partnerships, partners, and tax shelters after tax … · partnerships, partners, and tax shelters...
TRANSCRIPT

Partnerships, Partners, and Tax Sheltersafter Tax-Rdform, 1987-1989by Tom Petska
T
he Tax Reform,Act (TRA) of 1986 was targeted, inpart, at curbing alleged abusive "tax sheltering"activities. The first 3 years of post-TRA data for
partnership~ and individual partners indicate that itsconsequences are more evident among partners who wereindividuals than among the partnerships theinselves. Thepartnership losses claimed by individuals declined from$61.2 billion to $38.4 billion between 1986 and 1989,even though partnership losses for real estate operatorsand lessors of buildings and for oil and gas extraction,'twoindustries associated with tax sheltering, only declinedfrom $57.9 billion to $56.8 billion over the same period[1,2,3]. However, such'a response is not surprising sincethe limitations on "passive losses," a key provision ofTRA, directly affects the tax liabilities of individualpartners,
__giving them
-incentivesto move*out of, tax
shelters, while the partnerships themselves and othertypes of partners (such as corporations) can still benefitfrom the tax advantages of tax shelter partnerships.
The partnership form of enterprise has provided anattractive structure for tax shelters because of its "flow-through"-nature and its flexibility inallocating incomeamong partners [4,5]. Individuals with large incomesfrom other sources, such as wages and salaries or self-employment earnings, can invest in partnerships andreduce their taxable income with tax losses passedthrough to them from these partnership investments.-The1986 Tax Reform Act Was a major legislative change, ,toward reducing tax shelter benefits and thereby restoringgreater equity to the Federal tax code.
individual partners.
Tax Shefters DefinedTax shelters are generally defined as investments "inwhich a significant portion.of the investor's return isderived from the realization of tax saving with respect toother income, as well as the'receipt of tax-favored (or,potentially, tax-exempt) income from the investmentitself' [6]. Tax shelters usually involve one or more of thefollowing advantages [6,7]:
m deferral of tax -liability through the use of taxprovisions or tax preferences that accelerate deduc-tions;
• conversion of ordinary income into capital gains orother forms ofincome s_ubji~ctto a lower effective_rate of tax; and
• leveraged purchasing which magnifies the other taxadvantages [8].
As a flow-through entity with flexibility in allocatingincome -among partners, the partnership form of businessprovides an attractive structure for tax shelters. Individu-als with large incomes from other sources can invest inpartnerships and reduce their taxable income with taxlosses from partnership investments. If they invested in a"limited" partnership (one for which the liability of one ormore partners is confined to the amount of money orproperty contributed by that partner), they can receive thesame limited-liability-of-owners benefit as a corporation,as well as the flow-throug4 benefits of a partnership,[9,10].
Partnerships and the Taxation of PartnershipIncomeA partnership is not a taxable entity. Each partnership.annually files an information return (Form 1065) with the-Internal Revenue Service (IRS) which shows thepartnership's taxable income or loss for the year. Partner-ships compute the distributive allocation to.each Partnerand provide a Schedule K- 1, Partner's Share of Income,Credits, Deductions, etc., which identifies the partner'sshare of the total partnership's business activity. Thisinformation is used by partners in their own tax computa-tions. As partners calculate their annual tax liabilities,they include their distributive shares of income anddeductions from partnerships alongwith income fromother sources. Partners can be individuals, corporations;other partnerships, or virtually any other legal entity,though the focus of this article is on partnerships and
Tom Petska is an economist and Chiefof the Coordination andPublications Staff.
Provisions of the 1986 Tax Reform ActOne of the-main goals of the-1986 Tax Reform Act was todiminish.the ability of individual taxpayers to reduce theirtax liabilities through the use of tax shelters [6). The Acttook several steps to accomplish this including:
m lowering overall marginal tax rates;O'elin-finating the lower tax rate on long-term capital
gains (attributable to the 60 percent exclusion ofgains from taxable income);
m reducing the acceleration of depreciation deductions;and
0 imposing limitations on"passive losses".The passive loss lin-fitations,
which apply to most forms offlow-through business, particu-larly affect partnerships. Theselimitations prevent passivepartners - ones who do not"materially participate" in the
Individuals Invested In
partnerships and
reduced their taxable
Income with losses
from partnership
Investments.

Partnerships, Partners, and Tax Sheltersafter Tax Reform, 1987-1999
business of the firm- from using any temporary lossesgenerated by the business to offset income from othersources, such as wages and salaries, interest, or dividends[9, 101.
The Taxation of Partnership IncomeThe mechanics of the taxation of partnership income atthe individual level in the pre- and post-tax reformperiods can be illustrated as follows, using categoriesintroduced by TRA; let:
Yi = "active income (or loss)" which includes wages,salaries, and other types of earned income;
Y'. = "portfolio income" which includes interest,
dividends, most capital gains, and other types of taxableinvestment income;
Y k = "passive income (or loss)" which includes taxableincome or loss generated by a business such as a limitedpartnership or S Corporation in which the individual doesnot materially participate [I I]; and
Y, = the sum of active (Y), portfolio (Y and passive(Yd income, which, absent any other forms of personalincome, corresponds to "adjusted gross income" prior tocertain statutory adjustments, in both the pre- and post-taxreform periods.
Thus, Yt = Yi+ Y + Y
k*
The differences in Y before and after the 1986 taxtreform are primarily in Yi and Yk
• Before tax reform, portfolio income (Y~) excluded 60percent of most long-term capital gains, whereasafter TRA, 100 percent was included in Y
j
.• Before tax reform, passive income (Yd Could be
positive or negative. After tax reform, it could not benegative. Thus, the passive losses that were previ-ously used to offset active or portfolio income couldonly be used to offset passive (Yd gains.
Although some temporary relief was provided throughphase-in rules, it appeared that the future of tax shelterpartnerships was seriously endangered by these provisions[12].
Constructing a Partnership DatabasePiecing together partnership and partner financial flowscan be a difficult process. Data from the partnershipinformation return (Form 1065) are needed to understandthe overall finances of the business, its legal form (as ageneral or limited partnership), and its principal businessactivity.
Information from the partnership Schedule K- I isneeded to capture partnership distributions to each partnerand other information, such as the legal form of eachpartner. The Schedule K- I data are aggregated on the
partnership Schedule K, which includes a summary of theincome distributed to each type of partner. Data from eachpartner's tax return (Form 1040 in the case of individualtaxpayers) are needed to ascertain the effective taxconsequences of the income (or losses) generated by thepartnership and distributed (or allocated) to each partner.
Since each return or schedule provides only some of thedesired information, an idealinformation system for capturingpartnership and partner financialflows can be quite complex andcostly. The optimal way toexamine these issues would be tolink, at the individual record lev-el, partnership and partnerinformation sources in both thepre- and post-tax reform periods,and to compare data in the latterwith projections based on a model
After tax reform,
"passive" partner-
ship losses could
only offset "pas-
sive" gains.
of pre-TRA behavior from the former. Statistics ofIncome studies involving the linkages of these sourceshave been carried out with only mixed success [ 131.
In the absence of such a data base, an alternativeapproach, as reflected in this article, exan-dries tax returndata on partnerships and partners from before and afterthe enactment of TRA for evidence of the anticipatedresponse. If the provisions of TRA were having animpact, it would be expected that the numbers of partner-ships and partners and the amounts of losses woulddecline in those activities where the primary motive wastax sheltering, since partnership losses have a diminishedsheltering capability.
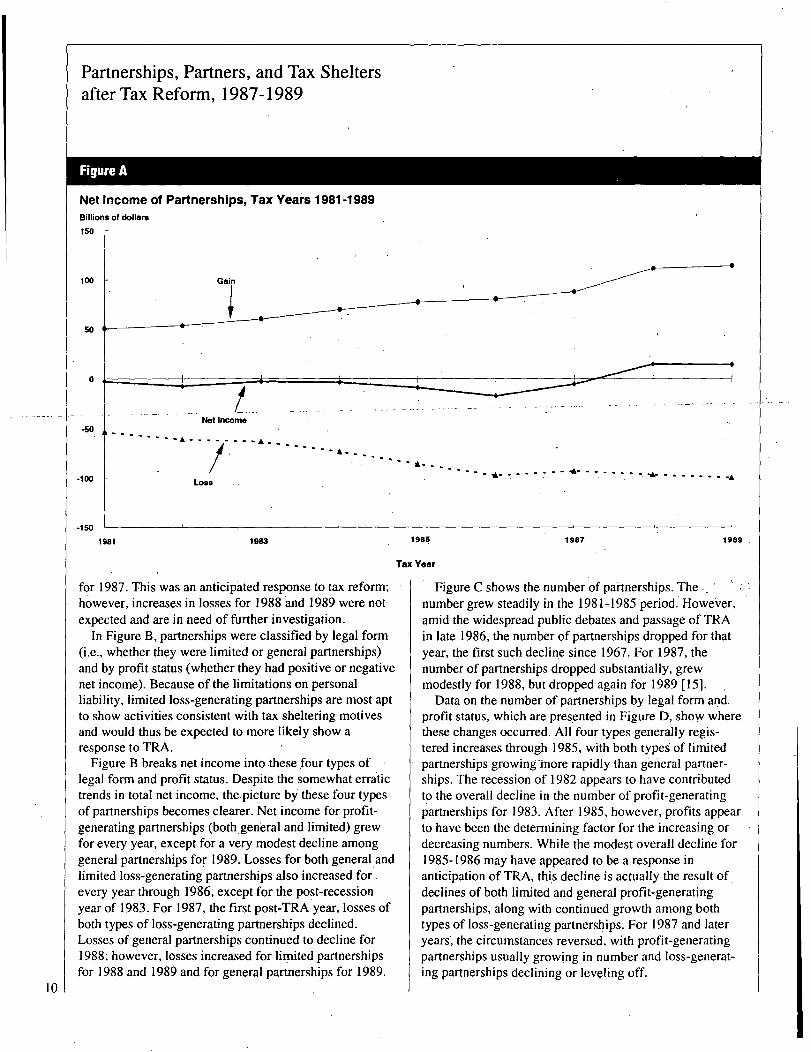
Statistics on Partnerships and PartnersPartnership Trends, 1981-1989Figure A plots the net income of partnerships for TaxYears 1981-1989 [14]. Overall, partnerships had losses innet income each year, except for 1988 and 1989. Theselosses peaked in the 1982 recession year, declined slightlyfor 1983, then began a period of steady and uninterruptedgrowth culminating in a record overall net loss of $17billion for 1986. From 1987 to 1989, the first 3 years inwhich provisions of Tax Reform were in effect, netincome moved strongly positive, from a negative netamount of $17 billion for 1987 to approximately $14billion positive amounts for both 1988 and 1989.
Partnership gains and losses before netting are alsoplotted for each year in Figure A. Gains (positive netincome, or profits) increased annually throughout the1981-1989 period. Losses, on the other hand, grewannually through 1986, but then dropped by $4.6 billion
9
Partnerships, Partners, and Tax Sheltersafter Tax Reform, 1987-1989
Figure A
Net Income of Partnerships, Tax Years 1981-1989Billions of dollars
150 r
100
-50
-100
-150
Gain
Not Income
A . . . . . . . . A
Lose
1981 1983
1316 - - - - - - - a. . ... . . . . .L. . . . . . . . .A
1985 1987 1989
Tax Year
for 1987. This was an anticipated response to tax reform;however, increases in losses for 1988 and 1989 were notexpected and are in need of further investigation.
In Figure B, partnerships were classified by legal form(i.e., whether they were limited or general partnerships)and by profit status (whether they had positive or negativenet income). Because of the lin-dtations on personalliability, limited loss-generating partnerships are most aptto show activities consistent with tax sheltering motivesand would thus be expected to more likely show aresponse to TRA.
Figure B breaks net income into these four types oflegal form and profit status. Despite the somewhat erratictrends in total net income, the picture by these four typesof partnerships becomes clearer. Net income for profit-generating partnerships (both general and lin-dted) grewfor every year, except for a very modest decline amonggeneral partnerships for 1989. Losses for both general
'and
limited loss-generating partnerships also increased forevery year through 1986, except for the post-recessionyear of 1983. For 1987, the first post-TRA year, losses ofboth types of loss-generating partnerships declined.Losses of general partnerships continued to decline for1988; however, losses increased for limited partnershipsfor 1988 and 1989 and for general partnerships for 1989.
Figure C shows the number of partnerships. The ... , ' .number grew steadily in the 1981-1985 period However,amid the widespread public debates and passage of TRAin late 1986, the number of partnerships dropped for thatyear, the first such decline since 1967. For 1987, thenumber of partnerships dropped substantially, grewmodestly for 1988, but dropped again for 1989 [15].
Data on the number of partnerships by legal form and.profit status, which are pres
'ented in Figure D, show where
these changes occurred. All four types generally regis-tered increases through 1985, with both typeg of limitedpartnerships growing - more rapidly than general partner-ships. The recession of 1982 appears to have contributedto the overall decline in the number of profit-generatingpartnerships for 1983. After 1985, however, profits appearto have been the determining factor for the increasing ordecreasing numbers. While the modest overall decline for1985-1986 may have appeared to be a response inanticipation of TRA, thi
's decline is actually the result of.
declines of both limited and general profit-generatingpartnerships, along with continued growth among bothtypes of loss-generating partnerships. For 1987 and lateryears' the circumstances reversed, with profit-generatingpartnerships usually growing in number and loss-generat-ing partnerships declining or leveling off.
10

Partnerships, Partners, and Tax Sheltersafter Tax Reform, 1987-1989
Figure B
Partnership Gain or Loss, by Type of Partnershipand Profit Status, Tax Years 1981-1989[Money amounts are in billions of dollars]
Type of partnership
Taxyear
1981 ..............1982 ..............1983 ..............1984 ..............1985 ..............1986 ..............1987 ..............1988 ..............1989 ..............
Total gainor loss
11)$-2.7
-7.3-2.6-3.5-8.9
-17.4-5.414.514.1
Gain
J2)
$42.844.448.655.760.563.566.281.280.9
Loss
(3)
$-29.8-34.2-32.5-36.6-42.4-45.3-43.4-42.7-45.2
Lim
Gain
(4)
$7.89.2
11.714.016.616.821.530.133.0
ited
Loss
(5)
$-23.5-26.7-30.4-36.6-43.5-52.3-49.6-54.2-54.6
NOTES: Detail may not add to totals because of rounding. For data sources,see Figure F.
The increasing number of loss-generating partnerships,despite their growing losses throughout the pre-TRAperiod, defies conventional economic motives whichwould have predicted that resources (both in terms offirms and investors) would flow toward profitableactivities and away from loss-generating activities. This
Figure C
Number of Partnerships, Tax Years 1981-1989Thousands of returns
1,800 F
Total partnerships
1'sw
1,200
900
Goo
300
Loss partnerships
2
- - - - - -- 'A . . . . . . A - - - - - - -
A
01 1 1 1 1 1 1 1
1981 1983 1985 1987 1989
Tax Year
Gain partnerships
pattern is, instead, consistent with tax sheltering motivesin which investor/partners appear to have been seekingtax losses, not a positive return on their partnershipinvestments.
The number of partners, as shown in Figure E, exhib-ited substantial and uninterrupted growth throughout theentire 9-year period, even in years for which the numberof partnerships dropped. The number of partners in profit-reporting partnerships exhibited consistent growththroughout this period, while the number of partners inloss-generating partnerships grew through 1986, but thenleveled off.
In Figure F, the number of partners are classified intothe four types of legal form and profit status types. Thenumber of partners in limited partnerships grew muchmore rapidly and consistently than those in generalpartnerships, which is consistent with the motives of taxshelters. The number of partners in general profit-generating partnerships declined substantially for 1985,mirroring a similar increase in the number of partners inlimited profit-generating partnerships. In the post-TRAperiod of 1987-1989, the number of partners in limitedprofit-generating partnerships increased in every year,while the number of partners in general profit-generatingpartnerships moved erratically. The number of partners in
0Al
. . . . At . . . . . . . . A - - - - - - - -
L - - - - ; '
General
I I

Partnerships, Partners, and Tax Sheltersafter Tax Reform, 1987-1989
. Figure D
Number of Partnerships, by Type of Partnershipand Profit Status, Tax Years 1981-1989[Numbers are in thousands]
Type of partnership
Taxyear
Totalpartnerships
(1)
Gain
L21
General
1981 ........... 1,461 677
1982 ........... 1,514 707
1983 ........... 1,542 707
1984 ........... 1,644 750
1985 ........... 1,714 774
1986 ........... 1,703 766
1987 ........... 1,648 769--1!988;.-..: 1;654-- 782
11 1,635 770
Loss
_U3
576581601636660663617
_587-571
Lim
Gain
ited
Loss
(5)1 (4) 1
758782
1011079296
1 19128
133139152157173181166166166
NOTES: Detail may not add to totals because of rounding. For data sources,see Figure F.
loss-generating partnerships declined each year in thep0St7TRA period, except for a large reversal for 1980 forlimited loss-generating partnerships.
Figures A through F thus indicate a response to TRA,but some indicators have not been consistent. To further
,Figure E
Number of -Partners, Tax Years 1981-1989Millions of parlners
20
investigate, net income (i.e., income less loss), gains
(positive net income), and losses of partnerships by
selected industry are presented in Table I for the period
1985-1989, the period surrounding TRA. The last year
unaffected by both the publicity, as well as the provisions
of TRA, was 1985. Although 1986 was generally not
directly affected by the provisions of TRA, the Act's
potential provisions were quite well known from the
public debates, especially by individuals and organiza-
tions whose pre
'
-TRA benefits w,ere at stake. In addition to
a-high level of public awareness, TRA's passage in
November 1986 allowed time to react prior to its effective
date of January !, 1987, and many persons took advantage
of this (apparently) last opportunity to benefit from a
-reduced tax on- long-jerm capital-gains.-Thus, 1986 is -
hardly a pre-reform year in a strict sense. However, the
years 1987 through 1989 are all post-tax reform years,
although phase-in provisions lessened the Act's immedi-
ate impact [ 1 2].
Industrial ActiviffiesPartnership net income (in Figure A and Table 1) declinedby $8.5 billion between 1985 and 1986. This large declin ewas led by a drop of $4.9 billion in oil and gas extraction
E

Partnerships, Partners, and Tax Sheltersafter Tax Reform, 1987-1989
in the mining division and a decrease of $6.6 billion inreal estate operators and lessors of buildings in thefinance, insurance and real estate division. These twoindustries were well known for their tax shelteringactivities.
For 1987, the overall partnership loss in net incomedeclined sharply to $5.4 billion. Although oil and gasextraction did show an overall increase in net income of$4.4 billion, the increases in positive net income reportedfor other industrial groupings played the major role inreducing the overall loss for 1987. In particular, increaseswere reported for agriculture, forestry and fishing ($3.0billion), manufacturing ($1.3 billion), and especiallyholding and investment companies ($4.2 billion) infinance, insurance and real estate. Overall net incomeimproved by $19.9 billion to a positive $14.5 billion for1988, with gains evident for most industries, including$1.8 billion for both oil and gas extraction and real estateoperators and lessors of buildings. For 1989, overall netincome was again positive, but declined to $14.1 billion.However, this was only $0.4 billion less than the yearbefore. Since overall net income (or loss) statistics canobscure trends in the underlying gains and losses, theseare examined next.
As Table I shows, total partnership gains increasedannually between 1985 and 1989. The largest increaseswere for 1987 ($7.4 billion) and 1988 ($23.7 billion).These gains were spread throughout the industries,although manufacturing and service industrial divisionswere the only ones to show increases for all years. Thelargest source of the $23.7 billion increase for 1988 wasan $11.8 billion increase for finance, insurance and realestate, consisting of a $4.1 billion increase for holding andinvestment companies and a $3.1 billion increase for realestate operators and lessors.
On the loss side, partnership losses increased by $11.7billion for 1986, led by a $2.3 billion increase for oil andgas extraction and $7.4 billion for real estate operatorsand lessors. Between 1987 and 1989, the rate of increaseslowed considerably, however, and losses increased by
Losses of oil and
gas extractors and
real estate opera-
torsVand lessors
greatly affected
partnership profits.
only another $2.2 billion. Thus,the substantial improvement innet income between 1986 and1989 is far more attributable tothe growth in gains than thereduction in losses.
For 1985, the last pre-TRAyear, the losses for oil and gasextraction and real estateoperators and lessors ofbuildings were the largest
Figure F
Number of Partners, by Type of Partnershipand Profit Status, Tax Years 1981-1989[Numbers are in thousands]
Tax year Total partners
Partners by type of partnership
General
1981 .............1982 .............1983 .............
1984 .............1985 .............1986 .............1987 .............
1988 .............
1989 .............
9,0959,765
10,58912,42713,24515,30116,96317,29118,432
Gain
(2)
2,8832,8862,9393,5272,9903,0613,1853,4213,150
Loss
_U3
2,0362,1672,2162,2152,3402,4262,2552,1972,058
Gain
(4)
Lim ited
Loss
_T57
1,6282,0272,4883,0823,6804,7096,0546,6647,656
2,5482,6842,9473,6034,2345,1055,4695,0095,568
NOTES: Data for Figures A through F are from the Statistics of IncomeBulletin, selected issues; and Statistics of Income-- 1978-1982, PartnershipReturns; unpublished data from Office of Tax Analysis, U.S. Department ofthe Treasury; and special Statistics of Income tabulations. Profit status isdefined as gain or loss in net income; see footnote 14 at the end of this articlefor a further explanation of how this is defined. Partnerships with a breakevenbetween gain and loss are included with loss partnerships.
reported. Oil and gas extraction had an overall net incomeof $2.3 billion, consisting of gains of $7.3 billion andlosses of $5.0 billion. Real estate operators and lessorshad an overall loss in net income of $26.2 billion, nearlythree times the size of the net loss for all other partner-ships. The real estate overall loss resulted from gains of$17.0 billion and losses of $43.2 billion; the latterrepresented half the total loss of all loss partnerships.Clearly, the experience of these two industries, andparticularly the latter one, had an enormous impact onpartnership profits. If loss partnerships in these twoindustries are really the largest proponents of tax shelters,a closer look at trends in the net income, numbers ofbusinesses, and numbers of partners before and after TRAis warranted. These data are presented in Figures Gthrough K.
Figures G through I plot net income and the number ofpartnerships and partners for the oil and gas extractionindustry for the period 1981-1989. They also separatelyplot partnerships with gains or losses. The overall netincome of oil and gas partnerships, which is presented inFigure G, climbed steadily from a net loss of nearly $10billion for 1981 to a positive net income, albeit modest,for 1984 and 1985. However, for 1986, net incomedropped by $4.9 billion to an overall net loss of $2.7billion. Beginning with 1987, net income again climbedmodestly, but consistently with each successive year. Oiland gas gains were relatively stable in this period with the
13

Partnerships, Partners, and Tax Sheltersafter Tax Reform, 1987-1989
Figure G
Net Income of Oil and Gas Partnerships, Tax Years 1981-1989Billions of dollars
14
only substantial annual change being a decline of $2.6billion for 1986. Thus, most of the fluctuation in netincome is attributable to changes in losses; in fact, overallnet income displays a pattern over time that closelyfollows the trend for losses.
Figure H shows the number of oil and gas extractionpartnerships. Despite year-to-year. fluctuations, thenumber of oil and gas partnerships with gains changedonly slightly over the 9-year period, 1981 through 1989,with the most noticeable deviations being a decline for1986 and an increase for 1988.
Unlike the number of partnerships, the number ofpartners in oil and gas partnerships show a very pro-nounced pattern over the 1981-1989 period, as evidencedin Figure 1. The number of partners in gain or profit-generating partnerships increased for nearly every year,while the number of partners in loss-generating partner-ships shows essentially no growth.
Figures J through L plot similar data for real estateoperators -and lessors I f buildi'njs.'Ove~all net incomedata presented in
IPigu
Ire
.J show th'af losses grew each year0
from 1981 through 1986. From 1987 forward, the post-TRA'period, losses in net income declined very modestly($2.7 billion) from their level of
'$32.8 billion for 1986.
Gains, on the other hand, were remarkably stable,growing moderately for 8 of the 9 years from 1981
through 1989. However, losses grew every year through1986 when they totaled $50.6 billion, and then remainedin the $50-$52 billion range through 1989.
The number of partnerships that were real estateoperators or lessors of buildings are presented in FigureK. Through 1986, the number of such partnerships grewannually, with loss-generating firms increasing in numberat a somewhat faster rate. Starting with 1987, however,
, the total number of firms changed very little with theslight increase among gain firms offset by declines amongloss-generating firms.
As with the number of partners in-oil and gas, thenumber of partners in real estate operator and lessorventures grew annually for both. gain and loss partnershipsthrough 1986, as presented in Figure L. Growth in thenumber of partners was very small in the post-TRA years,and attributable solely to gain partnerships.
From these data, several patterns are evident. First, theeffects of TRA are more evident in the overall net incomeand number of partners than in the number of partner-ships. This is consistent with tax sheltering behavior sinceit shows increasing numbers of investor/partners seekinggrowing losses in the pre-TRA period, with a halt to thisin the post-TRA period. Second, as expected, the patternof losses over time is far more consistent with taxsheltering motives and to a response to TRA than are the

Partnerships, Partners, and Tax Sheltersafter Tax Reform, 1987-1989
Figure H
Number of Oil and Gas Partnerships, Tax Years 1981-1989
Thousands of returns
60 r
1981
Gain partnerships
1993 INS 1987
'Ar - - - --A
1989
Tax Year
gain data. This is not surprising in that tax shelteringmotives are the underlying reason for the growth in loss-generating businesses, so it would be expected that theyshow the most responsiveness to the applicable provisionsof TRA.
To further examine these issues, annual growth rates forloss-generating oil and gas extraction and real estateoperator and lessor partnerships are presented in FigureM, in which the 1981-1989 period is divided into 3intervals: the pre-tax reform period (1981-1985); thetransitional year (1986); and the post-tax reform period(1987-1989).
The number of oil and gas loss-generating partnershipsdeclined modestly in the pre-tax reform period, probablydue to market conditions which bottomed out in late 1985.For 1986, the number of loss-generating partnershipsincreased by nearly 4 percent before declining at anannual rate of over 17 percent in the post-reform period.
The number of partners in oil and gas loss-generatingpartnerships declined by 4 percent in the pre-tax reformperiod. For 1986, their partners increased by over 19percent, which, again, appears to be more of a reaction tomarket conditions. In the post-tax reform period, thenumber of partners declined by just over 2 percent peryear.
Oil and gas loss-generating partnerships averagedannual losses of nearly $10 billion in the pre-reformperiod. These losses declined to $7.3 billion for 1986 andcontinued declining annually to an average loss of $5.4billion for the post-tax reform period.
Real estate loss-generating partnerships grew in numberat annual rates of approximately 6 percent in the pre-reform period, including 1986. In the post-reform period,however, they declined at an annual rate of 4 percent peryear. Real estate loss-generating partnerships gainedpartners at an annual rate of over 13 percent per year inthe pre-reform period and nearly 18 percent for 1986,alone. This is further evidence of sheltering behavior,since this growth was attributable to an additional 2million investors in these loss-generating businesses. Incontrast, during the post-reform period, the number ofpartners showed no growth.
The losses of these real estate loss-generating partner-ships averaged $27 billion annually in the pre-reformperiod. Within this period, they increased steadily from$15 billion to $43 billion. For 1986, the losses increasedto nearly $51 billion and then grew slightly in the 3 post-reform years.
What do these figures indicate about the response toTRA? Oil and gas losses did decline from 1986 to 1989. 15

Partnerships, Partners, and Tax Sheltersafter Tax keform, 1987-1989
16
As previously alluded to, part of this was attributable.tothe energy sector's recovery from a substantial oil pricedecline in late 1985. Nevertheless, oil and. gas was one ofthe few industries granted major exceptions to the passiveloss limitations. Losses from most general partnerships in'oil and gas could continue to offset income from othersources, while losses from limited partnerships in oil andgas could not. Thus, despite some continuation of pre-TRA benefits, losses still declined, which is cons
'i9tent
with the-overall intent of TRA--tha't business losses-
should reflect economic conditions rather' than be gener-ated primarily for tax sheltering purposes.
Real estate contributed heavily to'paitnership losses, yetthe losses leveled off in'the ppst-reform. period,ratherthan declined. Does this suggest that the real estate
-industry-was-not affected by tax-reform?-On the contrary,----the fact that real estate losses did not grow is a majorreversal of the trend in the pre~refonri period in whichlosses grew substantially. Also,- the fact. that the number ofinvestor/par!ners ceased to grow in the po.st-reform. periodfurther reveals the effect of reform. This lack of growthoccurred despite the fact-that some partners in real estategeneral partnerships could qualify for* a special, $25,000exemption from the passive loss limitations for lossesfrom "active" real estate activities.
Figure I
The real estate industry also experienced depresseddemand in certain geographic areas, probably due in partto overbuilding caused by the pre-TRA tax benefits..Partners in loss-generating real estate partnerships mayhave found a "buyers market" in their attempts to sell off
.their partnership interests. The result may be that, at leastin the short run,
'TRA left many such investors with no
other recourse than to sell off their investments at afraction of their original cost or to wait out the soft realestate market by absorbing continued losses even withtheir"diminished capability tooffset other income.
Another indication of the impact of tax reform is thebirth rate of new firms in these two industries. Figure Npresents a percentage distribution of all partnerships,those in oil and gas extraction, or that were real estateoperators -and lessors-, and the'total, excluding. these -twoindustries. If TRA was having,an effect, one would expectgrowth among new firms to be appreciably less than forother types of partnerships.
Nearly 29 percent of all partnerships were established -in the 1987-1989 post-TRA period. Of this group, aboutI I percent were formed in 1989, and over 17 percent in1987-1988. For oil and gas extraction, almost 20 percentwere formed in the post-reform period, while for realestate operators and lessors of buildings, 19 percent were
Number.of Partners'in Oil and Gas Partnerships, Tax Years 1981-1989millions of partrwe
3

Partnerships, Partners, and Tax Sheltersafter Tax Reform, 1987-1989
Figure J
Net Income of Real Estate Operator and Lessor Partnerships, Tax Years 1981-1989Billions of dollars
40 r
PE
-20
-40
Loss A .
IL . . . . . . . . .L.
-60
1981 1983 1985 1987
A-
-0
A
EITE
Tax Year
created in this period. If these two industries are excludedfrom the total, a clearer picture emerges. Nearly 35percent of partnerships in this "other" group were formedin the post-reform period. Growth in partnerships in these"non-shelter" industries continued at a rate 80 percenthigher than that for oil and gas and for real estate.Clearly, the provisions of TRA had an impact.
Of course, economic conditions undoubtedly contrib-uted to these movements as well. For the oil and gasindustry, the passage of the Act coincided with thebeginning of a period of recovery which appears to haveobscured the effect of TRA. For real estate, the passageof TRA more closely coincided with an industry down-turn; losses persisted at pre-tax reform levels due to thecombined affects of TRA and a slumping market.Separating these effects, however, is beyond the scope ofthis article.
IndIvidual ParhmnThe intent of the passive loss provisions was to curb thealleged abuses of individual taxpayers' use of partnershiplosses to offset income from other sources, therebyreducing their "taxable income" and income tax. To helpassess the impact of TRA, Figure 0 provides time seriesdata on "ordinary income and losses" from partnerships
Not income
'A.
as reported on individuals' income tax returns [16]. Suchordinary income is not a total measure of the partnershipincome reported on tax returns (since it excludes capitalgains and losses and most dividends, for example), but thetrends it reveals can be used for this purpose, neverthe-less.
The most striking results are:• the fact that individuals claimed overall net losses for
each year in the pre-tax reform period, and• the overall similarity to the plot of partnership
income over time as displayed in Figure A.Partnership total ordinary income reported by individu-
als increased consistently throughout the entire period; thelargest increase was $13 billion for 1987. This may be dueto individual partners restructuring their portfolios toobtain additional partnership passive gains against whichto apply their passive losses.
Partnership ordinary losses reported by individualsgrew throughout the pre-tax reform period, reaching a lowof $61 billion for 1986. Losses then declined by $17billion for 1987 and continued to decline, though muchmore modestly for 1988 and 1989. Even though theseamounts are after deduction of any disallowed passivelosses, this movement is still a strong indication of aresponse to TRA. The passive loss limitations are un-
17

Partnerships, Partners, and Tax Sheltersafter Tax Reform, 1987-1989
Figure K
Number of Real Estate Operator and Lessor Partnerships, Tax Years 1981-1989
ThousarKle of returns700
r-
600
Soo
400
Total partnerships
Loss partner hips
. At
1 100
C) -
1981
Gain partnerships
1 1983
. -At - - - - - - - --& - - - - - - - - Ar - - - - - - - - Ar - - - - - - - -A' -
doubtedly responsible for much of the reversal in losses,though their precise effect can only be estimated. For1987, the Treasury Department estimates that approxi-mately $ 10 billion in passive partnership losses weredisallowed [3]. With the phase-in of the passive losslimitations progressing, the amount of disallowed passivelosses will likely increase [ 12]. However, based on whatwas reported on partnership returns, partnership lossesclaimed by individual partners would have declined for1987, even without the disallowance of some of the ,passive losses. This is further evidence that TRA had senta clear message to tax shelter investors.
The d6clines in partnership losses claimed by individu-als for 1988 and 1989 were more moderate than for 1987.Since these losses were after deduction of disallowedpassive losses, this issue needs further investigation, aswell as an estimate of disallowed partnership passivelosses for these years [17]. As a result,of the decreases inlosses in the post-TRA period, overall partnership netincome (less loss) claimed by individuals shifted stronglypositive over the entire 3-year post-TRA period.
For 1987 through 1989, the data do not include "portfo-lio income" (interest, dividends and royalties, which werecombined with similar income from other sources) earnedby partners, as do the figures for earlier years, complicat-
18
1985 1987 im
Tax Year
ing interpretation. This tends to understate the gains andoverstate the losses for 1987 and later years.
If the partnership losses reported by all individualpartners are lower in the post-tax reform period, does thismean that high income individuals are using them lessoften to reduce their tax liability? How has the use ofpartnership losses to reduce the tax of high income~taxpayers changed with tax reform? Table 2 addressesthese questions with data based on the Statistics ofIncome individual tax return samples for 1985 through1989.
Table 2 uses a measure of income that ignores taxpay7ers' losses in determining whether or not they had highincomes. The measure, total positive income, or TPI,looks only at positive amounts of income, viewingindividuals as having a high income if they had largeamounts of gross income before any netting of losses[18]. Table 2 displays TPI for returns with at least$250,000 and shows, among other information, theportion of TPI offset by partnership losses. In addition,the high TPI returns are classified according to theiraverage tax burdens relative toTP1 [19]. -
The number of high TPI returns grew quite dramati-cally over this 5-year period, at an annual rate of nearly15 percent. Most of this growth was quite steady, with

Partnerships, Partners, and Tax Sheltersafter Tax Reform, 1987-1989
Figure L
Number of Partners in Real Estate Operator and Lessor Partnerships, Tax Years 1981 -1989
Millions of partnars
one exception - the change from 1985 to 1986 - inwhich the number grew by 184,700, or by 50 percent.This appears to result from the large number of capitalgain realizations, as individuals sold assets near the end of
Figure M
Annual Growth Rates and Average AnnualLosses for Oil and Gas Extraction andReal Estate Operator and Lessor LossPartnerships, Tax Years 1981-1989(Money amounts are In billions of dollars)
Tax
year
AnnuallgrowthWes
Partnerships
Average
annual loss
(3)
1981785 ....................
1986 ..........................
1987-89 ....................
1981-85 ....................1986 ..........................1987-89 ....................
-0)Partners
(2)Oil and gas extraction partn
-0.9%3.8
-17.4
-4.2%19.2-2.3
Real estate operator and lessor
5.96.2
-4.0
13.118.1C )
erships
$-9.6-7.3-5.4
partnerships
-27.1-50.6-51.3
I Less than 0.05 percent.NOTES: This table Is based only on data for those partnerships with losses
that were engaged In oil and gas extraction or that were real estate operators orlessors. Growth rates reflect annual percentage changes. Losses are annualaverages for the period stated.
1986 to take advantage of the lower rate on long-termcapital gains that was scheduled to expire at the end of theyear. In. addition to swelling the ranks of high TPI returns,these large capital gain realizations pushed a greaterproportion of the 1986 high TPI returns into a tax rateclass other than the 20-percent-and-over class. For each ofthe other 4 years, a higher portion of returns were in the20-percent-and-over class and the highest percentages inthe 20-percent-and-over class were in post-reform years.
The amounts of TPI clearly show the effect of capitalgain realizations for 1986; this year had the highestoverall TPI for the 5-year period, though not by much,compared to 1988 and 1989. As for the number of returns,the distribution of TPI among the average tax rate classeswas much more skewed away from the 20-percent-and-over rate class for 1986 than it was for the other years.
For partnership losses, 1986 again stands out asdifferent from the other years. Partnership losses for theother years were in the range of $25 to $27 billion; for1986, however, partnership losses were approximately$10 billion higher.
Average TPI provides some insight into what occurred.TPI averaged between $598, 100 and $669,500 for yearsother than 1986; for 1986, the average was $745,900. Aspreviously noted, capital gain realizations appear to be the
19

Partnerships, Partners, and Tax Sheltersafter Tax Reform, 1987-1989
Figure N
Number of Partnerships for 1989 and PartnershipBirth Rates, Pre- and Post-Tax Reform Act (TRA)Periods[Numbers are in thousands]
Taxyear
AllIndustries
Oil and gasextraction
Realestate
operatorsand lessors
Allother
1989 ...............................
Pro-TRA .........................Post-TRA, 1987-89 ........
1987-881989...........................
(1) (2) 1 (3) ,
Number of partnerships
1,635.2 42.5 589A]Birth rates
80.3%19.714.8
__4.9___l
_C4)
1,002.9
65.4%34.621.1
~ -13.5---
NOTE: The Tax Reform Act of 1986 was enacted in late 1986 and waseffective starting with 1987. Thus, the pre-TRA percentages refer to 1986 andearlier years.
primary reason.Overall, average-partner
.ship losses show a steady
decline in this period, from $74,900 for 1985 to $38,700for 1989. This is consistent with the expected impact ofTRA. Within the average tax rate classes, there is consid-erable variation in the size of these losses. For all years,
Figure 0
the lowest average tax rate class shows the largest lossesby far, and the size of these losses declines as average taxrates rose.
An important aspect of the impact of TRA is theportion of partnership losses that were used to offset TPI,i.e., losses as a percentage of TPl. Overall, this percentagedeclined for each successive year in the period, althoughthe drop from 1986 to 1987 was very modest. Thispercentage is highest by far in the lowest average taxgroup (particularly in the pre-TRA years), as would beexpected if these losses were being effectively used tooffset income, thereby pushing s6ch individuals intolower average tax rates. The partnership loss percentagedeclines as average tax rates increase which is consistentwith expectations of a response to TRA.
So what does all this say concerning the impact of TWA-on high TPI individuals? The pre-tax reform realizationsof long-term capital gains in 1986 cloud the picture, sinceboth the number of high TPI individuals and the amountsof their income increased dramatically for that year.Taxpayers could have.indirectly responded to the passiveloss limitations by diverting investments into otheractivities, further reducing partnership losses. Otherprovisions of TRA, such as the reduction in accelerated
Partnership Income and Loss Reported on Individual Income Tax Returns,Tax Years 1981-1989Billions of dollars
20

Partnerships, Partners, and Tax Sheltersafter Tax Reform, 1987-1989
depreciation, would have reduced the tax losses associatedwith new investments. Improvements in economicconditions, such as that which apparently occurred in theoil and gas industry after 1986, could have also contrib-uted to the change in partnership and partner income.Separating the response to TRA from the effects of theseother factors is, however, beyond the scope of this article.
Summary and ConclusionsThis article presents evidence suggesting that, based onaggregate data for 3 years, the 1986 Tax Reform Act isachieving its intended effect of curbing the abuses of taxshelter partnerships. The consequences of TRA are moreevident among individual partners than among thepartnerships, themselves. However, such a response wasnot unexpected, since the passive loss limitations directlyaffect the tax liabilities of partners, giving them incentivesto move out of tax shelters. Because corporate and othertypes of partners can still benefit from the tax advantagesof tax shelter partnerships, many partnerships have lessincentive to eliminate tax losses than do their individualpartners.
As the phase-in of the passive loss limitations proceedand partnerships are able to restructure their investments,partnership losses, the number of partnerships and thenumbers of investor/partners are expected to continuedeclining in those industries for which pre-TRA provi-sions contributed largely to their attractiveness. Aspreviously noted, separating the response to TRA fromthe effects of other economic factors, such as industry-wide business cycles, are useful extensions of this articlebut are beyond its scope.
Notes and References[1] Petska, Tom, "Further Examinations of Tax Shelters
in the Post-Reform World," 1991 Proceedings of theAmerican Statistical Association, Section on SurveyResearch Methods.
[21 Petska, Tom and Nelson, Susan, "Partnerships andTax Shelters: An Analysis of the Impact of the 1986Tax Reform," 1990 Proceedings of the AmericanStatistical Association, Section on Survey ResearchMethods.
[3) Nelson, Susan, and Petska, Tom, "Partnerships,Passive Losses, and Tax Reform," 1989 Proceedingsofthe American Statistical Association, Section onSurvey Research Methods and Statistics of IncomeBulletin, Winter 1989-90, Volume 9, Number 3.
[4] Dworin, Lowell, "An Analysis of PartnershipActivity, 1981-83," Statistics of Income Bulletin,Spring 1986, Volume 5, Number 4.
[5] Nelson, Susan, "Taxes Paid by High-IncomeTaxpayers and the Growth of Partnerships, 1983,"Statistics of Income Bulletin, Fall 1985, Volume 5,Number 2.
[6] U.S. Congress, Joint Committee on Taxation, TaxReform Proposals: Tax Shelters and Minimum Tax(JCS-34-85), August 7, 1985, page 2.
[7] U.S. Congress, Joint Committee on Taxation,General Explanation of the Tax Reform Act of 1986(H.R. 3838, 99th Congress; Public Law 99-514),May 4,1987.
[8] Leveraged purchasing,i.e., by means of "borrowed"funds, increases the benefits of tax-favored statussince, not only does it allow for augmenting themagnitude of the investment and the resultingbenefits, but such financing creates an additionaldeduction for interest paid.
[9] Nelson, Susan, "Noncorporate Business Taxation:Before and After the Tax Reform Act of 1986,"U.S. Department of the Treasury, OTA Paper 59,May 1988.
[10] Shapleigh, Colbert C., and Raley, Terry M., "TheEffect of the Passive Loss Rule and Other RelatedProvisions of the Tax Reform Act," Journal ofPartnership Taxation, Spring 1987.
[11] S Corporations, like partnerships, are not taxeddirectly, but are taxed through their shareholders,just as partnerships are taxed through their partners.To qualify as an S corporation, a firm had to be: adomestic corporation which was not a member of anaffiliated group and did not have more than 35shareholders; or a shareholder who was neither anindividual (other than an estate or trust) nor anonresident alien; and which had only one class ofstock.
[121 For 1987, under the phase-in rules, 65 percent ofpassive losses from pre-TRA investments wereallowed; for 1988, 40 percent; for 1989, 20 percent;for 1990, 10 percent; and for 199 1, none wereallowed.
13] Several Statistics of Income (SOI) studies involvingthe Schedule K- I have been attempted with mixedresults. One involved sampling from a file based on
21

Partnerships, Partners, and Tax Sheltersafter Tax Reform, 1987-1989
the K-I data and retrieving income tax returninformation for the first ten individual partnerslisted. However, weighting problems, particularlyin regard to the adequacy of the procedure ofweighting the first ten individual partners topopulation totals, raised serious concerns with theinterpretation of these data. A second "piggy-backed" on the SOI partnership program. Fiftypartner Schedules K- I were obtained for all typesof partners and selected money amounts wereextracted. While this study included'a substantiallylarger protion of the partner population, it stillexcluded large portions and was considerably morecostly as well.
[14] P,;utfii-t§hip-hi~tihdciffie(lds~-di~fi~it)t6pt&gdiits-ordinary income (loss) on page I of the Form 1065through Tax Year 1986. Beginning with tax year1987, a comparable net income figure ha's beencomputed as the sum of: ordinary income or lossfrom trade or business, portfolio income distributeddirectly to partners (excluding capital gains), netincome or loss from rental real estate activities, andnet income or loss from other rental activities.Profit status is determined as gain or loss on netincome. Partnerships with a breakeven betweengain and loss are included with loss.
[151 An undetermined number of partnership returns.were mistakenly rejected from the 1987 Statistics ofIncome sample lowering the population estimate. Ifthis downward bias in the population estimate isbetween 6,000 and 50,000 returns, which appears tobe reasonable, the partnership population wouldhave exhibited a steady decline from 1985 forward.See McMahon, Paul, "Statistics of Income Partner-ship Studies: Sampling Plan Redesign Il," 1991
-Proceedings of the American Statistical Associa-tion, Section on Survey Research Methods.
[16] Statistics for total net income or loss on individu-als' returns (Figure 0) frequently differ from the
comparable totals reported for partnerships (e.g.,'Figures A and B, and Table 1) because not allpartnership income is distributed or allocated toindividual partners and because of income defini-tional differences.
[17] Total passive activity allowed and disallowed lossesare available from the Form 8582, Passive ActivityLoss Limitations. Although partnership passivelosses undoubtedly constitute the majority of theseamounts, an estimate of the actual partnershipportion requires disaggregation of total passivelosses at the individual return -level and is beyond thescope of this article.
[18] Total positive income (TPI) is a surrunation of allline items on an individual tax return that showedpositive amounts of income. The only exception tothis is for the Schedule E, Supplemental Income andLoss. Instead of using the summary total line itemamount from the sources of income on this form,positive amounts from each of the following wereincluded: total rental and royalty income (or loss),
. total partnership and S Corporation income (or loss),total estate and trust income (or loss), and incomeand loss from Real Estate Mortgage InvestmentConduits. For years prior to 1987, the amounts onSchedule D, Capital Gains and Losses, weresummed before adjusting for the 60-percent exclu_~sion from income of long-term capital gains.
[19] Data in Table 2 differ from those presented in thepaper by Nelson and Petska (see footnote 3) becauseof inconsistencies in the quantification of TPI in thelatter.
General ReferencesU.S. Department of the Treasury, Internal Revenue
Service, Statistics of Income-1988, Individual,Income Tax Returns.
Zempel, Alan, "Partnership Returns, 1989," Statistics ofIncome Bulletin, Fall 1991, Volume 11, Number 2..'
22

Partnerships,
Partners,
andT
axS
heltersafterT
axR
eform,
1987-1989
Q?r-
M9
7"
qN
011~
"~C
ir*
~q
~07
7C?
'T9
C"cli
~qN
toCR
01'tt
Wr.:
r*.:U~
CR'~t
qC4
7C4
CIJ
~qc!
U~co
CRr*'~
alr-
qN
qw
qM
-0
r-M
r-co
0(0
clir~-0
NC~
C~NN
qgN
of
c4ui.4
C'iN
1
t-N
qwq
NtLIw
oo
Nq
cq-
-1c)
;CL
~cq
u~r*-~u~r%~Lq
w~~
rl~o7't
mqq
77
Zc')
'qQD
c.)u)
cli1--
7
qui
qu~
ciw
cqIp
rl.~u~
Ptr*.:
u~o
-c~
c~m
nn
0o
c"9
cjw
cjo
'tc\I
r-q
cqo
rl~9
IQC
jV:
(DIp
U~q
W~
CR't
0"t
IRV)
mm
wm
wcq
401
9R
oC?
-(o
72
c)
Q!
nn
Dr-
cmM
C\Iw
vr-
tom
U"
IDD
r-w
No
Mo
C11(D
CD
6
c!OR
wIQ
qI-
o7't
7r,
ow
N-
oo
-o
o
loui6
C\iC\l-i
r-.:ciui
0g
6c
c "T
cIj7
NC?
?
wIp
ciqCR
U~IR
U~77
m~2
Vr.,-
N"!
~~7
~2C~
ut7
Mq
C!(Q
Ncl
IPcm
or--
Mc!
7IQ
oN
coc!
NCI
MN
Ntv
NC~
C~
Lqw
ow
r-N
mN
oN
oto
cq
,.zC?
c~C?
C?N
N6
6r--:
r':v:
'i~g
guicj
CO7
NCQ
IN
C,CI
gID
MID
M-4
C6~g
qV
N
12
LI
CL
tz
JiU
~r
;J
5
8rL
23

Table 2.--Individual Income Tax Returns'with Total Positive Income (TPI) $250,000 or More: TPI and Partnership LosIses, by Average Tax Rate,
Tax Years 1985-1989[All figures are estimates based on s amples -- number of returns are in thousands; dollar amounts*are in billions, except where indicated]
Total positive income (TPI) Partnership losses Average Average PartnershipAverage tax Number TPI partnership loss losses as a
rate, year of returns Percentage Amount Percentage Amount PeIroentage (thousand (thousand percentagedollars) dollars) of TPI
(2) (3) (4) (5) (6) (7) (8)
1985All returns vAth TPI $250,000 or more ....................................... 362.8 100.0 235.9 100.0 27.2 100.0. 650.3 74.9 11.5Average total income tax as a percentage of TPI:Under 5 percent .......................................................... :........... 39.1 10.8 25.0 10.6 11.5 .42.3 639.6 293.9 46.05 percent under 10 percent .................................................... 35.8 9.9 19.8 8.4 4.5 16.5 552.6 124.8 22.610 percent under 20 percent....................................... .......... 120.3 33.1 88.6 37.6 6.7 24.5 737.7 55.5 7.520 percent or more.............................................................. 167.7 46.2 102.5 43.5 4.5 16.7 611.2 27.1 4.4
1996All returns Wth TPI $250,000 or more .................................... 547.5 100.0 408.4 100.0 35.7 100.0 745.9. 65.3 8.8Average total income tax as a percentage of TPI: iUnder 5 percent ...................................................................... 56.3 10.3 37.3 9.1 15.0 42.1 662.4 267.4 40.45 percent under 10 percent .................................................... 53.9 9.8 30.9 7.6 6.1 17.0 573.4 112.7 19.610 percent under 20 percent.................................................. 233.9 42.7 211.3 51.7 10.8 30.3 903.4 46.3 5.120 percent or more ................................................................. 203.5 37.2 128.9 31.6 3.8 10.6 633.5 18.6 2.9
1987All returns with TPI $250,000 or more ....................................... 494.4 100.0 295.7 100.0 25.9 .100.0 598.1 52.1 8.7Average total income tax as a percentage of TPI: iUnder 5 percent ...................................................................... 58.5 11.8 37.8 12.8 10.4 i 40.4 645.3 177.8 27.65 percent under 10 percent .................................................... 36.7 7.4 21.1 7.1 2.9 11.4 574.3 79.8 13.910 percent under 20 percent...................................... I ........... 105.2, 21.3 61.0 20.6 6.5 25.2 580.1 61.7 10.620 percent or more ................................................................. 293.9 59.5 175.8 59.5 5.9 23.0 598.1 20.2 3.4
1988All returns with TPI $250,000 or more................ ................. 596.3 100.0 399.2 100.0 26.0 100.0 669.5 43.6 6.5Average total income tax as a percentage of TPI:Under 5 percent ................................................................ 42.7 7.2 31.3 7.8 11.0 1 42.3 732.3 257.7 35.25 percent under 10 percent ....................................................
.28.8 4.8 19.6 4.9 2.8 10.7 679.4 96.5 14.2
10 percent under 20 percent.................................... I....... ...... 123.8 20.8 75.4 18.9 6.7 1 25.6 609.4 53.7 8.820 percent or more .................................. .............................. 400.9 67.2 272.9 68.4 5.6 21.5 680.7 13.4 2.0
1989All returns voth TPI $250,000 or more....................................... 653.8 100.0 406.5 100.0 25.4 .100.0 621.8 38.7 6.2Average total income tax as a percentage of TPL
Under 5 percent...................................................................... 57.5 8.8 41.5 10.2 122 48.1 721.3 211.9 29 45 percent under 10 percent .................................................... 36.8 5.6 24.9 6.1 2.9 11.5 677.5 79.0
.11.7
10 percent under 20 percent .................................................. 157.6 24.1 89.9 22.1 6.0 23.6 570.1 37.9 6.620 percent or more ................................................................. 1 401.8. 61.5 1 250.2 61.6 1 4.3 i 16.9 1 622.7 10.7 1.7
: Detail may not add to totals because of rounding.