passing traits from one generation to the next
TRANSCRIPT

Chapter 2 • Modern Genetics for All Students T 97
2CHAPTER
Passing Traitsfrom OneGeneration to the Next


CHAPTER 2
Passing Traits from OneGeneration to the Next
CHAPTER TWO OVERVIEW . . . . . . . . . . . . . . . . . . . . . . . . . . . . . . . . . . . . . . . . . . . . . . . .T100
SECTION AWhat is Inheritance? . . . . . . . . . . . . . . . . . . . . . . . . . . . . . . . . S75 . . . .T101
1. An Introduction to Inheritance . . . . . . . . . . . . . . . . . . . . . . . . . S76 . . . . . T102
SECTION BHow Does a New Generation Get Started? . . . . . . . . . . . . . . . . S79 . . . .T103
Section B Background . . . . . . . . . . . . . . . . . . . . . . . . . . . . . . . . . . . . . . . . . . T104
1. Model Systems for Studying Heredity and Development . . . . . S80 . . . . . T105
2. Starting a New Generation: Sea Urchin Fertilization. . . . . . . . . S82 . . . . . T107
3. The Miracle of Life. . . . . . . . . . . . . . . . . . . . . . . . . . . . . . . . . . S87 . . . . . T115
SECTION CIf All the Kids Have Mom and Dad’s Genes, Why Don’t They All Look Alike? . . . . . . . . . . . . . . . . . . . . . . . . S89 . . . .T117
Section C Background . . . . . . . . . . . . . . . . . . . . . . . . . . . . . . . . . . . . . . . . . . T118
1. Really Relating to Reebops . . . . . . . . . . . . . . . . . . . . . . . . . . . S90 . . . . . T119
2. Determining Genetic Probabilities with a Punnett Square . . . . . S98 . . . . . T125
3. Exploring Human Traits: Create-a-Baby . . . . . . . . . . . . . . . . . S100 . . . . . T127
4. Using a More Complicated Punnett Square. . . . . . . . . . . . . . . S108 . . . . . T130
SECTION DHow are Genetic Experiments Actually Performed? . . . . . . . . . . S111 . . . .T135
Section D Background . . . . . . . . . . . . . . . . . . . . . . . . . . . . . . . . . . . . . . . . . . T136
1. A Colorful Experiment in Yeast Genetics . . . . . . . . . . . . . . . . S112 . . . . . T137
2. Experimenting with Wisconsin Fast Plants . . . . . . . . . . . . . . . S120 . . . . . T145
SECTION EHow are Genetic Results Evaluated Statistically? . . . . . . . . . . . . S147 . . . .T167
Section E Background . . . . . . . . . . . . . . . . . . . . . . . . . . . . . . . . . . . . . . . . . . T168
1. Introduction to Using Statistics to Evaluate Genetic Explanations . . . . . . . . . . . . . . . . . . . . . . . . . . . . . . . S148 . . . . . T169
2. Too Many White Kittens? Using Chi Square (χ2) to Find Out. . . . . . . . . . . . . . . . . . . . . . . . . . . . . . . . . . . . . . . . . S150 . . . . . T169
3. How to Perform a Chi-Square Test on Any Data Set. . . . . . . . S152 . . . . . T170
Chapter 2 • Modern Genetics for All Students T 99

Chapter 2 • Modern Genetics for All Students T 100
Chapter 2 OverviewIN CHAPTER 1, YOUR students were introduced to the concept that DNA is the carrier ofhereditary information. This should have raised more questions in their minds than itanswered. For example, how does DNA get passed on from parents to children? Or if eachchild inherits DNA molecules from both parents, doesn’t this mean that each person musthave twice as much DNA as his or her parents? Or if my sister, my brother, and I all gotour DNA from our Mom and Dad, and if the DNA we inherited determines all of our heri-table traits, why don’t we look just like one another? And why don’t we look like somesort of average of Mom and Dad?
The purpose of this chapter is to help students answer such questions. To do this, we mustmove the discussion of heredity to a slightly more complex level. We have to consider howDNA actually gets passed on between the generations. And we have to think about how theinformation that this DNA contains is used to generate a whole new individual, not just abunch of new protein molecules.
Chapter 2 • Modern Genetics for All Students T 101
CHAPTER 2
Passing Traits fromOne Generation to the Next
SECTION A
What isInheritance?

An Introduction to Inheritance STUDENT PAGES 76-77
LESSON OVERVIEW
This section consists of only one part: a reading assignment designed to familiarize yourstudents with the general concepts underlying the study of inheritance.
TIMELINE
It will take an average student 15 to 20 minutes to read this material. It could be assignedas homework.
Chapter 2 • Modern Genetics for All Students T 102
A.1

Chapter 2 • Modern Genetics for All Students T 103
CHAPTER 2
Passing Traits fromOne Generation to the Next
SECTION B
How Does a NewGenerationGet Started?

Chapter 2: Section B Background IT MIGHT SEEM THAT studies of embryos are out of place in a discussion of genetics.But nothing could be further from the truth.
It is only through the processes of embryonic development that the potential present in theDNA in an egg and a sperm can be converted into a physical reality – a new individual.Or, to say the same thing in technical terms that your students will learn to use in thischapter, it is during embryonic development that a genotype (an individual’s complete setof genes) becomes transformed into its phenotype (its set of visible features).
This section begins with a discussion of what model systems are, and how they are usedboth to study heredity and development, and to yield insight about humans that couldnever be obtained by studying human beings directly.
In the second part of this section, students will work with one such model system, seaurchins, which are the premier model for studying the first few stages of the beautiful andmysterious process by which genotype is transformed into phenotype. Here they willwatch the fusion of egg and sperm and the initial stages of embryonic development.
In the third and final part of this section, they will encounter an even more captivatingexample of genotype-to-phenotype transformation. In the Nova video, The Miracle of Life,they will benefit from extraordinary, award-winning cinemagraphic techniques that recordthe development of a human being from the time when egg and sperm are released,through the instant of their fusion, and the subsequent nine months of development, to themoment of birth.
Chapter 2 • Modern Genetics for All Students T 104

Model Systems for StudyingHeredity & Development STUDENT PAGES 80-81
LESSON OVERVIEW
Progress in genetics has always been most rapid when geneticists have found an appropri-ate model system, an organism whose biological features make it very well suited for theexperimental analysis of a specific set of questions.
Garden peas were the ideal model system for Gregor Mendel, a monk and botanist whowas interested in asking the basic questions about heredity 150 years ago. But garden peascould never have been used to determine the chemical nature of the hereditary material orthe way it works. For addressing that sort of genetic question, bacteria turned out to be theideal model. But bacteria are of little value in addressing questions about the way particu-lar genes control the development of specific body parts in complex organisms like our-selves. Such questions must be addressed with animals. The animals that have been mostuseful as model systems for asking this kind of developmental-genetic question includefruit flies, round worms, zebra fish, frogs, and mice.
Even the most ardent advocates of such developmental-genetic models have regularly beenquite astonished, however, to discover the extent to which studies of the genetic control ofembryonic development in one of these model systems turns out to apply to others –including ourselves. An expanded version of the example that is mentioned in the studentpages may help to underscore this very important concept.
A few years ago, biologists studying fruit fly development discovered that an eyeless flywas produced whenever both copies of one particular gene were defective. For obviousreasons, they named this the “eyeless” (eye) gene. The wild-type eye gene is normallyexpressed (transcribed and translated) only in the region of the fruit fly head where theeyes will form. But when cells on a leg, or the back, or a wing of the fly were tricked intoexpressing the wild-type eye gene and making the corresponding protein, extra eyes devel-oped in those regions of the leg, or back, or wing! This clearly suggested that the eye geneis a “master control gene” that is responsible for triggering the entire series of events thatis involved in making an eye. Soon it was found that all animals with eyes, includingsquid, sea scallops, flatworms, fish, birds, mice, and humans, have a gene of extremelysimilar DNA sequence that plays a similar role in eye development in every case. In fact,the mouse version of the eye gene is so similar to the fly gene, that when the mouse genewas introduced into fruit flies and expressed anywhere on the fly body, an extra eye wasformed in that location. (Notably, the eyes that formed under these conditions were flyeyes, not mouse eyes.)
Chapter 2 • Modern Genetics for All Students T 105
B.1

Human babies who have the misfortune to be born with one defective copy of the humanversion of the eye gene have small eyes that lack an iris, which results in serious visionproblems. Babies that are born with two defective copies of this gene have no eyes at all.Thus, it is clear that the eye gene plays the same role in human eye development as itscounterpart does in that of the fly.
Similarly detailed genetic parallels between flies, birds, mammals and ourselves have beendiscovered with respect to the master control genes that control development of the heart(a gene called tinman), legs, nervous system, and other body parts. If most biologists hadnot already been thoroughly convinced that (as a famous biologist said 50 years ago),“nothing in biology makes sense except in the light of evolution,” such modern observa-tions would undoubtedly drive them to such a conclusion.
TIMELINE
It will take an average student 10 minutes to read this material; it could be assigned ashomework.
REFERENCE
The Genes We Share with Yeast, Flies, Worms and Mice: New Clues to Human Health andDisease. (2001). Available by writing to the Howard Hughes Medical Institute, Office ofCommunications, 4000 Jones Bridge Road, Chevy Chase, MD 20815-6789. This colorfuland well-written booklet is the eighth in a series of reports about biomedical research thathas been prepared by the Howard Hughes Medical Institute specifically to provide teachersand students with up-to-date information about current research developments in biologyand biomedical sciences. It is an unusually rich source of information about the powerfulnew methods that are now being used to study the genes of model organisms as well as thenovel insights that such studies have already provided us about our own genetic makeup.
Chapter 2 • Modern Genetics for All Students T 106

Starting a New Generation: Sea Urchin Fertilization STUDENT PAGES 82-85
LESSON OVERVIEW
This activity is meant to bring the processes of early development vividly to life for yourstudents. The sea urchin sperm and eggs that they will see under their microscope serve aswonderful models to help them understand their own biological and genetic origins. Students enjoy working with live animals, particularly ones that are unfamiliar, yet non-threatening. So this is a wonderful time to talk about the unity and diversity of life: It isthe fundamental unity of all life forms that allows a model organism such as the sea urchinto give us insights into our own biological nature. This exercise is also, of course, a won-derful time to introduce or review the concepts of mitosis and meiosis, and the roles thateach plays in the processes of heredity and development.
TIMELINE
The sea urchins need to be ordered at least two weeks before you plan to use them in yourclass. They are only shipped on Monday or Tuesday and will usually arrive sometime dur-ing the next day. Be sure you are prepared to take care of the urchins properly when theyarrive (see below). It is best to do the fertilization exercise as soon as possible after deliv-ery. So plan accordingly.
MATERIALS
For the entire exercise:3 or 4 aquariums or holding tanks (see Advance Preparation for details)1 package of a dry artificial sea water mixture (such as Instant Ocean™)*1 hydrometer*1 aquarium pump*3 or 4 air stones*tubing and adapters to connect air pump to air stones*sea urchins2-5 ml syringe with a 20-30 gauge needle30 ml of 0.5 M KCl (1.13 g of KCl in 30 ml water)disposable petri dishesdropping pipettesmicroscope slides and cover glasses for checking gametes1 or 2 microcentrifuge tubes for storing sperm3 or 4 250 ml beakers to hold female sea urchins during spawning3 or 4 16 x 100 mm test tubes for making sperm suspensions3 or 4 50 or 100 ml beakers for fertilizing eggs1 500 ml bottle for cultivating embryos
*available at most pet stores, or from lab supply catalogs
Chapter 2 • Modern Genetics for All Students T 107
B.2

For each group of four students:1 or 2 depression slides2 or 3 dropping pipettesa compound microscope
Sea urchins can be ordered from:Carolina Biological Supply(800) 334-5551www.carolina.comSea Urchin Embryological Kit, catalog no. BA-16-2505 or Sea Urchins, catalog no. BA-216-2949
Pacific Bio-Marine Laboratories(310) 677-1056
Gulf Specimen Corp.(904) 984-5297
Urchins are sold by Carolina Biological Supply Co. in sets of 14, which is usually ade-quate to supply enough gametes for all of the classes taught by one (or possibly even two)teachers. Because different species are available from different suppliers and/or at differenttimes of the year, and because this will affect the way you will need to handle the urchinswhen they arrive (as explained below), it is a good idea to ask what species will beshipped when you place your order.
ADVANCE PREPARATION
• Order sea urchins at least three weeks before the activity.
• Visit the sea urchin website (http://www.stanford.edu/group/Urchin/fert.htm) wellbefore the urchins arrive. As discussed in the reference section below, this site is full ofuseful and interesting information.
• Have 3-4 aquaria or holding tanks filled with sea water, aerated, and equilibrated for afew days by the time the sea urchins are scheduled to arrive. See discussion of SeaUrchin Care below to determine temperature at which your aquaria or holding tanksshould be equilibrated.
• If you have aquaria already on hand, use them. However, genuine aquaria are notessential. Large, clear plastic boxes (such as 3-gallon Rubber Maid, #2220) purchasedat a discount store will work equally well as holding tanks. You should soak them for afew days with several changes of tap water (to leach out any plasticizers that might betoxic to sea urchins) before filling with sea water.
• Air pumps, air stones, a hydrometer, and sea salt are available in many pet stores.These supplies can be obtained from most any biological supply company as well.
• Prepare the sea water according to the instructions on the package, using dechlorinatedtap water. Check the specific gravity with the hydrometer. Adjust as necessary to a spe-
Chapter 2 • Modern Genetics for All Students T 108

cific gravity of 1.020 and 1.023 (at 75°C), adding more sea salt to increase or moredechlorinated water to decrease the specific gravity.
• Collect and organize other supplies. Most of the additional supplies can be purchasedfrom any scientific supply company. For example, from Fisher Scientific [(800) 766-7000, www.fishersci.com] you might order:
Potassium chloride, 500 g, cat. no. P217-500 Plastic dropping pipettes, box of 400, cat. no. 13-711-37 Hanging drop depression slides, package of 12, cat. no. 12-560A3 ml disposable syringes with 22 Ga needles, box of 100, cat. no. 14-826-85
• It is important to use glassware and other supplies that are clean and free of detergentresidues or other potentially toxic substances. Glassware that has been used previouslyshould be rinsed extensively with clear tap water before being used for this exercise.
• When you finish this exercise, rinse all of your equipment thoroughly with clear water.Do not use any soap or detergent, or you may leave a residue on them that will killnext year’s sea urchins.
SEA URCHIN CARE
Identify which species of urchins you received. Different species have different fertile seasons,so the month in which you order will often determine which species you will get. The fourspecies most commonly shipped from the sources listed above are:
Strongylocentrotus drohbachiensis, a cold-water North Atlantic species;Strongylocentrotus purpuratus, a purple, cold-water Pacific species;Lytechinus variegatus, a light-colored, warm-water species from Florida;Arbacia punctulata, a dark purple, warm-water species from Florida.
If you have received either of the warm-water species, they should be kept in tanks orholding trays in a cool room (60-68˚ F) but not a refrigerator. Your prospects of havinghealthy, cooperative sea urchins for your class will be improved if you can allow theurchins time to become acclimated to their new environment gradually. If they wereshipped in bags of sea water, float the bags in the aquarium about half an hour. Meanwhile,assess each urchin. Examine its spines and the water it has been shipped in. If its spinesare falling off, or it smells foul when the bag is opened, it is dead or dying; discard it. Ifthe urchin looks healthy, and its water smells all right but is cloudy, it is likely that theurchin has spawned. If you put an urchin that has spawned in a tank with ones that havenot, chemicals diffusing from the eggs or sperm will usually cause the others to spawnimmediately, ruining them for your purposes. So place any questionable urchins in individ-ual beakers or jars of sea water, not in an aquarium with other urchins.
Once the bags with healthy urchins have equilibrated in temperature with the aquarium, openthe bags and use the hydrometer to check for salinity differences between the aquarium andthe sea water in the bag. If there is a difference, add portions of the aquarium water to thebag. When you have doubled the volume of the water in the shipping bags, remove the sea
Chapter 2 • Modern Genetics for All Students T 109
urchins from the bags and place them in the tank. One sea urchin per half gallon of sea wateris a good ratio.
Sometimes sea urchins are shipped in sea-water-soaked, shredded newspaper rather than inbags of water. If this is how your urchins have arrived, unwrap each one carefully and exam-ine it. If its spines are falling off, or it smells foul, it is dead or dying and should be discard-ed. If you see a white or yellow-orange exudate on the test, or shell, between the spines, thiswill indicate that the urchin has spawned; isolate it from the rest of the urchins, and rinseyour hands thoroughly before handling other urchins. Place healthy looking urchins in indi-vidual beakers or bags of cool (not cold) sea water, float the bags in the aquarium, and moni-tor carefully for the next half hour or so. If the water in a bag turns cloudy during this period,this also will indicate that the urchin has spawned and should not be housed with unspawnedones. Place healthy, unspawned urchins in a tank together, as above.
If you have received either of the cold water sea urchins, either use them immediately orkeep them in refrigerated sea water. Assess each urchin as above. Place the healthiest lookingones together in a shallow plastic tray with enough sea water to just cover them. Place themin a refrigerator at 45-50˚ F. Urchins held in this manner should remain healthy for 1-2 days.
PROCEDURE FOR COLLECTING AND USING SEA URCHIN GAMETES
Experience suggests that the chances of success are substantially increased when theteacher injects the urchins and collects the gametes rather than charging the students to doit. However, it is a good idea to allow students who wish to do so to hold and examine oneof the urchins. (For many of them it will be a novel and broadening experience.) 1. Fill a syringe with 2.0 ml of the 0.5M KCl solution. 2. Hold a sea urchin mouth side up. Insert the needle through the soft membrane sur-
rounding the mouth, while pointing the needle away from the mouth. There may be alittle initial resistance, but then the needle should slide in easily. Slowly inject the KClsolution.
3. Following injection, place the urchin, mouth down, on a clean, dry Petri dish. Checkperiodically for appearance of an exudate (the gametes) between the spines on theupper part of the test. It may take 5-10 minutes for the gametes to appear, and someurchins may not be mature and will not release gametes in response to the KCl.
4. If you see a smooth, milky white fluid being released, you have a male that is releasingsperm. But if you see a somewhat grainy suspension being released that is colored yel-low to red (depending on the species), you have a female releasing eggs. If in doubt asto which kind of gametes are appearing, use a pipette to put a small drop on a micro-scope slide, dilute it with a drop of sea water, and examine it under the microscope.
5. Immediately after you have determined the sex of your sea urchin, do one of the following:Female urchin: Place her, mouth up, over a 250 ml beaker that contains enough seawater to make contact with the test. Allow the eggs to flow to the bottom of the beaker. Male urchin: Leave him, mouth down, on a dry Petri dish. Use a dropping pipette topick up the sperm from the surface of the test and transfer them to a dry microcen-trifuge tube. As long as the sperm have not come in contact with sea water, they willremain alive in such a tube for at least 24 hours in a refrigerator (45˚ F).
Chapter 2 • Modern Genetics for All Students T 110

6. As soon as you have a reasonable numberof eggs in the bottom of a beaker, check theappearance of a drop of egg suspensionwith a microscope. If there is a lot of debrisvisible around the eggs, wash them. Towash the eggs, transfer the female to a sec-ond beaker of sea water to continue spawn-ing. After the eggs in the first beaker havesettled completely, pour off the water andadd fresh sea water. Repeat the process. Aclean suspension of healthy eggs will sur-vive in a refrigerator for several hours.
7. As soon as you have a clean suspension ofeggs, have each group of students transfer asmall sample to a depression slide, examineit in the microscope, and draw what theysee. Emphasize that their best chances ofseeing fertilization take place will occur ifthey have only 10-20 eggs in the depres-sion slide, and that if they have more, theyshould remove some of them and replacethem with more sea water.
8. After all students have eggs on their slides, the sperm can be prepared. Dilute one ortwo drops of the “dry” sperm in 10 ml of sea water. Use a microscope to view thesperm with a 40X objective to make sure that they are moving. The sperm are onlyviable for about 15 minutes after they have been exposed to sea water.
9. As soon as you have an active sperm suspension, transfer two or three pipettefuls of anegg suspension to each of two clean small beakers and add a pipetteful of sperm sus-pension to each. Label each beaker with the time that the sperm and eggs were mixed.
10. Now have each group of students add a drop of the sperm suspension to the eggs intheir depression slides. Emphasize that they should only need a little of the sperm sus-pension, enough so that they will see 10-100 sperm around each egg.
11. Check samples of the sperm-egg mixtures you have in the beakers to be sure that theeggs have been fertilized (see drawing). If they have, have each group of studentsexamine a drop of the suspension every 15 minutes or so to monitor development. Thefirst cleavage division should occur about an hour after fertilization.
12. Place the remaining unfertilized eggs in the refrigerator for use later in the day. Savesamples of fertilized eggs from one class to the next, so students can see the laterstages of development.
13. Toward the end of the day, transfer a suspension of developing embryos to a clean, dry,screw-cap 500 ml bottle and dilute it to about 100 ml with sea water. Screw the cap ontightly and float the bottle on its side in the aquarium. Samples of this preparation canthen be examined over the next day or two to monitor development and behavior of thesea urchin larvae or plutei (singular pluteus).
Chapter 2 • Modern Genetics for All Students T 111
Unfertilized egg Fertilized egg
Fertilization envelope
A sure sign that an egg has been fertilizedis the presence of a fertilization envelopesurrounding the egg at a distance. (Beforean egg is fertilized, this transparent fibrousstructure is attached to the surface of theegg, where it is invisible. But within sec-onds after sperm-egg fusion it swells,moves away from the surface, andbecomes visible. Its function is to prevent asecond sperm from reaching the egg.)

HINTS AND TROUBLESHOOTING
1. If your schedule permits, it would be a good idea to fertilize a batch of eggs one to twohours before your first class, so that students in that class will be able to observe somecleaving embryos. Alternatively – or in addition – you may want to make arrangementsso that students can drop in later in the day to observe more advanced stages of devel-opment.
2. If you have a video microscope, have it available for this exercise, so that the wholeclass can observe any particularly nice specimens at the same time. Also, try to use aVCR to record any particularly good views of fertilization and cell division for laterviewing.
3. One never knows for sure what is going to happen when working with live animals. Itis best to be prepared for the unexpected. It is possible that in the first hour you couldinject five urchins and they would all be males (or all females). The thing to rememberis that once you get one female and one male, you should have enough gametes to lastfor all your classes that day. Many teachers have backup activities planned for downtime and in case the urchins are uncooperative. Some ideas include: a videodisc or tapewith sections on mitosis, meiosis, and fertilization, a video from other classes wherethe activity was successful or prepared microscope slides of sea urchin development. Ifcomputers with Internet access are available, students can view the sea urchin websitereferenced above.
4. If you get eggs and sperm, but the eggs do not seem to be getting fertilized, check thetemperature of the sea water and make certain that they are not getting overheated. Thenext thing to try is to dilute a new batch of sperm and check to be sure it is active. Ifneither of these things seem to identify the problem, chances are that the eggs areimmature. This can sometimes be diagnosed by seeing a very large nucleus, since anegg that has not yet undergone meiosis will still have a diploid number of chromo-somes and a large nucleus.
5. If the eggs are getting fertilized but do not divide, or they divide abnormally, the causeis probably polyspermy (fertilization of each egg by more than one sperm). Dilute thesperm, make sure it’s still active, and start over.
6. It may be interesting to your students to discuss how different the tempo of sea urchindevelopment is from that of human development. With sea urchins the first division ofa fertilized egg occurs in about an hour, and then subsequent divisions occur aboutevery half hour. With humans, however, the first division does not occur until morethan a day after fertilization, and at the end of two days, while the sea urchin is alreadyswimming around as a pluteus larva and feeding itself, the human embryo is just get-ting around to dividing the second time. Moreover, by the time the sea urchin hasbecome a mature adult and is having “babies” of its own (about 18 months), the humaninfant is nine months old, still wholly dependent on its parents for food and everythingelse required for survival. The magnitude of these differences in timing makes it seemall the more astonishing how similar in quality many of the chemical changes are thatoccur in the two kinds of eggs following fertilization.
7. Keeping sea urchins for a prolonged period of time in an inland location is difficult.Even teachers who maintain a salt-water aquarium have often found that adding the
Chapter 2 • Modern Genetics for All Students T 112

left-over urchins to such an aquarium is a mistake; they can foul the aquarium andcause severe difficulties. The most humane way of killing urchins after you are throughusing them is to put them in a freezer. After they are dead, you may preserve the tests(shells) by washing them in diluted bleach and setting them out to dry. Students whoare squeamish about holding a live urchin may be willing to hold and examine a life-less test.
REFERENCES
Dr. David Epel of Stanford University has prepared an excellent resource regarding seaurchin development. It can be found at http://www.stanford.edu/group/Urchin/fert.htm.This site takes students through gamete collection, fertilization, and development. It hasgood animated sequences, lots of useful information, and great ideas for further studies.
Womb with a View (1995), Kendall/Hunt Publishing Company. This reference book forteachers contains several activities related to meiosis and mitosis and is an excellentresource for sea urchin background information. It discusses the historical uses of the seaurchin as well as its anatomy and taxonomy. The book has more detailed ordering informa-tion and includes several activities related to meiosis, mitosis, sea urchin fertilization, andsea urchin behavior.
From Egg to Adult: A Report From the Howard Hughes Medical Institute (1992).Available by writing Howard Hughes Medical Institute, 4000 Jones Bridge Road, ChevyChase, MD 20815-6789. This colorful brochure illustrates beautifully the way in whichfruit flies have served as a model system to identify the genes that regulate formation ofthe human body from head to toe.
ANSWERS TO POSTLAB QUESTIONS STUDENT PAGE 86
1. If an adult sea urchin of one particular species has 14 chromosomes, how many chro-mosomes would an egg or sperm of that species have?It would have seven chromosomes.
2. What do you think would happen if one of the gametes (either the egg or the sperm)had the wrong number of chromosomes? Why?The embryo derived from the fertilized egg would not develop normally. This isbecause an embryo needs to receive an equal number of chromosomes from each par-ent in order to develop normally.
3. What are some differences between a fertilized and unfertilized egg?A fertilized egg has twice as many chromosomes as an unfertilized egg. It also has afertilization membrane that protects it from being penetrated by a second sperm. It alsois capable of dividing and forming a sea urchin larva, something an unfertilized eggcannot do.
Chapter 2 • Modern Genetics for All Students T 113

4. What is the function of the fertilization membrane? Why would that be important?It is to prevent a second sperm from fusing with the egg. That is important because anegg that fuses with more than one sperm never develops normally.
5. What happens to the fertilized egg about an hour after fertilization?It undergoes its first division.
6. Whenever a cell of an embryo divides, how are each of the newly formed cells similarto one another and to the original fertilized egg but different from the unfertilized egg?They are diploid, whereas the unfertilized egg was haploid.
7. Mitosis and meiosis are essential aspects of the cycle of life and development.Complete the adjacent diagram by writing mitosis or meiosis on the correct lines. a. meiosisb-e. mitosis
Chapter 2 • Modern Genetics for All Students T 114

The Miracle of Life STUDENT PAGES 87-88
LESSON OVERVIEW
If all went well, the preceding exercise provided your students a chance to watch gameterelease, fertilization, and the early development of a sea urchin. Now, thanks to the spec-tacular cinematography included in this video, which was first shown on Nova, they willget to see the equivalent processes taking place in human beings.
TIMELINE
Viewing this video and answering the questions will take an entire 50 minute period.
MATERIALS
The Miracle of Life can be ordered from:Carolina Biological Supply Company(800) 334-5551www.carolina.comThe Miracle of Life, catalog no. BA-49-3555V
ANSWERS TO THE MIRACLE OF LIFE QUESTIONS STUDENT PAGES 87-88
1. Describe the journey of the egg as it becomes mature and travels toward the sperm.The egg matures in a follicle in the ovary, is released when the follicle ruptures, and isthen swept into the fallopian tube, where it is pushed in the direction of the uterus bycilia on the surface of the cells lining the fallopian tubes.
2. Describe the journey of the sperm as they leave their site of origin and travel towardthe exterior.Sperm are formed in the seminiferous tubules in the testes and stored in the epididymis.During ejaculation they travel through the vas deferens, are mixed with secretionsreleased by the seminal vesicles and prostate gland, and then travel through the ure-thra and are expelled into the vagina.
3. About how many sperm does a man produce in his lifetime?A typical male produces about 400 billion sperm in his lifetime.
4. About how many sperm are released in a single ejaculation?About 200-300 million sperm are released in a typical ejaculation.
5. After sperm are released into the vagina, how long are they viable?Sperm remain viable in the female reproductive tract for 24-48 hours.
Chapter 2 • Modern Genetics for All Students T 115
B.3
6. Describe the barriers that the sperm face as they travel up the female reproductive tracttoward the egg.The acidic condition of the vagina kills many sperm, as do protective cells that attackthem. Then once they reach the fallopian tubes, the sperm must swim upstream againstthe current generated by the cilia.
7. Where is the egg when the sperm reach it?It is in one of the fallopian tubes.
8. About how many sperm reach the egg?Only about 50 sperm ever make it to the vicinity of the egg, and only one enters it.
9. What happens to the sperm after it enters the egg?The sperm loses its tail and midpiece, and its head swells and then ruptures, releasingits genetic material into the egg.
10. When does the fertilized egg begin dividing?The egg divides for the first time about a day after fertilization.
11. What is the fertilized egg called after it divides?When the egg is fertilized, it becomes a zygote; then when it begins to divide, itbecomes an embryo.
12. How long after fertilization does the embryo implant itself in the uterine wall?Implantation in the uterine wall begins about 10 days after fertilization.
13. Describe the human embryo at the following stages:4 weeks: It has arm buds and the beginnings of eyes.
5 weeks: It has a nose and leg buds.
6 weeks: It is about 1/2 inch long.
7 weeks: It is about 3/4 inch long and has fingers
8 weeks: Bones and joints are visible in its fingers and toes.
10 weeks: It is now about 2 inches long.
14 weeks: It is able to suck its thumb.
18 weeks: Its eyes are still closed, but it can detect light.
Chapter 2 • Modern Genetics for All Students T 116

Chapter 2 • Modern Genetics for All Students T 117
CHAPTER 2
Passing Traits fromOne Generation to the Next
SECTION C
If All the KidsHave Mom andDad’s Genes,Why Don’t TheyAll Look Alike?

Chapter 2: Section C BackgroundIN SECTION B, YOUR students saw how the fusion of sperm and egg initiates the beauti-ful and mysterious process by which a genotype gives rise to a phenotype. Now it is timeto get the students to contemplate the rules of heredity that relate the phenotype of the off-spring to the genotypes of the parents that produced the egg and sperm. Our goal in thissection is to help our students understand the answer to the question, If all the kids haveMom and Dad’s genes, why don’t they all look alike?
The field of inquiry to which your students will be introduced in this section is calledMendelian genetics, because it involves using methods of investigation very similar to theones Gregor Mendel used more than 150 years ago.
In the first exercise, your students will have the fun of crossing two members of a verycharming species of imaginary animals – the Reebops – and producing a young Reebop ofdistinctive phenotype. Although all the progeny produced by the class will be children ofthe same pair of parents (Mom and Dad Reebop), it is extremely unlikely that any two ofthe young Reebops will look exactly alike. In the course of this exercise, your studentswill have a painless introduction to many of the most important terms and concepts ofMendelian genetics.
Then in the second exercise, they will learn how to use a Punnett square, as well as a verysimple mathematical method, to make genetic predictions. In this exercise, they will per-form the equivalent of one of the most important tasks a genetic counselor must perform:predicting the probability that two parents of known genotype will have a baby with someparticular phenotype.
In the third exercise, genetics will strike much closer to home. The students will pair up toproduce an imaginary human baby together, and will discover which of them the baby willresemble with respect to 22 different phenotypic characters.
In the final exercise they will take information from Exercise 3 and use a more complicat-ed Punnett square to make a more complicated genetic prediction.
All in all, this section should not only introduce your students to many importantMendelian-genetic concepts, it should reinforce the concept that genetics (and science ingeneral) can be fun!
Chapter 2 • Modern Genetics for All Students T 118
Really Relating to Reebops STUDENT PAGES 90-94
LESSON OVERVIEW
Reebops (invented by Patti Soderberg at the University of Wisconsin*), are model “organ-isms” that students can use for a variety of genetic studies. In the initial exercise describedhere, students receive a set of diploid “chromosomes” that represent the genotypes of apair of parental Reebops. The students then simulate meiosis, combine the resulting twohaploid sets of chromosomes, and then determine phenotypes for individual offspring,which they construct from inexpensive materials. The class then compiles data for this F1generation and forms hypotheses about the inheritance patterns. This exercise can be car-ried through a number of generations, if desired, to test various hypotheses.
TIMELINE
Two 50 minute periods.
MATERIALS
For each pair of students provide at least:4 standard white marshmallows 2 thumbtacks1 red miniature marshmallow 4 red pushpins1 orange miniature marshmallow 4 blue pushpins1 yellow miniature marshmallow 1 short and straight pipecleaner3 green miniature marshmallows 1 long and curled pipecleaner8 toothpicks 1 set of red and 1 set of green 2 small nails chromosomes in an envelope
ADVANCE PREPARATION
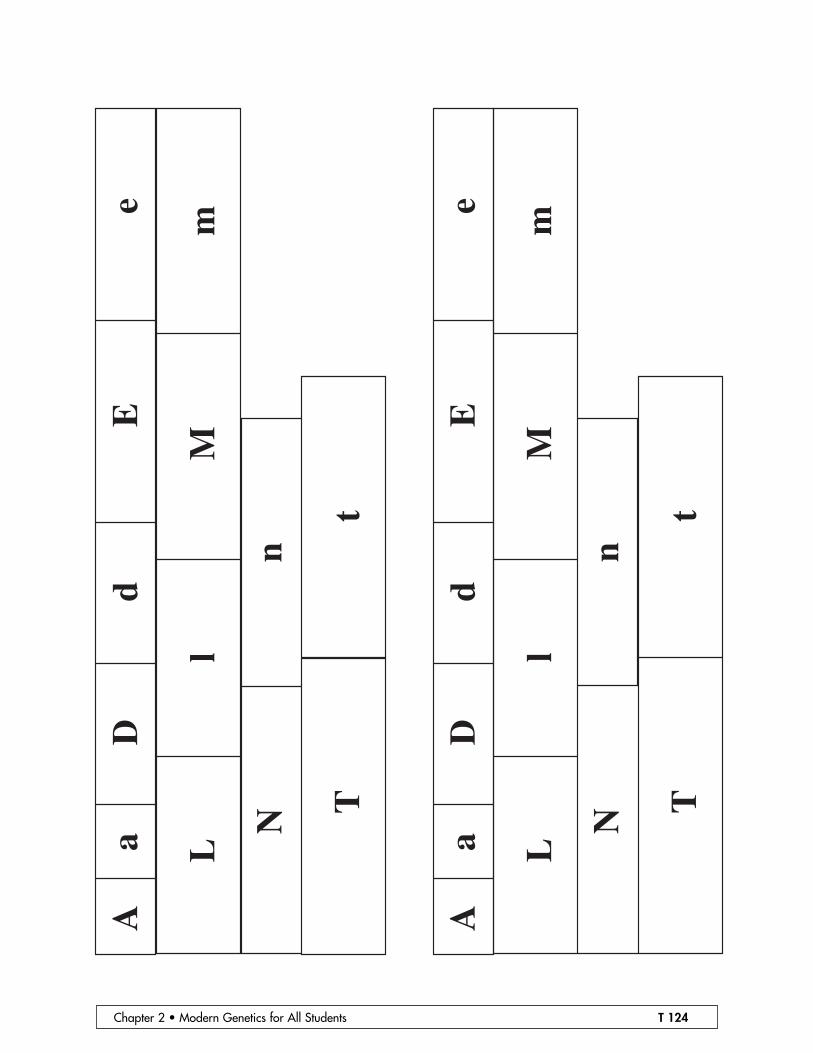
• Prepare two diploid chromosome sets per pair of students, using the templates provid-ed. For convenience, we have put two sets of chromosomes on one page, but you willneed one Mom set on red paper and one Dad set on green paper for each student pair.These chromosomes will be much more durable if they are laminated before they arecut out.
• Assemble Mom and Dad Reebop. The chromosomes indicate that both Mom and DadReebop are heterozygous at each locus (or gene pair). So the phenotype of each ofthem should be as follows: three body segments, one antenna, orange nose, two eyes,two green humps, curly tail, and blue legs (see drawing).
*The lesson included here has been adapted from Patti Soderberg’s version with her permission.
Chapter 2 • Modern Genetics for All Students T 119
C.1

PROCEDURE
Day 1
• Place body parts inboxes at the front of theroom.
• Give each pair of stu-dents an envelope withtheir chromosomes andintroduce the class toMom and Dad Reebop,which you should leavein a conspicuous placeduring the rest of theexercise. Make sure thatthe students sort theparental chromosomes in the kit and perform “meiosis” with code letters face down,gathering one haploid set of chromosomes from each parent at random. (They maythen put the extra chromosomes back in the envelope without looking at them.) Nowthey “recombine” the haploid chromosome sets produced by Mom and Dad Reebop togenerate the genotype of baby Reebop. After turning their baby’s chromosomes letter-side up, they should record this genotype on the worksheet. Then they should use theGenotype-Phenotype Conversion Table to determine (and record) what the baby’s phe-notype will be. Finally, they should assemble a baby with this phenotype.
• If there is enough time left after the babies have been “born,” you may wish to havethe students work on the Reebop Review. Alternatively, you may wish to assign it ashomework. (Note that it includes an introduction to predicting probabilities with aPunnett square.)
Day 2
• This session is used to compile and discuss the data from the population of Reebopbabies in the class.
• Try to work the key concepts of Mendelian genetics into the discussion at appropriateplaces. See the Genetic Glossary on S93.
• Some teachers may have a tendency to downplay the concept of a locus, because stu-dents may initially have a bit of trouble understanding it. But it is very difficult to dis-cuss any but the very simplest of genetic concepts without using the concept of alocus. So please work on getting students to understand it. A locus is the chromosomalsite where alleles affecting one particular heritable trait are located. A clear examplemay help: The ABO locus is the place on a particular chromosome where the proteinsresponsible for the A, B and O blood-group antigens are encoded. The A allele at thislocus encodes an enzyme that puts one kind of sugar on a red blood cell (RBC), mak-
Chapter 2 • Modern Genetics for All Students T 120
Small nail
White largemarshmallows
Green miniaturemarshmallows
Pipecleaner
Push pin
Toothpick
Orangeminiaturemarshmallow
Thumbtack
Toothpicks function as the unseen ligaments and tendonsthat hold the Reebop together.
ing it type A. The B allele encodes a different form of this enzyme, which puts a differ-ent kind of sugar on the RBC, making it type B. The O allele at this locus encodes aninactive form of the enzyme. (RBCs in AB heterozygotes have both kinds of sugar ontheir surface and type AB blood, whereas OO homozygotes have neither sugar on theircells and thus have type O blood.)
See “Suggested topics for additional discussion” in the next exercise.
ANSWERS TO REEBOP REVIEW STUDENT PAGE 95
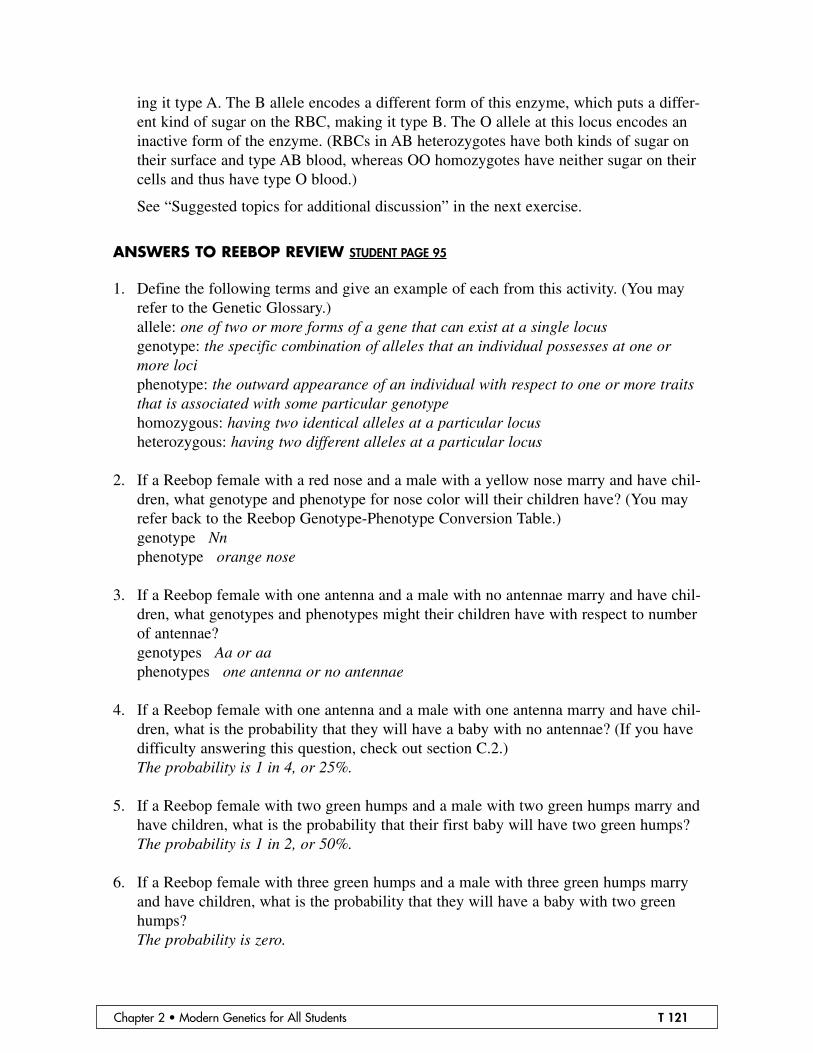
1. Define the following terms and give an example of each from this activity. (You mayrefer to the Genetic Glossary.)allele: one of two or more forms of a gene that can exist at a single locusgenotype: the specific combination of alleles that an individual possesses at one ormore lociphenotype: the outward appearance of an individual with respect to one or more traitsthat is associated with some particular genotypehomozygous: having two identical alleles at a particular locusheterozygous: having two different alleles at a particular locus
2. If a Reebop female with a red nose and a male with a yellow nose marry and have chil-dren, what genotype and phenotype for nose color will their children have? (You mayrefer back to the Reebop Genotype-Phenotype Conversion Table.) genotype Nnphenotype orange nose
3. If a Reebop female with one antenna and a male with no antennae marry and have chil-dren, what genotypes and phenotypes might their children have with respect to numberof antennae?genotypes Aa or aaphenotypes one antenna or no antennae
4. If a Reebop female with one antenna and a male with one antenna marry and have chil-dren, what is the probability that they will have a baby with no antennae? (If you havedifficulty answering this question, check out section C.2.)The probability is 1 in 4, or 25%.
5. If a Reebop female with two green humps and a male with two green humps marry andhave children, what is the probability that their first baby will have two green humps? The probability is 1 in 2, or 50%.
6. If a Reebop female with three green humps and a male with three green humps marryand have children, what is the probability that they will have a baby with two greenhumps?The probability is zero.
Chapter 2 • Modern Genetics for All Students T 121

Chapter 2 • Modern Genetics for All Students T 122
7. If a Reebop baby has a straight tail, but both of his parents have curly tails, what aregenotypes of the two parents? With respect to this trait, both parents have the genotype Tt. (Because the baby has thegenotype tt, it must have inherited a t allele from each parent. Therefore both parentsmust be heterozygous.)
ANSWERS TO ANALYSIS OF REEBOP FINDINGS STUDENT PAGES 96-97
1. Describe the phenotypes of Mom and Dad Reebop.three body segments, one antenna, orange nose, two eyes, two green humps, curly tail,and blue legs.
2. Using the information in the Reebop Genotype-Phenotype Conversion Table, list all ofthe genotypes that would produce the phenotypes exhibited by Mom and Dad. DD or Dd, Aa, Nn, EE or Ee, Mm, TT or Tt, LL or Ll.
3. How many of the Reebop babies in your class have the same phenotypes as Mom orDad?None
4. Do any two babies in your class have exactly the same phenotypes?(Probably) no
5. Why do some Reebop babies have traits that are not seen in either Mom or Dad?These are all traits for which the parents are heterozygous but the babies are homozy-gous recessive.
6. Which Reebop traits are dominant?three body segments, two eyes, curly tail, and blue legs
7. Which Reebop traits exhibit codominance? number of antennae, nose color, and number of humps
8. Use the information you have about the phenotypes of all of the Reebop babies in yourclass to figure out what the genotypes of Mom and Dad Reebop must be. Write theanswer below.Dd, Aa, Nn, Ee, Mm, Tt, Ll
9. If you know the genotype of the parents, is it possible to predict all of the possiblegenotypes of babies that they might produce? yes
10. If you know the genotype of the parents, is it possible to predict the genotype of anyparticular baby, such as their first one? Not unless both parents are homozygous at all loci. (If they were both homozygous atall loci, all of their offspring would have the same genotype, but such a situation wouldbe extremely rare in the real world.)

11. The Reebops appear to have only one gene on each chromosome. Do you think this istrue of real, living organisms? Probably not. More than likely they all have many more genes than they have chromo-somes.
Chapter 2 • Modern Genetics for All Students T 123
Chapter 2 • Modern Genetics for All Students T 124
Aa
Dd
Ee
L
N T
lM
m
n
t
L
N T
lM
m
n
t
Aa
Dd
Ee

Chapter 2 • Modern Genetics for All Students T 125
Determining Genetic Probabilitieswith a Punnett Square STUDENT PAGES 98-99
LESSON OVERVIEW
One of the most important uses of genetic information outside of a classroom or laboratoryis to predict the probable genotypes and phenotypes of unborn or potential offspring. Forexample, if a man and a woman both have siblings who suffer from cystic fibrosis (a heri-table disease), they undoubtedly would wonder what their chances would be of having achild with cystic fibrosis if they were to marry and raise a family. We will get into this sortof prediction with respect to human diseases in a later chapter. The Reebops activity pro-vided a great opportunity to introduce the concepts of genetic predictability and probabilityin a less somber context.
Students saw how many different Reebop phenotypes were generated with only sevenallele pairs; from that exercise they should have gained some insight into the enormousphenotypic diversity that can be generated by the twin processes of meiosis and recombi-nation in natural populations of real organisms. It is such phenotypic diversity that servesas the raw material on which natural selection acts to bring about evolutionary change.
The Punnett square provides a way for students to visualize all of the genotypic and phe-notypic possibilities in a cross between parents of known genotype and to determine therelative probabilities of each of those possibilities. It is a good idea, however, to make thepoint that a Punnett square is just a way of visually confirming a basic rule of probabilitythat applies to many events, not just sperm and egg fusion. The rule highlighted by thePunnett squares is that the probability of two events occurring together is equal to theproduct of their independent probabilities.
To apply this mathematical rule to the problem being addressed here, one would proceedas follows: The probability that an egg produced by an Aa female will contain the a alleleis 1 in 2, and the probability that a sperm produced by an Aa male will contain the a alleleis 1 in 2; therefore, the probability that a baby produced by this couple will have the aagenotype is 1/2 x 1/2, or 1/4.
C.2

An advantage of using the Punnett square is that it gives students a way to visualize all ofthe possible outcomes as sperm and eggs combine in a particular genetic cross. But themathematical approach of multiplying individual probabilities is applicable to many moresituations in science and life.
This lesson will use Punnett squares and mathematical calculations in a guided practiceactivity. You could easily pick other Reebop traits and have the students work through thesame process on their own.
TIMELINE
This exercise will only take about 5 to 10 minutes of class time. But you could assign it ashomework, together with a few other problems in Reebop heredity for the students to workout using Punnet squares and/or product-of-probability methods.
Chapter 2 • Modern Genetics for All Students T 126

Chapter 2 • Modern Genetics for All Students T 127
Exploring Human Traits: Create-a-Baby STUDENT PAGES 100-105
LESSON OVERVIEW
Now that your students have encountered the basic concepts of Mendelian genetics byworking with the Reebops, they get to apply them to beings with which they should haveeven less trouble identifying – their own imaginary offspring! Working in pairs, the stu-dents will analyze their own phenotypes and genotypes with respect to 22 visible featuresof the head and face. These will include dominant/recessive traits, codominant traits, andsimple multigenic traits. Having established their own genotypes, they will use a coin tossto determine which alleles they will pass on to their offspring at each locus where they areheterozygous. When alleles from two partners have been recombined in the imaginarybaby, they will work out the complete phenotype of the baby and name it. Then each part-ner will draw a picture of what they think the baby would look like.
TIMELINE
The reading, the phenotype and genotype diagnoses, and the Create-a-Baby Table require50 minutes to complete. If you chose to have the students do their drawings in class, a sec-ond period will be required. However, the drawings and the Create-A-Baby Review couldbe assigned as homework.
MATERIALS
a coin for each studentextra papercolored pencils
HINTS AND TROUBLESHOOTING
Many teachers compile all the baby pictures produced that year into a baby book. Studentsoften seem to take more pride in their work when they know it is going to be displayed tothe following year’s students.
C.3

ANSWERS TO CREATE-A-BABY REVIEW STUDENT PAGES 106-107
1. Define each of the following terms: chromosome, codominant, diploid, haploid, meiosis, multigenic, recombination
chromosome: a structure in the nucleus of a eukaryotic cell that contains a linear arrayof many genes. A chromosome is composed of a single DNA double helix moleculewound around many protein molecules that stabilize it and regulate its function.
codominant: refers to a pair of alleles, both of which exert an effect on the phenotypewhen they are present together. In codominance, the heterozygote has a phenotype dif-ferent from that of either homozygote and sometimes (but not always) is intermediatein phenotype.
diploid: having two complete sets of chromosomes, one set derived from the motherand one from the father.
haploid: having only one set of chromosomes (as in a sperm or egg nucleus).
meiosis: the “reduction division” in which a diploid cell divides to produce haploidcells that will function as gametes (eggs or sperm).
recombination: the process in which two haploid sets of chromosomes are broughttogether in a pair of gametes to produce a new diploid offspring. Usually this newdiploid will be different in genotype from both of its parents.
2. What was the probability that you and your partner would produce a boy? A girl?Explain.There was a 50% probability it would be a boy and a 50% probability it would be agirl, because the gender was determined by the toss of a coin, and the coin had a 50-50 chance of coming down heads versus tails.
3. Explain how it is possible for your baby to have a visible trait that neither you nor yourpartner have.If both partners are heterozygous at a particular locus, the baby could inherit onerecessive allele from each parent and exhibit the recessive version of that trait.
4. If you and your partner repeated this exercise and produced another imaginary baby, doyou think it would look just the same as the one you produced already? Explain.It would probably look quite similar, but not identical (as siblings usually do). This isbecause in every case where a coin toss was used to decide which allele the babywould get, there is a 50-50 chance that the outcome would be different the second time.
Chapter 2 • Modern Genetics for All Students T 128

5. A woman who is heterozygous for the chin-dimple trait marries a man without a chindimple. What are the possible genotypes and phenotypes of their children?The woman could contribute either a P or a p allele, but the man could contribute onlythe p allele. So the children could be either Pp (dimpled chin) or pp (no dimple).
6. What is the probability that the man and woman discussed in the preceding questionwill have a baby with a chin dimple? 50%
7. A man and a woman who are both heterozygous for two traits, the cheek-dimple andthe chin-dimple traits, get married. What is the probability that they will have a babythat has cheek dimples but not a chin dimple? (If you have trouble answering thisquestion, check out section C.4.) The probability that one of their babies will have cheek dimples but not chin dimples is3 in 16, or 3/16. (One way of obtaining this answer is by performing a 4-by-4 Punnettsquare. A second way is by multiplying the probability that one of their children willhave cheek dimples [3/4] by the probability that one of their children will not have achin dimple [1/4]; 3/4 x 1/4 = 3/16.)
8. What is the probability that a man with dark blonde hair and a woman with red hairwill have a baby with brown hair? 100%! (According to the information used in this exercise, the genotype correspondingto dark blonde hair is rr SS and the genotype corresponding to red hair is RR ss. All ofthe children of parents with these genotypes will be double heterozygotes: Rr Ss. Thephenotype associated with the doubly heterozygous genotype is brown hair.)
Chapter 2 • Modern Genetics for All Students T 129

Using a More ComplicatedPunnett Square STUDENT PAGE 108
LESSON OVERVIEW
Question 7 on the previous lesson leads students into the use of a 4 x 4 Punnett square todeal with alleles at two loci. Once again, after the students have used the Punnett square toanswer a question, you should discuss how the answer could also be obtained by multiply-ing independent probabilities.
For example, the question asked in the Punnett square discussion read, “When a man withan oval face and wavy hair marries a woman with an oval face and wavy hair, what is theprobability that they will have a baby with a square face and curly hair?”
The parents both have oval face and wavy hair, so they are both heterozygous at both lociof interest: they both have the genotype Aa Hh. Rephrasing the question, what we want toknow is, What is the probability that two parents with the genotype Aa Hh will have ababy with the genotype aa HH (the genotype for square face and curly hair)?
• We can break this problem into two parts. First we ask, What is the probability that thebaby will be homozygous recessive (aa) at the “a” locus? There are two ways we cananswer this part of the question.
• We may simply remember that the probability of any two heterozygotes producing ahomozygous-recessive offspring is always 1/4. Or we may get the same answer by theprocess of multiplying the independent probabilities. The probability that the baby willinherit the a allele from the mother is 1/2, and the probability that it will inherit the aallele from the father is 1/2; therefore, the probability that it will inherit two a alleles is1/2 x 1/2 = 1/4.
• Next we ask, What is the probability that the baby will be homozygous dominant (HH)at the “h” locus? By one of the two processes that we used above, we establish that theprobability that the baby will inherit two dominant alleles at the h locus is also 1/4.
• So now, to determine the probability that the baby will have the aa HH genotype, wesimply multiply the probability that it will be aa (1/4) by the probability that it will beHH (1/4). 1/4 x 1/4 = 1/16.
In the C.4 exercise, students were guided very carefully through the use of the 4 x 4Punnett square and given the answers. It would be a good idea to choose a pair of differentCreate-a-Baby traits and have students perform a Punnett square analysis of those traits(perhaps as a homework assignment).
An advantage of the Punnett square method is that once the diagram has been filled in, onehas information regarding the probabilities for all possible genotypes and phenotypes thatcould result from that particular cross. On the other hand, the advantage of the “product-
Chapter 2 • Modern Genetics for All Students T 130
C.4
of-independent-probabilities” method is that it can be applied to many situations in whichthe Punnett square is not useful, such as many non-genetic probability problems and genet-ic problems that are much too complex to be solved with a Punnett square.
For example, suppose we wanted to know what the probability is that one of the babiesproduced by Mom and Dad Reebop would have the homozygous-recessive genotype at allseven loci at which Mom and Dad are heterozygous. Because there are seven loci, wewould need a large square containing 27, or 128, squares on each side if we were to use thePunnett square method. Completing and analyzing such a huge Punnett square without anyerrors would be tedious, to say the least. On the other hand, to solve the same question bythe product-of-independent-probabilities method is quite simple. We know (or can quicklycalculate) that if both parents are heterozygous at any one locus, the probability of thebaby being homozygous recessive at that locus is 1/4. Therefore, to calculate what theprobability is that the baby will be homozygous recessive at all seven loci at which theMom and Dad Reebop are heterozygous, all we have to do is calculate the value of (1/4)7.This reveals that the probability of a Reebop baby being homozygous recessive at allseven loci is 1 in 16,384, or 0.006%.
TIMELINE
It will take an average student about 10-15 minutes to read through this exercise carefullyenough to really understand it.
SUGGESTED TOPICS FOR ADDITIONAL DISCUSSION
1. Why don’t all the babies in either the Reebop or the Create-a-Baby exercise look justlike their parents? They have different combinations of alleles than their parents have.
2. Does it make any difference whether you get a particular allele from your father orfrom your mother? In nearly all cases it does not. In fact, until a few years ago the answer to this questionwas thought to be a simple “no.” But in recent years it has been discovered that for afew genes (particularly ones that control aspects of very early embryonic development)it does make a difference whether a particular allele was inherited from the father orthe mother. However, this is an exception to the general rule, which is that any particu-lar allele has the same effect in the offspring whether it came from the mother or thefather.
3. Are dominant traits always more common than recessive traits? No. For example, in humans the allele for six fingers and six toes is dominant over theallele for five fingers and five toes, but the polydactyly (extra digits) allele is quiterare.
Chapter 2 • Modern Genetics for All Students T 131

4. If you know the genotype of the parents, can you predict the possible genotypes of thebabies? Yes. But when the parents are heterozygous for several different genes (as Mom andDad Reebop were in the previous exercise, for example), it becomes complicated. WhenMom and Dad are both heterozygous at only one locus (Aa), three different genotypesof babies are possible: AA, Aa, or aa. If they are heterozygous at two loci (Aa and Bb),there would are nine possibilities: AABB, AABb, AAbb, AaBB, AaBb, Aabb, aaBB,aaBb, and aabb. So we can quickly see that the relationship is…what? (Answer: Thereare 3n different genotypes possible, where n is the number of loci at which Mom andDad are heterozygous.) So, since Mom and Dad Reebop were heterozygous at sevenloci, how many different genotypes of babies could they have produced? (Answer: 37,or 2,187! That is why there will very rarely be two Reebop babies of identical genotypeproduced by a class.)
If two members of this class had been heterozygous with respect to 20 of the traits thatwere included in the Create-a-Baby Table, there would have been 320, or more thanthree billion, possible genotypes for the offspring they produced. Most humans areprobably heterozygous at thousands of different loci, so the number of possible geno-types of their offspring is astronomical. That is why siblings never look exactly alikeunless they are identical twins (derived from a single fertilized egg).
5. Why are there so many different skin and hair colors in humans? Skin and hair color, like many other human traits, are determined by the effects ofmore than one gene, so there are many possible combinations. For example, it isthought that alleles at seven different loci have major effects on skin color in humans.So, as we just calculated, if there are only two different alleles at each of these sevenloci, there are 2,187 possible genotypes. So at least 2,187 different skin color geno-types are possible in humans. This is without even making any allowance for the effectof sunlight on skin color.
6. Are there only two possible alleles at each locus? No, there can be any number. As a simple example, there are three common alleles atthe ABO blood-group locus. Alleles A and B encode different forms of an enzyme,thereby causing two different kinds of sugars to be put on the surface of red blood cells(RBCs). Alleles A and B are codominant, so a person who is heterozygous for these twoalleles has both types of sugar on the RBCs and thus has type AB blood. The O allele(which encodes an inactive form of the enzyme and thus is unable to put any sugar onthe surface of the RBCs) is recessive to both the A and B alleles. As a more complex example, in humans there are more than 100 alleles at most of the11 histocompatability loci, which encode proteins on the surfaces of cells in mosthuman tissues. It is differences in these proteins between donor and recipient cells thatcause the immune system to recognize grafted tissues as foreign and attack them. With100 alleles at 11 loci, there would be 10011, or 1022, possible combinations of differenthistocompatability alleles, which is far greater than the number of human beings thathave ever been born. That is why it is impossible (except in the case of identical twins)to find an organ donor who is a perfect match for someone who needs an organ graft.
Chapter 2 • Modern Genetics for All Students T 132

7. Mom and Dad Reebop have only one gene on each chromosome. How many differentgenes do humans have on a chromosome? As a result of the sequencing of the human genome, which was completed in 2001, wenow know that humans have about 35,000 genes per haploid chromosome set. Theseare distributed on 23 kinds of chromosomes that differ quite a bit in size, suggestingthat the number of genes per chromosome is probably also quite variable. So a goodguess would be that on average a human chromosome probably contains around 1,500genes, but that the range might be from about 750 to about 3,000.
HINTS AND TROUBLESHOOTING
Create-a-Baby is another fun exercise and a good complement to the Reebops. It reinforcesstudents’ newly gained knowledge of genetic concepts and terminology by referring toorganisms with which they have no trouble identifying: themselves, their friends, and theirfuture progeny.
You can contribute to the mutually reinforcing nature of these two exercises by tying thetwo discussions together as much as possible. Among the major take-home messagesshould be the following: (a) as a result of meiosis and recombination, a pair of sexuallyreproducing organisms have the potential to produce progeny with many different geno-types and phenotypes, but (b) if we know the genotype of the parents, we can predict howprobable it is that one of their offspring will have any particular genotype of interest.
This would be a good time to provide your students with copies of Appendix C (“SomePresumably Simple Heritable Human Traits”). If you do, be sure to call their attention tothe introduction, which indicates some of the reasons that the information in this tableshould be considered tentative.
Chapter 2 • Modern Genetics for All Students T 133


Chapter 2 • Modern Genetics for All Students T 135
CHAPTER 2
Passing Traits fromOne Generation to the Next
SECTION D
How AreGeneticExperimentsActuallyPerformed?

Chapter 2: Section D BackgroundIMAGINARY ORGANISMS ARE FUN. They can also be instructive, as we saw inSection C. But Mendelian genetics is not about imaginary organisms any more than chem-istry is about imaginary elements. So it’s time to introduce your students to some realMendelian-genetic experiments, with some real, live organisms.
Although all sexually reproducing eukaryotic organisms that have been studied adhere tothe principles of Mendelian genetics, there are a very limited number of them that are suit-able for performing Mendelian genetic experiments in a secondary-school classroom. Inorder to be useful in such a context, organisms must be quite small (so a large number ofthem can be produced and maintained in a small space). They must be relatively easy toraise in captivity (so teachers and students with little prior experience can work with themeffectively). They must have a relatively rapid sexual reproductive cycle (so progeny froma sexual cross can be produced and analyzed within the confines of a standard schoolterm). And they must be available in strains exhibiting reproducible visible differences thatstudents can readily distinguish (so students can easily collect the data that will enablethem to deduce the genetic basis for the phenotypic traits(s) in question).
Fruit flies meet all of the above criteria and therefore probably have been used for class-room Mendelian genetic experiments more than all other organisms combined.Nevertheless, they do not always meet one other criterion not listed above: to be actuallyadopted for classroom genetic studies, organisms must be aesthetically acceptable to theteacher. Our experience indicates that many teachers say they prefer not to have rogue fruitflies buzzing around their classrooms all semester or refuse to use fruit flies for some otherreason. So the exercises developed here are based on two very different kinds of organismsthat meet the above criteria: a fungus (baker’s yeast) and a plant that was developed forstudying genetics in the classroom (Wisconsin Fast Plants).
As you will read in the Overview to Section D.1, baker’s yeast has become one of themost intensively studied organisms in the world. Here your students will use it to generatea Punnett square that illustrates the results of a monohybrid cross, not with letters onpaper, but with live organisms that are growing and exhibiting two readily distinguishablediploid phenotypes.
As you should already have read by now (on the second page of this manual), fast is a rel-ative term when it comes to plants. If you have made the recommended preparations, webelieve your students will have a truly rewarding experience, as they see the results of adihybrid cross unfold before their eyes. However, we do provide an alternative, less time-consuming option that will permit your students to gain some of the benefits of the FastPlants, even if you are unable to devote as much time to this topic as the two-generationFast Plant exercise requires.
Chapter 2 • Modern Genetics for All Students T 136

A Colorful Experiment in YeastGenetics STUDENT PAGES 112-119
LESSON OVERVIEW
In this exercise, students perform a genetic cross that provides information about a singlegene trait. Haploid strains of baker’s yeast (Saccharomyces cerevisiae) come in two matingtypes, A and αα (alpha), each of which is available in red and white varieties. Therefore,students can use yeast matings to produce a visible Punnett square.
BACKGROUND
Baker’s yeast is a unicellular organism that can be grown on culture plates like bacteria.Nevertheless, it is a genuine eukaryotic organism with a nucleus, mitochondria, and manyother features shared by all eukaryotic cells. This, combined with its interesting life cycle,which involves an alternation of haploid and diploid phases, makes it a good model organ-ism for studying basic cell biology and genetics.
Yeast was the first eukaryotic organism to have its DNA completely sequenced as part of theHuman Genome Project. The reason that yeast was included in the Human Genome Projectis because it known to have thousands of genes that are extremely similar to those ofhumans, but it is much easier to study the function of many of those genes and their productsin yeast cells than it is in human beings. Yeast is the most intensively studied eukaryoticorganism. Nevertheless, thousands of yeast genes of unknown function were discovered as aresult of the DNA sequencing. Now that the sequence of each of those genes is known, workhas begun to understand all of their functions.
Cell Growth and Division
Baker’s yeast is known as a budding yeast. This refers to its unusual form of cell division.It does not just grow larger and then divide in the middle, as many animal and plant cellsdo. Instead, it forms a small bud at some point on the surface of each mother cell. Thisbud, or daughter cell, grows until it is as large as the mother cell, and then it pinches off
Chapter 2 • Modern Genetics for All Students T 137
D.1
Cell Division in Budding Yeast
Mother cell
Bud
Mother Daughter Cell separation Budding cyclerepeats

as a separate cell. (By then, the chromosomes will have been replicated, the nucleus willhave undergone mitosis, and the bud will have received a nucleus identical to that in themother cell.) Under good growth conditions, both the mother cell and the daughter cell(now about to become a mother cell itself) begin to bud again as soon as they have sepa-rated. Both haploid and diploid cells of baker’s yeast divide this way.
Sexual Reproduction and Beginning of the Diploid Phase
Saccharomyces cerevisiae has a well-characterized sexual cycle, which is illustrated on S113. A haploid cell population consists of cells of one of two mating types, usuallyreferred to as a (little a) and αα (alpha). But because of the difficulty students may have indistinguishing a and αα in writing, we will refer to the two mating types as A (capital a)and αα (alpha) throughout the rest of this exercise. Although haploid cells can reproduceasexually (by budding) indefinitely, they also can act as gametes and fuse with cells ofopposite mating type to form a diploid.
Each mating type releases a chemical substance that prepares cells of the other mating typefor sexual fusion. Thus, as soon as cells of opposite mating type encounter one another,they initiate a series of cellular events that will lead to conjugation in which an A cellfuses with an αα cell.
Sporulation and Beginning of the Haploid Phase
Given suitable conditions and adequate nutrients, diploid yeast cells can grow and dividemitotically for an indefinite period. However, if a diploid culture becomes nutritionallydeprived, growth and mitotic division ceases, and the cells prepare to undergo meiosis andsporulation or spore formation. As a result of meiosis, four haploid cells are produced.These four haploid cells develop as four ascospores, dormant, resistant cells, within thewall of the original diploid cell. Sporulation takes at least 15 hours. If ascospores are sim-ply returned to a nutritionally adequate environment, they will germinate and begin toreproduce asexually. But because both mating types will be present under these conditions,they will quickly mate and reform diploids.
On the other hand, if the ascospores are separated from one another while they are still dor-mant, each will form a stable haploid culture of a single mating type when it is returned torich medium. This is how the haploid strains that your students will be using were produced.
The Basis for the Red Phenotype in Yeast
In most organisms, presence of color is a dominant trait and colorless (white or albino) isrecessive. This is because the colorless trait is usually caused by a mutant gene thatencodes an inactive form of an enzyme required for producing a normal pigment. Evenwhen the enzyme encoded by the mutant allele is totally inactive, the heterozygote usuallyis normal in color, because the enzyme acts as a catalyst, and therefore half the usualamount of enzyme is enough to make the usual amount of pigment. In some cases that isnot true, so the traits exhibit codominance, and the heterozygote is intermediate in colorbetween the two homozygotes. (For example, it has pink flowers instead of red or white.)
Chapter 2 • Modern Genetics for All Students T 138

Yeast normally are not colored. The red strain that will be used in this exercise is unusualin that regard. It has a mutation of a gene that encodes an enzyme required for one particu-lar step in a series of reactions that normally produces the nitrogenous base adenine. Whenthis mutant gene is present in a haploid strain or in the homozygous condition in a diploidstrain, this step in adenine synthesis cannot take place.* As a consequence, the compoundthat is produced in the preceding reaction accumulates in the cell. And as luck would haveit, this accumulating intermediate product causes the cell to turn red. However, in a diploidcell that has one copy of the wild-type gene, enough functional enzyme is produced to pre-vent accumulation of the intermediate. Thus, the cell remains colorless. Or, putting it dif-ferently, white is dominant.
Experience indicates that, by one means or another, most students have developed a senseof the usual dominance relationship between color and colorless alleles and therefore willpredict that the heterozygous diploid yeast will be either red or pink. The contrast betweenwhat most students usually predict and what they actually observe often provides a goodopening for discussing the scientific approach as a way of testing assumptions andhypotheses.
*Adenine is essential for life. It is required for making DNA, RNA, ATP and several other very important cellular com-ponents. Thus, the red yeast strain could not grow if you did not provide adenine. However, the yeast extract that youincluded in the medium provides all of the adenine that the mutant strain needs for normal growth.
REFERENCE
Handbook for Using Yeast to Teach Genetics, T.R. Manney and M.L. Manney. 1991.Manhattan, KS, Kansas State University Department of Physics.This handbook and the accompanying video have several interesting experiments for fur-ther study.The Genes We Share with Yeast, Flies, Worms and Mice: New Clues to Human Health andDisease. (2001). This booklet contains an up-to-date discussion of the way in whichbaker’s yeast is being used to obtain important new insights into human genetics. A morecomplete description and ordering information are given on page T106.
TIMELINE
The terms Day One, Day Two, and Day Three in this exercise are based on the assumptionthat you will be able to incubate the culture plates at 30° C. If you do not have a 30° incu-bator, incubate the dishes at room temperature, but allow the yeast to grow for two daysbetween steps, instead of one. Day One About 15 minutes. Students label their Petri dishes and transfer haploid yeast
of four types from stock plates to their own test plates.Day Two 15-30 minutes. After the haploid cultures have grown enough on the Petri
dishes to show their color clearly, students will set up their crosses and thencomplete the Day Two Worksheet.
Day Three About 15 minutes. Students examine the results of their crosses, record obser-vations and complete the Day Three Worksheet.(If most of the lab groups find that their cultures have not grown enough tomake the color of each diploid entirely clear, all groups should allow their cul-tures to grow another day before continuing with the analysis.)
Chapter 2 • Modern Genetics for All Students T 139

MATERIALS
For each group of four students:1 petri dish containing yeast growth culture of Red, Mating type α yeast
medium (YED) culture of White, Mating type A yeastmarking pen culture of White, Mating type α yeasta packet of sterile toothpicks waste containerculture of Red, Mating type A yeast disinfectant
The four strains of yeast can be ordered from:Carolina Biological(800) 334-5551www.carolina.com
Mating type Color Strain Designation Catalog numberA red (R) HA2 ER-17-3624A white (W) HAT ER-17-3630α red (R) HB2 ER-17-3626α white (W) HBT ER-17-3631
At the same time that you order the above yeast strains, order the premixed powder thatyou will use to prepare the medium on which the yeast will be grown: Carolina cat. no.ER-17-3651 Yeast-Extract Dextrose (enough to make 2 liters of YED medium).You should also order 10 ml of 10 mg/ml Gentamycin solution (Cat. # G1272) fromSigma, P.O. Box 14508, St. Louis, MO 63178, (800) 325-3010, www.sigma-aldrich.com.
ADVANCE PREPARATION
NOTE CAREFULLY: Preparations for this exercise will not occupy a lot of your time, butat several points culture plates will need to sit for several days to a week at a time.Therefore, you need to begin preparations for this experiment at least two weeks inadvance, and if you do not have an incubator in which you can incubate the plates at 30°C,you should start preparations at least three weeks in advance. If plates and cultures areready before they are needed, they will keep. But if they are not ready when you want touse them, there will be nothing you can do to rush them along!
1. Preparation of yeast extract/dextrose plates (YED plates) for culturing the yeast. Youwill need four YED plates for your own use, plus five times as many plates as therewill be student groups in your largest class, plus one plate for each group of students ineach of your other classes. For example, assuming that you have seven groups of stu-dents in your largest class and six groups of students in each of your other three class-es, you will need to prepare 4 + (5 x 7) + (1 x 3 x 6) = 57 YED plates. But becauseYED plates are very easily contaminated, we recommend making a few extras. Thegeneral procedure for pouring YED plates is similar to the one that you used to preparenutrient agar (NA) plates for E. coli (Chapter 1, Section E). The major difference isthat because YED is richer in nutrients than NA medium is, more of the bacteria andfungi that are present in room air can grow on YED plates than can grow on NA plates.
Chapter 2 • Modern Genetics for All Students T 140

The gentamycin that we recommend adding will greatly reduce the chance of bacterialcontamination, but the plates will nevertheless be likely to become contaminated withairborne fungal spores unless they are poured and used with great care.
It is possible to buy the individual ingredients for YED and weigh them all out for eachbatch of medium. But because you will probably need to make several batches ofmedium, that could become tedious. We strongly recommend that you buy premixedYED powder from Carolina Biological Supply Company as noted earlier.
Below are the materials and steps required to make a batch of 12 dishes:15 g of YED powder Gentamycin solution (10 mg/ml)300 ml deionized water 1000 µl micropipettor with sterile tip500 ml flask 12 petri dishespiece of aluminum foil disinfectantautoclave or pressure cooker 1 Bunsen burner or alcohol burnerhot water
a. Weigh out 15 g of YED powder.b. Add 300 ml of deionized water to a 500 ml flask. Swirl the flask while adding the
powder slowly.c. Cover the flask with aluminum foil. Sterilize 30 min at 15 psi in an autoclave or
pressure cookerd. While medium is being sterilized, wipe down a flat surface with disinfectant and
spread out 12 petri dishes on it. e. Set up a Bunsen burner or alcohol burner near the petri dishes. f. Allow flask containing sterile YED to cool just enough that you can handle it com-
fortably. Use a micropipettor with a sterile tip to add 450 µl of gentamycin solution(10 mg/ml) to the medium. Swirl the flask to ensure that the contents are thoroughlymixed.
g. Light the Bunsen or alcohol burner. Remove the foil lid from the flask. Pass themouth of the flask through the flame.
h. Lift the lid of a petri dish, fill it about half way with YED medium, and cover itback up quickly.
i. Repeat the preceding two steps until all twelve plates have been poured. Fill theflask with hot water to simplify cleaning later.
Repeat the above procedure as many times as necessary, until you have enough platesfor all of your classes, plus a few to spare. If necessary, carefully stack one set ofplates four-high and move them aside, in order to make space for pouring the next setof 12 plates.
After all plates have solidified, they should be spread out in a place where they can beleft undisturbed for a day or two to dry out. (YED plates have a tendency to accumu-late a great deal of moisture on their lids initially. If this moisture is not allowed toevaporate before the plates are stored or used, contamination with unwanted organismsis almost inevitable.) When all, or nearly all, of the condensation has disappeared from
Chapter 2 • Modern Genetics for All Students T 141

their lids, the YED plates can be turned upside down, wrapped (either in the plasticsleeves from which the petri dishes came or in plastic wrap) to prevent further drying.They can then be stored upside down in the refrigerator until they are needed.
2. Preparation of stock culture plates. The yeast cultures from Carolina Biological willarrive in small vials. Use them to establish petri dish subcultures, using techniquessimilar to those you used to subculture E. coli for “Shine On!” (Chapter 1, SectionE.2.c). The difference here is that you will grow your yeast subcultures on the YEDplates that you have prepared in step 1. You will greatly decrease the chances that youwill contaminate your stock subcultures (and thereby possibly blow the whole exer-cise!) if you keep your YED plates upside down while streaking the yeast out on thesurface of the agar. This will seem a bit difficult to do at first. However, it is the tech-nique that you will be asking your students to use later. So some practice now mightcome in handy later.
Be sure to label and date the bottom of each subculture plate as you prepare it. Ratherthan using the catalog numbers or the strain codes that are used by Carolina Biologicalto identify the cultures, label your plates with the clear, simple designations that youwill have your students use, as shown in the following table:
Catalog number Carolina strain code Your labelBA-17-3624 HA2 Red, Mating type ABA-17-3630 HAT White, Mating type ABA-17-3626 HB2 Red, Mating type αBA-17-3631 HBT White, Mating type α
If you have a thermostatically adjustable incubator, set it for 30°C for growing yeastcultures. Otherwise, grow them in whatever place you can find that is closest to 30°C.At 30°C, it should take only two to three days for the white yeast colonies to grow tothe extent that they have a rich, creamy consistency and an ivory-white color. At thispoint they will be ready to use in the next step. The red colonies, however, probablywill not look as lush and creamy in consistency as the white colonies and will not beready for use. If that is the case, put the white yeast in the refrigerator and allow thered ones to grow another day or two, until they also have a rich, creamy appearanceand are very dark pink or red in color. If you grow the yeast at room temperature, itmight take twice as long to get cultures that are ready to use. The cooler the spot whereyou grow them, the longer it will be before you are ready for the next step. On theother hand, you should not assume that this means that the higher the temperature, thebetter. Yeast grow better in an incubator set at 30°C than one set at 37°C, for example.
Once the red and the white strains on your stock plates have all produced rich, creamy-looking colonies, use them to make one subculture of each strain for each studentgroup in your largest class. (All of your classes will be able to work from the same setof stock plates.) Be sure that you label each plate carefully as you set it up. After estab-lishing the second generation of subcultures for your classes, wrap the first generationplates in plastic film and store them in the refrigerator. It will take just about as long
Chapter 2 • Modern Genetics for All Students T 142

for your second generation plates to reach a useable condition as it did your first gener-ation plates. Once again, permit the red strains to grow longer than the white strains ifnecessary. If these subcultures are ready for use before your class is ready for them,wrap them in plastic film and refrigerate them; they will hold for weeks with no appar-ent loss of viability. (We do not recommend trying to hold them over from one year tothe next, however.)
3. Sterile toothpicks. Provide each lab group with an unopened box of toothpicks that hasjust had one corner cut off with a razor blade, so that toothpicks can be shaken out oneat a time. (Toothpicks in an unopened package are essentially sterile, so they do notrequire any additional sterilization.) As long as no contaminated toothpicks have beenput back in the package, the package can be passed on from class to class with noproblem.
4. Disinfectant. Prepare disinfectant spray bottles as for Chapter 1, Section E.2.
HINTS AND TROUBLESHOOTING
1. The YED plates get contaminated easily, so always make a few extra and emphasizethe importance of working with them carefully to avoid contamination. Experienceindicates that they will have much lower contamination levels if students keep theplates upside down while working with them. As mentioned above, you should practicethis technique in advance and then demonstrate it to the class.
2. Unless students are cautioned against doing so, they will tend to ignore the instructionsand use as much yeast as they can possibly load on the end of a toothpick to set upeach cross. Emphasize that “more is better” does not apply to this case. Indeed, if thereare too many haploid cells present, they will interfere with the growth of the diploidcells and will obscure the outcome of the cross. Emphasize that each cross should beset up with just enough yeast of each mating type to be barely visible. Then alsoemphasize the importance of mixing the two kinds of cells together thoroughly withthe second toothpick.
3. After students have set up their crosses and completed the Day 2 Worksheet, have themdiscuss it as a class. Most students will think either that red will be the dominant color,so that the diploids will be red, or that red and white will be codominant, so that thediploids will be pink. Actually white is dominant, as explained above, but don’t revealthis to the class yet.
4. If students have a colony that is mostly white, but with a red center, have them incu-bate the plate another day, by which time the white diploids should overgrow the redhaploids, clarifying the result.
5. At the end of the exercise, have the students open their plates, spray them with bleach,reclose them, tape them shut, and dispose of them in a standard trash container.
DAY 2 WORK SHEET STUDENT PAGE 116
After each group of students has predicted the outcomes of the crosses, have them discusstheir predictions as a group. Make a tally of the class predictions.
Chapter 2 • Modern Genetics for All Students T 143
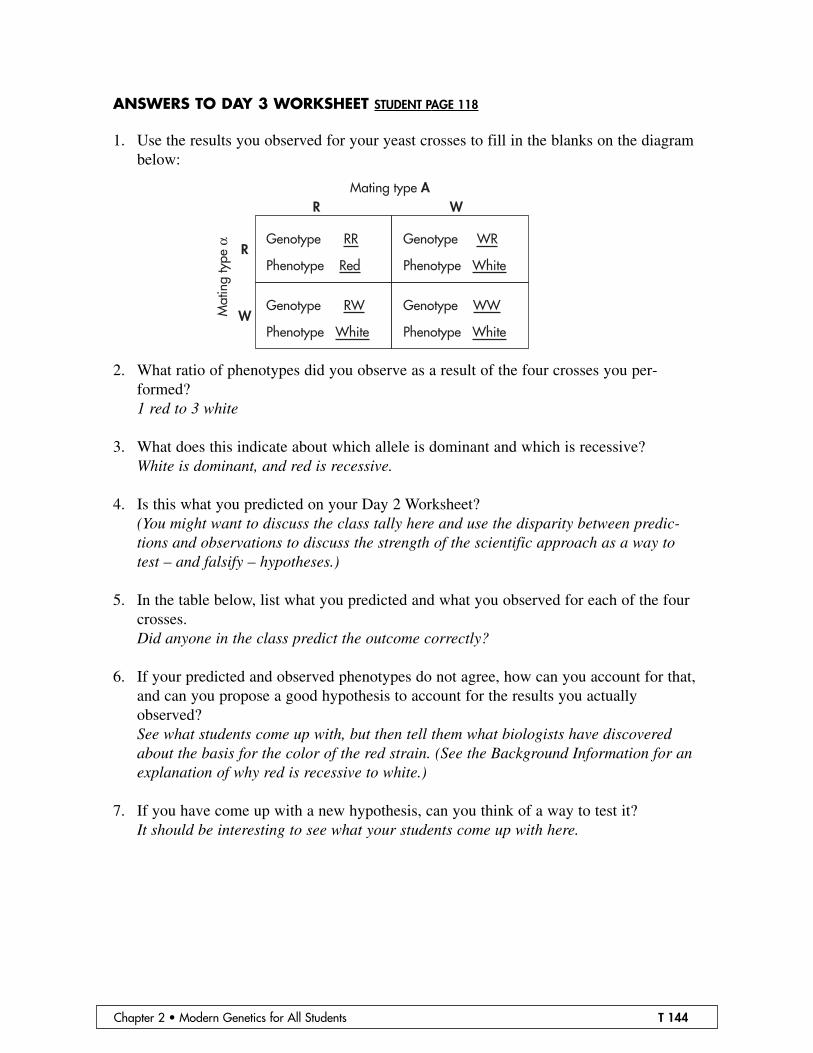
ANSWERS TO DAY 3 WORKSHEET STUDENT PAGE 118
1. Use the results you observed for your yeast crosses to fill in the blanks on the diagrambelow:
2. What ratio of phenotypes did you observe as a result of the four crosses you per-formed? 1 red to 3 white
3. What does this indicate about which allele is dominant and which is recessive? White is dominant, and red is recessive.
4. Is this what you predicted on your Day 2 Worksheet? (You might want to discuss the class tally here and use the disparity between predic-tions and observations to discuss the strength of the scientific approach as a way totest – and falsify – hypotheses.)
5. In the table below, list what you predicted and what you observed for each of the fourcrosses.Did anyone in the class predict the outcome correctly?
6. If your predicted and observed phenotypes do not agree, how can you account for that,and can you propose a good hypothesis to account for the results you actuallyobserved? See what students come up with, but then tell them what biologists have discoveredabout the basis for the color of the red strain. (See the Background Information for anexplanation of why red is recessive to white.)
7. If you have come up with a new hypothesis, can you think of a way to test it?It should be interesting to see what your students come up with here.
Chapter 2 • Modern Genetics for All Students T 144
Genotype RW
Phenotype White
Genotype RR
Phenotype Red
Genotype WR
Phenotype White
Genotype WW
Phenotype White
R
R
W
WMating type A
Mat
ing
type
α

Experimenting with WisconsinFast Plants STUDENT PAGES 120-156
LESSON OVERVIEW
Paul Williams, a plant biologist at the University of Wisconsin, performed an exceptional
service for biology teachers and students everywhere when he devoted 15 years to devel-
oping the Wisconsin Fast Plants. These plants have made it possible for students to carry
out meaningful experiments in plant genetics in less than a semester.
Most plants take at least one full growing season — six months to a year — to go through a
full life cycle. (That is, to go from a seed to an adult plant with mature seeds.)
Furthermore, most plants get so large by the time that they produce mature seeds that you
could not grow more than a few of them in a standard classroom. In contrast, Fast Plants
go from seed to seed in about six weeks, and they are so small when they are full-grown
that hundreds can be kept in just a few square feet.
Another name for Wisconsin Fast Plants is rapid-cycling brassicas. Brassica is the plant
genus that includes such familiar vegetables as broccoli, cabbage, cauliflower, collards,
kale, kohlrabi, and mustard greens (in addition to the rape seed plant, from which the
increasingly popular canola oil is obtained). The species of Brassica from which the Fast
Plants were derived is B. rapa, a species from which bok choi, Chinese cabbage and
turnips also were derived. Professor Williams planted seeds that had been collected from
thousands of brassica plants around the globe, and observed their offspring carefully. The
plants of each species that flowered and set seed most rapidly were crossed with one
another. This selection process, continued for many generations, resulted in B. rapa plants
that germinated within a day or two, flowered within two weeks, and had mature seed in
less than six weeks. These became the Wisconsin Fast Plants used for teaching, but Fast
Plants belonging to five other species of Brassica were also produced for use in profes-
sional plant research.
Seeds of a number of Fast Plant mutants are now commercially available. Among the
mutants with homozygous-recessive phenotypes that can be easily recognized are the fol-
lowing: The rosette mutant is much shorter than a wild-type plant because its internodes(the regions of stem between successive leaves) fail to elongate. The elongated internodemutant has the opposite abnormality and thus is much taller than a wild-type plant. The
petite mutant is about half as tall as a wild-type plant as a result of a reduction in size of
nearly all plant parts, not just an internode abnormality. The anthocyaninless mutant lacks
the purple-red pigment, anthocyanin, that is normally present to a varying degree in the
stems, leaves, and various other plant parts; thus these plants have a much brighter, clearer
green color than wild-type plants do. On the other hand, the yellow-green mutant, as its
name suggests, has a less intense green color than wild-type plants do.
Chapter 2 • Modern Genetics for All Students T 145
D.2

The Mendelian-genetics experiment that is outlined in this unit involves a dihybrid cross:
a cross involving alleles at two different loci (in this case, the anthocyaninless and the yel-low-green loci). It will provide your students with an opportunity to rediscover Mendel s
law of independent assortment of alleles at two loci.
The term law is put in quotation marks because independent assortment of alleles at two
loci is not a basic law of heredity as Gregor Mendel believed it was. The phenomenon of
independent assortment (which Mendel observed in every dihybrid cross that he analyzed)
is only observed when the two loci being studied are located either on separate chromo-
somes or far apart on a single chromosome. When the two loci being studied are located
near one another on a single chromosome they do not exhibit independent assortment; they
exhibit linkage, as will be explained in section 2.E.
Symbols Used to Identify Genotypes and Phenotypes of Fast Plants (andMany Other Organisms)
Wherever you look for information about Fast Plants — whether it is in the Carolina
Biological catalog, in information distributed by the Wisconsin Fast Plants Project, or even
in the ordering information provided in the MATERIALS section of this unit — you will
find symbols used to identify the various Fast Plant genes that look a bit more complicated
than the symbols that we ve been using to identify genes and their alleles earlier in this
chapter (in the Reebop and the Create-a-Baby exercises, for example).
Be assured that these unfamiliar symbols are not being introduced just to complicate your
life as a teacher! They are the kind of symbols that geneticists around the world have
agreed to use to symbolize the genotypes and phenotypes of organisms involved in genetic
studies. After explaining why such symbols are used, and how they are used, we will sug-
gest how you can avoid introducing such apparent complications into your classroom, if
you prefer.
When students are introduced to genetics, they and their teachers are usually given a very
simple and easily understood set of symbols to use for representing dominant and reces-
sive alleles. This is what we usually call the big-A-little-a convention; a single capital let-
ter represents the dominant allele associated with some particular trait, and the correspon-
ding lower case letter represents the corresponding recessive allele. For example, T was
used for the dominant Reebop curly tail allele, whereas t was used for the recessive
straight tail allele (see S94). In contrast, the symbols used for the various Fast Plant genes
all use three letters.
Why can t geneticists leave well enough alone and stick with the simple, easily understood
big-A-little-a convention for naming genes? One reason is that such a convention only pro-
vides a way of naming 26 genes per organism, and even the simplest real organisms have
thousands of genes. A second reason is that in most cases a single letter conveys no infor-
mation about the function of the gene for which it stands. For example, who would guess
that D stands for a gene that determines the number of segments in the body of a Reebop —
without looking it up in the Reebop genotype-phenotype table?
Chapter 2 • Modern Genetics for All Students T 146

In contrast, in the three-letter convention used to identify genes of Fast Plants (and many
other organisms), the symbols used for genes are usually abbreviations of the phenotypic
traits that they influence. As a result, the gene symbols convey useful information. For
example, one of the genes your students will study in this exercise controls the synthesis of
the purple-red pigment, anthocyanin. In plants that are homozygous for the recessive allele
at this locus, no anthocyanin can be made. Therefore, the symbol for this recessive allele is
anl, which is short for anthocyaninless. Similarly, the second trait that will be studied
gives the leaves of homozygous-recessive plants a yellow-green color, instead of the usual
dark green color. So the symbol for the recessive allele in this case is ygr, which is short
for yellow-green.
Like the big-A-little-a convention, the three-letter convention distinguishes the dominant
and recessive alleles by use of capital and lower case letters, respectively. Thus, the domi-
nant and recessive alleles at the anthocyaninless locus are symbolized ANL and anl,respectively. And the dominant and recessive alleles at the yellow-green locus are YGR and
ygr, respectively.
Notice that in the three-letter convention the allele symbols, as well as the names of the
genes themselves, are always italicized (or underlined when handwritten). This is because
there is a special use for the corresponding nonitalicized symbols: to provide a shorthand
identification of phenotypes. Here is how it works:
• The recessive (mutant) phenotype is identified by three non-italicized letters, of whichonly the first one is capitalized. For example, Anl stands for the anthocyaninless (no-purple color) phenotype of the homozygous recessive (anl/anl) plants.
• The dominant (wild-type) phenotype is identified by the same three-letter symbol, fol-lowed by a superscript-plus sign. For example, Anl+ stands for the anthocyanin-con-taining (purple stems, etc.) phenotype exhibited by both the homozygous dominant(ANL/ANL) and the heterozygous (ANL/anl) plants.
The table below may help you visualize all of these relationships:
Chapter 2 • Modern Genetics for All Students T 147
Trait being Dominant Recessive Dominant Recessive considered allele allele phenotype phenotype
Presence versus (purple stems, etc.) (anthocyaninless) absence of ANL anl Anl+ Anlpurple anthocyanin
Yellow-green YGR ygr (dark green leaves) (yellow-green leaves)versus dark green Ygr+ Ygr

You need to understand the three-letter convention to interpret the symbols for genotypes
and phenotypes in the Fast Plant section of the Carolina Biological catalog or in literature
distributed by the Wisconsin Fast Plant Project. However, you are free to decide whether
you will introduce these symbols to your students or whether you will continue to use the
big-A-little-a convention in your classroom. If you prefer, you may have your students use
A and a (instead of ANL and anl) for the dominant and recessive alleles at the anthocyanin-
less locus and B and b (instead of YGR and ygr) for the dominant and recessive alleles at
the yellow-green locus. The choice is yours.
TIMELINE
Some Important Scheduling Considerations
Fast Plants provide a virtually unrivaled opportunity for students to perform a genuine
study in Mendelian genetics in a standard classroom setting. However, fast is a relative
term when applied to plants. Although Wisconsin Fast Plants have a generation time of
less than one-fourth that of most annual plants, it still takes at least seven weeks to com-
plete a two-generation Mendelian-genetics experiment with them. Some teachers decide
that they cannot fit an experiment of such length into their curriculum — even though the
plants will require little attention during most of the seven weeks. Recognizing this, we
provide two options for conducting the Fast Plant experiment. Details of each option will
be given later, but here we will briefly outline both options, so that you can consider which
of them better suits your schedule and your teaching philosophy.
Outline of Option 1: A Seven-Week, Two-Generation Experiment
1. About seven weeks before you expect to finish the rest of Chapter 2 have your students
plant their F1 Fast Plant seeds. Do not discuss the genetic aspects of the experiment;
only tell them that they are starting an exercise in plant growth and development that
will take on additional meaning later.
2. Day 2: The seeds have germinated, and the students watch the plants develop.
3. Week 2: The plants are flowering, so the students pollinate them like busy little bees.
4. Week 5: The F2 seeds are mature, and the plants are dried out.
5. Week 6: The F2 seeds are dry and the students plant the seeds.
6. Week 7: The F2 plants germinate, and the students quickly see that (in distinction to
the F1 plants) the F2 plants are not all alike. While many will appear wild-type (as their
F1 parents did), some will be anthocyaninless, others will be yellow-green, and yet oth-
ers will be both anthocyaninless and yellow-green. They record the number of plants in
each of these categories and then analyze the data to see how closely they correspond
to the ratios predicted by Mendel s law of independent assortment.
Total elapsed time: about seven weeks.
Chapter 2 • Modern Genetics for All Students T 148

Outline of Option 2: A One-Week Analysis of the F2 Generation
1. Students begin with Step 5 of the above outline, when they plant F2 seeds that you
have purchased and provided to them. As controls, they will also plant seeds from the
parental and F1 generations.
2. Within the first week the students see the same set of phenotypes as the students per-
forming Option 1 do, record the same kind of data, and perform the same kind of data
analysis.
Total elapsed time: about one week. If you are already teaching from this manual when
you read this page, there is little doubt: Option 2 is for you. (But consider Option 1 for
next year!)
PROS AND CONS OF OPTION 1
The major advantage of Option 1 is that the students can follow the F1 plants through an
entire life cycle, pollinate the F1 flowers, watch them produce seeds, and then harvest and
plant those seeds to determine what kinds of plants will be produced in the F2 generation.
This will probably be the first opportunity for most of your students to follow a plant
through its entire life cycle. In addition, Option 1 will allow your students to observe one
of the most fundamental facts of life: namely, that certain heritable abnormalities can be
carried in a latent, invisible form by one generation of individuals, only to appear in a very
visible — and sometimes devastating — form in their progeny.
The disadvantages of Option 1 are (a) that it must be started about seven weeks before the
students obtain genetic data for analysis, and (b) during the intervening weeks the students
will need to water and observe their plants from time to time, even though they will be
engaged in other kinds of learning activities in your classroom.
PROS AND CONS OF OPTION 2
The advantage of Option 2 is that your students can collect and analyze the very same kind
of genetic data as with Option 1, but in one week instead of seven.
The disadvantage of Option 2 is that it is much more of a cookbook experiment than
Option 1. They do not have the opportunity of seeing any phase of the plant life cycle
other than the first few days of seedling growth. More importantly, they do not have the
opportunity of harvesting their own F2 seeds from the F1 plants they raised. Instead, they
are handed several sets of seeds and told what the relationship among them is.
Chapter 2 • Modern Genetics for All Students T 149

MATERIALS OPTION 1
Seeds required per 12 student groups (groups of four are recommended):
Chapter 2 • Modern Genetics for All Students T 150
Catalog number No. of seeds Phenotype Genotype Genetic role in exp.
BA-15-8812 50 anthocyaninless anl/anl, YGR/YGR PA
(Anl, Ygr+)
BA-15-8818 50 yellow-green ANL/ANL, ygr/ygr PB
(Anl+, Ygr)
Two packs of 2 x 200 wild type anl/ANL, YGR/ygr F1
BA-15-8891 (Anl+, Ygr+)
BA-15-8888 250 segregating all all of the above F2 (optional four phenotypes and below backup)
BA-15-8842 50 anthocyaninless, anl/anl, ygr/ygr double-mutantyellow-green (Anl, Ygr)
Carolina Biological Supply Company 1-800-334-5551 or Fax 1-800-222-7112
For all classes combined:
6 liters of potting mix (1 part Peatlite, RediEarth, or JiffyMix to 1 part medium
vermiculite)
Peter s Professional Fertilizer 20-20-20, diluted to 1X and 1/8X (instructions below)
1 1-liter and 1 2-liter soda bottle, with labels removed
masking tape
felt-tip marking pens
1 pack of dried bees (Cat. # BA-15-895)
1 box of toothpicks
1 tube of fast-drying Duco cement
The components for the potting mix and the Peter s Professional Fertilizer are available at
most garden centers.
For each set of four groups of four students:
1 plant lighthouse (instructions below)
6 8-inch x 10-inch pieces of 1 inch thick rigid insulating foam
Sheets of insulating material can be purchased inexpensively from building supply stores.
Your shop teacher may be able to cut up such a sheet for you, or you can cut it with a utili-
ty knife. Your students will use these six pieces of foam underneath their growth systems
initially, so that when the seedlings emerge, they will be close enough to the light to grow
vigorously. Then as their plants grow, students will remove the foam pieces one at a time,
in order to keep the growing tips of the plants at the recommended distance from the light.

For each group of four students:
1 film-can growth system (instructions below)
30 F1 seeds in a small envelope1 water bottle (instructions below)14 25-cm bamboo skewers (available in most supermarkets)
14 split-ring ties made from 9 or 10 mm O.D. Tygon or aquarium tubing (instructions
below)
1 brown paper lunch bag
1 small envelope
For each group of four students in Phase 2:
1 envelope with 6 PA seeds
1 envelope with 6 PB seeds
1 envelope with 6 double-mutant seeds
1 envelope with the students own F2 seeds
MATERIALS OPTION 2
Seeds required per 12 student groups (groups of four are recommended):
Chapter 2 • Modern Genetics for All Students T 151
Catalog number No. of seeds Phenotype Genotype Genetic role in exp.
BA-15-8812 50 anthocyaninless anl/anl, YGR/YGR PA
(Anl, Ygr+)
BA-15-8818 50 yellow-green ANL/ANL, ygr/ygr PB
(Anl+, Ygr)
BA-15-8890 50 wild type anl/ANL, YGR/ygr F1
(Anl+, Ygr+)
BA-15-8888 250 segregating all all of the above F2
four phenotypes and below
BA-15-8842 50 anthocyaninless, anl/anl, ygr/ygr double-mutantyellow-green (Anl, Ygr)
For all classes combined:
3 liters of potting mix (1 part Peatlite, RediEarth, or JiffyMix and 1 part medium
vermiculite)
Peter s Professional Fertilizer 20-20-20 diluted to 1X and 1/8X (instructions below)
masking tape
felt-tip marking pens
1 1-liter and 1 2-liter soda bottle, with labels removed
The components for the potting mix and the Peter s Professional Fertilizer are available at
most garden centers.

For each set of four groups of four students:
1 plant lighthouse (instructions below)
6 8 inch x 10 inch pieces of 1 inch thick rigid insulating foam
Sheets of insulating material can be purchased inexpensively from building supply stores.
Your shop teacher may be able to cut up such a sheet for you, or you can cut it with a utili-
ty knife. Your students will use these six pieces of foam underneath their growth systems
initially, so that when the seedlings emerge, they will be close enough to the light to grow
vigorously. Then as their plants grow, students will remove the foam pieces one at a time,
in order to keep the growing tips of the plants at the recommended distance from the light.
For each group of four students:
1 film-can growth system (instructions below)
1 envelope with 6 PA seeds
1 envelope with 6 PB seeds
1 envelope with 6 F1 seeds
1 envelope with 6 double-mutant seeds
1 envelope with 18 F2 seeds
1 water bottle (instructions below)
ADVANCE PREPARATIONS
Whether you use Option 1 or Option 2, the educational potential of the Fast Plants will be
realized only if you provide the plants all of the resources they need to grow vigorously
and fully express their genetic potentials. The most important resource is light. Fast Plants
have been developed to grow rapidly and express their full potential under inexpensive flu-
orescent lights of the sort used in the home if — but only if — such light is provided at rela-
tively high intensity and for 24 hours per day.
The lighting system that the Wisconsin Fast Plants Program currently recommends is a
plant lighthouse (see below). The plant lighthouse has several significant advantages
over the older light-bank system that was recommended previously*: It provides a more
nearly ideal light intensity; it is both easier and cheaper to construct; and it takes up far
less classroom space per plant grown. The plans given below are for making lighthouses
that can be folded up and stored flat when they are not in use. They should remain useable
for many years.
The other resources that your Fast Plants require are water, soil, and fertilizer. Information
regarding simple, inexpensive ways of providing all these resources are also given below.
*Until rather recently, the lighting system that most teachers used was a set of 6 4-foot flu-
orescent tubes spaced 10 cm apart (as in the Carolina Biological Plant Light Bank kit, Cat.
# BA-15-8998). If your school already has such a light bank, it may be used. Similarly, if
your school has a collection of the watering systems and quad growing units purchased
from Carolina for growing Fast Plants, they may be used. But in either case, please see the
Hints and Troubleshooting section for ways to improve the performance of these compo-
nents.
Chapter 2 • Modern Genetics for All Students T 152

A. CONSTRUCTING A PLANT LIGHTHOUSE (FIG. 1)
Whether you are implementing Option 1 or Option 2, you will need one plant lighthouse
for each four student groups.
Materials
For the entire project:
1 felt-tip marking pen1 quarter1 utility knife or other sharp,
pointed cutting tool1 or more glue sticks1 roll of 12 inch-wide alu-
minum foil1 pair of scissors1 roll of clear, glossy tape
For each lighthouse:
1 empty copy-paper box
(approximately 23 x 30 x 45
cm)
1 lid from a plastic container,
10-15 cm in diameter
1 foot of self-adhesive Velcro
tape (hook and loop)
1 30 to 39 watt energy saver
fluorescent circle-light with
a socket adapter**
1 electric cord with a standard
light socket on one end
1 wooden paint stirrer or other
thin wooden strip approxi-
mately 30 cm long
1 20 x 26 cm piece of card-
board
**A Lights of America 30 watt
Circlight (model # 2630) or 32 watt light (model # 2730) is good; a GE 39 watt Energy
Saver (Product Code 18739) is better. Such lights are sold at many discount and hardware
stores. If you cannot find such a light locally, the 30 watt model is available (at consider-
ably higher price) from Carolina Biological (Cat. # BA-15-8999 or BA-15-8997).
Chapter 2 • Modern Genetics for All Students T 153
Aluminum foil
curtain
Lamp
Plasticcontainer
lid
Figure 1

Construction Procedure
1. Discard the lid of the copy-
paper box. Check the rest of
the box carefully; if any
flaps are loose, reglue them
and allow the glue to dry.
2. Stand the box on end. Using
the marking pen and the
quarter, draw a circle in the
middle of what is now the
top of the box (Fig. 2) and
on the plastic lid. Use the
utility knife to cut out both
circles carefully.
3. Make cuts 2.5 cm from each
end, all around the box (Fig.
2), to separate both ends (A
and C) from the rest of the
box (B) (Fig. 3).
4. Lay piece B flat. Cut a 3 x
14 cm vent slot on each sec-
tion of piece B 3 cm from
the top edge (Fig. 4 B).
5. Attach 2.5 cm pieces of
Velcro tape — loop half — to
the outer surface of piece B
in the locations shown (Fig.
4B).
6. Attach 2.5 cm pieces of
Velcro tape — hook half — to
the inner surfaces of pieces
A and C (Fig. 4 A and C) in
positions such that the hook
pieces will make contact
with the loop pieces on
piece B when the box is
reassembled (Fig. 5).
7. Apply glue stick to the inner
surfaces of all three card-
board pieces, and cover all
these surfaces with alu-
minum foil, shiny side up.
Chapter 2 • Modern Genetics for All Students T 154
Figure 4 BB
Cover innersurface withfoil. Reinforceedges andseams of foilwith clear tape.
Attachpieces ofVelcro–loophalf–to outersurface ofcardboardin locationsshown.
Cut vents
Cover innersurface withfoil. Reinforceedges andseams of foilwith clear tape.
Attach pieces ofVelcro–hook half–toinner surface ofcardboard inlocations shown.
A (upside down)
C
A
B
C
Cut hole
Cut ondottedlines
B
C
Fit part Binside Aand C
A
Figure 2
Figure 3
Figure 4 A and C
Figure 5

8. Cut away the foil that covers the circular hole in piece A and the vent holes in piece B.
9. Use glossy clear tape to reinforce all the seams and edges of the foil, plus the bend
regions of piece B.
10. Fold piece B and insert it into the end pieces, A and C, to reassemble the box (Fig. 5).
Press Velcro tapes together to stabilize box.
11. Insert the lamp base through the hole in piece A from the inside. Slip the plastic lid
with a hole in it over the lamp base. Screw the lamp into the socket (Fig. 1).
12. Cut a piece of aluminum foil 40 cm long. Reinforce the sides and middle of this foil
with clear tape. Apply glue stick to both side of a paint stirrer, attach the stirrer to one
end of the foil, then roll it over so that it is covered with foil on both sides.
13. Tape the other end of the foil (shiny side in) to the top of the box so that it forms a cur-
tain over the top portion of the opening (Fig. 1). (It should not extend all the way to the
bottom of the box.)
14. Cover the 20 x 26 cm piece of cardboard with foil, shiny side out. Reinforce the edges
and seams of the foil with clear tape. (This piece of foil-covered cardboard will be
placed between the plants and the foam blocks that prop up the plants.)
B. ASSEMBLING A FILM-CAN GROWTH SYSTEM (FIG. 6)
Whether you are implementing Option 1 or Option 2, you will need one film-can growth
system for each group of four students. Four such growth systems are easily accommodat-
ed in one plant lighthouse.
Materials
For the entire project:
1 roll of narrow masking tape
1 can of quick-drying flat-black spray paint
1 4d finishing nail
1 pair of wire cutters
1 piece of wooden dowel ~10 cm long
1 drill with 5/64 and 3/16 drill bits
1 bunsen burner, alcohol burner, or other flame
1 pair of forceps
1 white correction pen or bottle of correction fluid
For each four student groups:
4 2-liter soda bottles
4 half-pound deli containers (Such containers are available at no cost to educators at
many supermarket deli counters.)
4 1 x 36 cm strips of capillary mat (Capillary matting is available from horticultural
supply companies, but often only in very large quantities. Pellon“ from a fabric
store will serve the same purpose; the heaviest available grade of Pellon is recom-
mended.)
4 7.5 cm squares of capillary mat
4 1 x 8 cm strips of capillary mat
Chapter 2 • Modern Genetics for All Students T 155

28 black 35 mm film cans (35 mm
film cans are available in large
quantities at no cost at most film-
processing counters or kiosks.)
12 #64 rubber bands (#64 rubber
bands are often used by mail carri-
ers to bundle mail, and thus are
available at no cost in many
offices.)
20 cm of 9 or 10 mm O.D. Tygon or
clear aquarium tubing
1 single-edge razor blade
Assembly Procedure
1. Nutrient reservoir. Peel the label off
a 2-liter soda bottle after heating it
with hot tap water or air from a hair
dryer. Cut the bottle in two about 13
cm from the bottom. Discard the top
piece and treat the bottom piece
(which will become the nutrient
reservoir) as follows:
Attach a vertical strip of tape to one
side. Spray the outside with several
thin layers of flat black paint until it
is nearly opaque. When the paint is
dry, remove the tape to create an
observation window (Fig. 6.). (The
black paint is to suppress algae
growth in the reservoir.)
2. A nail poke. Remove the head of
the finishing nail with wire cutters.
Drill a 5/64 inch hole in one end of
the dowel. Force the blunt end of the
nail into the hole (Fig. 7).
3. Slotted tray. Heat the nail poke in
a flame and use it to melt two slots
(2 x 12 mm) on opposite sides of the
bottom of a half-pound deli
container.
Chapter 2 • Modern Genetics for All Students T 156
Half-pounddeli container
pdeli container
p
Slotted tray withFilm-can cluste
yFilm-can cluste
yr
Nutrient levelevel
Wiicks
Nutrient leevelviewing winddow
Completed growth systel d h mFigure
gFigure 66
Bottom half of2-liter soda bottle
7.5 cmsquaremat
Slotted trayFigure 8
Film-cancluster
with rubberbbands
Wicks half in and halfout of each film can
Figure 10
Figure 7
Figure 9

Thread a 1 x 36 cm piece of capillary mat through the two slots in the deli container so
that it hangs down about the same distance on each side (Fig. 8). Place a 7.5 cm square
of capillary mat in the bottom of the tray.
Place the slotted tray in the nutrient reservoir.
4. Film can cluster. Cut a 1 x 8 cm strip of capillary mat on a 45¡ angle to produce seven
diamond-shaped wicks about 1 x 2 cm in size (Fig. 9).
Drill a 3/16 inch hole in the bottom of each film can. Using forceps, insert one wick in
the bottom of each film can, leaving about half of each wick protruding.
Cluster seven film cans and secure them with two or three #64 rubber bands. With the
correction pen or brush, number the six outer cans with numerals 1 through 6 (Fig. 10).
The central can will be #7 but need not be marked.
5. Completed growing system. Place the film-can assembly into the slotted tray and place
the slotted tray in the nutrient reservoir.
C. PREPARING THE POTTING MIX
Each film-can growth system requires about 250 ml of potting mix. Thus, for each planting
you need about a liter of mix for every four student groups. Option 1 of the exercise
requires two plantings (for the F1 and F2 generations), or about two liters of potting mix
per four student groups. Option 2, which involves only one planting (the F2 generation),
requires only about one liter of potting mix per four groups.
Measure into a large pail or bucket equal volumes of a peat-based soilless planting formula
(such as Peatlite, RediEarth, or JiffyMix) and medium vermiculite. Mix thoroughly by
hand. Add water to moisten the mixture somewhat but not enough so that it clumps.
D. PREPARING NUTRIENT SOLUTION
You will need about 400 ml of 1/8 X Peter s Professional Fertilizer per film-can growth
system.
Label a 1-liter soda bottle 1 X Peter s Stock Solution. Add one soda-bottle capful of Peter s
fertilizer (right out of the bag) to that bottle, add a liter of tap water and mix. Next, label a
2-liter soda bottle 1/8 X Peter s Nutrient. Add 250 ml of water to the bottle, draw a line at
the meniscus with a marking pen, and label the line 250 ml. Pour out the water and pour in
1 X Peter s Stock Solution up to the 250 ml mark. Add 1750 ml of water. Two liters of 1/8
X Peter s Nutrient is adequate for four student groups, and more can quickly be made from
the 1 X stock, as needed.
E. PREPARING WATER BOTTLES
Water bottles (one per student group) can be made from plastic soda bottles (16, 20, or 24
oz.) that have plastic caps. Heat the nail poke in a flame and melt a small hole in the cap.
Fill the bottle with water, cap it, turn it upside down, and squeeze it to obtain a stream of
water that will not disturb seeds or seedlings.
Chapter 2 • Modern Genetics for All Students T 157

F. PREPARING SPLIT-RING TIES (NEEDED FOR OPTION 1 ONLY)
Use the single-edge razor blade to cut off 3 mm rings from the piece of Tygon tubing (also
called clear aquarium tubing). Then use a pair of scissors to split each ring open, dropping
finished rings into a container as you go.
OPTION 1 PROCEDURE
Detailed procedures are given on student pages S121-133.
Remember to (a) give the students only the Phase 1 instructions at the beginning, (b) have
them plant only the F1 seeds, and (c) refer to these seeds simply as Wisconsin Fast Plant
seeds, because it would be premature to discuss any of the genetic aspects of the experi-
ment at this time.
Seed-planting day for Phase 1 should be on either a Monday or Tuesday, so that the
seedlings can be watered from above on three successive school days. Planting should take
the students about 30 minutes.
Phase 1 Schedule
Well in advance: Construct plant lighthouses and film-can growth systems. If possible,
test the growing system in advance for at least a week by following the student instruc-
tions.
Just in advance: Assemble all growing materials. In order to minimize the amount of
clean-up, keep the potting mix in a single large container in a central location and have the
students fill and level their film cans there. Provide a large spoon, a small spoon, and a
ruler (or other straight edge) next to the potting mix.
Day 1 (on a Monday or Tuesday): Hand out the Phase 1 instructions, the film-can growing
systems, and the F1 seeds. Oversee the planting of the seeds.
Days 2-4: Remind students to water their film cans with their water bottles.
Every day: Have students check the nutrient levels in their reservoirs and add 1/8 X
Peter s as necessary to keep the level up near (but not above) the bottom of the slotted tray.
It is a good idea to add the 1/8 X Peter s to the film can tray and allow it to run through
the slots to the reservoir; this will assure that the capillary matting remains saturated. Make
sure that all reservoirs are full at the end of the day before weekends and holidays.
Days 4-7: Have students transplant some seedlings if necessary and/or remove extra
seedlings, so as to end up with two healthy plants per film can.
Day 11 or 12: Have students assemble bee sticks.
Chapter 2 • Modern Genetics for All Students T 158

Days 13-17: Have students cross-pollinate plants with open flowers on at least three suc-
cessive days.
Days 17-35: Remind students to observe seed pod development at intervals. If time per-
mits, you may want to dissect a few seeds at intervals, so students can view the embryos
developing inside the seeds with a dissection microscope.
Day 35+ (approximately 20 days after last pollination): Have students remove their plants
from the water so that the seed pods can dry out.
Day 38-40+: After the seed pods are thoroughly dry, have students harvest the seeds
according to instructions on the student pages. Supply small envelopes for storing the
seeds.
Phase 2 Schedule
Fast Plant seeds differ from most other seeds by not having any required dormant period
before they will germinate. So after the seeds have been dried, you may begin the second
phase of this experiment any time you wish. It is a good idea to purchase a supply of F2
seeds (from Carolina Biological) just in case some or all of your students did not recover
enough F2 seeds to execute Phase 2 as outlined.
Remember that students did not get Phase 2 instructions initially, so give them to the stu-
dents now.
It is important to begin Phase 2 on a Monday so that students will be able to observe their
germinating seedlings daily for the first week. By the fifth day it should be possible to dis-
tinguish the phenotypes of all F2 plants and record the results. Nevertheless, have students
refill their water reservoirs before leaving for the weekend, so that they can recheck their
results early in the following week.
You need to provide a mechanism for students to give a standardized name to the mutant
phenotypes they will observe. There are at least three ways to do this:
¥ Good: You tell the class that the name for the mutant phenotype seen in the PA
seedlings is anthocyaninless, and that the name for the phenotype seen in the PB
seedlings is yellow-green.
¥ Better: You make color copies of the pictures of Fast Plant mutants in the Carolina
Biological catalog and let the students use these to decide what phenotypes their plants
exhibit. Alternatively, you can make your own Fast Plant photos as follows: When
seedlings are 4 to 5 days old, snip off one seedling of each genotype at ground level.
Use glue stick to attach the seedlings to a sheet of paper. Label each genotype. Quickly
(before the plants wilt) copy the page on a color copier. This works surprisingly well.
Chapter 2 • Modern Genetics for All Students T 159

¥ Best: If you did not grow a complete set of Fast Plant mutants at the beginning of the
genetics section, (as suggested under Hints and Troubleshooting) do so now. Plant all
of your mutant seeds (one type per film can) when the students are planting their F2
seeds and label each type of mutant.
It is a good idea to check that each group can distinguish the anthocyaninless yellow-green
(Anl/Ygr) double mutants from the two kinds of single mutants. This distinction is impor-
tant in determining whether their F2 plants behaved according to the expectations of
Mendelian genetics.
You also need to provide a mechanism for combining and tabulating the class data. A good
way of doing this is to use a strip of butcher paper to prepare enlarged versions of Tables
1.B and 2.B that have columns in which all groups can enter their data, plus a column for
class totals.
OPTION 2 PROCEDURE
Detailed procedures are given on student pages S141-145. Note that the work sheets for
Option 1 Phase 2 are also to be used for Option 2. However, they have not been duplicated
at the end of the Option 2 student pages.
It is important to begin this experiment on a Monday, so that students can to observe their
germinating seedlings daily for the first week. By the fifth day it should be possible to dis-
tinguish the phenotypes of all F2 plants and record the results. Nevertheless, have students
refill their water reservoirs before leaving for the weekend, so that they can recheck their
results early in the following week.
You need to provide a mechanism for students to give a standardized name to the mutant
phenotypes they observe. There are at least three ways to do this:
¥ Good: You tell the class that the name for the mutant phenotype seen in the PA
seedlings is anthocyaninless, and that the name for the phenotype seen in the PB
seedlings is yellow-green.
¥ Better: You make color copies of the pictures of Fast Plant mutants in the Carolina
Biological catalog and let the students use these to decide what phenotypes their plants
exhibit. Alternatively, you can make your own Fast Plant photos as follows: When
seedlings are 4 to 5 days old, snip off one seedling of each genotype at ground level.
Use glue stick to attach the seedlings to a sheet of paper. Label each genotype. Quickly
(before the plants wilt) copy the page on a color copier. This works surprisingly well.
¥ Best: If you did not grow a complete set of Fast Plant mutants at the beginning of the
genetics section, (as suggested under Hints and Troubleshooting) do so now. Plant all
of your mutant seeds (one type per film can) when the students are planting their F2
seeds and label each type of mutant.
Chapter 2 • Modern Genetics for All Students T 160

It is a good idea to check that each group can distinguish the anthocyaninless yellow-green
(Anl/Ygr) double mutants from the two kinds of single mutants. This distinction is impor-
tant in determining whether their F2 plants behaved according to the expectations of
Mendelian genetics.
You also need to provide a mechanism for combining and tabulating the class data. A good
way of doing this is to use a strip of butcher paper to prepare enlarged versions of Tables
1.B and 2.B that have columns in which all groups can enter their data, plus a column for
class totals.
HINTS AND TROUBLESHOOTING (BOTH OPTIONS)
1. The Wisconsin Fast Plants can help you dramatize the concept of heritable variation in
visible traits at the very beginning of the genetics unit.
If you have space available in a plant lighthouse two weeks before you begin the
genetics unit, consider setting up a growth system with a different variant in each film
can. If you are doing Option 1, your students Fast Plants should be nearly mature (and
wild-type in phenotype) by that time. Thus, they should be able to recognize the vari-
ous phenotypic differences quickly and easily. This would be a good time to let them in
on the big secret: namely, that even though all of the plants they have been growing
appear to be normal (wild-type), they are actually carrying invisible versions of two
of the mutant traits visible in your seedlings. (But even Option 2 students should be
able to see the visible differences among these plants and become intrigued by their
heritable basis.)
In short, you can use the Fast Plants at the beginning of the genetics section to stimu-
late student interest in understanding how visible traits are controlled, hidden from
view in one generation, and then caused to reappear in another generation.
If you decide to go this route, you should already have seeds of four distinctive geno-
types to plant in four of the film cans: namely, the PA (Anl), PB (Ygr), F1(wild-type)
and the double mutant seeds (Anl/Ygr). Additional mutant seeds you should consider
purchasing for use in the other three film cans include rosette (Cat. # BA-15-8815),
elongated internode (Cat. # BA-15-8824) and AstroPlants (Cat. # BA-15-8835).
If you cannot grow a complete set of demonstration mutants before the beginning of
the genetics section, consider doing so when the students are starting Phase 2 (or
Option 2) of the exercise.
2. On the page where the construction of a plant lighthouse was introduced, it was noted
that if you already have a six-tube fluorescent light bank (such as Carolina Biological
Cat. # BA-15-8998) you may grow the Fast Plants under it, even though its light out-
put is on the marginal side. (A four-tube bank of this sort does not provide adequate
light, however, and should NOT be used.) Growth under a six-tube bank is improved if
(a) the fluorescent tubes are replaced every two years, (b) aluminum foil curtains
Chapter 2 • Modern Genetics for All Students T 161
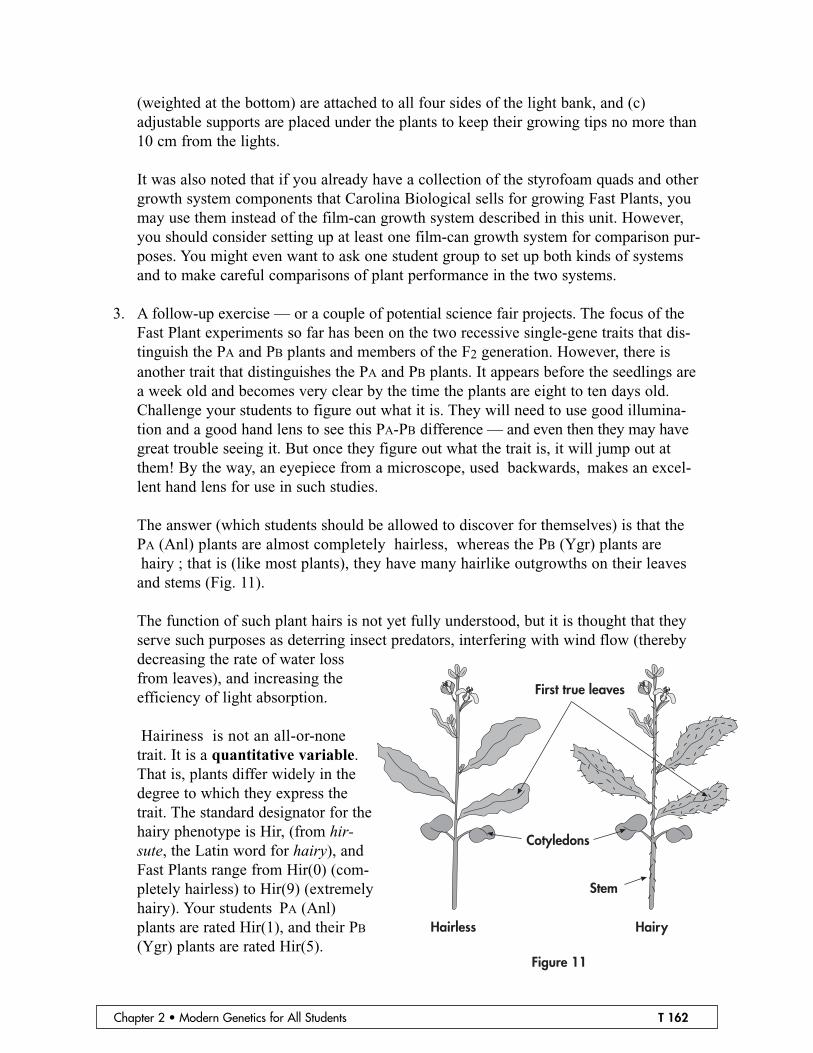
(weighted at the bottom) are attached to all four sides of the light bank, and (c)
adjustable supports are placed under the plants to keep their growing tips no more than
10 cm from the lights.
It was also noted that if you already have a collection of the styrofoam quads and other
growth system components that Carolina Biological sells for growing Fast Plants, you
may use them instead of the film-can growth system described in this unit. However,
you should consider setting up at least one film-can growth system for comparison pur-
poses. You might even want to ask one student group to set up both kinds of systems
and to make careful comparisons of plant performance in the two systems.
3. A follow-up exercise — or a couple of potential science fair projects. The focus of the
Fast Plant experiments so far has been on the two recessive single-gene traits that dis-
tinguish the PA and PB plants and members of the F2 generation. However, there is
another trait that distinguishes the PA and PB plants. It appears before the seedlings are
a week old and becomes very clear by the time the plants are eight to ten days old.
Challenge your students to figure out what it is. They will need to use good illumina-
tion and a good hand lens to see this PA-PB difference — and even then they may have
great trouble seeing it. But once they figure out what the trait is, it will jump out at
them! By the way, an eyepiece from a microscope, used backwards, makes an excel-
lent hand lens for use in such studies.
The answer (which students should be allowed to discover for themselves) is that the
PA (Anl) plants are almost completely hairless, whereas the PB (Ygr) plants are
hairy ; that is (like most plants), they have many hairlike outgrowths on their leaves
and stems (Fig. 11).
The function of such plant hairs is not yet fully understood, but it is thought that they
serve such purposes as deterring insect predators, interfering with wind flow (thereby
decreasing the rate of water loss
from leaves), and increasing the
efficiency of light absorption.
Hairiness is not an all-or-none
trait. It is a quantitative variable.
That is, plants differ widely in the
degree to which they express the
trait. The standard designator for the
hairy phenotype is Hir, (from hir-sute, the Latin word for hairy), and
Fast Plants range from Hir(0) (com-
pletely hairless) to Hir(9) (extremely
hairy). Your students PA (Anl)
plants are rated Hir(1), and their PB
(Ygr) plants are rated Hir(5).
Chapter 2 • Modern Genetics for All Students T 162
Hairless Hairy
First true leaves
Cotyledons
Stem
Figure 11

Below are a few of the simpler questions that you might pose to your students, and
some sample answers that they should come up with if they merely observe their plants
carefully.
Q: Does the hairy trait disappear in the F1 generation like the Anl and Ygr traits do?
A: No. The F1 plants are somewhere in between the two parental types in hairiness.
Q: What does this say about the heritable basis of the hairy trait?
A: It appears to be a heritable trait that exhibits co-dominance, or incomplete dominance.
Q: How does the hairiness of the F1 plants compare with the hairiness of the F2 plants?
A: The F2 plants are much more variable in their hairiness than the F1 plants.
Q: Does hairiness cosegregate with Ygr in the F2 generation? (That is to say, are the Ygr
plants routinely hairier than the Anl plants in the F2 generation, as they are in the
parental generation?)
A: No. The hairy and yellow-green traits appear to be inherited independently.
Q: Do the F2 plants fall into only three classes that resemble the PA, PB, and F1 plants
with respect to number of hairs?
A: No. The F2 plants are much more variable in hairiness than that.
Q: What does this imply about the heritable basis of the hairy trait?
A: Hairiness probably is controlled by genes at more than one hairy locus. (If the PA and
PB plants differed by only one allele at one locus, then the F2 plants should fall into
three distinct classes representing the heterozygote and the two homozygotes; but care-
ful inspection will reveal that they do not.)
Q: How can you rule out the possibility that the variation you see in the F2 plants is
caused by environmental variables that you were not aware of and could not control?
A: The PA, PB, and F1 plants provide controls that appear to rule out that possibility,
because they all exhibit much less variability in hairiness than the F2 plants do. If there
were uncontrolled environmental variables, there is no reason that they should affect
only the F2 plants.
Chapter 2 • Modern Genetics for All Students T 163

Below are some questions of a quantitative nature that you might pose to your students. Toanswer these questions, students would have to count hairs and perform various statisticaltests.
Q: Are the number of hairs on one part of a hairy plant (such as the edge of the first true
leaf) correlated with the number of hairs on another part (such as the surface of that
leaf or the edge of the second leaf)?
A: Yes. But obtaining this answer probably would be a highly instructive statistical-analy-
sis exercise. something with which the math teacher might help.
Q: How much variation is there in the number of hairs on equivalent structures (such as
the first true leaves) in a group of plants that are presumably similar genetically (such
as the PB plants)?
A: There is no single or simple answer to this question, but it could lead a motivated stu-
dent into an extended study of natural variability and the way that such variability is
evaluated statistically.
There are other interesting questions that you might pose to your students. These questions
could be answered only by performing additional crosses between their various plants
and/or growing additional plants of known genotype under different conditions. Some of
these questions could be used for great science fair projects. Just a couple of examples:
Q: How would you perform a scientific test of your hypothesis (mentioned above) that the
hairy trait is controlled by genes at more than one locus?
A: The best way to test this hypothesis would be to separate out the F2 plants with the
least hairs and the most hairs, cross-pollinate each kind with another plant of the same
type, and see how hairy their F3 offspring turn out to be. If the parental plants differ
with respect to only one locus that influences hairiness, then both sets of F3 plants
should have the same range of hairiness as the F2 generation did. But if there are multi-
ple hairy genes, then the very hairy F2 plants should produce very hairy F3 offspring,
and vice versa. Repeating this kind of selective breeding for another generation or two
could provide a great study of the effect of selection on plant evolution.
Q: How could you test the hypothesis that the number of hairs produced by a plant is con-
trolled by both its genotype and the environment to which it is exposed during devel-
opment?
A: The best way to test this hypothesis would be to grow plants of two different but fairly
uniform genotypes (such as the PB and F1 plants) under a range of environmental con-
ditions and see how these conditions affect the number of hairs produced.
Environmental factors to be tested might include such things as light intensity, or light
color, and the concentration of fertilizer and/or salt in the nutrient reservoir.
Chapter 2 • Modern Genetics for All Students T 164

ANSWERS TO THE QUESTIONS ON THE WISCONSIN FAST PLANTS WORKSHEET STUDENT PAGES 137-140
1. What are the two mutant traits that distinguished your PA and PB plants from one
another and from wild-type Wisconsin Fast Plants?
The PA plants are anthocyaninless mutants.The PB plants are yellow-green mutants.
2. If the mutant traits exhibited by the PA and PB generation are heritable, why didn t
those two traits appear in their progeny in the F1 generation?
They are both recessive traits that are not expressed in the heterozygous F1 plants.
3. Based on your explanation above, what would you predict that the ratio of wild-type to
mutant individuals for each of these two traits in the F2 generation? Explain.
3:1 The probability that an individual will receive a recessive allele from each of itsheterozygous parents is one in four. Thus, 1/4 of the offspring should have the recessivephenotype.
4. Above each of the tables below, record how many F2 plants germinated and grew large
enough that their phenotypes could be determined with confidence. Then in the right
hand column of each table record how many of these F2 plants had each of the indicat-
ed phenotypes.
All groups should have different data in Table 1.A, but the same data in Table 1.B.
5-7. With respect to the PA trait, how does the ratio of wild-type to mutant individuals
that you predicted in Question 3 compare to the ratios of wild-type to mutant individu-
als that you reported in tables 1 A and B?
The predicted wild-type-to-mutant ratio was (in each case) 3:1
All groups should have different ratios for their own plants, but the same ratio for theclass plants.
It should be very interesting to see how your students decide what constitutes a signifi-cant difference between predicted and observed ratios, and how much confidence theyhave in their ability to make such judgments.
This should provide you with an excellent opportunity to discuss the role of statisticalanalysis (as opposed to gut feelings) in making such decisions with respect to scientificobservations.
8. Record the observed phenotypes of the F2 plants with respect to combinations of PA
and PB traits.
Again, all groups should have different data for their own plants, but identical data forthe class.
Chapter 2 • Modern Genetics for All Students T 165

9. In the table below, compare the ratios of the four possible combinations of PA and PB
traits that you and your class observed with the ratios that are predicted for this kind of
dihybrid cross. In each case, set the number of double-mutant plants to one.
The predicted ratio is 9:3:3:1, but all groups should have different ratios for their owndata and identical ratios for the whole class.
10-11. Are the differences between the predicted and the observed ratios in the above table
significant?
Again, it should be very interesting to see how your students decide what constitutes asignificant difference between predicted and observed ratios, and how much confidencethey have in their ability to make such judgments.
If, for some reason, you have decided not to make unit 2.E a class assignment, encour-age your students to study it voluntarily, to find out about one widely used method ofdeciding whether differences between predicted and observed experimental results aresignificant.
REFERENCES
1. Catch the Spiral: Cycle Through Life With Fast Plants (2000). (ISBN 0-7872-6910-7)
Kendall/Hunt Publishing Company, Dubuque, Iowa. Tel. 800-228-0810; Fax 800-772-
9165; www.kendallhunt.com 25 explorations in plant biology. Developed by Dr.. Paul
H. Williams and other members of the Wisconsin Fast Plants Program, College of
Agriculture and Life Sciences, University of Wisconsin-Madison.
2. CrGC Information Catalogue(1997). Crucifer Genetics Cooperative, University of
Wisconsin-Madison, Madison Wis. Tel. 608-263-2634; Fax 608-263-2626; www.fast-
plants.cals.wisc.edu/crgc/crgc.html This catalog and information brochure from the
Crucifer Genetics Cooperative (which is closely associated with the Wisconsin Fast
Plants Program) lists seeds for a much wider variety of B. rapa mutants, as well as
several other species of crucifers.
3. Wisconsin Fast Plants Poster. Carolina Biological. Tel. 800-227-1150;
www.carolina.com This colorful 24 x 36 poster illustrates the rapid development and
complete life cycle of the Fast Plants.
ACKNOWLEDGMENTS
We gratefully acknowledge the assistance of the Wisconsin Fast Plants Program in prepar-
ing this exercise. The illustrations in this exercise were adapted, with permission, from
ones used by the Wisconsin Fast Plants Program in teacher workshops.
Chapter 2 • Modern Genetics for All Students T 166
Chapter 2 • Modern Genetics for All Students T 167
7
232
50%
20%
+=
6.89
4#x14
CHAPTER 2
Passing Traits fromOne Generation to the Next
SECTION E
How AreGeneticResultsEvaluatedStatistically?

Chapter 2: Section E BackgroundMANY BIOLOGY STUDENTS (and not a few biology teachers!) suffer “math insecuri-ty.” Many of them probably would just as soon go through life not thinking about anymathematical issues more complicated than counting their change at the pizza parlor.However, being able to make quantitative judgments, in addition to qualitative ones, is animportant part of being a scientifically literate, responsible citizen. Obviously, you cannotbe expected to completely counteract the math insecurities of all of your students and turnthem all into enthusiastic statistical whiz kids while teaching them genetics. But you canconceivably help lower the barriers to thinking quantitatively outside of the math class-room, if you approach this exercise as a fun and easy way – rather than a painful but nec-essary way – to determine whether all the time and effort that they put into the Fast Plantsexperiment yielded results consistent with Mendel’s “laws” of heredity!
Chapter 2 • Modern Genetics for All Students T 168

Introduction to Using Statistics to Evaluate Genetic ExplanationsSTUDENT PAGES 148-149
LESSON OVERVIEW
This lesson is a reading assignment to prepare your students to work with the conceptsbehind a Chi square analysis. It introduces them to the problem of evaluating geneticresults statistically with a “real life” situation that they should have no problem identifyingwith.
Too Many White Kittens? Using Chi Square (χ2) to Find OutSTUDENT PAGES 150-151
LESSON OVERVIEW
This is a guided practice activity on working with the Chi square analysis formula. The students will learn the concepts behind each step of the Chi square process in a non-threatening exercise.
TIMELINE
It will take an average student about 15 minutes to read sections E.1 and E.2 carefullyenough to understand the concepts involved.
Chapter 2 • Modern Genetics for All Students T 169
2 32+=4
#E.1
2 32+=4
#E.2

How to Perform a Chi-SquareTest on Any Data Set STUDENT PAGES 152-155
LESSON OVERVIEW
This is a guided practice activity on working with the Chi square analysis formula. The stu-dents will learn the concepts behind each step of the Chi square process.
TIMELINE
Assuming that the Fast Plant data for the class have already been tabulated and madeavailable, calculation of the χ2 and p values should not require more than 15-20 minutes.
ANSWERS TO THE QUESTIONS ON THE WISCONSIN FAST PLANTS™ CHISQUARE WORKSHEET
There will be two sets of correct answers for the first Chi square analysis, but all studentsshould get the same result for the second Chi square analysis. If you are going to have thestudents perform the analyses in class, it would be a good idea to work out the correctanswers for yourself in advance, once you have the class data. Blanks are left below forthis purpose.
Part One, A Simple Trial Run
The mutant trait I am analyzing by Chi square is anthocyaninless
Total number of F2 plants obtained by the class: _________.Multiply the total number of F2 plants by the expected frequencies (3/4 and 1/4) to get theexpected numbers of plants in each category. You probably will get non-integral numbers.
χ2 = (Observed - Expected)2 summed for all classes
Expected(Remember: “classes” here refers to classes of plant phenotypes, not classes of students!)
χ2: ________ p____________ Use the table on page S143 to determine the value of p.
Chapter 2 • Modern Genetics for All Students T 170
2 32+=4
#E.3
Phenotype Expected # Observed # Difference Difference2
Wild-type
Mutant

The mutant trait I am analyzing by Chi square is yellow-green
Total number of F2 plants obtained by the class: _________.
Again multiple the total number of F2 plants by the expected frequencies to get the expect-ed numbers of plants in each category. You may get non-integral numbers.
χ2 = (Observed - Expected)2 summed for all classes
Expected
χ2: ________ p____________
Conclusion: Presumably both Chi square analyses in part one will indicate that the dataare consistent with the hypothesis that the mutant trait in question is due to a recessiveallele at a single locus (which we know on the basis of prior studies is the case for bothtraits). If your advance analysis indicates that one or both of the Chi square analyses donot lead to this conclusion, you will need to be prepared to lead a discussion of alternativehypotheses. (One of which might be that certain groups failed to classify certain of theirplants correctly!)
Chapter 2 • Modern Genetics for All Students T 171
Phenotype Expected # Observed # Difference Difference2
Wild-type
Mutant

Part Two, Chi Square Analysis of the Two Phenotypes at Once
COMBINED DATA FOR THE ENTIRE CLASS TOTAL NUMBER OF F2 PLANTS: ______
*You can obtain these frequencies by either (a) using the product-of-probabilities method,(b) using a Punnett Square, or (c) reviewing similar calculations you made for previousexercises.
χ2: ________ p____________
Conclusion: Presumably the Chi square analysis here will indicate that the data are con-sistent with the hypothesis that the ‘a’ and ‘b’ loci assort independently. Once again, ifyour advance Chi square analysis does not lead to this conclusion, you will need to be pre-pared to lead a discussion of alternative hypotheses. (One of which might be, once againthat certain groups failed to classify certain of their plants correctly!)
Chapter 2 • Modern Genetics for All Students T 172
Frequency Number Number 'a' phenotype 'b' phenotype expected* expected observed Difference Difference2
Wild-type Wild-type
Mutant (aa) Wild-type
Wild-type Mutant (bb)
Mutant (aa) Mutant (bb)