passion for angola. - bni · passion for angola. to realise, develop and participate in angola’s...
TRANSCRIPT
PASSION FOR ANGOLA.To realise, develop and participate in Angola’s growth. This is where we apply our passion. To always do better. A commitment capable of making a difference to the realisation of our country’s dreams and ambitions, to the outcome of family projects and to overcoming the challenges faced by businesses.
For BNI, growing means growing with Angola, always.

03
CONTENTS
We Build the Future with You.| Message from the Chairman 06| Main Indicators 10| Banco de Negócios Internacional 12| Organic Structure 16| Corporate Management Model 18
The Value of Relationships.| Historical Milestones 22| Geographic Presence and Network of Branches 26| Campaigns 28| Sponsorships 32
We Grow with Angola.| Human Resources 36| BNI Growth Project 40| Business Support Areas – Synopsis 44
Passion for Business.| Business Developments 58| Business Areas 60| Distribution Channels 64| BNI Customer Breakdown 68
Commitment to People.| Risk Management 72| Regulatory Framework 80| Economic and Financial Environment 84
Soundness of Results.| Financial Review 96| Financial Statements 108| Opinion of the Auditor 174| Opinion of the Board of Auditors 176

WE BUILD THE FUTURE WITH YOU| Message from the Chairman
| Main Indicators
| Banco de Negócios Internacional
| Organic Structure
| Corporate Management Model
REP
OR
T A
ND
AC
CO
UN
TS
2014
| M
ESS
AG
E F
RO
M T
HE
CH
AIR
MA
N
06 07
ECONOMIC ENVIRONMENT
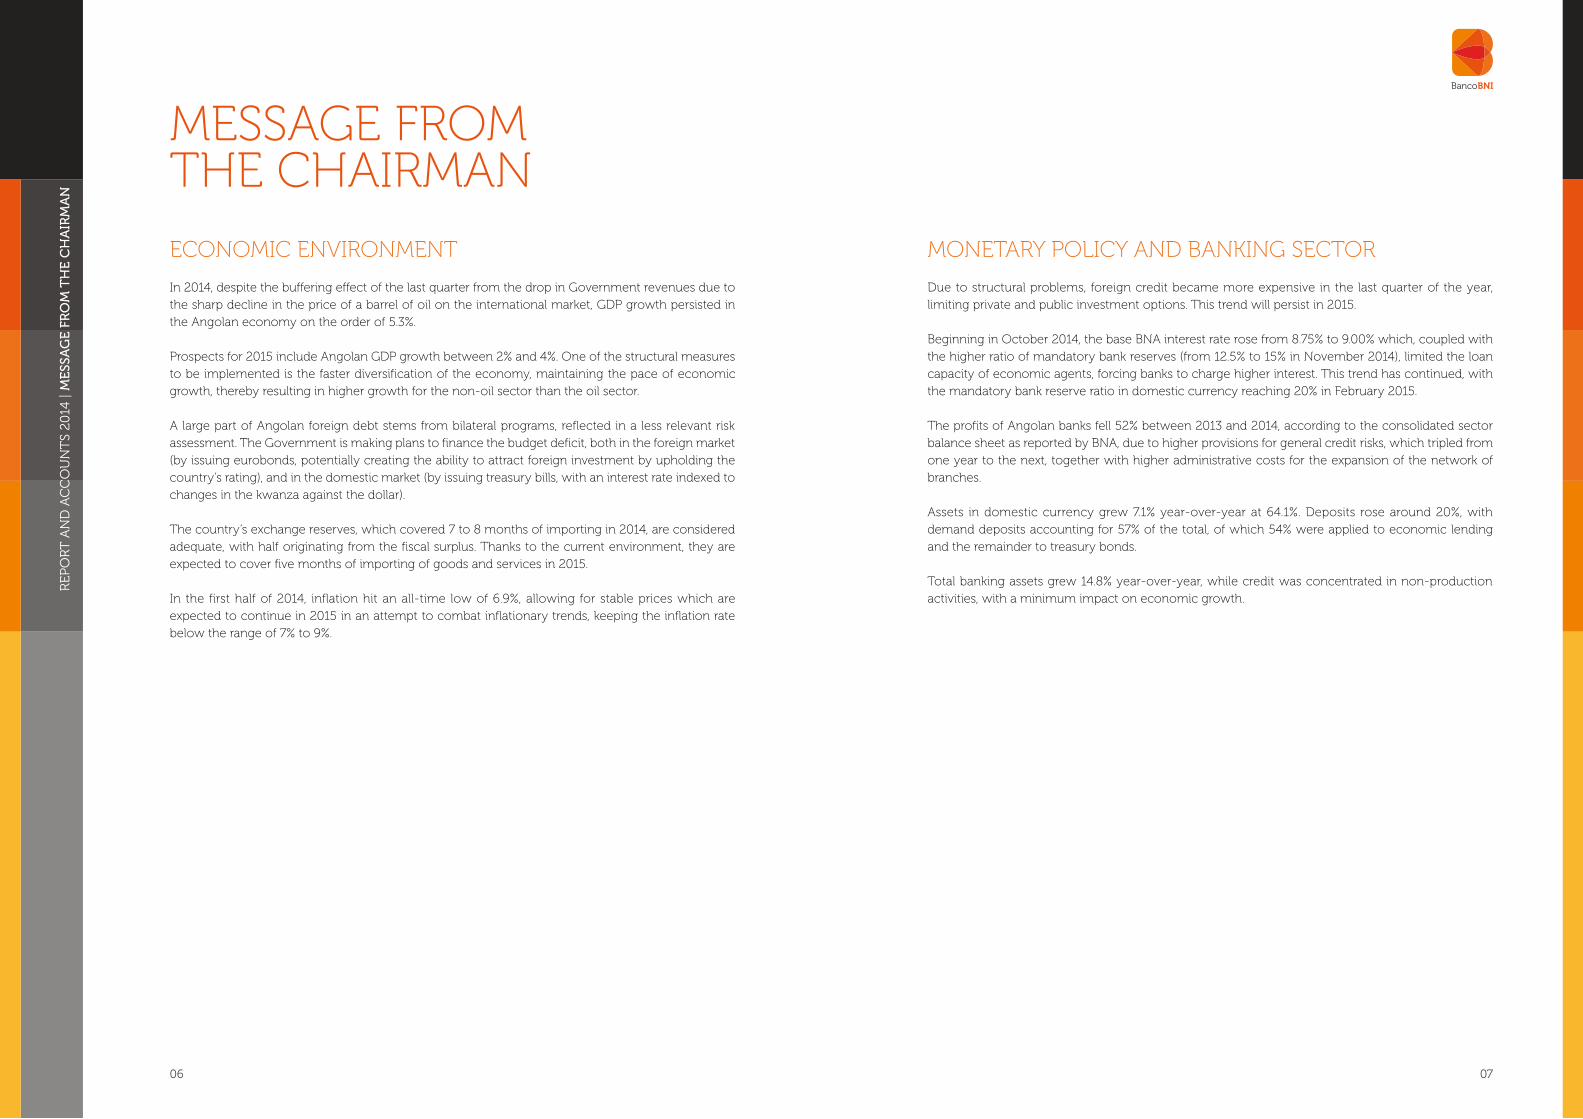
In 2014, despite the buffering effect of the last quarter from the drop in Government revenues due to the sharp decline in the price of a barrel of oil on the international market, GDP growth persisted in the Angolan economy on the order of 5.3%.
Prospects for 2015 include Angolan GDP growth between 2% and 4%. One of the structural measures to be implemented is the faster diversification of the economy, maintaining the pace of economic growth, thereby resulting in higher growth for the non-oil sector than the oil sector.
A large part of Angolan foreign debt stems from bilateral programs, reflected in a less relevant risk assessment. The Government is making plans to finance the budget deficit, both in the foreign market (by issuing eurobonds, potentially creating the ability to attract foreign investment by upholding the country’s rating), and in the domestic market (by issuing treasury bills, with an interest rate indexed to changes in the kwanza against the dollar).
The country’s exchange reserves, which covered 7 to 8 months of importing in 2014, are considered adequate, with half originating from the fiscal surplus. Thanks to the current environment, they are expected to cover five months of importing of goods and services in 2015.
In the first half of 2014, inflation hit an all-time low of 6.9%, allowing for stable prices which are expected to continue in 2015 in an attempt to combat inflationary trends, keeping the inflation rate below the range of 7% to 9%.
MONETARY POLICY AND BANKING SECTOR
Due to structural problems, foreign credit became more expensive in the last quarter of the year, limiting private and public investment options. This trend will persist in 2015.
Beginning in October 2014, the base BNA interest rate rose from 8.75% to 9.00% which, coupled with the higher ratio of mandatory bank reserves (from 12.5% to 15% in November 2014), limited the loan capacity of economic agents, forcing banks to charge higher interest. This trend has continued, with the mandatory bank reserve ratio in domestic currency reaching 20% in February 2015.
The profits of Angolan banks fell 52% between 2013 and 2014, according to the consolidated sector balance sheet as reported by BNA, due to higher provisions for general credit risks, which tripled from one year to the next, together with higher administrative costs for the expansion of the network of branches.
Assets in domestic currency grew 7.1% year-over-year at 64.1%. Deposits rose around 20%, with demand deposits accounting for 57% of the total, of which 54% were applied to economic lending and the remainder to treasury bonds.
Total banking assets grew 14.8% year-over-year, while credit was concentrated in non-production activities, with a minimum impact on economic growth.
MESSAGE FROM THE CHAIRMAN

REP
OR
T A
ND
AC
CO
UN
TS
2014
| M
ESS
AG
E F
RO
M T
HE
CH
AIR
MA
N
08 09
As regards the capital market, with the establishment of the the Angola Debt and Securities Exchange (BODIVA), BNI hopes to become an operator, given BODIVA’s potential future importance as an alternative source of economic financing.
Activation, with IFC, of the first line of credit of USD 25 million under the Global Trade Finance Program (BNI is the first Angolan financial institution to obtain this facility).
The medium and long-term credit limit for export credit financing with Commerzbank was increased to €70 million, aimed at financing several industrial projects in the country (this is the first instance of a private Angolan bank using this type of credit facility).
Finally, I wish to thank our Customers for their preference, our shareholders for supporting us in this journey, my colleagues on the Board of Directors and all of the bank’s Employees for their dedication and commitment to this undertaking.
Mário Abílio P. M. PalharesChairman of the Board of Directors
BANCO BNI
BNI ended 2014 with total assets of USD 1,964,683 thousand, up 4.13% compared to 2013.
Customer deposits totalled USD 1,510,204 thousand, with regulatory equity at USD 188,200 thousand and a solvency ratio of 11%.
The 2014 result before taxes was USD 14,087 thousand, a year-over-year decline in line with events in the sector, due to the need for higher provisions for general credit risk and higher administrative costs. It should also be noted that the year was marked by lower growth in the credit portfolio due to the economic environment and a prudent approach, bearing in mind the prospects for 2015.
We continued our internal restructuring strategy in 2014, focusing on ongoing Employee training (135 new admissions), adapting organic structures and internal processes to the new Internal Control System for Financial Institutions handed down by BNA, and continuing the strategy of cost reduction and implementing programs for information security and business continuity and recovery.
The credit and operations workflow platform was deployed in a wide range of areas, from origination to granting and recovery.
BNI is present in 14 provinces, with 8 new branches opened in 2014 for a total of 85 (including business centres, branches and outlets) in our commercial network. According to a survey by KPMG, BNI was considered the second best bank in the country in terms of service quality and Customer satisfaction.
We continued to play a part in Angolan Government programs to promote the domestic economy, such as Angola Investe and Bankita.
To encourage loyalty and offer additional products and services to our Customers, BNI Europa went into business, obtaining authorization to establish an insurance firm, whose launch is scheduled for 2015. From a regulatory standpoint, work began to adopt internal business sustainability standards and lay the groundwork for IAS/IFRS accounting standards, whose implementation will have transitional impacts between 01 January and 31 August 2015.
REP
OR
T A
ND
AC
CO
UN
TS
2014
| M
AIN
IN
DIC
AT
OR
S
10
MAIN INDICATORS
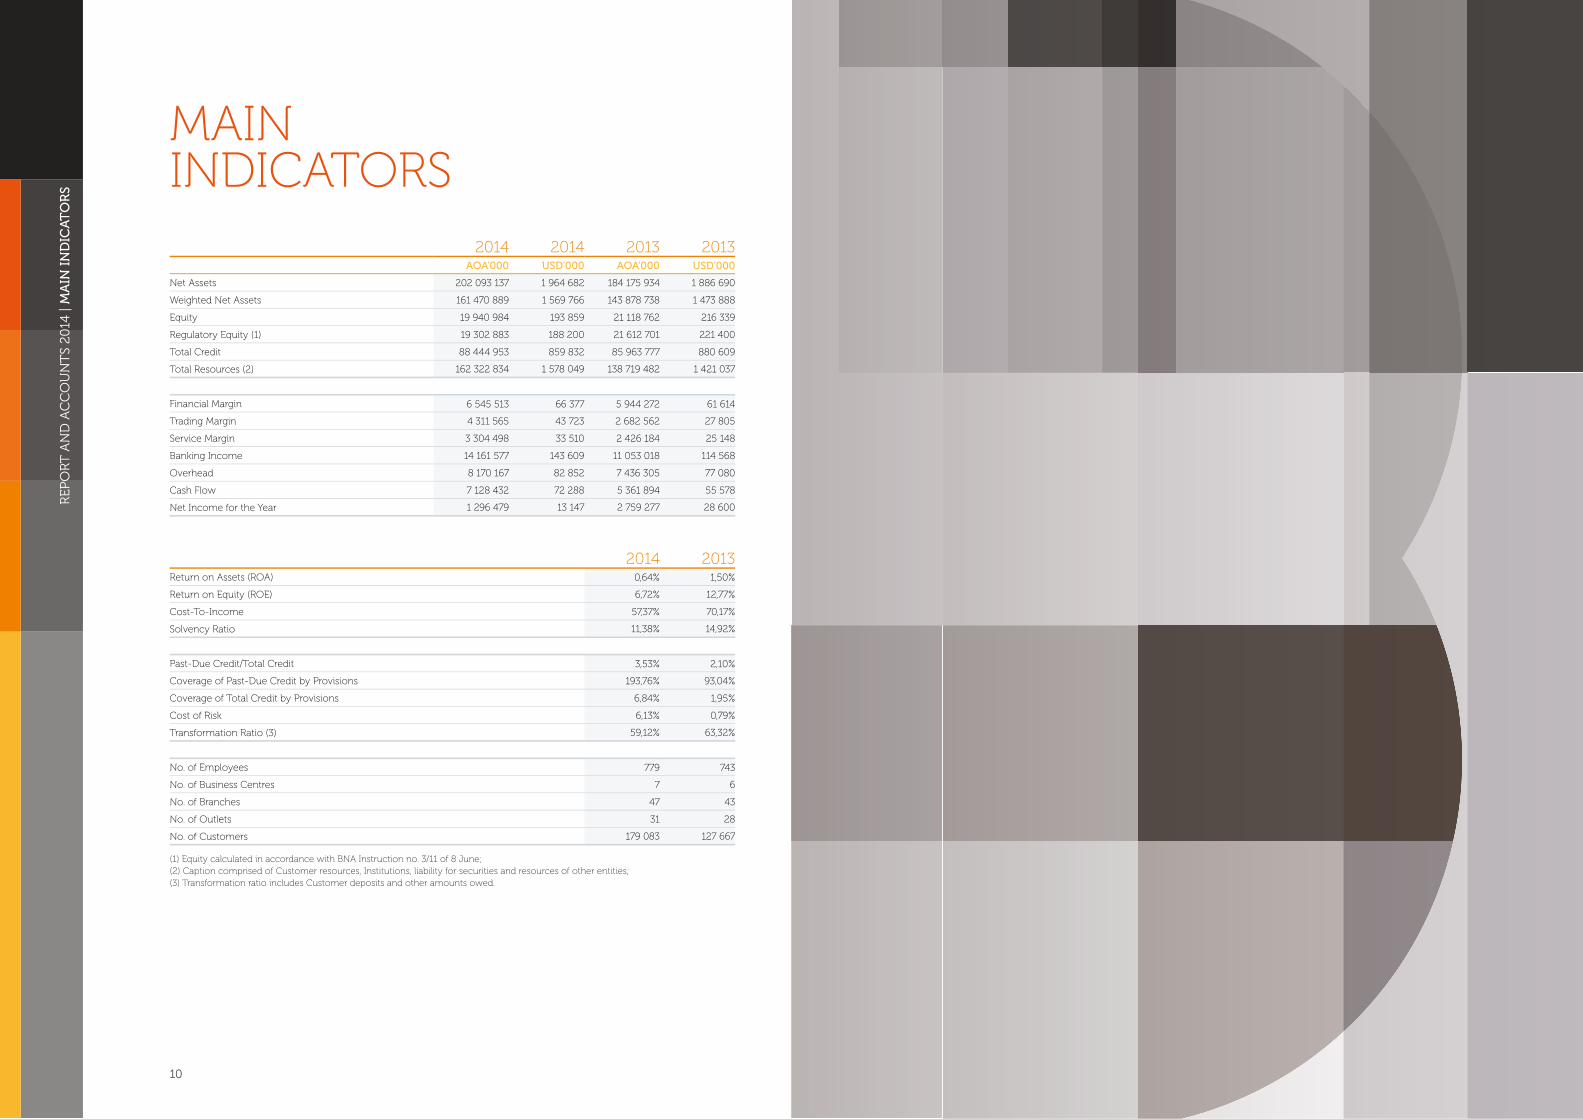
2014 2014 2013 2013AOA’000 USD’000 AOA’000 USD’000
Net Assets 202 093 137 1 964 682 184 175 934 1 886 690
Weighted Net Assets 161 470 889 1 569 766 143 878 738 1 473 888
Equity 19 940 984 193 859 21 118 762 216 339
Regulatory Equity (1) 19 302 883 188 200 21 612 701 221 400
Total Credit 88 444 953 859 832 85 963 777 880 609
Total Resources (2) 162 322 834 1 578 049 138 719 482 1 421 037
Financial Margin 6 545 513 66 377 5 944 272 61 614
Trading Margin 4 311 565 43 723 2 682 562 27 805
Service Margin 3 304 498 33 510 2 426 184 25 148
Banking Income 14 161 577 143 609 11 053 018 114 568
Overhead 8 170 167 82 852 7 436 305 77 080
Cash Flow 7 128 432 72 288 5 361 894 55 578
Net Income for the Year 1 296 479 13 147 2 759 277 28 600
2014 2013Return on Assets (ROA) 0,64% 1,50%
Return on Equity (ROE) 6,72% 12,77%
Cost-To-Income 57,37% 70,17%
Solvency Ratio 11,38% 14,92%
Past-Due Credit/Total Credit 3,53% 2,10%
Coverage of Past-Due Credit by Provisions 193,76% 93,04%
Coverage of Total Credit by Provisions 6,84% 1,95%
Cost of Risk 6,13% 0,79%
Transformation Ratio (3) 59,12% 63,32%
No. of Employees 779 743
No. of Business Centres 7 6
No. of Branches 47 43
No. of Outlets 31 28
No. of Customers 179 083 127 667
(1) Equity calculated in accordance with BNA Instruction no. 3/11 of 8 June; (2) Caption comprised of Customer resources, Institutions, liability for securities and resources of other entities; (3) Transformation ratio includes Customer deposits and other amounts owed.

REP
OR
T A
ND
AC
CO
UN
TS
2014
| B
AN
CO
DE
NE
GÓ
CIO
S IN
TE
RN
AC
ION
AL
12
BANCO DE NEGÓCIOSINTERNACIONAL
Presiding Board of the General Meeting of Shareholders
ChairmanJoão de Matos
Vice-ChairmanMário Dias
Board of Auditors
ChairmanLuis Manuel Neves
MemberLicínio de Assis
MemberDina Maria Leote de Oliveira
Board of Directors
ChairmanMário A. Palhares
Vice-ChairmanJosé Boyol
DirectorSandro Africano
DirectorLara Boyol
DirectorPedro Palhares
DirectorBruno Inglês
Auditors
KPMG - Auditores e Consultores, SARL
GOVERNING BODIES

REP
OR
T A
ND
AC
CO
UN
TS
2014
| B
AN
CO
DE
NE
GÓ
CIO
S IN
TE
RN
AC
ION
AL
14 15
Social Responsibility
A passion for people elevates BNI’s sense of social responsibility, which is why we ensure, respect and do everything we can to make society a better place. In 2014, the following institutions were supported:
•“Kuzola” children’s home – BNI sponsored this Institution by donating school materials to its students;•Lwini Foundation – donations were made to the foundation’s “Hydrocephalus Response” project;•Portuguese Cooperative for Angolan Education – travel assistance for students from the Portuguese
school, for social purposes, and cooperation in the purchase of two educational support buses of the same Institution;
•Mandume Ya Ndemuafayo University – support for this Institution’s second science conference, an event disseminating knowledge on renewable energies, the environment and tourism;
•Union of Portuguese-Speaking Capitals (UCCLA) – BNI supported the tribute ceremony to the ex-associates of the “Casa de Estudantes do Império” common home;
MISSION, STRATEGY, VALUES AND SOCIAL RESPONSIBILITY
BNI’s Mission
We are a leading bank in Angola. We have a profound knowledge of the financial sector and the markets in which we operate. We create value for our Customers, partners, shareholders and Employees through our range of innovative products and services, adhering to high standards of conduct and to the corporate principles of transparency and rigour.
BNI’s Vision
BNI aspires to be a model of financial sustainability, operational efficiency and image in the national and international marketplace.
We endeavour to contribute to the success of our Customers’, shareholders’ and Employees’ initiatives, offering innovative and competitive solutions.
We seek to expand our involvement into new business segments, forging sound partnerships.
BNI’s Values
Focus on the Customer – We create products centred on our Customers’ needs, demonstrating a total commitment to exceeding their expectations so as to guarantee their satisfaction and loyalty.
Trust – Our Customers are our most important asset. We forge relationships for the future based on trust, on business sustainability, on confidentiality and transparency.
Rigour – We act with ethics, conscience, responsibility and professionalism.
Innovation – We are geared to innovation, striving to create new tools, methodologies, products and services, which place us at the forefront of the Angolan and international financial market.
Teamwork – We respect people. We share the responsibility of improving our performance in order to attain the defined goals, for the success of all.

REP
OR
T A
ND
AC
CO
UN
TS
2014
| O
rg
AN
IC S
tr
UC
tU
re
16
ORGANIC STRUCTURe
external Audit
Chair of the Board
Board of directors
Vice-Chair of the Board
executive director
executive director
executive director
executive director
executive Secretary to the AdM
Information Systems division
Legal division
Compliance Office
Commercial division (networks)
Corporate Banking division
Credit Analysis and recovery division
Accounts division
Assets and Logistics division
electronic Banking division
Organisational development division
Operations division
Specialised Oversight division
Consultants
training and Career development division
Planning and Control division
Marketing and Communication division
human resources division
Corporate Finance Office
Advisory Structures
Internal Audit division
Finance and International division
Private Banking division
risk division
Oil & gas
Company Secretary
Client Ombudsman
Institutional relations
Credit Committee
ALCO Committee
technology Committee
Internal Control, risk and Compliance Committee
Operations Committee
Strategy Committee

REP
OR
T A
ND
AC
CO
UN
TS
2014
| C
OR
PO
RA
TE
MA
NA
GE
ME
NT
MO
DE
L
18 19
BNI’s governance model complies with and meets the requirements laid down in the Financial Institutions Act (Law no.13/05 of September).The governing bodies are made up of the General Meeting of Shareholders, the Board of Directors, the General Board and the Board of Auditors.The members of the governing bodies are elected by the General Meeting of Shareholders for a term of 4 years, with re-election being possible. BNI’s structure is composed of: the General Meeting of Shareholders; the Board of Directors; the Board of Auditors; the General Board; the Advisors; the Executive Secretariat and 24 Departments, as well as the existence of 6 committees (Credit Committee, ALCO Committee, Technology Committee, Risk and Compliance Internal Control Committee, Operations Committee and Strategic Committee).
GENERAL MEETING OF SHAREHOLDERS
BNI’s General Meeting of Shareholders is composed of all the individual or corporate members whose names appear on the shares listed in the company’s share register and which confer the right to vote. This registration has to be done, as set out in the Bank’s articles of association, up to 10 days prior to the meeting date.
At the General Meeting of Shareholders, matters of importance for the company are discussed by the shareholders. Shareholders without voting rights can take part in the deliberations when the Chairman of the Presiding Board of the General Meeting of Shareholders and the other members so authorize.
The General Meeting of Shareholders is responsible, besides the provisions laid down in the law, for observing the functions embodied in Banco de Negócios Internacional’s articles of association: a) Electing the members of the Presiding Board of the General Meeting of Shareholders, the Board
of Directors and the Board of Auditors, and appointing their respective Chairmen;
b) Electing the General Board members;
c) Electing the Remuneration Committee members;
d) Approving the annual report and accounts, as well as the Board of Auditors’ report;
e) Deciding on share capital increases proposed by the Board of Directors.
EXECUTIVE MANAGEMENT
Board of Directors
BNI’s Board of Directors is the governing body charged with overseeing the company’s general interests, performing all the necessary or appropriate acts to carry out the activities envisaged in the company’s corporate purpose. The Board of Directors is composed of 5 resident members elected by the General Meeting of Shareholders. According to the articles of association, the Board of Directors safeguards shareholders’ interests while also being the body responsible for the bank’s overall management, proposing and ensuring the implementation of the approved Business Plan.
This board is composed of 7 members elected by the General Meeting of Shareholders. Notwithstanding the functions generally attributed by law and others by Banco de Negócios Internacional’s articles of association, the Board of Directors’ responsibilities include:
•Defining the Bank’s general policies and approving the annual and multi-year plans and budgets;•Setting up the Bank’s internal organization and delegating powers to other levels of the hierarchical
chain;•Managing the Bank’s business, executing all the acts and operations which form part of its corporate
purpose; •Appointing representatives or authorized signatories for the purpose of performing certain acts;•Executing and ensuring compliance with provisions of the law and articles of association, and with
the General Meeting of Shareholders’ decisions;•Proposing to, the General Meeting of Shareholders, the continuity of the governing bodies whenever
these are justified after careful consideration;•Exercising other functions entrusted to it by the General Meeting of Shareholders.
The members of the Board of Directors also form part of the Credit Committee and the Internal Control and Quality Committee, presided over by the Chairman of the Board of Directors who also chairs the Audit Committee.
OVERSIGHT
Board of Auditors
The oversight of BNI’s business is carried out in terms of the law by a Board of Auditors composed of three members in office and one or two alternate members. The Board of Auditors meets in the periods prescribed by law and extraordinarily whenever requested by the Chairman, by the majority of its members or by the Board of Directors.
Decisions are made by a majority of votes cast, and in the mandatory presence of more than half of its members in office.
General Board
This board is composed of an even number of persons, not more than fifteen. The members in office of the General Board are: the Chairman of the Board of Directors and the Board of Auditors Chairman.
Pursuant to the law, BNI’s General Board members cannot exercise functions at other Financial Institutions, except where the exercise of such functions is at a Financial Institution in which BNI has a direct or indirect participating interest.
CORPORATE MANAGEMENT MODEL

THE VALUE OF RELATIONSHIPS| Historical Milestones
| Geographic Presence and Network of Branches
| Campaigns
| Sponsorships

REP
OR
T A
ND
AC
CO
UN
TS
2014
| H
IST
OR
ICA
L M
ILE
STO
NE
S
22 23
2010New share capital increase (USD 20 million);
Issue of subordinated bonds (USD 50 million);
Continuation of the branch network expansion.
2011Participation in the Banking Syndicate financing TAAG, for the acquisition of new jetliners;
License to operate in Portugal;
Attained the milestone of 50 branches;
Addition to the “Bankita” program and fostering home ownership.
2012Rebranding, the Bank adopts a new image, a new identity and a new logo;
Inauguration of the Bank’s new head office building;
Creation of an agreement with Hertz, covering all the Visa and Mastercard Gold cards, offering discounts and advantages to Customers in car hire around the world;
Creation of a Mastercard co-branded debit card TAAG-BNI, the first co-branded card in Angola;
Signing of a partnership with the Angolan Government under the program entitled “Angola Investe”, whose purpose is to finance micro, small and medium-sized enterprises in priority sectors of the national economy.
HISTORICAL MILESTONES
2006Creation of Banco de Negócios Internacional.
2007Opening of first Business Centre;
Creation of the “Rede Expresso 24” brand, catering to the retail segment;
The Bank entered into a partnership agreement with Fortis Bank for the development of new financial products;
Line of credit with Deustche Bank (USD 500,000 thousand), to finance infrastructure projects;
Line of credit with Fortis Bank (USD 50,000 thousand);
Conclusion of an agreement with the BDA for the commercialization, via our branch network, of BDA’s services and products;
Banco de Negócios Internacional signed an exclusivity agreement for Angola with Mastercard, in which BNI did the issue and acquiring of Mastercard credit cards.
2008Banco de Negócios Internacional is approved as Member of Visa and Acquiring POS;
The Bank issues the first Visa electron debit card in kwanza in the country;
Agreement signed between BNI and GA Seguros – cross-selling partnership for selling insurance;
Approval of the Bank’s capital increase (USD 20 million);
Opening of branches in the following provinces: Benguela, Huila, Cunene, Zaire.
2009Issue of the prepaid Visa Kwanza debit card, the first prepaid card in domestic currency in the country;
Opening of branches in the following provinces: Cabinda, Kwanza Sul.

REP
OR
T A
ND
AC
CO
UN
TS
2014
| H
IST
OR
ICA
L M
ILE
STO
NE
S
24 25
2014Share capital increase to USD 150 million;
Leadership in the TAAG banking syndicate, comprised of various Angolan banks, in restructuring the purchase transaction for a latest-generation Boeing aircraft, the 777-300ER;
Announcement of the public opening, in Lisbon, Portugal, of BNI Europa, with share capital of €25 million, targeting the Private and Corporate sectors;
Activation, together with IFC (International Finance Corporation), of a USD 25 million line of credit to expand trade finance and support SMEs and corporate Customers in projects contributing towards Angolan growth;
Reinforcement of financing agreement with Commerzbank, totalling €70 million;
Implementation of disaster recovery program;
Celebration of eighth anniversary;
Inauguration of 8 new branches, for a total network of 84 branches covering 14 of Angola's 18 provinces;
The milestone of 150,000 Customers is surpassed;
Implementation of information security program;
Customer deposits total USD 1,510 million, for a market share of 2.71%.
Other highlights
Launch of various products, including: Multibónus BNI, BNI Click, Depósito a Prazo BNI Super Flash and Depósito a Prazo BNI Júnior;
Launch of new BNI furniture line for Retail and Prime, first unveiled in the GIKA space.
2013Awards
The Bizz 2013 – World Business Leader given by the World Confederation of Business (Houston, Texas);
The Bizz 2013 – Inspirational Company awarded by the World Confederation of Business (Houston, Texas);
The Majestic Five Continents Award for Quality / Excellence given by the Chairman of the Association Otherways Management / Consulting (Geneva);
Total quality aptitude seal for the high quality performance / best Customer satisfaction (Geneva);
Best Enterprise – Socrates Committee – in the field of Bank Services (Oxford, UK).
Other highlights
Launch of various projects and first online subscription for Time Deposit;
Development and launching of the 4th phase of the “Desafio Crescer” (Growth Challenge) project, in partnership with human resources, to create and promote internal communication at BNI;
Launch of “Angola Investe” project;
Production of the new graphic image of the Multicaixa and Visa Electron debit cards, as well as of the Visa Gold and Mastercard Gold credit cards;
As part of the social solidarity initiatives, the gift of 50 Magalhães computers to the Hospital Pediátrico David Bernardino and 15 to the Lar Kuzola, as well as the cash donation through the advertisement in the Livro de Honra da Fundação Lwini at the Foundation’s Gala;
Participation in the BNA Savings Forum;
Presence at the ceremony for the awarding of the SIRIUS Prizes, with finalists in the category Angola’s Best Bank and the Best Report and Accounts 2012;
BNI was ranked in the top three banks in Customer service according to a KPMG survey.

REP
OR
T A
ND
AC
CO
UN
TS
2014
| G
EO
GR
AP
HIC
PR
ESE
NC
E A
ND
NET
WO
RK
OF
BR
AN
CH
ES
26
BNI’s strategy is centred on being close to its Customers, adhering to a policy of sustained growth. At the end of 2014, the Bank had a total of 85 branches (8 more than in 2013).
In Luanda, the Bank operated 3 business centres, 26 branches and 19 service outlets compared to 4 business centres, 21 branches and 12 service outlets in the country’s other provinces.
GEOGRAPHIC PRESENCE AND NETWORK OF BRANCHES
4
2
3
1
4
7
5
1
1
1
1
3
45
78
3
1
1
1
1
7
BRANCHES
PRIMEBUSINESSCENTRES
Cabinda
Zaire Uíge
MalangeKwanzaNorte
KwanzaSul
Benguela
Huíla
Cunene
Huambo
NamibeKuando Kubango
MoxicoBié
Lunda Sul
Lunda Norte
BengoLuanda

REP
OR
T A
ND
AC
CO
UN
TS
2014
| C
AM
PAIG
NS
28 29
CAMPAIGNS
In 2014, BNI took the decision and accepted the challenge of being actively involved in helping Angola to grow. To this end, the bank launched a number of campaigns, including:
“MULTIBÓNUS BNI” CAMPAIGN “BNI MAXI MULTIPLICA”

REP
OR
T A
ND
AC
CO
UN
TS
2014
| C
AM
PAIg
NS
30 31
“DePÓSITO A PRAZO BNI JÚNIOR” BNI CLICK

REP
OR
T A
ND
AC
CO
UN
TS
2014
| SP
ON
SOR
SHIP
S
32
SPONSORSHIPS
In 2014, BNI sponsored the following events:
•MISS LUANDA 2014 – annual event to elect the most beautiful woman in Luanda, whose theme this year was “Family and Literature”;
•USACC (U.S.A. - Angola Chamber of Commerce) – the Institution aims to strengthen trade relationships between the two countries;
•Musician Nanuto – works done by the musician in 2014;
•National Private Investment Agency (ANIP) “Young Inventors” award – each year, the event gives awards to young Angolan inventors;
•Fenacult Cultural Trains – the event disseminates Angolan culture through cultural trains.

WE GROW WITH ANGOLA| Human Resources
| BNI Growth Project
| Business Support Areas – Synopsis
REP
OR
T A
ND
AC
CO
UN
TS
2014
| H
UM
AN
RE
SOU
RC
ES
36 37
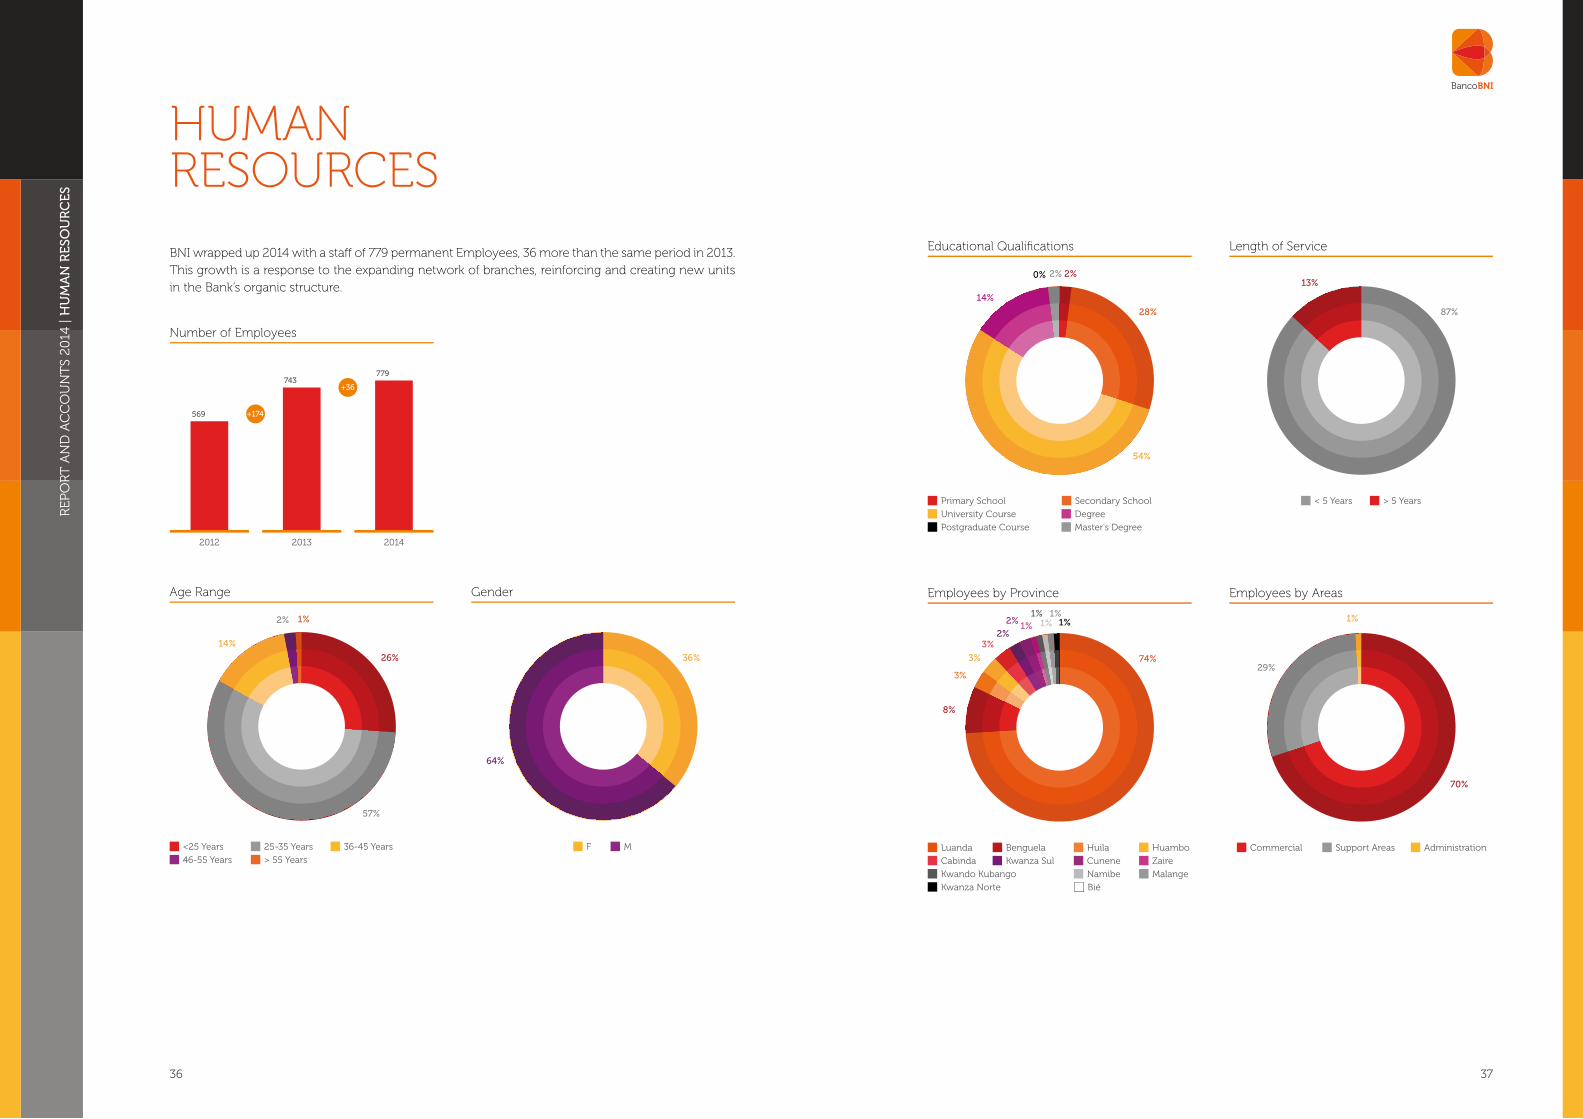
BNI wrapped up 2014 with a staff of 779 permanent Employees, 36 more than the same period in 2013. This growth is a response to the expanding network of branches, reinforcing and creating new units in the Bank’s organic structure.
HUMAN RESOURCES
569
2012
Number of Employees
779
2014
743
2013
+174
+36
Age Range Gender
26%
14%
57%
2% 1%
<25 Years 25-35 Years
46-55 Years > 55 Years
36-45 Years
36%
64%
F M
Educational Qualifications Length of Service
28%
14%
2% 2%0%
54%
Primary School Secondary School
Degree
Postgraduate Course Master's Degree
University Course
87%
13%
< 5 Years > 5 Years
Employees by Province Employees by Areas
74%
3%
3%
3%2%
2%1%
1%1%
1%1%
8%
Luanda Benguela Huila Huambo
Cunene Zaire
Kwando Kubango Namibe
Kwanza Norte Bié
Malange
Cabinda Kwanza Sul
70%
29%
1%
Commercial Support Areas Administration

REP
OR
T A
ND
AC
CO
UN
TS
2014
| H
UM
AN
RE
SOU
RC
ES
38
TRAINING AND QUALIFICATION OF STAFF
29 training initiatives and 4 internal workshops were taught by different training entities in 2014 for 387 Employees, for a total investment of around USD 157,749.
The BNI Growth training centre had a total of 80 trainees for the commercial network, hiring and distributing 57 new Employees/trainees to the Network and Prime branches.
Participation in training initiatives by position
Commercial Network
68
182
13
129
25
BoD Management
Assistants Other Positions
Managers
Head O�ce and Support Areas
160
14
43
BoD Line Managers Technicians
Hours of Training
239.592
60 96
22.268
80
(1) Includes Marketing, Products and Services(2) Behavioural(3) Includes Finance and Business Organisation
Banking techniques(1)
Soft Skills(2) Management(3) Human Resources
Law
Training Hours No. of Participants
536
15 3
76
4

REP
OR
T A
ND
AC
CO
UN
TS
2014
| B
NI
GR
OW
TH
PR
OJE
CT
40 41
BNI GROWTH PROJECT
EMPLOYEE OF THE MONTH
Employee in Focus
Interview with Sabino Silva Teller - BNI Sumbe (Commercial Division)
E-Crescer: Sabino, what has changed for you since the intranet announcement of the Employee of the Quarter award? SS: When I was told that I had been chosen as the BNI Employee of the Quarter, my confidence and performance really took off. I became even more motivated and can now look to new horizons.
E-Crescer: What have you done to improve your professional performance? SS: To improve my performance, I have made much more use of the advice available through my colleagues and line managers. They have helped me to clear up any doubts I might have had and to check my compliance with the bank’s internal regulations.
E-Crescer: What motivates you? SS: My biggest source of motivation is the fact that I enjoy an excellent working environment; one that encourages true cooperation between all the staff at the BNI Sumbe branch.
E-Crescer: If I say BNI, what do you say?SS: The future depends on us.
BRANCH OF THE YEAR 2014: PRIME
Interview with Antunes BiancoManager (Prime Lobito)
E-Crescer: Having been elected Best Branch of the Year, how do you feel? AB: We feel moved and grateful for the recognition. It is proof that BNI takes everyone’s performance into account in assessing overall branch results.
E-Crescer: What is your secret, Bianco?AB: In fact, the bank already provides us with the means and methods we need to turn in a good performance and meet our targets.Often, identifying these is the hardest part. However, when we have discussed them as a team, opinions have been both highly favourable and extremely useful.
E-Crescer: Who do you have to thank for having been selected? AB: We would like to thank the board, DCB, DHR, HR-Projects, DBE, Service Desk, Accounts, DC, DPL, DOP, GAI and all the other divisions that have, directly or indirectly, helped us along the way.Once again, thanks for the vote of confidence. “Together we create value”.
Employee of the month, Sabino Silva Branch of the year 2014: Prime Lobito
REP
OR
T A
ND
AC
CO
UN
TS
2014
| B
NI
GR
OW
TH
PR
OJE
CT
42 43
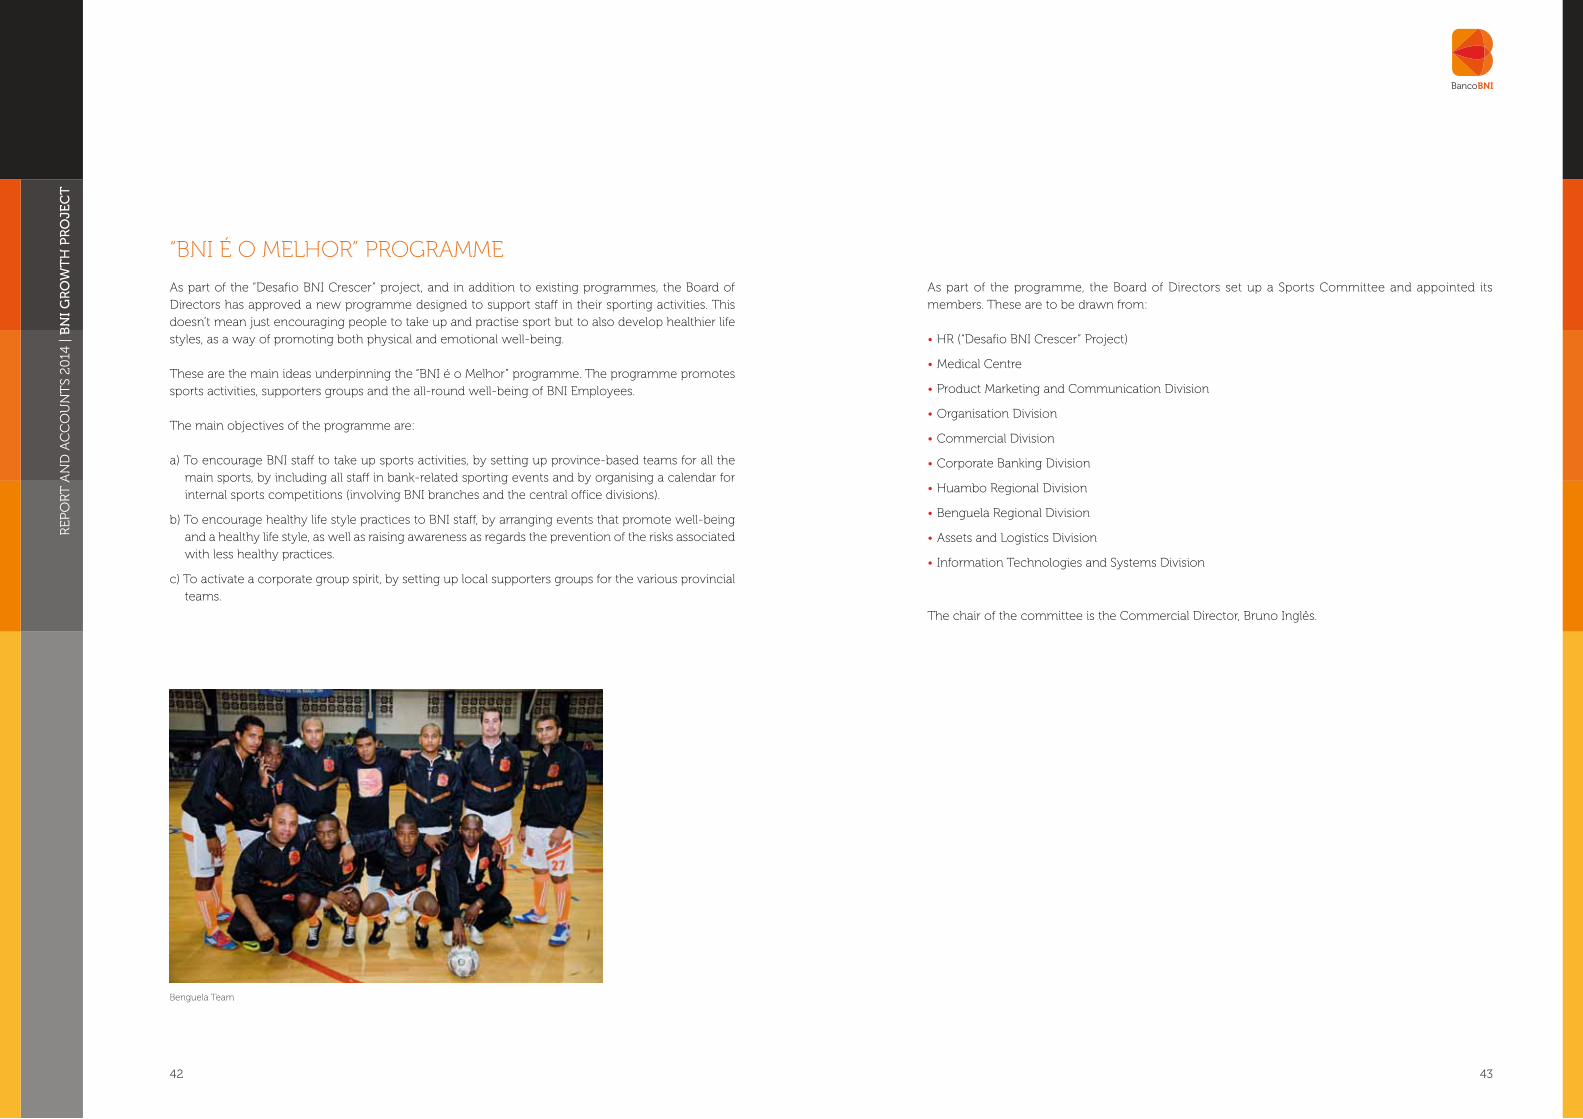
“BNI É O MELHOR” PROGRAMME
As part of the “Desafio BNI Crescer” project, and in addition to existing programmes, the Board of Directors has approved a new programme designed to support staff in their sporting activities. This doesn’t mean just encouraging people to take up and practise sport but to also develop healthier life styles, as a way of promoting both physical and emotional well-being.
These are the main ideas underpinning the “BNI é o Melhor” programme. The programme promotes sports activities, supporters groups and the all-round well-being of BNI Employees.
The main objectives of the programme are:
a) To encourage BNI staff to take up sports activities, by setting up province-based teams for all the main sports, by including all staff in bank-related sporting events and by organising a calendar for internal sports competitions (involving BNI branches and the central office divisions).
b) To encourage healthy life style practices to BNI staff, by arranging events that promote well-being and a healthy life style, as well as raising awareness as regards the prevention of the risks associated with less healthy practices.
c) To activate a corporate group spirit, by setting up local supporters groups for the various provincial teams.
As part of the programme, the Board of Directors set up a Sports Committee and appointed its members. These are to be drawn from:
•HR (“Desafio BNI Crescer” Project)
•Medical Centre
•Product Marketing and Communication Division
•Organisation Division
•Commercial Division
•Corporate Banking Division
•Huambo Regional Division
•Benguela Regional Division
•Assets and Logistics Division
•Information Technologies and Systems Division
The chair of the committee is the Commercial Director, Bruno Inglês.
Benguela Team
REP
OR
T A
ND
AC
CO
UN
TS
2014
| B
USI
NE
SS S
UP
PO
RT
AR
EA
S –
SY
NO
PSI
S
44 45
HUMAN RESOURCES DEPARTMENT (DRH)
After restructuring the Human Resources Department in 2013 based on the Bank’s strategic plan and goals for the area, the following activities were carried out in 2014:
•Continued configuration of the HR management system, with updating according to actual information needs;
•Recruitment and selection of 241 new Employees;•Updating, distribution and implementation of the Employee Manual;•Creation and implementation of the Sales Department staff resizing plan;•Updating, distribution and implementation of the Occupational Qualifier;•Definition and approval of the Technical and Specific Skills Manual, per job position;•Support in drawing up BNI’s Strategic Plan and coordination of the workgroup to define Departmental
Performance Indicators•Implementation of the Bonus and Performance Assessment model;•Implementation of the new recruitment and selection model and plan;•Implementation of the Bank’s Occupational Health and Safety Policy;•Updating of the remuneration and benefits model and respective payroll impact study;•Start of the Bank’s Career Management model;•Creation of “E-Crescer” company newsletter for Employees;•Creation and coordination of the Bank’s Disciplinary Proceedings workgroup;•Creation and coordination of the Banking Human Resources Departments workgroup;•Expansion of the Attendance Management system (portal) for all bank areas nationwide;•Creation of a Staff Cost Streamlining Plan, to be implemented starting in 2015.
TRAINING AND CAREER DEVELOPMENT DEPARTMENT (DFDC)A series of activities were carried out at the DFDC in 2014, including the following:
•29 training initiatives, 4 internal workshops for 387 Employees taught by different entities;•The BNI Growth training centre hosted a total of 80 trainees for the commercial network, hiring
and distributing 57 new Employees to the Network and BNI Prime branches;•Draft project to implement the e-learning platform at the Bank, to be deployed in 2015;•Comprehensive project support for the Information Systems and Technologies Department in
training new Employees from areas using the “Banka” system;•Creation of new trainee evaluation procedures for the Trainee Monitoring and Assessment group;•Start of phase one of training in provinces, including the completion of Employee training in service,
communication and general banking operations for the country’s central and southern provinces.
OIL & GAS OFFICE (GOG)
The Oil & Gas Office was created in 2013, in view of the nature of this sector and dynamics needed to meet the needs of oil sector companies and related service providers.
The main highlights of the Oil & Gas Office’s activities in 2014 were:
•Implementation of compliance procedures, with the prerequisites required by oil operators;•Reinforcement of the work team by hiring a new Employee;•Reactivation of the BNI accounts of companies engaged in the Oil&Gas sector, the attraction
and loyalty of new Customers in the Oil & Gas sector;•Updating of a database of Oil&Gas Customers;•Maintenance of a Strategic Operating Plan in the market;•Currently underway is the ISO271001 certification process (Information Security Standard);•Workshops with Customers ESPACIE and STAPEM;•Participation in oil sector development forum (Business Support Centre/CAE);•Participation in “The Oil & Gas Year” conference;•Participation in Sonangol offshore block bid session;•Partnership negotiation with OCA (Offshore Centre Angola); •Partnership negotiation with CAE (Business Support Centre).
BUSINESS SUPPORT AREAS SYNOPSIS

REP
OR
T A
ND
AC
CO
UN
TS
2014
| B
USI
NE
SS S
UP
PO
RT
AR
EA
S –
SY
NO
PSI
S
46 47
COMPLIANCE DEPARTMENT (DC)
In 2014, BNI took initiatives to comply with the best banking practices from legislation handed down by BNA and international bodies.
In the same year, the Compliance Department underwent several changes, approving its restructuring under criteria of independence and a permanent presence in BNI’s internal control system.
Among the activities carried out during this year, the following were noteworthy: •Consolidation of Customer database filtering and monitoring program against main lists of sanctions
in force in the international financial market;•Implementation of measures in the wake of new regulations in force (internal and external); •Drawing up of KYC (Know Your Customer) processes;•Investigation of cases on requests for information/investigation related to irregular transactions;•Participation in work to update the Internal Control Manual, in accordance with new legislation;•Monitoring of international transactions (OPEs, documentary remittances, automatic payment cards,
internet banking and mobile banking);•Adaptation to new regulatory framework for automatic payment cards;•FATCA (Foreign Account Tax Compliance Act) registry and adoption;•Monitoring of BNI Europa implementation process, in the area of compliance;•Passing of compliance test, following the granting of the IFC line of credit (World Bank member);•Participation in creating the new pricing model, in cooperation with the Organization Department;•Participation in creating the Customer Relations Office;•Coordination of new BNI cheque model implementation;•Implementation of monthly control of account openings;•Reassessment of AML/CFT process for remittance service (MoneyGram);•Preparation and completion of FCPA forms to pre-qualify for oil industry service provision;•Participation in establishing commercial relationship between BNI and the Unicredit Group;•Reformatting of account application forms (personal and corporate);•Updating of AIF ESAAMLG process.
INFORMATION SYSTEMS AND TECHNOLOGIES DEPARTMENT (DTSI)
A focus on technology innovation has always been a cornerstone of Banco BNI’s business.
The department comprises 39 Employees, including eight new hires in 2014, four departures and four appointments. Investments in information systems and new project launches in this area have made key contributions allowing the Bank’s areas to monitor and leverage growth.
The main highlights of the Information Systems and Technologies Department’s activities in 2014 were:•Deployment of money laundering application;•Development and implementation of “Multibónus BNI” product;•Development and implementation of “BNI Click” product;•Creation of technology support centres in provinces;•Expansion of ATM and POS network;•Development and deployment of a middleware platform;•Development and implementation of information security policies;•The department also received training in Cisco, Microsoft and Visa.
INTERNAL AUDITING DEPARTMENT (DAI)
In 2014, the organic and operating structure of the Internal Auditing and Inspection Department was changed to form two departments: Internal Auditing and Inspection. This area’s strategy for the year focused on covering the highest possible number of branches in terms of auditing visits, with a view to verifying the proper application of internal standards and procedures, and minimizing the inherent risks of the banking business.
Among the various activities carried out by the DAI in 2014, the following were noteworthy:•Work supervision of auditing technicians in their visits to branches, both in Luanda and in the provinces,
to monitor service quality to the Bank’s Customers;•Continuous assessment of the technical knowledge of the department’s staff to pinpoint training
needs and provide them with a high degree of qualification;•Implementation of rules to improve internal control when applying internal standards and procedures
throughout the entire branch network;•Reinforced use of internal software for real-time monitoring of all banking transactions performed
by the various branches and departments;•Performance of audits at 70% of all network branches. In the provinces, all of the branches were audited.•Technical training in internal auditing, inspection and Microsoft Office;•Participation in various seminars, discussion groups and meetings sponsored by various banking and
financial entities.

REP
OR
T A
ND
AC
CO
UN
TS
2014
| B
USI
NE
SS S
UP
PO
RT
AR
EA
S –
SY
NO
PSI
S
48 49
OPERATIONS DEPARTMENT (DOP)
The Operations Department is comprised of two departments: the National Operations Department and the Foreign Operations Department.
In 2014, the National Operations Department realized the following operations:
USD’000 Quantities2014 2013 Var.% 2014 2013 Var.%
Loans loaded in the system 521 354 267 098 95% 358 436 -18%
SPTR 2 144 387 1 454 547 47% 13 275 7 185 85%
Issued 1 052 779 725 988 45% 3 292 1 816 81%
Received 1 091 608 728 559 50% 9 983 5 369 86%
STC 87 729 142 946 -39% 18 956 19 324 -2%
Issued 33 239 73 910 -55% 9 733 9 396 4%
Received 54 490 69 036 -21% 9 223 9 928 -7%
Payments and Clearing Subsystem
Credit Clearing 163 456 521 082 -69% - - -
Debit Clearing 85 458 135 183 -37% - - -
In 2014, the Foreign Operations Department realized the following operations:
USD’000 Quantities2014 2013 Var.% 2014 2013 Var.%
Documentary credit for imports 32 370 76 742 -58% 45 41 10%
Documentary remittances issued for imports 135 512 280 604 -52% 1 035 1 284 -19%
OPE - Issued 700 650 1 268 825 -45% 11 660 12 108 -4%
OPR - Received 227 661 258 125 -12% 1 399 6 188 -77%
Total 1 096 192 1 884 297 -42% 14 139 19 621 -28%
ACCOUNTING DEPARTMENT (DC)
The main highlights of the Accounting Department’s activities in 2014 were:•Overhaul of team with a new manager; •Mechanisms to automate departmental processes and control;•Definition and consolidation of the department’s structure, with the assignment of duties and division
of tasks;•Implementation of a Supplier Management System;•Implementation of monthly reports: Monthly Activity Report, Employee Pending Item Schedule,
Travel Control, Teller Fault Schedule;•The department also received training in:•Tax reform and adjustments;•Actuarial Supplement and Accounts Reporting – post-employment benefit;•Financial Services Taxation;•Administrative Tax Litigation;•Angolan Taxation;•New Statutes of Major Taxpayers;•International IFRS standards.
INTERNATIONAL FINANCE DEPARTMENT (DFI)
The International Finance Department develops and undertakes the implementation of the Bank’s financial program. It also fosters and maintains relations with banks outside and inside the country, pursuing business goals, and is responsible for cash management and giving support to the management of assets and liabilities (Assets and Liabilities Committee), namely as concerns liquidity, interest rate and foreign currency risks.
Following are most noteworthy aspects of the DFI’s activities in 2014:•Management and control of market risks;•Reinforced control of foreign exchange exposure limit;•Preparation and implementation of DFI and ALCO Procedural Manual;•Restructuring of the Markets Room and Central Treasury through the hiring of human capital;•Ongoing implementation of BNA Instruction on foreign currency restructuring process.

REP
OR
T A
ND
AC
CO
UN
TS
2014
| B
USI
NE
SS S
UP
PO
RT
AR
EA
S –
SY
NO
PSI
S
50 51
ELECTRONIC BANKING DEPARTMENT (DBE)
Payment methods have evolved to become increasingly more efficient, essentially driven by the ability to make payments by electronic means. The electronic payment system also creates considerable economies of scale, with a sizeable collection of features.
The department is comprised of the following four departments: Credit Card Department, BNI On-Line Department, Fraud and Risk Analysis Department and Acceptance/Acquiring Department.
The primary undertakings in 2014 included the following:•Creation of Internet Banking Manual;•Creation of TPA Closing User Manual, Practical Credit Card Usage Guide;•Credit Card Information Manual;•Collection of annual credit card fee;•Call Centre;•Employee credit card recovery procedure;•Customer credit recovery procedure;•Change of cards to new image with chip;•Sending of monthly information to branches on expiry date of debit/credit cards and accounts
without associated electronic products;•Implementation of Intermarket card;•Implementation of Multibónus product.
LEGAL DEPARTMENT (DJU)
The Legal Department is situated at the front line of BNI’s organizational structure. It is tasked with ensuring the legal security and certainty of the businesses to which the Bank is a party or has interest.
As such, to achieve the goals laid out, the following work was done in 2014:•Drawing up of a total of 176 loan agreements; •Issuance of various bank guarantees, for a total of 80; •Drawing up of a partnership agreement with TAAG-Linhas Aéreas de Angola, to create a co-branded
credit card;•Handling of credit processes (DJU provides services to Customers in formalizing processes, including
trips to notary public offices to handle issues involving authentications, document notarization, for a total of 396 processes;
•Handling of notary deeds and registries to legalize the Institution’s properties; •Revision of general terms and conditions of various products, in view of specific new BNA
requirements;•Responses to 591 official dispatches addressed to BNI from various public entities;•Drawing up of various contracts: rental (11), work supervision (1), service provision (18), contract works
(12), debt settlement (4), share assignment (3), employment agreement termination (4), assignment of contractual position (3), promissory purchase and sale agreements (2), financial leasing (1), for a total of 59 contractual agreements;
•Preparation of criminal reports on improper withdrawals at Customer accounts and serious breaches of institutional procedures in force;
•Establishment of companies to support the Bank’s business activities – two new companies established;
•In the legalization process for the Institution’s properties, proceedings were concluded in relation to urban properties acquired by the Bank, now registered on behalf of BNI;
•BNI’s corporate boards were registered for the period of 2013-2016, following election by the General Meeting of Shareholders held 11 April 2013;
•Appointment of department head for matters involving litigation;•In 2014, the DJU collected AOA 3,819,660 (USD 37,133) for the Bank in services rendered.

REP
OR
T A
ND
AC
CO
UN
TS
2014
| B
USI
NE
SS S
UP
PO
RT
AR
EA
S –
SY
NO
PSI
S
52 53
•Preparation of the Bank’s 2014 budget;•Definition of annual sales department goals;•Launch of implementation project for the area’s new Business Intelligence tool;•Monitoring of BNA inspections; •Participation in the creation of BNI strategic plan and departmental performance indicators;•Participation and provision of information for the “branch of the month” monitoring workgroup;•Processing and provision of BNI statistical data to the IFC (World Bank institution), in accordance with
international reporting standards, at the time of contracting the new international line of credit;•Monitoring of financial performance of BNI group companies;•Support in implementing new pricing model;•Preparation and reporting of periodic financial information to the Bank’s Board of Directors and
departments;•Information reporting to BNA;•Participation in periodic meetings of the Angolan Commercial Banks Association (ABANC);•Ongoing participation in the Assets and Liabilities Committee (ALCO);•Monitoring of liquidity, exchange and market risks;•Updating of management reports, according to specific developments and rules of the Angolan
banking sector.
RISK MANAGEMENT DEPARTMENT (DGR)
Within the scope of implementing Notice no. 2 of 19 April 2013 governing Financial Institutions’ obligations in establishing an internal control system, BNI implemented a number of actions in 2014, including a Risk Management Department comprising three departments (Operating Risk, Credit and Counterparty Risk and Balance Sheet, Market and Rate Risk).
In this context, during the relatively short time of this area’s existence, the following steps were taken:•Order for the creation of Risk Management Department;•Appointment of a Head of Risk Department;•Internal publication of organic structure manual;•Internal publication of business continuity policy;•Start of recruitment process for Risk Department staff;•Start of work for implementing the business continuity management system.
MARKETING AND COMMUNICATION DEPARTMENT (DMC)
In 2014, the Marketing and Communication Department’s strategy was guided by compliance with budgetary limits, prioritizing all activities aimed at disseminating BNI’s image.
During the year, this department successfully launched new products through advertising campaigns in the press and radio, promoting these products at branches through brochures and posters, and at the BNI website through banners.
Products launched in 2014:•“Depósito a Prazo BNI Super Flash”;•“Depósito a Prazo BNI Net”;•“Multibónus BNI”;•“Depósito a Prazo BNI Júnior”.
Main activities carried out in 2014:•Continued updating of the website and intranet;•Revision of company identity of rules and manuals;•Editing and review of Employee Manual; •Formatting of business continuity policy document;•Graphic creation and layout of “BNI Crescer” E-news, in a partnership with the Human Resources
Department;•Organization of various activities, including the Bank’s Christmas dinner.•Production of company film on BNI and BNI Europa; •Publication of various press releases; •Preparation of image for new branches, and updating of image for the older ones; •Publication of 2013 Annual Report and Accounts, and production of various gift items for our Customers;•Updated look for furnishings at all branches (Retail and Prime); •Various partnerships, primarily in the area of welfare.
CONTROL AND MANAGEMENT DEPARTMENT (DCG)
The Control and Management Department is a structural area of the Bank which reports directly to the Board of Directors; as such, its purpose is to conceive, implement and monitor a financial information control and management model, as needed to monitor developments in the Bank’s business. This department is comprised of the Analysis and Financial Reporting, Planning and Management Control Departments.
Among the various activities carried out by the DCG in 2014, the following were noteworthy:•Modification of the area’s organic structure from an office to a department;•Appointment of Head of Planning Department;•Preparation of the Bank’s 2013 Annual Report and Accounts, ranked for the third year running among the
10 best management documents on a national scale in the Sirius award of the Deloitte consulting firm;
REP
OR
T A
ND
AC
CO
UN
TS
2014
| B
USI
NE
SS S
UP
PO
RT
AR
EA
S –
SY
NO
PSI
S
54 55
ORGANIZATIONAL DEPARTMENT (DO)
In 2014, the Organizational Department had the following strategy:•Ensure closer proximity to people (key people in the Bank’s business activities) and critical business
areas to obtain “real” knowledge of any shortcomings in the Bank’s regulatory framework in force and facilitate the standardization of the Bank’s internal policies and processes;
•Leverage the awareness of those in charge, with exclusive functions and responsibilities, comprising the boards tasked with a mission, and laying the initial groundwork for a clearly defined, transparent and understandable culture so that all Employees are proud to be part of the BNI culture and the market recognizes this as our way of being, our presence and our brand.
Activities carried out
•Updating of rules with new internal processes and procedures;•Proper adaptation of processes per target areas of the process re-engineering project (DFI, DPL and
DBE) and improvements implement.•Participation in the training modules “Transparency as a means of appreciating human and financial
capital” and “Diligence and commitment to quality generating superior Customer service”.•Various efforts to properly adapt requirements of good corporate governance, internal control and
Customer service support and information obligation for BNI products;•Updating of credit origination/risk assessment process based on rating and scoring models,
calculations of impairment and credit recovery, such as evaluations and proposals for critical process recovery within the scope of business continuity.
Other pertinent facts
Upcoming challenges:•Structure and implement new businesses, products and services (supported by Celbux, insurance
company, EMIS, Facilcred, and others);•Define and implement a governance by processes model/methodology, built over a process platform
(to support the implementation of Risk Officer processes based on our risk management model and corporate governance and internal control culture);
•Ensure/enable the proper separation of duties through formal procedures and limits to contracting or authorization;
•Implement automatic procedures for preparing bank reconciliations.
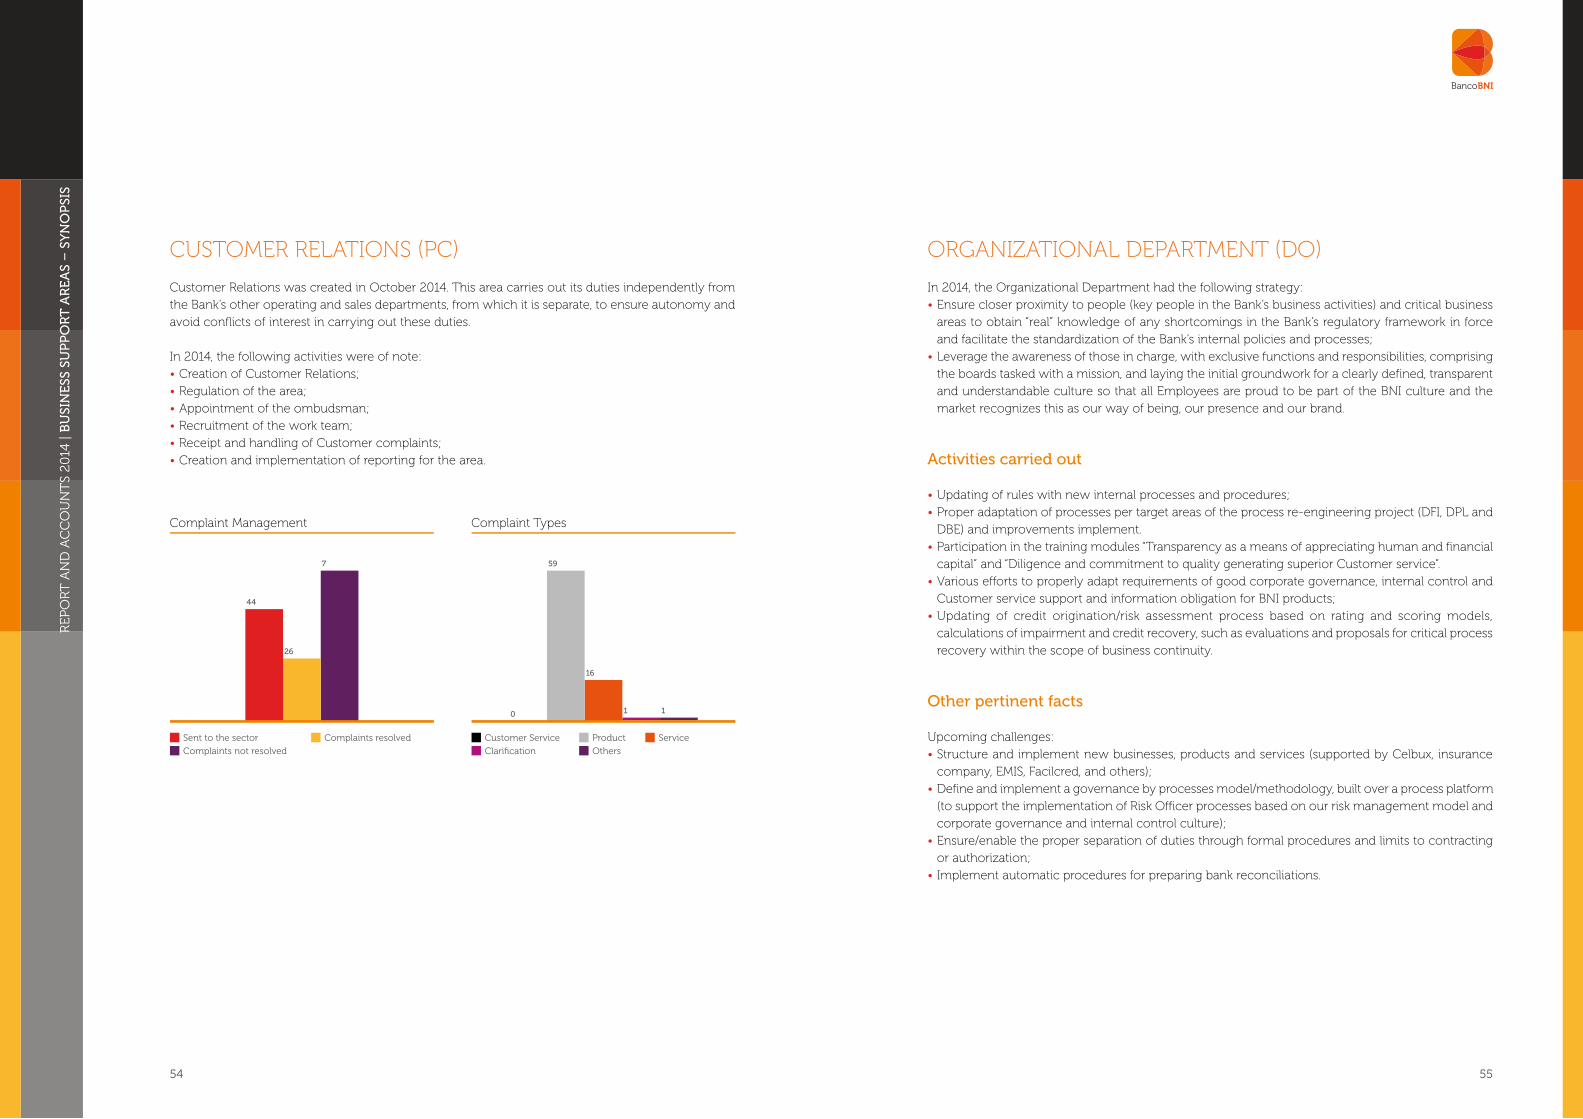
CUSTOMER RELATIONS (PC)
Customer Relations was created in October 2014. This area carries out its duties independently from the Bank’s other operating and sales departments, from which it is separate, to ensure autonomy and avoid conflicts of interest in carrying out these duties.
In 2014, the following activities were of note:•Creation of Customer Relations;•Regulation of the area;•Appointment of the ombudsman;•Recruitment of the work team;•Receipt and handling of Customer complaints;•Creation and implementation of reporting for the area.
Complaint Management
7
26
44
Sent to the sector Complaints resolved
Complaints not resolved
Complaint Types
11
16
59
0
Customer Service Product
Clarification Others
Service

PASSION FOR BUSINESS| Business Developments
| Business Areas
| Distribution Channels
| BNI Customer Breakdown

REP
OR
T A
ND
AC
CO
UN
TS
2014
| B
USI
NE
SS D
EVE
LOP
ME
NT
S
58 59
Brief notes on the main indicators:(*) Amounts in USD ‘000.
BUSINESS DEVELOPMENTS
Branch Network and Sta�
2012 2014
85
779
77
743
62
569
2013
Service Points Employees
Customers
2012 2014
7.157
171.926
5.235
122.432
4.372
91.524
2013
Personal Business
Business with Customers
2012 2014
859.832880.609791.280
1.510.204
1.367.5651.305.516
2013
Loans Customer Deposits
Loan-to-deposit ratio
66%
61%
62%
1.692.075
2012
Total Assets
1.964.682
2014
1.886.690
2013
Credit Quality
2012 20142013
Provision Coverage for Overdue Loans
2% 4%3%
93%
194%
103%
Loans Overdue / Total Loans
Total Own Funds
2012 2014
188.200
221.400
220.730
2013
Solvency Ratio
14,92%
11,38%
14,73%
Market Position (Resources)
2012 2014
1.442.7481.304.1161.083.712
52.995.461
48.518.497
41.748.904
2013
BNI All Banks Position of BNI Assets
111010
Market Position (Loans)
2012 2014
1.203.5101.072.025997.809
46.321.300
42.282.734
37.254.462
2013
BNI All banks Position of BNI Loans
11
99

REP
OR
T A
ND
AC
CO
UN
TS
2014
| B
USI
NE
SS A
RE
AS
60 61
BUSINESS AREAS
Banco de Negócios Internacional devotes itself to the taking of third-party resources and operates in the market through strategic units, backed by clear criteria and segmentation and differentiation objectives, in the form of deposits or other services, promoting their application in credit transactions, financing and other lending operations on the interbank and secondary markets..
BUSINESS UNITS
BNI Prime Corporate: dedicates itself to the high-revenue companies segment. At the end of 2014, this unit had a total of 1,962 Customers (1.10% of the Bank’s total), USD 919,260 thousand in Customer deposits (61.14% of the Bank’s total) and USD 767,098 thousand in credit granted (86.27% of the Bank’s total);
BNI Prime Private: Area dedicated to the high-income individuals segment. At the end of 2014, this unit had a total of 3,756 Customers (2.10% of the Bank’s total), USD 344,201 thousand in Customer deposits (22.89% of the Bank’s total), and USD 31,894 thousand in credit granted (3.59% of the Bank’s total);
Oil & Gas: Area dedicated to oil companies and related business providers. At the end of 2014, it had a total of 23 Customers (0.01% of the Bank’s total), USD 2,351 thousand in Customer deposits (0.16% of the Bank’s total) and USD 1 thousand in credit granted (0.00% of the Bank’s total), with a focus on constantly improving the products and services offered to this highly selective sector.
BNI Retail: Area dedicated to the retail segment, with 173,342 Customers (96.79% of the Bank’s total), USD 237,629 thousand in Customer deposits (15.81% of the Bank’s total), and USD 90,215 thousand in credit granted (10.15% of the Bank’s total).
At the end of 2014, the Bank had a total of 179,083 Customers (51,416 more compared to 2013), with year-over-year growth of 40.27%. Its national network of branches grew from 77 to 85 units, for a total of 8 new branches opened in 2014.
In 2014, Customer deposits were up 16.36% at USD 1,510,204 thousand. Deposits in domestic and foreign currency accounted for 77.28% and 22.72% of the total portfolio, respectively.
The credit portfolio was up up 6.96% at USD 859,833 thousand. Credit granted to Customers in domestic currency accounts for 87.71%, or USD 754,166 thousand, of the Bank’s total portfolio. In 2014, BNI’s market share was 2.72% for Customer deposits and 2.60% for credit.
New Customers Resource Inflow Loans Made
65,42%
34,18%
0,40%
27,19%
72,62%
0,19% 3,99%
96,01%
0,00%
BNI Prime Private BNI Prime Corporate Oil & Gas
97%
3%
28%
72% 67%
33%
BNI Business BNI Personal
New Customers Resource Inflow Loans Made

REP
OR
T A
ND
AC
CO
UN
TS
2014
| B
USI
NE
SS A
RE
AS
62
BANKITA
In 2014, the Bank saw the proliferation of Bankita products, wrapping up the year with 16,369 “Bankita” accounts opened, 4,972 more than in 2013, for total growth of 43.63%.
Bankita Customer account deposits were up 43.31% in 2014, or around USD 429 thousand, reaching a total of USD 1,419 thousand at year-end.
Demand and term deposits account for 95.38% and 4.62%, of all Bankita Customer account deposits, respectively.
“ANGOLA INVESTE” PROGRAM
With a view to spurring the national economy, the “Angola Investe” program has as its main aim fostering and diversifying the national economy through the funding of the investment projects of micro, small and medium-sized enterprises and entrepreneurs.
On 31 December 2014, BNI approved three financing transactions, advancing with two, in the amount of USD 1,526 thousand at year-end.
Customer Deposits
2012 2014
1.419
990
408
2013
11.397
16.369
5.907
Customer Deposits No. of Accounts
(*) Amounts in USD '000

REP
OR
T A
ND
AC
CO
UN
TS
2014
| D
IST
RIB
UT
ION
CH
AN
NE
LS
64 65
BNI remains strongly committed to developing solutions for the purpose of providing greater Customer satisfaction by creating attractive, convenient products and channels for all segments.
BNI’s distribution network is composed of:
NETWORK OF BRANCHES
At the end of 2014, the Bank had a total of 85 branches, 8 more than in 2013, including 7 business centres, 47 branches and 31 service outlets distributed across 13 of the country’s provinces. In Luanda, the Bank operates with 3 business centres, 26 branches and 19 service outlets.
ATMS
At the end of 2014, the Bank had 184 ATMs, including 57 for Visa/Mastercard and 127 for Multicaixa, 63 more than the same time last year, covering a total of 12 of the nation’s provinces.
AUTOMATIC PAYMENT TERMINALS (APTS) BNI’s APT network has 930 terminals, including 262 for Visa/Mastercard and 668 for Multicaixa.
In terms of 2014 purchases, the Visa/Mastercard network had 39,312 valid purchases totalling USD 25,955 thousand in transactions for a mon-thly average of USD 2,163 thousand.
The Multicaixa network had USD 86,312 thou-sand in transactions, totalling 536,066 valid purchases, for a monthly average of USD 7,193 thousand.
DISTRIBUTION CHANNELS
Branch Network in Luanda
19
26
3
Business Centre Branches Service Counters
Branch Network in the other Provinces
Benguela CabindaBié Cunene Huambo Huila Kuando Kubango
Kuanza Norte
Kuanza Sul Malange Namibe Zaire
1
2
5
1 1
22
3
1 1 1
2
1 1
4
2
1 1
2
1 1 1
Business Centre Branches Service Counters
ATM’s
2012 2014
57
127
55
66
56
46
2013
Visa/Mastercard Multicaixa
POS
2012 2014
262
668
182
358
165 164
2013
Visa/Mastercard Multicaixa

REP
OR
T A
ND
AC
CO
UN
TS
2014
| D
IST
RIB
UT
ION
CH
AN
NE
LS
66 67
INTERNET BANKING (BNI ONLINE)
At the end of 2014, the Bank had 879,441 transactions via BNI Online compared to 458,913 in 2013, with around 8,001 active contracts and a total transaction volume of USD 21,517 thousand.
CREDIT CARDS (VISA AND MASTERCARD)
In 2014, BNI’s network of active credit cards included 966 cards, with 517 from the Visa network and 449 from the Mastercard network.
As regards the Visa network, 303 cards were issued to the Prime network and 214 cards were issued to the BNI Retail network. For the Mastercard network, 215 cards were issued to the Prime network and 234 cards were issued to the BNI Retail network.
DEBIT CARDS (MULTICAIXA AND VISA)
In 2014, BNI’s Multicaixa and Visa debit cards totalled 101,091 (compared to 73,892 cards in 2013), up 27,199 (+37%) cards.
Of all Visa debit cards, 1,485 belong to the Prime network and 37,411 belong to the BNI Retail network. Of all Multicaixa cards, 1,388 belong to the Prime network and 60,807 belong to the BNI Retail network.Number of Contracts and Transactions
No. Transactions 2014
No. Contracts 2014
No. Transactions 2013
Jan
Feb
Ma
r
Ap
r
May
Jun
Jul
Au
g
Se
p
Oc
t
No
v
De
c
0
20.000
40.000
60.000
80.000
100.000
120.000
Transaction Volume
Transaction Volume in Thousands of USD - 2014
Transaction Volume in Thousands of USD - 2013
Jan
Feb
Ma
r
Ap
r
May
Jun
Jul
Au
g
Se
p
Oc
t
No
v
De
c
0
1.000
1.500
500
2.000
2.500
3.000
3.500
4.000
Active Credit Cards
2012 2014
517
449
684
468
554
336
2013
Visa Mastercard
Debit Cards
2012 2014
38.896
62.195
34.085
39.807
17.719
11.714
2013
Visa Electron Multicaixa

REP
OR
T A
ND
AC
CO
UN
TS
2014
| B
NI
CU
STO
ME
R B
RE
AK
DO
WN
68 69
BNI CUSTOMER BREAKDOWN
At the end of 2014, the Bank had a total of 179,083 Customers (51,416 more compared to 2013), with year-over-year growth of 40.27%. Personal banking Customers account for 96% of the Bank’s total Customer portfolio, or 171,926 Customers, while companies account for 4%, for a total of 7,157.
Statistically speaking, following are some conclusions with regard to BNI’s Customer portfolio:
Total Customers Gender
96%
4%
Businesses Personal
74%
26%
Men Women
Customer Distribution by Province Age
Benguela Cabinda
Cunene
Kuando Kubango Kuanza Sul
Malange Namibe
Zaire
Luanda
Bié
Kuanza Norte
Huambo Huila
40%
16%
25%
6%
Up to 24 years 25 to 35 years 36 to 45 years
46 to 55 years Over 56 years
5%13%
5%
8%
3%
0%
3%60%
2% 2% 7%0%
3%
2%
Educational Qualifications Profession
27%
7%
4%
1%1%
1%
59%
Primary School Secondary School
Degree
Postgraduate Course
No Schooling
PhD
University Course
17%
20%
50%
Student Civil Servant
No Profession
Other Professions
Doctor
Profession unknown
Teacher
7%
2%2%
2%
Business Sector
General Commerce
Other Sectors
Service ProvisionGeneral ConstructionHotel and RestaurantTransport, Storageand Communication
Education Public Bodies
Mining Extractionor Preparation
Agriculture and Farming
ManufacturingIndustries
3%3%
11%
36%
9%
15%12%
1%2%
7%
2%

COMMITMENT TO PEOPLE| Risk Management
| Regulatory Framework
| Economic and Financial Environment

REP
OR
T A
ND
AC
CO
UN
TS
2014
| R
ISK
MA
NA
GE
ME
NT
72 73
RISK MANAGEMENT
OPERATING RISK DEPARTMENT
The following functions have been assigned to the Operating Risk Department:
a) Conceive and implement policies ensuring efficient monitoring of operating risk;
b) Regularly identify and analyse operating risks associated with each business, transactions, products and services, together with the limits of assigned duties and profiles, proposing appropriate mitigation measures in view of compliance risk from the breach or non-fulfilment of laws, rules, regulations and contractual agreements, together with information systems risk from shortcomings in information technologies in terms of processing, integrity, control, availability and continuity, resulting from inadequate usage or strategies;
c) Monitor and ensure compliance with procedures on opening, blocking and closing accounts, together with extracting and analysing reports on inactive/dormant, unblocked and/or closed accounts;
d) Promote and provide support to structural units responsible for standardizing processes and constantly improving computer applications and procedures, ensuring mechanisms for the prevention and timely detection of fraud and errors;
e) Design an information collection system on events (errors and incidents) related to operating risk, for the purpose of analysing and recording them in a database separated by business activity and catalogued by type of event;
f) Calculate equity requirements to hedge operating risks through basic and standard indicator methods;
g) Control BNI’s pricing schedule;
h) Monitor the implementation of remedial measures for shortcomings related to operating risk, as identified in BNI’s Internal Control System Assessment report;
i) Other functions handed down by hierarchical superiors.
RISK MANAGEMENT DEPARTMENT
The risk management function has existed at BNI since 2014, the year of approval and internal publication of the organic structure manual for the Risk Management Department (DGR). Until this date, the plan to implement the area was underway, with a view to adapt it to comply with BNA Notice no. 2/2013 of 19 April on the issue of internal control.
Being accountable for the risk management function, the DGR’s main mission is to identify, evaluate, monitor, control and provide information on all relevant risks to BNI’s business, pursuant to article 11 of Notice no. 2/2013.
In this context, prior the DGR’s creation, risk from an overall standpoint was not considered in accordance with this Notice, notwithstanding being weighed up and controlled in a relevant manner by first-line organic units, namely the Control and Management Department (DCG), Credit Recovery and Analysis Department (DARC), Compliance Department (DC), Internal Auditing Department (DAI) and International Finance Department (DFI), denoting a general concern for this issue, particularly as regards operating, credit, liquidity, interest rate, foreign exchange and compliance risk.
Risk Department Organizational Chart
Risk Management Division
Credit and Counterparty
Risk Department
Operational Risk Department
Balance Sheet, Market and Interest Rate Risk
Department

REP
OR
T A
ND
AC
CO
UN
TS
2014
| R
ISK
MA
NA
GE
ME
NT
74 75
BALANCE SHEET, MARKET AND RATES RISK DEPARTMENT
The following functions have been assigned to the Balance Sheet, Market and Rates Risk Department:
a) Prepare supporting documentation for the ALCO Committee, by gathering and validating information furnished by the various structural units involved, as well as monitor decisions and policies in this regard;
b) Calculate and analyse liquidity, interest rate and exchange gaps;
c) Create stress tests for main variables impacting the balance sheet (liquidity and interest rate) to monitor and control the liquidity and interest rate ratio;
d) Calculate VaR and stress tests for balance sheet positions in currency to monitor and control exchange risk;
e) Calculate VaR and backtesting of the securities portfolio;
f) Calculate equity requirements to hedge interest rate and exchange risk;
g) Other functions handed down by hierarchical superiors.
CREDIT AND COUNTERPARTY RISK DEPARTMENT
The Credit and Counterparty Risk Department is responsible for monitoring risks tied to the credit portfolio, together with the portfolio’s quality. Its assigned duties include:
a) Provide information on credit risk to managing boards, committees and regulatory authorities;
b) Monitor and maintain credit portfolio risk using databases, computer applications or available files for this purpose;
c) Ensure credit risk maintenance for Customers being monitored, and identify potential warning signs based on the monitoring schedule sent by the Credit Recovery and Analysis Department;
d) Create and periodically update rating/scoring models to classify individual and corporate Customers by risk profile, defining all events affecting the Customer’s profile, together with any other information that may help understand a given Customer’s degree of risk to BNI;
e) Monitor BNI’s exposure to credit risk and respective provisioning, by analysing the suitability of provisions vis-à-vis the quality of the credit portfolio;
f) Analyse the credit portfolio’s performance by means of a scenario study (stress tests), to understand performance in the case of economic crisis, risk events and other situations;
g) Maintain interface needed with the BNA Credit Risk and Information Centre (CIRC) by providing and requesting necessary information on Customer liabilities (individuals and corporate);
h) Other functions handed down by hierarchical superiors.
REP
OR
T A
ND
AC
CO
UN
TS
2014
| R
ISK
MA
NA
GE
ME
NT
76 77
Opportunities for improvement
Improvements within the scope of the risk management function entail full compliance with article 11 of Notice no. 2/2013 of 19 April. In this context, a 2015 action plan is already underway for BNI to fully comply with this notice by the end of this year. Along these lines, a set of activities are planned to fully implement the Risk Management System.
The major challenges ahead include the hiring and specialized training of staff, and implementing consistent and reliable mechanisms for extracting and handling all information to separately identify, control, and comprehensively mitigate all of the bank’s risk events.
2015 action plans
The overall action plan for fully deploying the Risk Management System is scheduled for full final compliance on 31 December 2015, and includes the following phases:
•Implementation of Risk Committee pursuant to BNA Notice no. 2/2013 of 19 April;•Definition of principles and practices providing evidence of risk management in the decision-making
process;•Definition and formalization of methodologies and processes for quantifying risks;•Definition and formalization of stress testing policy;•Definition and formalization of risk limits and action plans;•Formal mechanisms and processes for internal and external reporting in issues involving risk
management.
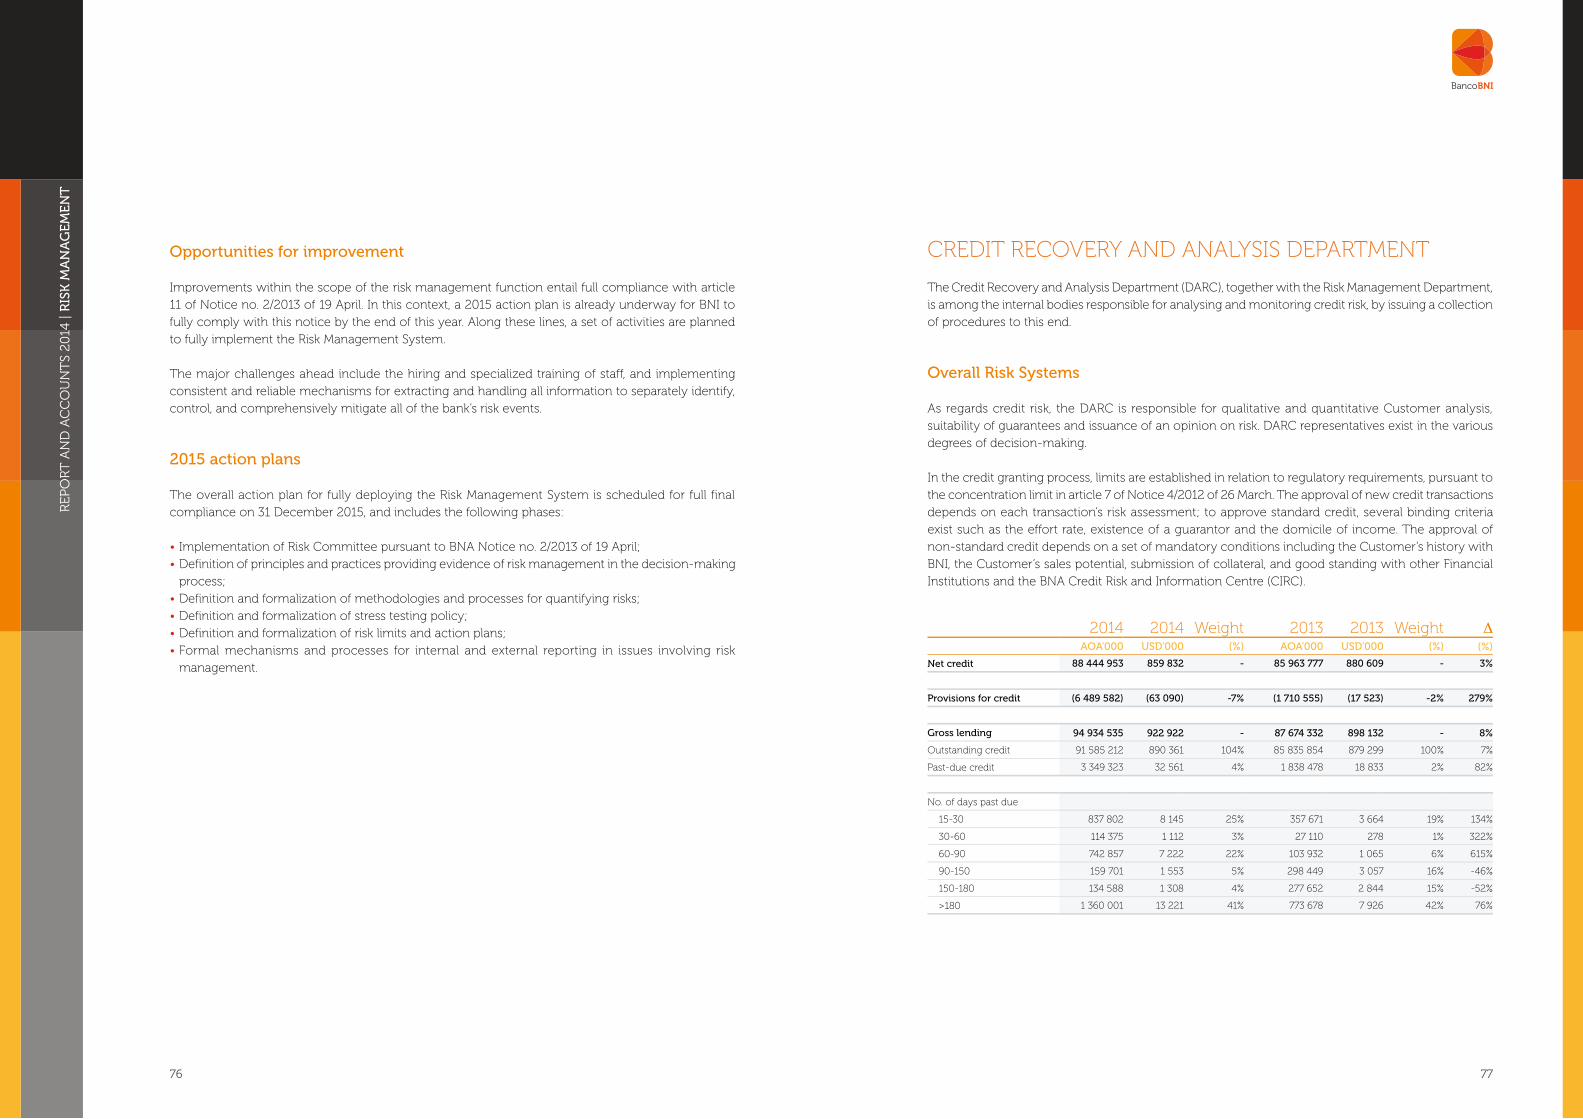
CREDIT RECOVERY AND ANALYSIS DEPARTMENT
The Credit Recovery and Analysis Department (DARC), together with the Risk Management Department, is among the internal bodies responsible for analysing and monitoring credit risk, by issuing a collection of procedures to this end.
Overall Risk Systems
As regards credit risk, the DARC is responsible for qualitative and quantitative Customer analysis, suitability of guarantees and issuance of an opinion on risk. DARC representatives exist in the various degrees of decision-making.
In the credit granting process, limits are established in relation to regulatory requirements, pursuant to the concentration limit in article 7 of Notice 4/2012 of 26 March. The approval of new credit transactions depends on each transaction’s risk assessment; to approve standard credit, several binding criteria exist such as the effort rate, existence of a guarantor and the domicile of income. The approval of non-standard credit depends on a set of mandatory conditions including the Customer’s history with BNI, the Customer’s sales potential, submission of collateral, and good standing with other Financial Institutions and the BNA Credit Risk and Information Centre (CIRC).
2014 2014 Weight 2013 2013 Weight ∆AOA’000 USD’000 (%) AOA’000 USD’000 (%) (%)
Net credit 88 444 953 859 832 - 85 963 777 880 609 - 3%
Provisions for credit (6 489 582) (63 090) -7% (1 710 555) (17 523) -2% 279%
Gross lending 94 934 535 922 922 - 87 674 332 898 132 - 8%
Outstanding credit 91 585 212 890 361 104% 85 835 854 879 299 100% 7%
Past-due credit 3 349 323 32 561 4% 1 838 478 18 833 2% 82%
No. of days past due
15-30 837 802 8 145 25% 357 671 3 664 19% 134%
30-60 114 375 1 112 3% 27 110 278 1% 322%
60-90 742 857 7 222 22% 103 932 1 065 6% 615%
90-150 159 701 1 553 5% 298 449 3 057 16% -46%
150-180 134 588 1 308 4% 277 652 2 844 15% -52%
>180 1 360 001 13 221 41% 773 678 7 926 42% 76%

REP
OR
T A
ND
AC
CO
UN
TS
2014
| R
ISK
MA
NA
GE
ME
NT
78 79
2014 USD’000
Risk Level Outstanding Past-Due Total Provisions Rate of Provisioning
Total 890 361 32 561 922 922 63 090 -
None A 94 885 - 94 885 - 0%
Very low B 568 008 7 067 575 075 7 112 1%
Low C 155 185 10 072 165 257 6 079 3%
Moderate D 12 200 1 011 13 211 8 931 10%
High E 23 702 4 606 28 308 12 434 20%
Very High F 0 2 905 2 905 18 996 50%
Loss G 2 667 6 447 9 114 9 537 100%
Interest receivable 33 714 453 34 167 -
2013 USD’000
Risk Level Outstanding Past-Due Total Provisions Rate of Provisioning
Total 879 299 18 833 898 132 17 523 -
None A 1 452 22 1 475 - 0%
Very low B 827 327 3 392 830 718 9 143 1%
Low C 19 878 4 231 24 109 756 3%
Moderate D 695 1 193 1 889 193 10%
High E 663 3 082 3 744 764 20%
Very High F 1 089 3 123 4 212 2 148 50%
Loss G 1 005 3 424 4 430 4 519 100%
Interest receivable 27 190 366 27 556 -
MONITORING AND CONTROL
Credit limits have been set for the maximum amount that can be approved for a Customer or business group, subject to analysis by the DARC, except for standardized credit, with an internal limit of AOA 5,000,000 (USD 48,608) to be analysed as structured products. For Customers in default and subject to restructuring, the associated criteria entails the reinforcement of guarantees and settlement of past-due interest. For this type of Customer, the higher exposure from restructuring remains limited.
Also with regard to internal reporting, the DARC produces a monthly credit portfolio analytical report for the Board of Directors, for the purpose of making decisions on the portfolio’s general standing. This report presents information on the changes and risk level of provisions, past-due ratio, segmentation of the portfolio, and concentration of exposure by Customer and by currency.
Using the Credit Risk Application (ARC) tool, developed to support portfolio management, the DARC performs an individual analysis of the portfolio by Customer, considering the relevance of exposure of this overall subset, allowing/producing a rating/classification of each Customer pursuant to Notice no. 4/2011 of 08 June. All Customers whose exposure is AOA 50,000,000 (USD 486,083) or higher are considered for the individual analysis.
The resulting classification comes from the completion of a form with a set of qualitative and quantitative questions on the Customer, such as management capacity and quality of internal control, history of on-time and late payments, contingencies, business sector, geographic region, credit limit, nature and purpose of the transaction, and characteristics of guarantees (particularly with regard to their sufficiency and liquidity) and their amount. This analysis is performed annually by the DARC’s recovery team, with the assistance of Sales Management. The final risk classification is reflected in the level of provisions assigned to each Customer, providing control of the level of exposure per major Customer with a higher or lower score or associated risk.
To reduce and control past-due credit and to balance liquidity, the DARC and the Control and Management Department have established criteria for granting credit per branch according to portfolio status parameters in terms of the past-due ratio and concentration ratio. As such, branches with a past-due ratio threshold of 2% of the credit portfolio and a 30% maximum transformation ratio of the deposit portfolio are eligible for granting credit.

REP
OR
T A
ND
AC
CO
UN
TS
2014
| R
EG
ULA
TO
RY
FR
AM
EWO
RK
80 81
PRINCIPAL LIMITS AND PRUDENTIAL RATIOS IN FORCE ON 31 DECEMBER 2014
Liquidity
•Mandatory reserves (Instruction no. 07/2014 of 3 December) – The mandatory reserves ratio to be applied to the daily balances of the items which form the basis of calculation defined in numbers 2 and 3, with the exception of the central Government, local Government and municipalities accounts, is 12.5% for DC and for FC. The mandatory reserves ratio relating to central and local Government and municipalities’ deposits in domestic currency is 100% (foreign currency 100%), and 50% (foreign currency 100%) respectively on these Institutions’ account daily balances.
Credit
•Maximum exposure per Customer (Notice no. 08/07 of 12 September) – Limit of 25% of regulatory equity. The surplus shall be deducted in the calculation of regulatory equity;
•Maximum overall exposure (Notice no. 08/07 of 12 September) – Limit of 300% of the regulatory equity for the 20 biggest debtors.
•Credit in foreign currency (Notice no. 03/12 of 28 March) – No credit in foreign currency permitted for any maturity period for the following purposes: financial assistance for liquidity, including amongst others pledges current accounts, motor car finance, consumer loans, micro credit, advances to depositors or overdrafts and other forms of financial credit of a short-term nature (less than one year);
•Credit provisions (Notice no. 3/12 of 28 March) – Credit granted and guarantees given should be classified according to their ascending order of risk, taking into account the characteristics and risks of the transaction and the borrower. The classification of credit according to risk levels should be reviewed annually, based on the quality of the Customer and as regards the transaction, and monthly as regards any delay noted in the payment of principal or interest.
Equity
•Minimum equity amount (article 75 of Law no. 13/05 of 30 September and Notice no. 4/07 of 12 September) –Equal to the required minimum share capital;
•Legal reserve (article 327 of Law 1/04 of 13 February and art. 76 of Law 15/05 of 30 September) – Reserve constituted by the appropriation of a minimum percentage of net income each year (20%) until the accumulated balance is equal to the total amount of share capital;
•Definition of regulatory equity (Notice No. 5/07 of 12 September and Instruction No. 3/11 of 8 June – (see note 1);
Original own funds (FPB) (Tier 1)To add Article 3.1.1
+Capital
+Share capital monetary revaluation reserve a)
+Retained profits and losses b)
+Special legal reserve and other reserves c)
+Net profit/loss for the current year d)
To deduct Article 3.1.2
-Treasury shares or quotas a)
-Not applicable (Note 1) b)
-Capital type loans c)
-Financial fixed assets d)
-Tax credits arising from tax losses e)
-Intangible assets f) and g)
-Other amounts to be determined by BNI h)
Supplementary own funds (Tier 2) < 100% FPBTo add Article 3.2
+Not applicable (Note 1) a)
+Not applicable (Note 1) b)
+Revaluation reserves - own-use property [(1st) 25% of the FPB and (2nd) < 50% of its value] c)
+ Subordinated debts and hybrid capital instruments [(1st) 50% of the FPB and (2nd) < 50% value div. 5 previous years] d)
+Other funds e)
Note 1: Alteration introduced by Instruction No. 3/11 of 08 June.
REGULATORY FRAMEWORK

REP
OR
T A
ND
AC
CO
UN
TS
2014
| R
EG
ULA
TO
RY
FR
AM
EWO
RK
82 83
RELEVANT FINANCIAL SECTOR REGULATIONS PASSED IN 2014
Date Notices Subject
17 January 01/2014 This notice establishes the procedures for importing and exporting foreign currency and travellers’ cheques to be observed by Financial Institutions.
28 March 02/2014Establishes the minimum information requirements on financial products and services that must be disclosed to the public by financial banking Institutions supervised by Banco Nacional de Angola with registered offices or branches in the national territory.
07 August 03/2014 Amends the wording of article 11 (1) of Notice no. 19/12 of 25 April on the settlment of for-eign exchange transactions for the importing, exporting and re-exporting of merchandise.
07 August 04/2014 Establishes the simplified process for the payment of imported merchandise.
01 October 05/2014 Authorizes the establishment of payment service providers.
01 October 06/2014 This Notice governs the provision of payment services under the Angolan Payment System.
08 October 07/2014This Notice establishes the procedures to be adopted by the National Concessionaire, domestic and foreign investing firms and oil operators, including companies belonging to the Angola LNG Project, in their foreign currency sale transactions.
01 December 08/2014 The purpose of this Notice is to establish the start date for the withdrawal of “1999 Series” notes and coins from circulation;
01 December 10/2014This Notice governs the characteristics and requirements of guarantees for which Financial Institutions are beneficiaries, together with the respective guarantors, for the purposes of being eligible for prudential effects.
17 December 11/2014 This Notice establishes specific requirements for credit transactions performed by the entities referred to in the following article.
01 December 12 /2014 This Notice governs the process of establishing provisions for financial institutions.
18 December 13/2014This Notice establishes the procedures to be followed in the transfer of any profits or dividends abroad to which foreign investors are entitled, pursuant to Law no. 20/11 of 20 May (Private Investment Act).
18 December 14/2014This Notice lays out procedures for the licensing and registry of capital importing, within the scope of private foreign investment undertakings approved under the Private Investment Act.
Date Instructions Subject
19 March 02/2014 Establishes the rules and procedures for registering invisible current transactions in the integrated foreign exchange transaction system (SINOC).
28 March 03/2014This instruction properly adapts foreign exchange market operability mechanisms, particularly in the secondary foreign exchange market, by their nature and relevance to stabilize the national economy.
15 May 04/2014 Establishes mandatory requirements for pricing schedules.
03 October 06/2014 The purpose of this Instruction is to establish limits for the provision of the payment services referred to in article 4 (3), article 17 (1a) and article 27 (6) of Notice no. 6/2014.
03 December 07/2014 Establishes the rules for calculating and complying with mandatory reserves.
Source: Banco Nacional de Angola (BNA)
•Regulatory solvency ratio (Notice No. 05/07 of 12 September, Instruction No. 3/11 of 08 June and Instruction No. 6/07 of 12 September) – The RSR calculation is done in the following manner:RSR = regulatory equity / (Credit risk + (Currency risk and Gold/10%)).The minimum RSR is 10%.
Exchange risk
•Currency conversion (Notice no. 2/09 of 8 May) – The financial statements must recognize every month the effects of the change in the domestic currency’s purchasing power based on the consumer price index (CPI) in case of a change greater (inflation) than 100% in the last 3 (three) years, through the adjustment of the book value of the fixed assets and equity accounts.
•Currency Exposure (Notice No. 05/10 of 10 November and Directive no. 33/DSI/11 of 01 April) – The currency exposure calculation encompasses all asset and liability positions, including off-balance sheet items, up to the limit of 30%, which result in liabilities constituted or indexed to foreign currency and Gold. The limit is 20% of regulatory equity for asset positions (long) and for liability positions (short).
Fixed assets
Fixed assets ratio (Notice No. 07/12 of 30 March) – Net investments in tangible and intangible fixed assets cannot exceed 100% of regulatory equity.

REP
OR
T A
ND
AC
CO
UN
TS
2014
| E
CO
NO
MIC
AN
D F
INA
NC
IAL
EN
VIR
ON
ME
NT
84 85
EXTERNAL ENVIRONMENT
The world economy has given mixed signs with regard to its path towards economic growth. This is not the first time this is happened; after 2008/2009, there have been more differing paces in forecasted GDP growth for the world and its major regions.
The United States of America seems to be resurfacing from its critical phase during the economic recession and international financial crisis of 2009, and is preparing to re-stake its claim as a driver of world economic growth.
The European Union and Euro Zone will continue to see the drivers of their growth stifled in 2015, and incapable of definitively combating the sovereign debt crisis, budgetary deficits and the effects of excessive and overbearing austerity (which increased the level of poverty and number of people in risk of poverty in the peripheral countries of southern Europe) on growth, job creation and the sustainability of social prevention and welfare systems. “The Economist” (Economic Forecast Summary November 2014) predicts GDP growth of just 1.1% in 2015, in the wake of a 0.9% change in 2014.
Source: IMF – World Economic Outlook, November 2014
At the same time, emerging economies have had a number of difficulties in recapturing the spark of the years immediately preceding the 2009 growth crisis. China – currently the main destination of Angolan oil exports – several years ago fell short of its 10% annual average GDP growth, with future prospects now averaging below 7.5%. Brazil – another key partner in Angolan trade relations – has been currently undergoing a period of insignificant growth since 2012, as demonstrated by the rates of 1% and 0.3% in the most recent years. In 2015, according to the International Monetary Fund (World Economic Outlook October 2014), real GDP growth will be around 1.4%.
Source: IMF – World Economic Outlook, November 2014
The African continent is not immune to this reality, not only because its economy is part of globalization – despite deriving few advantages and many inconveniences from this – but also because African economic integration is still a distant reality. In other words, Africa’s foreign dependency has no local counterpart on the continent (an inherent capacity to absorb changes in world production) to offset the most traumatic effects of fluctuations in world trade. The tremendous challenges involved in this international strategy of fighting underdevelopment can be summed up in two figures: to keep current poverty levels from getting worse, the African continent cannot grow less than 5% per year through 2015; if it wants to cut poverty by 50%, it must have sustained growth of 7% to 8% per year1. The real annual changes in its Gross domestic product have not achieved these levels: 6.9% in 2010, 5.1% in 2011, 4.7% in 2012, 4.9% in 2013, 5.2% in 2014 and 5.7% forecasted for 20152.
ECONOMIC AND FINANCIAL ENVIRONMENT
GDP growth rates (%)
World Advanced economies
USA Euro Area Japan UK Canada
2007 2008 2009 2010 2011 2012 2013 2014
-8
-6
-4
-2
0
2
4
6
GDP growth rates in selected emerging economies (%)
2007 2008 2009 2010 2011 2012 2013 2014
Newly industrialised countries Russia China India Brazil South Africa
-10
-5
0
5
10
15
1 Africa Economic Report 2013.2 International Monetary Fund – Regional Economic Outlook, October 2014, Sub-Saharan Africa.
Real growth rates (%)
Sub-Saharan Africa
0.0
2.0
3.0
1.0
4.0
5.0
6.0
7.0
8.0
7.0
5.5
2.6
5.0 5.15.4 5.3 5.4
2007 2008 2009 2010 2011 2012 2013 2014

REP
OR
T A
ND
AC
CO
UN
TS
2014
| E
CO
NO
MIC
AN
D F
INA
NC
IAL
EN
VIR
ON
ME
NT
86 87
THE ANGOLAN ECONOMY
Overview
The fragile groundwork laid for the domestic economy is again being shaken by oil prices on the international markets. Our extraordinary dependency on oil is now showing its more adverse effects on every sector of the domestic economy. From June to December 2014, the average price of a barrel of oil (Brent) fell around 50%, with severe consequences on some of the most important macro--economic aggregates.
Between January and December 2014, oil revenues were $28 billion, $3.12 billion down compared to the same period in 2011. However, this downward trend has repeated itself. According to official data, 2013 saw total tax revenues on the order of $45 billion, while $41.8 billion are expected for 2015, for an average price of $81 per barrel of oil (2015 State Budget). At an average price of $60 per barrel, tax revenues will fall to $32.8 billion, i.e. a total loss of $15.7 billion compared to 2013. These figures are based on average daily production of 1.8 million barrels (10.7% growth for this sector compared to 2014).
Meanwhile, some dark clouds exist with regard to world oil demand. According to BP forecasts, the average annual change in oil demand through 2035 will likely be just 0.8% for a number of reasons, particularly a major slowdown in China’s growth, the completion of essential industrialization processes in key emerging economies, the streamlining of oil consumption in developed and technologically advanced economies, the development of other sources of primary and alternative energy and savings in household use and transportation.
According to Bloomberg, “the difficulties in exporting oil from West Africa (particularly Angola and Nigeria) shows that excess supply is rising instead of going down”, which is consistent not only with the BP data mentioned above, but also with International Energy Agency analyses and projections.
As such, we are at the threshold of a new development model, which must be more endogenous, competitive, inclusive and integrated. This will be the challenge from here forward, where the financial system will play a much more important role than ever before in leveraging economic growth.
Economic activity
The signs of deterioration in national economic activity continued to play out over the year, with consecutive downward revisions of GDP growth. The 2013-2017 National Development plan had an 8% real GDP change in 2014. The International Monetary Fund’s April 2014 World Economic Outlook pointed to a figure of 5.5%. The State Budget’s 2014 Justification Report, however, had an optimistic view on national economic performance, considering the possibility of a rate of 8.8%.
The official (apparently final) estimates now put the real change in GDP at just 4.4% in 2014, down 4.4 percentage points compared to initial Government estimates. Even so, since 2009 there has been a trend line of growth with a negative slope, symbolizing the loss of some of the past’s momentum. During the national economy’s Golden years (2002-2008), average annual GDP growth was 10.2%, considered one of the highest in the world, and occasionally exceeding 20%. The international economic crisis which plunged the world economy into stagnation and depression had impacts on Angola which have yet to be completely absorbed, and are now being aggravated by the performance of the price of oil. Between 2009 and 2014, the average annual change in economic activity fell drastically, coming in at only 3.6%.
Sources: 2015 State Budget National Accounts and Justification Report
0.0
2.0
4.0
6.0
8.0
10.0
12.0
14.0
16.0
Comparison of economic growth
GDP growth rate
2002 2003 2004 2005 2006 2007 2008 2009 2010 2011 2012 2013 2014
Trend line
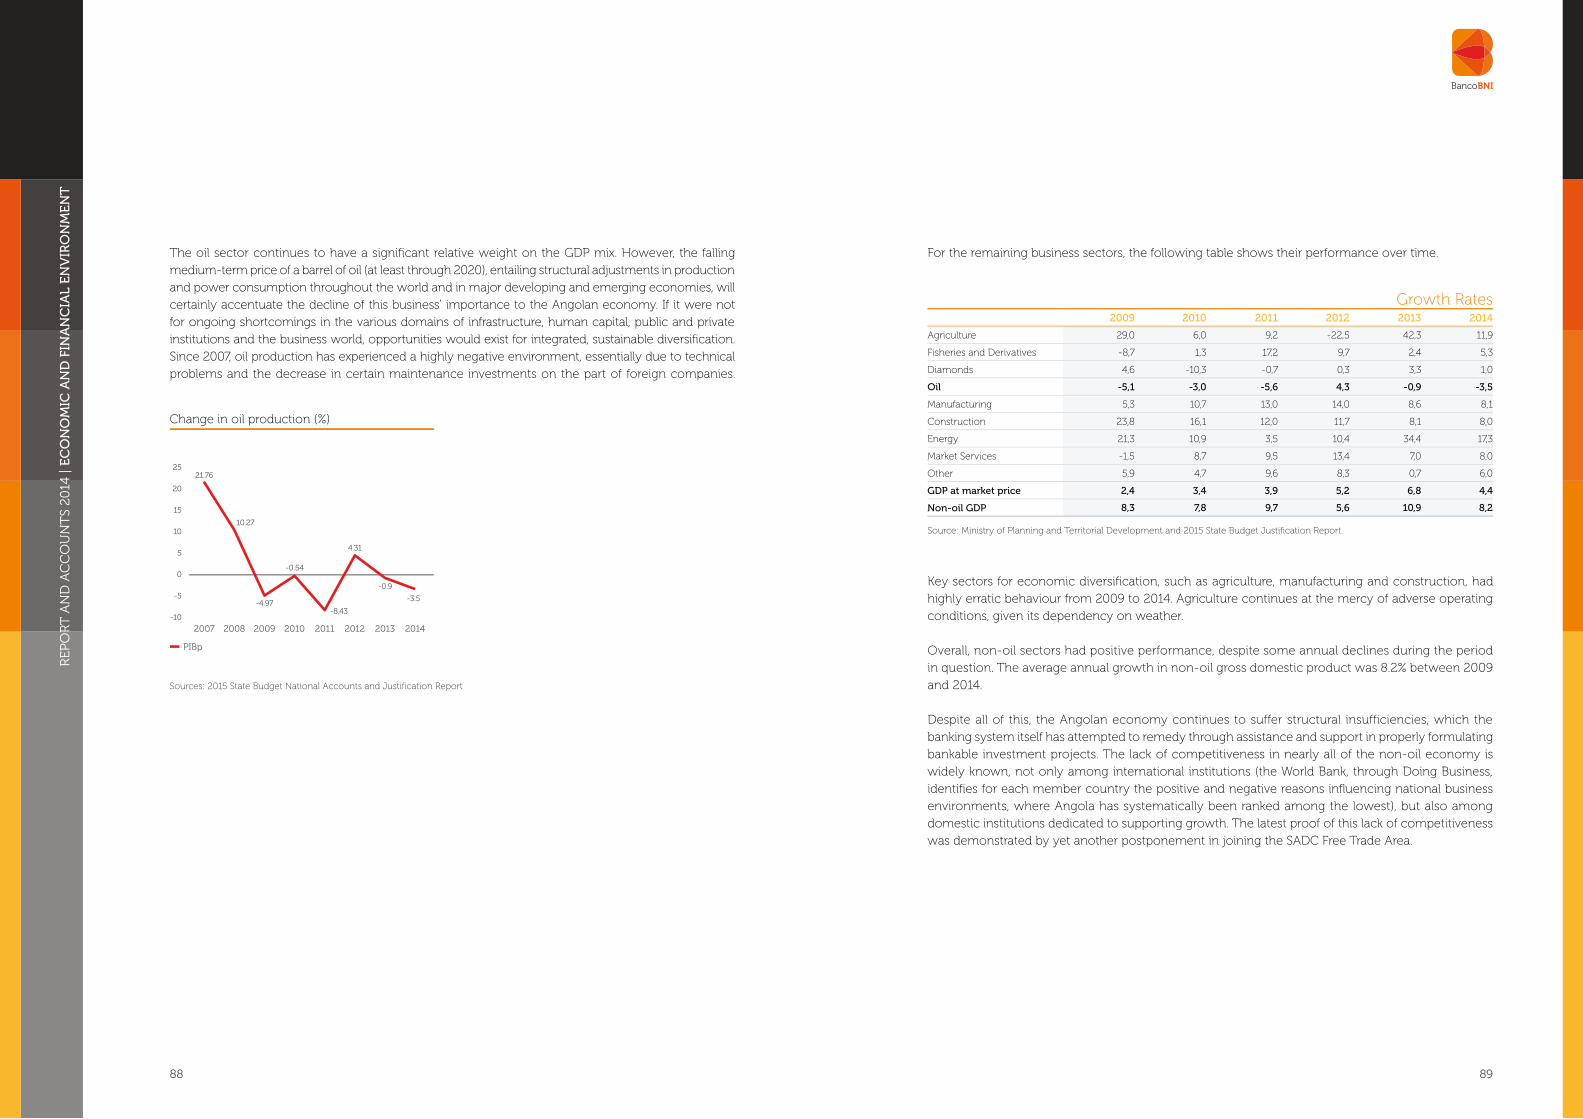
REP
OR
T A
ND
AC
CO
UN
TS
2014
| E
CO
NO
MIC
AN
D F
INA
NC
IAL
EN
VIR
ON
ME
NT
88 89
The oil sector continues to have a significant relative weight on the GDP mix. However, the falling medium-term price of a barrel of oil (at least through 2020), entailing structural adjustments in production and power consumption throughout the world and in major developing and emerging economies, will certainly accentuate the decline of this business’ importance to the Angolan economy. If it were not for ongoing shortcomings in the various domains of infrastructure, human capital, public and private institutions and the business world, opportunities would exist for integrated, sustainable diversification. Since 2007, oil production has experienced a highly negative environment, essentially due to technical problems and the decrease in certain maintenance investments on the part of foreign companies.
Sources: 2015 State Budget National Accounts and Justification Report
For the remaining business sectors, the following table shows their performance over time.
Growth Rates2009 2010 2011 2012 2013 2014
Agriculture 29,0 6,0 9,2 -22,5 42,3 11,9
Fisheries and Derivatives -8,7 1,3 17,2 9,7 2,4 5,3
Diamonds 4,6 -10,3 -0,7 0,3 3,3 1,0
Oil -5,1 -3,0 -5,6 4,3 -0,9 -3,5
Manufacturing 5,3 10,7 13,0 14,0 8,6 8,1
Construction 23,8 16,1 12,0 11,7 8,1 8,0
Energy 21,3 10,9 3,5 10,4 34,4 17,3
Market Services -1,5 8,7 9,5 13,4 7,0 8,0
Other 5,9 4,7 9,6 8,3 0,7 6,0
GDP at market price 2,4 3,4 3,9 5,2 6,8 4,4
Non-oil GDP 8,3 7,8 9,7 5,6 10,9 8,2
Source: Ministry of Planning and Territorial Development and 2015 State Budget Justification Report.
Key sectors for economic diversification, such as agriculture, manufacturing and construction, had highly erratic behaviour from 2009 to 2014. Agriculture continues at the mercy of adverse operating conditions, given its dependency on weather.
Overall, non-oil sectors had positive performance, despite some annual declines during the period in question. The average annual growth in non-oil gross domestic product was 8.2% between 2009 and 2014.
Despite all of this, the Angolan economy continues to suffer structural insufficiencies, which the banking system itself has attempted to remedy through assistance and support in properly formulating bankable investment projects. The lack of competitiveness in nearly all of the non-oil economy is widely known, not only among international institutions (the World Bank, through Doing Business, identifies for each member country the positive and negative reasons influencing national business environments, where Angola has systematically been ranked among the lowest), but also among domestic institutions dedicated to supporting growth. The latest proof of this lack of competitiveness was demonstrated by yet another postponement in joining the SADC Free Trade Area.
Change in oil production (%)
PIBp
-10
-5
0
5
10
15
20
2521.76
10.27
-4.97
-0.54
-8.43
4.31
-0.9
-3.5
2007 2008 2009 2010 2011 2012 2013 2014

REP
OR
T A
ND
AC
CO
UN
TS
2014
| E
CO
NO
MIC
AN
D F
INA
NC
IAL
EN
VIR
ON
ME
NT
90 91
Inflation
Controlling inflation has been one success story in macro-economic adjustment policy, the Government’s main goal being to hold inflation rates to single digits, achieving slightly more than 9% in 2012.
Inflation rates
Months
Percent Change
Monthly Cumulative Year-over-year
2012 2013 2014 2012 2013 2014 2012 2013 2014
January 0,73 0,61 0,76 0,73 6,61 0,76 11,48 8,9 7,84
February 0,69 0,82 0,49 1,42 1,44 1,25 11,32 9,04 7,48
March 0,6 0,66 0,51 2,03 2,11 1,76 11,12 9,11 7,32
April 0,7 0,6 0,51 2,74 2,72 2,28 10,88 9 7,22
May 0,65 0,87 0,62 3,41 3,62 2,91 10,51 9,25 6,95
June 0,68 0,63 0,57 4,11 4,27 3,5 10,11 9,19 6,89
July 0,66 0,57 0,61 4,8 4,81 4,13 10,02 9,04 6,98
August 0,6 0,54 0,6 5,42 5,38 4,75 9,87 8,97 7,05
September 0,55 0,5 0,63 6 5,91 5,42 9,65 8,93 7,19
October 0,91 0,41 0,68 6,97 6,34 6,13 9,76 8,38 7,48
November 0,93 0,52 0,53 7,96 6,89 6,69 9,83 7,94 7,49
December 0,99 0,75 0,73 9,02 7,69 7,48 9,02 7,69 7,48
Source: Ministry of Planning and Territorial Development
Tax Sector
The 2014 public accounts were broadly influenced by the sharp fall of 50% in the international price of oil from June to December. Although the Budgetary Performance Report from last year is not yet available, initial estimates point to an overall deficit of 4.5% of GDP.
The latest estimates point to total revenues of AOA 4,296.6 billion, down 11.4% from 2013. Oil revenues totalled AOA 2,935.8 billion, also lower than the previous year. On the other hand, non-oil revenues were up AOA 1,128.2 billion.
The ratio of Government debt stock in relation to GDP will come in at around 29.2%, with domestic and foreign debt accounting for 11.6% and 17.5% of GDP, respectively.
Monetary Sector, International Reserves and Exchange Rate
BNA’s monetary policy on behalf of the Government has been characterized by restrictiveness to tailor it to the goals of controlling inflation, stabilizing the financial system and preserving the purchasing power of domestic currency. In 2014, changes to the monetary base and means of payment have been aligned with goals of employment and inflation control. As such, in the period under analysis, the M3, M2 and M1 money aggregates expanded 18.45%, 13.49% and 15.01% over 2013. In 2014, the Broad Monetary Base and Base in Domestic Currency are expected to expand 6.1% and 13.72%, respectively.
Monetary Sector Data
Indicators
Rates of Change (%)
2012 20132014
Target Preliminary
CPI (year-over-year) 9,2 7,69 7,5 7,48
M3 9,37 14,33 13,9 18,45
M2 14,13 15,26 12,8 13,49
M1 10,22 16,21 16,7 15,01
Broad Monetary Base 4,36 15,24 11,9 6,1
Domestic Currency Monetary Base 4,73 16,94 18,1 13,72
Source: Banco Nacional de Angola.
In the foreign exchange market, the reference rate saw a slight depreciation in 2014, estimated at 5.3%, going from AOA/USD 97.6 in 2013 to AOA/USD 102.8 in 2014.
International reserves have also been used to help control inflation, against a backdrop of general macro-economic stability, but suffered a serious setback, for the reasons already described, with the systematic fall in the price of oil. According to available information and data, net international reserves (NIR) contracted 8.6% in the third quarter of 2014, going from USD 29.57 billion in the second quarter to USD 27.03 billion in the third quarter of 2014.

REP
OR
T A
ND
AC
CO
UN
TS
2014
| E
CO
NO
MIC
AN
D F
INA
NC
IAL
EN
VIR
ON
ME
NT
92 93
d) GDP growth may ease and employment may rise or, at least, employment may not rise at the rate desired by authorities and by the Angolan people. This is a direct upshot of lower public investment to adjust the fiscal deficit.
e) Accumulating fiscal deficits which are not virtuous (those resulting from expenses for development and potentially increasing GDP) diminish the productivity of the Government administrative machine and put pressure on public debt.
f) The foreign public debt component may be subject to negative validation by foreign, institutional and private investors, in view of fiscal deficits (which lessen the ability to uphold commitments) and the more than likely downward revision of the international country risk classification.
g) A lower international risk coefficient – aggravated by the significant drop in net international reserves (in truth, the country has no alternative sources of supplying or creating foreign reserves) – will inevitably lower the confidence of private foreign investors, causing them to cut their levels of investment or, certainly, their intentions to invest in Angola; this key psychological indicator may result in a negative cascade effect on private investment in the country, including Angolan.
h) Reduction of private foreign investment. Foreign investors normally have medium-term (two to three-year) strategic plans, and keep their intentions unaltered, even with the economic and financial turbulence that may occur during this time. In the case of Angola, however, the medium-term prospects are quite poor, which may result in a revision of foreign companies’ investment plans. Furthermore, in the oil sector, this adjustment will have to happen immediately: offshore oil exploration is only profitable with a crude oil price above $80 per barrel.
i) One must remember that foreign investment is essential, and a determining factor in diversifying the national economy. What truly counts in this process is the diversification of exports (much less that of domestic production), which brings higher competitiveness, the winning of new markets and strengthening of existing ones, streamlined production and so on, which can have a contagious effect on sectors working for the domestic economy.
j) “Threat” of an austerity program led by the IMF. It may bring benefits: higher external credibility of national adjustment program vis-à-vis the crisis, financial assistance for the balance of payments, maintenance of foreign private investment flow, etc. However, this new program monitored by the IMF has a highly negative medium-term reference framework, since the price of oil will likely remain at $60 per barrel or less through 2020.
The following table shows changes in net international reserves and the balance of payments.
Foreign Sector
Indicators 2012 20132014
Target Preliminary
Overall Balance (million USD) 4.643,2 84,21 -522,79 -4.542,28
Trade Balance (million USD) 47.376,34 41.902,56 43.400,08 36.039,41
Balance of Payments and Financing (million USD) -8.883,84 -8.209,32 -8.131,84 -7.981,87
NIR (billion USD) 30,63 30,95 28,76 26,9
NIR (months of importing) 8 8,03 ≥6 6,8
Source: Banco Nacional de Angola.
In 2014, the overall balance of payments was negative due to the less positive current account result, whose balance was insufficient to cover the financial account, resulting in a loss in gross reserves of USD 4,038.2 million.
Final considerations on the consequences of the financial crisis
The revision to the 2015 State Budget, whose base text was approved in December 2014 by the Assembly of the Republic, is proof that the possibility of oil prices falling between USD 40 and USD 50 in 2015 will cause serious adjustments to every area of the state’s financial governance and to many business sectors. These include the following:
a) Currencies (dollar, euro, South African rand, pound sterling) will become much more expensive, limiting the volume of transfers abroad, from every standpoint (salaries of expats, profits, dividends and interest, family support, travel).
b) Imports will become even more expensive, since they are currently experiencing the price effect of the new customs tariff.
c) Inflation will go up, lowering the average purchasing power of income. The containment of rising prices through monetary policy has imposed actual limits due to the need to inject monetary supply into the economy to make it grow. National production still lacks the economic and production efficiency to work with lower costs and lower end-product prices. However, the reduction/elimination of oil derivative pricing subsidies may be an additional factor in higher domestic production costs.

SOUNDNESS OF RESULTS| Financial Review
| Financial Statements
| Opinion of the Auditor
| Opinion of the Board of Auditors

REP
OR
T A
ND
AC
CO
UN
TS
2014
| FI
NA
NC
IAL
REV
IEW
96 97
FINANCIAL REVIEW
2014 saw a downward spiral in the price of a barrel of oil on the international market (more than 50%), with direct impacts on the income in dollars of oil producing countries, including Angola, as sub-Saharan Africa’s second largest producer. In the case of our country, the effect was doubled by a contracting oil business, affected by a production shutdown at some extraction points in the first half of the year.
These events had direct impacts on the Angolan financial system, including decreased access to currencies on the market, the devaluation of domestic currency, and delays in Government payments resulting in higher default among state service providers with credit liabilities in the domestic banking system.
For Banco de Negócios Internacional (BNI), 2014 was marked by a conservative stance in granting credit, measures to remedy the credit portfolio through higher provisions, administrative cost control and the careful management of assets in foreign currencies, without compromising service quality and Customer satisfaction.
Established in 13 provinces with 779 Employees and 85 branches, BNI served a total of 179,083 Customers in 2014. Coupled with careful management and a commitment to best corporate governance practices, these indicators resulted in positive results: more than USD 1,500,000 thousand in Customer resources, net assets of USD 1,964,682 thousand, equity of USD 188,200 thousand, a solvency ratio of 11.38% (14.92% in 2013) and a net profit of USD 13,147 thousand.
2014 BALANCE SHEET BREAKDOWN
ASSETS
In December 2014, the bank’s net assets were AOA 202,093,137 thousand (USD 1,964,682 thousand) compared to AOA 184,175,934 thousand (USD 1,886,690 thousand) in 2013, up 9.73% or AOA 17,917,203 thousand (USD 77,992 thousand), mainly due to credit granted to Customers totalling AOA 88,444,953 thousand (USD 859,832 thousand), accounting for 43.76% (2013: 46.67%) of the bank’s net assets.
The bank’s assets are primarily financed by Customer deposits, with a weight of 77%.
2014 2014 Weight 2013 2013 Weight ∆AOA’000 USD’000 (%) AOA’000 USD’000 (%) (%)
Total Assets 202 093 137 1 964 682 - 184 175 934 1 886 690 - 10%
Cash and Cash Equivalents 29 885 788 290 540 15% 31 438 716 322 057 17% -5%
Amounts owed by credit institutions 16 400 687 159 442 8% 32 040 647 328 223 17% -49%
Securities (held to maturity) 23 611 649 229 545 12% 10 247 433 104 974 6% 130%
Payment system credits 66 970 651 0% 600 6 0% 11065%
Foreign exch. transactions 925 767 9 000 0% 780 948 8 000 0% 19%
Total credit 88 444 953 859 832 44% 85 963 777 880 609 47% 3%
Other assets 14 060 908 136 695 7% 8 094 746 82 922 4% 74%
Fixed assets 28 696 415 278 977 14% 15 609 068 159 899 8% 84%
CASH AND CASH EQUIVALENTS
2014 2014 Weight 2013 2013 Weight ∆AOA’000 USD’000 (%) AOA’000 USD’000 (%) (%)
Cash and Cash Equivalents 29 885 788 290 540 - 31 438 716 322 057 - -5%
Cash 3 929 144 38 198 13% 6 137 012 62 869 12% -36%
Cash and Cash Equivalents at Central Bank 19 894 894 193 412 67% 19 829 601 203 133 43% 0%
Cash and Cash Equivalents at Financial Institutions
6 061 750 58 930 20% 5 472 103 56 055 45% 11%
Cash and cash equivalents were AOA 29,885,788 thousand (USD 290,540 thousand), down 4.94% or AOA -1,552,928 thousand (USD -31,517 thousand), accounting for 14.79% (2013: 17.07%) of net assets.
This was driven by a decrease in the caption Cash, totalling AOA 3,929,144 thousand (USD 38,198 thousand), with a decline of AOA -2,207,868 thousand (USD -24,671 thousand) and a weight of 1.94% (2013: 3.33%) of net assets.
Assets Equity and Liabilities
8%
44%
22%
15%
12%
Cash and Cash Equivalents Amounts Owed by Credit Institutions
Loans to CustomersOther Assets
Securities
77%
3%
2%
10%
7%
Customer Deposits Am. Owed to Credit Institutions
Other Liabilities
Equity
Other amounts owed

REP
OR
T A
ND
AC
CO
UN
TS
2014
| FI
NA
NC
IAL
REV
IEW
98 99
AMOUNTS OWED BY CREDIT INSTITUTIONS
Amounts Owed by Credit Institutions amounted to AOA 16,400,687 thousand (USD 159,442 thousand), down 48.81%, AOA 15,639,960 thousand (USD 168,781 thousand).
Amounts owed by Credit Institutions accounted for 8.12% of the bank’s total assets.
AOA 6,200,000 thousand (USD 60,274 thousand) represent the amount placed in Angolan kwanza, AOA 9,261,442 thousand (USD 90,037 thousand) represent the amount placed in foreign institutions in United States dollars, and AOA 939,244 (USD 9,131 thousand) represent the amount placed in euros.
SECURITIES
BNI’s securities portfolio is comprised of Angolan public debt securities held to maturity amounting to AOA 23,611,649 thousand (USD 229,545 thousand), compared to AOA 10,247,433 thousand (USD 104,974 thousand) in 2013, with a positive year-over-year change of 130.42%, around AOA 13,364,216 thousand (USD 124,570 thousand), accounting for 11.68% (5.56% in 2013) of net assets.
Short-term securities (treasury bills) account for 44.47% of the bank’s securities portfolio, with medium--term securities (treasury bonds) comprising the remaining 55.53%.
With regard to currency, securities in domestic currency (Tbills and readjusted Tbonds and Tbonds indexed to the CPI) represent 96.63% (92.65% in 2013) of the portfolio, while securities denominated in foreign currency (treasury bonds) account for the remaining 3.37% (7.35% em 2013).
The Bank classifies securities in the held-to-maturity category given that it has the intention and financial capability to hold them until the respective maturity.
CREDIT
In December 2014, total credit was AOA 88,444,953 thousand (USD 859,832 thousand), up 2.89% or AOA 2,481,176 thousand (USD (20,778) thousand), year-over-year, accounting for 43.76% of the bank’s net assets.
Gross credit in 2014 was AOA 94,934,535 thousand (USD 922,922 thousand), an increase of 8.28% or AOA 7,260,203 thousand (USD 24,790 thousand) year-over-year.
2014 2014 Weight 2013 2013 Weight ∆AOA’000 USD’000 (%) AOA’000 USD’000 (%) (%)
Total credit 88 444 953 859 832 - 85 963 777 880 609 - 3%
Outstanding and past-due credit 94 934 535 922 922 - 87 674 332 898 132 - 8%
In domestic currency 77 575 760 754 166 88% 67 702 350 693 540 79% 15%
Corporate 71 926 024 699 241 81% 61 187 435 626 802 71% 18%
Individual 5 649 736 54 925 6% 6 514 915 66 738 8% -13%
In foreign currency 13 844 249 134 589 16% 17 282 016 177 036 20% -20%
Corporate 13 180 164 128 133 15% 16 361 306 167 604 19% -19%
Individual 664 085 6 456 1% 920 710 9 432 1% -28%
Interest receivable 3 514 526 34 167 4% 2 689 966 27 556 3% 31%
Provision for doubtful debt (Note 24) (6 489 582) (63 090) -7% (1 710 555) (17 523) -2% 279%
On 31 December 2014, credit in domestic currency was AOA 77,575,760 thousand (USD 754,166 thousand), while credit in foreign currency was AOA 13,844,249 thousand (USD 134,589 thousand), with weights of 87.71% (2013: 78.76%) and 15.65% (2013: 20.10%) of total credit, respectively, reflecting the bank’s efforts to cut exposure to credit in foreign currency.

REP
OR
T A
ND
AC
CO
UN
TS
2014
| FI
NA
NC
IAL
REV
IEW
100 101
LIABILITIES
The bank finished 2014 with liabilities of AOA 182,152,153 thousand (USD 1,770,823 thousand), seeing growth of 11.71%, up AOA 19,094,980 thousand (USD 100,472 thousand) year-over-year.
Liabilities were leveraged by Customer deposits of AOA 155,344,158 thousand (USD 1,510,204 thousand), with a weight of 85.28% (81.87% in 2013), followed by amounts owed to Credit Institutions totalling AOA 15,047,479 thousand (USD 146,287 thousand), with a weight of 8.26% (9.66 in 2013) of the bank’s total liabilities.
On 31 December 2014, past-due credit totalled AOA 3,349,323 thousand (USD 32,561 thousand) compared to AOA 1,838,478 thousand (USD 18,833 thousand) in 2013, up 82.18%, around AOA (1,510,845) thousand (USD (13,728) thousand), for a past-due credit ratio of 3.53% (2.10% in 2013).
In 2014, the ratio of past-due credit covered by provisions for doubtful debt was 193.76%, compared to 93.04% in the same period in 2013.
Credit Quality
2014 2014 Weight 2013 2013 Weight ∆AOA’000 USD’000 (%) AOA’000 USD’000 (%) (%)
Net credit 88 444 953 859 832 - 85 963 777 880 609 - 3%
Provisions for credit (6 489 582) (63 090) -7% (1 710 555) (17 523) -2% 279%
Gross lending 94 934 535 922 922 - 87 674 332 898 132 - 8%
Outstanding credit 91 585 212 890 361 104% 85 835 854 879 299 100% 7%
Past-due credit 3 349 323 32 561 4% 1 838 478 18 833 2% 82%
No. of days past due
15-30 837 802 8 145 25% 357 671 3 664 19% 134%
30-60 114 375 1 112 3% 27 110 278 1% 322%
60-90 742 857 7 222 22% 103 932 1 065 6% 615%
90-150 159 701 1 553 5% 298 449 3 057 16% -46%
150-180 134 588 1 308 4% 277 652 2 844 15% -52%
>180 1 360 001 13 221 41% 773 678 7 926 42% 76%
(*) The weight shown reflects the total credit portfolio net of provisions.
Credit breakdown by sector
86,98%
4,27%
91,86%
1,24%
8,75%6,91%
Business sector
Private sector
Public sector
2014 2013
Breakdown of gross Credit by currency
2014 2013
79,36%
20,64%
85,21%
14,79%
Domestic currency Foreign currency
Specific provisions in 2014 totalled AOA 6,489,582 thousand (USD 63,090 thousand), representing a risk cost of 6.13% (0.79% in 2013) and covering 193.76% of past-due credit (93.04% in 2013), reflecting the focus on improving the quality of the credit portfolio.

REP
OR
T A
ND
AC
CO
UN
TS
2014
| FI
NA
NC
IAL
REV
IEW
102 103
Deposits in foreign currency account for 22.72% (27.74% in 2013) of all deposits, with the remaining 77.28% (72.26% in 2013) comprising deposits in domestic currency, thereby reflecting a decrease in foreign currency deposits vis-à-vis Angolan currency. The Customer deposit transformation ratio was 61.11%, compared to 65.67% in 2013.
Breakdown of Customer Deposits by currency
72,26%
27,74%
77,28%
22,72%
Domestic currency Foreign currency
2014 2013
33,26%
66,74%
34,34%
65,66%
Business sector Private sector
Breakdown of Customer Deposits by sector
2014 2013
2014 2014 Weight 2013 2013 Weight ∆AOA’000 USD’000 (%) AOA’000 USD’000 (%) (%)
Total Liabilities 182 152 153 1 770 823 - 163 057 172 1 670 351 - 12%
Customer deposits 155 344 158 1 510 204 85% 133 499 669 1 367 565 82% 16%
Amounts Owed to Credit Institutions 15 047 479 146 287 8% 15 749 888 161 341 10% -4%
Payment system obligations 292 510 2 844 0% 1 083 198 11 096 1% -73%
Foreign exch. transactions 926 280 9 005 1% 782 904 8 020 0% 18%
Other amounts owed 6 978 676 67 844 4% 5 219 814 53 472 3% 34%
Other obligations 3 016 005 29 321 2% 6 355 123 65 102 4% -53%
Provisions for probable liabilities
547 045 5 318 0% 366 577 3 755 0% 49%
CUSTOMER DEPOSITS
Customer deposits amounted to AOA 155,344,158 thousand (USD 1,510,204 thousand) in 2014, thanks to growth of 16.36% or AOA 21,844,489 thousand (USD 142,639 thousand) year-over-year, accounting for 85.28% of the bank’s total liabilities.
The deposit portfolio is comprised of demand, term and other deposits, with weights of 50.82%, 49.17% and 0.00%, respectively.
Demand deposits were AOA 78,953,163 thousand (USD 767,556 thousand), up 24.09% year-over-year. Term deposits totalled AOA 76,387,297 thousand (USD 742,612 thousand), a year-over-year increase on the order of 9.33%.
Other deposits were AOA 3,698 thousand (USD 36 thousand), up 40.14% year-over-year.
2014 2014 Weight 2013 2013 Weight ∆AOA’000 USD’000 (%) AOA’000 USD’000 (%) (%)
Customer deposits 155 344 158 1 510 204 - 133 499 669 1 367 565 - 16%
Demand deposits 78 953 163 767 556 51% 63 626 375 651 786 40% 24%
Term deposits 76 387 297 742 612 49% 69 870 655 715 752 47% 9%
Other deposits 3 698 36 0% 2 639 27 12% 40%

REP
OR
T A
ND
AC
CO
UN
TS
2014
| FI
NA
NC
IAL
REV
IEW
104 105
RESULT OF FINANCIAL INTERMEDIATION
Year-over-year, the result of financial intermediation was down 19.50% or AOA (2,020,699) thousand (USD (22,817) thousand).
OVERHEAD
Overhead includes staff expenses, third-party supplies, annual amortization and other costs, for a total of AOA 8,170,167 thousand (USD 82,852 thousand) compared to AOA 7,436,305 thousand (USD 77,080 thousand) in 2013, an increase of 9.87% or AOA 733,863 thousand (USD 5,772 thousand).
2014 2014 Weight 2013 2013 Weight ∆AOA’000 USD’000 (%) AOA’000 USD’000 (%) (%)
Administrative and Marketing Costs 8 170 167 82 852 - 7 436 305 77 080 - 10%
Staff expenses 3 085 571 31 290 38% 2 688 542 27 868 31% 15%
Third-party supplies 3 694 664 37 467 45% 3 273 571 33 932 42% 13%
Taxes and fees 86 074 873 1% 110 231 1 141 0% -22%
Penalties 20 493 208 0% 33 968 352 0% -40%
Amortization and depreciation
1 283 366 13 014 16% 1 329 993 13 786 27% -4%
The rise in costs is essentially due to the expansion of the commercial structure, the increase in staff and the wear-and-tear allowance on the bank’s fixed assets.
The cost-to-income ratio was 57.37% compared to 70.17% in 2013.
53,78%
46,22%46,22%
53,78%
Financial Margin Complementary Margin
2014 2013
Breakdown of Banking IncomeFINANCIAL MARGIN
The financial margin in 2014 totalled AOA 6,545,513 thousand (USD 66,377 thousand) compared to AOA 5,944,272 thousand (USD 61,614 thousand) in the same period in 2013, up 10.11% or AOA 601,241 thousand (USD 4,763 thousand).
2014 2014 Weight 2013 2013 Weight ∆AOA’000 USD’000 (%) AOA’000 USD’000 (%) (%)
Financial Margin 6 545 513 66 377 - 5 944 272 61 614 - 10%
Income from financial assets 10 972 568 111 270 - 10 660 824 110 503 - 3%
Income from amounts owed by credit institutions 595 407 6 037 5% 416 227 4 314 0% 43%
Income from securities 1 416 422 14 364 13% 657 705 6 817 9% 115%
Income from credit 8 960 739 90 869 82% 9 586 892 99 372 91% -7%
(-) Costs of financial liabilities (4 427 055) (44 893) - (4 716 552) (48 889) - -6%
Costs of Deposits (3 674 291) (37 260) 83% (3 787 404) (39 258) 80% -3%
Cost of amounts owed to credit institutions (457 969) (4 644) 10% (638 059) (6 614) 12% -28%
Costs of other amounts owed
(294 795) (2 989) 7% (291 089) (3 017) 8% 1%
COMPLEMENTARY MARGIN
The complementary margin was AOA 7,616,064 thousand (USD 77,233 thousand) compared to AOA 5,108,746 thousand (USD 52,954 thousand) in 2013, an increase of 49.08% or AOA 2,507,318 thousand (USD 24,279 thousand) year-over-year.
2014 2014 Weight 2013 2013 Weight ∆AOA’000 USD’000 (%) AOA’000 USD’000 (%) (%)
Complementary margin 7 616 064 77 233 - 5 108 746 52 954 - 49%
Results of negotiations and fair value adjustments - - - - - -
Results of foreign exch. transactions 4 311 565 43 723 57% 2 682 562 27 805 48% 61%
Result of financial service provision
3 304 498 33 510 43% 2 426 184 25 148 52% 36%
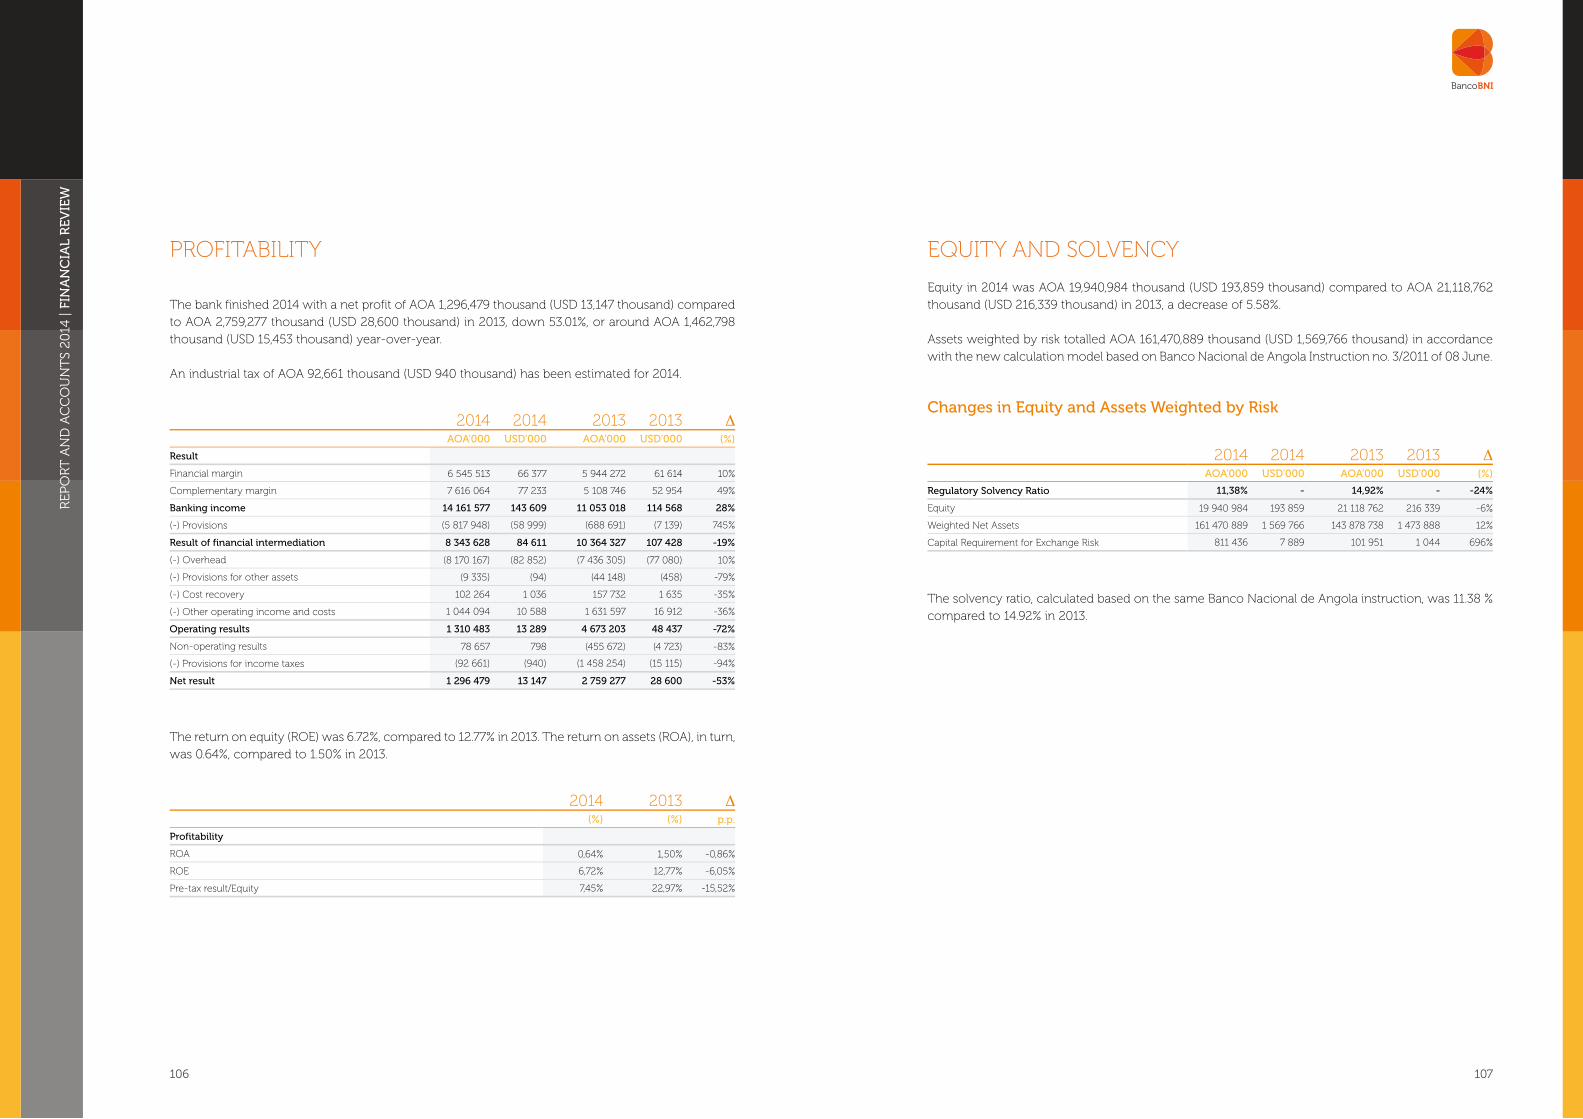
REP
OR
T A
ND
AC
CO
UN
TS
2014
| FI
NA
NC
IAL
REV
IEW
106 107
PROFITABILITY
The bank finished 2014 with a net profit of AOA 1,296,479 thousand (USD 13,147 thousand) compared to AOA 2,759,277 thousand (USD 28,600 thousand) in 2013, down 53.01%, or around AOA 1,462,798 thousand (USD 15,453 thousand) year-over-year.
An industrial tax of AOA 92,661 thousand (USD 940 thousand) has been estimated for 2014.
2014 2014 2013 2013 ∆AOA’000 USD’000 AOA’000 USD’000 (%)
Result
Financial margin 6 545 513 66 377 5 944 272 61 614 10%
Complementary margin 7 616 064 77 233 5 108 746 52 954 49%
Banking income 14 161 577 143 609 11 053 018 114 568 28%
(-) Provisions (5 817 948) (58 999) (688 691) (7 139) 745%
Result of financial intermediation 8 343 628 84 611 10 364 327 107 428 -19%
(-) Overhead (8 170 167) (82 852) (7 436 305) (77 080) 10%
(-) Provisions for other assets (9 335) (94) (44 148) (458) -79%
(-) Cost recovery 102 264 1 036 157 732 1 635 -35%
(-) Other operating income and costs 1 044 094 10 588 1 631 597 16 912 -36%
Operating results 1 310 483 13 289 4 673 203 48 437 -72%
Non-operating results 78 657 798 (455 672) (4 723) -83%
(-) Provisions for income taxes (92 661) (940) (1 458 254) (15 115) -94%
Net result 1 296 479 13 147 2 759 277 28 600 -53%
The return on equity (ROE) was 6.72%, compared to 12.77% in 2013. The return on assets (ROA), in turn, was 0.64%, compared to 1.50% in 2013.
2014 2013 ∆(%) (%) p.p.
Profitability
ROA 0,64% 1,50% -0,86%
ROE 6,72% 12,77% -6,05%
Pre-tax result/Equity 7,45% 22,97% -15,52%
EQUITY AND SOLVENCY
Equity in 2014 was AOA 19,940,984 thousand (USD 193,859 thousand) compared to AOA 21,118,762 thousand (USD 216,339 thousand) in 2013, a decrease of 5.58%.
Assets weighted by risk totalled AOA 161,470,889 thousand (USD 1,569,766 thousand) in accordance with the new calculation model based on Banco Nacional de Angola Instruction no. 3/2011 of 08 June.
Changes in Equity and Assets Weighted by Risk
2014 2014 2013 2013 ∆AOA’000 USD’000 AOA’000 USD’000 (%)
Regulatory Solvency Ratio 11,38% - 14,92% - -24%
Equity 19 940 984 193 859 21 118 762 216 339 -6%
Weighted Net Assets 161 470 889 1 569 766 143 878 738 1 473 888 12%
Capital Requirement for Exchange Risk 811 436 7 889 101 951 1 044 696%
The solvency ratio, calculated based on the same Banco Nacional de Angola instruction, was 11.38 % compared to 14.92% in 2013.

REP
OR
T A
ND
AC
CO
UN
TS
2014
| FI
NA
NC
IAL
STA
TE
ME
NT
S
108 109
BALANCE SHEETon 31 December 2014 and 2013
INCOME STATEMENTFor the years ended 31 December 2014 and 2013
FINANCIAL STATEMENTS
2014 2014 2013 2013Notes AOA’000 USD’000 AOA’000 USD’000
Assets
Cash and Cash Equivalents 3 29 885 788 290 540 31 438 716 322 057
Amounts owed by credit institutions 16 400 687 159 442 32 040 647 328 223
Interbank money market transactions 4 16 400 687 159 442 32 040 647 328 223
Securities 23 611 649 229 545 10 247 433 104 974
Held to maturity 5 23 611 649 229 545 10 247 433 104 974
Payment system credits 6 66 970 651 600 6
Foreign exch. transactions 7 925 767 9 000 780 948 8 000
Total credit 88 444 953 859 832 85 963 777 880 609
Outstanding and past-due credit 8 94 934 535 922 922 87 674 332 898 132
Provision for doubtful debt 8 (6 489 582) (63 090) (1 710 555) (17 523)
Other assets 9 14 060 908 136 695 8 094 746 82 922
Financial fixed assets 10 4 026 967 39 149 3 226 943 33 057
Tangible fixed assets and fixed assets in progress 11 13 428 941 130 552 12 098 254 123 934
Intangible fixed assets 11 11 240 507 109 276 283 870 2 908
Total assets 202 093 137 1 964 682 184 175 934 1 886 690
Liabilities
Deposits 155 344 158 1 510 204 133 499 669 1 367 565
Demand deposits 12 78 953 163 767 556 63 626 375 651 786
Term deposits 12 76 387 297 742 612 69 870 655 715 752
Other deposits 12 3 698 36 2 639 27
Amounts owed to credit institutions 15 047 479 146 287 15 749 888 161 341
Interbank money market transactions 13 15 047 479 146 287 15 749 888 161 341
Payment system obligations 14 292 510 2 844 1 083 198 11 096
Foreign exch. transactions 7 926 280 9 005 782 904 8 020
Other amounts owed 6 978 676 67 844 5 219 814 53 472
Subordinated debt 15 5 225 440 50 800 4 959 881 50 809
Other agreed amounts owed 15 1 753 236 17 044 259 933 2 663
Other obligations 16 3 016 005 29 321 6 355 123 65 102
Prov. for probable liabilities 17 547 045 5 318 366 577 3 755
Total liabilities 182 152 153 1 770 823 163 057 172 1 670 351
Share capital 18 14 642 808 142 353 6 039 104 61 865
Reserves and funds 19 3 568 462 34 691 4 536 729 46 474
Conversion results 2 - (543) - (335)
Potential results (1 154 502) (11 224) - -
Retained earnings 19 2 930 483 28 489 7 869 264 80 612
(-) Treasury Shares 19 (1 342 746) (13 054) (85 612) (877)
Net income for the year 1 296 479 13 147 2 759 277 28 600
Total equity 19 940 984 193 859 21 118 762 216 339
Total equity and liabilities 202 093 137 1 964 682 184 175 934 1 886 690
The accompanying notes are an integral part of the financial statements.
2014 2014 2013 2013Notas AOA’000 USD’000 AOA’000 USD’000
Income from financial assets 10 972 568 111 270 10 660 824 110 503
Income from amounts owed by financial institutions 20 595 407 6 037 416 227 4 314
Income from securities 20 1 416 422 14 364 657 705 6 817
Income from credit 20 8 960 739 90 869 9 586 892 99 372
(-) Costs of financial liabilities (4 427 055) (44 893) (4 716 552) (48 889)
Costs of deposits 21 (3 674 291) (37 260) (3 787 404) (39 258)
Cost of amounts owed to credit institutions 21 (457 969) (4 644) (638 059) (6 614)
Costs of other amounts owed 21 (294 795) (2 989) (291 089) (3 017)
Financial margin 6 545 513 66 377 5 944 272 61 614
Results of foreign exch. transactions 22 4 311 565 43 723 2 682 562 27 805
Result of financial services rendered 23 3 304 498 33 510 2 426 184 25 148
(-) Provisions for doubtful debt and guarantees 24 (5 817 948) (58 999) (688 691) (7 139)
Result of Financial Intermediation 8 343 628 84 611 10 364 327 107 428
(-) Staff 25 (3 085 571) (31 290) (2 688 542) (27 868)
(-) Third-party supplies 26 (3 694 664) (37 467) (3 273 571) (33 932)
(-) Taxes and fees not applicable to result (86 074) (873) (110 231) (1 141)
(-) Penalties from regulatory authorities (20 493) (208) (33 968) (352)
(-) Amortization and depreciation 27 (1 283 366) (13 014) (1 329 993) (13 786)
(-) Provisions for other probable liabilities 28 (9 335) (94) (44 148) (458)
Cost recovery 102 264 1 036 157 732 1 635
Other operating income and costs 29 1 044 094 10 588 1 631 597 16 912
Operating result 1 310 483 13 289 4 673 203 48 437
Non-operating result 30 78 657 798 (455 672) (4 723)
Result before taxes and other fees 1 389 140 14 087 4 217 531 43 715
(-) Current result charges 31 (92 661) (940) (1 458 254) (15 115)
Net income for the year 1 296 479 13 147 2 759 277 28 600
The accompanying notes are an integral part of the financial statements.

REP
OR
T A
ND
AC
CO
UN
TS
2014
| FI
NA
NC
IAL
STA
TE
ME
NT
S
110 111
CHANGES IN EQUITYFor the years ended 31 December 2014 and 2013
AOA’000 Share capital Reserves
Social fund
Potential results
Retained earnings
Total reserves
and funds
Net income for the
yearTreasury
sharesTotal
equity
Balances at 31 December 2012
6 039 104 3 815 671 49 986 - 5 926 612 15 831 373 3 378 526 - 19 209 899
Dividend distribution - - - - - - (713 265) - (713 265)
Social fund establishment - - 46 903 - - 46 903 (46 903) - -
Social fund use - - 51 537 - - (51 537) - - (51 537)
Establishment of reserves - 675 706 - - - 675 706 (675 706) - -
Transfer of 2012 results - - - - 1 942 652 1 942 652 (1 942 652) - -
Treasury Shares - - - - - - - (85 612) (85 612)
Net income for 2013 - - - - - - 2 759 277 - 2 759 277
Balances at 31 December 2013
6 039 104 4 491 377 45 352 - 7 869 264 18 445 097 2 759 277 (85 612) 21 118 762
Capital increase 8 603 704 (1 485 095) - - (7 118 609) - - - -
Social fund use - - (62 621) - - (62 621) - - (62 621)
Establishment of reserves - 551 855 - - - 551 855 (551 855) - -
Use of reserves - - - - - - - -
Transfer of 2013 results - - 27 594 - 2 179 828 2 207 422 (2 207 422) - -
Financial fixed asset exchange variation
31 679 - 31 679 - - 31 679
Treasury Shares - - - (1 186 181) - (1 186 181) - (1 257 134) (2 443 315)
Net income for 2014 - - - - - - 1 296 479 - 1 296 479
Balances at 31 December 2014
14 642 808 3 558 137 10 325 (1 154 502) 2 930 483 19 987 251 1 296 479 (1 342 746) (19 940 984)
USD'000 Share capital Reserves
Social fund
Potential results
Retained earnings
Total reserves
and funds
Net income for the
yearTreasury
sharesTranslation
reserveTotal
equity
Balances at 31 December 2012
63 022 39 818 522 - 61 848 165 209 35 404 - (148) 200 466
Dividend distribution - - - - - - (7 474) - - (7 474)
Social fund establishment - - 492 - - 492 (492) - - -
Social fund use - - (540) - - (540) - - - (540)
Establishment of reserves - 7 081 - - - 7 081 (7 081) - - -
Transfer of 2012 results - - - - 20 357 20 357 (20 357) - - -
Currency devaluation (1 157) (890) (9) - (1 593) (3 650) - - (187) (3 816)
Treasury Shares - - - - - - - (877) - (897)
Net income for 2013 - - - - - - 28 600 - - 28 600
Balances at 31 December 2013
61 865 46 009 465 - 80 612 188 951 28 600 (877) (335) 216 339
Capital increase 83 642 (15 393) - - (73 787) (5 538) - - - (5 538)
Social fund use - - (649) - - (649) - - - (649)
Establishment of reserves - 5 720 - - - 5 720 (5 720) - - -
Use of reserves - - - - - - - - - -
Potential results - - - - - - - - - -
Transfer of 2013 results - - 285 - 22 595 22 881 (22 881) - - -
Financial fixed asset exchange variation
- - - 328 - 328 - - - 328
Currency devaluation (3 154) (1 745) (1) 743 (931) (5 088) - 854 (208) (4 442)
Treasury Shares - - - (12 295) - (12 295) - (13 031) - (25 326)
Net income for 2014 - - - - - - 13 147 - - 13 147
Balances at 31 December 2014
142 353 34 591 100 (11 224) 28 489 194 309 13 147 (13 054) (543) (193 859)
The accompanying notes are an integral part of the financial statements.

REP
OR
T A
ND
AC
CO
UN
TS
2014
| FI
NA
NC
IAL
STA
TE
ME
NT
S
112 113
CASH FLOW STATEMENTFor the years ended 31 December 2014 and 2013
2014 2014 2013 2013AOA’000 USD’000 AOA’000 USD’000
I Financial Margin Cash Flow (I+II) 4 863 422 4 601 246 49 319 47 135
II Income Received from Financial Assets (1+2+3+4) 9 346 399 9 567 857 94 780 98 013
1 Income Received from Amounts Owed by Credit Institutions 107 808 41 172 1 093 422
2 Income Received from Securities 1 102 412 747 283 11 179 7 655
4 Income Received from Credit 8 136 179 8 779 402 82 507 89 936
III Expenses Paid from Financial Liabilities (5+6+7+8+9) (4 482 977) (4 966 611) (45 461) (50 878)
5 Expenses Paid from Deposits (3 733 547) (4 072 817) (37 861) (41 722)
6 Expenses Paid from Amounts Owed to Credit Institutions (457 969) (605 799) (4 644) (6 206)
7 Expenses Paid from Securities Funding - - - -
8 Expenses Paid from Derivative Financial Instruments - - - -
9 Expenses Paid from Other Amounts Owed (291 461) (287 995) (2 956) (2 950)
IV Cash Flow from Results of Negotiations and Fair Value Adjustments - - - -
V Cash Flow from Results of Foreign Exchange Transactions 4 311 565 2 682 510 43 723 27 480
VI Cash Flow from Results of Financial Service Provision 3 304 498 2 426 184 33 510 24 854
VII Cash Flow from Results of Insurance Plan, Capitalization and Supplementary Health - - - -
VIII Operating Cash Flow from Financial Intermediation (I+IV+V+VI+VII) 12 479 485 9 709 940 126 552 99 468
IX Cash Flow of Results from Merchandise, Products and Other Services - - -
10 Payments of Administrative and Marketing Costs (6 842 856) (5 696 193) (69 392) (58 352)
11 Payments of Other Expenses on Result - (1 458 254) - (14 938)
12 Cash Flow from Settlement of Transactions in Payment System (968 360) (1 148 539) (9 820) (11 766)
13 Cash Flow from Other Assets and Obligations (4 849 945) 1 826 076 (49 182) 18 706
14 Income Received from Financial Fixed Assets - - - -
15 Cash Flow from Other Operating Costs and Income 1 110 428 1 631 597 11 261 16 714
X Payments and Receipts of Other Operating Costs and Income (10+11+12+13+14+15) (11 550 733) (4 845 313) (117 133) (49 635)
XI Cash Flow from Operations (VIII+IX+X) 928 752 4 864 627 9 418 49 833
16 Cash Flow from Amounts Owed by Credit Institutions 2 343 917 (26 364 551) 23 769 (270 077)
17 Cash Flow from Investments in Securities (13 050 206) 2 571 496 (132 339) 26 342
18 Cash Flow from Investments in Derivative Financial Instruments - - - -
19 Cash Flow from Investments in Foreign Exchange Transactions (144 819) (6 782) (1 469) (69)
20 Cash Flow from Investments in Credit (7 284 789) (9 741 327) (73 873) (99 790)
XII Cash Flow from Investments in Financial Intermediation (16+17+18+19+20) (18 135 897) (33 541 164) (183 912) (343 594)
XIII Cash Flow from Investments in Other Assets - - - -
21 Cash Flow from Investments in Fixed Assets (5 456 647) (1 314 428) (55 335) (13 465)
22 Cash Flow from Results of Disposal of Fixed Assets 415 352 - 4 212 -
23 Cash Flow from Other Non-operating Gains and Losses 38 587 (455 672) 391 (4 668)
XIV Cash Flow from Fixed Assets (21+22+23) (5 002 708) (1 770 100) (50 731) (18 133)
XV Cash Flow from Investments (XII+XIII+XIV) (23 138 605) (35 311 264) (234 644) (361 727)
24 Cash Flow from Financing with Deposits 21 903 745 8 397 477 222 121 86 023
25 Cash Flow from Financing with Amounts Owed to Credit Institutions (702 409) 9 548 838 (7 123) 97 818
26 Cash Flow from Financing with Securities Funding - - - -
27 Cash Flow from Financing with Derivative Financial Instruments - - - -
28 Cash Flow from Financing with Foreign Exchange Transactions 143 376 6 749 1 454 69
29 Cash Flow from Financing with Other Amounts Owed 1 755 528 (54 715) 17 802 (560)
XVI Cash Flow from Financial Intermediation Financing (24+25+26+27+28+29) 23 100 240 17 898 349 234 254 183 350
XVII Cash Flow from Minority Shareholder Financing - - - -
30 Receipts from Capital Increases - - - -
31 Payments from Capital Decreases - - - -
32 Dividend Payments - (713 265) - (7 307)
33 Receipts from Disposal of Treasury Shares - 2 677 301 - 27 426
34 Payments for Acquisition of Treasury Shares (2 443 315) (2 762 913) (24 777) (28 303)
XVIII Cash Flow from Equity Financing (30+31+32+33+34) (2 443 315) (798 877) (24 777) (8 184)
XIX Cash Flow from Financing with Other Obligations - - - -
XX Cash Flow from Financing (XVI+XVII+XVIII+XIX) 20 656 925 17 099 472 209 477 175 166
Balance of Cash and Cash Equivalents at Start of Period 31 438 716 44 785 881 318 813 458 785
Balance of Cash and Cash Equivalents at End of Period (Note 3) 29 885 788 31 438 716 303 065 322 057
Changes in Cash and Cash Equivalents (XI+XV+XX) (1 552 928) (13 347 165) (15 748) (136 728)
The accompanying notes are an integral part of the financial statements.

REP
OR
T A
ND
AC
CO
UN
TS
2014
| FI
NA
NC
IAL
STA
TE
ME
NT
S
114 115
NOTES TO THE FINANCIAL STATEMENTS
For the years ended 31 December 2014 and 2013
1. Incorporation and business
Banco de Negócios Internacional, S.A., hereinafter referred to as the Bank, with registered office in Luanda, is a privately owned bank incorporated on 2 February 2006, whose corporate purpose is banking activities, pursuant to and within the limits of Angolan law. Commercial operations commenced on 13 November 2006.
2. Main accounting policies
2.1 Basis of presentation
The accompanying financial statements were prepared on a going concern basis from the books and records kept by the Bank, in accordance with the accounting principles prescribed in the Chart of Accounts for Financial Institutions (CONTIF), pursuant to Instruction no. 09/2007 of 19 September of Banco Nacional de Angola (“BNA”), which entered into force on 01 January 2010 and subsequent amendments, namely Directive no. 04/ DSI/2011, which prescribes the obligation to adopt the International Financial Reporting Standards (IFRS) in all matters relating to the accounting procedures and criteria which are not covered by the CONTIF. These principles may differ from those generally accepted in other countries.
CONTIF aims to standardize accounting records and financial disclosures and bring them into line with international practices through the convergence of accounting principles with the International Financial Reporting Standards (IFRS).
The financial statements presented here reflect the results of the Bank’s operations for the years ended 31 December 2014 and 2013, and have been prepared on a going-concern and accrual basis, whereby items are recognized as assets, liabilities, equity, income and costs when they meet the definitions and recognition criteria for these items contained in the conceptual framework, in conformity with the qualitative characteristics of understandability, relevance, materiality, faithful representation, true and fair view, substance over form, neutrality, prudence, completeness and comparability.
BNI’s financial statements for the year ended 31 December 2014 were approved by the Board of Directors on 30 March 2014.
The accounting policies presented in this note have been applied consistently in all the periods of the financial statements now presented.
The Bank’s financial statements on 31 December 2014 and 2013 are expressed in thousands of kwanza, pursuant to BNA Notice no. 15/2007, article 5, while assets and liabilities denominated in foreign currency have been converted using the indicative exchange rate published by Banco Nacional de Angola pursuant to accounting policy 2.2 b).
The financial statements have been prepared in thousands of kwanza (AOA’000) in conformity with the historical cost convention and in accordance with the accounting principles and standards of the Chart of Accounts for the Banking System as prescribed by Banco Nacional de Angola.
In order to disclose the financial statements on the basis of a universal comparison, the financial statements are also presented in thousands of United States dollars (USD’000), in accordance with the following conversion policy.
The AOA/USD exchange rates used in preparing the financial information in USD are as follows:
Year ending Average rate Closing rate
31.12.13 96.475 97.619
31.12.14 98.612 102.863
The financial statements expressed in AOA have been converted into USD using the following exchange rates:
•Closing rate – for all assets, liabilities and equity;•Average rate – for the income statement.
The currency differences arising from the conversion into USD have been included in the equity caption “Conversion reserve”.

REP
OR
T A
ND
AC
CO
UN
TS
2014
| FI
NA
NC
IAL
STA
TE
ME
NT
S
116 117
REP
OR
T A
ND
AC
CO
UN
TS
2014
| FI
NA
NC
IAL
STA
TE
ME
NT
S
116 117
Notes to the Financial Statements
Spot currency position
The spot currency position in each currency corresponds to the net balance of the assets and liabilities expressed in that currency, as well as spot transactions pending settlement and forward transactions maturing in the following two business days. The spot currency position is reassessed daily based on the average exchange rate published by BNA on that date, giving rise to an entry in the currency position account (domestic currency), with a corresponding entry in the income statement.
Forward currency position
The forward currency position in each currency corresponds to the net balance of the forward transactions pending settlement, excluding those maturing in the following two business days. All the contracts relating to these transactions (currency forwards) are revalued at market forward exchange rates or, in their absence, by means of their calculation based on the interest rates applicable to the residual maturity of each transaction. The difference between the counter values in kwanza at the forward revaluation rates applied, and the counter values at the contracted rates, which represent the cost or income or the forward currency position revaluation cost, is recorded under the asset or liability captions “Foreign exchange transactions”, with a corresponding entry in the income statement.
c) Credit
Classification of credit
Credit granted to Customers entails financial assets recorded at the contracted values when originated by the Bank, or at the amounts paid when acquired from other entities.
The interest component is subject to separate accounting disclosure in the respective balance sheet accounts, with the respective income accrued/deferred over the life of the credit transactions, regardless of when it is received or paid.
Credit is recorded at its initial amount, net of repayments and impairment losses.
Liabilities relating to bank guarantees are recorded in off-balance sheet accounts at the amount at risk, while the flows of interest, commissions or other income are recorded in income statement captions over the life of the transactions.
2.2 Accounting policies
The principal accounting policies used in preparing the financial statements are as follows:
a) Accrual Accounting
Income and costs are recognized in the period to which the transactions refer, in accordance with the accrual accounting principle, and recorded when they are due, irrespective of the moment of their receipt or payment.
Income is deemed to be realized when: a) in transactions with third parties, the payment is made or a firm commitment is assumed to make it; b) in the discharge, partial or total, of a liability, regardless of the reason, without the simultaneous disappearance of an asset of an equal or greater amount; c) in the natural generation of new assets, irrespective of the involvement of third parties; or d) in the actual receipt of donations and subventions.
Costs, in turn, are deemed to be incurred when: a) the corresponding asset value ceases to exist by transferring ownership thereof to a third party; b) by the diminution or elimination of the economic value of an asset; or c) by the emergence of a liability without the corresponding asset.
b) Transactions in foreign currency
Transactions in foreign currency are recorded in accordance with the multi-currency system, whereby each transaction is recorded on the basis of the currencies involved. Transactions in foreign currency are converted based on the exchange rate ruling on the transaction date (transaction exchange rate). Monetary assets and liabilities denominated in foreign currency are converted using the exchange rate ruling on the balance sheet date.
Income and costs arising from asset and liability transactions indexed to the currency variation (not realized in foreign currency) are recorded in the accounts representing the income or cost of the placement or deposit-taking made.
Non-monetary assets and liabilities, except for financial holdings, are recorded at historical cost.
Non-monetary assets and liabilities recorded at historical cost, acquired in foreign currency, are converted into kwanza at the exchange rate published by BNA on the transaction date.
On their contracting date, purchases and sales of spot and forward foreign currency are immediately recorded in the spot or forward currency position, per the following contents and valuation criteria:

REP
OR
T A
ND
AC
CO
UN
TS
2014
| FI
NA
NC
IAL
STA
TE
ME
NT
S
118 119
REP
OR
T A
ND
AC
CO
UN
TS
2014
| FI
NA
NC
IAL
STA
TE
ME
NT
S
118 119
Notes to the Financial Statements
The reclassification of credit to a lower risk category according to the decrease in the delay is limited to the level established in the initial classification or stemming from the monthly evaluation.
For credit granted to Customers for periods of more than two years, the time elapsed since the entry into default is considered to be double that relative to the time period referred to above.
Provision for doubtful debt and guarantees given
Provisions for doubtful debt are designed to cover the potential risks existing in the credit portfolio, including bank guarantees, and are set monthly, resulting from the product stemming from the application of provisioning percentages to the book value of each credit, thereby considering the amount receivable from the borrower, plus the income and charges of whatever nature not received, including those stemming from currency variation, if applicable.
The minimum provisioning levels to be applied to each credit transaction, according to the relevant risk level in which it is classified, are the following:
Risk Levels A B C D E F G
Minimum provisioning percentage 0% 1% 3% 10% 20% 50% 100%
Elapsed time since the date of defaultUp to 15
days15 to 30
days1 to 2
months2 to 3
months3 to 5
months5 to 6
monthsMore than 6 months
Provisions for doubtful debt calculated in this manner ensure compliance with the requirements laid down by BNA Notice no. 3/2012 of 28 March.
Provisions for credit granted are classified under assets, in the caption “Provision for doubtful debt” (Note 8), while provisions for guarantees given and import documentary credits not guaranteed at balance sheet date are presented on the liabilities side, under the caption “Provisions for probable liabilities on guarantees given” (Note 17).
Credit written off
Six months after the classification of a transaction under Class G, provided that it is in arrears for more than 180 days, the Bank writes this credit off from assets and utilizes the respective provision (transfer of credit to losses). Additionally, this credit remains recorded in an off-balance sheet caption for a minimum of ten years.
Since the entry into force of Notice no. 4/2011 of 08 June, as revoked by Notice no. 3/2012 of 28 March, lending transactions by way of cash disbursement must be granted in domestic currency for all entities, with exception of the State and companies with proven revenues and receipts in foreign currency, for the following purposes:•Financial assistance for liquidity, including, amongst others, the pledged current accounts;•Automobile financing;•Consumer loans;•Micro credit;•Advances to depositors or overdrafts;•Other types of financial credit of a short-term nature (less than one year).
Customer credit transactions, including bank guarantees, are classified according to their risk and subject to provisioning in accordance with BNA Notice no. 3/2012 of 28 March, which revoked BNA Notice no. 4/2011 of 08 June, concerning the methodology and classification of credit granted to Customers and the calculation of the respective provisions.
Pursuant to Notice no. 3/2012, the Bank classifies credit and bank guarantee transactions by ascending order of risk, according to the following levels:
Level Risk
A None
B Very Low
C Low
D Moderate
E High
F Very High
G Loss
Credit transactions which record default are classified according to the risk levels associated with the loan falling due and overdue of each transaction on the financial reporting date, considering for this purpose the classification attributed in the loan granting phase and the age of the default, respectively.
The classification of credit transactions to the same Customer, for purposes of the setting aside of provisions, is done in the class which presents the greatest risk.
The review and reclassification of an transaction’s risk level stem from the assessment made at the Bank, taking into consideration the risk perception associated with the credit transaction and the existence of any guarantees which serve as collateral for the debt at the Bank.
Notwithstanding the review described above, the classification of credit transactions is reviewed monthly according to the time elapsed since the transactions’ date of entry into default.

REP
OR
T A
ND
AC
CO
UN
TS
2014
| FI
NA
NC
IAL
STA
TE
ME
NT
S
120 121
REP
OR
T A
ND
AC
CO
UN
TS
2014
| FI
NA
NC
IAL
STA
TE
ME
NT
S
120 121
Notes to the Financial Statements
Similarly, the Bank classifies securities in ascending order of risk, in the following levels:
Level Risk
A None
B Very Low
C Low
D Moderate
E High
F Very High
G Loss
The Bank classifies Angolan State and Banco Nacional de Angola debt securities as falling under Level A.
Trading securities
Trading securities are those which are acquired for the purpose of being actively and frequently traded.
Securities held for trading are initially recognized at acquisition cost, including costs directly attributable to the asset’s acquisition. Subsequently, they are stated at fair value, while the respective income or loss arising from the revaluation is recognized in the income statement for the period.
Available-for-sale securities
Available-for-sale securities are those securities which are capable of eventually being sold and which do not fall under any other category.
They are initially recorded at acquisition cost, and then subsequently stated at fair value. The changes in fair value are recorded under equity, while gains are recognized in the income statement of the period in which the definitive sale of the asset occurs.
Securities held to maturity
Securities held to maturity are those which are acquired for the purpose of holding them in portfolio until their maturity, provided that the Bank has the financial means to do so.
Securities held to maturity are recorded at their acquisition cost plus income earned during their maturity term (including the accrual of interest and the premium/discount recognized in the income statement), with the Bank recognizing any future profits or losses calculated on the maturity date corresponding to the difference between the realized price and the respective book value.
Renegotiation of credit
Transactions subject to renegotiation are kept at least at the same risk level at which they were classified in the month immediately prior to the renegotiation. The reclassification to the lower risk class only occurs if there is a regular and substantial repayment of the liabilities. The gains or losses resulting from the renegotiation are not recorded until they are actually received.
Recovery of credit
In the situations in which there are recoveries of credit previously written off from assets by utilization of the provision, the amounts received are recorded under the caption “Non-operating net income”.
Appropriation of income
The Bank cancels interest in arrears for more than 60 days, as well as not recognizing interest with effect from that date, for credit transactions in default until such time as the Customer remedies the situation.
d) Securities
Classification of securities
Securities acquired by the Bank are recorded at the amount actually paid, including brokerage and fees. The Board of Directors decides the classification of its investments on initial recognition, in one of the following categories, taking into consideration the characteristics of the securities and their intention when they were acquired:
i.Trading securities;
ii.Available-for-sale securities;
iii.Securities held to maturity.
The income generated by securities relating to interest earned over the period until maturity or declared dividends must be recognized directly in the income statement for the period, regardless of the category they were classified under, while that relating to shares acquired less than six months ago must be recognized as a credit in the appropriate account where the corresponding acquisition cost is recorded.

REP
OR
T A
ND
AC
CO
UN
TS
2014
| FI
NA
NC
IAL
STA
TE
ME
NT
S
122 123
REP
OR
T A
ND
AC
CO
UN
TS
2014
| FI
NA
NC
IAL
STA
TE
ME
NT
S
122 123
Notes to the Financial Statements
Transfer of securities between categories
Transfers from one category to another can only occur for an exceptional reason, not habitual, non-recurring and which could not be reasonably anticipated, occurring after the classification date, with the documentation which served as the basis for the reclassification being kept available for the BNA duly accompanied by an explanation of the reasons by the Bank’s Board of Directors.
The eventual transfer to another category must take into account the Bank’s intention and financial means and must be effected at the security’s market value, while also observing the following procedures:
1) in the event of the transfer of a trading security to another category, it is not possible to reverse the amounts already recorded in the income statement derived from unrealized gains or losses;
2) in the event of the transfer of available-for-sale securities, unrealized gains and losses recorded as a separate component of equity must be recognized in the income statement for the period:
i. immediately, when transferred to the trading securities category;
ii. according to the remaining period to maturity, when transferred to the category held-to-maturity securities;
3) in the event of the transfer from the held-to-maturity securities category to other categories, the unrealized gains and losses must be recognized:
i. immediately in the income statement for the period, when transferred to the trading securities category;
ii. as a separate component in equity, when transferred to the category of available-for-sale securities.
Impairment
Impairment losses of a permanent nature in securities must be recognized immediately in the income statement of the period, ensuring that the adjusted amount stemming from the recognition of the aforesaid losses constitutes the new base value for the purposes of the appropriation of income.
In the case of the eventual sale of securities classified in the held-to-maturity category before redemption, any profits or losses arrived at on the date of sale representing the difference between the sale price and their book value must be recorded.
The Bank cannot classify any securities in the held-to-maturity category if, during the current financial year or in any other of the preceding two financial years, it sold or reclassified a substantial part of them before their maturity, except the cases where the acquisition costs of the securities plus the income earned do not represent a significant difference relative to the market value.
Central Bank Bonds and Treasury Bills are issued at the discounted value and recorded at their acquisition cost. The difference between this and nominal value - which constitutes the Bank’s remuneration - is recognized in the accounts as income over the period between the purchase date and the securities’ maturity date, in a separate account entitled “Income receivable”.
Treasury Bonds issued in local currency indexed to the United States dollar exchange rate are subject to currency revaluation. The result of the currency revaluation of the security’s nominal amount, the discount and the accrued interest, is reflected in the income statement of the period in which it occurs under the caption “Income from securities”.
Treasury Bonds issued in domestic currency indexed to the Consumer Price Index (CPI) are subject to the revaluation of the security’s nominal value according to that index’s variation. In this manner, the result of the aforesaid revaluation of the security’s nominal value and the accrued interest are reflected in the income statement of the year in which it occurs, under the caption “Income from securities”.
Market value
The methodology used by the Bank for arriving at the securities’ market value (fair value) is as follows:
i) Average trading price on the calculation day or, when not available, the average trading price of the previous business day;
ii) Probable net realizable value arrived at by the adoption of an internal valuation technique or model;
a.Price of a similar financial instrument, taking into consideration at the very least the payment and maturity periods, the credit risk and the currency or benchmark; and
iii) Price laid down by Banco Nacional de Angola.
In the case of securities with a maturity of less than one year for which there is no price in an active market with regular transactions, and which have minimal maturities, these are valued on the basis of the acquisition cost because this is deemed to be the best approximation to their market value.
REP
OR
T A
ND
AC
CO
UN
TS
2014
| FI
NA
NC
IAL
STA
TE
ME
NT
S
124 125
REP
OR
T A
ND
AC
CO
UN
TS
2014
| FI
NA
NC
IAL
STA
TE
ME
NT
S
124 125
Notes to the Financial Statements
In situations in which valuation by the equity method is not applicable, financial fixed assets are recorded at acquisition cost, net of provisions for losses.
When this is denominated in foreign currency, it is subject to revaluation, with the result of this currency revaluation being reflected under a specific caption of equity.
Holdings in other companies
Investments in other companies are deemed to be investments in companies in which the Bank holds, directly or indirectly, less than 10% of the respective voting capital.
Investments in other companies are valued at acquisition cost, net of a provision for losses.
The income derived from these investments relating to dividends declared, must be included directly in the income statement for the period. Investments acquired with proposed dividends and not yet paid (ex-dividend) must have these dividends recognized as an acquisition cost, with a corresponding entry in the respective income statement account for the period.
When this is denominated in foreign currency, it is subject to revaluation, with the result of this currency revaluation being reflected under a specific caption of equity.
Other investments
This caption includes rights of any nature not classified in the other asset captions, or in tangible or intangible fixed assets, such as the art collection.
f) Intangible and tangible fixed assets
Intangible fixed assets
Intangible assets correspond essentially to expenditure on key money, organization and expansion, improvements to leasehold properties and software, whenever the Bank can demonstrate that these will generate future economic benefits. These expenses are recorded at acquisition cost and amortized on a straight-line basis every month over a period of three years, with the exception of leasehold improvements which are amortized over the expected term of the rental contract or over their useful lives if less.
e) Financial fixed assets
Investments in associated and similar companies
Investments in associated and similar companies are deemed to be those investments in companies in which the Bank holds, directly or indirectly, an interest of 10% or more of the respective voting capital, but without controlling it.
The Bank applies the equity method for valuing its holdings in associated and similar companies in the following situations:
a) when the equity investments have a group relationship; or
b) when the equity holdings are important and the Bank has influence in their management, or when the percentage of the investment, direct or indirect, represents 20% (twenty per cent) or more of the investee company’s voting capital.
An investment in a company is deemed to be in a group relationship when control is exercised over the company, reflected by way of an operational control, in cases where they have a common administration or management, or by a corporate control, when control is obtained through the sum of the percentage held directly by the Bank, by its directors, controllers and affiliated companies.
A participating interest is deemed to be important when:
a) Its book value is 10% or more of the Bank’s equity; or
b) The book value of the various associated companies, when considered jointly, is 15% or more than the Bank’s equity.
According to the equity method, financial fixed assets are initially recorded at acquisition cost and subsequently adjusted according to the changes observed after the acquisition in the Bank’s proportional interest in the net assets of the investee companies concerned. The Bank’s results include its share in the net income/loss of those companies.
In addition, the Bank must set aside a provision for losses when there is a negative shareholders’ equity situation and it is the bank’s intention to maintain its financial support for the company.
The equity method ceases to be applied to the participating interest in associated and similar companies where there is actual and clear evidence that they are no longer going concerns or in cases where these are operating under severe long-term restrictions which significantly jeopardize their ability to transfer resources to the investor.

REP
OR
T A
ND
AC
CO
UN
TS
2014
| FI
NA
NC
IAL
STA
TE
ME
NT
S
126 127
REP
OR
T A
ND
AC
CO
UN
TS
2014
| FI
NA
NC
IAL
STA
TE
ME
NT
S
126 127
Notes to the Financial Statements
In evaluating the degree of impairment, the institution must consider at the very least the following indications:
1) significant decline in the value of an asset, more than expected from its normal use;
2) significant changes in the technological, economic or legal environment, with adverse effects for the Bank;
3) increase in interest rates or other market rates, with effects on discount rates and consequent decrease in the present value or on the recoverable amount of assets;
4) book value of net assets greater than the market value;
5) evidence available of obsolescence or loss of an asset’s physical capacity;
6) significant alterations in the manner the asset is used, with discontinuity or restructuring, with adverse effects for the Bank;
7) indication that the asset’s economic performance is worse than expected.
h) Reserve for monetary indexation of fixed assets and own funds
Pursuant to Banco Nacional de Angola Notice no. 2/2009 of 08 May relating to inflation indexation, which revokes Notice no. 19/2007 of 26 September, Financial Institutions must, in the case where inflation exists, take into account every month the effects of changes in the purchasing power of the local currency, based on the application of the Consumer Price Index, on fixed assets and on the balances of capital, reserves and retained earnings.
The financial statements of an entity whose functional currency is the currency of a hyperinflationary economy must be expressed in terms of the current measurement unit at balance sheet date. Hyperinflation is indicated by the characteristics of the economic environment of a country which includes, but without limiting, the following situations:
i. The population in general prefers to keep its wealth in non-monetary assets or in relatively stable foreign currency. The amounts of the local currency held are immediately invested in order to maintain purchasing power;
ii. The population in general sees monetary quantities in terms of stable foreign currency. Prices must be quoted in that currency;
iii. Credit sales and purchases take place at prices which compensate for the expected loss in purchasing power during the credit period, even where the period is short;
iv. Interest rates, salaries and prices are linked to a price index; and
v. The accumulated inflation rate during the last 3 years is close to or exceeds 100%.
Tangible fixed assets
Tangible fixed assets are recorded at acquisition cost, with their revaluation pursuant to applicable legal provisions being permitted.
Depreciation is calculated using the straight-line basis at the maximum rates accepted for tax purposes, in accordance with the Industrial Tax Code, which correspond to the following estimated useful lives:
Years of useful life
Properties for own use (Buildings) 50
Equipment:
Furniture and fittings 10
Machines and tools 4 e 10
Computer equipment 6
Interior fixtures 10
Transport equipment 3
Security equipment 10
Fixed assets in progress, which essentially correspond to buildings and branches/service centres under construction and the respective furnishings, are recorded at acquisition costs, with their depreciation commencing when the respective buildings and branches/service centres come operational.
g) Decrease in the recoverable amount of other assets (Impairment)
The Bank periodically values its assets, especially on the occasion of the preparation of the financial statements, with a view to identifying assets which present a recoverable value below that of their book value. The recognition of the decrease in the book value (impairment) of an asset occurs whenever its book value exceeds its recoverable amount, with a corresponding charge in the income statement.

REP
OR
T A
ND
AC
CO
UN
TS
2014
| FI
NA
NC
IAL
STA
TE
ME
NT
S
128 129
REP
OR
T A
ND
AC
CO
UN
TS
2014
| FI
NA
NC
IAL
STA
TE
ME
NT
S
128 129
Notes to the Financial Statements
j) Income tax
The Bank is subject to Industrial Tax, and is considered to be a Group A taxpayer. Its income is taxed pursuant to article 4 (1) of Law no. 19/14 of 22 October. The tax rate applicable is currently 30%, in accordance with this law, which established a transitional scheme in adopting the new Industrial Tax Code.
The tax losses computed in a particular year can, pursuant to article 46 of the Industrial Tax Code, be deducted from the taxable profits of the subsequent three years.
Tax returns are subject to review and correction by the tax authorities during a period of 5 years, and due to different interpretations of tax legislation, could result in corrections to the taxable profits relating to the 2010 to 2014 financial years. However, no correction relating to those years is expected to be made and, if they do occur, the expected impacts on the financial statements are not expected to be material.
Income from public debt securities resulting from Treasury Bonds and Treasury Bills issued by the Angolan Government, whose issuance is governed by the Direct Public Debt Framework Law (Law no. 16/02 of 05 December), together with Regulatory Decrees no. 51/03 and 52/03 of 08 July, are exempt from all taxes. This is complemented by the provisions of article 23 (1c) of the Industrial Tax Code, which expressly states that returns from any Angolan public debt security are not considered income for the purposes of determining the Industrial Tax payable. As such, these returns were deducted from taxable profits in determining the taxable income for the years ending 31 December 2014 and 2013.
Current taxation
Current taxation is calculated based on the taxable income for the year, which differs from the accounting profit due to adjustments resulting from costs or income which are not considered for tax purposes or which are only considered in other accounting periods.
Deferred taxation
Deferred taxation corresponds to the impact on taxation recoverable/payable in future periods resulting from temporary differences deductible or taxable between the balance sheet value of assets and liabilities and their tax base, utilized in the computation of taxable income. Deferred tax assets and liabilities are calculated based on the tax rates in force for the period in which the respective asset or liability is expected to be realized. Tax loss carry-forwards also give rise to deferred tax assets.
The amount resulting from the inflation indexation of fixed assets must be reflected monthly to the credit of the account “Result of monetary indexation”, with a corresponding entry to the gross values and accumulated depreciation of the relevant fixed assets.
The value resulting from the monetary indexation must be reflected monthly to the debit of the income statement account “Result of monetary indexation”, with a corresponding entry increasing the equity balances, with the exception of the caption “Share capital”, which must be classified in a specific caption (“Reserve for monetary indexation of share capital”) and which can only be utilized for a subsequent capital increase.
In 2013 and 2012, the Bank did not carry out the monetary indexation of its financial fixed assets and its equity on the grounds that the current inflation rate, as well as the behaviour of the currency which occurred throughout the period, did not indicate that Angola could be considered as being a hyperinflationary economy in terms of prevailing legislation.
i) Employee benefits
Retirement pension liabilities
Law no. 07/04 of 15 October, which revokes Law no. 18/90 of 27 October, which regulates Angola’s social security system, envisages the granting of retirement pensions to all Angolan workers enrolled in Social Security. The amount of the pensions is calculated based on a table proportional to the numbers of years worked, applied to the average of the monthly gross salaries earned in the periods immediately prior to the date on which the worker ceased to work. Pursuant to Decree no. 7/99 of 28 May, the contribution rates to this system are 8% for the Employer and 3% for the Employee.
In addition, according to Law 2/2000 and articles 218 and 262 of the General Labour Law, the compensation payable by the Bank in the event of the expiry of the employment contract due to the Employee’s retirement is calculated by multiplying 25% of the basic monthly salary earned on the date on which the worker reaches the legal retirement age by the number of years’ service.
Variable remuneration paid to Employees and directors
The Bank pays variable remuneration to its Employees and directors based on their performance (performance bonuses). The Board of Directors is responsible for setting the respective allocation criteria for each Employee and director whenever this is awarded. The variable remuneration awarded to Employees and directors is recorded in the income statement of the period to which they refer, notwithstanding being payable in the following year.
Provision for holiday pay and related subsidy
The General Labour Law, in force on 31 December 2014, provides that the amount of the holiday subsidy payable to Employees in a particular year is a right acquired by them in the immediately preceding year. Consequently, the Bank discloses in the accounts of the year the amounts relating to holiday pay and related subsidy payable in the following year (Note 16).
REP
OR
T A
ND
AC
CO
UN
TS
2014
| FI
NA
NC
IAL
STA
TE
ME
NT
S
130 131
REP
OR
T A
ND
AC
CO
UN
TS
2014
| FI
NA
NC
IAL
STA
TE
ME
NT
S
130 131
Notes to the Financial Statements
k) Provisions and contingencies
Provisions
Provisions represent probable liabilities with estimated time periods and amounts. Provisions are recognized when (i) the Bank has a present, legal or constructive obligation, (ii) it is probable its payment will be demanded and (iii) when a reliable estimate can be made of the amount of this obligation. The amount of the provision corresponds to the best estimate of the amount to be disbursed in order to settle the liability at the balance sheet date.
Contingent liabilities
Should the Bank have an obligation in which it is unlikely that there will be a future outflow of resources, then there is a contingent liability. Contingent liabilities are only subject to disclosure, unless the possibility of its materialization is remote.
Contingent liabilities are recognized in off-balance sheet accounts when (i) the Bank has a possible present obligation the existence of which will be confirmed only by the occurrence or not of one or more future events which are not under the bank’s control; (ii) a present obligation arising from past events, but which is not recognized because it is not probable that the Bank will have to settle it or the amount of the obligation cannot be measured with adequate assurance.
Contingent liabilities are revalued periodically to determine if the previous valuation continues to be valid. If it is probable that an outflow of resources will be required for an item previously treated as a contingent liability, a provision is recognized in the financial statements of the period in which the change in the estimate of the probability occurs.
Contingent assets
A contingent asset is a possible present asset arising from past events, the existence of which is confirmed by the occurrence or not of one or more future events which are not totally under the institution’s control. Contingent assets are only the object of disclosure and recognition in off-balance sheet accounts, unless the possibility of their materialization is remote.
Contingent assets must be revalued periodically for determining whether the initial evaluation remains valid. If it is practically certain that an inflow of resources will occur on account of an asset, where such inflow was previously classified as probable, the asset and the corresponding gain must be recognized in the financial statements of the period in which the change in the estimate occurs.
Deferred tax liabilities are normally recorded for all taxable timing differences, while deferred tax assets are only recognized providing that it is probable that there will be sufficient future taxable profit against which the corresponding tax loss or credit carry-forwards can be utilized. In addition, deferred tax assets are not recognized in cases in which their recoverability is questionable due to other situations, including issues relating to the interpretation of prevailing tax legislation.
Nevertheless, deferred tax assets or liabilities relating to timing differences originating from the initial recognition of assets and liabilities in transactions which do not affect the accounting net income/loss or taxable income are not recorded.
Tax reform
Within the scope of the tax reform currently underway, an important set of new tax laws was recently published in the Official Gazette (Diário da República), along with significant changes to other existing codes with their subsequent republication, namely:
•Industrial Tax Code (passed by Law no. 19/14 of 22 October);
•Capital Investment Tax Code (passed by Presidential Legislative Decree no. 2/14 of 20 October);
•Stamp Duty Code (passed by Presidential Legislative Decree no. 3/14 of 21 October);
•Employment Income Tax Code (Law no. 18/14 of 22 October);
•Tax Enforcement Code (passed by Law no. 20/14 of 22 October);
•General Tax Code (passed by Law no. 21/14 of 22 October);
•Collective Investment Undertaking Tax Scheme (passed by Presidential Legislative Decree no. 1/14 of 13 October).
Due to its importance, the existence of a transitional scheme should be noted; under this scheme, there is a new Industrial Tax rate of 30% applicable to 2014, as previously mentioned, together with the same withholding rates of 3.5% and 5.25% for contractors, subcontractors and service provision, respectively, for this same year.

REP
OR
T A
ND
AC
CO
UN
TS
2014
| FI
NA
NC
IAL
STA
TE
ME
NT
S
132 133
REP
OR
T A
ND
AC
CO
UN
TS
2014
| FI
NA
NC
IAL
STA
TE
ME
NT
S
132 133
Notes to the Financial Statements
3. Cash and Cash Equivalents
The caption Cash and cash equivalents comprises:
2014 2014 2013 2013AOA’000 USD’000 AOA’000 USD’000
Cash and Cash Equivalents 29 885 788 290 540 31 438 716 322 057
Cash and Cash Equivalents Central Bank 23 824 038 231 610 25 966 613 266 002
Cash 3 929 144 38 198 6 137 012 62 869
Domestic notes and coins 3 344 680 32 516 5 221 102 53 485
Foreign notes and coins 584 464 5 682 915 910 9 384
In United States dollars 325 845 3 168 703 692 7 209
In Euros 207 284 2 015 182 113 1 866
In Rand 6 403 62 7 088 73
In Pounds 44 932 437 23 017 236
Deposits at Central Bank 19 894 894 193 412 19 829 601 203 133
Domestic currency 13 953 576 135 652 14 269 318 146 174
Foreign currency 5 941 318 57 760 5 560 283 56 959
In United States dollars 5 941 318 57 760 5 560 283 56 959
Cash and Cash Equivalents at Financial Institutions 6 061 750 58 930 5 472 103 56 055
At domestic credit institutions 57 531 559 78 900 808
Outstanding cheques 57 531 559 78 900 808
At foreign credit institutions 6 004 219 58 371 5 393 203 55 247
Demand deposits 6 004 219 58 371 5 393 203 55 247
In United States dollars 5 542 373 53 881 5 209 217 53 363
In Euros 387 482 3 767 181 696 1 861
In Rand 39 0 680 7
In Pounds 74 325 723 1 610 16
The caption Deposits at the Central Bank includes the balance at Banco Nacional de Angola for the purpose of complying with the minimum cash reserve requirements in domestic and foreign currency.
l) Recognition of income resulting from services and commissions
Commissions for services rendered are normally recognized as income over the period the service is rendered or once only, if they result from the execution of single acts.
m) Earnings per share
Earnings per share are calculated by dividing the net income attributable to the Bank’s shareholders by the weighted average number of ordinary shares in circulation in the year, excluding the average number of ordinary shares bought by the Bank and held as treasury stock.
If the earnings per share calculation were to be altered as the result of an issue at a premium or a discount or other event which alters the potential number of ordinary shares or changes in accounting policies, the calculation of the earnings per share for all the periods presented is adjusted retrospectively.
n) Principal estimates and uncertainties associated with the application of accounting policies
The Bank’s accounts incorporate estimates made under conditions of uncertainty, thereby requiring the Board of Directors to use judgement in order to arrive at the appropriate estimate.
Accordingly, in certain situations the estimates made by the Bank’s Board of Directors could be different if a different judgement were made. The Board of Directors is of the opinion that the criteria adopted are appropriate and that the financial statements present a true and fair view of the Bank’s financial position and that of its operations in all material aspects.
Estimates and assumptions have been utilized, namely in the significant areas of provisions for doubtful debt, provisions for probable liabilities and income tax.
o) Cash Flow
For purposes of preparing the cash flow statement, the Bank regards as being cash and deposits the total of the balances on cash items, cash and cash equivalents at the Central Bank and amounts owed by Financial Institutions.
p) Setting-off of balances
The items of assets and liabilities must be valued separately, with the set-off of balances between debit and credit balances, including income statement accounts, not being permitted, with the exception of set-offs relating to inter-departmental or inter-branch operations or others prescribed by Banco Nacional de Angola.
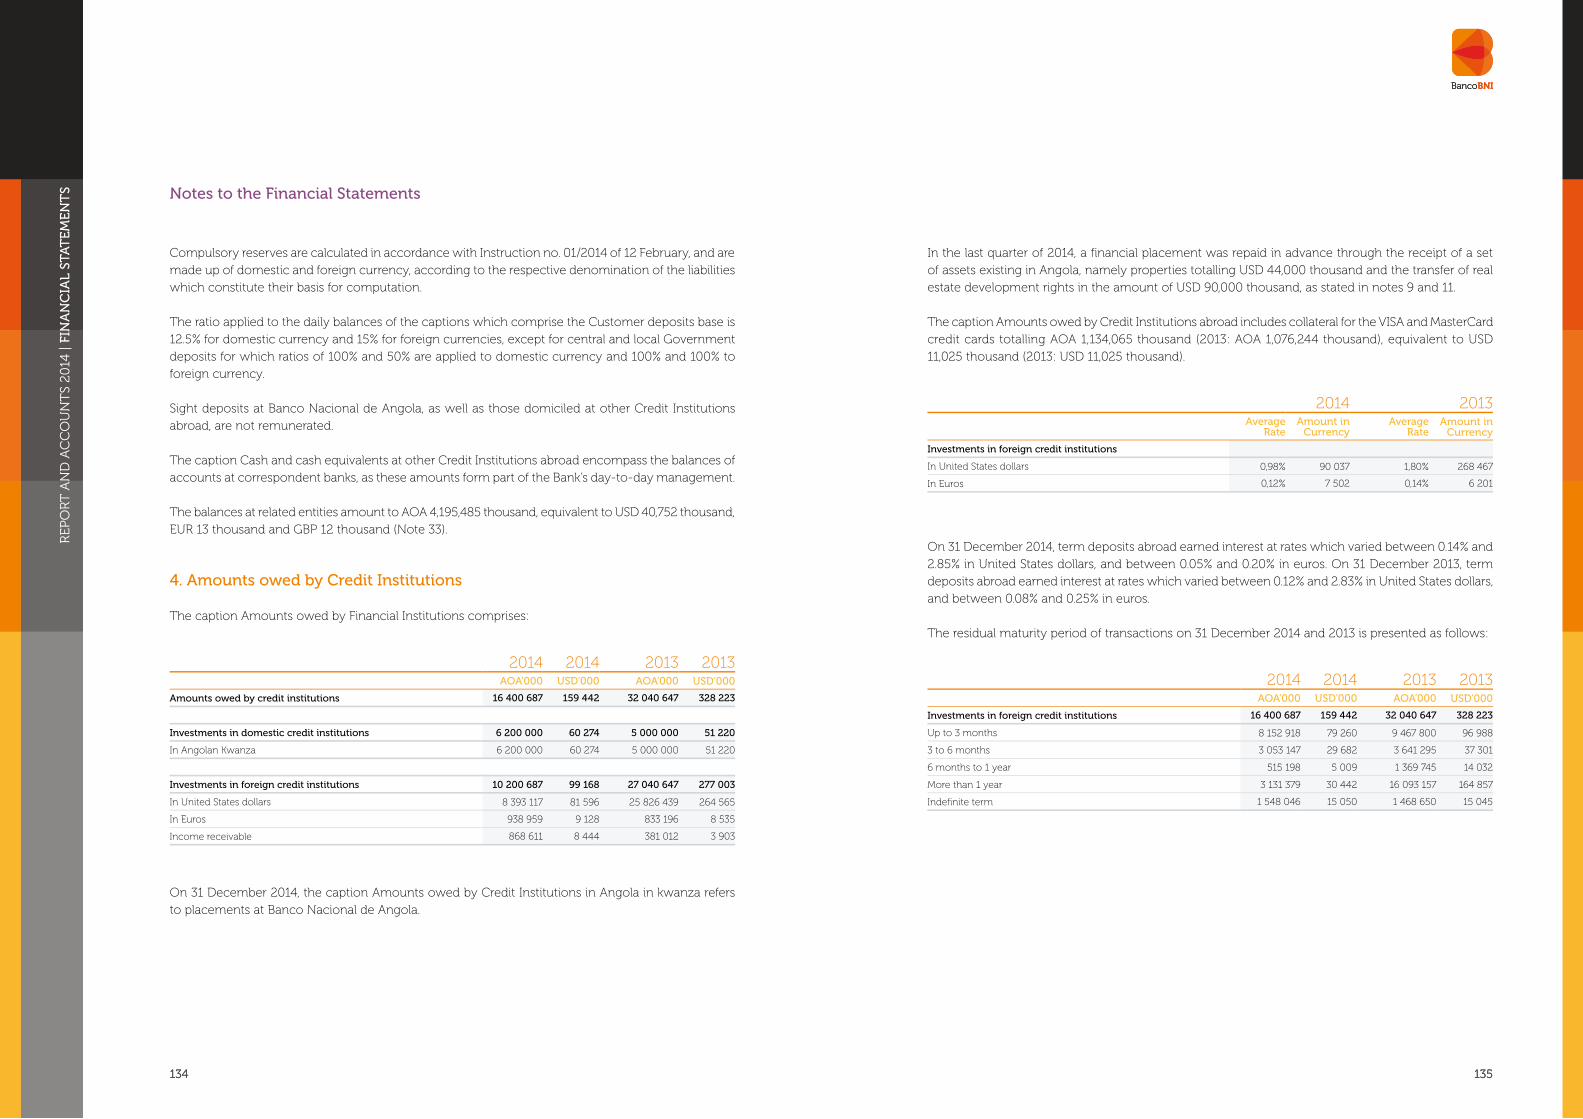
REP
OR
T A
ND
AC
CO
UN
TS
2014
| FI
NA
NC
IAL
STA
TE
ME
NT
S
134 135
REP
OR
T A
ND
AC
CO
UN
TS
2014
| FI
NA
NC
IAL
STA
TE
ME
NT
S
134 135
Notes to the Financial Statements
In the last quarter of 2014, a financial placement was repaid in advance through the receipt of a set of assets existing in Angola, namely properties totalling USD 44,000 thousand and the transfer of real estate development rights in the amount of USD 90,000 thousand, as stated in notes 9 and 11.
The caption Amounts owed by Credit Institutions abroad includes collateral for the VISA and MasterCard credit cards totalling AOA 1,134,065 thousand (2013: AOA 1,076,244 thousand), equivalent to USD 11,025 thousand (2013: USD 11,025 thousand).
2014 2013Average
RateAmount in
CurrencyAverage
RateAmount in
Currency
Investments in foreign credit institutions
In United States dollars 0,98% 90 037 1,80% 268 467
In Euros 0,12% 7 502 0,14% 6 201
On 31 December 2014, term deposits abroad earned interest at rates which varied between 0.14% and 2.85% in United States dollars, and between 0.05% and 0.20% in euros. On 31 December 2013, term deposits abroad earned interest at rates which varied between 0.12% and 2.83% in United States dollars, and between 0.08% and 0.25% in euros.
The residual maturity period of transactions on 31 December 2014 and 2013 is presented as follows:
2014 2014 2013 2013AOA’000 USD’000 AOA’000 USD’000
Investments in foreign credit institutions 16 400 687 159 442 32 040 647 328 223
Up to 3 months 8 152 918 79 260 9 467 800 96 988
3 to 6 months 3 053 147 29 682 3 641 295 37 301
6 months to 1 year 515 198 5 009 1 369 745 14 032
More than 1 year 3 131 379 30 442 16 093 157 164 857
Indefinite term 1 548 046 15 050 1 468 650 15 045
Compulsory reserves are calculated in accordance with Instruction no. 01/2014 of 12 February, and are made up of domestic and foreign currency, according to the respective denomination of the liabilities which constitute their basis for computation.
The ratio applied to the daily balances of the captions which comprise the Customer deposits base is 12.5% for domestic currency and 15% for foreign currencies, except for central and local Government deposits for which ratios of 100% and 50% are applied to domestic currency and 100% and 100% to foreign currency.
Sight deposits at Banco Nacional de Angola, as well as those domiciled at other Credit Institutions abroad, are not remunerated.
The caption Cash and cash equivalents at other Credit Institutions abroad encompass the balances of accounts at correspondent banks, as these amounts form part of the Bank’s day-to-day management.
The balances at related entities amount to AOA 4,195,485 thousand, equivalent to USD 40,752 thousand, EUR 13 thousand and GBP 12 thousand (Note 33).
4. Amounts owed by Credit Institutions
The caption Amounts owed by Financial Institutions comprises:
2014 2014 2013 2013AOA’000 USD’000 AOA’000 USD’000
Amounts owed by credit institutions 16 400 687 159 442 32 040 647 328 223
Investments in domestic credit institutions 6 200 000 60 274 5 000 000 51 220
In Angolan Kwanza 6 200 000 60 274 5 000 000 51 220
Investments in foreign credit institutions 10 200 687 99 168 27 040 647 277 003
In United States dollars 8 393 117 81 596 25 826 439 264 565
In Euros 938 959 9 128 833 196 8 535
Income receivable 868 611 8 444 381 012 3 903
On 31 December 2014, the caption Amounts owed by Credit Institutions in Angola in kwanza refers to placements at Banco Nacional de Angola.

REP
OR
T A
ND
AC
CO
UN
TS
2014
| FI
NA
NC
IAL
STA
TE
ME
NT
S
136 137
REP
OR
T A
ND
AC
CO
UN
TS
2014
| FI
NA
NC
IAL
STA
TE
ME
NT
S
136 137
Notes to the Financial Statements
The information relating to the quantity, nominal value, acquisition amount, average acquisition cost, market price and balance sheet value, is detailed as follows:
2014 AOA’000Nature and kind of securities Issuer Risk
level Quantity Nominal value
Average acquisition cost
Book value
Investment Securities – through maturity 10 825 746 - 22 479 594 23 611 649
Treasury bills Banco Nacional de Angola (BNA) A 10 721 632 10 721 632 10 255 304 10 500 512
Treasury bonds/domestic currency
Ministry of Finance (MINF) A 50 927 6 387 718 5 092 700 5 459 671
Treasury bonds/foreign currency
Ministry of Finance (MINF) A 53 187 5 100 340 7 131 590 7 651 466
Indexed to USD Ministry of Finance (MINF) A 52 423 5 092 700 6 387 718 6 856 101
Issued in USD Ministry of Finance (MINF) A 764 7 640 743 872 795 365
Central Bank securitiesBanco Nacional
de Angola (BNA) A - - - -
2013 AOA’000Nature and kind of securities Issuer Risk
level Quantity Nominal value
Average acquisition cost
Book value
Investment Securities – through maturity 2 248 304 - 10 127 135 10 247 433
Treasury bills Banco Nacional de Angola (BNA) A 1 887 521 1 000 1 820 347 1 838 921
Central Bank securities Banco Nacional de Angola (BNA) A 300 000 1 000 298 473 298 498
Treasury bonds/domestic currency
Ministry of Finance (MINF) A 57 102 6 593 957 6 972 743 7 061 702
Treasury bonds/foreign currency
Ministry of Finance (MINF) A 3 681 838 093 1 035 572 1 048 313
Indexed to USD Ministry of Finance (MINF) A 2 917 350 000 291 700 294 654
Issued in USDMinistry of
Finance (MINF) A 764 488 093 743 872 753 659
On 31 December 2014 and 2013, the breakdown of the securities portfolio by maturities is presented as follows:
2014 2014 2013 2013AOA’000 USD’000 AOA’000 USD’000
Securities 23 611 649 229 545 10 247 433 104 974
< 3 months 2 565 263 24 939 3 111 871 31 878
3-6 months 3 135 978 30 487 1 120 360 11 477
6-12 months 4 959 750 48 217 374 000 3 831
1-5 years 5 497 263 53 443 4 887 543 50 068
> 5 years 7 453 395 72 459 753 659 7 720
5. Securities
The caption Securities comprises:
2014 2014 2013 2013AOA’000 USD’000 AOA’000 USD’000
Securities held to maturity 23 611 649 229 545 10 247 433 104 974
Central Bank securities/domestic currency - - 298 473 3 058
Interest receivable - - 25 -
Treasury Bills/domestic currency 10 255 304 99 699 1 820 348 18 648
Interest receivable 245 208 2 384 18 573 190
Treasury Bonds/domestic currency, indexed 6 757 106 65 690 6 972 659 71 428
Interest receivable 98 995 962 89 043 912
Treasury bonds/adjusted 5 381 036 52 313 291 700 2 988
Interest receivable 78 635 765 2 954 30
Treasury Bonds/foreign currency 783 837 7 620 743 872 7 620
Interest receivable 11 528 112 9 786 100
On 31 December 2014, the bank’s securities portfolio was composed exclusively of securities held to maturity, namely Treasury Bills, Treasury Bonds in domestic currency indexed to the United States dollar, readjusted Treasury Bonds and Treasury Bonds in foreign currency issued in 2007 and 2008 with maturities of between 8 to 11 years.
The average remuneration rates on held-to-maturity securities in 2014 and 2013 are presented as follows:
2014 2013% %
Securities held to maturity
Central Bank securities/domestic currency - 3,03%
Treasury Bills/domestic currency 5,32% 4,26%
Treasury Bonds/domestic currency, indexed 7,12% 6,52%
Treasury bonds/adjusted 7,04% 6,98%
Treasury Bonds/foreign currency 3,52% 3,64%

REP
OR
T A
ND
AC
CO
UN
TS
2014
| FI
NA
NC
IAL
STA
TE
ME
NT
S
138 139
REP
OR
T A
ND
AC
CO
UN
TS
2014
| FI
NA
NC
IAL
STA
TE
ME
NT
S
138 139
Notes to the Financial Statements
6. Payment system credits
The caption Payment system credits comprises:
2014 2014 2013 2013AOA’000 USD’000 AOA’000 USD’000
Payment system credits 66 970 651 600 6
Dealings with correspondents
Offsetting of amounts - credit cards 277 3 - -
Offsetting of amounts - other 66 693 648 600 6
7. Exchange transactions
The caption Foreign exchange transactions comprises:
2014 2014 2013 2013AOA’000 USD’000 AOA’000 USD’000
Foreign Exchange transactions - Assets 925 767 9 000 780 948 8 000
Purchase of foreign currency - USD 925 767 9 000 780 948 8 000
Foreign exchange transactions - Liabilities 926 280 9 005 782 904 8 020
Sale of domestic currency 926 280 9 005 782 904 8 020
The Bank’s portfolio of foreign currency operations is comprised of transactions with maturity in the subsequent two business days.
8. Total Credit
The caption Total credit comprises:
2014 2014 2013 2013AOA’000 USD’000 AOA’000 USD’000
Total credit 88 444 953 859 832 85 963 777 880 609
Outstanding and past-due credit 94 934 535 922 922 87 674 332 898 132
In domestic currency 77 575 760 754 166 67 702 350 693 540
Corporate 71 926 024 699 241 61 187 435 626 802
Individual 5 649 736 54 925 6 514 915 66 738
In foreign currency 13 844 249 134 589 17 282 016 177 036
Corporate 13 180 164 128 133 16 361 306 167 604
Individual 664 085 6 456 920 710 9 432
Interest receivable 3 514 526 34 167 2 689 966 27 556
Provision for doubtful debt (Note 24) (6 489 582) (63 090) (1 710 555) (17 523)
Total credit includes outstanding and past-due credit, interest receivable net of provisions and excludes guarantees given, documentary credit and irrevocable commitments.
Total credit classified as outstanding and past-due credit comprise:
2014 2014 2013 2013AOA’000 USD’000 AOA’000 USD’000
Outstanding and past-due credit 94 934 535 922 922 87 674 332 898 132
Outstanding credit 91 585 212 890 361 85 835 854 879 299
Domestic currency 74 274 910 722 076 66 083 562 676 957
Foreign currency 13 842 372 134 571 17 098 095 175 152
Interest receivable 3 467 930 33 714 2 654 197 27 190
Past-due credit 3 349 323 32 561 1 838 478 18 833
Up to 60 days 303 594 2 951 357 066 3 658
Over 60 days 2 999 133 29 157 1 445 643 14 809
Interest receivable 46 596 453 35 769 366
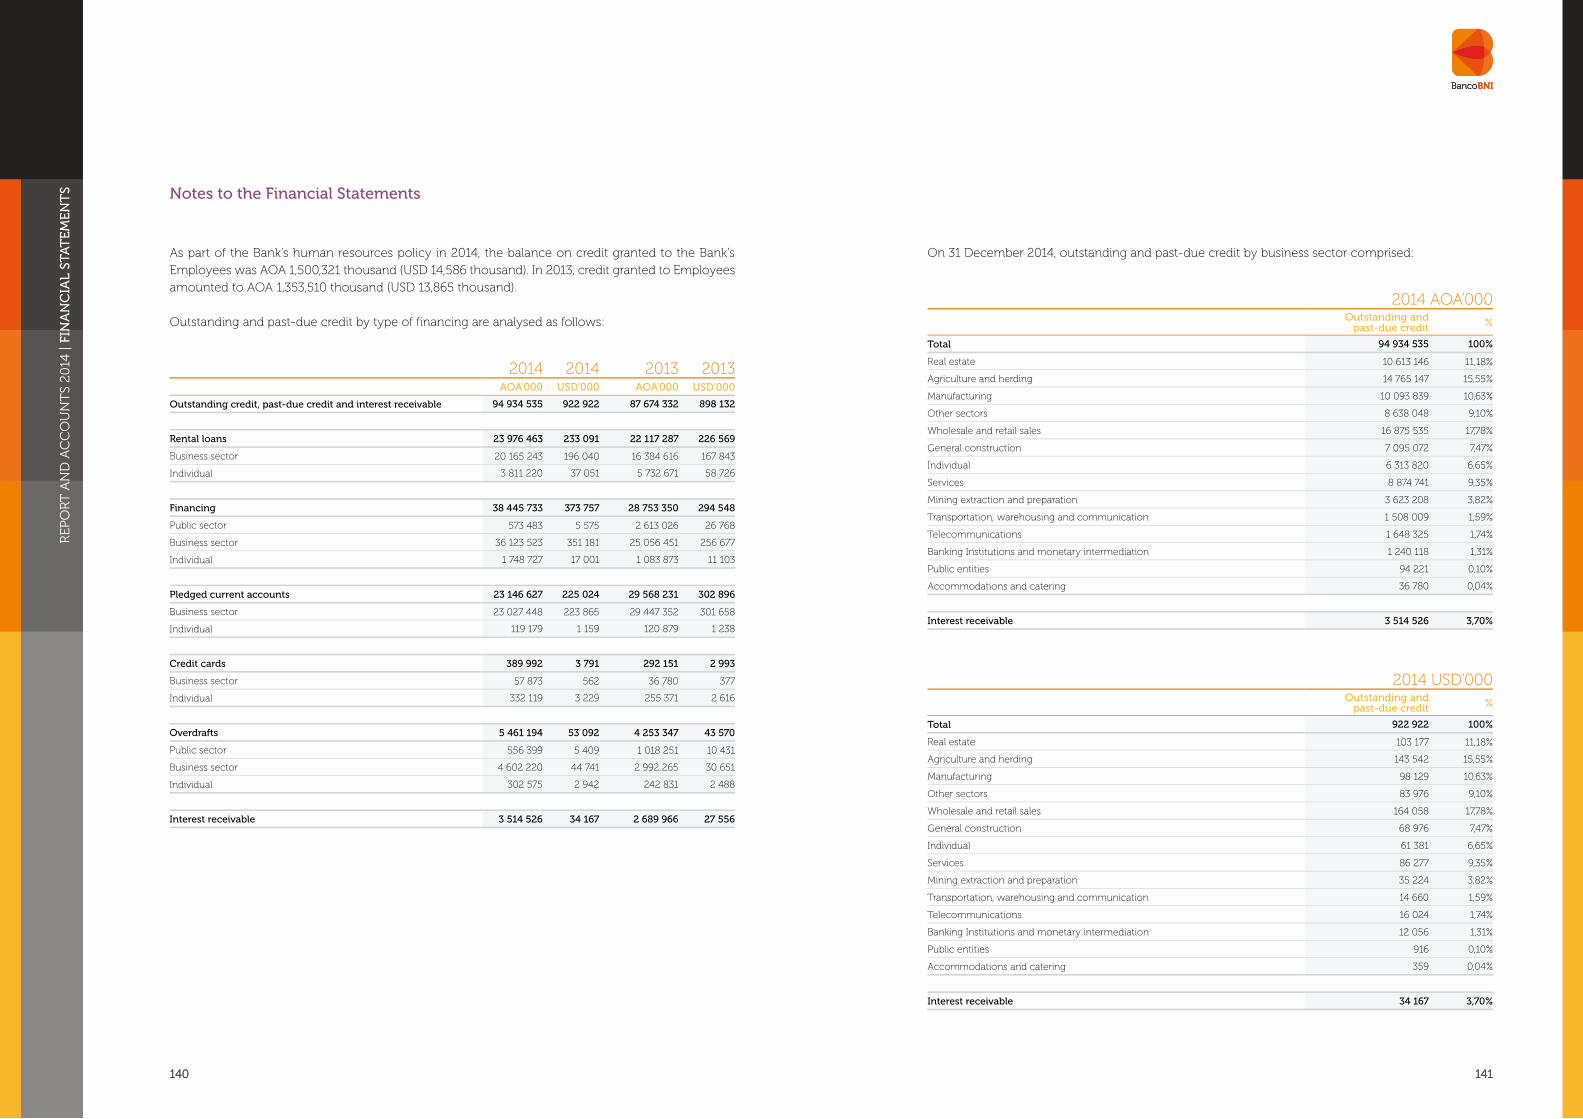
REP
OR
T A
ND
AC
CO
UN
TS
2014
| FI
NA
NC
IAL
STA
TE
ME
NT
S
140 141
REP
OR
T A
ND
AC
CO
UN
TS
2014
| FI
NA
NC
IAL
STA
TE
ME
NT
S
140 141
Notes to the Financial Statements
As part of the Bank’s human resources policy in 2014, the balance on credit granted to the Bank’s Employees was AOA 1,500,321 thousand (USD 14,586 thousand). In 2013, credit granted to Employees amounted to AOA 1,353,510 thousand (USD 13,865 thousand).
Outstanding and past-due credit by type of financing are analysed as follows:
2014 2014 2013 2013AOA’000 USD’000 AOA’000 USD’000
Outstanding credit, past-due credit and interest receivable 94 934 535 922 922 87 674 332 898 132
Rental loans 23 976 463 233 091 22 117 287 226 569
Business sector 20 165 243 196 040 16 384 616 167 843
Individual 3 811 220 37 051 5 732 671 58 726
Financing 38 445 733 373 757 28 753 350 294 548
Public sector 573 483 5 575 2 613 026 26 768
Business sector 36 123 523 351 181 25 056 451 256 677
Individual 1 748 727 17 001 1 083 873 11 103
Pledged current accounts 23 146 627 225 024 29 568 231 302 896
Business sector 23 027 448 223 865 29 447 352 301 658
Individual 119 179 1 159 120 879 1 238
Credit cards 389 992 3 791 292 151 2 993
Business sector 57 873 562 36 780 377
Individual 332 119 3 229 255 371 2 616
Overdrafts 5 461 194 53 092 4 253 347 43 570
Public sector 556 399 5 409 1 018 251 10 431
Business sector 4 602 220 44 741 2 992 265 30 651
Individual 302 575 2 942 242 831 2 488
Interest receivable 3 514 526 34 167 2 689 966 27 556
On 31 December 2014, outstanding and past-due credit by business sector comprised:
2014 AOA’000Outstanding and
past-due credit %
Total 94 934 535 100%
Real estate 10 613 146 11,18%
Agriculture and herding 14 765 147 15,55%
Manufacturing 10 093 839 10,63%
Other sectors 8 638 048 9,10%
Wholesale and retail sales 16 875 535 17,78%
General construction 7 095 072 7,47%
Individual 6 313 820 6,65%
Services 8 874 741 9,35%
Mining extraction and preparation 3 623 208 3,82%
Transportation, warehousing and communication 1 508 009 1,59%
Telecommunications 1 648 325 1,74%
Banking Institutions and monetary intermediation 1 240 118 1,31%
Public entities 94 221 0,10%
Accommodations and catering 36 780 0,04%
Interest receivable 3 514 526 3,70%
2014 USD’000Outstanding and
past-due credit %
Total 922 922 100%
Real estate 103 177 11,18%
Agriculture and herding 143 542 15,55%
Manufacturing 98 129 10,63%
Other sectors 83 976 9,10%
Wholesale and retail sales 164 058 17,78%
General construction 68 976 7,47%
Individual 61 381 6,65%
Services 86 277 9,35%
Mining extraction and preparation 35 224 3,82%
Transportation, warehousing and communication 14 660 1,59%
Telecommunications 16 024 1,74%
Banking Institutions and monetary intermediation 12 056 1,31%
Public entities 916 0,10%
Accommodations and catering 359 0,04%
Interest receivable 34 167 3,70%

REP
OR
T A
ND
AC
CO
UN
TS
2014
| FI
NA
NC
IAL
STA
TE
ME
NT
S
142 143
REP
OR
T A
ND
AC
CO
UN
TS
2014
| FI
NA
NC
IAL
STA
TE
ME
NT
S
142 143
Notes to the Financial Statements
On 31 December 2013, outstanding and past-due credit by business sector comprised:
2013 AOA’000Outstanding and
past-due credit %
Total 87 674 332 100%
Real estate 13 807 047 15,75%
Agriculture and herding 13 007 872 14,84%
Manufacturing 8 991 623 10,26%
Other sectors 7 697 942 8,78%
Wholesale and retail sales 8 830 365 10,07%
General construction 8 579 941 9,79%
Individual 7 435 874 8,48%
Services 7 196 644 8,21%
Mining extraction and preparation 3 895 935 4,44%
Transportation, warehousing and communication 1 905 664 2,17%
Telecommunications 1 315 333 1,50%
Banking Institutions and monetary intermediation 1 204 403 1,37%
Public entities 1 018 251 1,16%
Accommodations and catering 97 472 0,11%
Interest receivable 2 689 966 3,07%
2013 USD’000Outstanding and
past-due credit %
Total 898 132 100%
Real estate 141 439 15,75%
Agriculture and herding 133 252 14,84%
Manufacturing 92 110 10,26%
Other sectors 78 857 8,78%
Wholesale and retail sales 90 458 10,07%
General construction 87 893 9,79%
Individual 76 172 8,48%
Services 73 722 8,21%
Mining extraction and preparation 39 910 4,44%
Transportation, warehousing and communication 19 522 2,17%
Telecommunications 13 474 1,50%
Banking Institutions and monetary intermediation 12 338 1,37%
Public entities 10 431 1,16%
Accommodations and catering 998 0,11%
Interest receivable 27 556 3,07%
An analysis of outstanding and past-due credit by residual maturity periods and by currency for 2014 is as follows:
Domestic
Foreign
Total 2014
Total 2014
AOA’000 AOA’000 AOA’000 USD’000Outstanding credit, past-due credit and interest receivable 80 894 402 14 040 133 94 934 537 922 922
Up to 3 months 8 853 875 900 929 9 754 804 94 833
3 months to 1 year 11 160 261 9 461 722 20 621 983 200 480
1-3 years 10 912 476 1 577 440 12 489 916 121 423
3-5 years 12 735 875 578 604 13 314 479 129 439
More than 5 years 30 612 425 1 323 677 31 936 102 310 472
Indefinite term 3 300 849 1 876 3 302 725 32 108
Interest receivable 3 318 641 195 885 3 514 526 34 167
An analysis of outstanding and past-due credit by residual maturity periods and by currency for 2013 is as follows:
Domestic
Foreign
Total 2013
Total 2013
AOA’000 AOA’000 AOA’000 USD’000Outstanding credit, past-due credit and interest receivable 69 578 877 18 095 455 87 674 332 898 132
Up to 3 months 17 776 732 7 392 313 25 169 045 257 831
3 months to 1 year 14 044 644 6 502 406 20 547 050 210 483
1-3 years 10 386 733 613 824 11 000 557 112 689
3-5 years 6 479 815 1 278 507 7 758 322 79 476
More than 5 years 17 395 640 1 311 045 18 706 683 191 631
Indefinite term 1 618 786 183 921 1 802 709 18 466
Interest receivable 1 876 527 813 439 2 689 966 27 556
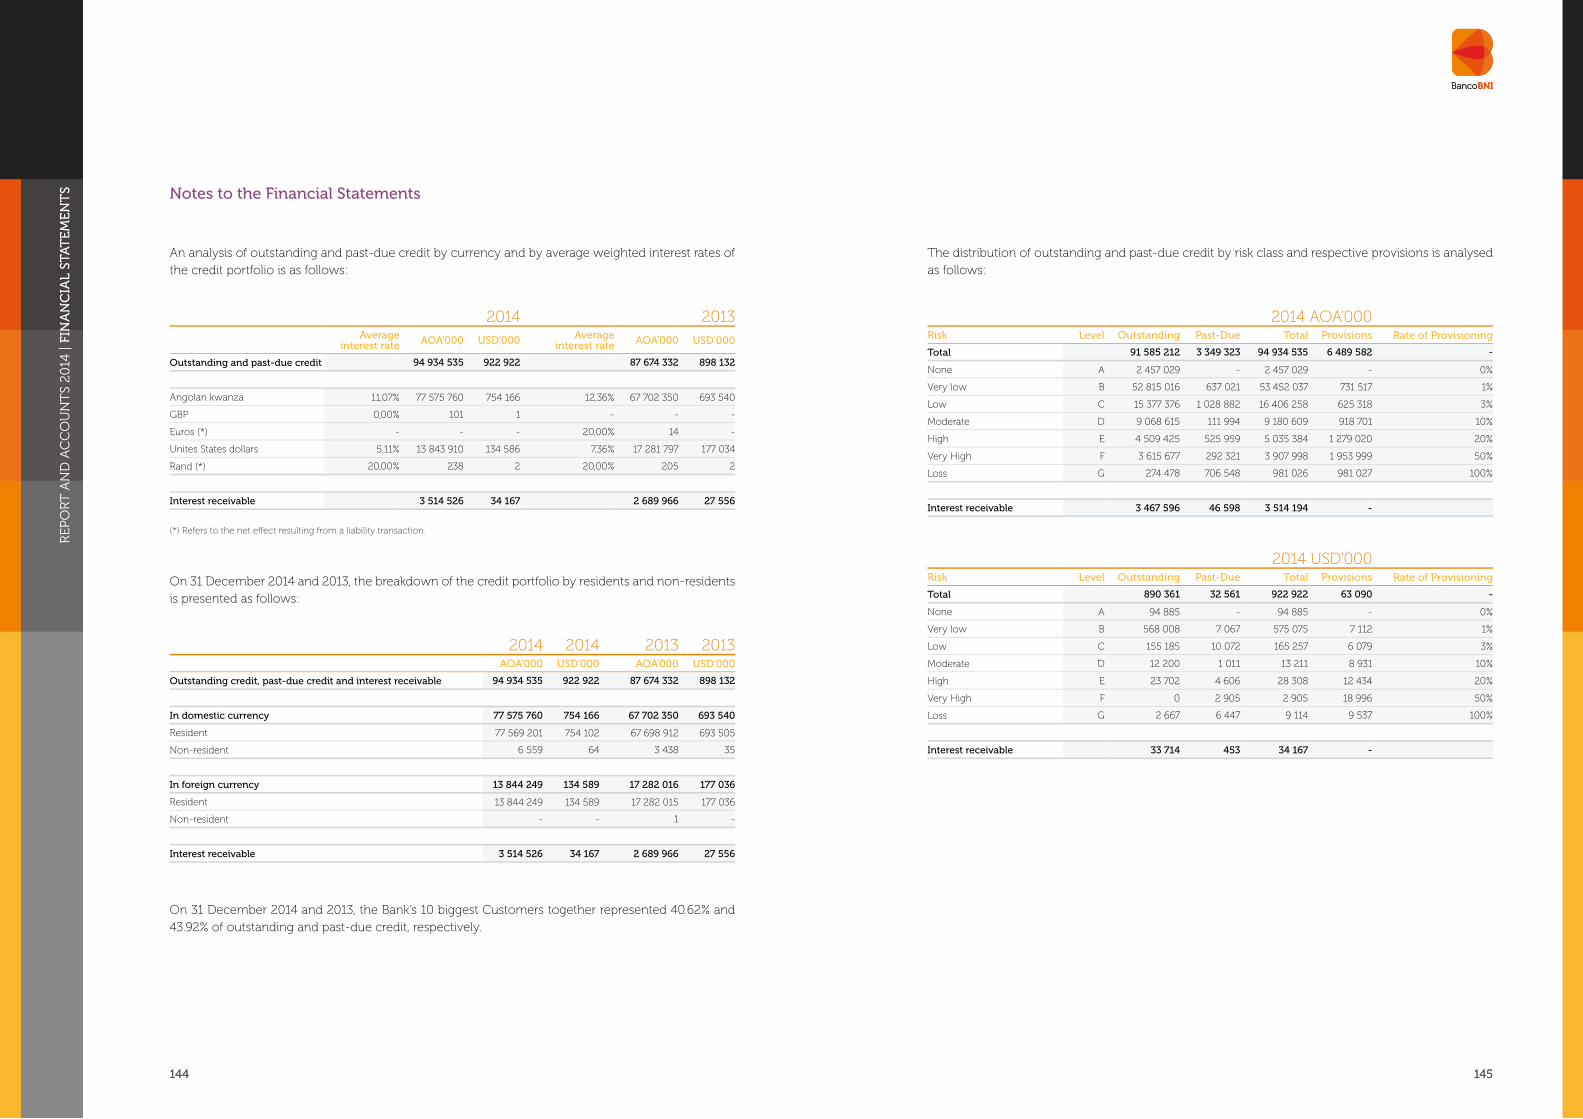
REP
OR
T A
ND
AC
CO
UN
TS
2014
| FI
NA
NC
IAL
STA
TE
ME
NT
S
144 145
REP
OR
T A
ND
AC
CO
UN
TS
2014
| FI
NA
NC
IAL
STA
TE
ME
NT
S
144 145
Notes to the Financial Statements
An analysis of outstanding and past-due credit by currency and by average weighted interest rates of the credit portfolio is as follows:
2014 2013Average
interest rate AOA’000 USD’000 Average interest rate AOA’000 USD’000
Outstanding and past-due credit 94 934 535 922 922 87 674 332 898 132
Angolan kwanza 11,07% 77 575 760 754 166 12,36% 67 702 350 693 540
GBP 0,00% 101 1 - - -
Euros (*) - - - 20,00% 14 -
Unites States dollars 5,11% 13 843 910 134 586 7,36% 17 281 797 177 034
Rand (*) 20,00% 238 2 20,00% 205 2
Interest receivable 3 514 526 34 167 2 689 966 27 556
(*) Refers to the net effect resulting from a liability transaction.
On 31 December 2014 and 2013, the breakdown of the credit portfolio by residents and non-residents is presented as follows:
2014 2014 2013 2013AOA’000 USD’000 AOA’000 USD’000
Outstanding credit, past-due credit and interest receivable 94 934 535 922 922 87 674 332 898 132
In domestic currency 77 575 760 754 166 67 702 350 693 540
Resident 77 569 201 754 102 67 698 912 693 505
Non-resident 6 559 64 3 438 35
In foreign currency 13 844 249 134 589 17 282 016 177 036
Resident 13 844 249 134 589 17 282 015 177 036
Non-resident - - 1 -
Interest receivable 3 514 526 34 167 2 689 966 27 556
On 31 December 2014 and 2013, the Bank’s 10 biggest Customers together represented 40.62% and 43.92% of outstanding and past-due credit, respectively.
The distribution of outstanding and past-due credit by risk class and respective provisions is analysed as follows:
2014 AOA’000Risk Level Outstanding Past-Due Total Provisions Rate of Provisioning
Total 91 585 212 3 349 323 94 934 535 6 489 582 -
None A 2 457 029 - 2 457 029 - 0%
Very low B 52 815 016 637 021 53 452 037 731 517 1%
Low C 15 377 376 1 028 882 16 406 258 625 318 3%
Moderate D 9 068 615 111 994 9 180 609 918 701 10%
High E 4 509 425 525 959 5 035 384 1 279 020 20%
Very High F 3 615 677 292 321 3 907 998 1 953 999 50%
Loss G 274 478 706 548 981 026 981 027 100%
Interest receivable 3 467 596 46 598 3 514 194 -
2014 USD’000Risk Level Outstanding Past-Due Total Provisions Rate of Provisioning
Total 890 361 32 561 922 922 63 090 -
None A 94 885 - 94 885 - 0%
Very low B 568 008 7 067 575 075 7 112 1%
Low C 155 185 10 072 165 257 6 079 3%
Moderate D 12 200 1 011 13 211 8 931 10%
High E 23 702 4 606 28 308 12 434 20%
Very High F 0 2 905 2 905 18 996 50%
Loss G 2 667 6 447 9 114 9 537 100%
Interest receivable 33 714 453 34 167 -

REP
OR
T A
ND
AC
CO
UN
TS
2014
| FI
NA
NC
IAL
STA
TE
ME
NT
S
146 147
REP
OR
T A
ND
AC
CO
UN
TS
2014
| FI
NA
NC
IAL
STA
TE
ME
NT
S
146 147
Notes to the Financial Statements
2013 AOA’000Risk Level Outstanding Past-Due Total Provisions Rate of Provisioning
Total 85 835 854 1 838 478 87 674 332 1 710 555 -
None A 141 745 2 200 143 945 - 0%
Very low B 80 762 399 331 083 81 093 482 892 513 1%
Low C 1 940 440 413 001 2 353 441 73 758 3%
Moderate D 67 861 116 499 184 360 18 807 10%
High E 64 704 300 822 365 526 74 606 20%
Very High F 106 269 304 871 411 140 209 703 50%
Loss G 98 239 334 233 432 472 441 168 100%
Interest receivable 2 654 197 35 769 2 689 966 -
2013 USD’000Risk Level Outstanding Past-Due Total Provisions Rate of Provisioning
Total 879 299 18 833 898 132 17 523 -
None A 1 452 22 1 475 - 0%
Very low B 827 327 3 392 830 718 9 143 1%
Low C 19 878 4 231 24 109 756 3%
Moderate D 695 1 193 1 889 193 10%
High E 663 3 082 3 744 764 20%
Very High F 1 089 3 123 4 212 2 148 50%
Loss G 1 005 3 424 4 430 4 519 100%
Interest receivable 27 190 366 27 556 -
Recoveries of credit previously written off amounted to AOA 115,926 thousand (USD 1,127 thousand) in 2014 and AOA 543,608 thousand (USD 5,569 thousand) in 2013.
The following movements took place on the provisions for doubtful debt:
2014 2014 2013 2013AOA’000 USD’000 AOA’000 USD’000
Balance on 01 January 1 710 555 17 523 2 107 864 21 997
Credits 7 859 235 79 699 1 292 446 13 397
Reversals (2 231 062) (22 625) (594 941) (6 167)
Uses (849 146) (8 255) (1 094 814) (11 215)
Exchange difference - (3 252) - (489)
Balance on 31 December 6 489 582 63 090 1 710 555 17 523
9. Other assets
The caption Other assets comprises:
2014 2014 2013 2013AOA’000 USD’000 AOA’000 USD’000
Other assets 14 060 908 136 695 8 094 746 82 922
Subsidies 1 580 14 - -
Consortium members' rights 13 879 135 2 545 26
Misc. receivables 7 078 183 68 812 5 660 539 57 986
Prepaid expenses 218 877 2 128 193 090 1 978
Office supplies - - 30 982 317
Assets not for own use 6 748 389 65 606 2 207 135 22 610
Other advances - - 455 5
The caption Sundry debtors is mainly composed of amounts receivable from the BGI Group of AOA 2,677,301 thousand (USD 26,028 thousand) and Banco Privado Internacional (I.F.I.), S.A. of AOA 1,400,672 thousand (USD 13,617 thousand).
On 31 December 2014, the caption Assets not for own use includes USD 44,000 thousand for properties received under the early payment of a financial placement, as explained in note 4.
10. Financial fixed assets
The caption Financial fixed assets comprises:
2014 2014 2013 2013AOA’000 USD’000 AOA’000 USD’000
Financial fixed assets 4 026 967 39 149 3 226 943 33 057
Holdings in other companies 138 677 1 348 152 865 1 566
Emis - Empresa Interbancária de Serviços, SARL 36 848 358 36 848 378
Facilcred - Sociedade de Microcrédito, S.A. 101 829 990 116 017 1 188
BNI - Banco de Negócios Internacional (Europa), S.A. 3 888 290 37 801 3 074 078 31 491

REP
OR
T A
ND
AC
CO
UN
TS
2014
| FI
NA
NC
IAL
STA
TE
ME
NT
S
148 149
REP
OR
T A
ND
AC
CO
UN
TS
2014
| FI
NA
NC
IAL
STA
TE
ME
NT
S
148 149
Notes to the Financial Statements
On 31 December 2014, Banco BNI held a 99.97% stake in BNI Europa, S.A. which corresponds to AOA 3,888,290 thousand (USD 37,801 thousand).
The change in the stake in Facilcred – Sociedade de Microcrédito, S.A. is due to the equity accounting corresponding to AOA 14,188 thousand (USD 138 thousand).
The following are details of the equity stakes:
Company Currency Share capital (in thousands) Kind % holding No. of shares
owned
Emis - Empresa Interbancária de Serviços, SARL AOA 910 000 Acções 1,98% 18 018
BNI - Banco de Negócios Internacional (Europa), S.A. EUR 25 000 Acções 99,97% 4 998
Facilcred - Sociedade de MicroCrédito, S.A. AOA 287 500 Acções 51,00% 1 275
11. Tangible fixed assets, intangible fixed assets and fixed assets in progress
The following movements took place in the caption Tangible fixed assets, intangible fixed assets and fixed assets in progress during 2014:
AOA’000Gross fixed assets Balance on
31-Dec-13 Additions Write-offs Adjustments/Transfers
Balance on31-Dec-14
Furniture, tools, fixtures and equipment 13 789 181 2 751 598 (230 064) (1 902 427) 14 408 288
Other fixed assets 5 523 16 646 (56 496) 102 166 67 839
Fixed assets in progress 1 334 189 1 060 640 (88 722) (1 154 008) 1 152 099
Tangible fixed assets 15 128 893 3 828 884 (375 282) (2 954 269) 15 628 226
Intangible fixed assets 1 438 061 219 564 - 12 281 153 13 938 778
Accumulated depreciation
Furniture, tools, fixtures and equipment (3 030 639) (747 913) - 1 579 267 (2 199 285)
Other fixed assets - - - - -
Tangible fixed assets (3 030 639) (747 913) - 1 579 267 (2 199 285)
Intangible fixed assets (1 154 191) (535 453) - (1 008 627) (2 698 271)
Net tangible fixed assets and fixed assets in progress 12 098 254 3 080 971 (375 282) (1 375 002) 13 428 941
Net intangible fixed assets 283 870 (315 889) - 11 272 526 11 240 507
USD’000
Gross fixed assets Balance on31-Dec-13 Additions Write-offs Adjustments/
Transfers
Conversion exchange
differences
Balance on31-Dec-14
Furniture, tools, fixtures and equipment 141 256 26 750 (2 237) (18 495) (7 201) 140 073
Other fixed assets 57 162 (549) 993 (3) 660
Fixed assets in progress 13 668 10 311 (863) (11 219) (696) 11 201
Tangible fixed assets 154 980 37 223 (3 649) (28 721) (7 902) 151 933
Intangible fixed assets 14 731 (2 135) - (119 393) (751) 135 508
Accumulated depreciation
Furniture, tools, fixtures and equipment (31 046) (7 271) - 15 353 1 583 (21 381)
Other fixed assets - - - - - -
Tangible fixed assets (31 046) (7 271) - 15 353 1 583 (21 381)
Intangible fixed assets (11 823) (5 205) - (9 806) 602 (26 232)
Net tangible fixed assets and fixed assets in progress 123 934 29 952 (3 649) (13 368) (6 317) 130 552
Net intangible fixed assets 2 908 3 070 - 109 587 (149) 109 276

REP
OR
T A
ND
AC
CO
UN
TS
2014
| FI
NA
NC
IAL
STA
TE
ME
NT
S
150 151
REP
OR
T A
ND
AC
CO
UN
TS
2014
| FI
NA
NC
IAL
STA
TE
ME
NT
S
150 151
Notes to the Financial Statements
The following movements took place in the caption Tangible fixed assets, intangible fixed assets and fixed assets in progress during 2013:
AOA’000Gross fixed assets Balance on
31-Dec-12 Additions Write-offs Adjustments/Transfers
Balance on31-Dec-13
Furniture, tools, fixtures and equipment 14 571 777 1 169 739 (2 837 792) 885 457 13 789 181
Other fixed assets 5 523 539 059 (1 395) (537 664) 5 523
Fixed assets in progress 1 530 120 151 862 - (347 793) 1 334 189
Tangible fixed assets 16 107 420 1 860 660 (2 839 187) - 15 128 893
Intangible fixed assets 1 424 991 13 070 - - 1 438 061
Accumulated depreciation
Furniture, tools, fixtures and equipment (2 781 415) (1 105 701) 856 477 - (3 030 639)
Other fixed assets - - - - -
Tangible fixed assets (2 781 415) (1 105 701) 856 477 - (3 030 639)
Intangible fixed assets (929 829) (224 362) - - (1 154 191)
Net tangible fixed assets and fixed assets in progress 13 326 005 754 959 (1 982 710) - 12 098 254
Net intangible fixed assets 498 162 (214 292) - - 283 870
USD’000
Gross fixed assets Balance on31-Dec-13 Additions Write-offs Adjustments/
Transfers
Conversion exchange
differences
Balance on31-Dec-14
Furniture, tools, fixtures and equipment 152 065 11 983 (29 070) 9 071 (2 792) 141 256
Other fixed assets 58 5 522 (14) (5 508) (1) 57
Fixed assets in progress 15 968 1 556 - (3 563) (294) 13 668
Tangible fixed assets 168 090 19 060 (29 084) - (3 087) 154 980
Intangible fixed assets 14 871 133 - - (273) 14 731
Accumulated depreciation
Furniture, tools, fixtures and equipment (29 026) (11 488) 8 935 - 533 (31 046)
Other fixed assets - - - - - -
Tangible fixed assets (29 026) (11 488) 8 935 - 533 (31 046)
Intangible fixed assets (9 672) (2 298) - - 147 (11 823)
Net tangible fixed assets and fixed assets in progress 139 065 7 572 (20 149) - (2 554) 123 934
Net intangible fixed assets 5 199 (2 165) - - (126) 2 908
In the caption furniture, tools, fixtures and equipment, the amount of acquisitions includes additional works in the Sólida Plaza building, along with the acquisition of the Gika, Living and Cabinda branches.
The caption Fixed assets in progress essentially refers to branches under construction.
On 31 December 2014, the caption Intangible fixed assets included multi-annual costs, software, units in expansion, third-party property improvements and real estate development rights, along with USD 90,000 thousand for the transfer of real estate development rights under the advance repayment of a financial placement, as explained in note 4.
No third-party property improvements were recorded on 31 December 2013.
12. Deposits
The caption Customer deposits on 31 December 2014 and 2013 comprises:
2014 2014 2013 2013AOA’000 USD’000 AOA’000 USD’000
Deposits 155 344 158 1 510 204 133 499 669 1 367 565
Demand deposits 78 953 163 767 556 63 626 375 651 785
In domestic currency 65 720 456 638 912 50 280 214 515 068
In foreign currency 13 232 707 128 644 13 346 161 136 718
Term deposits 76 387 297 742 612 69 870 655 715 752
In domestic currency 53 882 603 523 829 45 768 574 468 851
In foreign currency 21 808 877 212 019 23 347 008 239 166
Interest payable 695 817 6 764 755 073 7 735
Other deposits 3 698 36 2 639 27
On 31 December 2014, related entity balances amounted to AOA 4,441,503 thousand (USD 43,179 thousand); on 31 December 2013, they were 7,883,325 thousand (USD 80,756 thousand), as per note 33.
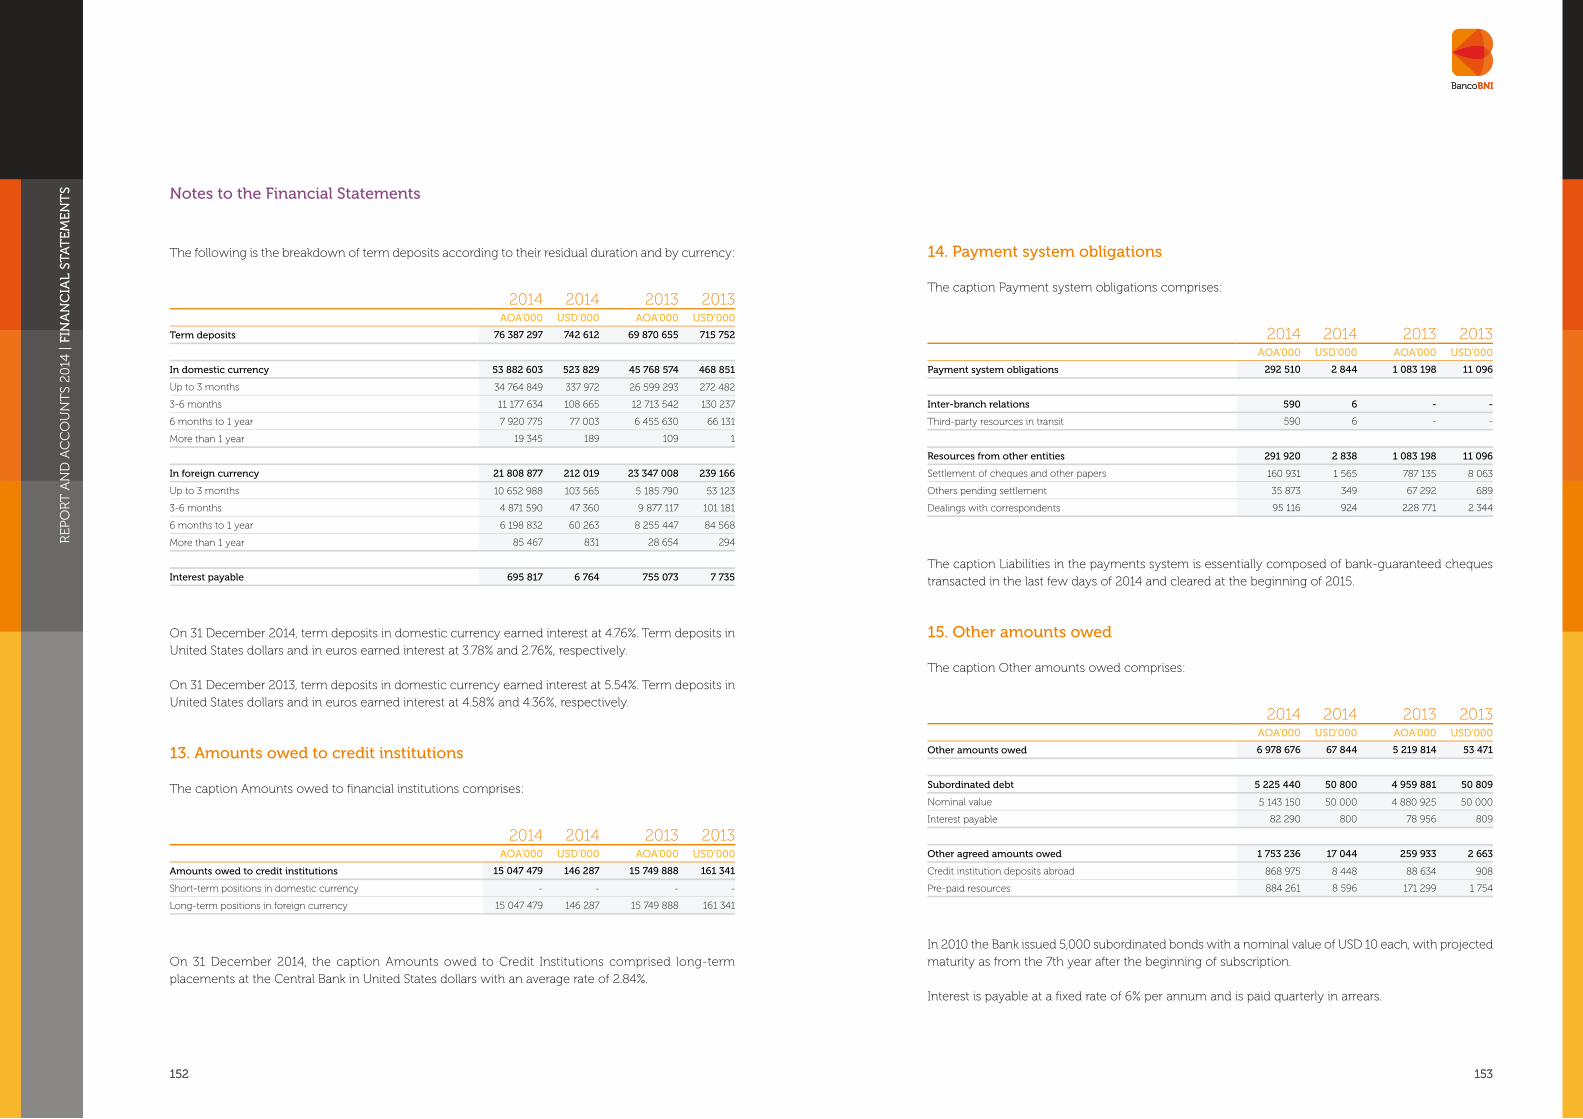
REP
OR
T A
ND
AC
CO
UN
TS
2014
| FI
NA
NC
IAL
STA
TE
ME
NT
S
152 153
REP
OR
T A
ND
AC
CO
UN
TS
2014
| FI
NA
NC
IAL
STA
TE
ME
NT
S
152 153
Notes to the Financial Statements
14. Payment system obligations
The caption Payment system obligations comprises:
2014 2014 2013 2013AOA’000 USD’000 AOA’000 USD’000
Payment system obligations 292 510 2 844 1 083 198 11 096
Inter-branch relations 590 6 - -
Third-party resources in transit 590 6 - -
Resources from other entities 291 920 2 838 1 083 198 11 096
Settlement of cheques and other papers 160 931 1 565 787 135 8 063
Others pending settlement 35 873 349 67 292 689
Dealings with correspondents 95 116 924 228 771 2 344
The caption Liabilities in the payments system is essentially composed of bank-guaranteed cheques transacted in the last few days of 2014 and cleared at the beginning of 2015.
15. Other amounts owed
The caption Other amounts owed comprises:
2014 2014 2013 2013AOA’000 USD’000 AOA’000 USD’000
Other amounts owed 6 978 676 67 844 5 219 814 53 471
Subordinated debt 5 225 440 50 800 4 959 881 50 809
Nominal value 5 143 150 50 000 4 880 925 50 000
Interest payable 82 290 800 78 956 809
Other agreed amounts owed 1 753 236 17 044 259 933 2 663
Credit institution deposits abroad 868 975 8 448 88 634 908
Pre-paid resources 884 261 8 596 171 299 1 754
In 2010 the Bank issued 5,000 subordinated bonds with a nominal value of USD 10 each, with projected maturity as from the 7th year after the beginning of subscription.
Interest is payable at a fixed rate of 6% per annum and is paid quarterly in arrears.
The following is the breakdown of term deposits according to their residual duration and by currency:
2014 2014 2013 2013AOA’000 USD’000 AOA’000 USD’000
Term deposits 76 387 297 742 612 69 870 655 715 752
In domestic currency 53 882 603 523 829 45 768 574 468 851
Up to 3 months 34 764 849 337 972 26 599 293 272 482
3-6 months 11 177 634 108 665 12 713 542 130 237
6 months to 1 year 7 920 775 77 003 6 455 630 66 131
More than 1 year 19 345 189 109 1
In foreign currency 21 808 877 212 019 23 347 008 239 166
Up to 3 months 10 652 988 103 565 5 185 790 53 123
3-6 months 4 871 590 47 360 9 877 117 101 181
6 months to 1 year 6 198 832 60 263 8 255 447 84 568
More than 1 year 85 467 831 28 654 294
Interest payable 695 817 6 764 755 073 7 735
On 31 December 2014, term deposits in domestic currency earned interest at 4.76%. Term deposits in United States dollars and in euros earned interest at 3.78% and 2.76%, respectively.
On 31 December 2013, term deposits in domestic currency earned interest at 5.54%. Term deposits in United States dollars and in euros earned interest at 4.58% and 4.36%, respectively.
13. Amounts owed to credit institutions
The caption Amounts owed to financial institutions comprises:
2014 2014 2013 2013AOA’000 USD’000 AOA’000 USD’000
Amounts owed to credit institutions 15 047 479 146 287 15 749 888 161 341
Short-term positions in domestic currency - - - -
Long-term positions in foreign currency 15 047 479 146 287 15 749 888 161 341
On 31 December 2014, the caption Amounts owed to Credit Institutions comprised long-term placements at the Central Bank in United States dollars with an average rate of 2.84%.

REP
OR
T A
ND
AC
CO
UN
TS
2014
| FI
NA
NC
IAL
STA
TE
ME
NT
S
154 155
REP
OR
T A
ND
AC
CO
UN
TS
2014
| FI
NA
NC
IAL
STA
TE
ME
NT
S
154 155
Notes to the Financial Statements
16. Other obligations
The caption Other obligations comprises:
2014 2014 2013 2013AOA’000 USD’000 AOA’000 USD’000
Other obligations 3 016 005 29 321 6 355 123 65 102
Dividends payable 81 897 796 74 506 763
Of a tax nature 209 836 2 040 1 628 502 16 682
Of a civil nature 2 222 421 21 606 4 248 158 43 518
Staff, salaries and remuneration 501 851 4 879 403 957 4 138
The caption Other obligations of a tax nature include AOA 258,604 thousand (2013: AOA 1,458,254 referring to industrial tax payable, as mentioned in note 31.
On 31 December 2014, the caption Other obligations of a civil nature include AOA 1,724,074 thousand (2013: AOA 3,468,556 thousand) referring to guarantees pledged by Customers.
On 31 December 2014 the caption Staff, salaries and remuneration includes AOA 264,883 thousand for the holiday pay provision and related subsidy and Employee bonuses.
17. Provisions for probable liabilities
The caption Provisions for probable liabilities refers to provisions for tax contingencies, for liabilities of an administrative, civil and a survivorship nature and for guarantees given.
The following movements took place in provisions for probable liabilities, by nature, during 2014 and 2013:
AOA’00031/12/13 Credits Reversals Uses Transfers 31/12/14
Provisions for probable liabilities 366 577 372 125 (173 016) (19 069) 428 547 045
Provisions for probable tax liabilities 23 187 - (23 187) - - -
Provisions for probable civil liabilities 60 000 - - - - 60 000
Provisions for probable administrative liabilities 68 271 76 948 - (19 069) - 126 150
Provisions for probable survivor's pension liabilities 44 426 - (44 426) - - -
Provisions for probable liabilities for guarantees and documentary credit 170 693 295 177 (105 402) - 428 360 896
AOA’00031/12/12 Credits Reversals Uses Transfers 31/12/13
Provisions for probable liabilities 377 361 155 953 (120 619) (46 118) - 366 577
Provisions for probable tax liabilities 78 983 - (55 796) - - 23 187
Provisions for probable civil liabilities 60 000 - - - - 60 000
Provisions for probable administrative liabilities 59 149 55 518 - 46 118 (278) 68 271
Provisions for probable survivor's pension liabilities - 44 426 - - - 44 426
Provisions for probable liabilities for guarantees and documentary credit 179 229 56 009 64 823 - 278 170 693
USD’000
31/12/13 Credits Reversals Uses TransfersConversion
exchange differences
31/12/14
Provisions for probable liabilities 3 755 3 774 (1 755) (185) 3 (277) 5 318
Provisions for probable tax liabilities 238 - (235) - - (3) 0
Provisions for probable civil liabilities 615 - - - - (32) 583
Provisions for probable administrative liabilities 700 780 - (185) - (69) 1 226
Provisions for probable survivor's pension liabilities 455 - (451) - - (4) 0
Provisions for probable liabilities for guarantees and documentary credit
1 749 2 994 (1 069) - 3 (169) 3 508
USD’000
31/12/12 Credits Reversals Uses TransfersConversion
exchange differences
31/12/13
Provisions for probable liabilities 3 938 1 598 (1 236) (472) - (72) 3 755
Provisions for probable tax liabilities 824 - (572) - - (15) 238
Provisions for probable civil liabilities 626 - - - - (11) 615
Provisions for probable administrative liabilities 617 569 - (472) (3) (11) 700
Provisions for probable survivor's pension liabilities - 455 - - - - 455
Provisions for probable liabilities for guarantees and documentary credit
1 871 574 (664) - 3 (35) 1 749
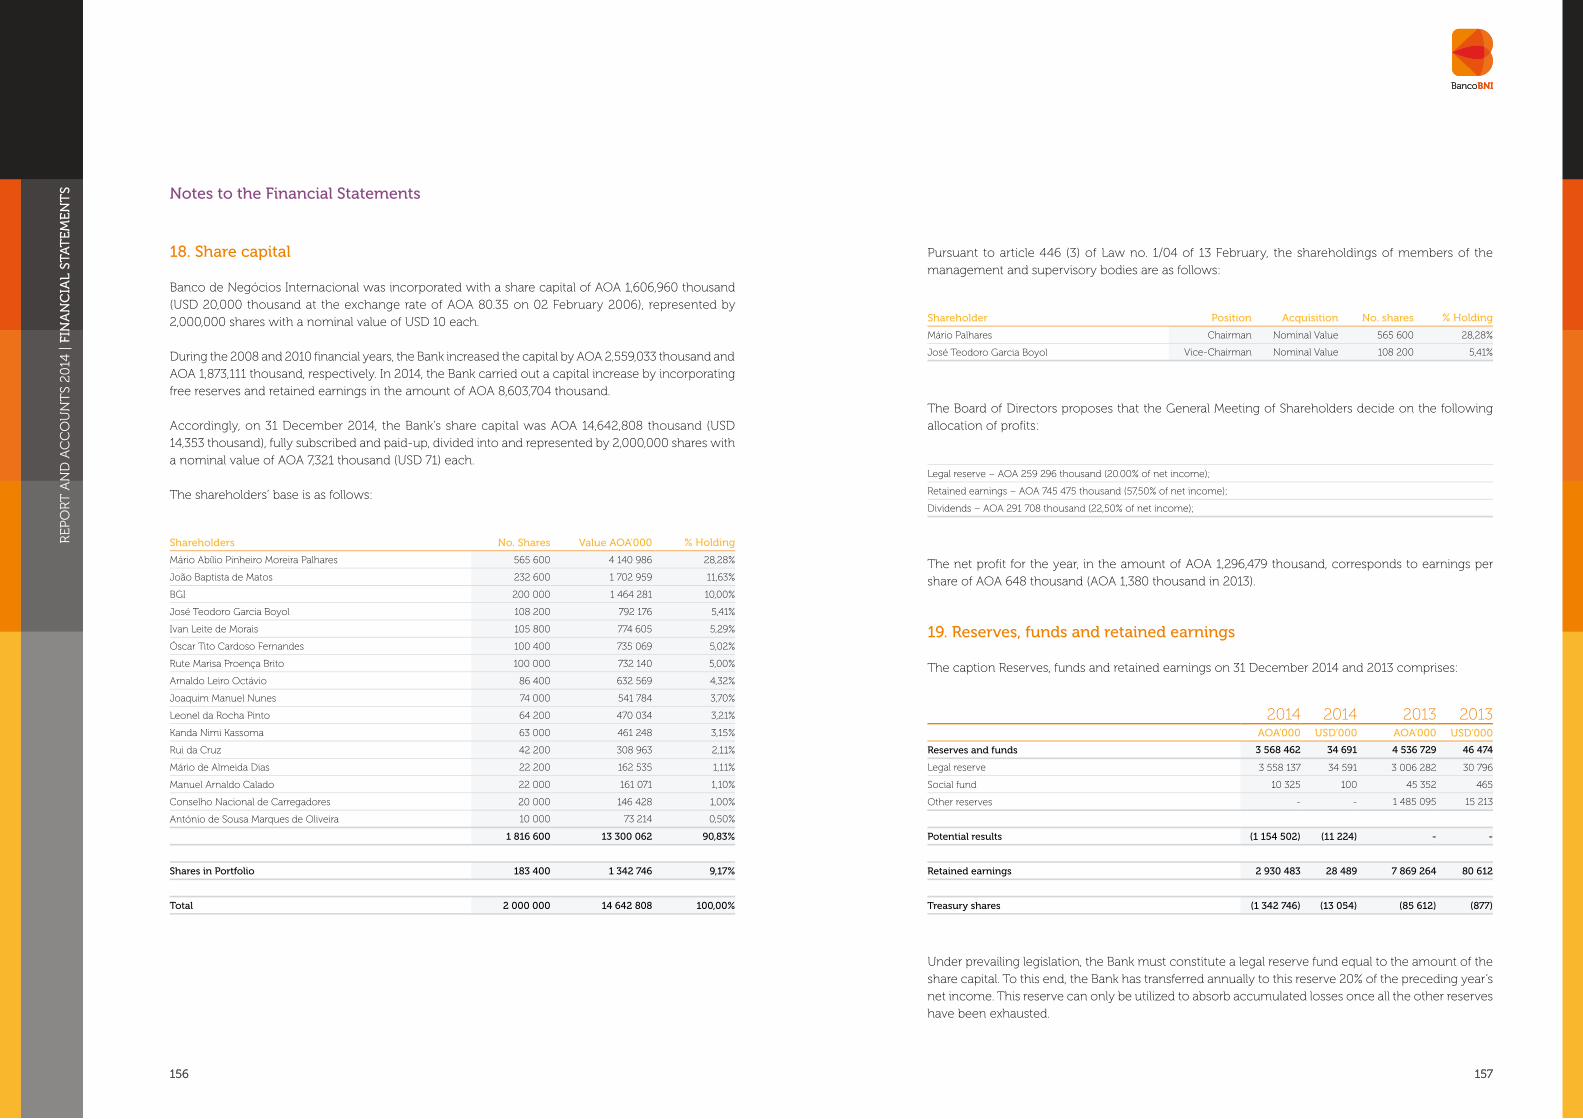
REP
OR
T A
ND
AC
CO
UN
TS
2014
| FI
NA
NC
IAL
STA
TE
ME
NT
S
156 157
REP
OR
T A
ND
AC
CO
UN
TS
2014
| FI
NA
NC
IAL
STA
TE
ME
NT
S
156 157
Notes to the Financial Statements
Pursuant to article 446 (3) of Law no. 1/04 of 13 February, the shareholdings of members of the management and supervisory bodies are as follows:
Shareholder Position Acquisition No. shares % Holding
Mário Palhares Chairman Nominal Value 565 600 28,28%
José Teodoro Garcia Boyol Vice-Chairman Nominal Value 108 200 5,41%
The Board of Directors proposes that the General Meeting of Shareholders decide on the following allocation of profits:
Legal reserve – AOA 259 296 thousand (20.00% of net income);
Retained earnings – AOA 745 475 thousand (57,50% of net income);
Dividends – AOA 291 708 thousand (22,50% of net income);
The net profit for the year, in the amount of AOA 1,296,479 thousand, corresponds to earnings per share of AOA 648 thousand (AOA 1,380 thousand in 2013).
19. Reserves, funds and retained earnings
The caption Reserves, funds and retained earnings on 31 December 2014 and 2013 comprises:
2014 2014 2013 2013AOA’000 USD’000 AOA’000 USD’000
Reserves and funds 3 568 462 34 691 4 536 729 46 474
Legal reserve 3 558 137 34 591 3 006 282 30 796
Social fund 10 325 100 45 352 465
Other reserves - - 1 485 095 15 213
Potential results (1 154 502) (11 224) - -
Retained earnings 2 930 483 28 489 7 869 264 80 612
Treasury shares (1 342 746) (13 054) (85 612) (877)
Under prevailing legislation, the Bank must constitute a legal reserve fund equal to the amount of the share capital. To this end, the Bank has transferred annually to this reserve 20% of the preceding year’s net income. This reserve can only be utilized to absorb accumulated losses once all the other reserves have been exhausted.
18. Share capital
Banco de Negócios Internacional was incorporated with a share capital of AOA 1,606,960 thousand (USD 20,000 thousand at the exchange rate of AOA 80.35 on 02 February 2006), represented by 2,000,000 shares with a nominal value of USD 10 each.
During the 2008 and 2010 financial years, the Bank increased the capital by AOA 2,559,033 thousand and AOA 1,873,111 thousand, respectively. In 2014, the Bank carried out a capital increase by incorporating free reserves and retained earnings in the amount of AOA 8,603,704 thousand.
Accordingly, on 31 December 2014, the Bank’s share capital was AOA 14,642,808 thousand (USD 14,353 thousand), fully subscribed and paid-up, divided into and represented by 2,000,000 shares with a nominal value of AOA 7,321 thousand (USD 71) each.
The shareholders’ base is as follows:
Shareholders No. Shares Value AOA'000 % Holding
Mário Abílio Pinheiro Moreira Palhares 565 600 4 140 986 28,28%
João Baptista de Matos 232 600 1 702 959 11,63%
BGI 200 000 1 464 281 10,00%
José Teodoro Garcia Boyol 108 200 792 176 5,41%
Ivan Leite de Morais 105 800 774 605 5,29%
Óscar Tito Cardoso Fernandes 100 400 735 069 5,02%
Rute Marisa Proença Brito 100 000 732 140 5,00%
Arnaldo Leiro Octávio 86 400 632 569 4,32%
Joaquim Manuel Nunes 74 000 541 784 3,70%
Leonel da Rocha Pinto 64 200 470 034 3,21%
Kanda Nimi Kassoma 63 000 461 248 3,15%
Rui da Cruz 42 200 308 963 2,11%
Mário de Almeida Dias 22 200 162 535 1,11%
Manuel Arnaldo Calado 22 000 161 071 1,10%
Conselho Nacional de Carregadores 20 000 146 428 1,00%
António de Sousa Marques de Oliveira 10 000 73 214 0,50%
1 816 600 13 300 062 90,83%
Shares in Portfolio 183 400 1 342 746 9,17%
Total 2 000 000 14 642 808 100,00%

REP
OR
T A
ND
AC
CO
UN
TS
2014
| FI
NA
NC
IAL
STA
TE
ME
NT
S
158 159
REP
OR
T A
ND
AC
CO
UN
TS
2014
| FI
NA
NC
IAL
STA
TE
ME
NT
S
158 159
Notes to the Financial Statements
20. Income from financial assets
The caption Income from financial assets comprises:
2014 2014 2013 2013AOA’000 USD’000 AOA’000 USD’000
Income from financial assets 10 972 568 111 270 10 660 824 110 503
From amounts owed by credit institutions 595 407 6 037 416 227 4 314
From securities 1 416 422 14 364 657 705 6 817
Held to maturity 1 416 422 14 364 657 705 6 817
From credit 8 960 739 90 869 9 586 892 99 372
The caption Income from liquidity placements reflects the income received by the Bank relating to term deposits at financial institutions abroad, as well as from inter-financial money market transactions.
Income from securities refers to interest from public debt securities, namely Central Bank Bonds, Treasury Bills and Treasury Bonds.
The caption Income from credit reflects interest from Customer credit agreements.
21. Costs of financial liabilities
The caption Income from financial liabilities comprises:
2014 2014 2013 2013AOA’000 USD’000 AOA’000 USD’000
Costs of financial liabilities (4 427 055) (44 893) (4 716 552) (48 889)
Of deposits (3 674 291) (37 260) (3 787 404) (39 258)
Of demand deposits (6 903) (70) (7 814) (81)
Of term deposits (3 667 388) (37 190) (3 779 590) (39 177)
Of amounts owed to credit institutions (457 969) (4 644) (638 059) (6 614)
Of other amounts owed (294 795) (2 989) (291 089) (3 017)
Of subordinate debt funding (294 795) (2 989) (291 089) (3 017)
The caption Costs of amounts owed to Credit Institutions includes interest for the taking of short-term liquidity in the interbank money market.
22. Results of foreign exchange transactions
The caption Results of foreign exchange transactions comprises:
2014 2014 2013 2013AOA’000 USD’000 AOA’000 USD’000
Results of foreign exch. transactions 4 311 565 43 723 2 682 562 27 805
Revaluation of exchange position
Profits 7 604 846 77 119 7 567 712 78 442
Losses (3 293 281) (33 396) (4 885 150) (50 637)
Net 4 311 565 43 723 2 682 562 27 805
The results of foreign exchange transactions are derived from the revaluation of the Bank’s foreign currency position, as well as the result of foreign currency transactions.
23. Result of financial services rendered
The caption Result of financial services rendered comprises:
2014 2014 2013 2013AOA’000 USD’000 AOA’000 USD’000
Result of financial services rendered 3 304 498 33 510 2 426 184 25 148
Commissions received 4 583 634 46 482 3 075 539 31 879
VISA and MasterCard cards 2 435 889 24 702 1 208 702 12 529
Transfers 441 825 4 480 851 412 8 825
Opening of lines of credit 587 460 5 957 308 974 3 203
Documentary credit 404 779 4 105 180 792 1 874
Other banking transactions 38 057 386 55 322 573
Other banking services 505 294 5 124 345 303 3 579
Other commitments 141 936 1 439 125 034 1 296
Securities 28 378 288 - -
Electronic settlement 16 1 - -
Commissions paid (1 279 136) (12 972) (649 355) (6 731)
VISA and MasterCard cards (1 248 811) (12 664) (602 741) (6 248)
Irrevocable lines of credit (14 146) (144) (40 420) (419)
Other commissions (16 179) (164) (6 194) (64)
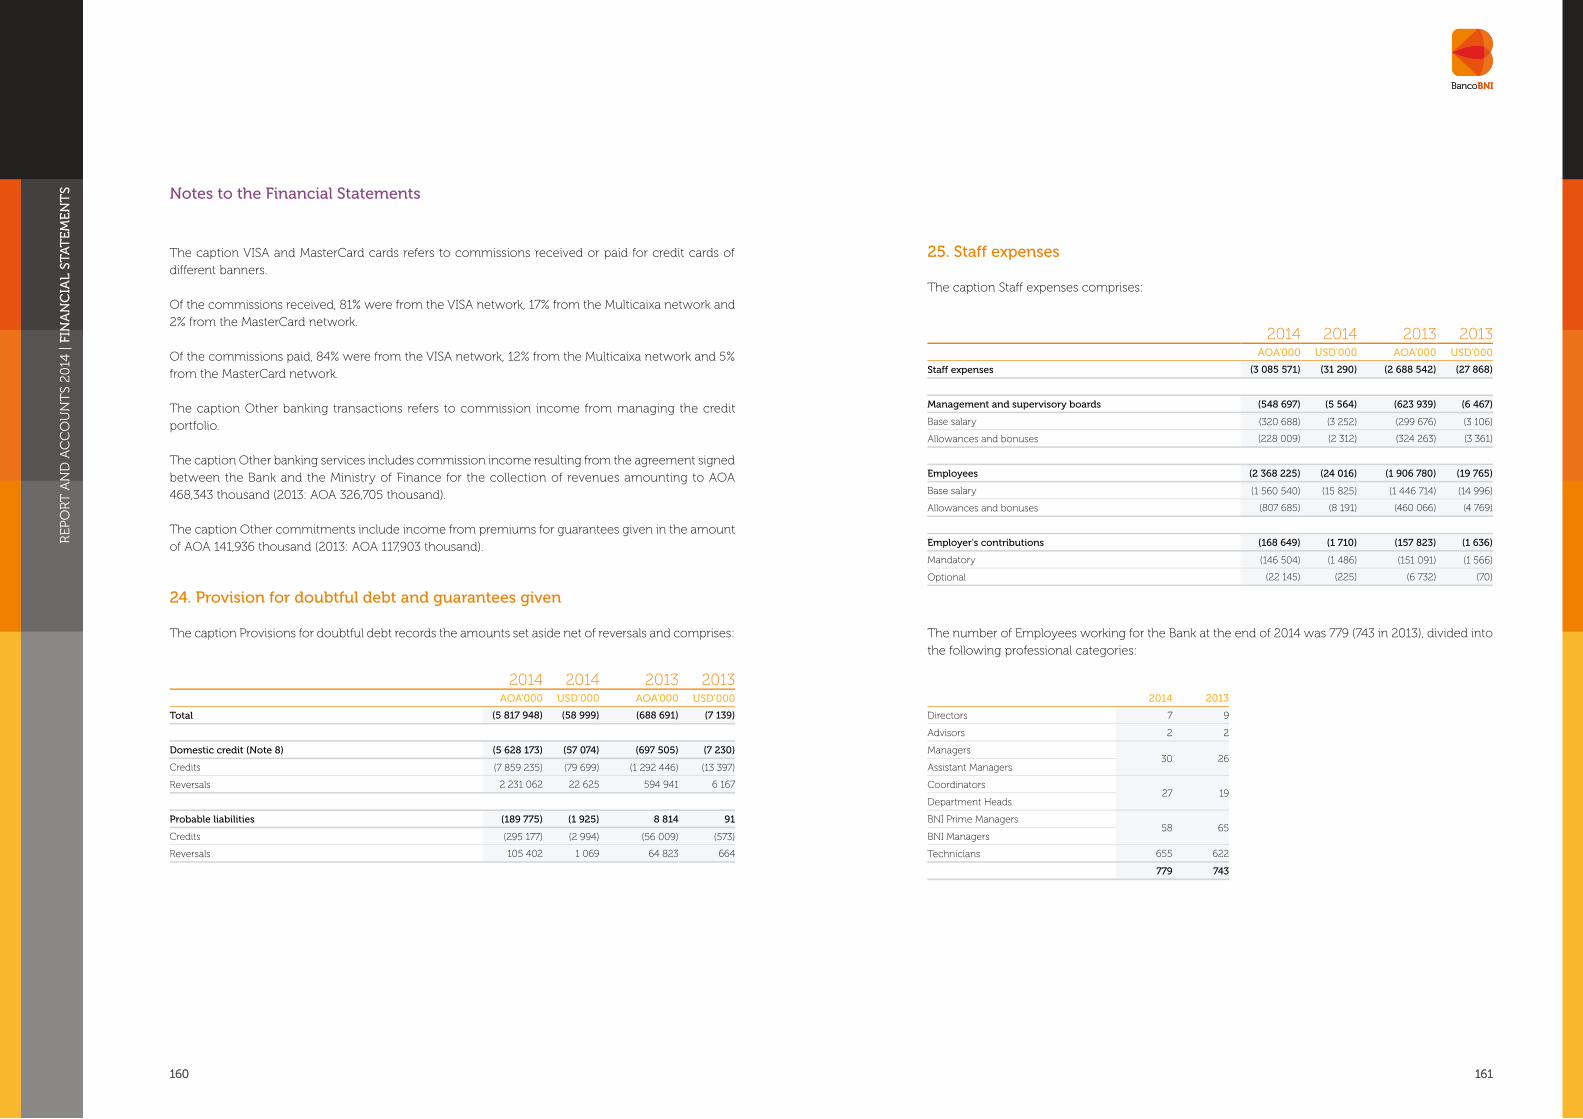
REP
OR
T A
ND
AC
CO
UN
TS
2014
| FI
NA
NC
IAL
STA
TE
ME
NT
S
160 161
REP
OR
T A
ND
AC
CO
UN
TS
2014
| FI
NA
NC
IAL
STA
TE
ME
NT
S
160 161
Notes to the Financial Statements
The caption VISA and MasterCard cards refers to commissions received or paid for credit cards of different banners.
Of the commissions received, 81% were from the VISA network, 17% from the Multicaixa network and 2% from the MasterCard network.
Of the commissions paid, 84% were from the VISA network, 12% from the Multicaixa network and 5% from the MasterCard network.
The caption Other banking transactions refers to commission income from managing the credit portfolio.
The caption Other banking services includes commission income resulting from the agreement signed between the Bank and the Ministry of Finance for the collection of revenues amounting to AOA 468,343 thousand (2013: AOA 326,705 thousand).
The caption Other commitments include income from premiums for guarantees given in the amount of AOA 141,936 thousand (2013: AOA 117,903 thousand).
24. Provision for doubtful debt and guarantees given
The caption Provisions for doubtful debt records the amounts set aside net of reversals and comprises:
2014 2014 2013 2013AOA’000 USD’000 AOA’000 USD’000
Total (5 817 948) (58 999) (688 691) (7 139)
Domestic credit (Note 8) (5 628 173) (57 074) (697 505) (7 230)
Credits (7 859 235) (79 699) (1 292 446) (13 397)
Reversals 2 231 062 22 625 594 941 6 167
Probable liabilities (189 775) (1 925) 8 814 91
Credits (295 177) (2 994) (56 009) (573)
Reversals 105 402 1 069 64 823 664
25. Staff expenses
The caption Staff expenses comprises:
2014 2014 2013 2013AOA’000 USD’000 AOA’000 USD’000
Staff expenses (3 085 571) (31 290) (2 688 542) (27 868)
Management and supervisory boards (548 697) (5 564) (623 939) (6 467)
Base salary (320 688) (3 252) (299 676) (3 106)
Allowances and bonuses (228 009) (2 312) (324 263) (3 361)
Employees (2 368 225) (24 016) (1 906 780) (19 765)
Base salary (1 560 540) (15 825) (1 446 714) (14 996)
Allowances and bonuses (807 685) (8 191) (460 066) (4 769)
Employer's contributions (168 649) (1 710) (157 823) (1 636)
Mandatory (146 504) (1 486) (151 091) (1 566)
Optional (22 145) (225) (6 732) (70)
The number of Employees working for the Bank at the end of 2014 was 779 (743 in 2013), divided into the following professional categories:
2014 2013
Directors 7 9
Advisors 2 2
Managers30 26
Assistant Managers
Coordinators27 19
Department Heads
BNI Prime Managers58 65
BNI Managers
Technicians 655 622
779 743

REP
OR
T A
ND
AC
CO
UN
TS
2014
| FI
NA
NC
IAL
STA
TE
ME
NT
S
162 163
REP
OR
T A
ND
AC
CO
UN
TS
2014
| FI
NA
NC
IAL
STA
TE
ME
NT
S
162 163
Notes to the Financial Statements
26. Third-party supplies
The caption Third-party supplies comprises:
2014 2014 2013 2013AOA’000 USD’000 AOA’000 USD’000
Third-party supplies (3 694 664) (37 467) (3 273 571) (33 932)
Communications (276 298) (2 802) (101 664) (1 054)
Water and power (69 234) (702) (18 841) (195)
Transportation, travel and accommodations (294 397) (2 985) (219 119) (2 271)
Publications, advertising and propaganda (175 901) (1 784) (82 891) (859)
Security, maintenance and repairs (408 277) (4 140) (317 465) (3 291)
Auditing, consulting and other specialized technical services (1 386 856) (14 064) (1 217 779) (12 623)
Insurance (122 824) (1 246) (124 402) (1 289)
Rentals (374 997) (3 803) (369 320) (3 828)
Misc. supplies (338 613) (3 434) (567 655) (5 884)
Other third-party supplies (247 267) (2 507) (254 435) (2 638)
The caption Audit and consultancy fees includes security services in the amounts of AOA 470,355 thousand (2013: AOA 473,366 thousand), IT consulting services in the amounts of 350,755 thousand (2013: AOA 348,301 thousand) and financial consulting services in the amount of 274,204 thousand (2013: AOA 122,974 thousand).
The caption Security, maintenance and repairs primarily comprises repair and upkeep services for machinery and tools at AOA 118,328 thousand (2013: AOA 210 thousand), cleaning services at AOA 114,807 thousand (2013: AOA 103,899 thousand) and property repair and upkeep at AOA 59,354 thousand (2013: AOA 7,924 thousand).
27. Amortization and depreciation
The caption Amortization and depreciation comprises:
2014 2014 2013 2013AOA’000 USD’000 AOA’000 USD’000
Amortization and depreciation (1 283 366) (13 014) (1 329 993) (13 786)
Tangible fixed assets (747 913) (7 584) (1 105 701) (11 461)
Properties for own use (173 595) (1 760) (617 055) (6 396)
Other fixed assets (278) (3) (53 845) (558)
Equipment (574 040) (5 821) (434 801) (4 507)
Intangible fixed assets (535 453) (5 430) (224 292) (2 325)
On 31 December 2014, intangible assets included multi-annual costs, software, units in expansion and third-party property improvements.
No third-party property improvements were recorded on 31 December 2013.
28. Provisions for other probable liabilities
The caption Provisions for other probable liabilities comprises:
2014 2014 2013 2013AOA’000 USD’000 AOA’000 USD’000
Provisions for other probable liabilities (9 335) (94) (44 148) (458)
Provisions for probable tax liabilities 23 187 234 55 796 572
Provisions for probable administrative liabilities (76 948) (780) (55 518) (569)
Provisions for probable survivor's pension liabilities 44 426 451 (44 426) (455)
29. Other operating income and costs
The caption Other operating income and costs comprises:
2014 2014 2013 2013AOA’000 USD’000 AOA’000 USD’000
Other operating income and costs 1 044 094 10 588 1 631 597 16 912
Other operating income 1 187 194 12 038 1 752 034 18 160
Recovery of credit written off 115 926 1 176 543 814 5 637
Annual fees 188 001 1 906 142 702 1 479
Other services 506 224 5 134 883 702 9 160
Other income 376 833 3 821 181 813 1 884
Irreconcilable 184 1 2 -
Irregular - - 1 -
Regular 26 - - -
Other operating costs (143 100) (1 450) (120 437) (1 248)
Regular - - (44 713) (463)
Theft (42 071) (427) (3 789) (39)
Misc. costs and losses (99 385) (1 008) (71 935) (746)
Irregular (1 331) (13) - -
Irreconcilable (313) (2) - -

REP
OR
T A
ND
AC
CO
UN
TS
2014
| FI
NA
NC
IAL
STA
TE
ME
NT
S
164 165
REP
OR
T A
ND
AC
CO
UN
TS
2014
| FI
NA
NC
IAL
STA
TE
ME
NT
S
164 165
Notes to the Financial Statements
On 31 December 2014, the caption Other services included income from withdrawals in foreign currency, office supplies, blocking of cheques, payment orders, quarterly maintenance and issuing statements.
30. Non-operating result
The caption Non-operating result comprises:
2014 2014 2013 2013AOA’000 USD’000 AOA’000 USD’000
Non-operating results 78 657 798 (455 672) (4 723)
Gains and losses on fixed assets (11 614) (118) 54 087 561
Financial fixed assets (13 866) (141) (30 608) (317)
Tangible fixed assets 2 252 23 84 695 878
Result from the disposal of fixed assets 40 070 407 - -
Tangible fixed assets 40 070 407 - -
Prior year adjustments 139 059 1 410 (509 759) (5 284)
Prior year gains 1 029 208 10 437 348 794 3 615
Prior year losses (890 149) (9 027) (858 553) (8 899)
Extraordinary result (88 858) (901) - -
Irreconcilable differences 6 0 - -
Extraordinary losses (88 864) (901) - -
31. Charges on net operating income
The Bank is subject to Industrial Tax, and is considered to be a Group A taxpayer. On 31 December 2014, its income was taxed pursuant to article 4 (1) of Law no. 19/14 of 22 October. The tax rate applicable is currently 30%, in accordance with this law, which established a transitional scheme in adopting the new Industrial Tax Code (notes 2.2 j).
On 31 December 2014 and 2013, the cost of corporate income tax recognized in the income statement amounts to AOA 92,661 thousand and AOA 1,458,254 thousand, respectively.
The Industrial Tax was calculated as follows:
2014 2013AOA’000 AOA’000
Result before taxes 1 389 140 4 217 531
Deductions and rebates (1 439 609) (665 593)
Additions 359 339 640 908
Taxable amount 308 870 4 192 846
Industrial tax (35%) 92 661 1 458 254
Net income 1 296 479 2 759 277
Effective tax rate 6,7% 34,6%
32. Balance Sheet by Currencies
Balance sheet structure by currency on 31 December 2014:
AOA’000 Dollars Euros Rand Pounds Angolan kwanza Total
Total Assets 50 438 931 5 636 821 6 678 119 418 145 891 288 202 093 137
Cash and Cash Equivalents 11 809 536 594 766 6 442 119 257 17 355 788 29 885 788
Amounts owed by credit institutions 9 261 442 939 244 - - 6 200 000 16 400 687
Securities 795 363 - - - 22 816 286 23 611 649
Payment system credits - - - - 66 970 66 970
Foreign exchange transactions 925 767 - - - - 925 767
Credit 13 690 115 - 236 100 74 754 503 88 444 953
Other assets 4 699 038 214 521 - 61 9 147 289 14 060 908
Fixed assets 9 257 670 3 888 290 - - 15 550 455 28 696 415
Total Liabilities (53 814 961) (3 463 818) (2 682) (1 071) (124 869 621) (182 152 153)
Deposits (32 891 273) (2 395 352) (2 681) (1 071) (120 053 781) (155 344 158)
Amounts owed to credit institutions (15 047 479) - - - - (15 047 479)
Payment system obligations - - - - (292 510) (292 510)
Foreign exch. transactions - - - - (926 280) (926 280)
Other amounts owed (5 227 178) (868 975) - - (882 522) (6 978 676)
Other obligations (642 502) (199 491) (1) - (2 174 011) (3 016 005)
Prov. for probable liabilities (6 528) - - - (540 517) (547 045)
Total Equity - - - - (19 940 984) (19 940 984)

REP
OR
T A
ND
AC
CO
UN
TS
2014
| FI
NA
NC
IAL
STA
TE
ME
NT
S
166 167
REP
OR
T A
ND
AC
CO
UN
TS
2014
| FI
NA
NC
IAL
STA
TE
ME
NT
S
166 167
Notes to the Financial Statements
Balance sheet structure by currency on 31 December 2013:
AOA’000 Dollars Euros Rand Pounds Angolan kwanza Total
Total Assets 57 441 313 3 664 177 7 971 24 628 123 037 845 184 175 934
Cash and Cash Equivalents 11 473 191 363 808 7 768 24 628 19 569 321 31 438 716
Amounts owed by credit institutions 26 207 307 833 340 - - 5 000 000 32 040 647
Securities 753 659 - - - 9 493 774 10 247 433
Payment system credits - - - - 600 600
Foreign exchange transactions 780 948 - - - - 780 948
Credit 17 695 343 14 203 - 68 268 217 85 963 777
Other assets 530 865 2 467 015 - - 5 096 866 8 094 746
Fixed assets - - - - 15 609 067 15 609 067
Total Liabilities (55 979 122) (2 486 450) (3 029) (4 100) (104 584 471) (163 057 172)
Deposits (34 637 505) (2 397 750) (3 028) (431) (96 460 955) (133 499 669)
Amounts owed to credit institutions (15 749 888) - - - - (15 749 888)
Payment system obligations (75) - - - (1 083 123) (1 083 198)
Foreign exch. transactions - - - - (782 904) (782 904)
Other amounts owed (4 963 186) (84 965) - (3 669) (167 993) (5 219 814)
Other obligations (614 284) (3 735) (1) - (5 737 103) (6 355 123)
Prov. for probable liabilities (14 184) - - - (352 393) (366 577)
Total Equity (46) 2 860 - - (21 121 576) (21 118 762)
33. Related parties
Shareholders
Mário Abílio Pinheiro Moreira Palhares
João Baptista de Matos
BGI
Valdomiro Minoru Dondo
José Teodoro Garcia Boyol
Ivan Leite de Morais
Óscar Tito Cardoso Fernandes
Rute Marisa Proença Brito
Arnaldo Leiro Octávio
Joaquim Manuel Nunes
Leonel da Rocha Pinto
Kanda Nimi Kassoma
Rui da Cruz
Mário de Almeida Dias
Manuel Arnaldo Calado
Carlos Manuel de Carvalho Rodrigues
Conselho Nacional de Carregadores
António de Sousa Marques de Oliveira
Corporate Boards
Mário Palhares Chairman of the Board of Directors
José Teodoro Garcia Boyol Vice-Chairman of the Board of Directors
Sandro Africano Executive Director
Lara Boyol Executive Director
Pedro Palhares Executive Director
Bruno Inglês Executive Director
João de Matos Chairman of the Presiding Board of the General Meeting of Shareholders
Bornito de Sousa Vice-Chairman of the Presiding Board of the General Meeting of Shareholders
Luís Manuel Neves Chairman of the Board of Auditors
Licínio de Assis Member of the Board of Auditors
Dina Maria Leote de Oliveira Member of the Board of Auditors
Subsidiary and associated companies
Emis - Empresa Interbancária de Serviços, SARL
BNI - Banco de Negócios Internacional (Europa), S.A.
Facilcred - Sociedade de MicroCrédito, S.A.
Other related entities
Predigest – Empreendimentos, Lda. Customer
BPI – Banco Privado Internacional Correspondent

REP
OR
T A
ND
AC
CO
UN
TS
2014
| FI
NA
NC
IAL
STA
TE
ME
NT
S
168 169
REP
OR
T A
ND
AC
CO
UN
TS
2014
| FI
NA
NC
IAL
STA
TE
ME
NT
S
168 169
Notes to the Financial Statements
On 31 December 2014, the overall amount of assets, liabilities and off-balance sheet liabilities relating to transactions with related parties, according to Banco Nacional de Angola’s applicable legislation, had the following breakdown:
AOA’000
ShareholdersGoverning
Body Members
Bank subsidiary and associated
companies
Other related entities
Outras entidades
relacionadasTotal
Assets 17 764 135 560 - 4 195 485 4 348 809
Cash and Cash Equivalents (Note 3) - - - 4 195 485 4 195 485
Total credit (Note 8) 17 740 135 560 - - 153 300
Other assets (Note 9) 24 - - - 24
Liabilities 3 308 740 452 396 165 823 514 544 4 441 503
Deposits (Note 12) 3 308 740 452 396 165 823 514 544 4 441 503
USD’000
ShareholdersGoverning
Body Members
Bank subsidiary and associated
companies
Other related entities
Outras entidades
relacionadasTotal
Assets 173 1 318 - 40 787 42 278
Cash and Cash Equivalents (Note 3) - - - 40 787 40 787
Total credit (Note 8) 173 1 318 - - 14 890
Other assets (Note 9) - - - - -
Liabilities 32 166 4 398 1 613 5 002 43 179
Deposits (Note 12) 32 166 4 398 1 613 5 002 43 179
On 31 December 2013, the overall amount of assets, liabilities and off-balance sheet liabilities relating to transactions with related parties, according to Banco Nacional de Angola’s applicable legislation, had the following breakdown:
AOA’000
Shareholders Governing Body Members
Bank subsidiary and associated
companies
Other related entities Total
Assets 598 162 23 024 83 464 2 935 250 3 639 899
Cash and Cash Equivalents (Note 3) - - - 2 935 250 2 935 250
Total credit (Note 8) 598 162 23 024 - - 621 186
Other assets (Note 9) - - 83 464 - 83 464
Liabilities 6 812 663 464 111 163 886 442 665 7 883 325
Deposits (Note 12) 6 812 663 464 111 163 886 442 665 7 883 325
USD’000
Shareholders Governing Body Members
Bank subsidiary and associated
companies
Other related entities Total
Assets 6 128 236 855 30 069 37 288
Cash and Cash Equivalents (Note 3) - - - 30 069 30 069
Total credit (Note 8) 6 128 236 - - 6 363
Other assets (Note 9) - - 855 - 855
Liabilities 69 789 4 754 1 679 4 534 80 756
Deposits (Note 12) 69 789 4 754 1 679 4 534 80 756
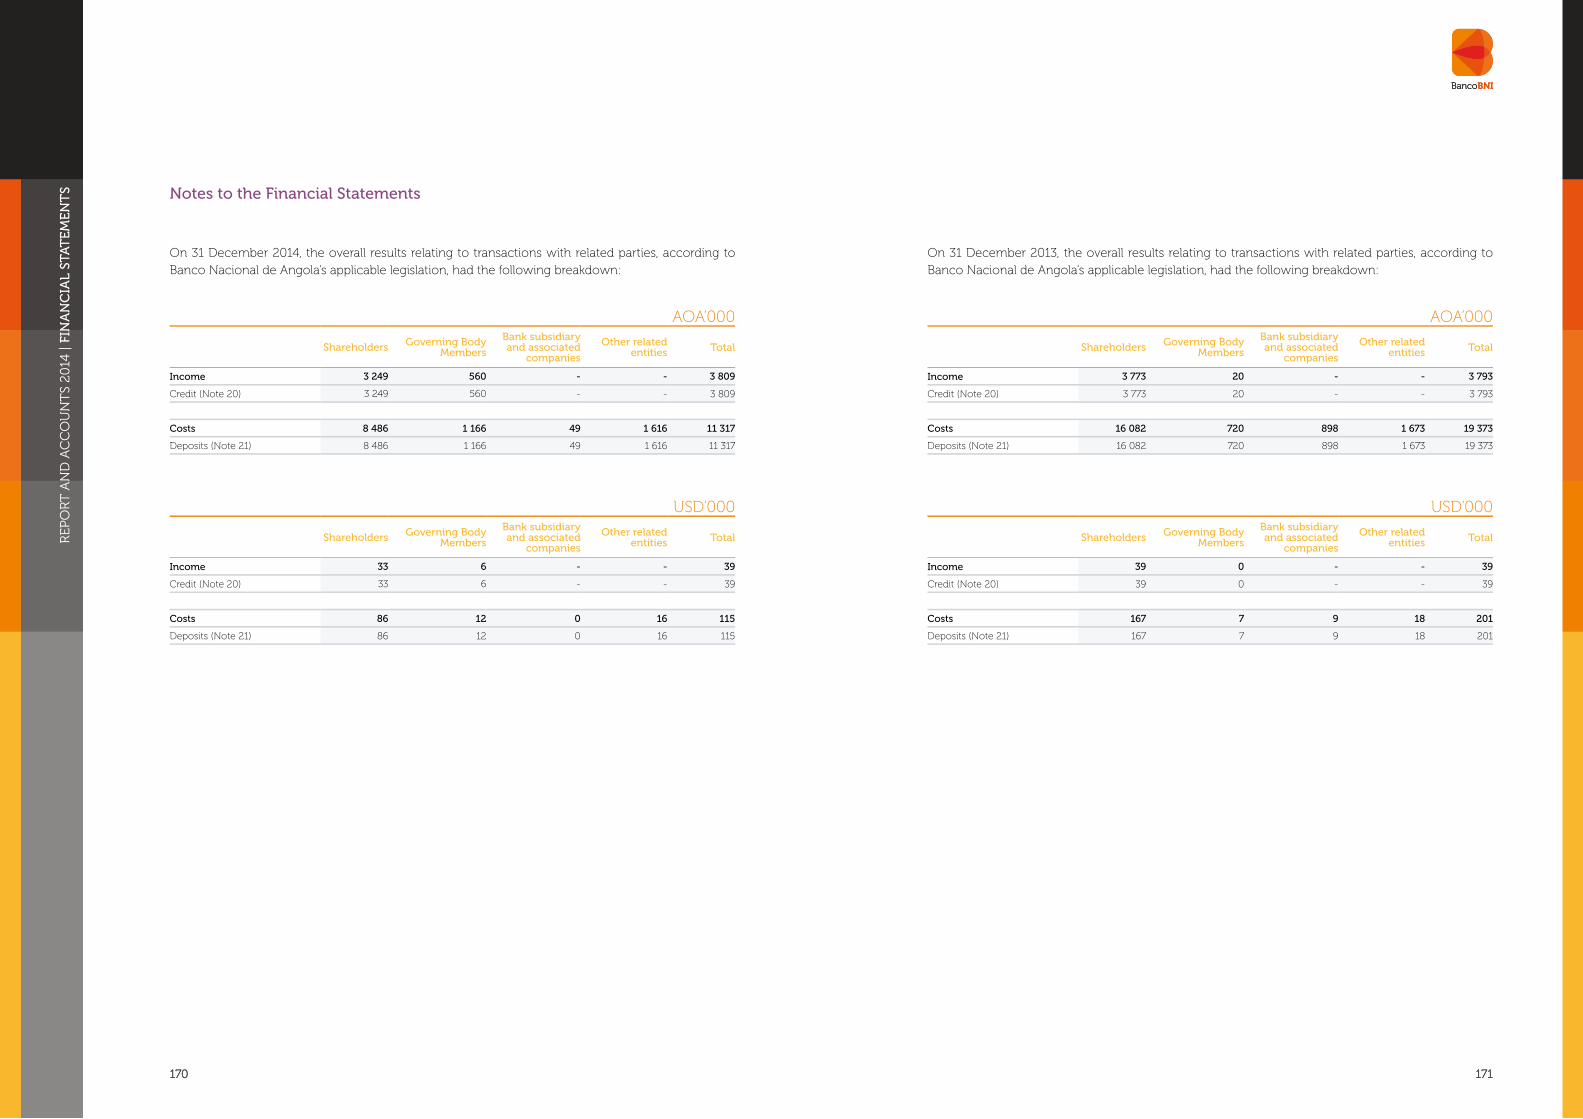
REP
OR
T A
ND
AC
CO
UN
TS
2014
| FI
NA
NC
IAL
STA
TE
ME
NT
S
170 171
REP
OR
T A
ND
AC
CO
UN
TS
2014
| FI
NA
NC
IAL
STA
TE
ME
NT
S
170 171
Notes to the Financial Statements
On 31 December 2014, the overall results relating to transactions with related parties, according to Banco Nacional de Angola’s applicable legislation, had the following breakdown:
AOA’000
Shareholders Governing Body Members
Bank subsidiary and associated
companies
Other related entities Total
Income 3 249 560 - - 3 809
Credit (Note 20) 3 249 560 - - 3 809
Costs 8 486 1 166 49 1 616 11 317
Deposits (Note 21) 8 486 1 166 49 1 616 11 317
USD’000
Shareholders Governing Body Members
Bank subsidiary and associated
companies
Other related entities Total
Income 33 6 - - 39
Credit (Note 20) 33 6 - - 39
Costs 86 12 0 16 115
Deposits (Note 21) 86 12 0 16 115
On 31 December 2013, the overall results relating to transactions with related parties, according to Banco Nacional de Angola’s applicable legislation, had the following breakdown:
AOA’000
Shareholders Governing Body Members
Bank subsidiary and associated
companies
Other related entities Total
Income 3 773 20 - - 3 793
Credit (Note 20) 3 773 20 - - 3 793
Costs 16 082 720 898 1 673 19 373
Deposits (Note 21) 16 082 720 898 1 673 19 373
USD’000
Shareholders Governing Body Members
Bank subsidiary and associated
companies
Other related entities Total
Income 39 0 - - 39
Credit (Note 20) 39 0 - - 39
Costs 167 7 9 18 201
Deposits (Note 21) 167 7 9 18 201

REP
OR
T A
ND
AC
CO
UN
TS
2014
| FI
NA
NC
IAL
STA
TE
ME
NT
S
172 173
REP
OR
T A
ND
AC
CO
UN
TS
2014
| FI
NA
NC
IAL
STA
TE
ME
NT
S
172 173
Notes to the Financial Statements
34. Guarantees and other commitments
This caption comprises:
2014 2014 2013 2013AOA’000 USD’000 AOA’000 USD’000
Third-party liabilities 32 033 407 311 419 19 153 212 196 205
Guarantees 20 526 369 199 551 13 712 533 140 471
Third-party commitments 11 507 038 111 868 5 440 679 55 734
The amounts of guarantees given are as follows:
2014 2014 2013 2013AOA’000 USD’000 AOA’000 USD’000
Guarantees 20 526 369 199 551 13 712 533 140 471
Guarantees 13 855 132 134 695 6 203 353 63 547
Documentary credit 6 671 237 64 856 7 509 180 76 924
Guarantees and sureties are banking transactions which do not translate into the mobilization of funds on the part of the Bank.
Documentary credits are irrevocable commitments on the part of the Bank and on behalf of its Customers to pay/order to pay a specified amount to the supplier of a given commodity or service, within a stipulated period, against the presentation of documents referring to the dispatching of the commodity or provision of the service. The irrevocable condition means that the commitment cannot be cancelled or altered without the express agreement of all the parties involved.
The amounts of Liabilities for guarantees given are as follows:
2014 2014 2013 2013AOA’000 USD’000 AOA’000 USD’000
Liabilities for services rendered (16 073 844) (156 265) (7 468 350) (76 505)
Services rendered by third parties (23 179 080) (225 339) (9 544 645) (97 775)
Deposit and custody of assets (23 179 080) (225 339) (9 544 645) (97 775)
Services rendered by the institution 7 105 236 69 074 2 076 295 21 270
Deposit and custody of assets 5 470 160 53 179 - -
Collection 1 635 076 15 895 2 076 295 21 270
Commitments assumed to third parties represent contractual agreements for the granting of credit with the Bank’s Customers (for example, unused lines of credit) which, as a general rule, are contracted for fixed periods or with other expiry requirements and, normally, require the payment of a commission.
35. Subsequent events
There have been no material transactions and/or relevant occurrences after the balance sheet date and before the financial statements were authorized to be issued that merit disclosure.
36. Important facts
In 2014, Banco BNI increased its share capital via an incorporation of retained earnings and free reserves in the amount of AOA 8,603,704 thousand (USD 83,642 thousand), for a total of AOA 14,642,808 thousand (USD 142,353 thousand), for a share capital increase of 142.5%.
This boosted its credibility and visibility on the domestic and international stages, as well as guaranteeing the stability of its principal ratios.

REP
OR
T A
ND
AC
CO
UN
TS
2014
| O
PIN
ION
OF
th
e A
Ud
ItO
r
174 175
OPINION OF THe AUDITOR

REP
OR
T A
ND
AC
CO
UN
TS
2014
| O
PIN
ION
OF
th
e B
OA
rd
OF
AU
dIt
Or
S
176 177
OPINION OF THe BOARD OF AUDITORS

Report & Accounts 2014
Direcção de Controle de Gestão Direcção de Marketing e Comunicação
July 2015
BNIBanco de Negócios Internacional
Avenida Che - Guevara, nº 42 - ABairro Maculusso - Município da IngombotaCx. Postal 578 Luanda - AngolaTel. +244 222 632 900
www.bni.ao
