passive mode-locking of 2-µm solid-state lasers: towards
TRANSCRIPT

Passive mode-locking of 2-µm
solid-state lasers: towards sub-10
optical cycle pulse generation
im Fachbereich Physik
der Freien Universität Berlin
eingereichte Dissertation
Yicheng Wang
2017

II
This work was carried out at the Max Born Institute for Nonlinear Optics and Ultrafast Spectroscopy,
Berlin, under the mentorship of Dr. V Petrov.
Erstgutachter: Prof. Dr. Marcus Vrakking (Betreuer)
Zweitgutachter: Prof. Dr. Ivan Buchvarov
Date of the defense: 6. November 2017

III
Abstract
This thesis is devoted to the development of novel passively mode-locked lasers around
2 micron based on the Tm and Ho trivalent ion stimulated emission in this spectral range. The
main objective of the experimental work was to investigate the limits of ultrashort pulse
generation with this kind of solid-state lasers. To this aim, novel active media and novel
saturable absorbers were studied and the performance of the mode-locked lasers was
characterized.
A fundamental prerequisite for the generation of femtosecond pulses from a mode-locked
laser is the available gain bandwidth. For the given two ions which have no alternative in this
spectral range this can be optimized in terms of flat and broad spectral gain cross-sections
only by selection of suitable host materials. The materials which were exclusively available
for this research included ceramic samples of the isotropic garnets Y3Al5O12 (YAG) and
Lu3Al5O12 (LuAG), one uniaxial disordered crystal, CaGdAlO4 (CALGO), and one biaxial
crystal with pronounced distortion of the crystal field, MgWO4. The samples used were
designed on the basis of careful spectroscopic characterization of the relevant properties and
in particular the anisotropy which offers more options for selection of the proper orientation.
The saturable absorbers employed in the 2 micron spectral range included novel GaSb-
based semiconductor saturable absorber mirrors (SESAMs) with faster relaxation times, as
well as low-loss carbon nanostructures (graphene and single-walled carbon nanotubes,
SWCNTs) deposited on transparent substrates, which typically exhibit broadband nonlinear
response. All of them can be considered as being slow in their recovery compared to the pulse
durations achieved.
Stable and self-starting SESAM mode-locking was achieved with three garnet ceramics
(Tm:YAG, Ho:YAG, and Tm:LuAG) generating picosecond pulses. Sub-picosecond
durations were obtained with the SESAM mode-locked Tm:CALGO laser. Finally, all the
saturable absorbers were compared with the Tm:MgWO4 crystal and for a specific orientation,
this laser generated for the first time sub-100 fs pulses which were characterized by
frequency-resolved optical gating (FROG) measurements.
Keywords: Tm- and Ho-doped laser materials, mode-locked solid-state lasers, femtosecond
pulses, eye-safe 2-micron ultrafast lasers, saturable absorbers

IV
Kurzzusammenfassung
Diese Arbeit widmet sich der Entwicklung von neuartigen, passiv modengekoppelten Lasern
im 2-µm Wellenlängenbereich auf der Basis von Tm- und Ho-dotierten aktiven Materialien.
Das Hauptziel der experimentellen Arbeit war es, die Grenzen der Ultrakurzpulserzeugung
mit dieser Art von Festkörperlasern zu erforschen. Zu diesem Zweck wurden neuartige aktive
Medien und neuartige sättigbare Absorber untersucht und deren Potential in
modengekoppelten Laser charakterisiert.
Eine Grundvoraussetzung für die Erzeugung von Femtosekunden-Impulsen mit einem
modengekoppelten Laser ist die verfügbare spektrale Verstärkungsbandbreite. Diese sollte ein
breites und flaches Verstärkungsprofil aufweisen, was nur durch die Auswahl geeigneter
Wirtsmaterialen optimiert werden kann. Für Tm3+
- und Ho3+
-Ionen, welche im 2-µm
Spektralbereich alternativlos sind, standen folgende Wirtsmaterialien exklusiv zur Verfügung:
keramische Proben der isotropen Granate Y3Al5O12 (YAG) und Lu3Al5O12 (LuAG), ein
uniaxialer ungeordneter Kristall, CaGdAlO4 (CALGO) und ein biaxialer Kristall mit
ausgeprägter Verzerrung des Kristallfeldes, MgWO4. Die verwendeten Laserkristalle wurden
auf der Grundlage einer sorgfältigen spektroskopischen Charakterisierung der relevanten
Eigenschaften konzipiert. Der Anisotropie wurde besonderes Augenmerk gewidmet, da sie
Auswahlmöglichkeiten für geeignete Kristallorientierungen bietet.
Die eingesetzten sättigbaren Absorber für den 2-µm Spektralbereich umfassten neuartige,
auf GaSb basierende, sättigbare Absorberspiegel (SESAMs) mit kurzen Relaxationszeiten
sowie verlustarme Kohlenstoff-Nanostrukturen (Graphen und einwandige Kohlenstoff-
Nanoröhrchen, SWCNTs). Letztere wurden auf transparenten Substraten abgeschieden und
weisen typischerweise eine breitbandige nichtlineare Response auf. Die Relaxationszeiten
aller eingesetzten sättigbaren Absorber sind lang im Vergleich zu den erreichten
Laserimpulsdauern.
Stabile und selbststartende Modenkopplung unter Verwendung von SESAMs wurde mit
drei Granatkeramiken erreicht (Tm:YAG, Ho:YAG und Tm:LuAG). Die emittierten
Pulsdauern lagen bei wenigen Pikosekunden. Kürzere Pulse, im sub-Pikosekundenbereich,
wurden mit dem gleichen Prinzip mit einen Tm:CALGO Laser erzielt. Der Vergleich aller
eingesetzter sättigbarer Absorber wurde mit dem, hinsichtlich der spektroskopischen
Eigenschaften, vielversprechendsten aktiven Material, Tm:MgWO4, durchgeführt. Unter
Verwendung eines Graphen-basierten sättigbaren Absorbers und einer spezifischen
Kristallorientierung wurden erstmals Impulse mit sub-100 fs Dauer für Festkörperlaser im 2-
µm Spektralbereich erzeugt. Die Charakterisierung dieser Pulse mittels frequenzaufgelöstem
optischem Gating (FROG) lieferte eine nahezu Fourier-limitierte Pulsqualität.

V
Contents
Glossary of abbreviations .................................................................................................... VII
Chapter 1 Introduction ........................................................................................................ 1
Chapter 2 Tm3+
and Ho3+
doped laser active materials .................................................... 9
2.1 Energy level schemes of Tm3+
and Ho3+
ions ............................................................ 12
2.2 Host materials ............................................................................................................ 15
2.2.1 YAG and LuAG ................................................................................................. 21
2.2.2 CALGO and CALYO ......................................................................................... 24
2.2.3 KLuW and MgW ................................................................................................ 27
2.3 Comparison of the Tm- and Ho-doped laser materials .............................................. 31
Chapter 3 Saturable absorbers .......................................................................................... 35
3.1 Characteristics of SAs used in mode-locked SSLs .................................................... 35
3.2 SESAMs ..................................................................................................................... 39
3.3 SAs based on carbon nanostructures ......................................................................... 42
3.3.1 SWCNT-SAs ...................................................................................................... 43
3.3.2 Graphene-SAs ..................................................................................................... 45
3.4 Comparison of different SAs employed for mode-locking at 2 µm .......................... 47
Chapter 4 Fundamentals of passive mode-locking .......................................................... 49
4.1 Pulse shaping effects .................................................................................................. 51
4.1.1 Dispersion ........................................................................................................... 51
4.1.2 Dispersion compensation .................................................................................... 54
4.1.3 Self-phase modulation (SPM) ............................................................................ 58
4.2 Haus master equation ................................................................................................. 59
4.3 Passive mode-locking mechanisms ........................................................................... 62
4.4 Solitons ...................................................................................................................... 62
4.5 Mode-locking stability ............................................................................................... 64
4.5.1 Q-switched mode-locking (QSML) instabilities ................................................ 64

VI
4.5.2 Soliton break-up ................................................................................................. 66
Chapter 5 Passively mode-locked 2-µm lasers: experimental results ........................... 69
5.1 Experimental set-up ................................................................................................... 70
5.2 Mode-locking of garnet ceramics .............................................................................. 73
5.2.1 Tm:YAG ceramics ............................................................................................. 73
5.2.2 Tm:LuAG ceramics............................................................................................ 76
5.2.3 Tunable mode-locked Ho:YAG ceramic laser ................................................... 80
5.3 Sub-ps Tm:CALGO laser .......................................................................................... 87
5.4 Femtosecond Tm:MgW laser .................................................................................... 91
5.4.1 SESAM mode-locked Tm:MgW laser ............................................................... 91
5.4.2 SWCNT-SA mode-locked Tm:MgW laser ........................................................ 93
5.4.3 Graphene-SA mode-locked Tm:MgW laser ...................................................... 96
5.4.4 Summary of the mode-locked Tm:MgW laser results ..................................... 101
5.5 Summary and comparison of the mode-locked laser results ................................... 102
Chapter 6 Conclusion and outlook ................................................................................. 105
References .......................................................................................................................... 109
List of publications ............................................................................................................... 119
Acknowledgements............................................................................................................... 123

VII
Glossary of abbreviations
AC autocorrelation
A-FPSA antiresonant Fabry–Pérot saturable absorber
AR antireflection
ASE amplified spontaneous emission
CALGO CaGdAlO4
CALYO CaYAlO4
CEP carrier-envelope phase
CM chirped mirror
CNT carbon nanotube
CPA chirped-pulse amplification
CPOPA chirped-pulse optical parametric amplification
CR cross-relaxation
CW continuous-wave
CWML continuous-wave mode-locking
Cz Czochralski
ESA excited-state absorption
ET energy-transfer
FH fourth harmonic
FROG frequency resolved optical gating
FWHM full width at half maximum
FWOT full wave optical thickness
GD group delay
GDD group delay dispersion
GSA ground-state absorption
GVD group velocity dispersion
GVM group velocity mismatch
HHG high harmonic generation
HITRAN high resolution transmission database developed at the
Harvard-Smithsonian Center for Astrophysics
IR infrared
KLM Kerr lens mode-locking
KREW KRE(WO4)2, RE = Gd, Y, Lu
LD laser diode
LIDAR light detection and ranging
Ln lanthanide
LuAG Lu3Al5O12

VIII
M migration
MBE molecular beam epitaxy
MgW MgWO4
OC output coupler
OPA optical parametric amplification
OPSL optically pumped semiconductor laser
PMMA polymethyl-methacrylate
PP prism pair
QD quantum defect
QSML Q-switched mode-locking
QW quantum well
RE rare earth
RF radio frequency
RoC radius of curvature
SA saturable absorber
SCF single crystal fiber
SESAM semiconductor saturable absorber mirror
SF self-focusing
SH second harmonic
SHG second harmonic generation
SPM self-phase modulation
SPOPO synchronously pumped optical parametric oscillator
SSL solid-state laser
SWCNT single-walled carbon nanotube
TBP time-bandwidth product
TM transition metal
TOD third order dispersion
TPA two-photon absorption
TSSG top-seeded solution growth
UC up-conversion
UCF up-conversion fluorescence
YAG Y3Al5O12
YSGG Y3Sc2Ga3O12

1
Chapter 1
Introduction
Mode-locked ultrafast solid-state lasers generating picosecond and femtosecond light pulses
in the near-IR up to ~ 3 µm have become nowadays an indispensable research tool in physics,
chemistry, biology, medicine as well as in machining and engineering [1].
Developments of such coherent sources around 2 μm, i.e. lasers based on Tm- and/or Ho-
doped materials, is drawing increasing attention in the last decade due to their unique
advantages for certain applications. Because of the strong water absorption in this spectral
range, such sources fall into the category of the “eye-safe” lasers. The “eye-safe” range starts
in fact from around 1.4 µm but Er-lasers lasers operating near 1.6 µm are much more limited
in terms of achievable efficient pumping, output power or pulse energies. In general, 2 µm
lasers are considered advantageous for free-space applications such as eye-safe LIDAR (LIght
Detection And Ranging) and gas sensing or for direct atmospheric optical communications [2,
3]. The favorable absorption in water makes them very useful for medical treatments and
highly localized surgery in particular (i.e. precise cutting of biological tissue combined with a
coagulation) [3]. Transparent plastic processing (e.g. welding of polymers) benefits from the
fact that such materials directly absorb ~ 2 µm laser light in contrast to the standard ~ 1 µm
laser sources which require artificial absorbers. All these important technological, security,
military, environmental and medical applications greatly stimulated the development of 2 µm
solid-state lasers defining a new segment in the laser market. However, apart from few
exceptions (e.g., very specific material processing or medical issues), the coherent sources
required for them emit continuous-wave (CW) radiation or pulses of nanosecond (i.e. short
but not ultrashort) durations.
Tm and Ho solid-state lasers can be divided into fiber and bulk (glass, ceramic or
crystalline) lasers, both types having their advantages and limitations. Lasers in general and
solid-state lasers in particular are often applied also to pump other lasers, basically to create
new coherent sources at different (mostly longer) wavelengths where such do not exist. This
is generally true also for ~ 2 µm lasers but it makes no sense to employ ultrafast lasers for
pumping other solid-state lasers because the relevant relaxation processes in such solids
proceed on a much slower time scale. Thus, the so-called synchronous pumping (i.e. an
ultrafast laser pumps another ultrafast laser with matched cavity length), widely employed in
the past for dye lasers [4], is not relevant to all-solid-state laser systems. It is possible,
however, to synchronously pump a nonlinear material (non-centrosymmetric crystal
exhibiting 2nd
order optical nonlinearity) in a cavity whose round-trip time corresponds
exactly to the repetition rate of the solid-state laser because this process is not related to
electronic transitions and is instantaneous in its nature. Such devices called synchronously
pumped optical parametric oscillators (SPOPOs) represent nowadays the main direct
“application” of ultrafast 2 µm lasers in laser physics because through their wide spectral

Chapter 1 Introduction
2
tunability they enable the coverage of an extremely broad part of the mid-IR part of the
spectrum (e.g., from 3 to 15 µm) [5]. The essential advantage of the pump wavelength region
around 2 µm in this case is that one can avoid another higher order but detrimental nonlinear
effect known as two-photon absorption. While this effect is present in any nonlinear crystal,
the non-oxide crystals employed in the mid-IR are narrow band-gap semiconductors and as
such cannot be pumped by the more mature ultrafast solid-state lasers emitting at ~ 800 nm or
~ 1 µm in the near-IR.
SPOPOs operating in the mid-IR possess their own great application potential related to
the so-called molecular fingerprint region (the spectral region in which the characteristic
vibrations of many molecules occur). Depending on the spectral resolution required in such
spectroscopic measurements, picosecond pulses might be more adequate than femtosecond
pulses because the temporal and spectral extents of an ultrashort pulse are linked by a relation
similar to the Heisenberg uncertainty principle. It is important to note that because the
nonlinear process is instantaneous, SPOPOs reproduce the pulse duration of the pump laser
and thus picosecond or femtosecond 2 µm lasers might be required as such pump sources. A
relatively new field based on femtosecond SPOPOs is related to frequency comb generation in
the mid-IR. In the case of femtosecond pulse durations, such frequency combs can be viewed
as a collection of ~ 105 phase-locked narrow-bandwidth CW sources, which can be applied to
massively parallel high resolution spectroscopy [6]. Direct generation of mid-IR frequency
combs is challenging due to the lack of suitable femtosecond laser sources but SPOPOs are a
very promising alternative and the best results have been demonstrated by pumping them with
femtosecond 2 µm lasers [5]. Frequency combs in the mid-IR can be also generated from a
femtosecond 2 µm laser without the SPOPO (i.e. without the complexity required to match
two cavities): Propagation in highly nonlinear fibers can be used to produce a Stokes shifted
replica of the pump by supercontinuum or Raman generation which is then parametrically
amplified by the major part of the available pulse energy near 2 µm. Also in this case the
advantage of the pump wavelength is that more efficient nonlinear crystals can be applied in
such so-called difference-frequency generation [5].
Mode-locked ultrafast oscillators emit an infinite train of ultrashort pulses typically at a
repetition rate of the order of 100 MHz: Thus, the output pulses are much shorter than the
corresponding period of ~ 10 ns. The repetition rate of some more sophisticated mode-locked
lasers may be as low as few MHz in order to achieve higher single pulse energy or as high as
few GHz, e.g. for frequency combs with increased spacing (equal to the longitudinal mode
spacing) that can be resolved by compact dispersive elements [1]. In any case the ideal regime
of operation under CW pumping is stationary or steady-state which ensures stability and
reproducibility of the pulse parameters. Such lasers are limited in their average power to about
few Watts (although the shortest pulses are demonstrated normally at average powers of the
order of 100 mW or even less) which is mainly related to the thermal load as a result of the
heat released in the laser material. This automatically sets a limit on the single pulse energy
which is normally on the nJ level or even less. There is one exception and this is the thin-disk
laser concept which enables efficient heat removal and has resulted in average powers

Chapter 1 Introduction
3
reaching the kW level and pulse energies of tens of microjoules directly from a diode-pumped
mode-locked laser, albeit at the expense of the pulse duration [7]. It shall be emphasized here
that such mode-locked lasers exist only in the 1 µm spectral range: Extension to the 2 µm
range is expected in the near future, however, there are a number of new challenges for the
thin-disk concept in this spectral range related to the lack of laser diodes for direct pumping,
adequate mode-locking elements, and suitable laser gain media.
The well-known approach to increase the pulse energy of an ultrashort pulse emitted
from a mode-locked laser in order to enable new applications is its amplification at lower
repetition rates (by picking pulses out of the ~ 100 MHz pulse train from the oscillator) [8].
This is possible because the maximum average power reflects fundamental limitations while
the pulse energy can reach even the joule level at low repetition rates down to single pulses.
Ultrafast laser amplifiers are normally based on the same or similar active medium as the seed
oscillator, however, they operate at lower repetition rates (typically from about 10 Hz up to
hundreds of kHz). The repetition rate is practically determined by the pump source of the
amplifier which again has to be pulsed, typically with nanosecond duration (ultrashort pulses
will produce higher order nonlinear effects such as self-focusing leading to optical damage),
because only by depositing a high energy into the laser amplifier medium within the
fluorescence lifetime (energy storage time) can one achieve high inversion and sufficient gain.
An exception here are fiber based ultrafast amplifiers which can be pumped by CW laser
diodes and amplify the output of a mode-locked laser (fiber or bulk type) maintaining the
original ~ 100 MHz repetition rate, however, the single pulse energy achieved in this case will
be obviously limited. In general, the so-called chirped-pulse amplification (CPA) concept is
employed to avoid higher order nonlinear effects due to the amplified pulse leading to optical
damage in the laser gain medium: The input pulse is stretched in time by dispersive elements
and recompressed after laser amplification by similar elements with opposite sign of their
group velocity dispersion. All the above applies fully to Tm- and Ho-based ultrafast
amplifiers, however, a seed oscillator (i.e. a mode-locked solid-state laser) is always needed.
Depending on the application envisaged for the ultrafast amplifier it can also operate in the
picosecond or femtosecond regime and the pulse duration is largely, though not fully
determined by the seed source. While amplified femtosecond pulses find direct applications,
amplified picosecond pulses around 2 µm are needed for pumping of optical parametric
amplifiers as discussed in the following.
The present work is devoted to the development and characterization of mode-locked Tm
and Ho lasers needed for integration in high average power and high energy laser systems
under development for applications in high field physics. This is closely related to the focus
of the research programme of the Attosecond Physics Division of the Max Born Institute. The
final goal in this case is to achieve high energy few cycle (the optical cycle is equal to ~ 7 fs
at 2 µm) pulses at relatively high repetition rates which is only possible by optical parametric
amplification (OPA), the same fundamental three-wave nonlinear optical process employed in
SPOPOs, however without a cavity thanks to the high pump intensity achievable at lower
repetition rates. OPA provides gain bandwidths much broader than any laser amplifier in
Chapter 1 Introduction
4
which the gain bandwidth is determined by the fluorescence spectrum, however, high
amplification factors are achievable only in some special cases (for specific combinations of
pump, signal and idler wavelengths) when relatively long nonlinear crystals can be applied [5].
Since pump and seed (at the signal wavelength) laser sources are available only at specific
wavelengths, the universal approach for efficient parametric amplification is related again to
stretching (i.e. chirping) of the input seed pulses and their instantaneous (in contrast to laser
amplifiers which can store the pump energy) amplification in the field of the longer pump
pulse followed by recompression to the initial pulse duration. This technique is called
chirped-pulse optical parametric amplification (CPOPA) and nowadays plays an important
role for high harmonic generation (HHG) of attosecond pulses [9]. Although state-of-the-art
HHG sources are mainly based on Ti:sapphire laser amplifiers operating near 800 nm as
driving sources, there are many efforts taking place towards longer wavelength driving lasers
since the cut-off energy of high harmonics is proportional to λ2 [9]. Therefore, the
development of ~ 2 μm femtosecond and ultimately few-cycle seed mode-locked lasers is of
great importance as they could be further parametrically amplified for HHG. The CPOPA is
normally pumped by nanosecond pulses and efficient amplification requires stretching of the
seed to a comparable duration. However, when it comes to few-cycle pulses, maintaining such
pulse durations is only possible at lower stretching factors, which requires pump sources with
duration of the order of few picoseconds. This makes picosecond 2 µm lasers interesting as
pump sources for mid-IR CPOPA (e.g., up to 8 µm for the idler) because they can ensure
access to yet higher high harmonic photon energies. Such picosecond Tm or Ho lasers can be
amplified in CPA laser systems as discussed above [10].
It should be outlined here that femtosecond lasers are nowadays no longer the only source
of a seed for high-power CPOPA systems and this holds also for the 2-µm spectral range. As
already mentioned such CPOPA chains are pumped by amplified picosecond laser systems
(most often based on the CPA architecture). The mature quality of oxide second-order
nonlinear crystals which cover the entire near-IR makes it possible to derive a seed
wavelength near 2-µm from CPA pump systems operating near 800 nm (Ti:sapphire lasers) or
near 1 µm (Yb-lasers). To this aim, apart from difference-frequency generation such schemes
employ also supercontinuum generation in bulk materials. The advantage of such methods
based on nonlinear optics is the intrinsic synchronization and the passive carrier-envelope
phase (CEP) stabilization essential for HHG with few cycle pulses [11].
The seed lasers used in the CPA pump systems normally provide much shorter pulses,
serving as a “front end” because CPA is associated with some spectral narrowing and
temporal broadening in the process of laser amplification. Therefore, it is in fact advantageous
to employ the seed laser for the generation of femtosecond pulses near 2 µm. In this case,
however, the energy obtained is very low and it may be problematic to suppress a competing
nonlinear process in the CPOPA chain called amplified parametric super-fluorescence [12].
When it comes to Ti:sapphire laser front-ends combined with Nd- or Yb-laser amplifiers in
the pump arm, separate amplification in different laser amplifiers for the seed generation will
be required which greatly increased the complexity of the entire system [13].

Chapter 1 Introduction
5
A seed pulse for CPOPA near 2 µm can be directly derived also from the CPA pump
system: The supercontinuum generation necessary to shift the wavelength and achieve finally
few-cycle pulse durations is, however, much more difficult with picosecond systems and this
works with Yb-laser (but not with Nd-laser) based systems operating in the 1 µm spectral
range [14]. Availability of femtosecond mode-locked lasers near 2-µm as direct seed sources
for CPOPA systems could offer major advantages due to the higher seed level. However, the
perfect solution for subsequent HHG will require durations down to the few optical cycles and
CEP stabilization. Second-harmonic generation from such femtosecond lasers could provide
simultaneously convenient seed for 1-µm based CPA amplifiers based on Nd- or Yb-lasers to
be employed as a pump for the CPOPA. The major advantage of a CPOPA system at 2 µm,
pumped near 1 µm, is that operation near degeneracy results in substantially broader
parametric gain and allows one to use longer nonlinear crystals [5].
The present work is devoted to passively mode-locked bulk solid-state lasers operating in
the 2 µm spectral range. This research field advances in steady competition with fiber based
systems which have certain advantages but exhibit also some limitations. In fiber lasers,
because of the very long active material length and small mode area, there will be strong
nonlinear effects leading to structured spectra, the phase noise is much more pronounced and
there may be uncontrolled birefringence leading to unpredictable polarization.
The ideal laser material for generating ultrashort pulses will exhibit high absorption and
emission cross-sections as well as broad and flat gain spectral shape. However, due to
fundamental relationships between these spectroscopic characteristics (the mechanisms for
line broadening), a trade-off is inevitable. Other aspects of the laser material such as thermo-
mechanical properties or anisotropy are also crucial for the mode-locked laser stability and
power scaling. The objective of this thesis is to demonstrate a kind of a roadmap towards
ultrashort pulse generation in the 2 μm spectral range by mode-locked Tm and Ho lasers that
could be useful for the above discussed applications. Besides the laser material, another cavity
element of crucial importance to shorten the pulse duration and realize this objective is the
saturable absorber which initiates and sustains mode-locked operation ensuring long-term
stability against noise and fluctuations. There is, however, a second important reason to
include separate introductory chapters devoted to the laser materials and saturable absorbers
employed in the present work: All of them were provided by different collaboration partners
(from China, Spain and Germany for the laser crystals and ceramics, and from Finland and
South Korea for the semiconductor and carbon nanostructures). On one hand, the exclusive
access to these materials and structures was instrumental in achieving results beyond the state-
of-the-art. On the other hand, all of them exhibit some novel features in relation to the spectral
range of application and are still in a development stage, with ongoing characterization and
optimization by the research groups manufacturing them, for which a feedback from laser
experiments is of major importance. Therefore, all the resulting publications are joint works
with the researchers who supplied these components: Without them the present PhD work
would be impossible to realize.

Chapter 1 Introduction
6
The thesis begins with Chapter 2 which gives an overview of the active dopant ions and
the host materials for the 2 μm spectral range, including energy level schemes of the Tm3+
and
Ho3+
ions, the processes of excitation, emission and different interactions between the ions.
Then three families of hosts and in particular specific representatives of them are presented
and compared in terms of polarized absorption, emission and gain cross sections as well as
upper state lifetime. These spectroscopic results are directly related to the main experimental
part of the dissertation which is devoted to the mode-locking of 2 µm solid-state lasers
because exactly the same materials, including isotropic ceramics, uniaxial and biaxial crystals
with Tm and Ho doping, are employed there as active elements in the laser setup.
Chapter 3 explains the principle of operation of relevant saturable absorbers which
represent the key cavity element to transform a CW solid-state laser into an ultrafast laser by
locking the phase of the longitudinal modes through a “passive” method, i.e. by the evolving
pulse itself. Special emphasis is given to the saturation and relaxation behavior of those
saturable absorbers that are employed in the mode-locking experiments, which include
semiconductors and carbon nanostructures, i.e. single-walled carbon nanotubes (SWCNTs)
and graphene. All known parameters and characteristics of the saturable absorbers used later
on are summarized in this chapter.
The specific saturation behavior of the laser materials and the saturable absorbers applied
in the 2-µm spectral range is essential for understanding the mode-locking regime which is
realized in such solid-state lasers. That is why these chapters precede the presentation of the
different mode-locking techniques in Chapter 4. Chapter 4 first provides a brief theoretical
background of passive mode-locking explaining the differences and the advantages with
respect to active mode-locking (and also the possibility of Q-switching), including all the
pulse shaping mechanisms and their role in the formation of the steady-state. Special
emphasis is given here to the effects of group velocity dispersion and its compensation as well
as the self-phase modulation. These two effects show some peculiarities in the 2 µm spectral
range (e.g., compared to shorter wavelengths, the dispersion may be anomalous and the self-
phase modulation is expected to be much weaker far from the material band-gap), however,
the differences are basically quantitative.
Then a model of steady-state passive mode-locking is presented in Chapter 4 based on the
assumption of slight changes of the pulse parameters in each of the cavity elements, leading to
an equation widely known in the literature as Haus master equation. This equation can be
used for analytical and numerical modeling of many types of passively mode-locked laser
systems and while steady-state modeling of the obtained results goes beyond the scope of the
present work, it is essential to show that there is a theoretical background for the pulse shapes
normally assumed when measuring the pulse durations of ultrashort pulses by the
autocorrelation technique. Three most important passive mode-locking concepts are
subsequently discussed which are related to the spectroscopic properties of the laser medium
and the saturable absorber. The mode-locked lasers considered in the present work belong to
one of them. A brief insight into soliton-like pulses and their properties is presented, both in
the narrow sense including self-phase modulation and anomalous dispersion, and also in the

Chapter 1 Introduction
7
more general case with all pulse shaping effects present in the laser model. Finally, the
stability of the steady-state mode-locking regime as well as methods that can ensure such
stability are discussed. This concerns Q-switching instabilities and pulse break-up, both of
which were encountered in the experimental part. Special emphasis is given here to a
fundamental soliton bound-state (two pulses at a separation comparable to their duration)
because this really exotic effect has been experimentally observed, too.
Chapter 5 can be considered as the main body of this dissertation because it summarizes
the essential experimental results achieved in the present work with passively mode-locked
bulk Tm and Ho lasers emitting near 2 µm. The common laser cavity is described first
together with all the relevant elements, pump sources and diagnostic tools. Then all the
experimental results with the different materials are presented and discussed in terms of pulse
duration, spectral width, average output power, stability, etc. These include picosecond, sub-
picosecond and femtosecond operation culminating in the generation of the shortest pulses so
far from a 2 µm bulk solid-state laser which were below 100 fs. Wherever possible, soliton-
like pulse-shaping is analyzed as well as the existence of multi-pulses and bound states.
Chapter 5 ends with a table where the obtained results are compared with literature data on
mode-locked solid-state lasers with respect to all the essential output characteristics.
The final Chapter 6 provides a summary of the achievements and gives an outlook on
their possible extensions and direct applications in the near future.
As already mentioned, the major contributions of the present work are found in Chapter 5
where the author had the leading role in all experiments. However, some additional
contributions are included also in Chapter 2: They concern spectroscopic properties,
anisotropy, identification of orientation, and in general characterization of some of the laser
materials as explained in the corresponding places. In the end of the Dissertation, after the list
of references, a list of publications is included which were used as a basis when writing the
present text and where more detailed information can be found on the different subjects. An
additional list contains all publications that appeared in the period of the PhD work but which
finally remained outside the scope of the thesis.

Chapter 1 Introduction
8

9
Chapter 2
Tm3+
and Ho3+
doped laser active materials
Laser active materials must exhibit sharp fluorescent lines, strong absorption bands and high
quantum efficiency for the fluorescent transition of interest: Solids with such properties are
crystals, ceramics or glasses that incorporate in small amounts elements in which optical
transitions can occur between different states. In the near-IR spectral range from 0.7 to 3 µm,
coherent sources based on laser emission from solids (solid-state lasers or SSLs) rely on
emission from two kinds of ions: transition metals (TM), such as chromium (Cr3+
, Cr4+
, Cr2+
)
and titanium (Ti3+
), and trivalent lanthanide (Ln3+
) ions including ytterbium (Yb3+
),
neodymium (Nd3+
), erbium (Er3+
), thulium (Tm3+
) and holmium (Ho3+
), as shown in Fig. 2.1.
1.0 1.5 2.0 2.5 3.00
20
40
60
80
100
Tra
nsm
itta
nce [
%]
Wavelength [µm]
USA model, mean latitude, summer, H=0 L=1m
CH4
CO2
H2OH2OH2OH2O
Ti3+ Er3+ Cr2+Ho3+Tm3+
Cr3+
Cr4+
Yb3+
Er3+Nd3+
Fig. 2.1 Laser emission of different ions in the near-IR (0.7-3 µm). The gray line shows the air
transmission at normal conditions, calculated from the HITRAN database for a path length of 1 m.
TM lasers are characterized by strong interaction of electronic transitions with phonons –
vibrational-electronic (vibronic) interaction – which leads to large laser gain bandwidth. More
phonons can be emitted or phonon absorption can be involved in optical transitions. Vibronic
lasers are widely tunable lasers, called in the past also phonon-terminated SSLs. Most Ln
lasers are NOT vibronic lasers. Nevertheless, phonons play other important roles in Ln lasers:
They lead to fast thermalization within Stark level manifolds and fast non-radiative transitions
between close manifolds. In many cases, such fast non-radiative transitions are essential for
pumping and/or for depopulating the lower laser level.
The ground state electronic configuration of the Ln atom consists of a core that is
identical to xenon, plus additional electrons in higher orbits. In Xe, the shells n=1,2,3 are
completely filled, the shell n=4 has its s, p, and d subshells filled, whereas the 4f subshell

Chapter 2 Tm3+
and Ho3+
doped laser active materials
10
capable of accommodating 14 electrons is empty. However, the n=5 shell has acquired its first
8 electrons which fill the 5s and 5p orbits: 1s22s
22p
63s
23p
63d
104s
24p
64d
105s
25p
6.
Table 2.1 Electronic configurations of the Ln atoms (57-71) and some Ln3+
-ions. Not all Ln-ions
have optical transitions to be considered as laser-active. Some Ln-ions such as Gd and Lu are
“passive” and thus more suited for host compounds to be substituted by an active dopant ion,
preferably a neighbor in the periodic table.
No. Chemical element Number of electrons in
shells n=1,2,3,4,5,6
Ln3+
-ion
configuration
54 Xenon 2, 8, 18, 18, 8
55 Caesium 2, 8, 18, 18, 8, 1
56 Barium 2, 8, 18, 18, 8, 2
57 Lanthanum 2, 8, 18, 18, 9, 2
58 Cerium 2, 8, 18, 19, 9, 2
59 Praseodymuim 2, 8, 18, 21, 8, 2
60 Neodymium 2, 8, 18, 22, 8, 2 Nd3+
: [Xe]4f3
... ... ... ...
67 Holmium 2, 8, 18, 29, 8, 2 Ho3+
: [Xe]4f10
68 Erbium 2, 8, 18, 30, 8, 2 Er3+
: [Xe]4f11
69 Thulium 2, 8, 18, 31, 8, 2 Tm3+
: [Xe]4f12
70 Ytterbium 2, 8, 18, 32, 8, 2 Yb3+
: [Xe]4f13
71 Lutetium 2, 8, 18, 32, 9, 2
The number of 4f electrons in Ln atoms increases from 1 (Ce) to 14 (Yb, Lu). The sharp
fluorescence lines in Ln3+
ions result from the fact that the 4f electrons involved in optical
transitions are shielded by the outer shells (5s, 5p) from the surrounding crystal lattice. The
corresponding transitions are similar to those in the free ions.
Fig. 2.2 Energy level scheme of Ho3+
in YSGG (Y3Sc2Ga3O12, a garnet crystal) (a) and
magnitude of the different splitting mechanisms in Ln3+
ions (b). Note that pump and laser
transitions in Ho and Tm lasers are intra-configurational (i.e. within 4f10
and 4f12
, respectively).

Chapter 2 Tm3+
and Ho3+
doped laser active materials
11
In Ln ions, the Coulomb and spin-orbit interactions are similar in magnitude and the
crystal field splitting acts as a small perturbation, see Fig. 2.2. In TM ions, the crystal-field
splitting dominates the spin-orbit splitting: The optical transitions are 3d-3d in the outer shell
and the vibronic character is much stronger (e.g. Ti3+
:sapphire), however, there exist also
narrow lines (R-lines in Cr3+
:Al2O3 or ruby) or combination of narrow-band and vibronic
transitions (Cr3+
:BeAl2O4 or alexandrite), with all these examples in the same spectral range.
Which of the Ln ions are more vibronic and why? A complete theoretical treatment is not
available [15] but at least the spectroscopy confirms that the vibronic character tends to
increase for active ions towards the end of the Ln3+
series: Yb3+
, Tm3+
, etc. The question is
also not very precisely formulated because more than one electronic transitions exist in many
Ln ions and the situation for them might be different. However, the answer to this question
remains important because ultrashort pulse (ps and fs) SSLs can be built only with broadly
tunable active media, i.e. partly vibronic materials. In cases when the laser transitions are
narrow-band, e.g. Nd3+
or Er3+
, fs pulses can only be produced with glass hosting these ions.
Air absorption and in particular water absorption as indicated in Fig. 2.1 define important
applications of SSLs. The latter can be based on material absorption but also on the absence
of such absorption, e.g. the Er3+
transition at 1.6 µm for telecommunications. Er3+
lasers
emitting near 3 µm are widely used e.g. in medical applications but the penetration depth is
too low for minimally invasive surgical treatment. Near 2 µm, even the small difference in the
wavelength between Tm-lasers (emitting in general below 2 µm) and Ho-lasers (slightly
above 2 µm) can play a significant role [3].
In this work the main interest is exactly in this same wavelength range near 2 µm but the
motivation comes from a different kind of applications which require ultrashort (ps and fs)
pulses, as explained in the Introduction. Tm3+
and Ho3+
ions and in particular their transitions
to the ground state (i.e. the ~ 2 µm transitions) offer nowadays the most attractive properties
for laser operation in this spectral range. Indeed, continuous-wave (CW) and pulsed, i.e. in the
Q-switched (QS) or mode-locked (ML) regimes which will be explained in Chapter 4,
operation of such lasers, in particular under laser-diode pumping, has been drawing increasing
attention over the last two decades [16, 17].
Table 2.2 Ln-ion transitions for which mode-locked lasers have been demonstrated in the ps or fs
regimes. The right column shows typical optical sources employed for pumping (LD: laser diode,
SH: second harmonic, FH: fourth harmonic, OPSL: optically pumped semiconductor laser).
Laser ion Laser wavelengths Emission range Pump source
Nd3+
0.9 μm, 1.06 μm, 1.3 μm near-IR Ln lasers AlGaAs LD
Yb3+
1.0−1.1 μm InGaAs LD
Tm3+
2 μm AlGaAs LD or Tm
Ho3+
2 μm AlGaIn-AsSb LD or Tm
Er3+
1.6 μm, 3 μm Yb-Er or InGaAsP LD
Pr3+
0.52 μm, 0.60 μm
0.64 μm, 0.72 μm
Visible Ln lasers (InGa)N LD or SH OPSL
*Ce3+
0.3 μm UV Ln lasers GaN LD or FH Nd
*Inter-configurational, electric-dipole allowed transition, with characteristics similar to laser dyes.

Chapter 2 Tm3+
and Ho3+
doped laser active materials
12
It shall be mentioned that in the past also so-called color-center SSLs were employed for
the generation of ultrashort pulses near 2 µm [18] but they have lost their importance because
of the cryogenic temperatures required. Nowadays, in addition to SSLs, also parametric
frequency down-conversion in nonlinear crystals from the 1-µm spectral range (Nd- and Yb-
lasers) or the 800-nm range (Ti:sapphire laser) can be used to obtain ultrashort pulses near
2 µm, however, at the cost of greatly increased complexity of such systems. Table 2.2
summarizes the Ln ion transitions on which mode-locking has been demonstrated to generate
ultrashort pulses and indicates the pump sources employed in each case.
When Tm3+
and Ho3+
ions are introduced into the laser host, the electric crystal field
produces a Stark-splitting. The relevant laser transitions (3F4 →
3H6 for Tm
3+ and
5I7 →
5I8 for
Ho3+
) of these two ions for the 2-μm emission both end in the upper Stark levels of the ground
state manifold. Thus, lasing is described using a so-called quasi-3-level model.
In this chapter, the energy level schemes of Tm3+
and Ho3+
are discussed first, including
the processes of excitation, emission and different interactions between the ions. Then
representatives of three different families of hosts, which are employed in the laser
experimental part, are presented in more detail, with emphasis on their spectroscopic
properties such as polarized absorption, emission and gain cross sections as well as the upper
state lifetime.
2.1 Energy level schemes of Tm3+
and Ho3+
ions
Population inversion between the upper and lower levels of a laser transition is essential for
laser amplification and more than two energy levels are needed to achieve this. Most lasers
usually operate in one of the three fundamental schemes: 4-level scheme, 3-level scheme and
quasi-3-level scheme, as shown as Fig. 2.3. The ruby laser (Cr3+
:Al2O3) is an example of a 3-
level scheme [19].The threshold pump power is high in this case since population inversion
can be achieved only when more than half of the ions are excited into the upper laser level. In
the 4-level scheme, typical for Nd-lasers operating on the 1.06 µm transition, the threshold
can be much lower since the lower laser level is not populated; in the lasing state, fast non-
radiative decay from this level to the ground state will keep the population inversion.
Fig. 2.3 Energy level diagrams for different laser schemes: (a): 3-level scheme, (b): 4-level scheme,
(c): quasi-3-level scheme. Dashed arrows indicate fast non-radiative decay processes.
(a) (b) (c)
Pump
Laser
Pump
Laser
Pump
Laser

2.1 Energy level schemes of Tm3+
and Ho3+
ions
13
As most of the Ln ion transitions included in Table 2.2, the relevant 2-µm transitions in
Tm3+
and Ho3+
ions can be described as quasi-3-level schemes, which is a kind of
intermediate case. The lower laser level is an upper Stark component of the ground state
manifold with appreciable population at the operating temperature. Typically, 2% of the ions
can be in the lower laser level at room temperature. This leads to several features which are
specific for quasi-3-level lasers:
Weakly pumped regions of the gain medium still cause some reabsorption loss at the
laser wavelength and higher pump intensities are needed, achievable only with high
brightness pump sources.
The spectral shape of the optical gain depends on the excitation level because of the
reabsorption. As a consequence, the laser wavelength depends on the cavity losses as
well as the doping concentration. High cavity losses or low doping concentration
require a higher inversion: The maximum gain shifts then to shorter wavelengths.
The above consideration follows the most widespread classification in the existing
literature but is only qualitative. Pronounced 3-level behavior is inevitable for gain media
with a very small quantum defect (QD = 1-λP/λL, where the subscripts P and L stand for the
pump and laser wavelengths; QD determines the maximum possible laser efficiency), because
this enforces a small energy spacing between the lower laser level and the ground state, so
that thermal population of the lower laser level is significant. The transition between 4- and 3-
level systems can be smooth and the extent of being a 3-level-system depends on the exact
laser wavelength and operating temperature. The systematics of such schemes can be in fact
quantified with precise definitions of quasi-2-, quasi-3-, and quasi-4-level schemes [20].
The relevant energy level scheme for the Tm3+
ion is shown in Fig 2.4a. Excitation of Tm
lasers is usually at λP ~ 800 nm (3H6 →
3H4 transition), which matches very well the emission
of AlGaAs laser diodes. Laser operation is achieved typically at λL ~ 1.95 μm due to the 3F4
→ 3H6 transition. This results in a low Stokes efficiency, ηSt = λP/λL ~ 0.41. However, a
special feature of the Tm3+
system is the very strong cross-relaxation (CR) mechanism for two
adjacent ions, 3H4 +
3H6 →
3F4 +
3F4 [21]. This non-radiative process ideally generates two
photons at ~ 1.95 μm from only one pump photon at ~ 0.8 μm, resulting in a much higher ηSt
of 2λP/λL ~ 0.82. Laser operation with strong CR is very desirable for increase of the
efficiency and reduction of the heat load. The latter can be estimated as ηh = 1 – 2λp/λL ~ 0.18
which is lower than for Nd3+
ions (ηh ~ 0.24) pumped at the same wavelength. The efficiency
of the CR process strongly depends on the doping concentration (~ N2) since the involved
dipole-dipole interaction probability depends on the ion spacing [22]. For many Tm3+
-doped
materials, a very high CR efficiency for reasonable Tm3+
doping concentrations (3-5 at. %)
has been demonstrated and, consequently, a high laser efficiency has been achieved. It is also
possible to pump the 3F4 energy level directly between 1.7 and 1.8 µm (in-band pumping), but
no well-developed pump sources suitable for this exist.
CR is only one of the few non-radiative energy-transfer (ET) processes in which no
emission / absorption of a photon is involved. In the opposite direction, up-conversion (UC)

Chapter 2 Tm3+
and Ho3+
doped laser active materials
14
processes occur. Starting from the upper laser level, UC processes are phonon assisted. One
such process is the reverse of the mentioned CR process, i.e. 3F4 +
3F4 →
3H4 +
3H6 which
leads to UC fluorescence (UCF) from 3H4 but it introduces negligible losses. The other UC
process from this level is 3F4 +
3F4 →
3H5 +
3H6 and in this case the excitation of one ion is
lost. The 3H5 state has a very short lifetime and is depopulated by a non-radiative process
3H5
→ 3F4 which generates heat in the crystal.
Excited-state absorption (ESA) is another important process limiting the performance of
Ln SSLs. ESA results in a depopulation of the pump level or emitting state with the excitation
of the Ln ions to higher-lying multiplets and leads to UCF processes. Non-radiative or
radiative transitions from these multiplets result in an additional heat load and decrease the
laser efficiency. ESA of laser photons may occur also from 3F4 to
3H4 or from
3H4 to
1G4.
When pumping Tm3+
ions at ~ 800 nm, 3H5 →
1G4 ESA may be observed. As a result of the
population of the 1G4 higher-lying multiplet (~ 21500 cm
-1), several visible up-conversion
emissions occur at ~ 480 nm (to the 3H6 ground-state, observed in the blue), at ~ 650 nm (to
the 3F4 state, in the red) and at ~ 800 nm (to the
3H5 state, in the near-IR). As the energy gap
between the 3F2,3 states and the lower-lying
3H4 pump state is small (~ 2000 cm
-1), a fast non-
radiative relaxation suppresses any additional parasitic emissions. UCF in singly Tm3+
-doped
materials is relatively weak.
Fig. 2.4 Detailed energy level diagrams of the Tm3+
ion (a) and of Tm3+
and Ho3+
ions (b)
indicating the resonant excited levels: UC – up-conversion, UCF – UC fluorescence, ESA –
excited-state absorption, CR – cross-relaxation, M – migration, NR – non-radiative relaxation. In
(a), all processes exist in both ions but for clarity they are arbitrarily distributed between the two.
Considering a fast and efficient CR mechanism for highly Tm3+
-doped laser materials,
one can neglect the population of all multiplets with the exception of the 3H6 ground state (N1)
and the 3F4 upper laser level (N2), so that N1 + N2 ≈ NTm where NTm is the Tm
3+ concentration.
1G4
3F23F33H4
3H5
3F4
3H6
1G4
3F23F33H4
3H5
3F4
3H6
E, 10 cm3 -1
0
5
10
15
20
0
5
10
15
20
E, 10 cm3 -1
5 3F2 8 , K
5F35 5S2 , F4
5F5
5I4
5I5
5I6
5I7
5I8
Tm3+
Tm3+
Tm3+
Ho3+
CR
ESA
pump~0.8 mμ
laser~1.95 mμ
~0.8 mμ
~0.48 mμ
~0.65 mμ
UCF
M
M
M
pump~0.8 mμ
laser~2.1 mμ
UC
NR
(a) (b)
UC
NR
UC

2.2 Host materials
15
The Ho3+
ion exhibits no absorption bands in the emission range of standard laser diodes
and Ho-lasers were mainly lamp-pumped in the past. At present, most attractive is in-band
pumping into the upper laser level using high-power Tm-fiber lasers or AlGaIn-AsSb diodes
at wavelengths slightly below 2 μm (Table 2.2). Co-doping with Tm3+
is another method of
pumping through an efficient migration (M), another ET process, between Tm3+
(3F4) and
Ho3+
(5I7) ions:
3F4 +
5I8 →
3H6 +
5I7, see Fig. 2.4b. Typically, at optimum co-doping and
room temperature, about 50% of the excitation energy can be transferred to the Ho3+
ions, the
rest of the energy is stored in excited Tm3+
ions.
The Ho-laser emission around 2 μm is a result of the 5I7 →
5I8 transition. UC processes
exist in Ho3+
, too. In Fig. 2.4b two such phonon-assisted UC processes are indicated: 5I7 +
5I7
→ 5I6 +
5I8 and
5I7 +
5I7 →
5I5 +
5I8. They become important at high inversion levels. In co-
doped crystals, CR processes occur also between Tm3+
and Ho3+
ions and there are M
processes also between other higher-lying excited states, cf. Fig. 2.4b.
Ho3+
ions show somewhat narrower optical bands, more structured compared to Tm3+
because of the lower number of 4f electrons. However, Ho-lasers are still very attractive for
ultrashort pulse generation because the pump scheme offers more options for power scaling.
2.2 Host materials
Host materials can be classified as crystals, glasses and ceramics. Crystals belong to one of
the 32 symmetry classes (point groups) which are grouped in 7 crystal systems. From the
point of view of linear optics, crystals are isotropic (cubic), uniaxial (trigonal, tetragonal and
hexagonal), and biaxial (orthorhombic, monoclinic and triclinic). For electric dipole
transitions in birefringent crystals the interaction of the dopant ion with light depends only on
the polarization but not on the propagation direction.
The absorption and emission probabilities are described in terms of interaction cross-
sections. The meaning of the absorption cross-section for instance can be easily understood
from the Lambert-Beer law (transmission 𝑇 = 𝐼/𝐼0 = 𝑒−𝛼 ), where the dimensionless
absorption coefficient is given by 𝛼 = 𝜎𝑎(𝜆)𝑁𝐿 (L: sample length). The factor 𝜎𝑎(𝜆) has a
dimension of area (cm2). It can be interpreted as the probability of a photon to hit an ion
which may be viewed as a 'target' with such area. The larger the cross section, the higher the
probability that the 'target' will be hit.
In uniaxial crystals, the spectroscopic notations are for light polarization perpendicular
to the optic axis c and for polarization parallel to the optic axis c. The interaction cross-
sections depend on the wavelength: For one and the same electronic transition they can be
higher for one of these polarizations at a certain wavelength but the situation may be reversed
at a different wavelength. Obviously, maximum cross-sections may occur also at some
intermediate polarization. Nevertheless, to avoid polarization rotation effects leading to cavity
losses, one usually selects the laser polarization to be one of the two principal polarizations,
or . Normally it is the one that ensures higher gain but in a mode-locked laser it can be also
the one providing larger bandwidth. If polarization is selected, the active element has the so-

Chapter 2 Tm3+
and Ho3+
doped laser active materials
16
called a-cut (propagation along one of the two a-axes). If polarization is selected, the cut
can be either a-cut or c-cut and the exact choice may depend on other anisotropic properties
such as thermal conductivity which determines the cooling efficiency.
Also the pump polarization might have to be taken into account because although in
many cases it coincides with the laser polarization (when the active element is uncoated and
inclined under Brewster’s angle to prevent Fresnel reflection losses), laser diodes used for
pumping are often unpolarized when coupled into fibers and antireflection (AR) coated
elements used at normal incidence are preferable. The polarization dependence of the crystal
absorption is different from the one of the emission and in this case one can select the
configuration that ensures higher overall pump absorption.
From Maxwell’s equations one can derive that in a crystal there can be zero, one or two
optic axes in the sense that for propagation along these special directions the index of
refraction is independent of the polarization direction [23]. The two optic axes in biaxial
crystals are important for some effects (e.g. in polarization rotators) but do not play an
essential role in laser physics or nonlinear optics. Instead, the so-called dielectric frame is
considered here, also known as the frame of the optical ellipsoid or optical indicatrix [23]: It
is the orthogonal eigenframe of the tensor of the linear electric susceptibility which will be
defined in Chapter 4. The corresponding 3 axes are designated as principal axes; they span 3
principal planes, and the 3 refractive indices are called principal refractive indices. In the
principal planes, biaxial crystals are considered in a similar way as uniaxial crystals but the
nomenclature is different for laser and nonlinear crystals although this can be exactly the
same crystal. For laser crystals, the old notation Np, Nm, and Ng is still most popular to
designate the 3 orthogonal axes of the optical ellipsoid where per definition np<nm<ng holds
for the three principal refractive indices. Spectroscopic properties are reported for the three
principal polarizations along these axes. As in uniaxial crystals, the laser polarization is
chosen along one of these principal optical axes while propagation is along one of the
remaining two axes and the latter choice does not affect the interaction cross-sections. In
orthorhombic crystals the dielectric frame NpNmNg coincides with the orthogonal
crystallographic frame abc and only the correspondence of the axes has to be determined. In
monoclinic crystals, however, in which abc is not an orthogonal frame, only one of the
dielectric axis coincides with the monoclinic axis which is normally designated as b (the axis
which is perpendicular to the plane spanned by the other two: Depending on the symmetry,
this is a two-fold crystallographic axis for point group 2, an axis perpendicular to the mirror
plane in point group m or both in point group 2/m). The remaining two dielectric axes are
rotated at some angles from the a- and c-axes which cross at the monoclinic angle (per
convention ≥ 0 and c0 < a0 holds for the lattice constants). These angles depend on
wavelength and temperature but normally the position of the dielectric frame relative to the
crystallographic frame can be assumed to be fixed [24]. Illustrating examples follow in this
chapter when describing the laser crystals employed in the present work.
Crystalline laser hosts are also divided into ordered and disordered [25]. In ordered
crystals the passive ion (most often a trivalent rare-earth, RE, i.e. Sc3+
, Y3+
or Ln3+
including

2.2 Host materials
17
La3+
) to be substituted by the Ln3+
dopant occupies only a single lattice site. In disordered
crystals one lattice site can be occupied by different host cations, e.g. with 50% Na+ and 50%
Gd3+
in NaGd(WO4)2, but in a random distribution for the first cationic sphere of neighbors or
there can be two different crystallographic sites that can accommodate both the monovalent
and the trivalent cations but in general with different occupancy factors. Disordered crystals
can be obtained also by mixing two ordered crystals containing different passive RE ions such
as Gd3+
and Lu3+
, e.g. KGdxLu1-x(WO4)2. In all cases the active Ln dopant ion which
substitutes the passive RE host ion experiences a locally variable crystal field which is
manifested in the large bandwidths of the spectral lines of the electronic transitions, the so-
called inhomogeneous line broadening in laser physics. With regard to their spectroscopic but
also opto-mechanical properties, such disordered crystals occupy an intermediate position
between ordered laser hosts and glasses which are characterized by only short-range order (no
local disorder and no long-range order). Disordered crystals are important for mode-locked
lasers because they provide larger gain bandwidths supporting shorter pulses, however, their
thermal conductivity is lower. Glasses ensure the broadest absorption and gain bandwidths
but they exhibit also lowest thermal conductivity and for this reason have lost their
importance in the 2-µm spectral range. This is true, however, only for bulk glasses. In Tm3+
or
Ho3+
optical fibers, where the thermal load problem is solved by heat distribution across a
very large fiber length and surface, they are real alternatives to bulk lasers.
Polycrystalline ceramics consist of fine, randomly oriented microcrystals with sizes
ranging from submicron to several tens of micrometers. The development of Ln ion doped
crystals is slowed down by the expensive, complex and time consuming growth in
comparison with the simpler and relatively fast ceramic approach. Since growth of large
crystals is technologically limited, laser power or energy scaling are also limited. Furthermore,
a composite laser medium is essential to improve laser performance. Large aperture, minimal
losses, high optical homogeneity, good thermo-mechanical properties in combination with
adequate spectroscopic properties, and cost effectiveness, are requirements that are impossible
to satisfy simultaneously with the existing crystals applied in SSL systems. While glasses,
which are scalable in size, with their roughly an order of magnitude lower thermal
conductivity are restricted to low repetition rate and average power applications, laser
ceramics seem to offer a combined solution to all these challenges. The main features of the
ceramic laser technology can be summarized as: (i) Scalability, i.e. increasing the size of the
active elements in a cost-effective manner while preserving the optical uniformity, (ii)
Multifunctionality, because fabrication of multifunctional elements is possible by the bonding
technique which is easy to adapt to this technology to produce composite elements or
functionally graded materials by adjusting the doping concentration (which can be in general
higher than in crystals) and chemical composition, and (iii) Mass production, similar to that of
glass. Transparent laser ceramics exhibit optical and thermal properties similar to those of
single crystals but their fracture toughness and damage resistivity are superior. In general,
most ceramics are opaque. The reason is simple: Translucent ceramics contain many
scattering sources, such as grain boundary phases, residual pores and secondary phases, which

Chapter 2 Tm3+
and Ho3+
doped laser active materials
18
cause significant scattering losses. The real technological breakthrough came in the 1990s,
with the use of submicron- to nano-sized raw materials [26]. It should be outlined that it
makes sense to use only isotropic (cubic) materials for fabrication of laser ceramics due to the
random grain orientation. The spectroscopic properties of doped laser ceramics are considered
to be similar to those of the corresponding crystals although accurate characterization is
available only in rare cases.
Transitions occurring between levels inside the 4f subshell are in fact electric-dipole
forbidden by the Laporte selection rule which says that states with even parity can be
connected only with states of odd parity, and odd states only with even states. Although
magnetic dipole and electric quadrupole radiative transitions are allowed, with few exceptions
the Ln3+
-transitions are still of electric-dipole type because the crystalline fields in solids
distort the electronic motion so that the selection rules for free ions no longer apply. This
effect is produced, however, only by non-centrosymmetric crystal fields, which emphasizes
the importance of the local site symmetry [27]. The local symmetry determines the number of
sublevels that can be expected as a result of the Stark splitting while the local field strength
determines the magnitude of the splitting.
The ground-state absorption (GSA) cross-sections of Tm3+
and Ho3+
-doped materials are
measured simply by transmission spectroscopy (spectrophotometer) using a broadband
halogen lamp as the source and samples oriented for the corresponding polarization. The
intensities are low and no depletion of the ground state occurs, thus the absorption cross-
section a is derived from the Lambert–Beer law. A powerful theoretical tool exists, the Judd-
Ofelt method, which allows one to calculate the radiative transition probabilities and the
branching ratios as well as lifetimes for spontaneous emission for different inter-manifold (i.e.
manifold to manifold) transitions from accurate measurements of the entire GSA spectrum
[27]. It is based on static, free-ion and single configuration approximations with some
additional assumptions. In the static model, the central ion is affected by the surrounding host
ions via a static electric field, referred to as ligand or crystal field. In the free-ion model, the
host environment produces the static electric field, and is treated as a perturbation to the free-
ion Hamiltonian. In the single configuration model, the interaction of electrons between
configurations is neglected. The results can be validated by comparing the branching ratios
with fluorescence and lifetime measurements. The latter can be complicated by the presence
of ET, non-radiative relaxation and reabsorption. Thus, directly measured lifetimes might be
inaccurate even at lower temperature.
The emission cross-section e can be determined from polarized fluorescence
measurements by the Füchtbauer–Ladenburg equation [17],
𝜎e𝑖(𝜆) =
𝜆5𝑃𝑓𝑖(𝜆)
8𝜋𝑛2𝑐𝜏𝑟 ∫ 𝑃𝑓𝑖(𝜆) 𝜆𝑑𝜆
,
where 𝑃𝑓𝑖(𝜆) is the recorded fluorescence signal (power) in dependence on the wavelength for
the i-th polarization, n is an average refractive index of the laser host, c is the speed of light,

2.2 Host materials
19
and τr is the spontaneous (or radiative) lifetime of the level or manifold investigated. Apart
from the fact that the value of r is required, the main problem in the Füchtbauer–Ladenburg
method is the reabsorption which affects the measured signal. Therefore, in quasi-3-level
systems it is mainly applied in the long-wave wing of the emission, exactly where another
method called the reciprocity method might be problematic. The reciprocity method requires
GSA measurements for the laser transition for all polarizations. This method is based on the
theory developed by McCumber [28] who considered quasi-3-level systems applying the
Einstein relations for the rates of spontaneous and stimulated emission and absorption, with
the levels in each manifold being in thermal equilibrium (i.e. Boltzmann distribution). The
result reads [17]:
𝜎e𝑖(𝜆) = 𝜎a
𝑖(𝜆) exp (−ℎ𝑐
𝑘𝐵𝑇(
1
𝜆−
1
𝜆𝜇)) ,
where the absorption cross-section 𝜎a𝑖(𝜆) was introduced before and the chemical potential
wavelength is defined by: 𝜆𝜇 =ℎ𝑐
𝑘𝐵𝑇(ln
𝑍𝑙
𝑍𝑢)−1. Here kB is the Boltzmann constant, T is the
temperature, h is the Planck constant, and Zl and Zu are the partition functions of the lower
and upper manifolds defined as 𝑍𝑚 = ∑ 𝑔𝑘𝑚exp (−𝐸𝑘
𝑚/𝑘𝐵𝑇)𝑘 , m = l, u. 𝑔𝑘𝑚 is the degeneracy
of the sublevel having the number k and the energy 𝐸𝑘𝑚 measured from the bottom of the
corresponding multiplet. Thus, the reciprocity method requires precise knowledge of all the
individual Stark sublevels of the two manifolds. This problem has been circumvented in the
modified reciprocity method [29] leading to the expression:
𝜎e𝑖(𝜆) =
exp (−ℎ𝑐
𝑘𝐵𝑇𝜆)
8𝜋𝑛2𝜏𝑟𝑐 ⟨∫ 𝜆−4𝜎𝑎(𝜆) exp (−ℎ𝑐
𝑘𝐵𝑇𝜆) 𝑑𝜆⟩
𝜎a𝑖(𝜆) ,
for the i-th polarization where ⟨ ⟩ denotes averaging over polarizations (the 3 principal
polarizations in biaxial crystals or the -polarization and 2 times the -polarization in uniaxial
crystals). Note that, a combination of the Füchtbauer–Ladenburg and reciprocity methods, i.e.
with 𝜎𝑒𝑖(𝜆) derived by the latter, provides an expression for the radiative lifetime τr [17]:
𝜏𝑟−1 = 8𝜋𝑛2𝑐 ⟨∫ 𝜆−4𝜎e(𝜆) 𝑑𝜆⟩ ,
Similarly, a combination of the reciprocity and the modified reciprocity methods can also
be used to determine the radiative lifetime τr [29]:
𝜏𝑟−1 = 8𝜋𝑛2𝑐 ⟨∫ 𝜆−4𝜎a(𝜆) exp (−
ℎ𝑐
𝑘𝐵𝑇(
1
𝜆−
1
𝜆𝜇)) 𝑑𝜆⟩ ,

Chapter 2 Tm3+
and Ho3+
doped laser active materials
20
Vibronic interactions may compromise the accuracy of the reciprocity method [30].
As already mentioned, in quasi-3-level systems the maximum laser gain is determined
not only by the emission but also by the reabsorption. This leads to the concept of the gain
cross-section σg = βσe-(1-β)σa, where the inversion rate β = N1/(N1+N2) ≈ N1/N is
approximately equal to the ion density in the upper laser level divided by the total ion density
N ( = NTm or NHo). This parameter is simply plotted for different values of the inversion rate
and serves to predict the laser wavelength in the CW regime because different cavity losses
require different magnitude of the gain coefficient gNL where L is the active medium length.
Which polarization will dominate in anisotropic materials depends on the wavelength
dependent gain cross-section. The latter is obviously sensitive to temperature. At lower
temperatures quasi-3-level systems tend to behave as 4-level systems because reabsorption
losses decrease but simultaneously the spectral linewidths get narrower which is
disadvantageous for the generation of ultrashort pulses. At higher temperatures, there will be a
reduction of the peak absorption cross-section, and linewidth broadening [31]. Spectroscopic
cross-section data are available as a rule only at room temperature. In a quasi-3-level system
laser, by changing the cavity losses one can control not only the wavelength of maximum gain
(as already mentioned - decreasing with the losses) but also the gain bandwidth.
The experimentally measured lifetime is usually not the radiative lifetime r but the
harmonic mean value with the lifetime accounting for non-radiative processes nr:
𝜏𝑓−1 = 𝜏𝑟
−1 + 𝜏𝑛𝑟−1 ,
Since this is the characteristic time with which the fluorescence signal decays, the time
constant f is called in laser physics the fluorescence lifetime. It depends on the concentration
because at higher doping ion-ion interactions tend to reduce it (fluorescence quenching). For
this reason the measurements are preferably performed with low-doped samples, which also
eliminate ET effects. The results in the literature often vary a lot because the reabsorption
effect, called also radiation trapping, is not properly taken care of and few techniques have
been suggested to solve the problem. Two methods are mainly used to suppress this effect and
the total internal reflection (i.e. fluorescence from inside the crystal which propagates at such
large angles that it remains trapped in the crystal after reflection at the surface) both of which
lengthen the intrinsic decay constant of an isolated ion: using powdered samples [32] or a
pinhole on the bulk sample surface [33]. In the pinhole method the sample with the pinhole is
inclined at 45° with respect to the excitation beam and detection takes place at 90° from the
excitation beam. The overlap of the crystal region that is excited and the region that emits
photons that can be detected scales up with the pinhole size. To eliminate the probability of
re-emission the pinhole size is continuously decreased and the fluorescence lifetime is derived
asymptotically from the measurements for zero pinhole size. To determine the intrinsic f
properly is essential on the first place for spectroscopic characterization of a new material and
as explained above – for derivation of the emission and gain cross-sections. This is so because
in Ln doped materials non-radiative relaxation can be normally neglected for the laser

2.2 Host materials
21
transition. Then r is approximated by the measured f. Experimentally measured values of f
can be compared with values of r derived from the reciprocity method as explained above,
which provides an estimate for the overall accuracy of the emission cross-section values [34].
Both results can be used also for validating the Judd-Ofelt method reliability. In a real laser,
the effects of fluorescence quenching, reabsorption and stimulated emission all affect the
actual fluorescence or energy storage lifetime which can be measured under operating
conditions or estimated from the performance in the regime of active Q-switching (cf.
Chapter 4) under CW pumping. It is then this time that enters different theoretical models.
2.2.1 YAG and LuAG
YAG (Y3Al5O12) and LuAG (Lu3Al5O12) (space group 𝐼𝑎3̅𝑑 or 𝑂ℎ10, point group 𝑚3̅𝑚) are
representatives of the big family of isostructural synthetic garnet crystals belonging to the
cubic system, with general formula A3B2(CO4)3, where A = Ca, Y, or RE, B = Al, Sc, Ga, or
Fe, C = Al, Ga, Ge, or Fe, the A-ion is located in 8-fold O2-
-coordinated sites with
orthorhombic 222 local symmetry, B in octahedral sites, and C in tetrahedral sites. Garnets are
one of the most popular and successful laser host materials for many of the Ln3+
active
dopants [25]. They are optically isotropic ordered crystals, known for their superior thermo-
mechanical properties. The incorporation of Ln active ions is facilitated by the presence of RE
passive ions in the lattice, Sc, Y, Gd or Lu. Since Tm3Al5O12 and Ho3Al5O12 belong to the
same space group, the substitution can be up to 100% (complete solid solutions). However, in
contrast to other dopants such as Yb3+
, unwanted interaction processes between excited ions
as shown in Fig. 2.4, limit the doping level to much lower values and stoichiometric TmAG
and HoAG lasers do not exist in contrast to YbAG. Thanks to their cubic structure, doped
YAG and LuAG are both suitable for transparent laser ceramics [26]. Most of the best laser
results in terms of CW or average power in the pulsed regime that can be found in the
literature were obtained with Tm- and Ho-doped YAG crystals [3, 17].
Figures 2.5 and 2.6 show the absorption cross-sections for the pump transition measured
in Tm:YAG ceramics, and the absorption, emission and gain cross-sections obtained for the
laser transition [35]. The maximum absorption cross section for the 3H6→
3H4 transition is a
= 7.7×10⁻²¹
cm2
at 786 nm. This value is very close to the one reported for single crystals,
7.5×10⁻²¹
cm2
at 785 nm [3]. The emission cross-section of Tm:YAG ceramics was calculated
by the Füchtbauer–Ladenburg method approximating r by f (see below), giving a maximum
σe = 3.0×10⁻²¹
cm2 at 2.015 µm with a linewidth (FWHM) of 29.6 nm. This is higher
compared to single crystals (1.8×10⁻²¹
cm2
at 2.013 µm with a linewidth of ~ 28 nm [3]).
Having in mind that more measurements on single crystals exist, which confirm the latter
values, it can be concluded that further spectroscopic efforts are needed in order to obtain
more reliable values for the emission cross-section. The fluorescence lifetime of a 4%
Tm:YAG ceramic sample was measured by the pinhole method giving f = 10 ms at room
temperature [35], which agrees rather well with values known for single crystals (10-10.5 ms)

Chapter 2 Tm3+
and Ho3+
doped laser active materials
22
[3, 34]. In general, such characteristics indicate that the quality of the developed ceramics is
comparable to that achievable with single crystals.
740 760 780 800 820 8400.0
0.2
0.4
0.6
0.8
1.0
Tm:YAG
Tm:LuAG3H6
3H4
a [
10
-20c
m2]
Wavelength [nm]
Fig. 2.5 Ground-state absorption (GSA) cross-section of Tm:YAG (red curve) and Tm:LuAG
(blue curve) ceramics (reproduced from [20]).
0
1
2
3
4
1700 1800 1900 2000 2100 2200
0
1
2
3
(a)
[
10
-21 c
m2]
(b)
e
a
0.4
0.5
g [
10
-21 c
m2]
Wavelength [nm]
=
0.1
0.2
0.3
Fig. 2.6 Absorption, σa, and emission, σe, cross-sections (a), and calculated gain cross-section, σg,
for different inversion rates β (b) of Tm:YAG ceramics (remeasured data but very close to [20]).
LuAG is a similar host material but studied to a much lesser extent as a crystal. In the
case of Tm-doping, one of its advantages is the weaker population of the lower laser level as a
result of the stronger crystal field and Stark splitting [36]. As a consequence, the free running
emission wavelength of Tm:LuAG is 2.023 µm, i.e. shifted by ~ 10 nm to longer wavelengths
compared to Tm:YAG [3, 37], which matches much better to one of the atmospheric optical
transmission windows. The Tm ionic radius in 8-fold coordination (0.994 Å) is closer to that
of Lu (0.977 Å) compared to that of Y (1.019 Å) [38]. Thus one of the advantages of this host
compared to YAG (as in other crystal families containing these two passive ions) is the
possibility for higher doping (important to activate the CR process) without distortion of the
crystal lattice and with weaker effect on the thermal conductivity. It is unclear, however, if
this advantage is essential in ceramics as well.

2.2 Host materials
23
In the literature, spectroscopic data are only available for Tm:LuAG single crystals [36,
37]. Here, the laser-relevant spectroscopic characterization of Tm:LuAG ceramics will be
presented. The highest absorption cross-sections for the 3H6→
3H4 Tm
3+ pump transition
amount to 6.43×10⁻²¹
cm2 at 783 nm and 5.71×10
−21 cm
2 at 787 nm. In single crystals the
maximum a amounts to 5.7×10⁻²¹
cm2 at 788 nm [3, 37]. The emission cross-section σe for
the 3F4→
3H6 Tm
3+ laser transition was derived from the absorption cross-section σa by the
reciprocity method. Both cross-sections for the 3F4↔
3H6 transition are shown in Fig. 2.7a.
The maximum emission cross-section of the ceramics for the laser transition from the 3F4
level to the ground state is 1.51×10⁻²¹
cm2 at 2.023 µm with a linewidth of 30 nm. It is only
slightly lower compared to Tm:LuAG single crystals: σe = 1.66×10⁻²¹
cm2 with a linewidth of
23 nm [37]. The calculated gain cross-section σg for several values of the inversion rate β is
presented in Fig. 2.7b. For the 3F4↔
3H6 Tm
3+ transition, the Tm:LuAG ceramics cross-
sections are very similar to those of its single crystal counterpart [37]. The 3F4 fluorescence
lifetime of 10 ms measured for 4 at.% bulk Tm:LuAG ceramics at room temperature is also in
good agreement with values reported for single crystals (10.9 ms) [37].
0.0
0.5
1.0
1.5
1800 1850 1900 1950 2000 2050
0.0
0.3
0.6
[
10
-21 c
m2] (a)
(b)
e
a
0.3
0.35
0.4
g [
10
-21 c
m2]
Wavelength [nm]
=
0.15
0.2
0.25
Fig. 2.7 Absorption, σa, and emission, σe, cross-sections (a) and gain cross-section, σg, for different
inversion rates β (b) of Tm:LuAG ceramics.
With regard to Ho3+
-doping, only YAG laser ceramics were available and considered in
the present work. The maximum σa for in-band pumping amounts to 9.8×10⁻²¹
cm2 at
1.9065 µm with a linewidth of 5.6 nm. In crystals, this value is 1.18×10⁻²⁰
cm2 at 1.90765 µm
with a linewidth of 5 nm [39]. In order to estimate the potential spectral extent of the gain in
Ho:YAG ceramics, the gain cross-section was calculated for several values of the inversion
rate β, as shown in Fig. 2.8b. The radiative lifetime τr of the upper laser level 5I7 was
estimated from the Judd-Ofelt modeling to be 7.7 ms [40]. The emission cross-section σe was
deduced from the absorption cross-section σa (both shown in Fig. 2.8a) by the reciprocity
method using the reported Stark splitting for Ho:YAG single crystals [41]. All spectroscopic
results were very close to published data for single crystals [39]. The maximum σe of the
Ho:YAG ceramics for the 5I7→
5I8 Ho
3+ laser transition at 2.09 µm is 1.45×10
-20 cm
2. This

Chapter 2 Tm3+
and Ho3+
doped laser active materials
24
value is slightly higher compared to Ho:YAG single crystals at the same wavelength: σe =
1.29×10⁻²⁰
cm2 [39]. Comparing the gain cross-sections, the wavelength dependence is
somewhat smoother in ceramics which is potentially advantageous for ultrashort pulses. For
inversion rates β < 0.2, emission of the free running Ho:YAG ceramic laser is expected at
~ 2.1215 µm, whereas for higher β the maximum gain is at 2.09 µm (Fig. 2.8b).
1800 1900 2000 2100 22000.0
0.2
0.4
0.6
0.8
1.0
1.2
1.4
2000 2040 2080 2120 2160
0.0
0.1
0.2
0.3
5I85I7
e
[
10
-20cm
2]
Wavelength [nm]
a
(a) (b)
0.10
0.15
0.20
0.25
0.30
g [
10
-20cm
2]
Wavelength [nm]
Fig. 2.8 Absorption, σa, and emission, σe, cross-sections (a) and gain cross-section, σg, for different
inversion rates β (b) of Ho:YAG ceramics.
The 5I7 fluorescence lifetime of 8 ms measured for 1 at. % bulk Ho:YAG ceramics at
room temperature is very close to the radiative lifetime r and also in good agreement with
values reported for single crystals (7.8 ms [3, 34]).
2.2.2 CALGO and CALYO
CALGO (CaGdAlO4) as well as its isomorph CALYO (CaYAlO4) (space group 𝐼4/𝑚𝑚𝑚 or
𝐷4ℎ17, point group 4/𝑚𝑚𝑚) are representatives of an isostructural family of crystals belonging
to the tetragonal crystal system, with the general formula ABCO4, where A is either Ca or Sr,
B is Y or Ln, and C is Al or Ga; A and B statistically occupy the same 9-fold O2-
-coordinated
site with tetragonal 4mm local symmetry whereas C is in octahedral sites. They are optically
uniaxial disordered crystals. In CALGO, the Tm3+
ions (ionic radius: 1.052 Å) replace the
Gd3+
ones which have a closer radius (1.107 Å) compared to the Ca2+
ions (1.180 Å) [38].
The local disorder affecting the crystal field for Tm3+
originates from the second coordination
sphere of the Ca2+
/Gd3+
ions due to the charge difference of these two ions and the different
cation-cation distances [42]. CALGO and CALYO crystals were one of the most successful
hosts with Yb3+
-doping in terms of shortest pulse durations (~ 30 fs) achieved by mode-
locked lasers around 1 µm [43, 44]. This is due to the relatively broad and flat gain spectra
related to the structural disorder. Nevertheless, CALGO exhibits relatively good thermo-
mechanical properties, and the thermal conductivity of 4.5-5.3 W/mK (depending on the
orientation), is roughly two times lower compared to the garnets [45]. Another advantage is
the low melting temperature: CALGO melts congruently at ~ 1840°C (i.e., no phase transition

2.2 Host materials
25
to a different crystallographic structure occurs below this temperature) and large crystals were
obtained by the Czochralski (Cz) method [46].
The Tm:CALGO crystals grown by the Cz method at FEE GmbH (Idar-Oberstein,
Germany) were with 3 at. % Tm-doping in the charge [47]. The actual concentration was
unknown but one can assume a segregation coefficient (i.e. ratio of the actual doping in the
crystal to that in the melt) of ~ 0.6 from the literature [29]. This leads to 1.8 at. % doping in
the crystal which, with a density of 5.947 g·cm-3
[45], gives NTm = 2.22×10²⁰
cm-3
, in good
agreement with absorption measurements. The as-grown crystals were yellow colored as
shown in Fig. 2.9a. According to [45] the coloration is due to interstitial oxygen. The color
centers were removed by annealing under H2 at 950°C for 24 h. The annealed crystals became
completely colorless, cf. Fig. 2.9b. With an a-cut cubic (3×3×3 mm3) sample, it was possible
to access both π- and σ-polarizations for spectroscopy and laser experiments. Here, the
spectroscopic features of Tm:CALGO are presented.
Fig. 2.9 As grown (yellow) (a) and annealed (colorless) (b) Tm:CALGO crystals.
740 760 780 800 820 8400.0
0.2
0.4
0.6
0.8
1.0
1.2
1.4
1.6
1500 1600 1700 1800 1900 20000.0
0.2
0.4
0.6
0.8
1.0
1.2
1.4
1.63H6
3H4
a [
10
-20cm
2]
Wavelength [nm]
(a)
e()
e()
a()
a()
3H63F4
[
10
-20cm
2]
Wavelength [nm]
(b)
Fig. 2.10 Polarized absorption cross-sections for the
3H6→
3H4 (a) and absorption/stimulated
emission (solid/dashed line) cross-sections for the 3H6↔
3F4 (b) transitions of Tm:CALGO.
Figures 2.10 show the absorption cross-sections for the pump transition measured in
Tm:CALGO, and the absorption, emission and gain cross-sections obtained for the laser
transition at room temperature, respectively [47]. For the 3H6 →
3H4 transition suitable for
(a) (b)

Chapter 2 Tm3+
and Ho3+
doped laser active materials
26
pumping near 800 nm, the maximum σa is 15.9×10⁻²¹
cm2 at 792.0 nm (π-polarization), with a
linewidth of 16.5 nm, see Fig. 2.10a. For σ-polarization, σa is lower, 6.9×10⁻²¹
cm2 at
798.4 nm, with a linewidth of 18.1 nm. For the 3H6 →
3F4 transition, cf. Fig. 2.10b, σa(π) =
10.9×10⁻²¹
cm2 at 1.698 µm and σa(σ) = 6.2×10
-21 cm
2 at 1.7352 µm.
The radiative lifetime τr of the 3F4 excited state is ~ 2 ms as calculated from Judd-Ofelt
theory [47]. Using this lifetime in the modified reciprocity method, the stimulated-emission
cross-sections for the 3F4→
3H6 transition were calculated, see dashed line in Fig. 2.10b. The
maximum σe corresponds to π-polarization: 11.6×10⁻²¹
cm2 at 1.7592 µm, with a linewidth of
143.6 nm. For σ-polarization, there exist two identical maxima of 10.3×10⁻²¹
cm2 at 1.766 and
1.808 µm, see dashed line in Fig. 2.10b.
1750 1800 1850 1900 1950 2000 2050
0.0
0.5
1.0
1750 1800 1850 1900 1950 2000 2050
0.0
0.5
1.0
(a)
g [
10
-20cm
2]
Wavelength [nm]
0.05
0.07
0.10
0.15
0.20
0.25
(b)
g [
10
-20cm
2]
Wavelength [nm]
0.05
0.07
0.10
0.15
0.20
0.25
Fig. 2.11 Gain cross-sectionsσg for π- (a) and σ- (b) polarizations corresponding to the 3F4→
3H6
transition of Tm:CALGO for various inversion rates β.
However, at longer wavelengths, where laser operation in the quasi-3-level Tm3+
laser
system is expected, the σ-polarization exhibits higher emission cross-section: The value of σe
in the local maximum at 1.944 µm is 2.38×10⁻²¹
cm2. The calculated gain cross-sections
shown in Fig. 2.11 indicate generally higher gain for -polarization which will be naturally
selected in a laser cavity without polarization n selective elements. At low inversion rates (β <
0.10), typical for mode-locked lasers, the gain for -polarization is also broader and smoother,
which may facilitate the generation of shorter pulses. The wavelength dependence of the gain
cross-sections of Tm:CALGO is smoother and relatively flat compared to the garnet hosts
discussed before. The 3F4 fluorescence lifetime of 6.04 ms measured in [29] for 3.66 at. %
bulk Tm:CALGO at room temperature is longer than the calculated radiative lifetime τr which
is attributed to re-absorption.
Only Tm:CALGO was available for the present work. As can be expected from the closer
ionic radii (1.075 Å for Y3+
), the isomorph CALYO shows higher segregation coefficient for
Tm-doping [48]. The spectroscopic information on Tm:CALYO that can be found in the
literature is rather limited, especially the polarization dependence, but at least the absorption
spectra for the pump transition are very similar to Tm:CALGO [48].

2.2 Host materials
27
2.2.3 KLuW and MgW
Ordered monoclinic double tungstates and disordered tetragonal double tungstates and
molybdates represent other important classes of laser host crystals [25]. In particular,
monoclinic potassium double tungstates with general formula KRE(WO4)2 (KREW, RE = Gd,
Y, Lu) with which some of the most efficient lasers with different Ln-dopings have been
realized, are famous for their strong anisotropy, highest cross-sections, and minimal
fluorescence quenching due to relatively large dopant ion-ion separation. Tm:KREW crystals,
and Tm:KLuW in particular which so far provided the best results in terms of shortest pulses,
are characterized by broad and smooth spectral emission near 2 µm [49] which makes them
attractive for mode-locked lasers. In this ordered crystal, Tm3+
ions substitute Lu3+
ions in an
8-fold coordinated site with monoclinic 2 local symmetry. For reasons similar to those
discussed when comparing LuAG to YAG, KLuW is the preferable host of this class for Tm
dopant ions. The tungstate crystal investigated for the first time in the present work as Tm
host, MgWO4 (MgW) belongs to a group of monoclinic divalent metal mono-tungstates with
general formula MWO4 (M = Mg, Mn, Ni, Cd, Zn) [50, 51], which do not contain a passive
RE ion and for which Ln-doping has been attempted only very recently. The spectroscopic
features of the novel Tm:MgW crystal developed at Fujian Institute of Research on the
Structure of Matter, CAS (Fuzhou, China), show emission properties similar to those of the
monoclinic double tungstates [52]. In the ordered MgW host, Tm3+
ions substitute Mg2+
ions
in a single 6-fold coordinated site with monoclinic 2 local symmetry while charge
compensation is ensured by Na+ ions from the flux. The distortion of the crystal field for the
Tm3+
ion is facilitated by the significant difference of its ionic radius (0.88 Å) from that of the
substituted Mg2+
ion (0.72 Å) [38]. As a consequence, Tm:MgW exhibits very broad
absorption and emission bands [52]. With 10 at. % Tm in the charge, the concentration of
Tm3+
ions in the as-grown crystal was determined to be 0.89 at. % (NTm = 1.409×10²⁰
cm-3
),
leading to an expectedly low segregation coefficient of 0.089 [52]. The room temperature
thermal conductivity of the monoclinic MgW host crystal measured for an arbitrary
orientation is ~ 8.7 W/mK [53], i.e. more than 2 times higher compared to KLuW (2.55-
4.4 W/mK, depending on direction) [49].
Both KLuW (space group 𝐶2/𝑐 or 𝐶2ℎ6 , point group 2/𝑚) and MgW (space group 𝑃2/𝑐 or
𝐶2ℎ4 , point group 2/𝑚) belong to the monoclinic system and are optically biaxial. Figure 2.12
shows the correspondence between crystallographic and dielectric frames in KLuW and MgW
crystals. In KLuW, the monoclinic angle is 130.7°, the principal optical axis Np is parallel
to the b crystallographic axis, Ng is located at 18.5° with respect to the c crystallographic axis
and Nm at 59.2° with respect to the a crystallographic axis, cf. Fig. 12a [49].
Since the principal refractive indices of MgW are still unknown and only an average value
can be found in the literature, it was not possible to define the Np, Nm, and Ng axes.
Conoscopic interference patterns (characteristic pictures observed on a screen for divergent
light propagating along special directions in a biaxial crystal) still enable one to identify the
location of the three orthogonal principal axes X, Y and Z, choosing arbitrarily the Y-axis to be
parallel to the crystallographic b-axis, cf. Fig. 2.12b. The other two axes of the optical

Chapter 2 Tm3+
and Ho3+
doped laser active materials
28
indicatrix are located in the a-c plane: X at 36.4° from a and Z at 37.1° from c. The
monoclinic angle is 90.7°. Note that for MgW the non-standard convention a0 < c0 for the
lattice constants is used and the specified angles refer in fact to Yb-doped MgW [54].
Fig. 2.12 Correspondence between crystallographic (red) and dielectric (green) frames in KLuW (a)
and MgW (b).
Similar to KLuW, MgW exhibits non-congruent melting character (i.e. a phase transition
to a different crystallographic structure below the melting point) and cannot be grown by the
Cz method [55]. The growth temperature can be reduced by adding a solvent (flux methods)
and in this case the top-seeded solution-growth method (TSSG) is applied. Fig. 2.13 shows a
bulk Tm:MgW crystal with dimensions of ~ 16×8×6 mm3 [52]. The light yellowish coloration
of the as-grown crystal comes from color centers (defects), most probably related to the flux
used. The defect related optical absorption in the 320–420 nm spectral range is present also in
undoped MgW [55].
Fig. 2.13 As-grown MgW crystal with 0.89 at. % Tm-doping.
The spectroscopic features of Tm:KLuW have been discussed in detail in [49]. For
comparison and completeness, only the wavelength dependence of the cross-sections is
a
cZ
X
Y||b
a
c
Ng
Nm
Np||b
(a) (b)
59.2°
18.5°
36.4°
37.1°

2.2 Host materials
29
reproduced in Figs. 2.14-15. Note that due to the low cross-sections, the Ng polarization is not
used for pumping and / or lasing. The radiative lifetime τr of the 3F4 excited state of 1.483 ms
calculated by Judd-Ofelt theory agrees, within the accuracy, with the measured by the pinhole
method fluorescence lifetime τf of 1.34 ms for 3.7 at. % Tm-doping [49].
760 780 800 8200
2
4
6
8
10
0
1
2
3
4
1500 1600 1700 1800 1900 2000 21000
1
2
3
4
(a)3H6
3H4
Np
Nm
Ng
a [
10
-20cm
2]
Wavelength [nm]
(b) 3H63F4
a(Nm)
e(Nm)
a(Np)
e(Np)
(c)
[
10
-20cm
2]
Wavelength [nm]
Fig. 2.14 Polarized absorption cross-sections for the 3H6→
3H4 transition of Tm:KLuW (a), and
absorption and stimulated-emission cross-sections for the 3H6↔
3F4 transition: Np- (b) and Nm- (c)
polarizations (reproduced from [34]).
1800 1900 2000 2100
0.0
0.2
0.4
0.6
1800 1900 2000 2100
0.0
0.5
1.0
1.5
Np
g [
10
-20 c
m2]
Wavelength [nm]
= 0.1 0.2 0.3 0.4 0.5
(a) (b) Nm
g [
10
-20 c
m2]
Wavelength [nm]
= 0.1 0.2 0.3 0.4 0.5
(a)
Fig. 2.15 Gain cross-sections of Tm:KLuW for Np- (a) and Nm- (b) polarizations and different
inversion rates β (reproduced from [34]).
Figures 2.16 and 2.17 summarize the spectroscopic properties of Tm:MgW in the
dielectric frame defined in Fig. 12b [52]. The polarized absorption cross-sections σa for the 3H6→
3H4 Tm transition are shown in Fig. 2.16a. The maximum σa is 2.07×10
-20 cm
2 at
803.0 nm (X-polarization) with a linewidth of ~ 14 nm. For Y-polarization, the maximum σa is
somewhat lower and amounts to 1.44×10⁻²⁰
cm2 at 796.4 nm, with a flat top and a linewidth of
31 nm, and for Z-polarization the maximum σa is only 0.35×10⁻²⁰
cm2 at 802.0 nm with a
linewidth of 25 nm. Strong anisotropy is seen also in the absorption cross-section for the 3H6
→3F4 transition, cf. Fig. 2.16b. Thus, similar to KLuW, one of the polarizations (Z) in the
case of the MgW host turns out not to be useful for pumping/lasing.

Chapter 2 Tm3+
and Ho3+
doped laser active materials
30
740 760 780 800 820 8400.0
0.5
1.0
1.5
2.0
2.5
1500 1600 1700 1800 1900 2000 21000.0
0.5
1.0
1.5
2.0
2.5
X
Y
Z
a [
10
-20cm
2]
Wavelength [nm]
3H63H4
(a) (b)
X
Y
Z
3H63F4
a [
10
-20cm
2]
Wavelength [nm]
Fig. 2.16 Polarized absorption cross-sections for the 3H6→
3H4 (a) and
3H6→
3F4 (b) transitions of
Tm:MgW.
1600 1700 1800 1900 2000 21000.0
0.5
1.0
1.5
2.0
2.5
1850 1900 1950 2000 2050 2100
0.00
0.05
0.10
0.15
(a) X
Y
Z
e [
10
-20cm
2]
Wavelength [nm]
(b) X
g [
10
-20 c
m2]
Wavelength [nm]
= 0.10 0.15 0.20 0.25 0.30
1850 1900 1950 2000 2050 2100
0.0
0.1
0.2
0.3
1850 1900 1950 2000 2050 2100
0.00
0.02
0.04
0.06
Y
g [
10
-20 c
m2]
Wavelength [nm]
= 0.10 0.15 0.20 0.25 0.30
(d) Z
g [
10
-20 c
m2]
Wavelength [nm]
= 0.10 0.15 0.20 0.25 0.30
(c)
Fig. 2.17 Polarized stimulated-emission cross-sections for the
3F4→
3H6 transition of Tm:MgW (a),
and gain cross-sections for different inversion rates β for X- (b), Y- (c) and Z- (d) polarizations.
The radiative lifetime τr of the 3F4 excited state amounts to 1.95 ms, as calculated from
Judd-Ofelt theory [52]. The polarized stimulated-emission cross-sections for the 3F4→
3H6
transition were calculated from the absorption cross-sections by the modified reciprocity
method using this lifetime and are shown in Fig. 2.17a. The maximum σe corresponds to Y-
polarization and amounts to 2.36×10⁻²⁰
cm2 at 1.877 µm with a linewidth of 76.7 nm. For X-

2.2 Host materials
31
polarization, there exist two local peaks at 1.7995 and 1.8485 µm with a cross-section of
~ 1.61×10⁻²⁰
cm2. For Z-polarization, the maximum σe is only 0.31×10
-20 cm
2 at 1.884 µm.
With the same argumentation as for Tm:CALGO, due to the quasi-3-level scheme, the
actual free running laser polarization is expected to be parallel to the Y-axis. The local
maximum for 𝜎𝑒𝑌 amounts to 0.86×10
-20 cm
2 at 2.0145 µm, with a linewidth of 83 nm. More
accurate predictions including the situation in lasers with selected polarization are provided
by the calculated gain cross-sections shown in Figs. 2.17b-d. For inversion rates β up to 0.25,
the maximum gain cross-section for Y-polarization is at ~ 2.014 µm (cf. Fig. 2.11 for
Tm:CALGO where switching to shorter wavelengths occurs at much lower inversion).
Comparing with the gain curves for Tm:KLuW shown in Fig. 2.15, it can be seen that
Tm:MgW naturally supports operation above 2 µm which is essential to avoid air
absorption/dispersion effects. The tungstates in general, similar to Tm:CALGO exhibit
smoother gain cross-sections compared to Tm- or Ho-doped garnets.
The 3F4 fluorescence lifetime of 1.93 ms measured in [36] by the powder method for
0.89 at. % Tm:MgW at room temperature almost coincides with the calculated radiative
lifetime τr
2.3 Comparison of the Tm- and Ho-doped laser materials
The main spectroscopic features of the presented laser active materials and the thermal
conductivity (taken from the literature) are summarized in Table 2.3. For the monoclinic
tungstates, only the two useful polarizations are included: Nm and Np for Tm:KLuW, and X
and Y for Tm:MgW. For the garnets, the spectroscopic parameters refer to single crystals, for
better comparison and also because for the moment these data are more reliable.
Table 2.3 Relevant properties of the considered 2 µm laser materials: P indicates the pump
wavelength for which a is specified together with the linewidth (FWHM) and similarly L
indicates the expected laser wavelength with the corresponding e and linewidth (FWHM).
Apart from KLuW which was included for completeness and also for comparison of the
experimental results in Chapter 4, the other materials in Table 2.3 are those used in the laser
experiments. Availability of spectroscopic data is a prerequisite for the design of successful
Material Tm:YAG Tm:LuAG Tm:CALGO Tm:KLuW Tm:MgW Ho:YAG
Symmetry cubic cubic tetragonal monoclinic monoclinic Cubic
Polarization − − σ π Nm Np X Y −
λP [nm] 785 788 798.4 792 802 793.5 803 797 1908
σa [10-21
cm2] 7.5 5.7 6.9 15.9 59.5 99.6 20.7 14.4 11.8
FWHM [nm] 1.3 1.7 18.1 16.5 4 1 14 31 5
λL [µm] 2.013 2.023 1.95 1.95 1.95 1.95 1.979 2.0145 2.09
σe [10-21
cm2] 1.8 1.66 2.38 0.84 12 5.7 2.55 8.6 12.9
FWHM [nm] 28 23 − − − − − 83 15.5
τf [ms] 10-10.5 10.9 6.04 [46] 1.34 [49] 1.93 [52] 7.8
[W/mK]
8.8-13 [56]
(undoped)
8.3-9.6 [56]
(undoped)
5.3//a, 4.5//c [45]
(undoped)
2.55-4.4 [49]
(undoped)
8.69 (avg.) [53]
(Cr3+
-doped)
8.8-13 [56]
(undoped)
Growth
method
Cz /
Ceramics
Cz /
Ceramics
Cz /
Ceramics
TSSG TSSG Cz /
Ceramics

Chapter 2 Tm3+
and Ho3+
doped laser active materials
32
lasing experiments and the interpretation of the results. However, even for the most widely
used crystals, this information is never complete and steadily updated and improved. This is a
consequence of the difficulties already mentioned in this chapter, e.g. not precisely known
actual doping, limited dynamic range of spectrophotometers used to measure the absorption,
systematic errors in the measured fluorescence lifetime, etc. The absorption cross-sections
(position of peaks and their magnitude in dependence on polarization) were used to design the
active elements for the laser experiments in terms of doping level, length and orientation for
use with the available pump sources. The characteristic absorption linewidths in Table 2.3 are
important to evaluate the required wavelength stability and emission linewidth of the pump
source and conclude whether diode-pumping is feasible. Calculated low-signal absorption
values were used to evaluate possible saturation effects under lasing conditions.
The emission wavelengths in Table 2.3 are used to compare with the experimentally
observed laser wavelength in the free-running mode and also in relation with the dependence
on the cavity losses. As already discussed, the laser wavelength will in fact be determined by
the gain cross-sections and from the observed wavelength one can judge about the actual
cavity losses. While linewidths could be partially defined for the emission spectra, this was
impossible for the gain spectra. This is related to all the line broadening mechanisms such as
electron-phonon coupling, crystal disorder, distortion of the crystal field, etc. That such data
could not be included in the table makes the comparison of different materials more
qualitative but on the other hand, as already mentioned, broader and smoother gain spectra are
the first prerequisite for obtaining ulrashort pulses. If the broader gain occurs for a given
polarization in combination with a higher gain cross section the choice of the crystal
orientation is rather simple (secondary effects such as thermo-mechanical properties still
might have to be considered). Otherwise one normally has to compare the laser results for
more than one orientation simply because the gain cross sections depend on the inversion
level and hence on cavity losses, etc. This is a consequence of the quasi-3-level system
according to which the 2 µm lasers operate.
From the spectroscopic information presented in this chapter one can more or less
compare the potential of the different materials in Table 2.13. This has been largely discussed
when presenting them individually. The fluorescence lifetime is more related to the expected
difficulties in achieving and stabilizing ultrashort pulse operation of the laser. As it will be
explained in Chapter 4, although there is no direct relation of this parameter to the stability
criterion, from the Füchtbauer-Ladenburg equation shorter lifetime is associated with higher
emission cross-sections which favor the mode-locking stability.
Other parameters related to the thermo-optic properties are also important but similar to
the spectroscopic properties they are only partially known (in particular their anisotropy,
temperature and wavelength dependence). The thermal conductivity in Table 2.3 is only one
such example. Power scaling of such lasers might require taking account also the tensor
character of the thermal expansion or the thermo-optic coefficients (dependence of refractive
index on temperature). For the power levels applied in the present work, simple water cooling
of the active element holder proved to be sufficient to avoid thermal effects.

2.3 Comparison of the Tm- and Ho-doped laser materials
33
Further aspects when comparing different crystals which are difficult to assess
quantitatively include crystal homogeneity, stress, optical damage threshold, difficulty of the
growth, etc. These aspects were not relevant for the present work because relatively small
samples were employed. Nevertheless, it shall be outlined here that almost all samples
available were exclusive, often from first growth attempts of novel materials, made available
only for the present laser experiments.


35
Chapter 3
Saturable absorbers
After the gain medium, the saturable absorber is the second most essential cavity element
which plays a crucial role in generating femtosecond pulses from a SSL. Passive mode-
locking of SSLs is realized by an intensity or fluence dependent loss mechanism in the laser
cavity which favors the peak of the circulating pulse and suppresses its wings, in particular
the leading edge, providing a pulse shortening effect which, as will be explained in the next
chapter, is counterbalanced in the steady-state regime by dispersion. Most often this role is
played by saturable absorbers (SAs) representing a key element in ultrafast SSLs. Much
shorter laser pulses can be obtained from passively mode-locked SSLs because driven by the
pulse itself, this key element can modulate the cavity losses much faster than any electronic
(typically acousto- or electro-optic) modulator used in actively mode-locked lasers (cf.
Chapter 4). From the first application of saturable dyes for mode-locking [57] until now,
various types of SAs have been developed to satisfy the different laser requirements because
depending on the parameters of the SA and the gain medium, saturable absorption may also
lead to passive Q-switching or Q-switched mode-locking (cf. Chapter 4). While organic dye
SAs played a crucial role in the first steady-state femtosecond lasers which were based on
laser dyes [4], in ultrafast SSLs this role was taken over by semiconductor SAs [58, 59]. In
the last decade, however, novel low-dimensional carbon nanostructures with parameters
similar to those of the semiconductor SAs proved to be useful for Q-switching and mode-
locking of SSLs. In the first place these were carbon nanotubes (CNTs) and graphene which
operate in a wide spectral range covering almost the entire near-IR [60-62]. Despite the
different absorption mechanism, there are several general material independent SA parameters
which control the pulse generation process: non-saturable losses, saturable losses, saturation
fluence or intensity and recovery time.
In this chapter the principle of operation of relevant SAs will be reviewed based on the
existing literature, including their saturation and relaxation behavior, and the parameters of
semiconductor, single-walled CNT (SWCNT) and graphene SAs will be compared at ~ 2 μm.
3.1 Characteristics of SAs used in mode-locked SSLs
As already mentioned an element with saturable loss is needed for passive mode-locking. In
the so-called Kerr lens mode-locked SSLs this is indeed an intensity dependent saturable loss
which can be achieved as a result of self-focusing (SF) in combination with a soft or hard
aperture [59]. The physical effect behind this, as it will be explained in Chapter 4, is the
electronic Kerr effect which can be considered as being instantaneous or much faster
compared to the steady-state pulse duration. In contrast, in the considered types of SAs that
are employed in the present work absorption rather than loss is saturated and they show non-

Chapter 3 Saturable absorbers
36
instantaneous response (slow SAs) to laser radiation. Therefore, the saturation effect is mostly
fluence and not intensity dependent, with the saturation fluence as a characteristic parameter.
However, the same SA can be considered as being fast in a mode-locked SSL generating
relatively long picosecond pulses and then the saturation intensity will be the relevant
parameter.
Although this is not desirable, only part of the cavity losses introduced by the SA are
saturable. This part of the losses is often called modulation depth of the SA (in analogy with
this parameter in active mode-locking devices) although the actual effect on the circulating
pulse depends on the saturation level and can be lower than the specified modulation depth.
The non-saturable part of the absorption losses, due e.g. to defect centers, is unwanted and
may eventually prevent mode-locking. After some recovery time, the SA returns to its initial
state and different relaxation mechanisms may be responsible for more than one characteristic
time constant of this recovery process.
In principle all considered types of SAs can operate in reflection when combined with a
dielectric or metallic mirror or in transmission when manufactured on a transparent substrate.
In the following, a reflection type SA will be considered: Its reflectivity R is a function of the
incident pulse fluence Fp and thus a function of time during the interaction with the
circulating pulse. Typically SEmiconductor SAs are Mirrors (SESAMs) while SWCNTs and
graphene are used as transmission type SAs. In the latter case, instead of the reflectivity R one
considers the fluence/intensity dependent transmission T of the SA.
1 10 100 100095
96
97
98
99
100
without TPA
with TPA
Fsat
Pulse Fluence Fp [J/cm2]
Rns
R
Refl
ecti
vit
y R
[%
]
Rlin
Rns
Fig. 3.1 Typical reflectivity curve of a reflection type SA: nonlinear reflectivity R as a function of
incident pulse fluence Fp. Rns and Rlin define the reflectivity with the absorption saturated and the
linear (i.e. low signal) reflectivity, respectively.
The nonlinear reflectivity R versus incident pulse fluence Fp is shown in Fig. 3.1. Such a
dependence can be experimentally measured outside the cavity [63]. This is easier for
transmission type SAs where translation along a focused beam (z-scan) at constant power can
be applied [64]. A deviation from the model function may occur at higher fluences with the
reflectivity decreasing due to two-photon absorption (TPA) [63], an effect more typical for

3.1 Characteristics of SAs used in mode-locked SSLs
37
transmission-type SAs, due e.g. to the substrate material. At relatively low fluences, the
nonlinear reflectivity R can be described by a 2-level system band structure approximation,
neglecting intraband relaxations as well as trapping or recombination. Then one can solve the
coupled nonlinear differential equations for the absorption and the transmitted intensity [63].
After integration over time one obtains:
𝑅(𝐹p) = 𝑅ns
ln(1 + 𝑅lin/𝑅ns(e𝐹p/𝐹sat − 1))
𝐹p/𝐹sat,
As expected for a 2-level system with a slow relaxation, the saturation effect is fluence
dependent [4]. At higher fluences this formula can be corrected by the factor
exp(−𝐹𝑝 𝐹2⁄ ) [63], where 𝐹2 ≈ 𝜏𝑝/𝛽𝑇𝑃𝐴𝐿𝑒𝑓𝑓, 𝜏p is the pulse duration, 𝛽TPA is the TPA
coefficient, 𝐿eff is the effective absorber thickness which accounts for the standing wave
pattern, the penetration depth of the optical field into the mirror, and the different TPA
coefficients for different materials. TPA involves a transition from the ground state of a
system to a higher-lying state by the simultaneous absorption of two incident photons and is
an instantaneous, i.e. intensity-dependent process [65] as can be seen by substitution of the F2
expression into the saturation term which leads to exp(−𝛽𝑇𝑃𝐴𝐼𝑝𝐿𝑒𝑓𝑓) dependence with the
pulse intensity Ip = Fp/p. The differential equation describing this effect reads 𝑑𝐼𝑝 𝑑𝑧⁄ =
−𝛼𝐼𝑃 − 𝛽𝑇𝑃𝐴𝐼𝑝2 where is the linear absorption coefficient (as derived from the
LambertBeer law). The blue curve in Fig. 3.1 shows the modified nonlinear reflectivity in
the presence of TPA assuming 𝐹2 = 150 μJ/cm2. Apart from the introduced losses, TPA
obviously counteracts the pulse shortening mechanism due to saturation because it is an
instantaneous intensity dependent effect that suppresses the pulse peak.
Typically, i.e. in the absence of TPA, only three parameters completely describe the
characteristic curve of the SA shown in Fig. 3.1: the linear reflectivity Rlin, the reflectivity Rns
with the absorption totally bleached and the saturation fluence Fsat. The modulation depth ΔR
and the non-saturable losses ΔRns are expressed then as ∆𝑅 = 𝑅ns − 𝑅lin and ∆𝑅ns = 1 − 𝑅ns,
respectively. The saturation fluence Fsat corresponds to the value of the incident fluence at
which the reflectivity R increases by ΔR/e (i.e. by ~ 37% of ΔR) from Rlin, where the
saturation process starts. Note that all the above definitions imply plane waves, i.e. the spatial
distribution of the beam on the SA is neglected assuming some average values.
The recovery time of the SA can be measured with standard pump-probe techniques.
Despite the complexity of the dynamics, typical temporal decay of the reflectivity (or
transmission) of SAs from a certain saturated level back to the initial, i.e. the linear level can
be modeled with a bi-exponential function
𝑅(𝑡) = 𝐴𝑒−t/𝜏1 + (1 − A)𝑒−𝑡/𝜏2 ,
where A is the amplitude of the fast component, τ1 is the fast decay constant and τ2 is the slow
decay constant.

Chapter 3 Saturable absorbers
38
Fig. 3.2 Typical relaxation dynamics of a SESAM: bi-exponential response with a fast component
τ1 in the 100 fs range corresponding to intraband thermalization and a slow component τ2 in the
picosecond-nanosecond range corresponding to interband recombination (figure reproduced from
[1]).
The two decay constants correspond to different recombination processes as shown in
Fig. 3.2 [1] for a SESAM. A semiconductor can absorb light if the photon energy is sufficient
to excite carriers from the valence to the conduction band (graphene is an exception since it is
a zero band-gap semiconductor). Then, after a decoherence process, the relaxation is
dominated solely by the dynamics of the electron/hole population. The scattering that occurs
between charge carriers is known as intraband thermalization. Usually this process takes place
within ~ 100 fs. Once the thermalization is completed, interband recombination of electron
hole pairs will dominate the relaxation process until the semiconductor returns to
thermodynamic equilibrium. For high quality semiconductors (i.e. with a low level of defect
states), such recombination processes take place on time scales of hundreds of ps and longer
[1]. At high optical intensities, electrons can accumulate in the conduction band, so that initial
states for the absorbing transition are depleted while final states are occupied. Band-filling
occurs because two electrons cannot fill the same state in agreement with the Pauli blocking
principle. This is the physical mechanism behind the saturation (bleaching) of the absorption.
The terms fast and slow refer to the pulse duration. If the steady-state pulse duration of a
CW pumped laser is longer than the relaxation time of the SA, the saturable absorption will
be fast, i.e. intensity dependent with a characteristic saturation intensity parameter Isat ~ Fsat/2.
Time delay
Interbandrecombination≈ ns
Density of states D
Density of states D
E
E
Conduction band
Intrabandthermalization≈ 100 fs
Valence band
Conduction band
Valence band
Mid-gap traps for electr ons≈ ps-ns
D
D

3.1 Characteristics of SAs used in mode-locked SSLs
39
Saturation of the SA by intensity may lead to its damage and in mode-locked SSLs such a
regime is more typical for artificial SAs (in which losses and not absorption are saturated)
such as Kerr lensing in combination with an aperture. On the other hand, the use of a slow SA
does not mean that the resulting steady-state pulse duration of the mode-locked SSL cannot be
shorter than the characteristic decay constants: In fact the slow component might be
instrumental for achieving reliable self-starting. The same types of SAs can be used not only
for mode-locking where the pulse duration is much shorter than the cavity round trip time but
also for Q-switching of SSLs where the pulse duration is much longer than the cavity round
trip time (cf. Chapter 4), however, the requirements are different. In mode-locked SSLs, ΔRns
is typically quite low (e.g. < 1%) and Fsat shall be several times lower than the pulse fluence
which can be adjusted by the beam size on the SA. Depending on the mode-locking
mechanism employed, the recovery time may or may not be important for the generation of
ultrashort pulses. Low ΔRns helps to achieve higher average power and shorter pulse durations.
Optical damage is a more serious issue in SAs used for Q-switching because of the higher
fluences. Thus, it is essential to avoid Q-switching instabilities in mode-locked SSLs, e.g. by
enhancing the bleaching through tighter focusing on the SA. This and other issues related to
the dependence of the mode-locking regime on the SA parameters will be discussed in
Chapter 4.
3.2 SESAMs
SEmiconductor SA Mirrors (SESAMs) are the most widely used SAs developed for passively
mode-locked SSLs. Until their invention such passive mode-locking was possible only in a
pulsed (non-steady-state) regime employing fast dye SAs and a steady-state regime under CW
pumping was considered to be impossible to realize because of instabilities [4]. The general
design of a SESAM is characterized by two main components: the semiconductor quantum
wells (QWs) and the Bragg mirror. III-V semiconductor materials offer a wide flexibility in
the absorption range to match the emission wavelength of a particular SSL. Despite the band
structure and the presence of mid-gap impurities, the long wavelength limit of the saturable
absorption is only determined by the band-gap. Thus, the absorption of different III-V
semiconductor materials ranges from ~ 400 nm in the UV (GaN-based structures) to ~ 2.5 μm
in the near-IR (InGaAsSb-based structures). However, a broad spectral range for a selected
material composition may only be obtained at the expense of higher defect concentration
because this is achievable at an increased lattice mismatch to a given substrate material. Also,
TPA may be non-negligible in SESAMs [66].
Different from the typical GaAs-based design for operation around 1 μm, SESAMs for
lasers emitting around 2 μm are based on InGaAs or InGaAsSb QWs. In the latter case, GaSb
substrates and AlAsSb/GaSb distributed Bragg reflectors can be applied to avoid large lattice
mismatch, improve the SESAM quality and reduce the non-saturable losses. Fig. 3.3 shows
such a typical GaSb-based design.

Chapter 3 Saturable absorbers
40
(a) (b)
Fig. 3.3 AR-coated near-surface quantum-well (QW) design GaSb-based SESAM (a) and its
schematic structure (b).
Interband recombination processes taking place on a time scale of hundreds of
picoseconds or even nanoseconds will restrict the performance of such a SESAM with respect
to the achievable pulse duration. Few methods have been developed to accelerate the
recombination processes, such as low temperature growth [67] and ion implantation [68].
However, most of these techniques increase the defect density and thus the non-saturable
losses imposing a trade-off between faster recovery time and lower ΔRns of the SESAM
design. A near-surface QW design is another method to accelerate the recovery of the
saturable absorption by placing the QWs only a few nm from the surface (separated by a cap
layer, as shown in Fig. 3.3), see Table 3.1 and Fig. 3.4. This is due to fast surface
recombination effects. In fact, the recovery time of such high quality heterostructures did not
change for a relatively large variation of the growth conditions [69] which is attributed to the
fact that in narrow band-gap materials, such as GaSb, the Auger recombination
(recombination of electron-hole pair giving up their energy to an electron in the conduction
band, increasing its energy) is significantly stronger than in GaAs and InP heterostructures,
which also contributes to the reduced carrier lifetime. The band gap of GaSb is 0.726 eV and
though not observed for the intensities applied so far, TPA can be expected with ultrashort
pulses in the 2 µm spectral range.
Because the initially developed semiconductor SAs introduced large cavity losses, they
were first used in weakly coupled secondary cavities (e.g., such coupled through a low-
transmission output coupler of the main cavity) [70]. This simultaneously resolved the
problem of the too low saturation intensity and the low damage threshold. The antiresonant
Fabry–Pérot SA (A-FPSA) design combines these properties in an integrated structure that
can be employed directly in the cavity, most often as an end reflector [71]. In earlier A-FPSA
designs, the SA was placed between two Bragg mirrors. Adjusting the thickness of the SA
and spacer layers, the Fabry-Perot is operated at antiresonance at the laser wavelength so that
the intensity inside is always lower than the incident intensity, which increases the effective
saturation intensity and the damage threshold of the device. The dielectric top reflector can be
designed to control the intensity in the SA. The A-FPSA exhibits negligible bandwidth
QW - InxGa1-xAsySb1-y
GaS
b sub
strate
AlAsxSb1-x/GaSb Bragg mirror
Cap layer - GaSb
AR coating

3.2 SESAMs
41
limitations at antiresonance because the free spectral range is very broad and the
semiconductor bottom Bragg reflector or the dielectric top reflector may be the limiting factor.
Modern SESAMs are based on a complex design, which may incorporate also special
dispersive properties. Concerning the Fabry-Perot effect it ranges from the high-finesse A-
FPSA (high reflectivity of the top reflector) version to AR-coated SESAMs where the top
reflectivity is missing. In the latter case thinner SA layers have to be used to suppress the
effect of non-saturable losses while the saturation performance can be controlled by the beam
waist on the SESAM surface [72]. In addition, the AR-coating can increase the modulation
depth of the SESAM and act as a passivation layer for the semiconductor surface that can
improve the long-term reliability of the entire device [58].
The GaSb-based SESAMs employed in the present work were AR-coated (Table 3.1 and
Fig. 3.4). Precise simulations performed by the manufacturers in the case of the near-surface
design indicate that the electric field strength in the position of the QWs is twice lower with
AR-coating compared to the case without, cf. Fig. 3.5. Measurements indicated, however, that
the AR-coating reduces the slow decay constant τ2 by as much as 68% [73] which is a
desirable effect (although no data are available about the effect on the actual modulation
depth).
Table 3.1 AR-coated GaSb-SESAMs with different designs tested in the present work (from [73]).
SESAM No. of QWs Cap [nm] τ1 [ps] τ2 [ps]
No.1 3 300 0.292 9.7
No.2 2 5 0.266 4.1
No.3 1 10 0.300 1.7
No.4 1 5 0.471 1.6
No.5 2 50 0.239 20
-2 0 2 4 6 8 100.0
0.2
0.4
0.6
0.8
1.0 bi-exponential fit
No.1
No.2
No.3
Tra
nsm
issio
n c
han
ge
T/T
[a.u
.]
Delay [ps]
No.4
Fig. 3.4 Relaxation dynamics of different GaSb-based SESAMs from Table 3.1 (from [73]).

Chapter 3 Saturable absorbers
42
0.0 0.5 1.0 1.5 2.00
10
20
30
40
50
60
Optical distance [FWOT]
Ele
ctr
ic f
ield
[V
/m]
AR
SESAM No.4
QW DBR
with AR
without AR
1
2
3
4
5
Refr
acti
ve i
nd
ex
Fig. 3.5 Simulation of the electric field in SESAM No.4 with and without AR-coating: With a
near-surface QW design the field drops almost 2 times in the presence of AR-coating. The FWOT
(full wave optical thickness) units correspond to the design wavelength (2 µm). The size of the
QW is exaggerated for better visibility. DBR: distributed Bragg reflector.
For low optical intensities, the degree of electronic excitation is small, and the absorption
remains unsaturated. At high optical intensities, however, electrons can accumulate in the
conduction band, so that initial states for the absorbing transition are depleted while final
states are occupied (Pauli blocking).
SESAMs require complex and expensive fabrication processes such as metal organic
chemical vapor deposition (MOCVD), metal organic phase vapor epitaxy (MOPVE), or
molecular beam epitaxy (MBE), From the above description it is also clear that the complex
stack of layers including AR-coating, cap layer, QWs, distributed Bragg reflector and
substrate required for a specific SESAM may lead to a dramatic number of parameters to be
optimized in different growth runs. This increases not only the fabrication complexity but also
the costs.
3.3 SAs based on carbon nanostructures
As already mentioned, SWCNTs and graphene also show saturable absorption properties
which are suitable for mode-locking [60, 74]. Compared to SESAMs, the fabrication of
SWCNT- and graphene-SAs is much simpler: Commercially available SWCNTs or graphene
can be easily transferred (i.e. by spin coating) onto a dielectric mirror or a transparent
substrate.
SWCNTs and graphene represent 1D and 2D carbon nanostructures, respectively. As
illustrated in Fig. 3.6, monolayer graphene may be regarded as a source material from which
different dimensions of carbon nanostructures can be constructed [75]. Although the growth
of SWCNTs does not require graphene as a key precursor [76], for visualization, SWCNTs
may be understood as a rolled up sheet of graphene with diameter on the nanometer scale and
length on the micrometer scale.

3.3 SAs based on carbon nanostructures
43
Fig. 3.6 Construction of fullerenes, SWCNTs, and graphite (from left to right) from graphene,
which may be understood as a basis structure for the three carbon nanostructures (from [75]).
3.3.1 SWCNT-SAs
Depending on their chirality (roll-up direction), SWCNTs exhibit pronounced metal or
semiconductor characteristics. In particular, the latter possess a pronounced optical
nonlinearity together with chemical stability and high optical damage threshold [77].
Figure 3.7 shows the qualitative pattern of sharp van Hove peaks, which arise from quasi–
onedimensionality, predicted for electronic state densities of semiconducting SWNTs [78].
Fig. 3.7 Schematic density of electronic states for an individual free-standing SWCNT showing
the first two interband transitions. Solid arrows depict optical absorption and emission transitions;
dashed arrows denote non-radiative relaxation of the electron (in the conduction band) and hole (in
the valence band) before emission (after [78]).

Chapter 3 Saturable absorbers
44
As the absorption resonance of the electronic interband transition spectrally shifts with
diameter and chirality [79], natural mixtures of SWCNTs automatically provide smooth and
broad absorption in the near-IR range. A typical transmission spectrum of a SWCNT-SA as
the one shown in Fig. 3.8a [80] exhibits two broad absorption bands spanning from 0.85 to
1.15 μm and from 1.60 to 2.10 μm. The latter is attributed to an overlap of the first interband
transition (E11) in semiconducting SWCNTs (Fig. 3.7) of different diameters and chiralities
with intertube interaction causing further broadening. Raman spectroscopy provides
information on the diameter and chirality of the distributed SWCNTs. The former band is
related to the E22 interband transition in semiconducting SWCNTs (Fig. 3.7). The two
absorption bands represent averaging and their position depends on the synthesis method for
the SWCNTs which affects their distribution [81]. Using different types of SWCNTs and
based on these two transitions such SAs can be employed for mode-locking of various TM
and Ln lasers emitting in the near-IR [81] and in particular of Tm/Ho lasers, operating in the
2 µm spectral range. A particular advantage of SWCNTs is that a dispersion of different types
can be used to manufacture a single device applicable in all near-IR SSLs [60, 81].
Under excitation, charge carriers in SWCNTs are excited from the valence to the
conduction band by absorbing a photon. With increasing fluence the number of occupied
states increases, preventing absorption of subsequent incident photons. This leads to a
characteristic decrease of the absorption with the incident intensity, similar to semiconductors.
Regardless of the fabrication procedure used, non-saturable losses are always present in
SWCNTs, in the first place related to scattering. Depending on the preparation of the SWCNT
dispersion and the coating process, more or less pronounced bundling and curling may occur,
causing nanotubes to interweave, eventually forming macroscopic ball-like objects with much
less favorable scattering properties. However, bundling may also enhance tube-to-tube
interactions to some extent, accelerating the absorber relaxation [60]. In any case, control of
the statistical distribution of the SWCNTs is the key to balancing non-saturable losses and
accelerated relaxation. Separating low values of saturable and non-saturable losses is
experimentally difficult and such data are not available in the entire near-IR spectral range.
The SWCNT SAs studied in this work were fabricated by the procedure described in [78].
Purified SWCNTs synthesized by the arc-discharge method from a commercial supplier were
used as a precursor. They were dried under vacuum at 100C and dispersed in
dichlorobenzene (DCB) via ultrasonic agitation. Subsequently, poly(m-phenylenevinylene-co-
2,5-dioctoxy-p-phenylenevinylene) (PmPV) was added in the ultrasonic process to enhance
their solubility. The SWCNT dispersion and a polymethyl-methacrylate (PMMA) solution
were then mixed and stirred. Transmission type SAs were produced by spin coating the
SWCNT film onto a quartz substrate (substrate thickness 1 mm, film thickness ~ 300 nm)
[77]. Assuming a modulation depth < 0.5% as deduced at 1.3 µm [80], the non-saturable
losses of such SWCNT-SAs near 2 µm are estimated to be in the 0.7 - 1.2% range.
Figure 3.8b shows the measured relaxation dynamics of such a SWCNT-SA pumped and
probed at 1.92 µm [80]. With the bi-exponential decay model described before, the response
is well fitted by one nearly instantaneous component with a time constant of ~ 0.25 ps and a

3.3 SAs based on carbon nanostructures
45
second slower component with a characteristic time of 1.16 ps, which is comparable to the
fastest response reported for GaSb-based SESAMs.
800 1200 1600 200097
98
99
100
-1 0 1 2 3 4 50.0
0.2
0.4
0.6
0.8
1.0
E11
(a)
Tra
nsm
issio
n T
[%
]
Wavelength [nm]
E22
(b)
1 = 0.25 ps
2 = 1.16 ps
experimental data
bi-exponential fit
Tra
nsm
issio
n c
han
ge
T
/T [
a.u
.]
Delay [ps]
Fig. 3.8 (a) Low signal transmission spectrum of a transmission-type SWCNT-SA (corrected for
Fresnel losses) and (b) relaxation dynamics of such a SWCNT-SA at 1.92 µm (from [80]).
TPA has been observed in SWCNTs at shorter wavelengths near 800 nm for peak
intensity values on the GW/cm2 level [82]. However, no such observations have been reported
at longer wavelengths for similar intensity levels [60].
3.3.2 Graphene-SAs
While the saturable absorption of SWCNTs decreases significantly beyond 2 µm, vanishing
towards 2.1 µm [80], graphene is characterized by a broad absorption extending into the mid-
IR [74]. Furthermore, the modulation depth of graphene-SAs can be increased by adding
graphene layers [74]. A single-layer graphene is characterized by “universal” small-signal
absorption, almost constant from the visible (~ 0.6 μm) up to at least ~ 3 μm, equal to πα =
2.3% where α = e2/40ħc ~ 1/137 is the fine structure constant [83]. For multilayer (n)
graphene, the small-signal absorption scales with n almost linearly, ~ nπα. The mechanism of
saturable absorption is illustrated in Fig. 3.9. Graphene has a unique band structure. Both its valence
and conduction bands have hollow cone shapes touching each other which results in almost zero
band-gap. The absorption of a photon with an energy hν leads to the appearance of a hole in the
valence and an electron in the conduction band. For high excitation intensities, the concentration of
photon-generated carriers increases significantly, so that the states near the edges of the bands (within
an energy interval of hν/2 for each band) are filled [74, 84]. Thus, further absorption is blocked
implying transparency of graphene.
The linear absorption of graphene is almost constant but the saturable part shows pronounced
wavelength dependence [85]. In particular, Isat decreases with wavelength and it is easier to achieve
saturation of graphene at longer wavelengths. Figure 3.9 illustrates this dependence: The number of
electronic states is linearly proportional to the energy and lower energy photons require the excitation
of a lower number of electrons in order to exhaust the corresponding part of the valence band and
bleach the absorption. Indeed, measurements indicate that Isat decreases in the ~ 0.5-2 µm spectral

Chapter 3 Saturable absorbers
46
range inversely proportional to the wavelength, approaching zero at long wavelengths, which is the
characteristic of the Dirac point in the graphene band structure. Thus, the use of graphene as a SA for
mode-locking ~ 2 µm Tm/Ho lasers is more attractive compared to lasers emitting e.g. at ~ 1 µm.
Fig. 3.9 The saturable absorption effect in graphene.
The graphene-SAs employed in the present work were fabricated following the procedure
described in [86]. Monolayer graphene was synthesized by chemical vapor deposition (CVD)
of the mixture of methane and hydrogen gases on Cu foils at 1000°C. After spin-coating the
well-grown graphene monolayer with 5 wt % PMMA in chlorobenzene, the underlying Cu
foil was etched and the graphene layer supported by PMMA was transferred onto quartz or
CaF2 substrates without any intense mechanical and chemical treatments and dried on a hot
plate at 80°C. Finally, acetone was used to remove the PMMA layer. Multilayer SAs were
fabricated by layer-by-layer stacking of monolayer graphene.
400 800 1200 1600 2000
86
88
90
92
94
96
98
100
-2 -1 0 1 2 3 4 50.0
0.2
0.4
0.6
0.8
1.0(a)
Tra
nsm
issio
n T
[%
]
Wavelength [nm]
graphene
monolayer
bilayer
trilayer
1 = 0.18 ps
2 = 1.285 ps
experimental data
bi-exponential fit
Tra
nsm
issio
n c
han
ge
T/T
[a.u
.]
Delay [ps]
(b)
Fig. 3.10 (a) Transmission spectra of monolayer, bilayer and trilayer graphene-SAs (corrected for
Fresnel losses) (from [86]) and (b) relaxation dynamics of a graphene-SA at 1.56 µm (from [62]).
conductionband
hv
e
h
hv2
E
kx
ky
valenceband
hv2

3.4 Comparison of different SAs employed for mode-locking at 2 µm
47
The transmission spectra of such monolayer, bilayer and trilayer graphene-SAs are shown
in Fig. 3.10a [86]. The increase in absorption indeed occurs in steps of 2.3%. Assuming a
modulation depth similar to the values measured at 1.25 µm (0.54% and 1.3% for monolayer
and bilayer graphene, respectively [86]), the non-saturable losses near 2 µm were calculated
as 1.86% for monolayer and 3.4% for bilayer graphene, slightly higher compared to the
SWCNT-SAs but lower compared to the SESAMs.
Figure 3.10b shows the measured relaxation dynamics of a graphene-SA at 1.56 µm [62].
Applying the bi-exponential decay model, the response is well described by a fast component
with a time constant of 0.18 ps and a slower component with a decay time of ~ 1.29 ps.
Due to resonant enhancement, the TPA coefficient βTPA of graphene shows also strong
wavelength dependence and can be few orders of magnitude higher compared to normal
semiconductors [87]. However, the relevant thickness 𝐿eff amounts to only few nm (one
atomic layer), which is >106 times thinner compared with a typical SESAM design, and no
detrimental TPA effects are expected in graphene-SAs.
3.4 Comparison of different SAs employed for mode-locking at 2 µm
The relevant characteristics of the SAs employed for mode-locking of Tm/Ho lasers near
2 μm are summarized in Table 3.2. In general, both carbon nanostructures are characterized
by a fast carrier relaxation process, low saturation fluence, low cost as well as easy fabrication.
Table 3.2 Relevant properties of different SAs for the 2 μm spectral range.
GaSb-based
SESAMs SWCNTs
Mono/bilayer
Graphene
Operating wavelength [µm] 1.9-3 [73] 0.8-2.1 [80] 0.8-2.5 [74]
Modulation depth ΔR [%] ≈ 3-6 [88]*
< 0.50% [80] 0.54 / 1.30 [86]
Non-saturable losses ΔRns [%] ≈ 0.7-1.2 [80] 1.86 / 3.4 [86]
Saturation fluence Fsat [μJ/cm2] NA < 10 [80] 14.5 / 22.5 [86]
Fast relaxation time τ1 [ps] 0.3-0.5 [73] 0.25 [80] ≈ 0.18 [62]
Slow relaxation time τ2 [ps] ≈ 2-10 [73] 1.16 [80] 1.29 [62]
TPA not observed absent absent
Fabrication complex/expensive simple simple
*in the case of the SESAMs only the total losses are known and included in the table.
As can be concluded from the Table 3.2, the characteristics of the SAs described are
often difficult to be measured extracavity (e.g. in pump and probe arrangements) and not all
of them are precisely known. This is related mainly to the low values of the modulation depth.
However, in most of the cases the signal-to-noise ratio is sufficient to evaluate the relaxation
times. As will be seen in Chapter 5, the short relaxation times play a crucial role in achieving
pulse shortening in mode-locked 2-µm lasers.


49
Chapter 4
Fundamentals of passive mode-locking
The gain media and SAs employed in the present work were reviewed in the previous two
chapters. Inserting such a SA into the cavity of a CW laser containing the gain medium might
result in two different regimes of operation: passive Q-switching and mode-locking. It is
important to distinguish them here because although the thesis is devoted solely to mode-
locking, the Q-switching process might simultaneously occur, leading to the so-called regime
of Q-switched mode-locking (QSML). This regime is essentially different from the steady-
state mode-locking which can be called CW mode-locking (CWML).
In a passively Q-switched laser, the absorption of the SA will prevent the build-up of
oscillation, continuously increasing the population inversion of the gain medium over some
period in which the cavity quality Q-factor is low (high losses). At a certain point, the SA
losses suddenly start to decrease due to the rapidly growing amplified spontaneous emission
(ASE). The cavity begins to resonate the radiation and its Q-factor grows rapidly (low loss
cavity) while the laser produces finally a so-called “giant pulse” at its output. After the giant
pulse has been generated, the cavity Q-factor again switches to low because the gain has been
depleted and the SA has recovered. Under CW pumping the process can be periodic and
typically the pulse durations are much longer (in the 1-100 ns range) than the cavity round trip
time. Highest energies (at the mJ level) can be generated if lasing is suppressed for a period
equal to the gain medium lifetime, i.e. at repetition rates corresponding to the inverse lifetime.
Mode-locking is a totally different process: A Fabry-Perot cavity is resonant for an
infinite number of longitudinal modes with frequency separation of c/2Lc where Lc is the
optical cavity length and a CW laser normally oscillates on many longitudinal modes (optical
frequencies) which fall within the gain bandwidth. The electric field of the different
longitudinal modes inside the cavity can be expressed as [4]:
𝐸𝑚(𝑡) = 𝐸0 cos (𝜔0𝑡 + 𝑚𝜋𝑐
𝐿𝑡 + 𝜑𝑚),
where 𝜔0 is the center frequency and 𝜑𝑚 is the phase of the m-th longitudinal mode. If the
phase 𝜑𝑚 of the different modes are locked with a constant 𝜃0, 𝜑𝑚 = 𝜑0 + m𝜃0 , the sum of
such 2n+1 modes can be expressed as,
𝐸(t) = ∑ 𝐸𝑚
𝑛
𝑚=−𝑛
(𝑡) = 𝐸0 ∑ cos (𝜔0𝑡 + 𝑚𝜋𝑐
𝐿𝑡 + 𝜑0 + 𝑚𝜃0)
𝑛
𝑚=−𝑛
= 𝐸0
sin 2𝑛 + 1
2 (𝜋𝑐𝐿 𝑡 + 𝜃0)
sin12 (
𝜋𝑐𝐿 𝑡 + 𝜃0)
cos(𝜔0𝑡 + 𝜑0).

Chapter 4 Fundamentals of passive mode-locking
50
The last expression can be regarded as a plane wave with a carrier frequency 𝜔0 and an
amplitude modulated by the factor sin2𝑛+1
2(
𝜋𝑐
𝐿𝑡 + 𝜃0) /sin
1
2 (
𝜋𝑐
𝐿𝑡 + 𝜃0). The formation of a
pulse by the superposition of longitudinal modes is illustrated in Fig. 4.1 which shows the
temporal intensity and the spectral intensity of the pulse (known in physics also as a wave
package).
1 2 3
Round trip
T = 2L/cI(t)
= c/LI()
Angular frequency
Fig. 4.1 Superposition of longitudinal modes, an effect known as mode-beating in the case of few
modes, gives birth to well-defined pulses at a separation of 2L/c in the case of a large number of
longitudinal modes (n = 1 assumed for the refractive index).
If a fixed phase relationship can be established between these different longitudinal
modes, ultrashort pulses are formed through the superposition of these frequencies whose
pulse duration (in the picosecond and femtosecond ranges) is much shorter than the cavity
round trip time. As in Q-switching, this can be realized externally (active modulation) or by
the pulse itself (passively). In the steady-state which can be established under CW pumping,
mode-locking could be understood as a single pulse, oscillating inside the cavity and
“bleaching” (saturating) the SA each time when passing through it, while random fluctuations
are suppressed by the SA. This eventually produces a pulse train at the output, with a
repetition frequency frep = c/2Lc. Obviously a SA with a relaxation time much longer than the
cavity roundtrip will only lead to Q-switching. It is essential to realize that the spectrum of a
mode-locked laser consists of the discrete modes which, however, are normally not resolved
by the spectrometer which records the envelope.
While active mode-locking which relies on an optical modulator typically produces
longer (~ 100 ps) pulses and needs electronic synchronization between the cavity length and
the modulation frequency, passive mode-locking of bulk SSLs is capable of producing pulses
as short as few femtoseconds. Nowadays, numerous cavity elements and techniques have

4.1 Pulse shaping effects
51
been demonstrated but the operation principle of all of them can be reduced to a saturable loss
effect and in particular to saturable absorption (cf. Chapter 3). The already mentioned Kerr
lens mode-locking (KLM) is the most prominent example of a situation without absorption
and the main advantage of this technique is that there is no heat load leading to damage. The
other most exploited technique relies on a SA used in reflection or transmission. Both effects
can be present simultaneously: the SA serving as a starting and stabilizing mechanism and the
Kerr effect shortening the pulse duration.
In this chapter, the basic concepts and theories of passive mode-locking are briefly
reviewed. The role of the dispersion and the methods for dispersion compensation are
explained in detail, as well as self-phase modulation (SPM). Then a model of passive mode-
locking is introduced leading to the so-called Haus master equation for the steady-state pulse
solution. The three main passive mode-locking mechanisms are presented followed by the
related soliton type solutions to the equation and their properties. Finally, the stability of
CWML against Q-switched operation and pulse break-up is discussed.
4.1 Pulse shaping effects
All cavity elements are associated with a respective pulse shaping effect, i.e. a modification of
the pulse intensity and/or phase. One such effect is the saturable absorption considered in the
previous chapter and related to the SA. The active medium discussed in Chapter 2 also is
important for the formation of the steady-state pulse. However, in Ln SSLs (both bulk and
fiber) there is no appreciable saturation of the laser gain by interaction with a single pulse
because of the relatively low emission cross-sections leading to high saturation energies and
negligible gain depletion. The gain medium lifetime in Ln3+
-doped materials is much longer
than the cavity round-trip time and saturation still takes place in terms of average intracavity
intensity which only reduces the low signal gain compared to the situation without lasing but
there is no change in the instantaneous gain during the interaction with a single pulse.
However, the spectral extent of the gain can play the role of a spectral filter (similar to the SA,
the cavity mirrors, etc.) which affects the steady-state regime. The cavity losses, both useful
such as the output coupler (OC) and unwanted losses, also play a role in the formation of the
steady-state and its characteristics. The spectral limiting (filter) effect is mainly due to the OC
because it is most difficult to be manufactured broadband. In the following the focus will be
on two pulse shaping effects of crucial importance in femtosecond SSLs: dispersion and SPM.
4.1.1 Dispersion
The origin of dispersion in dielectric media is the frequency-dependence of the linear part of
the dielectric susceptibility 𝜒(1)(𝜔) whose real part is related to the refractive index 𝑛(𝜔).
Considering a linearly polarized optical pulse traveling through a transparent isotropic
medium with length L, different frequency components will experience time delay with
respect to each other. The frequency-dependent phase shift can be expressed as

Chapter 4 Fundamentals of passive mode-locking
52
𝜙(𝜔) = 𝑘(𝜔)𝐿 ,
where
𝑘(𝜔) =𝑛(𝜔)
𝑐 𝜔
is the wave number. For anisotropic media, the refractive index corresponding to the laser
polarization has to be considered. The phase shift can be expanded as a Taylor series around
the center frequency 𝜔0,
𝜙(𝜔) = 𝜙(𝜔0) +𝜕𝜙
𝜕𝜔(𝜔 − 𝜔0) +
1
2!
𝜕2𝜙
𝜕𝜔2(𝜔 − 𝜔0)2 +
1
3!
𝜕3𝜙
𝜕𝜔3(𝜔 − 𝜔0)3 + ⋯ .
The 0th
-order term represents a constant phase shift. The 1st order derivative term
𝜕𝜙/𝜕𝜔 will introduce a linear phase shift for different frequencies and is called group delay
(GD) because it is related to the group velocity of the pulse in the medium. The pulse
envelope and phase propagate with different velocities. The GD describes the delay of the
pulse as compared to a pulse with a flat phase (i.e. for vanishing dispersion).
Leading edgeTrailing edge
n()
Trailing edge Leading edgeL
Fig. 4.2 Pulse broadening and chirping upon propagation in a medium with positive GDD.
The 2nd
order derivative term 𝜕2𝜙/𝜕𝜔2 is called group-delay dispersion (GDD). It
indicates a linear frequency dependence of the GD for different frequency components: e.g.,
for positive GDD higher frequency components will be delayed with respect to lower
frequency components as shown in Fig. 4.2. This defines a positive or up-chirp (frequency
modulation) of the pulse which is simultaneously temporally broadened behind the medium.
The 3rd
order term 𝜕3𝜙/𝜕𝜔3 representing the Third Order Dispersion (TOD) introduces a
frequency dependence of the GDD leading to a more complex distortion of the pulse shape.
These dispersion terms can be defined and quantified per unit length, e.g. the GD per unit
length corresponds to the reverse of the group velocity 𝜐g . From the Sellmeier equations
which describe the wavelength dependence of the refractive index of a transparent material,
one can calculate all the dispersion terms. Table 4.1 summarizes the relations between the two
definitions and the defining equations in terms of wavelength and refractive index.

4.1 Pulse shaping effects
53
Table 4.1 Relation between dispersion and dispersion per unit length.
Term Defining equation Term
per unit length Defining equation
Group delay (GD) 𝜕𝜙
𝜕𝜔= 𝛽1𝐿 =
𝐿
𝜐g
Group velocity 𝜐g 𝛽1
=𝜕𝑘
𝜕𝜔=
1
𝜐g
=1
𝑐(𝑛 − 𝜆
𝑑𝑛
𝑑𝜆)
Group delay
dispersion (GDD)
𝜕2𝜙
𝜕𝜔2= 𝛽2𝐿
Group velocity
dispersion (GVD) 𝛽2
=𝜕2𝑘(𝜔)
𝜕𝜔2=
𝜆3
2𝜋𝑐2
𝑑2𝑛
𝑑𝜆2
Third order
dispersion (TOD)
𝜕3𝜙
𝜕𝜔3= 𝛽3𝐿
Third order
dispersion (TOD) 𝛽3
=𝜕3𝑘(𝜔)
𝜕𝜔3=
−𝜆4
4𝜋2𝑐3(3
𝑑2𝑛
𝑑𝜆2+ 𝜆
𝑑3𝑛
𝑑𝜆3)
For Gaussian pulse shapes, the propagation task through a dispersive medium with GDD
can be analytically solved [8, 89]. This is due to the fact that a Gaussian pulse shape is
maintained: (i) upon switching between intensity and field, (ii) upon Fourier transform, and
(iii) under the effect of GDD (in the frequency domain). Operating with complex Gaussian
functions and back converting to the time domain, one obtains expressions for the pulse
duration and chirp after the dispersive medium. For unchirped input pulses the expressions are
greatly simplified and the output pulse is broadened (stretched) according to:
𝜏𝐿 = 𝜏0√1 + (4ln2𝛽2𝐿
𝜏02
)2
where L (0) is the output (input) pulse duration (FWHM intensity).
101 102 103 104101
102
103
104
105
106
103 fs2
102 fs2
0 [fs]
L [
fs]
104 fs2
105 fs2
106 fs2
Fig. 4.3 Output versus input pulse duration (FWHM intensity) for a Gaussian pulse propagating in
a medium with GDD (numbers indicate the absolute value of the GDD assumed).
Figure 4.3 illustrates the pulse broadening as a function of the initial pulse duration and
the GDD. One can see that a relatively short input pulse, i.e. one for which 𝛽2𝐿 > 𝜏02 is

Chapter 4 Fundamentals of passive mode-locking
54
satisfied, experiences a much stronger broadening. Thus, whether a pulse is understood as
short or long depends on the GDD and this can strongly vary with wavelength, e.g., the
dispersive broadening can be much more pronounced in the UV compared to the near-IR for a
given transparent material.
Similar to GDD, TOD becomes an important factor when TOD > 𝜏03, typically only
when the pulse duration is below 10 fs in the near-IR.
It shall be outlined here that dispersion is a linear effect which does not change the
intensity distribution of the pulse spectral components – only their relative phase in the
frequency domain is modified. Accordingly, the FWHM intensity of this distribution, equal to
Δ = 2ln2/πτ0 for an unchirped input Gaussian pulse, remains unchanged. The product of the
temporal and spatial FWHMs is an important quantity for ultrashort pulses called the time-
bandwidth product (TBP):
𝜏𝐿Δ𝜈 =2𝑙𝑛2
𝜋√1 + (4ln2
𝛽2𝐿
𝜏02
)2
For the unchirped input Gaussian pulse (L=0) this product equals 0.441 while the actual
TBP of the output pulse shows the extent to which a chirped pulse can be recompressed to its
initial duration using a dispersive material with opposite sign of the GVD or what the pulse
duration would be if the given GDD is pre-compensated. In any case the goal is always to
have a minimum TBP because such pulses, called bandwidth- or Fourier-limited, ensure the
best simultaneous temporal and spectral resolution in subsequent experiments where they are
applied. The Gaussian pulse shape is a useful approximation to derive analytically the above
expressions and also in many other cases. Strictly speaking, only for this pulse shape linear
chirp in the time domain (linear dependence of the instantaneous frequency on time)
corresponds to a quadratic dependence of the spectral phase on frequency. The Gaussian
pulse shape is sometimes used for fitting the pulse shape in mode-locked lasers but
theoretically it is more related to active mode-locking and the corresponding equations. As
will be seen later, in passively mode-locked SSLs the pulse shape is mostly assumed (also on
the basis of theoretical models) to be sech2 in intensity. For unchirped pulses with this shape
one can derive that TBP = 0.315. This product is not very different also for other pulse shapes
and so are most of the conclusions made above, e.g. the dependence in Fig. 4.3.
4.1.2 Dispersion compensation
Dispersion compensation plays also a key role in the generation of femtosecond pulses. A
frequency dependent refractive index will lead to a mode spacing c/2nL which is not constant
and the longitudinal modes will not superimpose properly in order to form an ultrashort pulse.
The laser cavity may normally exhibit GDD as high as few 1000 fs2 per round trip, mainly
due to the active medium although SA and other substrates may also contribute. Such values
have to be compensated by GDD with opposite sign in order to avoid dispersive broadening.

4.1 Pulse shaping effects
55
Also, as will be shown later, for soliton formation, negative GDD is required rather than
vanishing GDD. There are different elements that can be used for dispersion compensation.
The two briefly discussed here are the most widely employed and they were also used in the
experimental part of the present work, in the 2 μm spectral region.
Fig. 4.4 Scheme of a prism pair for GVD compensation. θB and α: Brewster and apex angles.
Antiparallel prism pairs with compensated angular dispersion (i.e. suppressed wavelength
selectivity effect) are one of the most commonly used elements for the generation of negative
GVD [90]. As shown in Fig. 4.4, different spectral components propagate along different
paths between the prisms, in the second prism and after it, which leads to negative overall
GVD. Grating pairs have the same property but they are not suitable for intracavity
applications due to the higher losses while prisms can be designed as symmetric Brewster
angle prisms for the given wavelength (i.e. such that the apex angle is calculated from the
Brewster angle B to ensure a symmetric beam path) with vanishing Fresnel losses for p-
polarization. The resulting 2nd
order dispersion which depends on the separation of the two
prisms is known as angular GVD whereas the insertion of the prisms introduces additional
GVD due to material dispersion. To recombine the spatially offset frequency components
behind the second prism, the pair can be complemented by a second one which is a mirror
image of it (if ring cavities are employed) or equivalently a plane retro-reflecting cavity
mirror can be employed after the second prism (in linear cavities), as shown in Fig. 4.4. In
both cases, by introducing a knife edge in the region where the spectral components are
spatially separated one can perform some independent tuning of the central wavelength or
suppress some unwanted spectral components.
The angular and material GVD of a Brewster prism pair, assuming a separation much
larger than the glass path, are given for a single pass by [8],
Angular GVD =−2𝜆3
𝜋𝑐2(
𝜕𝑛
𝜕𝜆)
2
,
Material GVD =𝜆3
2𝜋𝑐2
𝜕2𝑛
𝜕𝜆2 .
Additional material GVM
α
d
α
< <n1 n2 n3

Chapter 4 Fundamentals of passive mode-locking
56
Initially such prism pairs were employed in dye lasers operating in the visible and
Ti:sapphire lasers operating near 800 nm where the material GVD is positive. Thus, angular
GVD allowed one to reach zero total GDD or to achieve negative GDD. In all cases,
translation of the second prism in Fig. 4.4 enables fine tuning of the total GDD. Figure 4.5
shows the calculated GVD around 2 μm for several commonly used prism materials.
1900 1950 2000 2050 2100
-100
0
100
200
300
1900 1950 2000 2050 2100
-150
-100
-50
0(a)
Mate
rial
GV
D [
fs2/m
m]
Wavelength [nm]
YAGFused Silica
ZnS
ZnSe
CaF2
MgF2
(b)
An
gu
lar
GV
D [
fs2/c
m]
Wavelength [nm]
YAG
Fused Silica
ZnS
ZnSe
CaF2
MgF2
Fig. 4.5 Material (a) and angular (b) GVD of commonly used prism pairs (single pass) for GDD
compensation in the 2 µm spectral range. Note that the beam path in the prisms is on the mm scale
while between them it is on the cm scale which explains the different units.
Table 4.2 GVD values at 2.02 μm. The Sellmeier equations used are from the references.
Prism material Material GVD
[fs2/mm]
Angular GVD
[fs2/cm]
CaF2 [91] − 22.4 − 15.2
MgF2 [92] o-wave − 30.0 − 18.2
YAG [93] − 64.6 − 135.3
ZnS [94] 158.5 − 59.7
ZnSe [95] 278.1 − 114.3
Fused silica [96] − 105.0 − 127.4
Table 4.2 summarizes the GVD values calculated for several materials at 2.02 μm.
Fluoride and oxide materials exhibit anomalous (negative) material GVD around 2 μm. Thus
the prism pair can only introduce negative total GDD. Only the low band-gap chalcogenide
materials exhibit normal (positive) GVD at this wavelength and permit universal adjustment
of the introduced GDD.
While fused silica shows some absorption in this spectral range, CaF2, MgF2 or YAG can
be used to provide negative GDD also simply as plates of different thickness. Figure 4.6
shows the double pass (i.e. round-trip in a linear cavity) GDD introduced by placing such
10 mm thick plates at Brewster’s angle inside the cavity.

4.1 Pulse shaping effects
57
1900 1950 2000 2050 2100-2500
-2000
-1500
-1000
-500
0
MgF2
YAG
Fused Silica
GD
D [
fs2]
Wavelength [nm]
CaF2
Fig. 4.6 Round-trip GDD introduced by placing a 10-mm thick plate inside the cavity.
The wavelength dependence in Figs. 4.5 and 4.6 is indicative of the TOD because TOD is
the 1st derivative of the GVD. It shall be taken into account for extremely short pulses.
Fig. 4.7 Schematic drawing of a chirped mirror.
1900 2000 2100 2200-250
-200
-150
-100
-50
0
|GDD-R(0°1925-2175 nm)| ~ 125 ± 20 fs2
GD
D [
fs2]
Wavelength [nm]
0°
15° s-Pol
15° p-Pol
Fig. 4.8 GDD of a chirped mirror for 2 µm SSLs (data from Layertec GmbH).
So-called chirped mirrors present another option for broadband GVD compensation with
low insertion losses [97]. The principle can be understood from Fig. 4.7: By appropriate
design of the Bragg mirror, longer wavelengths are reflected deeper in the mirror structure
and follow a longer optical path which leads to negative GVD and GDD.
Chirped Mirror
Substrate

Chapter 4 Fundamentals of passive mode-locking
58
However, the straightforward implementation of this idea leads to strong oscillations of
the GDD (as a function of frequency or wavelength) known as dispersion ripples. These
oscillations can be greatly reduced by numerical optimization which results in complex
deviations from the simple chirped design. Figure 4.8 shows typical characteristics of such a
chirped mirror applied in the experimental part in 2 μm mode-locked SSLs.
The dispersion ripples in Fig. 4.8 are within ±15 % of the average specified negative
GDD. However, Fig. 4.8 represents theoretical curves provided by the supplier because
characterization of such mirrors after their fabrication was impossible for them, in contrast to
similar products designed for operation at shorter wavelengths.
It shall be emphasized that chirped mirrors, similar to Brewster plates, can modify the
GDD only in discrete steps, in contrast to the prism pairs which enable continuous adjustment.
4.1.3 Self-phase modulation (SPM)
The optical Kerr effect (also known as AC Kerr effect) shows an extremely rapid response
because it is due to a non-resonant process and no electronic transitions take place. On the
time scales considered in the present work it can be thought of being instantaneous (< 1 fs)
and its dispersion across the optical spectrum of the laser pulse can be ignored. The electric
polarization P as a function of the electric field E can be expanded in a Taylor series [8],
𝐏 = 휀0(𝜒(1)𝐄 + 𝜒(2)𝐄𝐄 + 𝜒(3)𝐄𝐄𝐄 + ⋯ ).
Taking only the linear and 3rd
order terms in this expansion (e.g. for centrosymmetric
media where the 2nd
order terms are vanishing), the refractive index can be expressed as
intensity I dependent [8],
𝑛(𝐼) = 𝑛(0) +3𝜒(3)
8𝑛(0)|𝐄|𝟐 = 𝑛 + 𝑛2𝐼 ,
where 𝑛2 denotes the nonlinear refractive index and n=n(0)..
Through this intensity dependence, the refractive index may vary both in space and in
time. The spatial variation leads to self-focusing (Kerr lens) because for all materials n2 is
positive. The temporal variation leads to the so-called Self-Phase Modulation (SPM). After a
propagation length L in a medium, SPM introduces a time-dependent phase shift to the pulse,
Δ𝜑(𝑡) = 2𝜋𝑛2
𝐿
𝜆0𝐼(𝑡) =
𝜔0
𝑐𝑛2𝐿𝐼(𝑡) ,
where 𝜆0 and 𝜔0 denote the center wavelength and frequency. This time-dependent phase
shift then leads to frequency modulation or chirping of the propagating pulse,
Δ𝜔(𝑡) =𝜕
𝜕𝑡Δ𝜑(𝑡) =
𝜔0
𝑐𝑛2𝐿
𝜕𝐼(𝑡)
𝜕𝑡 .
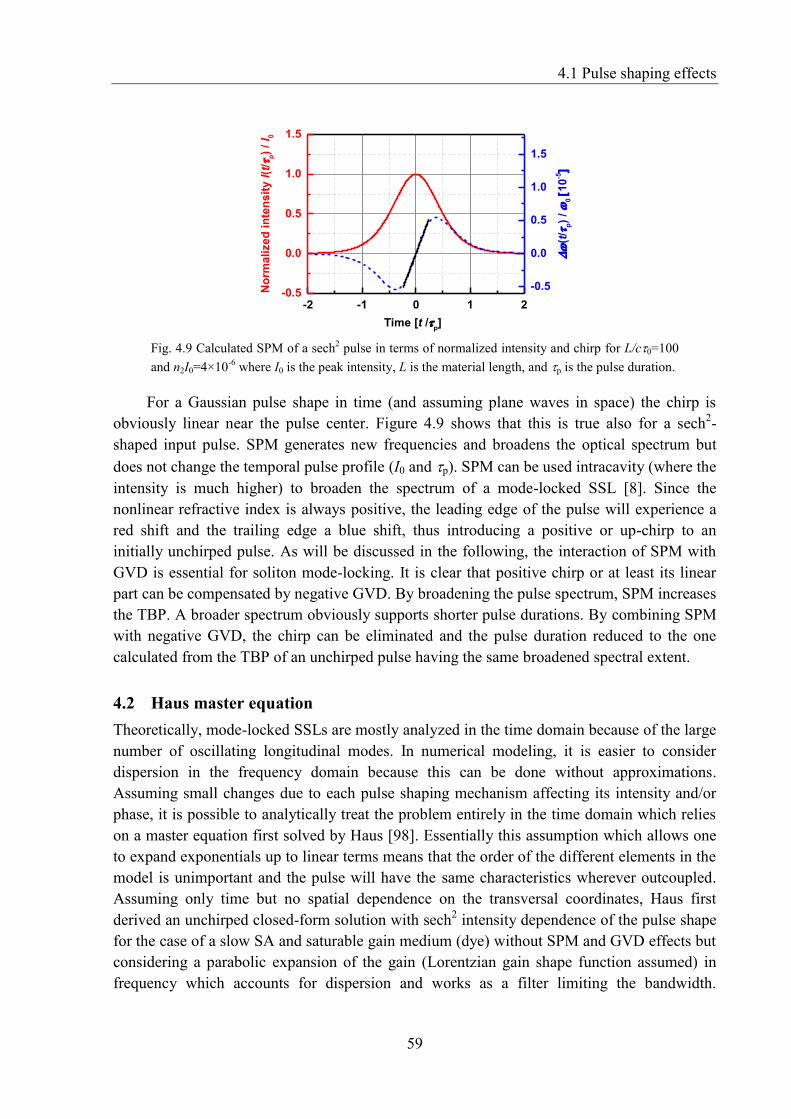
4.1 Pulse shaping effects
59
-2 -1 0 1 2-0.5
0.0
0.5
1.0
1.5
Time [t /p]
No
rmali
zed
in
ten
sit
y I
(t/
p)
/ I 0
-0.5
0.0
0.5
1.0
1.5
(t/
p)
/
0[
10
-5]
Fig. 4.9 Calculated SPM of a sech2 pulse in terms of normalized intensity and chirp for L/c0=100
and n2I0=4×10⁻⁶
where I0 is the peak intensity, L is the material length, and pis the pulse duration.
For a Gaussian pulse shape in time (and assuming plane waves in space) the chirp is
obviously linear near the pulse center. Figure 4.9 shows that this is true also for a sech2-
shaped input pulse. SPM generates new frequencies and broadens the optical spectrum but
does not change the temporal pulse profile (I0 and p). SPM can be used intracavity (where the
intensity is much higher) to broaden the spectrum of a mode-locked SSL [8]. Since the
nonlinear refractive index is always positive, the leading edge of the pulse will experience a
red shift and the trailing edge a blue shift, thus introducing a positive or up-chirp to an
initially unchirped pulse. As will be discussed in the following, the interaction of SPM with
GVD is essential for soliton mode-locking. It is clear that positive chirp or at least its linear
part can be compensated by negative GVD. By broadening the pulse spectrum, SPM increases
the TBP. A broader spectrum obviously supports shorter pulse durations. By combining SPM
with negative GVD, the chirp can be eliminated and the pulse duration reduced to the one
calculated from the TBP of an unchirped pulse having the same broadened spectral extent.
4.2 Haus master equation
Theoretically, mode-locked SSLs are mostly analyzed in the time domain because of the large
number of oscillating longitudinal modes. In numerical modeling, it is easier to consider
dispersion in the frequency domain because this can be done without approximations.
Assuming small changes due to each pulse shaping mechanism affecting its intensity and/or
phase, it is possible to analytically treat the problem entirely in the time domain which relies
on a master equation first solved by Haus [98]. Essentially this assumption which allows one
to expand exponentials up to linear terms means that the order of the different elements in the
model is unimportant and the pulse will have the same characteristics wherever outcoupled.
Assuming only time but no spatial dependence on the transversal coordinates, Haus first
derived an unchirped closed-form solution with sech2 intensity dependence of the pulse shape
for the case of a slow SA and saturable gain medium (dye) without SPM and GVD effects but
considering a parabolic expansion of the gain (Lorentzian gain shape function assumed) in
frequency which accounts for dispersion and works as a filter limiting the bandwidth.

Chapter 4 Fundamentals of passive mode-locking
60
Additional assumptions included weak (expandable up to 2nd
order terms) saturation of the
SA and gain medium by the instantaneous pulse fluence. Almost simultaneously, Haus
derived the same pulse shape as a closed-form solution in a similar model of mode-locked
SSLs where the weakly saturated SA is fast (instantaneous) and the gain is not saturated by a
single pulse at all [99]. Following this pioneering work [100], similar analytical approaches
were applied to many different lasers and mode-locking techniques. In particular, the addition
of SPM and GVD was shown to lead to the same intensity profile but the closed-form solution
was chirped with a ln(sech) phase dependence on time [101, 102]. That is why the master
equation is called nowadays also Haus equation: It is also a very useful approach for
numerical treatment of the problem whereby iterating the pulse-shaping effects in many round
trips a steady-state is reached with certain pulse parameters. No ansatz for the pulse shape is
necessary in this case and most of the assumptions stated above can be avoided. Numerical
simulations start normally with some kind of noise assumed. Then the pulse develops from
this noise due to the pulse shaping mechanisms which favor some intensity/energy spike
reaching finally a steady-state after many round trips, cf. Fig. 4.10.
Fig. 4.10 Model of a mode-locked laser explaining the derivation of the Haus master equation.
Blocks indicate different shaping effects acting on the complex pulse envelope A(t).
The principles for calculation of such a steady-state can be summarized as follows:
The pulse that evolves in the cavity after many round trips until a steady-state is
reached, is described as a complex amplitude 𝐴(𝑡) in the time domain.
In the steady-state the pulse reproduces itself after one round trip. In mode-locked
laser theory a steady-state is defined by the intensity and the chirp. In analytical
treatments with the above pulse shape ansatz, the 4 parameters that are derived are the
pulse duration, its maximum intensity, a linear chirp coefficient and the central
frequency (or the frequency offset) because it might deviate from the maximum of the
gain assumed to be Lorentzian in shape.
Two additional parameters are necessary in order to obtain analytically a closed-form
solution. The steady-state pulse may experience a small time shift after one round trip
and also a small constant phase shift. The first effect means that pulse shaping effects
may shift the pulse in time and its propagation velocity is different from the group
velocity as derived for passive optical materials. Experimentally, this generalized
Outputcoupler
GDD SPM Gain ΔAi

4.2 Haus master equation
61
pulse velocity defines the observed pulse repetition rate from the mode-locked laser.
The second effect corresponds to a correction in the phase velocity. Both effects are
necessary to take into account also in numerical simulations in order to obtain a
steady-state but were considered to be largely irrelevant to experimental optimization
of the operating regime. However, more recently, great attention is paid to the carrier-
envelope phase (CEP) stability of such mode-locked SSLs especially when they
generate few-cycle pulse durations. The phase slip observed outside the cavity is
directly related to the phase shift in the Haus model because the pulse train is a result
of the periodic outcoupling of the circulating intracavity pulse in the model each time
it hits the OC.
The changes ∆𝐴𝑖 of the pulse complex envelope 𝐴(𝑡) due to different pulse shaping
mechanisms in the cavity (such as gain, saturable loss or absorption, dispersion, SPM,
non-saturatble loss etc.) must cancel each other with vanishing overall effect on the
pulse intensity and chirp.
Table 4.3 Main linearized operators ∆𝐴𝑖 that define the change of the pulse envelope 𝐴(𝑡) at
resonance [1, 102]. The envelope A(t) is normalized in such a way that │A(t)│2 corresponds to
the instantaneous power P(t) of a plane wave. L is the round trip length of the relevant element.
Laser cavity element Linearized operator Constants
GDD ∆𝐴 ≈ 𝑖𝐷𝜕2
𝜕𝑡2𝐴
𝐷 =𝛽2𝐿
2 : dispersion parameter
(half of the GDD per cavity round trip)
SPM ∆𝐴 ≈ −𝑖𝛿𝐿|𝐴|2𝐴 𝛿𝐿 =
𝑘𝑛2𝐿
𝑆𝐿 : SPM coefficient
𝑆𝐿: laser mode size in the Kerr medium
Gain ∆𝐴 ≈ [𝑔 + 𝐷𝑔
𝜕2
𝜕𝑡2]𝐴
𝐷𝑔 =𝑔
π2Δ𝑔2 : gain dispersion at resonance
𝑔: saturated amplitude gain coefficient
Δ𝑔: gain bandwidth (FWHM)
Non-saturable loss ∆𝐴 ≈ −𝑙𝐴 𝑙: amplitude loss coefficient without the SA
Constant phase shift ∆𝐴 ≈ 𝑖𝜓𝐴 𝜓: phase shift
Fast SA ∆𝐴 ≈ −𝑞0𝐴 + 𝛾𝐴|𝐴|2𝐴
𝛾𝐴 =𝑞0
𝐼𝑠𝑎𝑡𝑆𝐴 : SA coefficient
𝑞0: maximum saturable amplitude loss
Isat: saturation intensity of the fast SA
SA: laser mode size in the SA
Slow SA ∆𝐴 = −𝑞0 (1 − 𝜖 +𝜖2
2) 𝐴
𝜖(𝑡) = ∫ |𝐴(𝑡′)|2𝑡
−∞
𝑑𝑡′ 𝑆𝐴𝐹𝑠𝑎𝑡⁄
𝑞0: maximum saturable amplitude loss
Fsat: saturation fluence of the slow SA
SA: laser mode size in the SA
Table 4.3 summarizes the most important pulse shaping effects in passively mode-locked
lasers and their linearized operators (i.e. assuming small changes).

Chapter 4 Fundamentals of passive mode-locking
62
4.3 Passive mode-locking mechanisms
One distinguishes three main passive mode-locking mechanisms according to the relaxation
time of the saturable loss or SA and the gain medium, see Fig. 4.11 [1].
Fig. 4.11 Different mechanisms for passive mode-locking: (a) slow SA with gain saturation of the
active medium, (b) fast SA and (c) slow SA mode-locking without gain saturation (after [1]).
Slow SA mode-locking with instantaneous gain saturation: Found only in color center
SSLs. The SA is shaping (shortening) the leading edge of the pulse whereas depletion
of the gain leads to negative gain (due to the remaining non-saturable losses) for the
trailing edge which is also shortened. The resulting net positive gain window supports
sub-100-fs pulse fomation, much shorter than the characteristic (ns) time constants of
the SA and the gain medium. Noise outside the pulse is suppressed by negative gain.
Fast SA mode-locking with non-saturable gain: The net positive gain window is
formed solely by the SA whose saturation is intensity dependent. KLM is very close to
an ideal fast SA due to the extremely rapid response of the AC Kerr effect.
Slow SA mode-locking with non-saturable gain: Although there is no obvious shaping
effect for the trailing edge, the SA delays the pulse in time thus “swallowing” any
noise growing behind at the trailing edge. Only slow SAs and saturable gain media
(the latter accelerate) have this property to modify the pulse velocity (1st order time
derivatives in the master equation) because saturation is fluence dependent in this case
4.4 Solitons
Under solitons one understands highly localized pulses traveling at a constant speed without
changing their shape. Real optical solitons only exist for propagation in fibers where all the
pulse shaping effects are distributed and occur simultaneously. In bulk lasers, e.g. SPM and
GVD are due to different discrete elements and occur separately (i.e. in the laser active
medium and in the prism pair) with the pulse shaping effects balanced only within a complete
round trip. The pulse reproduces itself after every round trip but its parameters in different
positions inside the cavity are slightly different. The term used for such pulse formation when
it is dominated by the SPM and GVM effects is soliton-like mode-locking. It should be
(a) Time
Pulse
Gain
Loss
(b) Time
Pulse
Gain
Loss
(c) Time
Pulse
Gain
Loss

4.4 Solitons
63
outlined that numerically, the ultrashort pulse propagation and the mode-locked laser
modeling are treated in the same manner because the split-step method applied for pulse
propagation separates all the shaping effects and different thin slices of the medium are
considered that present only one of them, each slice introducing only small modifications to
the pulse. Thus the analogy is well substantiated.
With the expressions from Table 4.3 (fast SA assumed), the Haus master equation reads:
∑ ∆𝐴𝑖
𝑖
= {𝑖 [𝐷𝜕2
𝜕𝑡2− 𝛿𝐿|𝐴(𝑡)|2] + [𝑔 − 𝑙 − 𝑞0 + 𝐷𝑔
𝜕2
𝜕𝑡2+ 𝛾𝐴|𝐴(𝑡)|2]} 𝐴(𝑡) = 0,
which is known as the generalized Ginzburg-Landau equation. The time coordinate is in a
frame moving with the pulse. For simplicity, 1st order derivative terms responsible for the
time shift of the pulse (the actual pulse propagation velocity) and the phase shift term
responsible for the actual phase velocity are omitted. The saturation of the fast SA in the
above equation is weak (i.e. only terms linear in intensity are included) and this allows one to
find analytical solutions. A slow SA is treated in a similar way and an assumption of weak
saturation (up to quadratic terms in fluence, cf. Table 4.3) enables again an analytic treatment.
In the absence of gain and loss, the above equation reduces to the nonlinear Schrödinger
equation (the terms in the first square brackets) which has been widely studied in soliton
theory. For negative GVD (𝐷 < 0) and positive SPM (𝑛2 > 0) the well-known fundamental
soliton solution is found by perturbation theory [8] (this theory predicts also “higher” order
non-stationary solitons whose more complex shape is reproduced periodically) which reads:
𝐴(𝑡) = 𝐴0 sech (𝑡
𝜏) 𝑒−𝑖𝜓𝑠(𝑧)
Such a pulse propagates without distortion in a medium with the above two properties
and only its phase changes along the propagation coordinate z in accordance with 𝜓𝑠(𝑧). The
soliton pulse duration in terms of FWHM intensity is 𝜏p = 1.763𝜏 (2arcosh(√2) ≈ 1.763).
The spectral intensity of such an unchirped pulse has the same sech2 profile with a FWHM =
1.763/() [103]. From these expressions one obtains the previously mentioned TBP = 0.315.
For given GVD and SPM coefficients, the pulse energy 𝜖p and the pulse duration of the
fundamental soliton obey the so called “area theorem” [100].
𝜏p = 1.7632|D|
𝛿L𝜖p ,
which can be easily obtained by integration of the intensity over time. This relationship is
very useful for identification of soliton-like regimes in mode-locked lasers because it predicts
reduction of the pulse duration inversely proportional to the average output power which can
be increased e.g. by the pump power. It shall be repeated here that by “solitons”, one means
the fundamental solution to the nonlinear Schrödinger equation which can be easily confirmed

Chapter 4 Fundamentals of passive mode-locking
64
by simple substitution with the above defined pulse shape. However, solutions to the
Ginzburg-Landau equation are also called solitons in a more general sense.
Ultrashort laser pulses are often characterized by intensity autocorrelations [1]. While the
autocorrelation function of a Gaussian pulse is also Gaussian with a FWHM increased by a
factor of √2, for sech2-shaped pulses the fit of the autocorrelation (AC) functions shall be
performed with a more complex expression derived in [103]:
𝐺2(𝜏) =3(𝜏 ∙ cosh(𝜏) − sinh (𝜏))
sinh3 (𝜏)
From the fit, the pulse width can be derived and from it - the FWHM intensity p.
4.5 Mode-locking stability
There exist two essential limits for the mode-locking stability in SSLs, the transition to Q-
switched mode-locking (QSML) at powers lower than the threshold for stable steady-state
operation and soliton break-up above the limits of the CWML regime. In the following, these
two phenomena as well as the stability criteria will be briefly discussed.
4.5.1 Q-switched mode-locking (QSML) instabilities
When a CW laser is disturbed during operation, e.g. by fluctuations of the pump power, its
output power does not immediately return to its steady-state. Instead, a number of spikes
called relaxation oscillations are emitted before the CW steady-state is reached again. This is
typical for SSLs with their lifetimes which are much longer than the cavity lifetime (the
damping time in which the radiation accumulated is dissipated in the absence of further
pumping due to the outcoupling and parasitic losses). This situation may occur also in a
passively mode-locked SSL because the SA favors higher energies which increase the cavity
Q-factor. This tendency to Q-switching is called then Q-switching instability.
0 4 8 12 16 200 4 8 12 16 20
CWML
Inte
nsit
y [
a.u
.]
Time [multiples of round trip time]
(a) QSML(b)
Fig. 4.12 Schematic trace of stable CWML (a) and a mode-locked laser exhibiting large Q-
switching instabilities (QSML with 100% modulation) (b). The average laser power is the same.

4.5 Mode-locking stability
65
Saturation of the gain could provide a stabilizing feedback but as already mentioned the
gain is not saturated by a single ultrashort pulse in Ln3+
SSLs. Figure 4.12 illustrates the
QSML regime in comparison with true CWML. As shown in Fig. 4.12b, while the ultrashort
pulse train follows at a repetition rate around 100 MHz, Q-switching leads to an additional
intensity modulation with frequency typically in the kHz range. Such a modulation is
normally unwanted because all other pulse characteristics vary within the Q-switched
envelope of the train and the high peak intensity may lead to damage to the SA. However, for
certain applications (e.g. material processing) QSML with 100% modulation as the one shown
in Fig. 4.12b may be useful, at least in the picosecond regime. Note that this figure illustrates
a stable regime (QSML) when a bunch of ultrashort pulses (a macro-pulse) is emitted at low
repetition rate as in a steady-state Q-switched laser. In most cases, however, Q-switching
instabilities lead to noisy behavior and such “stable” macro-pulses cannot be seen with fast a
photodiode and an oscilloscope.
For SSLs operating in the picosecond regime, a simple stability criterion in terms of
intracavity pulse energy 𝜖p has been derived for stable CWML without Q-switching
instabilities [104]:
𝜖p2 > 𝜖p,c
2 = 𝜖sat,L𝜖sat,A∆𝑅 ,
where 𝜖p,c is the critical (minimum) intracavity pulse energy required for stable CWML.
𝜖sat,L = 𝑆eff,L𝐹sat,L is the saturation energy of the gain medium, i.e. the energy that
depletes the gain to 1/e of its low signal value. To prevent the laser from QSML, the effective
mode area 𝑆eff,L in the gain medium should be as small as possible. However, this mode area
should be also matching the pump size to achieve high efficiency and the overlap should
ensure that higher-order transverse modes are suppressed. The saturation fluence of the laser
medium 𝐹sat,L = ℎ𝜈/2𝜎𝑔 (the factor 2 accounts for 2 passes per round trip in a linear cavity)
is inversely proportional to the gain cross section σg, i.e. materials with higher gain show
weaker tendency for QSML [104]. It shall be outlined that contrary to the general reasoning,
the upper-state lifetime of the active medium is not directly involved in the criterion for
stability against QSML [104].
Both the saturation energy 𝜖sat,A and the modulation depth ∆𝑅 of the SA enter the
criterion for stable CWML. Reducing both of them will improve the stability. By focusing the
beam tighter onto the SA, the effective mode area 𝑆eff,A can be reduced and thus 𝜖sat,A =
𝑆eff,A𝐹sat,A will be lower. However, at higher powers this may not only lead to optical damage
but also will require a trade-off with the pulse break-up tendency. On the other hand, reducing
the modulation depth ∆𝑅 will lead to a longer steady-state pulse duration and weaker self-
starting tendency for CWML operation [105, 106].
In the femtosecond regime, the tendency towards QSML is significantly reduced [104].
As the energy of a pulse grows slightly, SPM and/or any pulse shortening effect will broaden
the pulse spectrum. A broader spectrum reduces the effective gain and provides a negative

Chapter 4 Fundamentals of passive mode-locking
66
feedback thus relaxing the criterion for stable CWML which in its modified version reads
[104]
𝜖sat,L2𝑔𝐾2𝜖p3 + 𝜖p
2 > 𝜖sat,L𝜖sat,A∆𝑅 ,
with
𝐾 =0.315
1.763
4𝜋𝑛2𝐿𝐿
𝐷𝑆eff,L𝜆0Δ𝑔 ,
Here 𝐿𝐿 and 𝑆eff,L are the single-pass length and the effective area in the Kerr medium
assumed here to coincide with the active medium and the other parameters were defined in
Table 4.3.
102.0 102.2 102.4 102.6 102.8 103.0
-100
-80
-60
-40
-20
0
81.95 82.00 82.05 82.10 82.15 82.20 82.25
-100
-80
-60
-40Span = 1 MHz
RBW = 300 Hz(b)
Frequency [MHz]
RF
po
wer
den
sit
y [
dB
m]
Span = 300 kHz
RBW = 300 Hz(a)
RF
po
wer
den
sit
y [
dB
m]
Frequency [MHz]
Fig. 4.13 RF spectra of the first beat note for typical QSML of the Ho:YAG laser studied in this
work: (a) strong Q-switching instability with strong side bands and (b) weak Q-switching
instability with weak side bands. Such regimes were obtained by misalignment of the cavity (cf.
Chapter 5).
QSML in bulk SSLs leads to characteristic radio-frequency (RF) spectra with side bands
of the fundamental beat note or modulation with periods of several tens of kHz. Such RF
spectra present a powerful tool to measure different kinds of noise and fluctuations in mode-
locked lasers [107]. As an example, Fig. 4.13 shows RF spectra recorded in the QSML regime
of the Ho:YAG ceramic laser studied in Chapter 5. Apart from the fundamental repetition rate
beat note at 82.1 MHz, one can clearly see in Fig. 4.13a additional bands with a separation of
27 kHz. A weak Q-switched instability leading to modulation of the CW pulse train results in
RF spectra as the one shown in Fig. 4.13b.
4.5.2 Soliton break-up
As the steady-state pulse energy of a mode-locked SSL grows (e.g., by increasing the pump
power) it might happen that the slow SA is completely saturated and cannot further stabilize a
single soliton-like pulse. High order solitons accommodating more energy exist as solutions

4.5 Mode-locking stability
67
to the nonlinear Schrödinger equation but they are not steady-state and reproduce their shape
(in a laser) only after a certain number of round trips corresponding to their period. Such
solitons have been indeed observed by sampling the output at the soliton period to record the
corresponding AC trace [108].
The high order solitons under certain conditions may break up into two fundamental
solitons with lower energy and longer duration (according to the area theorem). Such a double
pulse sequence will prevail thanks to better stability against noise. Decreasing the magnitude
of the introduced negative GDD will also lead to a formation of high order soliton since the
pulse duration decreases and at a certain point the gain cannot support the broadened
spectrum. This finally leads to the break-up into two pulses with longer duration.
Normally the excess energy is carried by two or more pulses with a separation
comparable to the cavity round-trip time. Achieving a so-called harmonic mode-locking
(operation at multiple of the repetition rate as known from active mode-locking [109]) is
interesting for increasing the repetition rate. Many observations of this kind can be found in
the literature but in passively mode-locked SSLs the spacing between the pulses is irregular
and subject to spontaneous changes [110]. An interesting steady-state femtosecond regime
was described in [111] for a SESAM mode-locked Ti:sapphire laser with an intracavity
spectral filter, in which the pulses were very close to each other (separation comparable to the
pulse length). This study was performed by changing the GDD and monitoring the output
energy and duration of the single and double pulses. The soliton break-up observed could not
be explained in the framework of the nonlinear Schrödinger equation because the pulse
broadening of the double pulses was less than the predictions. The explanation presented was
based on the combined effects of saturable absorption, spectral filter, and soliton-soliton
interaction as known from the nonlinear Schrödinger equation.
For two pulses with exactly the same amplitude and phase (no phase difference), periodic
collapse occurs as a result of the soliton interaction [111]. However, when the pulses get
closer (separation less than ~ 5 times the SA recovery time), the second pulse will reach the
SA when it is still partly bleached and will experience less loss, which will lead to slightly
different amplitudes of the two pulses [111]. A phase difference between the two pulses will
relocate the spectral distribution of the pulse energy and in the presence of a gain filter effect
this can provide another feedback mechanism. It turns out that stable pulse pairs exist with
small separation if the relative phase is such that attractive and repulsive forces average out.
These are generalized fundamental solitons, however, which obey the generalized Ginzburg-
Landau equation.
Apart from the AC function, such soliton bound-states can be recognized from their
characteristic optical spectra. The superposition of the two coherent pulses with a temporal
separation T, and phase difference 𝜙 will form an interference pattern in the spectral domain.
Let the amplitude of the two pulses be approximately equal and the envelope A(t) is
normalized in such a way that │A(t)│2 gives the intensity I(t) of each of them, as in Table 4.3.
If the second pulse is shifted in time by T and exhibits a phase difference of , the Fourier
transform of the doublet will be given by:

Chapter 4 Fundamentals of passive mode-locking
68
𝐴𝐷(𝛺) = ℱ[𝐴(𝑡) + 𝐴(𝑡 + 𝑇)𝑒𝑖𝜙] = 𝐴(𝛺) + 𝑒𝑖(𝑇𝛺+𝜙)𝐴(𝛺) = (1 + 𝑒𝑖(𝑇𝛺+𝜙))𝐴(𝛺),
where 𝐴(𝛺) = ℱ[𝐴(𝑡)]. Since the fast oscillating terms are separated and the slowly varying
envelope function A(t) is considered here, the relative frequency = -0 appears as an
argument where 0 is the center (carrier) frequency of the field. The spectral intensity 𝐼𝐷(𝛺)
of the doublet is then:
𝐼𝐷(𝛺) = 𝐴𝐷(𝛺)𝐴𝐷(𝛺)∗ = 2[1 + cos(𝑇𝛺 + 𝜙)]𝐼(𝛺),
Without time or phase shift (T=0, =0) the two amplitudes simply add resulting in 4-fold
increase of the intensity. In the general case, however, the spectral intensity corresponding to
a single pulse 𝐼(𝛺) is modulated at a frequency 𝛺𝑚𝑜𝑑 = 1/𝑇 . Figure 4.14 shows the
calculated spectrum of such a pulse doublet with a zero phase difference.
-400 -200 0 200 400 130 140 150 160 170
(a) I(t)
Inte
nsit
y [
a.u
.]
Time t [fs]
(b) I()
Sp
ectr
al
inte
nsit
y [
a.u
.]
Frequency v [THz]
double pulse
single pulse
Fig. 4.14 A doublet of closely spaced ultrashort pulses of equal amplitude and phase (a) and its
spectrum (b). The pulse duration (FWHM) is p = 50 fs assuming sech2-shape and the separation
amounts to 400 fs. The carrier frequency corresponds to 0 = 2 μm (150 THz). For comparison, the
single pulse spectrum is also shown by a dashed line in (b).
The modulation period measured in nanometers will be Δ𝜆𝑚𝑜𝑑 ≈ 𝜆02/𝑐𝑇 where 𝜆0 =
2𝜋/𝜔0.
As will be seen in Chapter 5, such stable bound states have been observed for the first
time in the present work for a mode-locked Ln3+
SSL without any spectral filter.

69
Chapter 5
Passively mode-locked 2-µm lasers:
experimental results
The first mode-locking of a 2 µm laser (Ho:YAG) was realized in 1981 by an acousto-optic
modulator (active mode-locking) [112], however, this was a Xe flash lamp pumped laser
operating at liquid N2 temperature only in pulsed mode (up to 5 Hz). Mode-locking was
obtained both in free-running and Q-switched modes and pulse durations of p = 0.57 ns were
measured in the latter case. The first room temperature steady-state mode-locking (again by
acousto-optic modulator) was achieved in 1991 with Cr,Tm:YAG and Cr,Tm,Ho:YAG
crystals pumped by a Kr-ion laser (the Cr co-doping served as a sensitizer) [113] and with
Tm:YAG pumped by a Ti:sapphire laser [114]. The Cr,Tm:YAG laser generated pulses as
short as 45 ps at 2.013-2.025 µm for an average output power Pout = 160 mW at
~ 123 MHz [113] and the Tm:YAG laser generated pulses of p = 35 ps at 2.01 µm for Pout =
70 mW at 300 MHz [114]. The pulse duration from the Cr,Tm,Ho:YAG laser was 800 ps for
Pout = 60 mW at ~ 123 MHz, however, the operation of this laser was unstable [113].
Only few years later, another milestone was accomplished with the first sub-ps operation
demonstrated with a Tm-fiber laser passively mode-locked by nonlinear polarization rotation
[115]. This laser operated in the soliton regime, producing pulse durations of p ~ 350-500 fs
at ~ 1.8-1.9 µm. with Pout of only 320 µW at ~ 17.5 MHz. In the following years, great
progress was achieved with such Tm-fiber lasers (later on also with Er- and Ho-co-doping or
Raman frequency conversion for extended spectral coverage). More recently, their output
characteristics have been greatly improved both in terms of pulse duration (e.g.p = 45 fs
pulses with Pout = 13 mW at 67.5 MHz, after external prism pair compression [116]), and Pout
(2.5 W at the same repetition rate, with a CW pumped Tm-fiber amplifier for p = 48 fs [117]).
Notwithstanding these impressive results, fiber lasers tend to be more limited for certain
applications such as the generation of frequency combs and carrier-envelope phase (CEP)
stabilization as few-cycle seed sources for further (laser or parametric) amplification because
of excess noise which arises from spontaneous emission, the low cavity quality factor, and
large intracavity nonlinearities [118], as well as because of the structured spectral shape [115,
116]. These limitations stimulate the research on bulk mode-locked lasers as an alternative
solution.
In 2009, the first passive CWML of a bulk 2-µm Ln3+
laser was demonstrated employing
the monoclinic Tm:KLuW crystal with a transmission-type SWCNT-SA [80]. Stable and self-
starting operation with p = 9.7 ps was obtained at 1.944 µm for Pout reaching 240 mW at
126 MHz. This result triggered extensive research by other groups employing different host
materials and SAs. With a GaSb-based SESAM and the disordered tetragonal crystal

Chapter 5 Passively mode-locked 2-µm lasers: experimental results
70
Tm,Ho:NaY(WO4)2, sub-ps operation could be demonstrated [119]. Pumped by a Ti:sapphire
laser, this mode-locked Tm laser produced transform-limited pulsed withp = 570 fs at
2.055 µm for Pout = 130 mW at 118 MHz. With the same type of SA and different hosts
~ 200 fs pulses were generated at ~ 2.06-2.1 µm employing again Tm,Ho:NaY(WO4)2 [120]
and some sesquioxide-based hosts (Tm:Sc2O3 crystal [121] and Tm:Lu2O3 ceramic [122]).
The investigation of carbon nanostructures as SAs continued, demonstrating pulse durations
of 354 fs at 2.01 µm using a reflection-type graphene-SA with Tm:CLNGG (disordered
garnet) as a gain medium [62]. Employing a transmission-type SWCNT-SA resulted in the
shortest pulses so far: p = 175 fs with Tm:Lu2O3 [123] and p = 141 fs with Tm:KLuW [124].
This chapter summarizes the main experimental results achieved in the present work on
passive mode-locking of bulk Tm and Ho lasers near 2 µm. First, the laser cavity used is
described including some general aspects common for all experiments. The CWML laser
results cover three garnet ceramics (Tm:YAG, Tm:LuAG and Ho:YAG) which operated in
the picosecond regime with GaSb-based SESAMs, the uniaxial Tm:CALGO crystal which
generated shorter pulses reaching sub-ps duration with the same SESAMs, and finally a more
comprehensive and systematic study of the monoclinic Tm:MgW crystal applying different
SAs (SESAMa, SWCNTs, and graphene) and intracavity GVD compensation techniques,
which led to the generation of the shortest, sub-100 fs pulses by a bulk mode-locked laser near
2 μm.
5.1 Experimental set-up
For efficient operation of a long cavity laser with longitudinal pumping, a beam waist shall be
formed in the active medium and the cavity design should ensure good mode matching with
the focused pump beam over the Rayleigh range. Usually the pump mode size is slightly
smaller than the laser mode size in order to stabilize the laser against higher transversal modes
which, having slightly different eigen-frequencies, tend to deteriorate the mode-locking. In
this case, as briefly mentioned in Chapter 4, the Kerr lens effect may act spatially as a pinhole.
In the presence of such self-focusing and also due to the thermal lensing effect in the active
medium (e.g. heat released as a result of non-radiative relaxation), in a real laser the mode
size differs from the one calculated by the standard ABCD matrix formalism.
A cavity focus is created most often by employing two concave folding mirrors (M1 and
M2 in Fig. 5.1) in X- or Z-shaped cavities [125]. For short (few mm) crystal lengths as
typically used, there is no need to manufacture Brewster rhombs and the active element is
simply a plate inclined under Brewster’s angle for the corresponding polarization. Such a
plate introduces astigmatism which can be compensated in the beam waist by the incidence
angle on the two concave folding mirrors. In the experiments described in this chapter these
two folding mirrors had a Radius of Curvature (RoC) of −100 mm. As shown in the example
in Fig. 5.2c, the calculated beam waist in the gain medium with such mirrors, depending on
the exact separations, can be of the order of ~ 30 μm (S) ⨉ 60 μm (T), where S and T denote
the sagittal and tangential planes, respectively.

5.1 Experimental set-up
71
The benefit of such a symmetric X- or Z-shaped cavity is that it can be easily extended
for dispersion compensation, SA or other elements in the two arms and still have a single
output. In the X-type cavity employed in the present work (Fig. 5.1), the right arm (M2 to the
end mirror) can be adapted for different SAs, i.e. reflection- or transmission-type SAs, while
the left arm (M1 to the output coupler, OC) can be used for dispersion compensation or
wavelength tuning purposes.
Fig. 5.1 Scheme of the cavity designed for different mode-locked 2 µm lasers: Black boxes
represent alternative intracavity GVD compensation or tuning elements and blue boxes - different
SAs. The optional Lyot filter inserted under Brewster’s angle is a standard low-loss cavity element
applied for wavelength tuning in CW lasers whose operation is based on birefringence [126].

Chapter 5 Passively mode-locked 2-µm lasers: experimental results
72
Fig. 5.2 Equivalent cavity scheme (a) and calculated beam sizes for the specific configuration of
the mode-locked Tm:MgW laser (b), zoomed near the two beam waists, (c) and (d). The RoC of
M3 and M4 is -150 and -50 mm, respectively, and the distances shown (abscissa) are measured
from the OC.
Table 5.1 Mode-locked 2 µm lasers studied and their most important parameters: PP / CM
represent prism pair / chirped mirrors for intracavity GVD compensation. S / T represent
sagittal / tangential plane for the transmission-type SAs under Brewster’s angle.
Host
Doping
concentration
[at. %]
Pump
source λP [nm] SA
RoC
M3/M4
[mm]
Beam radius
on SA [μm] GVD
Tm:YAG 4 / 10 Ti:sapphire 785 SESAM −100/NA 70 PP
Tm:LuAG 4 Ti:sapphire 787 SESAM −150/NA 100 PP
Ho:YAG 1 Tm:fiber 1908 SESAM −100/NA 70 −
Tm:CALGO 6 Ti:sapphire 798 SESAM −100/NA 70 PP
Tm:MgW 0.89 Ti:sapphire 796
SESAM −100/NA 70 Plate
SWCNT −150/−50 60(S)/80(T) PP / CM
Graphene −150/−50 57(S)/79(T) CM

5.1 Experimental set-up
73
Some important cavity parameters are listed in Table 5.1. All samples used were
uncoated and inclined under Brewster’s angle. The main pump source applied in this work
was a tunable narrowband (~ 1 nm) Ti:sapphire laser (modified CW Tsunami, Spectra-
Physics) which delivered maximum output power up to ~ 3 W in the fundamental mode. The
pump laser was tuned to match the absorption maximum of the different laser materials as
indicated in Table 5.1 (cf. Chapter 2). In the study of Ho:YAG ceramics, a commercial
Tm:fiber laser (IPG Photonics) was employed with an output power up to 5.2 W in the
fundamental mode and a linewidth of 0.3 nm. In all cases the pump beam was focused by an
f = 70 mm lens (L in Fig. 5.1).
The second beam waist required to increase the fluence on the SA, cf. Chapter 4, is
created by the curved folding mirror M3 (for reflection-type SAs which act as a plane end
mirror) and by M3 and an additional curved end mirror M4 (Fig. 5.1) for transmission-type
SAs which were also mounted under Brewster’s angle. Mirrors with different RoC were
available for optimization. The 3rd
cavity waist occurs on the OC, see Fig. 5.2b.
Table 5.2 Laser characteristics and diagnostics equipment used.
Characterized parameter Equipment
Average output power Pout Power meter (TPM-300, Gentec)
Optical spectrum Spectrum analyzer (waveScan, extended IR, APE GmbH)
RF spectrum Fast InGaAs PIN photodiode (ET-50000, EOT Inc);
Spectrum analyzer (R&S FSP7, Rohde & Schwarz).
Pulse duration Autocorrelator (pulseCheck, APE GmbH);
Home-made FROG
The mode-locked 2 µm lasers were characterized in terms of average output power Pout,
optical spectrum, RF spectrum and pulse duration p (FWHM intensity). The equipment used
is listed in Table 5.2. For sub-100 fs pulse durations, also a home-made Frequency Resolved
Optical Gating (FROG) apparatus was applied, with a commercial Si-detector spectrometer
(Ocean Optics USB4000).
5.2 Mode-locking of garnet ceramics
The basic features and advantages of laser ceramics as active media were outlined in
Chapter 2 where also the spectroscopic characterization performed was presented. In the
present work, three garnet ceramics were studied for the first time in mode-locked lasers for
the generation of ultrashort pulses near 2 µm.
5.2.1 Tm:YAG ceramics
As discussed before, crystalline Tm:YAG lasers were one of the first 2 µm lasers to be mode-
locked in the steady-state in 1991. Prior to this work passively mode-locked Tm:YAG

Chapter 5 Passively mode-locked 2-µm lasers: experimental results
74
crystalline lasers had not been reported at all and Tm:YAG ceramics had never been
employed in mode-locked lasers.
Two transparent YAG ceramics, doped with 4 and 10 at. % Tm3+
, were available for the
present laser experiments. These ceramics were fabricated by solid-state reactive sintering of
commercial α-Al2O3, Y2O3 and Tm2O3 powders using MgO powder and tetraethoxysilane
(TEOS) to favor the sintering process, all with purity better than 99.99% [127]. Both ceramic
active elements had a thickness of 3.2 mm and an aperture of 3.2×3.2 mm2. For cooling, the
ceramics were mounted in a Cu holder and wrapped in Indium foil to ensure good thermal
contact with all the four lateral faces. The holder was cooled with water at 20°C. The
Ti:sapphire laser pump beam was focused through the dichroic mirror M1 which was highly
transmitting at this wavelength. In a single pump pass, the 4 and 10 at. % Tm:YAG ceramics
absorbed about 75% and 95% of the incident pump light, respectively, which agrees rather
well with the calculated values using the cross-section data in Chapter 2 (77% and 97%,
respectively) and no saturation of the absorption by the pump was observed.
OCs with transmission in the 0.5%-3.0% range at the laser wavelength were used in this
experiment. The cavity scheme applied contained a prism pair for GDD compensation and a
GaSb-based SESAM as a SA (cf. Table 5.1). The two CaF2 Brewster prisms inserted
produced a round-trip GDD between -500 and -3000 fs2, depending on their separation. The
negative GDD turned out to be essential for stabilizing the CWML. However, no significant
variation of the pulse duration was observed in dependence on the GDD in the ps regime.
The known characteristics of the available GaSb-SESAMs were summarized in Table 3.1.
Self-starting mode-locking was achieved with SESAMs No.2, No.3 and No.4 for both
ceramic samples. For SESAM No.1, a strong tendency of QSML was observed leading to
damage of the SESAM. This can be attributed to the expected higher modulation depth ∆𝑅
with the 3-QW design, as discussed in Chapter 4. The laser characteristics in the CWML
regime are summarized in Table 5.3. In all cases the output spectrum was centered near
2.01 µm. With a prism separation of ~ 15 cm the repetition rate of the laser was ~ 99 MHz.
Table 5.3 Comparison of the mode-locked Tm:YAG ceramic laser performance with different
GaSb-SESAMs and 3.0% OC. corresponds to the FWHM and Pout denotes the average output
power.
SESAM
4 at. % Tm 10 at. % Tm
τp
[ps]
Δλ
[nm] TBP
Pout
[mW]
τp
[ps]
Δλ
[nm] TBP
Pout
[mW]
No.1 NA, damage occurs
No.2 3.2 2.17 0.514 140 3.3 2.52 0.616 62
No.3 3.0 2.56 0.569 135 3.3 2.55 0.623 39
No.4 3.0 2.2 0.489 105 3.6 2.04 0.544 57
In general, the performance in terms of pulse duration was similar for SESAMs No.2,
No.3 and No.4. The difference in output power is presumably due to the non-saturable losses

5.2 Mode-locking of garnet ceramics
75
∆𝑅ns, unfortunately not precisely known for the SESAMs used. The two different ceramic
samples produced similar laser characteristics such as wavelength, duration, bandwidth, and
TBP; only Pout was lower for the higher doping, by a factor of ~ 2. The latter is most likely
related to the increased reabsorption. However, the wavelength shifted by only 1 nm for the
increased doping, from 2.011 to 2.012 µm.
-15 -10 -5 0 5 10 15 200.0
0.2
0.4
0.6
0.8
1.0
2008 2012 2016
-15 -10 -5 0 5 10 15 200.0
0.2
0.4
0.6
0.8
1.0
2008 2012 2016
4 at.%
Tm:YAG(a)
measured
sech2 fit
P= 3.4 ps
Inte
nsit
y [
a.u
.]
Delay [ps]
Wavelength [nm]
= 2.7 nm
10 at.%
Tm:YAG(b)
measured
sech2 fit
P= 3.2 ps
Inte
nsit
y [
a.u
.]
Delay [ps]
= 2.5 nm
Wavelength [nm]
Fig. 5.3 Recorded AC-traces (black symbols) and fits (red lines) assuming a sech
2-pulse shape of
the mode-locked Tm:YAG ceramic laser with SESAM No.4 and the corresponding optical spectra
(insets): (a) 4 at. % Tm:YAG ceramics with 0.5% OC and (b) 10 at. % Tm:YAG ceramics with
1.5% OC.
Intensity autocorrelation (AC) traces recorded for the 4 and 10 at. % Tm:YAG ceramics
with SESAM No.4 are shown in Fig. 5.3 for comparison. Lower out-coupling leads to lower
overall losses and from theoretical point of view to shorter pulse durations [100]. However, in
this experiment the pulse duration did not show a clear dependence on the OC transmission.
For the relatively low out-coupling studied, increasing the transmission of the OC, only Pout
increased proportionally, e.g., for SESAM No.2 and the 4 at. % Tm:YAG, Pout increased from
~ 40 mW for 0.5% OC to ~ 150 mW for 3.0% OC.
0.0 0.2 0.4 0.6 0.8 1.0-80
-70
-60
-50
-40
-30
-20
-10
0
88.6 88.8 89.0 89.2
-100
-80
-60
-40
-20
0
RBW = 30 kHz
RF
po
wer
den
sit
y [
dB
m]
Frequency (GHz)
(a)
RF
po
wer
den
sit
y [
dB
m]
RBW = 300 Hz
Frequency (MHz)
(b)
77 dBc
Fig. 5.4 RF spectra of the mode-locked 4 at. % Tm:YAG ceramic laser with the 0.5% OC: (a) 1.0
GHz wide span, (b) fundamental beat note in a 800 kHz wide span. RBW: resolution bandwidth.

Chapter 5 Passively mode-locked 2-µm lasers: experimental results
76
As a further evidence for stable single-pulse CWML without Q-switching instabilities,
the RF spectra were recorded, shown for the 4 at. % Tm:YAG ceramics in Fig. 5.4. Despite
the slight drop of the harmonic beat notes in Fig. 5.4a, no peaks were observed in between.
The fundamental beat note at 88.83 MHz displays a remarkably high extinction ratio of 77 dB
above carrier, as shown in Fig. 5.4b, and no side bands related to Q-switching are seen.
After the publication of the above results [128], other researchers reported mode-locking
of diode-pumped Tm:YAG ceramics using graphene-SAs [129]. Their best results were
similar both in terms of shortest pulse duration (p = 2.8 ps at 2.016 µm) and maximum
average power (Pout = 158 mW at 98.7 MHz).
5.2.2 Tm:LuAG ceramics
Tm:LuAG ceramics had not been employed before the present work in mode-locked lasers.
However, one report on crystalline Tm:LuAG laser mode-locked by GaAs-based SESAMs
was published very recently: With diode pumping this laser generated 38 ps pulses at
~ 2.023 µm with Pout = 1.2 W at 129.2 MHz [130].
A 4 at. % Tm:LuAG ceramics was available for the present study, fabricated by the same
procedure as Tm:YAG. The 3 mm thick active element had an aperture of ~ 5×5 mm2. It was
mounted in a similar way in the same cavity as the one used for the Tm:YAG ceramics. The
single-pass average absorption of the pump light was ~ 71 %, in good agreement with the
calculated 72% (cf. Fig. 2.5). No roll-off in the input-output power dependence in CW
operation (prism pair removed and SESAM substituted by a plane 100% reflecting mirror)
was observed up to the maximum pump level applied for OC transmission in the 0.5-5%
range, which is an indication of the high quality of the ceramic.
0 400 800 1200 16000
100
200
300
400
0 200 400 600 800 1000 12000
50
100
150
(a) 3% OC
CWML
QSML
Multi
pulses
CWMLQSML
SESAM No.2 = 28%
SESAM No.4= 16%
Avera
ge o
utp
ut
po
wer
[mW
]
Absorbed pump power [mW]
(b) SESAM No.3
Multi
pulses
CWML
CWMLQSML
QSML
3% OC = 14%
1.5% OC = 7%
Avera
ge o
utp
ut
po
wer
[mW
]
Absorbed pump power [mW]
Fig. 5.5 Average output power versus absorbed pump power of the mode-locked Tm:LuAG
ceramic laser using different SESAMs with the 3.0% OC (a) and using different OCs with SESAM
No.3. η is slope efficiency versus absorbed pump power in the CWML regime (linear fit).
For mode-locking, the same batch of GaSb-based SESAMs was tested. However, the
mode size on the SESAM had to be increased to prevent damage although this contradicts the
CWML criterion discussed in Chapter 4. By applying an M3 with a RoC of −150 mm (the

5.2 Mode-locking of garnet ceramics
77
largest available), a waist radius at the SESAM position of ~ 100 μm (calculated value) was
achieved (cf. Table 5.1). As expected, the central wavelength of the Tm:LuAG ceramic laser
was slightly longer, around 2.022 µm. With a prism separation of 21 cm the repetition rate
was ~ 93 MHz.
The input-output power dependences are compared in Fig. 5.5 for different SESAMs and
OCs and the laser characteristics are summarized in Table 5.4. Initially, SESAM No.3 was
tested and the pulse duration got shorter, from p = 3.8 to 3.0 ps, as the cavity losses were
reduced by the OC, however, the slope efficiency also dropped to 7%. Moreover, multi-pulse
operation occurred as Pout reached 95 mW for the 1.5% OC.
Figure 5.6a shows the intensity AC trace recorded in such a multi-pulse (4 pulses) regime
resulting in 7 peaks. The situation was greatly improved with the 3% OC, as can be seen from
Fig. 5.6b.
It shall be noted that with the 1.5% OC, damage to the SESAM No.3 occurred in the
QSML region in Fig. 5.5. Due to this reason, the 3.0% OC was employed for comparison of
the different SESAMs in the stable CWML regime.
-80 -60 -40 -20 0 20 40 60 80 100 1200.0
0.5
1.0
1.5
2016 2020 2024
-10 -5 0 5 10 15 20 250.0
0.5
1.0
1.5
2016 2020 2024
Delay [ps]
Inte
nsit
y [
a.u
.]
1.5% OC
SESAM No.3(a)
measured
sech2 fit
P= 3.0 ps
Wavelength [nm]
= 2.7 nm
Delay [ps]
Inte
nsit
y [
a.u
.]
3.0% OC
SESAM No.3(b)
measured
sech2 fit
P= 3.8 ps
= 2.3 nm
Wavelength [nm]
-10 -5 0 5 10 15 20 250.0
0.5
1.0
1.5
-10 -5 0 5 10 15 20 250.0
0.5
1.0
1.5
2016 2020 2024 2016 2020 2024
Inte
nsit
y [
a.u
.]
3.0% OC
SESAM No.2(c)
measured
sech2 fit
P= 2.7 ps
Delay [ps]
In
ten
sit
y [
a.u
.]
3.0% OC
SESAM No.4(d)
measured
sech2 fit
P= 2.9 ps
Delay [ps]
= 2.0 nm
Wavelength [nm]
= 2.6 nm
Wavelength [nm]
Fig. 5.6 Measured AC traces (black symbols) and fits (red lines) assuming a sech2-pulse shape of
the mode-locked Tm:LuAG ceramic laser with (a) SESAM No.3 and 1.5% OC; (b) SESAM No.3
and 3.0% OC; (c) SESAM No.2 and 3.0% OC; (d) SESAM No.4 and 3.0% OC. Insets: optical
spectra.

Chapter 5 Passively mode-locked 2-µm lasers: experimental results
78
Self-starting CWML operation was achieved with SESAMs No.2, No.3, and No.4 easily,
without damage. Depending on the SESAM parameters, the mode-locked laser undergoes
different operation regimes in the applied pump power range (CW, QSML, CWML, multi-
pulses), as shown in Fig. 5.5. The AC traces and spectra can be compared in Figs. 5.6b-d. As
could be expected, implementing the SESAM with the highest modulation depth ∆𝑅 (SESAM
No.1 with 3 QWs), only led to strong tendency of Q-switching instabilities and optical
damage.
Table 5.4 Comparison of the mode-locked Tm:LuAG ceramic laser performance with different
GaSb-based SESAMs and OCs. corresponds to the FWHM, Pout is the average output power,
and Fth is the (spatially) averaged fluence on the SESAM at the CWML threshold.
SESAM OC τp
[ps]
Δλ
[nm] TBP
Pout
[mW]
Fth
[μJ/cm2]
No.1 NA, damage occurs
No.2 3.0% 2.7 2.0 0.40 232 100
No.3 3.0% 3.8 2.3 0.64 119 65
1.5% 3.0 2.7 0.60 95*
No.4 3.0% 2.9 2.6 0.55 270 218
400*
*limit when multi-pulses occur
Also in the case of Tm:LuAG ceramics it was essential to have the intracavity prism pair
(with calculated round trip GDD of −2020 fs2) for ultimate stability. However, again the
prisms had no pulse shortening effect.
The performance of SESAM No.2 was the best in terms of CWML operation range,
extending from 700 mW up to the maximum absorbed pump power, cf. Fig. 5.5a. Pulses as
short as 2.7 ps were obtained with Pout = 232 mW. A satellite pulse was observed at a
separation of 16 ps (the same as for the multi-pulses discussed before), with an amplitude of
only 3% of the main pulse. It can be seen together with the corresponding slight spectral
modulation in Fig. 5.6c. The TBP amounted to 0.40 in this case.
Using SESAM No.3, CWML started from an absorbed power of ~ 600 mW, with a slope
efficiency of 14%. A maximum Pout = 119 mW was reached for CWML. The corresponding
AC trace and optical spectrum are presented in Fig. 5.5b. The satellite amplitude was ~ 2% of
the main pulse and the TBP amounted to 0.64.
Best performance with respect to Pout (270 mW) and slope efficiency (=28%) was
obtained with SESAM No.4. However, compared to SESAM No.3, CWML started at a rather
high average intracavity fluence on the SESAM of Fth = 218 μJ/cm2 and the stability range
was narrower in terms of absorbed pump power, Fig. 5.5a. The pulses were shorter, p =
2.9 ps, compared to SESAM No.3 but the amplitude of the satellite increased to about 7% of
the main pulse at the same separation, cf. Fig. 5.6d. This led to more pronounced modulation

5.2 Mode-locking of garnet ceramics
79
in the spectrum. The corresponding TBP = 0.55 is slightly closer to the Fourier limit
compared to SESAM No.3. When Pout exceeded the CWML limit, multi-pulse operation was
observed in this case, too.
It shall be noted that the satellite separation from the main pulse was exactly 16 ps in all
cases. This matches rather well the round trip time of the entire SESAM structure taking into
account the high refractive index (n = 3.34) of GaSb. In other words, a part of the pulse
energy incident upon the SESAM, is transmitted through the distributed Bragg reflector and
retro-reflected from the rear surface of the GaSb substrate, leading to formation of the satellite
pulse. This spurious Fabry–Pérot effect is also confirmed by the modulation of the emission
spectra in Fig. 5.6 (Δλmod = 0.8 nm), which correlates with the free-spectral range of the
~ 520 μm thick GaSb substrate. More pulses are expected at higher power as they are able to
saturate the QWs being further amplified by the gain medium. However, the observed Fabry–
Pérot effect in the SESAM structure does not limit the bandwidth of the mode-locked
Tm:LuAG oscillator for the present pulse durations. This will become clear in the following
where shorter pulses will be reported with the same SESAMs using other active media. The
spurious Fabry–Pérot effect could be easily suppressed in the future by adding a few more
layer pairs to the distributed Bragg reflector and/or by further roughening the SESAM rear
surface.
0.0 0.2 0.4 0.6 0.8 1.0
-90
-80
-70
-60
-50
-40
-30
-20
92.50 92.55 92.60 92.65 92.70 92.75
-100
-80
-60
-40
-20
RF
po
wer
den
sit
y [
dB
m]
RBW = 30 kHz
Frequency (GHz)
(a)
RF
po
wer
den
sit
y [
dB
m]
Frequency (MHz)
RBW = 100 Hz(b)
80 dBc
Fig. 5.7 RF spectra of the mode-locked Tm:LuAG ceramic laser: (a) 1.0 GHz wide-span, (b)
fundamental beat note in a 300 kHz wide-span. RBW: resolution bandwidth.
Finally, the stability of the mode-locked Tm:LuAG ceramic laser was characterized by
RF spectra and the results for SESAM No.2 are shown in Fig. 5.7. The narrow fundamental
beat note was centered at 92.63 MHz with a very high extinction ratio of 80 dB above the
noise level, cf. Fig. 5.7b. The RF spectra indicate again stable and clean CW mode-locking
without Q-switching instabilities. Similar extinction ratios around 80 dB above the noise level
were achieved when operating the Tm:LuAG laser in the CWML regime with SESAMs No.3
and No. 4. Compared to Tm:YAG (Fig. 5.4), the flat RF comb in Fig. 5.7a within the 1 GHz
span and the higher extinction ratio indicate more stable operation of the mode-locked
Tm:LuAG laser.

Chapter 5 Passively mode-locked 2-µm lasers: experimental results
80
Compared to the so far only report on a Tm:LuAG crystalline laser mode-locked by a
SESAM [130] , one order of magnitude shorter pulses and two orders of magnitude better
pulse contrast are achieved in the present work. This is attributed to the faster relaxation time
of the SESAM employed in the present work. With respect to the previously described
performance of the mode-locked Tm:YAG ceramic laser [128], higher efficiency and output
power are demonstrated at comparable pulse characteristics.
5.2.3 Tunable mode-locked Ho:YAG ceramic laser
As already mentioned, Ho:YAG lasers were the first 2 µm lasers which were actively mode-
locked. Recently, also passive CWML with a Tm,Ho:YAG crystal pumped by a Ti:sapphire
laser has been demonstrated [131]: with an InGaAs/AlAsSb QWs-based SESAM, pulses of p
= 60 ps were obtained at 2.091 µm for Pout = 160 mW at 106.5 MHz, without GVD
compensation. A similar laser with chirped mirrors for negative GDD was studied in [132]
employing GaAs- and GaSb-based SESAMs. The latter turned out to me more promising
delivering pulses as short as 21.3 ps at 2.091 µm for Pout = 63 mW at ~ 107 MHz. The only
CWML results reported for a singly Ho-doped YAG crystal/ceramics deal with active mode-
locking by acousto-optic modulation: Pumping by a Tm:YLF laser, pulses as short as 102 ps
at ~ 2.097 µm with Pout = 1.04 W at ~ 83 MHz were obtained [133], and pumping with a Tm-
fiber laser, the shortest pulse duration was p = 241.5 ps at 2122 µm for Pout = 1.84 mW at
~ 82 MHz [134].
In the present experiment, the Tm-fiber laser used for pumping emitted at 1.908 µm, very
close to the absorption maximum of Ho:YAG (cf. Chapter 2) and within the FWHM of the
peak. After the collimating optics, the beam had a diameter of 4.5 mm with a divergence
angle of 0.57 mrad and an M2 factor of 1.03. The calculated pump beam radius at the input
facet of the Ho:YAG ceramic sample was 28 μm and the cavity was designed for a laser mode
radius ~ 30 μm. The single-pass absorption amounted to only ~ 36±1%, because of the strong
Fresnel reflection at Brewster’s angle of the unpolarized pump light (its s-component).
The 1 at. % Ho:YAG ceramic sample, prepared by a similar fabrication process as the
Tm:YAG/LuAG ceramics [135], had a thickness of 4 mm and an aperture of ~ 3×3 mm2. In
this experiment, the GaSb-based SESAM No.2 (without additional AR coating) was applied
as a SA. The beam radius on the SESAM was adjusted for best CWML stability by the choice
of M3 (cf. Table 5.1). The laser was studied without intracavity GDD compensation and the
repetition rate was 82-83 MHz.
Self-starting CWML operation was achieved with this laser for OCs with transmission of
0.5 and 1.5%. The results in terms of average output power and slope efficiency are shown in
Fig. 5.8. In both cases the CWML regime starts at an intracavity power ~ 5.3 W. This
corresponds to an average fluence of 420 µJ/cm2 on the SESAM. As the pump power was
increased, the laser directly switched from CW to CWML regime without any Q-switching
instability, cf. Fig. 5.8. No QSML region existed and RF spectra as the one shown in Fig. 4.12
for illustration purposes were obtained only when the cavity was misaligned. This was mainly
due to the one order of magnitude higher gain cross section σg of Ho:YAG compared to the

5.2 Mode-locking of garnet ceramics
81
Tm-doped garnets (cf. Figs. 2.6-2.8). The resulting lower gain saturation fluence 𝐹sat,L
stabilizes the laser against Q-switching instabilities, as discussed in Chapter 4.
0 200 400 600 800 1000 1200 14000
50
100
150
200
250
CWML
CWML
0.5% OC 12%
1.5% OC 18%
Avera
ge o
utp
ut
po
wer
[mW
]
Absorbed pump power [mW]
Fig. 5.8 Average output power versus absorbed pump power of the mode-locked Ho:YAG ceramic
laser for different output couplers (OCs). The vertical lines indicate the transition from CW to
clean CWML operation. : slope efficiency obtained from linear fits.
-20 -10 0 10 200.0
0.5
1.0
-20 -10 0 10 200.0
0.5
1.0
-20 -10 0 10 200.0
0.5
1.0
2080 2090 2100 2110
Inte
nsit
y [
a.u
.]
Delay [ps]
measured
sech2 fit
P= 7.4 ps
(a) 1.5% OC
Inte
nsit
y [
a.u
.]
Delay [ps]
(b) 0.5% OC
= 1.4 nm
measured
sech2 fit
P= 7.4 ps
(c) 1.5% OC &
Lyot-Filter
Inte
nsit
y [
a.u
.]
Delay [ps]
measured
sech2 fit
P= 7.2 ps
(d)
Sp
ectr
al
inte
nsit
y [
a.u
.]
Wavelength [nm]
= 1.4 nm
= 1.4 nm
1.5% OC
cf. (a)
1.5% OC &
Lyot-filter
cf. (c)
0.5% OC
cf. (b)
Fig. 5.9 SESAM mode-locked Ho:YAG ceramic laser: Measured AC traces (black symbols) and
fits (red lines) assuming a sech2-pulse shape without (a,b) and with the Lyot filter (c) in the cavity
(OC: output coupler). (d) Optical emission spectra corresponding to (a), (b) and (c).
With the 1.5% OC, the mode-locked laser delivered a maximum Pout of 258 mW for
1.4 W of absorbed pump power, with a slope efficiency of 18%. The maximum absorbed
pump power with the 0.5% OC was limited to 1.1 W (Pout 128 mW). Above this level,
damage on the surface of the SESAM was observed. The damage threshold of this SESAM

Chapter 5 Passively mode-locked 2-µm lasers: experimental results
82
was estimated from this to be about 2.0 mJ/cm2
of on-axis fluence. As long as the laser was
operated below this value, CWML was very stable and could be maintained without
interruption during the entire day.
The AC traces and optical emission spectra of the mode-locked Ho:YAG ceramic laser
are presented in Fig. 5.9 at maximum Pout. As in the CW regime (Fig. 5.10 gives only an idea
of this because it was recorded with a wavelength tuning element), stable dual-wavelength
emission centered at 2.090 and 2.096 µm occurred. Each peak exhibited a spectral width of
Δλ = 1.4 nm for both 1.5% and 0.5% OCs (Fig. 5.9d). A pulse duration p = 7.4 ps was
derived from the measured AC traces under the assumption of sech2-pulse shapes (Figs. 5.9a
and b). The AC traces are modulated with a frequency of 0.43 THz, which corresponds to the
spectral difference of the two emission wavelengths (Fig. 5.9a and b). The depth of this
modulation is related to the intensity ratio of the two peaks in Fig. 5.9d. The effect thus is
reminiscent of the multi-pulse regime discussed in Chapter 4 but obviously cannot be
qualified as pulse break-up because it occurs also in the CW regime. Dual emission of the
same pair of wavelengths was reported for the SESAM mode-locked Tm,Ho:YAG laser
in [132] but in contrast to the present measurements, no modulation of the AC trace was
detected, most likely because of the much longer pulse durations. Thus, this behavior can be
attributed to the nature of Ho:YAG and agrees with the calculated gain cross sections in Fig.
2.8.
2000 2030 2060 2090 2120 21500
150
300
450
600
750
900 CW tuning
SESAM
Wavelength [nm]
Ou
tpu
t p
ow
er
[mW
]
82
86
90
94
98
Refl
ecti
vit
y [
%]
122 nm
Fig. 5.10 Spectral tunability of the CW Ho:YAG ceramic laser obtained with a Lyot filter (1.5%
OC) and reflectivity curve of the employed GaSb-based SESAM. The SESAM had been
substituted by a plane mirror for the tunability measurement.
Such dual-wavelength CWML regimes were observed by other researchers in different
spectral ranges and suggested as a promising approach for the generation of THz radiation or
as synchronized sources for double-pulse pump-probe measurements [136-138]. In this work
the synchronous dual-wavelength emission aspect was not further pursued since the main goal
was the generation of non-modulated pulses with shortest durations. Two different methods
were applied to suppress the dual-wavelength operation of the mode-locked Ho:YAG ceramic
laser.

5.2 Mode-locking of garnet ceramics
83
-20 -10 0 10 200.0
0.2
0.4
0.6
0.8
1.0
1.2
-20 -10 0 10 200.0
0.2
0.4
0.6
0.8
1.0
1.2
(a) = 2064 nm measured
sech2 fit
P= 2.1 ps
Inte
nsit
y [
a.u
.]
Delay [ps]
(b) = 2066 nm measured
sech2 fit
P= 4.0 ps
Inte
nsit
y [
a.u
.]
Delay [ps]
-20 -10 0 10 200.0
0.2
0.4
0.6
0.8
1.0
1.2
-20 -10 0 10 200.0
0.2
0.4
0.6
0.8
1.0
1.2
(c) = 2079 nm measured
sech2 fit
P= 6.7 ps
Inte
nsit
y [
a.u
.]
Delay [ps]
(d) = 2090 nm measured
sech2 fit
P= 5.8 ps
Inte
nsit
y [
a.u
.]
Delay [ps]
-30 -20 -10 0 10 20 300.0
0.2
0.4
0.6
0.8
1.0
1.2
-30 -20 -10 0 10 20 300.0
0.2
0.4
0.6
0.8
1.0
1.2
(e) = 2097 nm measured
sech2 fit
P= 7.2 ps
Inte
nsit
y [
a.u
.]
Delay [ps]
(f) = 2106 nm measured
sech2 fit
P= 9.3 ps
Inte
nsit
y [
a.u
.]
Delay [ps]
-60 -40 -20 0 20 40 600.0
0.2
0.4
0.6
0.8
1.0
1.2
2060 2080 2100 21200.0
0.2
0.4
0.6
0.8
1.0
1.2
(g) = 2121 nm measured
sech2 fit
P= 12.5 ps
Inte
nsit
y [
a.u
.]
Delay [ps]
(h)
Sp
ectr
al
inte
nsit
y [
a.u
.]
Wavelength [nm]
Fig. 5.11 Tuning of the mode-locked Ho:YAG laser with the 0.5% OC: (a)-(g) measured AC
traces (black symbols) and fits (red lines) assuming a sech2-pulse shape and (h) optical emission
spectra.
At first, the CaF2 prism pair was inserted together with a knife edge in the cavity arm
containing the OC. Neither the targeted single-wavelength emission nor a significant pulse
shortening were achieved despite the large amount of GDD (up to −1700 fs2). Thus the prism
pair was removed.

Chapter 5 Passively mode-locked 2-µm lasers: experimental results
84
Then a birefringent (Lyot) filter was inserted instead of the prism pair. In this
configuration the dual-wavelength emission was eliminated and clean pulses without
modulation were generated at 2.096-2.097 µm, as shown in Figs. 5.11e and 5.12f. The non-
modulated pulses are slightly shorter (7.2 ps) and the TBP amounts to 0.69.
-20 -10 0 10 200.0
0.2
0.4
0.6
0.8
1.0
1.2
-20 -10 0 10 200.0
0.2
0.4
0.6
0.8
1.0
1.2
(a) = 2059 nm measured
sech2 fit
P= 2.6 ps
Inte
nsit
y [
a.u
.]
Delay [ps]
(b) = 2065 nm measured
sech2 fit
P= 2.5 ps
Inte
nsit
y [
a.u
.]Delay [ps]
-20 -10 0 10 200.0
0.2
0.4
0.6
0.8
1.0
1.2
-20 -10 0 10 200.0
0.2
0.4
0.6
0.8
1.0
1.2
(c) = 2066 nm measured
sech2 fit
P= 4.9 ps
Inte
nsit
y [
a.u
.]
Delay [ps]
(d) = 2079 nm measured
sech2 fit
P= 7.1 ps
Inte
nsit
y [
a.u
.]
Delay [ps]
-20 -10 0 10 200.0
0.2
0.4
0.6
0.8
1.0
1.2
-30 -20 -10 0 10 20 300.0
0.2
0.4
0.6
0.8
1.0
1.2
(e) = 2090 nm measured
sech2 fit
P= 5.4 ps
Inte
nsit
y [
a.u
.]
Delay [ps]
(f) = 2096 nm measured
sech2 fit
P= 7.2 ps
Inte
nsit
y [
a.u
.]
Delay [ps]
-30 -20 -10 0 10 20 300.0
0.2
0.4
0.6
0.8
1.0
1.2
-40 -20 0 20 400.0
0.2
0.4
0.6
0.8
1.0
1.2
(g) = 2105 nm measured
sech2 fit
P= 10.5 ps
Inte
nsit
y [
a.u
.]
Delay [ps]
(h) = 2121 nm measured
sech2 fit
P= 15.6 ps
Inte
nsit
y [
a.u
.]
Delay [ps]
Fig. 5.12 Tuning of the mode-locked Ho:YAG laser with the 1.5% OC: (a)-(h) measured AC
traces (black symbols) and fits (red lines) assuming a sech2-pulse shape.

5.2 Mode-locking of garnet ceramics
85
Prompted by the broad CW lasing tunability achieved (122 nm) of the Ho:YAG ceramic
laser and the broad reflection band of the GaSb-based SESAM shown in Fig. 5.10, the same
Lyot filter was employed to study the tunability in the CWML regime. The Lyot filter was a
3-mm thick quartz plate with the optical axis at 60° to the surface, a special design which does
not substantially restrict the bandwidth to suppress fs pulse generation [126].
Tunable CWML was achieved with both the 0.5% and 1.5% OCs. The AC traces and the
corresponding optical emission spectra are shown in Fig. 5.11 for the 0.5% OC and in Fig.
5.12 for the 1.5% OC. The achieved tunability is demonstrated in Fig. 5.11h for the former
and in Fig. 5.13 for the latter case.
2050 2060 2070 2080 2090 2100 2110 21200.0
0.2
0.4
0.6
0.8
1.0
1.2
Sp
ectr
al
inte
ns
ity [
a.u
.]
Wavelength [nm]
Fig. 5.13 Optical emission spectra of the tunable mode-locked Ho:YAG laser with the 1.5% OC.
The pulse duration and Pout dependences of the tunable mode-locked Ho:YAG laser are
illustrated in Fig. 5.14 and all important parameters are compiled in Table 5.5.
2060 2080 2100 2120
0
4
8
12
16 (a) 0.5% OC
P
Pavg
Wavelength [nm]
Pu
lse d
ura
tio
n [
ps]
0
20
40
60
80
100
120
Avera
ge o
utp
ut
po
wer
[mW
]
2060 2080 2100 2120
4
8
12
16
P
Pavg
(b) 1.5% OC
Wavelength [nm]
Pu
lse d
ura
tio
n [
ps]
0
40
80
120
160
200
240 A
vera
ge o
utp
ut
po
wer
[mW
]
Fig. 5.14 Spectral tunability of the mode-locked Ho:YAG ceramic laser with a Lyot filter in the
cavity: Pulse duration and average output power obtained with the 0.5% (a) and 1.5% (b) OCs.
With the 0.5% OC, tuning in the CWML regime was possible from 2.064 to 2.121 µm,
leading to a total tuning range of 57 nm. The laser was still pulsing up to 2.129 µm but no

Chapter 5 Passively mode-locked 2-µm lasers: experimental results
86
stable mode-locking was achievable. This is attributed to the abrupt drop in the SESAM
reflectivity above ~ 2.120 µm (Fig. 5.10). The pulse duration decreased from 12.5 ps at
2.121 µm to 2.1 ps at 2.064 µm and Pout reached 102 mW at 2.121 µm. The pulse shortening
towards shorter wavelengths could be related to an increase of the modulation depth of the
SESAM since it was originally designed for 2.040 µm. The shortest pulse duration of 2.1 ps
was obtained at 2.064 µm for Pout = 10 mW.
Table 5.5 Summary of the tunable mode-locked Ho:YAG ceramic laser output characteristics.
0.5% OC at 1.07 W absorbed pump power
λ [nm] 2129 2121 2106 2097 2090 2079 2066 2064 2059
Pout [mW] 76 102 96 95 84 33 20 10
NA τp [ps]
N/A
12.5 9.3 7.2 5.8 6.7 4 2.1
Δλ [nm] 0.8 1.2 1.4 1.8 1.9 3.1 3
TBP 0.67 0.75 0.69 0.71 0.88 0.87 0.44
1.5% OC at 1.55 W absorbed pump power
λ [nm] 2129 2121 2106 2097 2089 2076 2067 2065 2059
Pout [mW] 158 230 196 216 141 83 52 42 28
τp [ps]
N/A
15.6 10.5 7.2 5.4 7.1 4.9 2.5 2.6
Δλ [nm] 0.8 1.2 1.3 1.7 1.8 2.5 2.9 2.6
TBP 0.83 0.85 0.64 0.63 0.89 0.86 0.51 0.47
0 1 2 3 4 5 6 7
-80
-60
-40
-20
0.0 0.2 0.4 0.6 0.8 1.0
-80
-60
-40
-20
82.50 82.55 82.60 82.65 82.70 82.75
-100
-80
-60
-40
-20
(a)
Frequency [GHz]
RBW: 300 kHz
(b)
RBW: 30 kHz
RF
po
we
r d
en
sit
y [
dB
m]
Frequency [GHz]
77 dBc
(c)
RBW: 300 Hz
Frequency [MHz] Fig. 5.15 RF spectra of the mode-locked Ho:YAG ceramic laser with the 0.5% OC: (a) 7 GHz and
(b) 1.1 GHz wide-span, (c) fundamental beat note in a 300 kHz wide-span. RBW: resolution
bandwidth.

5.3 Sub-ps Tm:CALGO laser
87
With the 1.5% OC, tuning in the CWML regime was possible from 2.059 to 2.121 µm.
The tuning range was slightly broader (by 5 nm) compared to the 0.5% OC. In general, the
pulses were slightly longer compared to the results with the 0.5% OC: Their duration
decreased from 15.6 ps at 2.121 µm to 2.5-2.6 ps in the short wavelength limit and Pout
reached 230 mW at 2.121 µm. The TBP in Table 5.5 varies from 0.44 to 0.89 which is almost
3 times the Fourier limit. Insertion of the CaF2 prism pair did not result in further pulse
shortening to utilize the available spectral bandwidth, just as without the birefringent filter.
The stability of the SESAM mode-locked Ho:YAG ceramic laser operating with the Lyot
filter but without the prism pair at 2.097 µm is demonstrated in Fig. 5.15 in terms of RF
spectra recorded in different spans. The narrowband fundamental beat note at 82.6 MHz
exhibits a high extinction ratio of 78 dB above noise level (Fig. 5.15c). The RF spectra
indicate clean CWML without Q-switching instabilities or any multi-pulse behavior. Note that
the laser could be continuously tuned during operation without interruption of the CWML
regime.
5.3 Sub-ps Tm:CALGO laser
Despite the broad and smooth gain cross-sections of Tm:CALGO and Tm:CALYO crystals
which, as explained in Chapter 2 (cf. Fig. 2.11), make them potentially interesting for the
generation of ultrashort pulses near 2 µm, only tens of picoseconds pulse durations are found
in the literature: In 2015, passive mode-locking of Tm:CALGO was first reported using a
commercial GaAs-based SESAM. The shortest pulse durations were 27 ps at 1949.5 nm, with
Pout = 330 mW at ~ 129 MHz [139]. Employing the same SESAM, also dual-wavelength
(1.9589 and 1.9606 µm) CWML of Tm:CALYO was reported [138]: In this case the pulses
were even longer, ~ 35 ps for Pout = 830 mW at ~ 145 MHz.
1800 1850 1900 1950 2000 2050 21000
20
40
60
80
100
Tra
ns
mit
tan
ce [
%]
CW tuning
1 m air
Short pass filter
Wavelength [nm]
254 nm
0
50
100
150
200
250
300
350
Ou
tpu
t p
ow
er
[mW
]
Fig. 5.16 Spectral tunability of the CW Tm:CALGO laser obtained with a Lyot filter (1.5% OC)
and transmittance of the applied short pass filter. The grey line represents calculated transmittance
of 1 m air from HITRAN database.

Chapter 5 Passively mode-locked 2-µm lasers: experimental results
88
Most of the femtosecond mode-locked bulk lasers reported before operated above 2 μm
[123, 124]. This is related to the strong water absorption in air below 1.95 µm (cf. Fig. 5.16),
which will introduce unstable losses (depending on the humidity) in the cavity beam path and
preclude spectral broadening as a prerequisite for pulse shortening towards sub-ps durations.
In addition strong dispersion is expected in the presence of sharp absorption lines. As shown
in Fig. 2.11, the gain maximum of Tm:CALGO is below 2 μm. This was experimentally
confirmed by the CW tuning range recorded with the same X-shaped cavity shown in
Fig. 5.16 without GDD compensation and the SESAM substituted by a plane total reflector:
The Lyot filter permitted CW tuning across 254 nm with maximum Pout near 1.946 µm. Thus
the picosecond pulse regime obtained by other researchers was not surprising. To overcome
this limitation, a special short pass filter was adapted in the present work as an OC. As shown
in Fig. 5.16, the transmittance of this short pass filter increased sharply below 2 μm,
introducing huge losses at shorter wavelengths which forced the laser to operate above 2 μm.
The 6 at. % (in the melt) Tm:CALGO crystal employed was grown by the Cz method and
provided by the research team of [46]. The active element was processed as a 3.8 mm long
Brewster rhomb with an aperture of ~ 4×4 mm2 designed for σ-polarization due to the higher
gain cross section (Fig. 2.11). The Ti:sapphire pump wavelength was tuned to 798 nm to
match the absorption maximum for σ-polarization, cf. Table 5.1. The measured absorption
amounted to 65.5%, in reasonable agreement with the calculated 72.8 % (cf. Fig. 2.10a). It did
not change with the pump level or under lasing conditions.
2000 2010 2020 2030 20400.0
0.2
0.4
0.6
0.8
1.0
1.2
-3 -2 -1 0 1 2 30.0
0.2
0.4
0.6
0.8
1.0
1.2(b)
Wavelength [nm]
Sp
ectr
al
inte
nsit
y [
a.u
.]
= 5.6 nm
mod
= 0.8 nm
TBP = 0.376
(a)
Inte
nsit
y [
a.u
.]
Delay [ps]
measured
sech2 fit
P= 915 fs
Fig. 5.17 Tm:CALGO laser mode-locked by the GaSb-based SESAM No.2 without GDD
compensation: (a) measured AC trace (black symbols) and fit (red line) assuming a sech2-pulse
shape, and (b) optical emission spectrum.
Mode-locking of the Tm:CALGO laser was studied with the GaSb-based SESAMs No.2-
5 from Table 3.1. For initial tests, no GDD compensation was applied in the laser cavity and
the repetition rate was 102 MHz. Best performance in terms of stability, damage resistivity
and pulse duration was achieved with SESAM No.2. At the oscillating wavelength of 2.020
µm the transmission of the OC amounted to 2.8%. The pulse duration was p = 915 fs, cf. Fig.
5.17a. With a spectral width of 5.6 nm one arrives at TBP = 0.376. Slight spectral modulation

5.3 Sub-ps Tm:CALGO laser
89
can be seen in Fig. 5.17b. It should have the same origin (parasitic Fabry-Perot effect) as in
the mode-locked Tm:LuAG laser (cf. Fig. 5.6) since the period was again Δλmod = 0.8 nm.
With SESAMs No.3 and No.4, the tendency towards multi-pulse operation was stronger.
This is probably due to the 1-QW structures which exhibit the lowest modulation depths.
Single QWs are expected to be saturated more easily and thus further pulses, as those
resulting from the Fabry-Perot effect will be favored. Still, it was possible to measure the
pulse durations: p = 1.6 ps for SESAM Nr.3 and p = 1.0 ps for SESAM Nr.4.
Applying SESAM No.5 in which the QWs were relatively far from the surface, a pulse
duration of p = 7 ps was measured. Thus thinner cap layer seems to play an important role for
shortening the SA recovery time which affects the mode-locked laser pulse duration. The
results can be compared with the performance of the commercial GaAs-based SESAM
(BATOP GmbH) described in [4]. The relaxation time τ2 for this SESAM was specified as
34 ps while the obtained pulse duration for stable steady-state CWML was τp = 27 ps.
1900 1950 2000 2050 2100 2150 2200-100
-80
-60
-40
-20
0
20
40
o
e
Wavelength [nm]
GV
D [
fs2/m
m]
CALGO
Fig. 5.18 Calculated GVD of CALGO near 2 μm (single-pass).
SESAM No.2 (cf. Table 3.1) was selected for further study and the CaF2 prism pair was
inserted into the cavity as a next step, see Fig. 5.1. The GVD versus wavelength, calculated
with the new Sellmeier equations of CALGO fitted in [140], is shown in Fig. 5.18. The value
for o-polarization at 2.020 µm is close to zero (−32.2 fs2/mm). The prism separation was
optimized and at about 15 cm, the shortest pulses with ultimate stability were observed. The
calculated contributions of the prism pair are both negative, as explained in Chapter 4. With
the values from Table 4.2 which apply for a single pass, the round-trip GDD calculated for the
above prism separation and a material path of 4 mm is −632 fs2. The SESAM contribution
was assumed to be −300 fs2 from simulations [88], giving a total round-trip GDD ~ −1200 fs
2.
Figure 5.19 shows the input-output mode-locked laser characteristics with SESAM No.2
and the prism pair. Stable and self-starting mode-locking was achieved starting from Pout =
18 mW. The calculated beam waist radius at the position of the SESAM was 70 µm, resulting
in an average fluence of 78 µJ/cm2 at the CWML threshold. The maximum output power
reached Pout = 58 mW at ~ 101 MHz. The relatively low slope efficiency in the CWML
regime (η = 8.8%) is related to the decreasing gain at wavelengths above 2 µm.

Chapter 5 Passively mode-locked 2-µm lasers: experimental results
90
0 200 400 600 800 10000
20
40
60
80
2.8% OC 8.8%
Ave
rag
e o
utp
ut
po
we
r [m
W]
Absorbed pump power [mW]
CWML
Fig. 5.19 Average output power versus absorbed pump power for the mode-locked Tm:CALGO
laser. The vertical dashed line indicates the transition from CW to clean CWML operation.
2000 2010 2020 2030 20400.0
0.2
0.4
0.6
0.8
1.0
1.2
-3 -2 -1 0 1 2 30.0
0.2
0.4
0.6
0.8
1.0
1.2(b)
Wavelength [nm]
Sp
ectr
al
inte
nsit
y [
a.u
.]
= 9.2 nm
TBP = 0.44
measured
sech2 fit
P= 646 fs
(a)
Inte
nsit
y [
a.u
.]
Delay [ps]
Fig. 5.20 Tm:CALGO laser mode-locked by the GaSb-based SESAM No.2 with GVD
compensation: (a) measured AC trace (black symbols) and fit (red line) assuming a sech2-pulse
shape, and (b) optical emission spectrum.
0.0 0.2 0.4 0.6 0.8 1.0
-90
-80
-70
-60
-50
-40
-30
-20
-10
0
100.62 100.64 100.66 100.68 100.70
-100
-80
-60
-40
-20
0
RBW = 30 kHz
RF
po
wer
den
sit
y [
dB
m]
Frequenzy (GHz)
(a)
RF
po
wer
den
sit
y [
dB
m]
RBW = 300 Hz
Frequenzy (MHz)
(b)
78 dBc
Fig. 5.21 RF spectra of the mode-locked Tm:CALGO laser: (a) 1 GHz wide-span, (b) fundamental
beat note in a 100 kHz wide-span. RBW: resolution bandwidth.

5.4 Femtosecond Tm:MgW laser
91
The pulse duration decreased with increasing pump level: from τp ~ 750 fs at the CWML
threshold down to τp = 646 fs at the maximum output power, as shown in Fig. 5.19a. The
central wavelength was 2.021 µm. The TBP of 0.44 (Fig. 5.20b) is just 1/3 above the Fourier
limit which leaves little room for pulse compression. Due to the rather low magnitude of the
negative round-trip GDD, it is most likely that the soliton shaping mechanism was weak. This
conclusion seems supported by the fact that in the CWML power range the soliton “area
theorem” as described in Chapter 4 was not fulfilled.
However, the negative GDD of the prism pair was essential to achieve stable CWML and
improve the signal-to-noise ratio in the RF spectra (cf. Fig. 5.21). Both records indicate clean
CWML without Q-switching instabilities. The fundamental beat-note was 78 dB above noise
level which is much better compared with the situation without the prism pair in the cavity.
5.4 Femtosecond Tm:MgW laser
The spectroscopic properties of the new monoclinic Tm:MgW crystal were presented in
Chapter 2. Laser operation in the CW and passively Q-switched regime was achieved only
very recently, in 2017 [52, 141], but these results are outside the scope of the present thesis
and will not be presented here. The work on passive mode-locking was started in fact
simultaneously. It was triggered not only by the calculated broad and smooth gain spectra, cf.
Fig. 2.17, but also by the expected natural selection of wavelengths above 2 µm. Thus, a more
systematic study was devoted to this unique laser material to which exclusive access was
granted by the crystal growers.
The uncoated sample of Tm:MgW available for the mode-locked laser experiments was
manufactured from the same 0.89 at. % doped as-grown material used for spectroscopic
purposes, cf. Chapter 2. It was rectangular in shape, 3 mm thick along the X-axis, with an
aperture of 4(Y)×3.5(Z) mm2. Mode-locking was first investigated applying the GaSb-based
SESAMs for the two possible polarization configurations with the sample inclined under
Brewster’s angle. The Ti:sapphire pump laser was tuned to 796 nm (maximum absorption for
E||Y and very close to the maximum for E||Z, cf. Fig. 2.16a and Table 5.1). Then SWCNT-SAs
were applied with a prism pair or chirped mirrors for GDD compensation. Finally, mode
locking was studied also with graphene-SAs and chirped mirrors for GDD compensation.
5.4.1 SESAM mode-locked Tm:MgW laser
Initially, the Tm:MgW sample was oriented for the E||Z polarization (both pump at 802 nm
and laser) and SESAM No.2 was employed without GDD compensation in a ~ 1.43 m long
cavity. With the 1.5% OC, the free running laser wavelength was below 2 μm and the
spectrum was affected by air absorption. A strong tendency of multi-wavelength emission was
observed (cf. Fig. 5.22) which most likely was associated with mode-locking, however, the
spectra were very unstable (cf. Fig. 5.22), with several well defined dips whose position
coincided with the air absorption lines. This precluded stable CWML and further
characterization. Other SESAMs or GDD compensation did not improve the situation. On the

Chapter 5 Passively mode-locked 2-µm lasers: experimental results
92
other hand, as could be expected, tuning of the laser with the Lyot filter to wavelengths
beyond 2 μm led to stable mode-locking but the pulse durations were of the order of few ps.
For E||Y polarization, stable and self-starting CWML was achieved with SESAM No.3
which contained a single QW and a 10 nm thick cap layer, without GDD compensation.
Without the Lyot filter, the naturally selected laser wavelength was ~2.021 µm. At an incident
pump power of 1.86 W (absorbed pump power 0.80 W), Pout reached 30 mW.
1960 1965 1970 1975 1980 1985 1990 1995 20000.0
0.2
0.4
0.6
0.8
1.0
Wavelength [nm]
Sp
ectr
al
inte
nsit
y [
a.u
.]
95
96
97
98
99
100
Tra
nsm
itta
nce [
%]
Fig. 5.22 Multi-wavelength emission of the Tm:MgW (E||Z) laser with the GaSb-based SESAM
No.2 and the prism pair (blue, red and black curves). Grey line represents the calculated
transmittance of 1 meter air from HITRAN database.
2000 2010 2020 2030 20400.0
0.2
0.4
0.6
0.8
1.0
1.2
-3 -2 -1 0 1 2 30.0
0.2
0.4
0.6
0.8
1.0
1.2(b)
Wavelength [nm]
Sp
ectr
al
inte
nsit
y [
a.u
.]
= 7.6 nm
TBP = 0.556
measured
sech2 fit
P= 997 fs
(a)
Inte
nsit
y [
a.u
.]
Delay [ps]
Fig. 5.23 Mode-locked Tm:MgW laser (E||Y) by the GaSb-based SESAM No.3: (a) measured AC
trace (black symbols) and fit (red line) assuming a sech2-pulse shape, and (b) optical emission
spectrum.
The recorded AC trace could be almost perfectly fitted using a sech2-pulse shape profile
which yields a pulse duration τp = 997 fs (Fig. 5.23a). With the simultaneously measured
spectral width of 7.6 nm (cf. Fig. 5.23b) this leads to TBP = 0.556. Although such a TBP

5.4 Femtosecond Tm:MgW laser
93
indicates some possibility for pulse compression, insertion of 10 mm thick CaF2 windows
under Brewster’s angle did not result in pulse shortening but rather is some lengthening for
the maximum round trip GDD of −1075 fs2 achievable with 3 plates. Obviously, soliton-like
pulse shaping was absent in this laser. While the SESAM is expected to introduce negative
GVD, the contribution of the active element is unknown. Adding positive GVD (a 3 mm ZnS
plate under Brewster’s angle) also did not compress the output pulses.
5.4.2 SWCNT-SA mode-locked Tm:MgW laser
The further mode-locking experiments were confined to the E||Y polarization due to its higher
gain cross-section and the naturally selected longer emission wavelength. Transmission-type
SWCNT-SAs were inserted in the cavity as shown in Figs. 5.1-5.2. The RoC of M3 was
150 mm (cf. Table 5.1 which contains the calculated beam size) because with 100 mm,
damage on the SA was observed before mode-locking could be stabilized. Additionally a
retro-reflecting Ag mirror (RoC = 100 mm) was placed behind the dichroic M2 cavity mirror
for a second pump pass, to utilize the residual pump power. The estimated double-pass
absorption was 69.1% assuming equal absorption (44.9%) in the two passes. The latter is in
good agreement with the calculated value (46.5%) from the spectroscopic data (cf. Fig. 2.16a).
Initially, the MgF2 prism pair with a separation of 12.5 cm was inserted for GDD
management.
0 400 800 1200 1600 2000
0
50
100
150
200
CWML
(a)
1.5% OC7.5%
Pulse duration
Absorbed pump power [mW]
Avera
ge o
utp
ut
po
wer
[mW
]
225
250
275
300
325
Pu
lse d
ura
tio
n [
fs]
60 70 80 90 100 110
225
250
275
300
325
(b)
Intracavity pulse energy [nJ]
y=30303/(25+x)
Fig. 5.24 (a) Average output power and pulse duration versus absorbed pump power of the mode-
locked Tm:MgW laser with the SWCNT-SA and a prism pair for GDD compensation. The same
pulse duration 𝜏𝑝 data plotted versus the calculated intracavity pulse energy 𝜖𝑝 are shown in (b)
together with a fit assuming inversely proportional dependence: 𝜏𝑝 = 𝑎/(𝑏 + 𝜖𝑝).
With the 1.5% OC, the mode-locked laser operated at 2.020 µm. As shown in Fig. 5.24a,
stable self-starting CWML was achieved from a threshold corresponding to Pout = 115 mW
and an average fluence of 506 μJ/cm2 on the SWCNT-SA (calculated for an elliptic spot
under Brewster’s angle). Increasing the pump power, Pout increased with a slope of 7.5% up to
a maximum value of 160 mW (at ~ 104.6 MHz) whereas p decreased from 315 to 242 fs.

Chapter 5 Passively mode-locked 2-µm lasers: experimental results
94
The shortest output pulses were generated for a prism material path of ~ 5 mm (single
pass). The total round trip GDD due to the prism pair amounted to −992 fs2 in this case. The
dependence of the pulse duration on the intracavity pulse energy (which is proportional to the
output power) corresponds to a soliton-like pulse shaping but the “area theorem” as described
in Chapter 4, is not strictly fulfilled as can be seen in Fig. 5.24b where a correction term b =
25 nJ was necessary for the fit. Figure 5.25 shows the AC trace and the corresponding
spectrum of the shortest pulses generated. With a spectral width of 20.6 nm, one arrives at
TBP = 0.367, which is very close to the Fourier limit of 0.315.
1980 2000 2020 2040 20600.0
0.2
0.4
0.6
0.8
1.0
1.2
-1.0 -0.5 0.0 0.5 1.00.0
0.2
0.4
0.6
0.8
1.0
1.2(b)
Wavelength [nm]
Sp
ectr
al
inte
nsit
y [
a.u
.] = 20.6 nm
TBP = 0.367
measured
sech2 fit
P= 242 fs
(a)
Inte
nsit
y [
a.u
.]
Delay [ps]
Fig. 5.25 Mode-locked Tm:MgW laser by SWCNT-SA with a prism pair for GDD compensation:
(a) measured AC trace (black symbols) and fit (red line) assuming a sech2-pulse shape, and (b)
optical emission spectrum.
The 0.5% and 3.0% OCs were also tested in the same laser configuration. With the 0.5%
OC, similar pulse duration but lower output power (Pout = 45 mW), roughly proportional to
the lower transmission, were obtained at the maximum pump level applied. With the 3.0%
OC, mode-locking could not be obtained because of the increased cavity losses.
0.0 0.2 0.4 0.6 0.8 1.0
-90
-80
-70
-60
-50
-40
-30
-20
104.5 104.6 104.7-120
-100
-80
-60
-40
-20
RBW = 30 kHz
RF
po
wer
den
sit
y [
dB
m]
Frequency [GHz]
(a)
RF
po
wer
den
sit
y [
dB
m]
RBW = 300 Hz
Frequency [MHz]
(b)
75 dBc
Fig. 5.26 RF spectra of the SWCNT-SA mode-locked Tm:MgW laser: (a) 1 GHz wide-span and (b)
fundamental beat note in a 300 kHz wide-span. RBW: resolution bandwidth.

5.4 Femtosecond Tm:MgW laser
95
The Tm:MgW laser mode-locked by the SWCNT-SA was very stable, running for hours
without any interruption under normal laboratory conditions. The recorded RF spectra
(Fig. 5.26) confirmed the absence of Q-switching instabilities. The fundamental beat note
centered at ~ 104.6 MHz was 75 dB above noise level.
1950 1980 2010 2040 2070 2100-1200
-1150
-1100
-1050
-1000
-950
-900
-850
-800G
DD
[fs
2]
Wavelength [nm]
Chirped mirror with 9 bounces
MgF2 Prisms pair
Fig. 5.27 The MgF2 prism pair (separation: 12.5 cm, material path length: 5 mm) with negative
round trip GDD ~ −1000 fs2 at 2.020 µm and chirped mirrors (4 bounces scheme from Fig. 5.1
resulting in a total number of 9 bounces per round trip) with similar GDD at the laser wavelength.
Chirped mirrors were also applied for GDD compensation as explained in Fig. 5.27 (cf.
Fig. 5.1). In this case also the curved end mirror M4 was a chirped one resulting in a total of 9
bounces per round trip in order to reach as close as possible GDD value to the MgF2 prism
pair. However, the derivation of GDD value obtained was about 2/3 of that for the prism pair.
1960 1980 2000 2020 2040 2060 20800.0
0.2
0.4
0.6
0.8
1.0
1.2
-1.0 -0.5 0.0 0.5 1.00.0
0.2
0.4
0.6
0.8
1.0
1.2(b)
Wavelength [nm]
Sp
ectr
al
inte
nsit
y [
a.u
.]
= 28.2 nm
TBP = 0.349
measured
sech2 fit
P= 168 fs
(a)
Inte
nsit
y [
a.u
.]
Delay [ps]
Fig. 5.28 Mode-locked Tm:MgW laser by SWCNT-SA and chirped mirrors for GDD
compensation: (a) measured AC trace (black symbols) and fit (red line) assuming a sech2-pulse
shape, and (b) optical emission spectrum.
With the 0.5% OC, Pout = 37 mW at 2.018 µm was obtained for an absorbed pump power
of 1.15 W. The shortest pulse duration was p = 168 fs (Fig. 5.28a) and with the spectral width

Chapter 5 Passively mode-locked 2-µm lasers: experimental results
96
of 28.2 nm one obtains TBP = 0.349 (Fig. 5.28b), which is again very close to the Fourier
limit of 0.315. With the 1.5% OC, a similar pulse duration was achieved but the average
output power reached Pout = 124 mW which was much higher compared to the prism pair (Pout
= 84 mW for the same absorbed pump power). This is attributed to the lower insertion losses
of the chirped mirrors (~ 0.02% per bounce) in comparison to the prism pair.
5.4.3 Graphene-SA mode-locked Tm:MgW laser
Both the spectroscopic properties of Tm:MgW and CWML results presented before indicate
that E||Y polarization configuration is preferable for femtosecond pulse generation. On the
other hand chirped mirrors turned out to be advantageous compared to the prism pair as
discussed for the SWCNT-SA mode-locked Tm:MgW laser. Thus, employing graphene-SA,
the study was confined to this polarization and chirped mirrors for intracavity GVD
compensation.
The mono-, bi-, and tri-layer graphene-SAs available for the present experiment are
denoted as 1G 2G and 3G on quartz. The cavity scheme resulting in a total of 9 bounces per
round trip on the chirped mirrors was employed with a single pump pass. With the 0.5% OC,
stable and self-starting CWML was achieved with all graphene-SAs at an absorbed pump
power of 1.15 W, cf. Fig. 5.29. Table 5.6 summarizes the relevant parameters: As more layers
of graphene are used, Pout decreased from 44 to 22 mW, which is attributed to the increasing
non-saturable losses. The 1G amd 3G SAs generated similar pulse durations, while the 2G
sample produced a shorter pulse with a ~ 20% larger spectral width. Note that in all cases the
TBP was very close to the Fourier limit which explains the almost perfect AC trace fits with
sech2 pulse shape, an indication of soliton-like pulse shaping.
Table 5.6 Mode-locked Tm:MgW laser performance with 1G, 2G, and 3G
SAs on quartz for 0.5% OC.
SA τp
[fs]
λL
[µm]
Δλ
[nm] TBP
Pout
[mW]
1G on quartz 182 2.017 23.9 0.321 44
2G on quartz 148 2.015 29.2 0.320 32
3G on quartz 173 2.015 25.7 0.328 22
Fused quartz or silica normally exhibit absorption starting from 2 μm which means
additional unwanted cavity losses. Thus the next batch of bi-layer graphene-SAs were
manufactured on 2-mm thick CaF2 substrates. Such 2G on CaF2 was employed for the further
studies in which the performance of the mode-locked Tm:MgW laser was compared for
different OCs and intracavity GDD. The GDD was managed by introducing different number
of bounces on the chirped mirrors. Operating with 2, 4 and 6 bounces (single pass) on the
plane CMs (as shown in Fig. 5.1), the introduced round-trip GDD, including the contribution
of the chirped curved mirror M4 and the CaF2 substrate, amounted to −735, −1235, and

5.4 Femtosecond Tm:MgW laser
97
−1735 fs2, respectively. The different numbers of bounces in the cavity correspond to
repetition rates of 66, 76 and 87 MHz, respectively. At a fixed absorbed pump power of
1.15 W, CWML could be achieved in most of the cases.
1950 2000 2050 21000.0
0.2
0.4
0.6
0.8
1.0
1.2
-1.0 -0.5 0.0 0.5 1.00.0
0.2
0.4
0.6
0.8
1.0
1.2(b)
Wavelength [nm]S
pectr
al
inte
nsit
y [
a.u
.]
= 23.9 nm
TBP = 0.321
measured
sech2 fit
P= 182 fs
(a)
1G on quartz
4 bounces
0.5% OC
Inte
nsit
y [
a.u
.]
Delay [ps]
1950 2000 2050 21000.0
0.2
0.4
0.6
0.8
1.0
1.2
-1.0 -0.5 0.0 0.5 1.00.0
0.2
0.4
0.6
0.8
1.0
1.2(d)
Wavelength [nm]
Sp
ectr
al
inte
nsit
y [
a.u
.]
= 29.2 nm
TBP = 0.320
measured
sech2 fit
P= 148 fs
(c)
2G on quartz
4 bounces
0.5% OC
Inte
nsit
y [
a.u
.]
Delay [ps]
1950 2000 2050 21000.0
0.2
0.4
0.6
0.8
1.0
1.2
-1.0 -0.5 0.0 0.5 1.00.0
0.2
0.4
0.6
0.8
1.0
1.2(f)
Wavelength [nm]
Sp
ectr
al
inte
nsit
y [
a.u
.]
= 25.7 nm
TBP = 0.328
measured
sech2 fit
P= 173 fs
(e)
3G on quartz
4 bounces
0.5% OC
Inte
nsit
y [
a.u
.]
Delay [ps]
Fig. 5.29 Mode-locked Tm:MgW laser with 1G, 2G, and 3G on quartz: (a), (c), and (e) present
measured AC traces (black symbols) and fits (red line) assuming a sech2-pulse shape, and (b), (d),
and (f) present the optical emission spectra.
The mode-locked laser characteristics in terms of pulse duration and average output
power are summarized in Table 5.7. Note that a configuration with 0 bounces corresponding

Chapter 5 Passively mode-locked 2-µm lasers: experimental results
98
to minimum introduced negative round-trip GDD of −125 fs2 by the chirped mirror M4 was
also tested, however, the Tm:MgW laser operated only in the CW regime.
Using the 2 bounce scheme, stable and self-starting CWML was achieved with the 1.5%
OC, reaching Pout = 96 mW (pulse energy of 1.45 nJ) and p = 96 fs (Fig. 5.30a). The spectral
width of 45.8 nm (Fig. 5.30b) resulted in TBP = 0.324. The laser operated at 2.016 µm.
Table 5.7 Mode-locked Tm:MgW laser with 2G on CaF2: performance for different OCs and
intracavity GDD at an absorbed power of 1.15 W.
0 bounce 2 bounces 4 bounces 6 bounces
τp
[fs]
Pout
[mW]
τp
[fs]
Pout
[mW]
τp
[fs]
Pout
[mW]
0.2% OC CW 100* 20 91 18 111 15
0.5% OC CW 106* 54 86 39 116 33
1.5% OC CW 96 96 116 91 152 62
* multi-pulse operation occurs.
1950 2000 2050 21000.0
0.2
0.4
0.6
0.8
1.0
1.2
-0.4 -0.2 0.0 0.2 0.40.0
0.2
0.4
0.6
0.8
1.0
1.2(b)
Wavelength [nm]
Sp
ectr
al
inte
nsit
y [
a.u
.]
= 45.8 nm
TBP = 0.324
measured
sech2 fit
P= 96 fs
(a)
2G on CaF2
2 bounces
1.5% OC
Inte
nsit
y [
a.u
.]
Delay [ps]
Fig. 5.30 Mode-locked Tm:MgW laser with 2G on CaF2, 2 bounce GDD compensation scheme
and the 1.5% OC: (a) measured AC trace (black symbols) and fit (red line) assuming a sech2-pulse
shape, and (b) optical emission spectrum.
Shorter steady-state pulses are expected for lower output coupling in the quasi-3-level
Tm laser system due to the modified gain profile. However, as discussed in Chapter 4, when
the intracavity power was too high (*cases in Table 5.7), pulse break-up (multi-pulse) was
observed. With the 0.2% OC, a bound state double-pulse could be stabilized similar to
observations described in [111]. Figure 5.31a shows the AC trace of such a bound state, from
which a separation of 433 fs was derived. The measured AC trace was fitted assuming a
double-pulse with equal amplitudes and pulse duration of 100 fs (sech2 shape), and such a
separation. Complete modulation of the optical spectrum was observed in this case (cf.
Fig. 5.31b). The FWHM of the modulated spectrum was slightly narrower and thus the TBP
remained almost unchanged in the double-pulse regime. The spectral modulation profile
depends on the phase difference ϕ of the two pulses (cf. Fig. 5.32). The measured spectrum

5.4 Femtosecond Tm:MgW laser
99
could be almost perfectly fitted assuming a phase difference ϕ=3π/4. Such a bound state
double-pulse operation is sometimes referred to as a ϕ=3π/4 doublets [111]. Well separated
pairs by up to few picoseconds, with equal or up to 4 times different energy content were also
observed in this laser.
-1.0 -0.5 0.0 0.5 1.00.0
0.2
0.4
0.6
0.8
1.0
1.2
1950 2000 2050 21000.0
0.2
0.4
0.6
0.8
1.0
1.2(a)
2G on CaF2
2 bounces
0.2% OC
Inte
nsit
y [
a.u
.]
Delay [ps]
measured
sech2 fit
P= 100 fs
T = 433 fs
(b) measured
simulation
Sp
ectr
al
inte
nsit
y [
a.u
.]
Wavelength [nm]
Fig. 5.31 AC trace (a) and optical spectrum (b) for the double-pulse regime of the Tm:MgW laser.
The simulated spectrum in (b) is calculated assuming equal amplitude of two 100-fs long sech2-
shaped pulses separated by 433 fs with a relative phase of ϕ = 3π/4 corresponding to a bound state.
1950 2000 2050 21000.0
0.2
0.4
0.6
0.8
1.0
1.2
0
Sp
ectr
al
inte
ns
ity [
a.u
.]
Wavelength [nm]
Fig. 5.32 Calculated spectra assuming two equal in amplitude 100-fs long sech
2-shaped pulses
with a separation of 433 fs. ϕ indicates the phase difference of the two pulses.
The 4 bounce configuration which introduced a round-trip GDD around −1235 fs2 led to
the shortest pulse of p = 86 fs (0.5% OC) at 2.017 µm. For more negative GDD (6 bounce
configuration) the pulses started to broaden. Figure 5.33 shows the AC trace of the shortest
pulse achieved together with a longer scale measurement up to 50 ps (inset) as a proof for
single pulse operation. The corresponding spectral width of 53 nm (Fig. 5.34d) results in TBP
= 0.335 which is very close to the Fourier limit. Note that broad Raman peaks were also
observed around 2.200 µm which is related to the broad spectral extent of the pulse.

Chapter 5 Passively mode-locked 2-µm lasers: experimental results
100
-0.4 -0.2 0.0 0.2 0.40.0
0.2
0.4
0.6
0.8
1.0
-20-10 0 10 20
2G on CaF2
4 bounces
0.5% OC
measured
86 fs sech2 fit
93 fs retrieved
Inte
ns
ity [
a.u
.]
Delay [ps]
Delay [ps]
Fig. 5.33 AC trace (black symbols) of the shortest pulse and fit (red line) assuming a sech
2-pulse
shape. The dashed blue line is the AC of the retrieved FROG trace. Inset: AC trace in a 50 ps time
window.
0.0
0.2
0.4
0.6
0.8
1.0
-200 -100 0 100 2000.0
0.5
1.0
1.5
0.0
0.2
0.4
0.6
0.8
1.0
2000 2100 22000.0
0.5
1.0
1.5
(c)
Inte
nsit
y [
a.u
.]
R= 93fs
Fourier limit
retrieved
F = 83 fs
Ph
ase [
rad
]
Delay [fs]
(d)
Sp
ectr
al
inte
nsit
y [
a.u
.]
measured
retrieved
phase
Wavelength [nm]
Ph
ase [
rad
]= 53 nm
phase
Fig. 5.34 Measured (a) and retrieved (b) SHG-FROG trace, together with the derived temporal (c)
and spectral (d) intensity and phase (green curve: directly measured spectrum by an InGaAs
spectrometer). τR: retrieved pulse duration, τF: Fourier limit pulse duration.

5.4 Femtosecond Tm:MgW laser
101
The shortest pulses were characterized also by second-harmonic generation frequency
resolved gating (SHG-FROG) technique using a 1 mm thick type-I LiNbO3 crystal.
Figure 5.34 shows the measured FROG trace (a) next to the retrieved FROG trace (b),
together with the derived temporal (c) and spectral (d) intensity and phase. From the FROG-
retrieval, a pulse duration of 93 fs was obtained with an almost symmetric pulse shape. The
derived pulse shape and duration were in excellent agreement with the directly measured
autocorrelation trace, cf. Fig. 5.33. The spectral width resulting from the FROG retrieval was
53 nm, coinciding with the one estimated from the directly measured spectrum, cf. Fig. 5.34d.
The FROG error on a 64×64 grid size was 0.004. The residual linear chirp parameter was
derived from a parabolic fit to the spectral phase whereby its sign was confirmed by placing
additional CaF2 plates in front of the FROG setup. Doing so, a value of −640 fs2 was obtained
which is consistent with the operation of ultrashort pulse oscillators in the negative GDD
regime for maximum stability.
0.0 0.2 0.4 0.6 0.8 1.0
-80
-60
-40
-20
0
75.8 75.9 76.0 76.1
-100
-80
-60
-40
-20
0
RBW = 30 kHz
RF
po
wer
den
sit
y [
dB
m]
Frequency [GHz]
(a)R
F p
ow
er
den
sit
y [
dB
m]
RBW = 100 Hz
Frequency [MHz]
(b)
80 dBc
Fig. 5.35 RF spectra of the mode-locked Tm:MgW with 2G on CaF2, 4 bounce GDD
compensation and the 0.5% OC: (a) 1 GHz wide-span and (b) fundamental beat note in a 300 kHz
wide span. RBW: resolution bandwidth.
To verify the stability of the mode-locked Tm:MgW laser, RF spectra were recorded in
different span ranges. The results for the shortest pulse configuration are presented in
Fig. 5.35. The harmonic beat notes show almost constant extinction ratio (Fig. 5.35a) whereas
the fundamental beat note at 75.95 MHz displays an extinction ratio of 80 dB above the
carrier (Fig. 5.35b). Such an extinction ratio was typical also for the other stable single pulse
operation regimes included in Table 5.7.
5.4.4 Summary of the mode-locked Tm:MgW laser results
Table 5.8 summarizes the best results achieved in terms of pulse duration with the mode-
locked Tm:MgW lasers. Although GDD compensation was attempted with the SESAM
mode-locked Tm:MgW laser this did not result in pulse shortening and no improvement of the
TBP could be achieved either.

Chapter 5 Passively mode-locked 2-µm lasers: experimental results
102
Table 5.8 Mode-locking results achieved with the Tm:MgW laser. PP and CM stand for prism pair
and chirped mirrors for intracavity GDD (group delay dispersion) compensation, respectively. p:
pulse duration (FWHM), L: laser wavelength, : bandwidth (FWHM), Pabs: absorbed power, Pout:
average output power, frep: repetition rate, SA: saturable absorber, OC: output coupler.
SA GDD τp
[fs]
λL
[nm]
Δλ
[nm]
Pabs
[W]
Pout
[mW]
frep
[MHz]
OC
[%]
SESAM − 997 2021 7.6 0.8 30 104.9 1.5
SWCNTs
PP 242 2020 20.6 2.07 160 104.6 1.5
CM 168 2018 28.2 1.15 124 76.0 1.5
1.15 37 76.0 0.5
Graphene CM 96 2016 45.8 1.15 96 66.0 1.5
86 2017 53.0 1.15 39 76.0 0.5
Comparing with the results achieved with the mode-locked Tm:CALGO laser, one can
conclude that the available SESAMs enable sub-ps pulse generation but further optimization
of their parameters will be necessary for implementation in the 100 fs pulse duration range.
This conclusion is supported by the much shorter pulse durations achieved with the SWCNT
and graphene SAs.
5.5 Summary and comparison of the mode-locked laser results
The results obtained in this chapter are compared with the state-of-the-art in terms of pulse
duration and average power for such bulk 2-µm mode-locked lasers in Fig. 5.36.
102 103 104
102
103
Literature
Tm:LuAG
Tm,Ho:YAG
Tm:CALYO
Tm:CALGO
Tm:KLuW
Tm:Lu2O3
This work:
Ceramics
Tm:YAG
Tm:LuAG
Ho:YAG
Crystals
Tm:CALGO
Tm:MgW
Avera
ge o
utp
ut
po
wer
[mW
]
Pulse duration [fs]
Fig. 5.36 Overview of the state-of-the-art concerning passively mode-locked bulk 2 μm lasers.
Table 5.9 presents a complete compilation of the mode-locking results obtained with such
lasers from the literature and the present work. Comparing the host materials, it can be seen

5.5 Summary and comparison of the mode-locked laser results
103
that the best results in terms of shortest pulses were obtained with glass, tungstates,
sesquioxides as well as CALGO and CALYO. This is mainly attributed to the flat and smooth
gain spectra profiles as discussed in Chapter 2. The physical factors contributing to such
advantageous gain profiles can be identified as inhomogeneous broadening due to the
existence of multiple sites or distortion of the crystal field around the dopant ion. However,
anisotropic materials offer also additional flexibility is selecting the most advantageous
orientation.
Table 5.9 Summary of mode-locked Tm and Ho laser results (from the literature and this work).
PP and CM stand for prism pair and chirped mirrors for intracavity GDD (group delay dispersion)
compensation, respectively. p: pulse duration (FWHM), L: laser wavelength, : bandwidth
(FWHM), Pout: average output power, frep: repetition rate, SA: saturable absorber.
Hosts Material
Form SA GDD
τp
λL
[nm]
Δλ
[nm]
Pout
[mW]
frep
[MHz]
Ho:YAG [112] Crystal Active No 570 ps NA NA NA NA
Cr,Tm:YAG [113] Crystal Active No 45 ps 2013 0.22 160 62
Tm:KLuW [80] Crystal SWCNTs No 9.7 ps 1944 0.45 240 126
Tm:GPNG [142] Glass GaSb SESAM PP 410 fs 1997 10.4 84 222
Tm:KYW [143] Crystal GaSb SESAM PP 386 fs 2029 11.14 235 97
Tm:LuAG [130] Crystal GaAs SESAM No 38 ps 2023 0.42 1210 129
Tm,Ho:YAG [132] Crystal GaSb SESAM CM 21ps 2091 2.6 63 107
Tm:CALYO [138] Crystal GaAs SESAM No 35 ps 1959 3.0 830 145
Tm:CALGO [139] Crystal GaAs SESAM No 27 ps 1950 2.0 330 129
Tm:Lu2O3 [123] Crystal SWCNTs PP 175 fs 2070 27.4 36 88
Tm:KLuW [124] Crystal SWCNTs PP 141 fs 2037 26.5 26 88
This work:
Tm:YAG Ceramic GaSb SESAM PP 3 ps 2012 2.5 140 89
Tm:LuAG Ceramic GaSb SESAM PP 3 ps 2022 2.5 270 93
Ho:YAG Ceramic GaSb SESAM No 2-16 ps 2059-
2121
2.6-
0.8
250-
28 83
Tm:CALGO Crystal GaSb SESAM PP 646 fs 2021 9.2 58 101
Tm:MgW Crystal GaSb SESAM No 997 fs 2021 7.6 30 105
SWCNTs PP
CM
242 fs
168 fs
2020
2018
20.6
28.2
160
124
105
76
Graphene CM 86 fs 2017 53 39 76

Chapter 5 Passively mode-locked 2-µm lasers: experimental results
104
The other essential aspect is related to the SA applied. Due to the faster relaxation time of
the GaSb-based SESAMs used in the present work, the pulse durations with the same active
media (garnets as well as CALGO) could be significantly improved by 1-2 orders of
magnitude, cf. Fig. 5.36. However, the shortest pulses are generated using carbon
nanostructure based SAs. Compared to SWCNTs, graphene seems more promising since the
modulation depth can be easily changed and controlled by transfer of a different number of
layers onto the substrate as discussed in Chapter 3.
An important factor which was not discussed in detail in this chapter but was essential in
selecting the active materials is the emission wavelength. Host materials that help to naturally
select wavelengths above 2 µm are advantageous for femtosecond pulse generation because
one can automatically avoid problems with air absorption and dispersion. This was the case
with all the crystals and ceramics studied in this work, cf. Table 5.9. Operation below 2 µm
normally results in narrower spectra of the mode-locked laser supporting only picosecond
pulses while shifting the spectrum by wavelength selective elements (e.g. by the OC) might
also restrict the spectrum. Operation with nitrogen purging was attempted with some of the
lasers studied in this work but was not effective.
The best result in the present work was achieved using chirped mirrors for GDD
compensation. Although they do not permit continuous control of the intracavity GDD, the
lower insertion losses and the relaxed alignment procedure seem to be more important
advantages.

105
Chapter 6
Conclusion and outlook
In this work, novel solid-state laser host materials doped with Tm and Ho ions were studied
for ultrashort pulse generation at ~ 2 µm in the regime of passive mode-locking. Combining
their advantageous spectroscopic properties with novel saturable absorbers such as GaSb
SESAMs, SWCNTs and graphene, successful self-starting and steady-state mode-locked
operation was achieved with various 2 µm lasers for the first time. The main achievements
and findings of the present work can be summarized as follows:
Complete spectroscopic characterization of 4 novel solid-state laser materials for the
2 μm spectral range, including 2 garnet ceramics (Tm:LuAG and Ho:YAG), and 2
single crystals (Tm:CALGO and Tm:MgW).
Successful demonstration of the potential of transparent laser ceramics combined with
near-surface QW design GaSb-based SESAMs for mode-locking around 2 μm
achieving record short pulse durations for these materials (in comparison with their
crystalline counterparts).
Shortest pulse durations generated employing novel SAs around 2 μm: GaSb-based
SESAM (Tm:CALGO) and graphene (Tm:MgW). Compared with SWCNT, graphene
benefits from the possibility to control the modulation depth.
As shown in Fig. 6.1, after more than 35 years of development, this work produced the
first sub-100 fs (appr. 12 optical cycles) pulses in the 2 μm spectral range from a
mode-locked bulk solid state laser.
1980 1985 1990 2005 2010 2015 2020
102
103
104
105
Tm:KLuW
Tm:GPNG
Tm:MgW
Tm:Lu2O3
Active mode-locking
Passive mode-locking
Cr,Tm:YAG
Ho:YAG
Tm:KLuW
Tm:KYWPu
lse d
ura
tio
n [
fs]
Year
Fig.6.1 Development of mode-locked bulk solid-state lasers at ~ 2 μm (cf. Table 5.9).

Chapter 6 Conclusion and outlook
106
Despite the first sub-100 fs pulse generation directly from a bulk solid-state laser near
2 μm, there is still a long way to go towards few cycle pulses. Possible strategies that could be
successful in reaching even shorter (sub-50 fs) pulses with such types of lasers include:
Kerr lens mode-locking because such tendency or spontaneous self-mode-locking was
not observed in the described experiments. Comparing with other spectral ranges (e.g.
1 µm) this can be interpreted as too low value of the nonlinear refractive index of the
laser materials near 2 µm. This can be expected farther from their band-gap but
literature data for this spectral range do not exist. Adding artificial self-phase-
modulation in a third cavity waist using materials with smaller but sufficient to avoid
TPA band-gap (e.g. ZnS) could eventually result in self-focusing in the mode-locked
regime. Such KLM has been achieved in Yb:YAG thin-disk lasers [144]. However
there is no report of pure Kerr lens mode-locking of such lasers near 2 μm in the
literature. Another approach to obtain Kerr lens mode-locking is to increase the
intracavity power. New cavity designs and pump sources will be needed for this and
Ho-lasers which offer in-band pumping with low heat generation seem more
promising due to the easy scalability of Tm-fiber pump lasers.
Improved SA. Compared with SWCNTs and graphene, GaSb-based SESAMs still
have a lot of room for improvement in terms of non-saturable losses and relaxation
time. By implementing them in Kerr lens mode-locked lasers they could contribute to
self-starting and stabilization while the enhanced SPM will enable the generation of
substantially shorter pulses which, from spectroscopic point of view, should be
supported by some of the laser materials studied here.
New laser hosts: There exist other laser hosts which combine the advantageous
features identified in the present work. For instance, Tm-doped cubic sesquioxides
(Lu2O3, Sc2O3 and Y2O3) naturally emit well above 2 µm and similar to YAG and
LuAG, they are suitable for laser ceramics. Moreover, they exhibit superior thermo-
mechanical characteristics. Mixed ceramics (e.g. LuaScbY2-a-bO3, a+b < 2) are
technologically easier to fabricate than mixed crystals which will facilitate the spectral
broadening due to the compositional crystal disorder.
Co-doped materials. The emission spectra of Tm and Ho ions in fact overlap and
instead of mixing hosts, one can try to mode-lock a co-doped system (i.e. a crystal or
ceramic doped with Tm and Ho). This is an idea not exploited so far for femtosecond
pulse generation. In such co-doped tunable CW lasers (pumped through the Tm ion) it
is hardly possible to assign the emission in the overlapping range. The co-doped
system is rather complex: The energy transfer plays an essential role and the doping
ratio is a crucial parameter for it. However, in-band pumping might offer an additional
degree of freedom in this case.
Pulse width reduction after amplification. Existing laser technology enables pulse
compression after amplification. Direct use of Tm-fibers for amplification of the pulse

Chapter 6 Conclusion and outlook
107
train from the mode-locked laser is not possible because the emission maximum in
glass is at much shorter wavelengths. However, the so-called single crystal fibers
(SCF) have been developed and successfully applied in other spectral regions, e.g.
with Yb-doping near 1 µm [145]. In fact these are not fibers because the laser light is
not guided but simply long (few cm) crystal rods with a diameter of the order of 1 mm
or less in which the pump light experiences internal reflection. Such SCFs benefit
from both the advantages of fibers, such as the straightforward thermal management
and high gain, and the spectroscopic and thermo-mechanical properties of single
crystals. Moreover, similar to fibers they can be applied at high repetition rates, i.e.
preserving the original repetition rate of the mode-locked laser. Suitable SCFs for the
2 µm spectral range seem such based on Tm-doped garnets or CALGO crystals.
Despite the gain narrowing effect in the process of laser amplification it is possible to
recompress the pulses to even shorter (than the initial) pulse durations. Such self-
compression towards the few-cycle limit can be achieved by simply focusing the beam
into a bulk material such as YAG [146]. The soliton mechanism required for this is
provided near 2 µm by the anomalous dispersion typical for many materials at this
wavelength. Having reached few-cycle pulse durations, one can perform carrier
envelope phase (CEP) stability measurements and implement methods for CEP
stabilization of the mode-locked laser.


109
References
1. U. Keller, Ultrafast solid-state lasers, Landolt-Börnstein, Group VIII/1B1, Laser
Physics and Applications. Subvolume B: Laser Systems. Part 1, G. Herziger, H. Weber,
and R. Proprawe, eds., (Springer, Berlin, 2007), pp. 33-167.
2. U. N. Singh, B. M. Walsh, J. Yu, M. Petros, M. J. Kavaya, T. F. Refaat, and N. P.
Barnes, "Twenty years of Tm:Ho:YLF and LuLiF laser development for global wind
and carbon dioxide active remote sensing," Opt. Mater. Express 5, 827-837 (2015).
3. K. Scholle, S. Lamrini, P. Koopmann, and P. Fuhrberg, "2 µm laser sources and their
possible applications," in Frontiers in Guided Wave Optics and Optoelectronics, B. Pal,
ed. (InTech, Rijeka, 2010), pp. 471-500.
4. J. Herrmann and B. Wilhelmi, Lasers for ultrashort light pulses (North-Holland,
Amsterdam, 1987).
5. V. Petrov, "Frequency down-conversion of solid-state laser sources to the mid-infrared
spectral range using non-oxide nonlinear crystals," Progress Quantum Electron. 42, 1-
106 (2015).
6. A. Schliesser, N. Picqué, and T. W. Hänsch, "Mid-infrared frequency combs," Nat.
Photonics 6, 440-449 (2012).
7. C. J. Saraceno, F. Emaury, C. Schriber, A. Diebold, M. Hoffmann, M. Golling, T.
Südmeyer, and U. Keller, "Toward millijoule-level high-power ultrafast thin-disk
oscillators," IEEE J. Sel. Top. Quantum Electron. 21, 106-123 (2015).
8. J.-C. Diels and W. Rudolph, Ultrashort laser pulse phenomena, 2nd
ed. (Academic press,
2006).
9. Z. Chang, Fundamentals of attosecond optics, (CRC Press, Boca Raton, FL, 2011).
10. D. Sanchez, M. Hemmer, M. Baudisch, S. L. Cousin, K. Zawilski, P. Schunemann, O.
Chalus, C. Simon-Boisson, and J. Biegert, "7 μm, ultrafast, sub-millijoule-level mid-
infrared optical parametric chirped pulse amplifier pumped at 2 μm," Optica 3, 147-150
(2016).
11. A. Baltuška, T. Fuji, and T. Kobayashi, "Controlling the carrier-envelope phase of
ultrashort light pulses with optical parametric amplifiers," Phys. Rev. Lett. 88, 133901
(2002).
12. T. Fuji, N. Ishii, C. Y. Teisset, X. Gu, Th. Metzger, A. Baltuska, N. Forget, D. Kaplan,
A. Galvanauskas, and F. Krausz, "Parametric amplification of few-cycle carrier-
envelope phase-stable pulses at 2.1 μm," Opt. Lett. 31, 1103-1105 (2006).
13. Y. Deng, A. Schwarz, H. Fattahi, M. Ueffing, X. Gu, M. Ossiander, T. Metzger, V.
Pervak, H. Ishizuki, and T. Taira, "Carrier-envelope-phase-stable, 1.2 mJ, 1.5 cycle
laser pulses at 2.1 μm," Opt. Lett. 37, 4973-4975 (2012).
14. C. Homann, M. Bradler, M. Förster, P. Hommelhoff, and E. Riedle, "Carrier-envelope
phase stable sub-two-cycle pulses tunable around 1.8 µm at 100 kHz," Opt. Lett. 37,
1673-1675 (2012).

References
110
15. A. F. Campos, A. Meijerink, C. d. M. Donegá, and O. L. Malta, "A theoretical
calculation of vibronic coupling strength: the trend in the lanthanide ion series and the
host-lattice dependence," J. Phys. Chem. Solids 61, 1489-1498 (2000).
16. I. T. Sorokina, "Crystalline mid-infrared lasers," in Solid-State Mid-Infrared Laser
Sources, Topics in Applied Physics, I. T. Sorokina and K. L. Vodopyanov, eds.
(Springer, Berlin, 2003), pp. 262-358.
17. M. Eichhorn, "Quasi-three-level solid-state lasers in the near and mid infrared based on
trivalent rare earth ions," Appl. Phys. B 93, 269-316 (2008).
18. K. Möllmann, M. Schrempel, B.-K. Yu, and W. Gellermann, "Subpicosecond and
continuous-wave laser operation of (F2+)H and (F2
+)AH color-center lasers in the 2-μm
range," Opt. Lett. 19, 960-962 (1994).
19. T. H. Maiman, "Stimulated optical radiation in ruby," Nature 187, 493-494 (1960).
20. J. O. White, "Parameters for quantitative comparison of two-, three-, and four-level
laser media, operating wavelengths, and temperatures," IEEE J. Quantum Electron. 45,
1213-1220 (2009).
21. R. C. Stoneman and L. Esterowitz, "Efficient, broadly tunable, laser-pumped Tm:YAG
and Tm:YSGG cw lasers," Opt. Lett. 15, 486-488 (1990).
22. V. A. French, R. R. Petrin, R. C. Powell, and M. Kokta, "Energy-transfer processes in
Y3Al5O12:Tm,Ho," Phys. Rev. B 46, 8018-8026 (1992).
23. M. Born and E. Wolf, Principles of optics, 7th
ed. (Cambridge University Press,
Cambridge, 1999).
24. P. Loiko, P. Segonds, P. L. Inácio, A. Peña, J. Debray, D. Rytz, V. Filippov, K.
Yumashev, M. C. Pujol, and X. Mateos, "Refined orientation of the optical axes as a
function of wavelength in three monoclinic double tungstate crystals KRE(WO4)2 (RE=
Gd, Y or Lu)," Opt. Mater. Express 6, 2984-2990 (2016).
25. A. A. Kaminskii, "Laser crystals and ceramics: recent advances," Laser Photonics Rev.
1, 93-177 (2007).
26. A. Ikesue and Y. L. Aung, "Ceramic laser materials," Nat. Photon. 2, 721-727 (2008).
27. B. M. Walsh, "Judd-Ofelt theory: principles and practices," in Advances in Spectroscopy
for Lasers and Sensing, B. Di Bartolo and O. Forte, eds. (Springer Netherlands,
Dordrecht, 2006), pp. 403-433.
28. D. E. McCumber, "Einstein relations connecting broadband emission and absorption
spectra," Phys, Rev. 136, A954-A957 (1964).
29. A. S. Yasyukevich, V. G. Shcherbitskii, V. É. Kisel', A. V. Mandrik, and N. V.
Kuleshov, "Integral method of reciprocity in the spectroscopy of laser crystals with
impurity centers," J. Appl. Spectrosc. 71, 202-208 (2004).
30. B. Aull and H. Jenssen, "Vibronic interactions in Nd: YAG resulting in nonreciprocity
of absorption and stimulated emission cross sections," IEEE J. Quantum Electron. 18,
925-930 (1982).
31. Y.-S. Yong, S. Aravazhi, S. A. Vázquez-Córdova, J. J. Carjaval, F. Díaz, J. L. Herek, S.
M. García-Blanco, and M. Pollnau, "Temperature-dependent absorption and emission of

References
111
potassium double tungstates with high ytterbium content," Opt. Express 24, 26825-
26837 (2016).
32. M. C. Pujol, M. A. Bursukova, F. Güell, X. Mateos, R. Solé, J. Gavaldà, M. Aguiló, J.
Massons, F. Díaz, P. Klopp, U. Griebner, and V. Petrov, "Growth, optical
characterization, and laser operation of a stoichiometric crystal KYb(WO4)2," Phys. Rev.
B 65, 165121 (2002).
33. H. Kühn, S. T. Fredrich-Thornton, C. Kränkel, R. Peters, and K. Petermann, "Model for
the calculation of radiation trapping and description of the pinhole method," Opt. Lett.
32, 1908-1910 (2007).
34. S. A. Payne, L. Chase, L. K. Smith, W. L. Kway, and W. F. Krupke, "Infrared cross-
section measurements for crystals doped with Er3+
, Tm3+
, and Ho3+
," IEEE J. Quantum
Electron. 28, 2619-2630 (1992).
35. J. T. Thomas, M. Tonelli, S. Veronesi, E. Cavalli, X. Mateos, V. Petrov, U. Griebner, J.
Li, Y. Pan, and J. Guo, "Optical spectroscopy of Tm3+
:YAG transparent ceramics," J.
Phys. D: Appl. Phys. 46, 375301 (2013).
36. N. P. Barnes, M. G. Jani, and R. L. Hutcheson, "Diode-pumped, room-temperature
Tm:LuAG laser," Appl. Opt. 34, 4290-4294 (1995).
37. K. Scholle, E. Heumann, and G. Huber, "Single mode Tm and Tm,Ho:LuAG lasers for
LIDAR applications," Laser Phys. Lett. 1, 285-290 (2004).
38. R. D. Shannon, "Revised effective ionic radii and systematic studies of interatomic
distances in halides and chalcogenides," Acta Cryst. A 32, 751-767 (1976).
39. S. Lamrini, P. Koopmann, M. Schäfer, K. Scholle, and P. Fuhrberg, "Efficient high-
power Ho:YAG laser directly in-band pumped by a GaSb-based laser diode stack at 1.9
μm," Appl. Phys. B 106, 315-319 (2011).
40. R. Lan, X. Mateos, Y. Wang, J. M. Serres, P. Loiko, J. Li, Y. Pan, U. Griebner, and V.
Petrov, "Semiconductor saturable absorber Q-switching of a holmium micro-laser," Opt.
Express 25, 4579-4584 (2017).
41. B. M. Walsh, G. W. Grew, and N. P. Barnes, "Energy levels and intensity parameters of
ions in Y3Al5O12 and Lu3Al5O12," J. Phys. Chem. Solids 67, 1567-1582 (2006).
42. P. O. Petit, J. Petit, P. Goldner, and B. Viana, "Inhomogeneous broadening of optical
transitions in Yb: CaYAlO4," Opt. Mater. 30, 1093-1097 (2008).
43. P. Sévillano, P. Georges, F. Druon, D. Descamps, and E. Cormier, "32-fs Kerr-lens
mode-locked Yb:CaGdAlO4 oscillator optically pumped by a bright fiber laser," Opt.
Lett. 39, 6001-6004 (2014).
44. J. Ma, H. Huang, K. Ning, X. Xu, G. Xie, L. Qian, K. P. Loh, and D. Tang, "Generation
of 30 fs pulses from a diode-pumped graphene mode-locked Yb:CaYAlO4 laser," Opt.
Lett. 41, 890-893 (2016).
45. Q. Hu, Z. Jia, C. Tang, N. Lin, J. Zhang, N. Jia, S. Wang, X. Zhao, and X. Tao, "The
origin of coloration of CaGdAlO4 crystals and its effect on their physical properties,"
CrystEngComm. 19, 537-545 (2017).

References
112
46. J. Di, X. Xu, C. Xia, Q. Sai, D. Zhou, Z. Lv, and J. Xu, "Growth and spectra properties
of Tm, Ho doped and Tm, Ho co-doped CaGdAlO4 crystals," J. Lumin. 155, 101-107
(2014).
47. P. Loiko, X. Mateos, S. Y. Choi, F. Rotermund, C. Liebald, M. Peltz, S. Vernay, D.
Rytz, Y. Wang, M. Kemnitzer, A. Agnesi, E. Vilejshikova, K. Yumashev, U. Griebner,
and V. Petrov, "Tm:CaGdAlO4: spectroscopy, microchip laser and passive Q-switching
by carbon nanostructures," Proc. SPIE 10082, 1008228 (2017).
48. S. Gao, Z. You, J. Xu, Y. Sun, and C. Tu, "Continuous wave laser operation of Tm and
Ho co-doped CaYAlO4 and CaGdAlO4 crystals," Mater. Lett. 141, 59-62 (2015).
49. V. Petrov, M. Cinta Pujol, X. Mateos, Ò. Silvestre, S. Rivier, M. Aguiló, R. M. Solé, J.
Liu, U. Griebner, and F. Díaz, "Growth and properties of KLu(WO4)2, and novel
ytterbium and thulium lasers based on this monoclinic crystalline host," Laser Photonics
Rev. 1, 179-212 (2007).
50. V. Kravchenko, "Crystal structure of the monoclinic form of magnesium tungstate
MgWO4," Journal of Structural Chemistry 10, 139-140 (1969).
51. E. Cavalli, A. Belletti, and M. Brik, "Optical spectra and energy levels of the Cr3+
ions
in MWO4 (M= Mg, Zn, Cd) and MgMoO4 crystals," J. Phys. Chem. Solids 69, 29-34
(2008).
52. L. Zhang, H. Lin, G. Zhang, X. Mateos, J. M. Serres, M. Aguiló, F. Díaz, U. Griebner,
V. Petrov, Y. Wang, P. Loiko, E. Vilejshikova, K. Yumashev, Z. Lin, and W. Chen,
"Crystal growth, optical spectroscopy and laser action of Tm3+
-doped monoclinic
magnesium tungstate," Opt. Express 25, 3682-3693 (2017).
53. L. Zhang, Y. Huang, S. Sun, F. Yuan, Z. Lin, and G. Wang, "Thermal and spectral
characterization of Cr3+
:MgWO4—a promising tunable laser material," J. Lumin. 169,
Part A, 161-164 (2016).
54. L. Zhang, W. Chen, J. Lu, H. Lin, L. Li, G. Wang, G. Zhang, and Z. Lin,
"Characterization of growth, optical properties, and laser performance of monoclinic
Yb:MgWO4 crystal," Opt. Mater. Express 6, 1627-1634 (2016).
55. F. A. Danevich, D. M. Chernyak, A. M. Dubovik, B. V. Grinyov, S. Henry, H. Kraus, V.
M. Kudovbenko, V. B. Mikhailik, L. L. Nagornaya, R. B. Podviyanuk, O. G. Polischuk,
I. A. Tupitsyna, and Y. Y. Vostretsov, "MgWO4–A new crystal scintillator," Nucl.
Instrum. Meth. A 608, 107-115 (2009).
56. K. Beil, S. T. Fredrich-Thornton, F. Tellkamp, R. Peters, C. Kränkel, K. Petermann, and
G. Huber, "Thermal and laser properties of Yb:LuAG for kW thin disk lasers," Opt.
Express 18, 20712-20722 (2010).
57. A. J. DeMaria, D. A. Stetser, and H. Heynau, "Self mode-locking of lasers with
saturable absorbers," Appl. Phys. Lett. 8, 174-176 (1966).
58. U. Keller, K. J. Weingarten, F. X. Kartner, D. Kopf, B. Braun, I. D. Jung, R. Fluck, C.
Honninger, N. Matuschek, and J. A. d. Au, "Semiconductor saturable absorber mirrors
(SESAM's) for femtosecond to nanosecond pulse generation in solid-state lasers," IEEE
J. Sel. Top. Quantum Electron. 2, 435-453 (1996).

References
113
59. U. Keller, "Recent developments in compact ultrafast lasers," Nature 424, 831-838
(2003).
60. W. B. Cho, J. H. Yim, S. Y. Choi, S. Lee, A. Schmidt, G. Steinmeyer, U. Griebner, V.
Petrov, D.-I. Yeom, K. Kim, and F. Rotermund, "Boosting the nonlinear optical
response of carbon nanotube saturable absorbers for broadband mode-locking of bulk
lasers," Adv. Funct. Mater. 20, 1937-1943 (2010).
61. F. Bonaccorso, Z. Sun, T. Hasan, and A. C. Ferrari, "Graphene photonics and
optoelectronics," Nat. Photon. 4, 611-622 (2010).
62. J. Ma, G. Xie, P. Lv, W. Gao, P. Yuan, L. Qian, U. Griebner, V. Petrov, H. Yu, H.
Zhang, and J. Wang, "Wavelength-versatile graphene-gold film saturable absorber
mirror for ultra-broadband mode-locking of bulk lasers," Sci. Rep. 4, 5016 (2014).
63. M. Haiml, R. Grange, and U. Keller, "Optical characterization of semiconductor
saturable absorbers," Appl. Phys. B 79, 331-339 (2004).
64. G. Xing, H. Guo, X. Zhang, T. C. Sum, and C. H. A. Huan, "The Physics of ultrafast
saturable absorption in graphene," Opt. Express 18, 4564-4573 (2010).
65. R. L. Sutherland, Handbook of nonlinear optics, 2nd
ed. (Marcel Dekker, New York, NY,
2003).
66. E. R. Thoen, E. M. Koontz, M. Joschko, P. Langlois, T. R. Schibli, F. X. Kärtner, E. P.
Ippen, and L. A. Kolodziejski, "Two-photon absorption in semiconductor saturable
absorber mirrors," Appl. Phys. Lett. 74, 3927-3929 (1999).
67. U. Keller, T. H. Chiu, and J. F. Ferguson, "Self-starting and self-Q-switching dynamics
of passively mode-locked Nd:YLF and Nd:YAG lasers," Opt. Lett. 18, 217-219 (1993).
68. M. J. Lederer, B. Luther-Davies, H. H. Tan, C. Jagadish, M. Haiml, U. Siegner, and U.
Keller, "Nonlinear optical absorption and temporal response of arsenic- and oxygen-
implanted GaAs," Appl. Phys. Lett. 74, 1993-1995 (1999).
69. J. Paajaste, S. Suomalainen, R. Koskinen, A. Härkönen, G. Steinmeyer, and M. Guina,
"GaSb-based semiconductor saturable absorber mirrors for mode-locking 2 µm
semiconductor disk lasers," phys. stat. sol. (c) 9, 294-297 (2012).
70. U. Keller, W. H. Knox, and H. Roskos, "Coupled-cavity resonant passive mode-locked
Ti:sapphire laser," Opt. Lett. 15, 1377-1379 (1990).
71. U. Keller, D. A. B. Miller, G. D. Boyd, T. H. Chiu, J. F. Ferguson, and M. T. Asom,
"Solid-state low-loss intracavity saturable absorber for Nd:YLF lasers: an antiresonant
semiconductor Fabry–Perot saturable absorber," Opt. Lett. 17, 505-507 (1992).
72. L. R. Brovelli, I. D. Jung, D. Kopf, M. Kamp, M. Moser, F. X. Kärtner, and U. Keller,
"Self-starting soliton modelocked Ti-sapphire laser using a thin semiconductor saturable
absorber," Electron. Lett. 31, 287-289 (1995).
73. J. Paajaste, S. Suomalainen, A. Härkönen, U. Griebner, G. Steinmeyer, and M. Guina,
"Absorption recovery dynamics in 2 µm GaSb-based SESAMs," J. Phys. D: Appl. Phys.
47, 065102 (2014).

References
114
74. Q. Bao, H. Zhang, Y. Wang, Z. Ni, Y. Yan, Z. X. Shen, K. P. Loh, and D. Y. Tang,
"Atomic-layer graphene as a saturable absorber for ultrafast pulsed lasers," Adv. Funct.
Mater. 19, 3077-3083 (2009).
75. A. K. Geim and K. S. Novoselov, "The rise of graphene," Nat. Mater. 6, 183-191 (2007).
76. M. J. Bronikowski, P. A. Willis, D. T. Colbert, K. A. Smith, and R. E. Smalley, "Gas-
phase production of carbon single-walled nanotubes from carbon monoxide via the
HiPco process: A parametric study," J. Vac. Sci. Technol. A 19, 1800-1805 (2001).
77. J. H. Yim, W. B. Cho, S. Lee, Y. H. Ahn, K. Kim, H. Lim, G. Steinmeyer, V. Petrov, U.
Griebner, and F. Rotermund, "Fabrication and characterization of ultrafast carbon
nanotube saturable absorbers for solid-state laser mode locking near 1 μm," Appl. Phys.
Lett. 93, 161106 (2008).
78. S. M. Bachilo, M. S. Strano, C. Kittrell, R. H. Hauge, R. E. Smalley, and R. B.
Weisman, "Structure-assigned optical spectra of single-walled carbon nanotubes,"
Science 298, 2361-2366 (2002).
79. A. Schmidt, "Carbon nanostructures for femtosecond mode-locked lasers in the 1.0 to
2.1 micrometer wavelength range," Dissertation (Humboldt University, Berlin, 2016).
80. W. B. Cho, A. Schmidt, J. H. Yim, S. Y. Choi, S. Lee, F. Rotermund, U. Griebner, G.
Steinmeyer, V. Petrov, X. Mateos, M. C. Pujol, J. J. Carvajal, M. Aguiló, and F. Díaz,
"Passive mode-locking of a Tm-doped bulk laser near 2 µm using a carbon nanotube
saturable absorber," Opt. Express 17, 11007-11012 (2009).
81. F. Rotermund, W. B. Cho, S. Y. Choi, I. H. Baek, J. H. Yim, S. Lee, A. Schmidt, G.
Steinmeyer, U. Griebner, and D.-I. Yeom, "Mode-locking of solid-state lasers by single-
walled carbon-nanotube based saturable absorbers," Quantum Electron. 42, 663-670
(2012).
82. I. H. Baek, S. Y. Choi, H. W. Lee, W. B. Cho, V. Petrov, A. Agnesi, V. Pasiskevicius,
D.-I. Yeom, K. Kim, and F. Rotermund, "Single-walled carbon nanotube saturable
absorber assisted high-power mode-locking of a Ti:sapphire laser," Opt. Express 19,
7833-7838 (2011).
83. R. R. Nair, P. Blake, A. N. Grigorenko, K. S. Novoselov, T. J. Booth, T. Stauber, N. M.
R. Peres, and A. K. Geim, "Fine structure constant defines visual transparency of
graphene," Science 320, 1308 (2008).
84. Q. Bao, H. Zhang, Z. Ni, Y. Wang, L. Polavarapu, Z. Shen, Q.-H. Xu, D. Tang, and K.
P. Loh, "Monolayer graphene as a saturable absorber in a mode-locked laser," Nano Res.
4, 297-307 (2011).
85. F. Zhang, S. Han, Y. Liu, Z. Wang, and X. Xu, "Dependence of the saturable absorption
of graphene upon excitation photon energy," Appl. Phys. Lett. 106, 091102 (2015).
86. W. B. Cho, J. W. Kim, H. W. Lee, S. Bae, B. H. Hong, S. Y. Choi, I. H. Baek, K. Kim,
D.-I. Yeom, and F. Rotermund, "High-quality, large-area monolayer graphene for
efficient bulk laser mode-locking near 1.25 μm," Opt. Lett. 36, 4089-4091 (2011).
87. H. Yang, X. Feng, Q. Wang, H. Huang, W. Chen, A. T. S. Wee, and W. Ji, "Giant two-
photon absorption in bilayer graphene," Nano Lett. 11, 2622-2627 (2011).

References
115
88. V. Aleksandrov, A. Gluth, V. Petrov, I. Buchvarov, G. Steinmeyer, J. Paajaste, S.
Suomalainen, A. Härkönen, M. Guina, X. Mateos, F. Díaz, and U. Griebner, "Mode-
locked Tm,Ho:KLu(WO4)2 laser at 2060 nm using InGaSb-based SESAMs," Opt.
Express 23, 4614-4619 (2015).
89. W. Rudolph and B. Wilhelmi, Light pulse compression, (Harwood Academic Publishers,
New York, NY, 1989).
90. R. L. Fork, O. E. Martinez, and J. P. Gordon, "Negative dispersion using pairs of
prisms," Opt. Lett. 9, 150-152 (1984).
91. M. Daimon and A. Masumura, "High-accuracy measurements of the refractive index
and its temperature coefficient of calcium fluoride in a wide wavelength range from 138
to 2326 nm," Appl. Opt. 41, 5275-5281 (2002).
92. M. J. Dodge, "Refractive properties of magnesium fluoride," Appl. Opt. 23, 1980-1985
(1984).
93. D. E. Zelmon, D. L. Small, and R. Page, "Refractive-index measurements of undoped
yttrium aluminum garnet from 0.4 to 5.0 μm," Appl. Opt. 37, 4933-4935 (1998).
94. C. A. Klein, "Room-temperature dispersion equations for cubic zinc sulfide," Appl. Opt.
25, 1873-1875 (1986).
95. B. Tatian, "Fitting refractive-index data with the Sellmeier dispersion formula," Appl.
Opt. 23, 4477-4485 (1984).
96. I. H. Malitson, "Interspecimen comparison of the refractive index of fused silica," J. Opt.
Soc. Am. 55, 1205-1209 (1965).
97. R. Szipöcs, K. Ferencz, C. Spielmann, and F. Krausz, "Chirped multilayer coatings for
broadband dispersion control in femtosecond lasers," Opt. Lett. 19, 201-203 (1994).
98. H. A. Haus, "Theory of mode locking with a slow saturable absorber," IEEE J. Quantum
Electron. 11, 736-746 (1975).
99. H. A. Haus, "Theory of mode locking with a fast saturable absorber," J. Appl. Phys. 46,
3049-3058 (1975).
100. H. A. Haus, "Mode-locking of lasers," IEEE J. Sel. Top. Quantum Electron. 6, 1173-
1185 (2000).
101. O. E. Martinez, R. L. Fork, and J. P. Gordon, "Theory of passively mode-locked lasers
including self-phase modulation and group-velocity dispersion," Opt. Lett. 9, 156-158
(1984).
102. V. Petrov, D. Georgiev, J. Herrmann, and U. Stamm, "Theory of cw passive mode-
locking of solid state lasers with addition of nonlinear index and group velocity
dispersion," Opt. Commun. 91, 123-130 (1992).
103. J.-C. M. Diels, J. J. Fontaine, I. C. McMichael, and F. Simoni, "Control and
measurement of ultrashort pulse shapes (in amplitude and phase) with femtosecond
accuracy," Appl. Opt. 24, 1270-1282 (1985).
104. C. Hönninger, R. Paschotta, F. Morier-Genoud, M. Moser, and U. Keller, "Q-switching
stability limits of continuous-wave passive mode locking," J. Opt. Soc. Am. B 16, 46-56
(1999).

References
116
105. H. A. Haus, "Parameter ranges for CW passive mode locking," IEEE J. Quantum
Electron. 12, 169-176 (1976).
106. F. X. Kärtner, L. R. Brovelli, D. Kopf, M. Kamp, I. Calasso, and U. Keller, "Control of
solid state laser dynamics by semiconductor devices," Opt. Eng. 34, 2024-2036 (1995).
107. D. Von der Linde, "Characterization of the noise in continuously operating mode-locked
lasers," Appl. Phys. B 39, 201-217 (1986).
108. F. Salin, P. Grangier, G. Roger, and A. Brun, "Observation of high-order solitons
directly produced by a femtosecond ring laser," Phys. Rev. Lett. 56, 1132-1135 (1986).
109. U. Keller, J. A. Valdmanis, M. C. Nuss, and A. M. Johnson, "53 ps pulses at 1.32 µm
from a harmonic mode-locked Nd: YAG laser," IEEE J. Quantum Electron. 24, 427-430
(1988).
110. J. Aus der Au, D. Kopf, F. Morier-Genoud, M. Moser, and U. Keller, "60-fs pulses from
a diode-pumped Nd: glass laser," Opt. Lett. 22, 307-309 (1997).
111. M. J. Lederer, B. Luther-Davies, H. H. Tan, C. Jagadish, N. N. Akhmediev, and J. M.
Soto-Crespo, "Multipulse operation of a Ti:sapphire laser mode locked by an ion-
implanted semiconductor saturable-absorber mirror," J. Opt. Soc. Am. B 16, 895-904
(1999).
112. N. P. Barnes and D. J. Gettemy, "Pulsed Ho:YAG oscillator and amplifier," IEEE J.
Quantum Electron. 17, 1303-1308 (1981).
113. F. Heine, E. Heumann, G. Huber, and K. L. Schepler, "Mode locking of room-
temperature cw thulium and holmium lasers," Appl. Phys. Lett. 60, 1161-1162 (1992).
114. J. F. Pinto, G. H. Rosenblatt, and L. Esterowitz, "Continuous-wave mode-locked 2-μm
Tm:YAG laser," Opt. Lett. 17, 731-732 (1992).
115. L. E. Nelson, E. P. Ippen, and H. A. Haus, "Broadly tunable sub-500 fs pulses from an
additive-pulse mode-locked thulium-doped fiber ring laser," Appl. Phys. Lett. 67, 19-21
(1995).
116. Y. Nomura and T. Fuji, "Sub-50-fs pulse generation from thulium-doped ZBLAN fiber
laser oscillator," Opt. Express 22, 12461-12466 (2014).
117. Y. Nomura and T. Fuji, "Generation of watt-class, sub-50 fs pulses through nonlinear
spectral broadening within a thulium-doped fiber amplifier," Opt. Express 25, 13691-
13696 (2017).
118. M. C. Stumpf, S. Pekarek, A. E. H. Oehler, T. Südmeyer, J. M. Dudley, and U. Keller,
"Self-referencable frequency comb from a 170-fs, 1.5-μm solid-state laser oscillator,"
Appl. Phys. B 99, 401-408 (2010).
119. A. A. Lagatsky, F. Fusari, S. Calvez, S. V. Kurilchik, V. E. Kisel, N. V. Kuleshov, M. D.
Dawson, C. T. A. Brown, and W. Sibbett, "Femtosecond pulse operation of a Tm,Ho-
codoped crystalline laser near 2 μm," Opt. Lett. 35, 172-174 (2010).
120. A. A. Lagatsky, X. Han, M. D. Serrano, C. Cascales, C. Zaldo, S. Calvez, M. D.
Dawson, J. A. Gupta, C. T. A. Brown, and W. Sibbett, "Femtosecond (191 fs)
NaY(WO4)2 Tm,Ho-codoped laser at 2060 nm," Opt. Lett. 35, 3027-3029 (2010).

References
117
121. A. A. Lagatsky, P. Koopmann, P. Fuhrberg, G. Huber, C. T. A. Brown, and W. Sibbett,
"Passively mode locked femtosecond Tm:Sc2O3 laser at 2.1 μm," Opt. Lett. 37, 437-439
(2012).
122. A. A. Lagatsky, O. L. Antipov, and W. Sibbett, "Broadly tunable femtosecond
Tm:Lu2O3 ceramic laser operating around 2070 nm," Opt. Express 20, 19349-19354
(2012).
123. A. Schmidt, P. Koopmann, G. Huber, P. Fuhrberg, S. Y. Choi, D.-I. Yeom, F.
Rotermund, V. Petrov, and U. Griebner, "175 fs Tm:Lu2O3 laser at 2.07 µm mode-
locked using single-walled carbon nanotubes," Opt. Express 20, 5313-5318 (2012).
124. A. Schmidt, S. Y. Choi, D.-I. Yeom, F. Rotermund, X. Mateos, M. Segura, F. Diaz, V.
Petrov, and U. Griebner, "Femtosecond pulses near 2 µm from a Tm:KLuW laser mode-
locked by a single-walled carbon nanotube saturable absorber," Appl. Phys. Express 5,
092704 (2012).
125. D. M. Kane, "Astigmatism compensation in off-axis laser resonators with two or more
coupled foci," Opt. Commun. 71, 113-118 (1989).
126. M. Wittmann, A. Penzkofer, and W. Bäumler, "Generation of frequency tunable
femtosecond pulses in a cw pumped linear dispersion-balanced passive mode-locked
Rhodamine 6G dye laser," Opt. Commun. 90, 182-192 (1992).
127. W.-X. Zhang, Y.-B. Pan, J. Zhou, W.-B. Liu, J. Li, Y.-W. Zou, and Z.-Y. Wei,
"Preparation and characterization of transparent Tm:YAG ceramics," Ceram. Int. 37,
1133-1137 (2011).
128. A. Gluth, Y. Wang, V. Petrov, J. Paajaste, S. Suomalainen, A. Härkönen, M. Guina, G.
Steinmeyer, X. Mateos, S. Veronesi, M. Tonelli, J. Li, Y. Pan, J. Guo, and U. Griebner,
"GaSb-based SESAM mode-locked Tm:YAG ceramic laser at 2 µm," Opt. Express 23,
1361-1369 (2015).
129. J. Ma, G. Xie, J. Zhang, P. Yuan, D. Tang, and L. Qian, "Passively mode-locked
Tm:YAG ceramic laser based on graphene," IEEE J. Sel. Top. Quantum Electron. 21,
1100806 (2015).
130. T. Feng, K. Yang, J. Zhao, S. Zhao, W. Qiao, T. Li, T. Dekorsy, J. He, L. Zheng, Q.
Wang, X. Xu, L. Su, and J. Xu, "1.21 W passively mode-locked Tm:LuAG laser," Opt.
Express 23, 11819-11825 (2015).
131. K. Yang, H. Bromberger, H. Ruf, H. Schäfer, J. Neuhaus, T. Dekorsy, C. V.-B. Grimm,
M. Helm, K. Biermann, and H. Künzel, "Passively mode-locked Tm,Ho:YAG laser at 2
µm based on saturable absorption of intersubband transitions in quantum wells," Opt.
Express 18, 6537-6544 (2010).
132. K. Yang, D. Heinecke, J. Paajaste, C. Kölbl, T. Dekorsy, S. Suomalainen, and M. Guina,
"Mode-locking of 2 μm Tm,Ho:YAG laser with GaInAs and GaSb-based SESAMs,"
Opt. Express 21, 4311-4318 (2013).
133. B. Q. Yao, Z. Cui, J. Wang, X. M. Duan, T. Y. Dai, Y. Q. Du, J. H. Yuan, and W. Liu,
"An actively mode-locked Ho:YAG solid laser pumped by a Tm:YLF laser," Laser Phys.
Lett. 12, 025002 (2015).

References
118
134. X. Duan, J. Yuan, Z. Cui, B. Yao, T. Dai, J. Li, and Y. Pan, "Resonantly pumped
actively mode-locked Ho:YAG ceramic laser at 2122.1 nm," Appl. Opt. 55, 1953-1956
(2016).
135. W. X. Zhang, J. Zhou, W. B. Liu, J. Li, L. Wang, B. X. Jiang, Y. B. Pan, X. J. Cheng,
and J. Q. Xu, "Fabrication, properties and laser performance of Ho:YAG transparent
ceramic," J. Alloys Compd. 506, 745-748 (2010).
136. G. Q. Xie, D. Y. Tang, H. Luo, H. J. Zhang, H. H. Yu, J. Y. Wang, X. T. Tao, M. H.
Jiang, and L. J. Qian, "Dual-wavelength synchronously mode-locked Nd:CNGG laser,"
Opt. Lett. 33, 1872-1874 (2008).
137. H. Yoshioka, S. Nakamura, T. Ogawa, and S. Wada, "Dual-wavelength mode-locked
Yb:YAG ceramic laser in single cavity," Opt. Express 18, 1479-1486 (2010).
138. L. C. Kong, Z. P. Qin, G. Q. Xie, X. D. Xu, J. Xu, P. Yuan, and L. J. Qian, "Dual-
wavelength synchronous operation of a mode-locked 2-µm Tm:CaYAlO4 laser," Opt.
Lett. 40, 356-358 (2015).
139. Z. Qin, G. Xie, L. Kong, P. Yuan, L. Qian, X. Xu, and J. Xu, "Diode-pumped passively
mode-locked Tm:CaGdAlO4 laser at 2 μm wavelength," IEEE Photon. J. 7, 1500205
(2015).
140. P. Loiko, P. Becker, L. Bohatý, C. Liebald, M. Peltz, S. Vernay, D. Rytz, J. M. Serres,
X. Mateos, Y. Wang, X. Xu, J. Xu, A. Major, A. Baranov, U. Griebner, and V. Petrov,
"Sellmeier equations, group velocity dispersion, and thermo-optic dispersion formulas
for CaLnAlO4 (Ln = Y, Gd) laser host crystals," Opt. Lett. 42, 2275-2278 (2017).
141. P. Loiko, J. M. Serres, X. Mateos, M. Aguiló, F. Díaz, L. Zhang, Z. Lin, H. Lin, G.
Zhang, K. Yumashev, V. Petrov, U. Griebner, Y. Wang, S. Y. Choi, F. Rotermund, and
W. Chen, "Monoclinic Tm3+
:MgWO4: a promising crystal for continuous-wave and
passively Q-switched lasers at ~2 μm," Opt. Lett. 42, 1177-1180 (2017).
142. F. Fusari, A. A. Lagatsky, G. Jose, S. Calvez, A. Jha, M. D. Dawson, J. A. Gupta, W.
Sibbett, and C. T. A. Brown, "Femtosecond mode-locked Tm3+
and Tm3+
-Ho3+
doped 2
μm glass lasers," Opt. Express 18, 22090-22098 (2010).
143. A. A. Lagatsky, S. Calvez, J. A. Gupta, V. E. Kisel, N. V. Kuleshov, C. T. A. Brown, M.
D. Dawson, and W. Sibbett, "Broadly tunable femtosecond mode-locking in a
Tm:KYW laser near 2 μm," Opt. Express 19, 9995-10000 (2011).
144. J. Brons, V. Pervak, D. Bauer, D. Sutter, O. Pronin, and F. Krausz, "Powerful 100-fs-
scale Kerr-lens mode-locked thin-disk oscillator," Opt. Lett. 41, 3567-3570 (2016).
145. F. Lesparre, J. T. Gomes, X. Délen, I. Martial, J. Didierjean, W. Pallmann, B. Resan, M.
Eckerle, T. Graf, M. A. Ahmed, F. Druon, F. Balembois, and P. Georges, "High-power
Yb:YAG single-crystal fiber amplifiers for femtosecond lasers in cylindrical
polarization," Opt. Lett. 40, 2517-2520 (2015).
146. M. Hemmer, M. Baudisch, A. Thai, A. Couairon, and J. Biegert, "Self-compression to
sub-3-cycle duration of mid-infrared optical pulses in dielectrics," Opt. Express 21,
28095-28102 (2013).

119
List of publications
A. Parts of this thesis are based on the following published or
submitted journal articles and conference proceedings:
I. Articles in Peer-Reviewed Journals
1. Y. Wang, W. Chen, M. Mero, L. Zhang, H. Lin, Z. Lin, G. Zhang, F. Rotermund, P. Loiko, X.
Mateos, U. Griebner, and V. Petrov, “Sub-100 fs Tm:MgWO4 laser at 2017 nm mode-locked by
a graphene-based saturable absorber,” Opt. Lett. 42 (2017), in press.
2. Y. Wang, W. Chen, L. Zhang, H. Lin, Z. Lin, G. Zhang, F. Rotermund, P. Loiko, X. Mateos, U.
Griebner, and V. Petrov, “Passively mode-locked femtosecond Tm:MgWO4 laser with
SWCNTs as a saturable absorber,” Opt. Express (2017), submitted.
3. P. Loiko, J. M. Serres, X. Mateos, M. Aguiló, F. Díaz, L. Zhang, Z. Lin, H. Lin, G. Zhang, K.
Yumashev, V. Petrov, U. Griebner, Y. Wang, S. Y. Choi, F. Rotermund, and W. Chen,
“Monoclinic Tm3+
:MgWO4: a promising crystal for continuous-wave and passively Q-switched
lasers at ~2 μm,” Opt. Lett. 42, 1177-1180 (2017).
4. L. Zhang, H. Lin, G. Zhang, X. Mateos, J. M. Serres, M. Aguiló, F. Díaz, U. Griebner, V.
Petrov, Y. Wang, P. Loiko, E. Vilejshikova, K. Yumashev, Z. Lin, and W. Chen, “Crystal
growth, optical spectroscopy and laser action of Tm3+
-doped monoclinic magnesium tungstate,”
Opt. Express 25, 3682-3693 (2017).
5. Y. Wang, R. Lan, X. Mateos, J. Li, C. Li, S. Suomalainen, A. Härkönen, M. Guina, V. Petrov,
and U. Griebner, “Thulium doped LuAG ceramics for passively mode locked lasers,” Opt.
Express 25, 7084-7091 (2017).
6. P. Loiko, P. Becker, L. Bohaty, C. Liebald, M. Peltz, S. Vernay, D. Rytz, J. M. Serres, X.
Mateos, Y. Wang, X. Xu, J. Xu, A. Major, A. Baranov, U. Griebner, and V. Petrov, “Sellmeier
equations, group velocity dispersion, and thermo-optic dispersion formulas for CaLnAlO4
(Ln=Y, Gd) laser host crystals,” Opt. Lett. 42, 2275-2278 (2017).
7. Y. Wang, R. Lan, X. Mateos, J. Li, C. Hu. C. Li, Y. Pan, S. Suomalainen, A. Härkönen, M.
Guina, V. Petrov, and U. Griebner, “Broadly tunable mode-locked Ho:YAG ceramic laser
around 2.1 µm,” Opt. Express 24, 18003-18012 (2016).
8. Y. Wang, G. Xie. X. Xu, J. Di, Z. Qin, S. Suomalainen, M. Guina, A. Härkönen, A. Agnesi, U.
Griebner, X. Mateos, P. Loiko, and V. Petrov, “SESAM mode-locked Tm:CALGO laser at
2 µm,” Opt. Mater. Express 6, 131-136 (2016).
9. A. Gluth, Y. Wang, V. Petrov, J. Paajaste, S. Suomalainen, A. Härkönen, M. Guina, G.
Steinmeyer, X. Mateos, S. Veronesi, M. Tonelli, J. Li, Y. Pan, J. Guo, and U. Griebner, “GaSb-
based SESAM mode-locked Tm:YAG ceramic laser at 2 µm,” Opt. Express 23, 1361-1369
(2015).

List of publications
120
II. Articles in SPIE Proceedings
10. P. Loiko, X. Mateos, S. Y. Choi, F. Rotermund, C. Liebald, M. Peltz, S. Vernay, D. Rytz, Y.
Wang, M. Kemnitzer, A. Agnesi, E. Vilejshikova, K. Yumashev, U. Griebner, and V. Petrov,
“Tm:CaGdAlO4: Spectroscopy, microchip laser and passive Q-switching by carbon
nanostructures,” Proc. SPIE 10082, 1008228/1-6 (2017).
III. Conference Papers
1. Y. Wang, W. Chen, M. Mero, L. Zhang, H. Lin, Z. Lin, G. Zhang, F. Rotermund, Y. J. Cho, P.
Loiko, X. Mateos, U. Griebner, and V. Petrov, “Sub-100 fs Tm:MgWO4 laser at 2017 nm,”
Advanced Solid State Lasers Conference, Nagoya, Japan, Oct. 1-5, 2017, accepted.
2. Y. Wang, W. Chen, L. Zhang, H. Lin, Z. Lin, G. Zhang, F. Rotermund, P. Loiko, J. M. Serres,
X. Mateos, U. Griebner, and V. Petrov, “Passively mode-locked femtosecond Tm:MgWO4
laser,” Conference on Lasers and Electro-Optics CLEO/Europe, Munich, Germany, June 25-29,
2017, paper CF-P.28, Online Conference Digest.
3. P. Loiko, J. M. Serres, L. Zhang, X. Mateos, M. Aguiló, F. Díaz, Z. Lin, H. Lin, G. Zhang, K.
Yumashev, V. Petrov, U. Griebner, Y. Wang, S. Y. Choi, F. Rotermund, and W. Chen,
“Monoclinic Tm3+
:MgWO4 – A novel efficient laser emitting above 2 μm,” Conference on
Lasers and Electro-Optics CLEO/Europe, Munich, Germany, June 25-29, 2017, paper CE-1.5,
Online Conference Digest.
4. L. Z. Zhang, Z. B. Lin, H. F. Lin, G. Zhang, X. Mateos, P. Loiko, J. M. Serres, M. Aguiló, F.
Díaz, Y. C. Wang, U. Griebner, V. Petrov, E. Vilejshikova, K. Yumashev, and W. D. Chen,
“Growth, spectroscopy and laser operation of Tm-doped monoclinic magnesium tungstate
(Tm:MgWO4),” Conference on Lasers and Electro-Optics CLEO'17, San Jose (CA), USA, May
14-19, 2017, paper STh4I.6, CLEO Online Technical Digest.
5. Y. Wang, R. Lan, X. Mateos, J. Li, S. Suomalainen, A. Härkönen, M. Guina, U. Griebner, and
V. Petrov, "Passively mode‐locked Tm:LuAG ceramic laser,” Conference on Lasers and
Electro-Optics CLEO'17, San Jose (CA), USA, May 14-19, 2017, paper SF2K.3, CLEO Online
Technical Digest.
6. X. Mateos, L. Zhang, Z. Lin, H. Lin, G. Zhang, P. Loiko, J. M. Serres, M. Aguiló, F. Díaz, Y.
Wang, U. Griebner, V. Petrov, E. Vilejshikova, K. Yumashev, and W. Chen, "Growth,
Spectroscopy and Laser Operation of Tm-doped Monoclinic Magnesium Tungstate
(Tm:MgWO4)," in Conference on Lasers and Electro-Optics, STh4I.6 (2017).
7. P. Becker, L. Bohaty, C. Liebald, M. Peltz, S. Vernay, D. Rytz, P. Loiko, J. M. Serres, X.
Mateos, K. Yumashev, Y. Wang, V. Petrov, and U. Griebner, “Sellmeier equations for
CaGdAlO4 and CaYAlO4,” Europhoton 2016, 7th EPS-QEOD Europhoton Conference on
Solid-State, Fibre and Waveguide Coherent Light Sources, Vienna, Austria, Aug. 21-26, 2016,
paper PO-3.13, Conference Digest, p. 48.
8. Y. Wang, R. Lan, X. Mateos, J. Li, Y. Pan, S. Suomalainen, A. Härkönen, M. Guina, U.
Griebner, and V. Petrov, “In-band-pumped mode-locked Ho:YAG ceramic laser at 2.1 μm”

List of publications
121
Conference on Lasers and Electro-Optics CLEO'16, San Jose (CA), USA, June 5-10, 2016,
paper STu4M.1, CLEO Online Technical Digest.
9. Y. Wang, G. Xie. X. Xu, J. Di, Z. Qin, S. Suomalainen, M. Guina, A. Härkönen, A. Agnesi, U.
Griebner, X. Mateos, P. Loiko, and V. Petrov, “SESAM mode-locked Tm:CALGO laser at 2
µm,” Advanced Solid State Lasers Conference, Berlin, Germany, Oct. 4-9, 2015, paper
AW1A.2.
B. The following papers appeared during the PhD work of the
candidate but remained outside the scope of the thesis.
I. Articles in Peer-Reviewed Journals
1. T. Xu, Y. Wang, D. Lu, Z. Pan, H. Yu, H. Zhang, and J. Wang, “The modulation mechanism of
growth atmosphere on composition and phase transition behavior in barium calcium titanate
crystal,” Cryst. Res. Technol. 52, 1700009/1-7 (2017).
2. Z. Zhang, P. Loiko, H. Wu, X. Mateos, J. M. Serres, H. F. Lin, W. D. Chen, G. Zhang, L. Z.
Zhang, F. Díaz, M. Aguiló, V. Petrov, U. Griebner, Y. C. Wang, E. Vilejshikova, K. Yumashev,
and Z. B. Lin, “Disordered Tm:Ca9La(VO4)7: a novel crystal with potential for broadband
tunable lasing,” Opt. Mater. Express 7, 484-493 (2017).
3. R. Lan, X. Mateos, Y. Wang, J. M. Serres, P. Loiko, J. Li, Y. Pan, U. Griebner, and V. Petrov,
“Semiconductor saturable absorber Q-switching of a holmium microchip laser,” Opt. Express
25, 4579-4584 (2017).
4. R. Lan, P. Loiko, X. Mateos, Y. Wang, J. Li, Y. Pan, S. Y. Choi, M. H. Kim, F. Rotermund, A.
Yasukevich, K. Yumashev, U. Griebner, and V. Petrov, “Passive Q-switching of microchip
lasers based on Ho:YAG ceramics,” Appl. Opt. 55, 4877-4887 (2016).
5. J. Di, X. Sun, X. Xu, C. Xia, Q. Sai, H. Yu, Y. Wang, L. Zhu, Y. Gao and X. Guo, “Growth and
spectral characters of Nd:CaGdAlO4 crystal,” Eur. Phys. J. Appl. Phys. 74, 10501/1-6 (2016).
6. M. Rüsing, S. Sanna, S. Neufeld, G. Berth, W. G. Schmidt, A. Zrenner, H. Yu, Y. Wang, and H.
Zhang, “Vibrational properties of LiNb1−xTaxO3 mixed crystals,” Phys. Rev. B 93, 184305/1-11
(2016).
7. F. J. Furch, A. Giree, F. Morales, A. Anderson, Y. Wang, C. P. Schulz, and M. J. J. Vrakking,
“Close to transform-limited, few-cycle 12 µJ pulses at 400 kHz for applications in ultrafast
spectroscopy,” Opt. Express 24, 19293-19310 (2016).
8. P. Loiko, X. Mateos, Y. Wang, Z. Pan, K. Yumashev, H. Zhang, U. Griebner, and V. Petrov,
“Thermo-optic dispersion formulas for YCOB and GdCOB laser host crystals,” Opt. Mater.
Express 5 1089-1097 (2015).

List of publications
122
II. Conference Papers
1. P. Loiko, X. Mateos, J. M. Serres, R. Lan, S. Y. Choi, F. Rotermund, Y. Wang, J. Li, Y. Pan, M.
Aguiló, F. Díaz, U. Griebner, and V. Petrov, “Single-walled carbon nanotubes oust graphene
and semiconductor saturable absorbers in Q-switched solid-state lasers at 2 μm,” Conference on
Lasers and Electro-Optics CLEO/Europe, Munich, Germany, June 25-29, 2017, paper CA-5.2,
Online Conference Digest.
2. L. Z. Zhang, Z. B. Lin, X. Mateos, P. Loiko, J. M. Serres, Y. C. Wang, U. Griebner, V. Petrov,
M. Aguiló, F. Díaz, E. Vilejshikova, K. Yumashev, H. F. Lin, G. Zhang, and W. D. Chen,
“Growth, spectroscopy and laser operation of a novel disordered tetragonal tungstate crystal –
Tm:Na2La4(WO4)7,” The 6th Advanced Lasers and Photon Sources (ALPS’17), Yokohama,
Japan, Apr. 18 - Apr. 21, 2017, paper ALPS11-4. Proceedings (USB stick), 2 pages.
3. P. Loiko, X. Mateos, S. Y. Choi, F. Rotermund, C. Liebald, M. Peltz, S. Vernay, D. Rytz, Y.
Wang, M. Kemnitzer, A. Agnesi, K. Yumashev, U. Griebner, and V. Petrov, “Tm:CALGO laser
passively Q-switched by graphene and single-walled carbon nanotubes,” Photonics West 17:
Lasers and applications in science and engineering, SPIE Conference 10082: “Solid State Lasers
XXVI: Technology and Devices”, San Francisco (CA), USA, Jan. 28 - Feb. 2, 2017, paper
[10082-79], Technical Summaries.
4. R. Lan, P. Loiko, X. Mateos, Y. Wang, J. Li, Y. Pan, S. Y. Choi, M. H. Kim, F. Rotermund, K.
Yumashev, U. Griebner, and V. Petrov, “Passively Q-switched Ho:YAG ceramic lasers,” 12th
Laser Ceramics Symposium, International Symposium on Transparent Ceramics for Photonic
Applications, Saint-Louis, France, Nov. 28 - Dec. 2, 2016, paper. We-5-O-03.
5. R. Lan, X. Mateos, P. Loiko, Y. Wang, S. Y. Choi, F. Rotermund, M. Aguiló, F. Díaz, K.
Yumashev, U. Griebner, and V. Petrov, “Sub-100 ns Tm:KLuW and Ho:KLuW lasers passively
Q-switched with SWCNTs,” Conference on Lasers and Electro-Optics CLEO'16, San Jose (CA),
USA, June 5-10, 2016, paper JTu5A.36, CLEO Online Technical Digest.
6. R. Lan, P. Loiko, X. Mateos, Y. Wang, J. Li, Y. Pan, S. Y. Choi, M. H. Kim, F. Rotermund, A.
Yasukevich, K. Yumashev, U. Griebner, and V. Petrov, “Passive Q-switching of Ho:YAG
ceramic lasers at 2.1 μm,” Conference on Lasers and Electro-Optics CLEO'16, San Jose (CA),
USA, June 5-10, 2016, paper STu4M.6, CLEO Online Technical Digest.
7. R. Lan, X. Mateos, Y. Wang, P. Loiko, J. M. Serres, J. Li, Y. Pan, K. Yumashev, V. Petrov, and
U. Griebner, “Semiconductor saturable absorber Q-switching of a holmium microchip laser,”
Advanced Solid State Lasers Conference, Boston (MA), USA, Oct. 30 - Nov. 03, 2016, paper
JTu2A.22.
8. P. Loiko, X. Mateos, Y. Wang, Z. Pan, K. Yumashev, H. Zhang, H. Yu, U. Griebner, and V.
Petrov, “Thermo-optic dispersion formulas for YCOB and GdCOB laser host crystals,”
Advanced Solid State Lasers Conference, Berlin, Germany, Oct. 4-9, 2015, paper AM2A.7.
9. F. J. Furch, A. Anderson, S. Birkner, Y. Wang, A. Giree, C. P. Schulz, and M. J. J. Vrakking,
“Improved characteristics of high repetition rate non-collinear optical parametric amplifiers for
electron-ion coincidence spectroscopy,” Conference on Lasers and Electro-Optics CLEO'15,
San Jose (CA), USA, May 10 - May 15, 2015, paper SF1M.5, CLEO Online Technical Digest

123
Acknowledgements
During the last 4 years, I have received a lot of help and support from my advisor, colleagues
and friends. Without your help, I would have been unable to finish my thesis. Here I would
like to express my gratitude to all of you.
First, I would like to express my sincere gratitude to my advisor Prof. Marc Vrakking for
giving me the opportunity to conduct my research here at MBI. Thank you for your patience,
motivation and insightful comments. You always provide me with valuable ideas and good
connections, encouraging me to be a better scholar in the future.
Second, I am truly grateful to my mentor at MBI, Dr. Valentin Petrov. Your advices on
my research and strict academic training have been, and will continue to be priceless for me.
Many thanks to Dr. Uwe Griebner in division C of MBI, who has helped me and contributed
to my research by providing samples and guidance on experimental setups, as well as
providing a lot of useful advice and discussions.
My work is also greatly supported by Dr. Xavier Mateos and Dr. Pavel Loiko. Thank you
not only for the inspiration and guidance but also for the great working environment you
create. Your optimism and enthusiasm in research cheer me along the way. Many thanks to
Dr. Weidong Chen as well for providing me with your crystals. I learn a lot from your
suggestions both on research and for my career.
I would also like to express my gratitude to Dr. Mark Merö who has given great guidance
and advice on the FROG measurements as well as help with the ongoing Cr:YAG project.
Thanks also to Dr. Federico Furch and Dr. Alexandria Anderson who helped me with the
building of f-2f interferometer during the initiate period of my research here. Thanks to Dr.
Gabrielle Thomas for proofreading my drafts and helping me with ongoing experiments.
I would like to give special thanks to Chinese Scholarship Council, for their support of
my Ph.D. work and study in Germany. I hope to thank my Masters advisor Prof. Huaijin
Zhang and Prof. Haohai Yu for encouraging me to apply for the scholarship. Their academic
suggestions help me to achieve my goals.
My time at Berlin was full of joy thanks to all my colleagues and friends: Jingming,
Yingliang, Nikita, Andrey, Florian, Achut, Ruijun and Tianli. Especially for the help I
received during the small bicycle accident here. Doped with titanium nails in my arm, I would
say I am the most suitable guy for ultrashort pulse generation.
Finally, I would like to thank my parents who are always supporting me, sorry for my
absence in family life during the last few years. Special thanks to Qiuzi for your support,
company and understanding. Meeting you is the most lovely accident in the long journey
from China to Berlin.
As the Chinese saying goes: There is an end to the words, but not to their message

124

Selbstständigkeitserklärung Hiermit versichere ich, dass ich die vorliegende Dissertation selbstständig und nur
unter Verwendung der angegebenen Literatur und Hilfsmittel verfasst habe.
Die Arbeit ist weder in einem früheren Promotionsverfahren angenommen noch als
ungenügend beurteilt worden.
____________________
Berlin, den 13. Juli 2017