password advice shouldn’t be boring: visualizing
TRANSCRIPT
Password Advice Shouldn’t Be Boring:Visualizing Password Guessing Attacks
Leah Zhang-KennedyHuman-Computer Interaction
Carleton UniversityEmail: [email protected]
Sonia ChiassonSchool of Computer Science
Carleton UniversityEmail: [email protected]
Robert BiddleSchool of Computer Science
Carleton UniversityEmail: robert [email protected]
Abstract—Users are susceptible to password guessing attackswhen they create weak passwords. Despite an abundance oftext-based password advice, it appears insufficient to help homeusers create strong memorable passwords. We propose thatusers would be empowered to make better password choices ifthey understood how password guessing attacks work throughvisual communication. We created three infographic posters andan online educational comic to help users to learn about thethreats. We conducted two studies to assess their effectiveness.All four methods led to superior learning outcomes than the text-alone approach. Our pre-test questionnaires also highlighted thatusers’ understanding of password guessing attacks is limited to a“target” mental model. One week after viewing our materials, themajority of users created strong sample passwords, and correctlydescribed all three attacks: targeted, dictionary, and brute-force.
I. INTRODUCTION
Knowledge-based authentication requires users to remem-ber data created for authentication purposes. Text passwordsand personal identification numbers (PINs) remain popular,despite the growing number of alternative graphical and textualschemes [1], [2]. Among many problems, text-based passwordsare difficult to remember and are frequently forgotten [2],[3]. Some users cope by creating short, easy to rememberpasswords. Such weak passwords are vulnerable to dictionary,brute-force, and targeted guessing attacks [1], [2].
Although most users understand the importance of pass-words, they continue to use poor password practices. There isa lack of resources available that explain the reasons behind theadvice given and why these rules are important [4]. Herley [5]argues that users often reject security advice because it offerspoor cost-benefit tradeoffs. Without an understanding of thethreat, users cannot make robust decisions, and so intentionallychoose to ignore good password advice if they believe that thebenefits are moot.
Security education in general has a few well known chal-lenges. Some experts argue that educational material does nothave positive effects on user behaviour [6], and that securityexperts should not put the burden on users [7]. Security isa secondary task for most users and therefore, motivationto learn is low. Ideally, automated systems would protectusers so they would not to need to worry about security.Realistically however, users will need some involvement inthe foreseeable future, especially with choosing passwords.Despite an abundance of security advice for strengtheningpasswords, there is a lack of explanations of why users should
follow the advice. We argue that when users are unawareor have incomplete conceptions of how password guessingattacks work, it can hinder their motivation and ability tocreate strong passwords. We feel a viable strategy is to raiseawareness about the risks by teaching them how the attackswork. Since our target audience is novice home users, we chosea visual approach to deliver the teaching material. Research ineducation provides strong evidence that integrating visual andverbal strategies facilitate better learning than text-alone [8],[9], [10], especially when prior knowledge is low [10].
Keeping the challenges of security education in mind, wedesigned the teaching material to be light and enjoyable tolearn. Our first three prototype designs are information graph-ics, often called infographics. These are visual representationsof information, data, or knowledge, sometimes using metaphorto demonstrate an idea [11]. Well-designed infographics areeasy and fast for people to read and understand, and help to vi-sually break down complex concepts to aid comprehension. Inthe usable security field, researchers have explored informationdesign in A Nutrition Label for Privacy, to improve the visualpresentation and comprehensibility of privacy policies [12].Our work differs in that it uses both text and images toconvey information. Other works, like Anti-Phishing Phil, alsouse integrated graphical representations to convey securityinformation to teach users about the risks [13].
Each of our three infographic prototypes uses a differentmetaphor for risk communication:“users as targets,” “pass-words as locks,” and “passwords have lifespans”. A fourthtext-alone condition is used as a baseline to compare theeffectiveness of our infographic prototypes. We tested the fourconditions using a between-subject study with 55 participants.
Drawing from the concepts and results of the first study, wedesigned an interactive prototype in an online comic format,and conducted a second study. We suggest that presentinga serious security topic like password guessing attacks as acomic could help users to overcome the “intimidation factor.”One security education effort exploring this approach is Secu-rity Cartoon, which uses short comic strips to explain varioussecurity risks [14]. Our prototype uses a similar approach, butincorporates interactivity, and delivers the information in a 14-page online comic book that offers a comprehensive overviewof password guessing attacks, including coping strategies forhow to create good passwords. We conducted a second userstudy with an additional 21 participants to assess the ef-fectiveness. For interested readers, we have made the threeinfographics and the interactive comic available online [15].
II. BACKGROUND
A. Overview of Online Password Guessing Attacks
In knowledge-based authentication, users are vulnerable toonline password guessing attacks when they set up “weak”passwords that can be easily predicted by attackers. Whileoffline guessing attacks are also possible (e.g., when attackersgain access to databases), our prototypes focus on the threatof online attacks. Online guessing attacks rely on interactionwith the live system to determine if a guess is correct. Aftera series of unsuccessful password entry attempts, some siteswill increase system response delay times or disable futureattempts. Although these security mechanisms help to reducepassword guessing, they also run the risk of locking outlegitimate users who forget their passwords, and could enablea denial-of-service attack to purposely lock user accounts.
Users cope with the challenge of remembering passwordsby making them short and easy to remember. They alsoreuse or create variations of the same password [16]. Thisputs users at risk of three types of online guessing attacks:exhaustive brute-force, dictionary, and targeted attacks. Toolsare readily available online to help launch automated attacks.Sophisticated large-scale attacks may require expertise, butmany attacks could easily be replicated by “script kiddies”with basic computer hacking skills.
Exhaustive Brute-force Attack: Brute-force attacks con-sist of guessing every possible password in a theoretical pass-word space. All passwords can eventually be cracked by brute-force, but the size of the search space, time, and processingpower can make it infeasible to crack strong passwords. Users’best defence against brute-force attacks is to create long,random-looking passwords containing alphanumeric and spe-cial characters to maximize the search space, thus minimizingattackers’ chance to crack passwords using brute-force.
Dictionary Attack: Dictionary attacks use pre-compiledor computerized lists of high probability candidate passwordsto guess the target password. Attackers exploit the fact thatpeople like to use whole words or a string of words tocreate their passwords. Attackers also search for predictablepatterns in user behavior supported by empirical data, suchas commonly used character substitutions (e.g. @ for a),popular passwords (e.g. qwerty123), or predictable characterdistribution and composition (e.g., P@ssword1). Such pre-compiled lists are easily computed, available online, and sharedamongst attackers [17].
Targeted Attack: In a targeted attack, the attackers try toobtain information about a specific user. It exploits the factthat people use personal information as their passwords tocope with memorability challenges [16]. For example, names,birth dates, hobbies, pets, or phone numbers are frequentlyused as passwords, and could be traced back to the user.This information is often readily available online, such as onsocial media sites, making it easy for attackers to gather userinformation even if they do not personally know their victims.
B. Mental Models, Passwords, and Metaphors
A mental model is a simplified internal concept of howsomething works in reality [18], [19], [4], [20]. People relyon the reasoning of their mental models to make predictions
about the outcome of their actions in real life, includingwhen they make security decisions. In password guessingattacks, users imagine hackers manually inputting guesses, andtry to make passwords difficult for a human to guess [16].For example, users rationalize “p1a1s1s1w1o1r1d” is strongbecause it consists of 15 alphanumeric characters, not knowingthat it is highly susceptible to dictionary attacks. Many usersalso mistakenly believe that attackers only target “big fish” [4],and feel it is unlikely that they will be victims.
Several theories exist to explain how graphics help to buildmental models. One is Paivio’s dual coding theory [21] thatsuggests graphics and text are coded into memory differently.People process text in their phonetic working memory, whileimages are encoded in visual working memory. The theoryimplies that the combination of related text and images helpsto enhance comprehension, and increases long-term memory.
Theories in education literature show that the use ofvisual-verbal strategies in learning is more effective thantext alone [8], [9], [22]. Scientific text books, for example,incorporate illustrations of theories and diagrams to supporttext explanations. Graphic design is applied to the page layoutto make reading and finding information more intuitive andaccessible. Information design is utilized to visually representinformation or data in figures or diagrams so that it is readilyunderstandable.
Research suggest that visuals depict the content of the textthey accompany may facilitate the construction of a mentalmodel [22]. In one study, researchers compared the effects oftext-alone, text accompanied by visuals that only representedelements described in the text, and text accompanied by visualsthat represented the relationships of elements described in thetext. In all cases, visuals returned higher accuracy and responsetimes in recognition and problem solving than text-alone.Secondly, visuals that show relationships between elementsbeing described in the text are the most beneficial [22]. Thissuggests that visual information would be more effective if itoffers additional insights by highlighting relationships betweenthe objects being described in the text.
Another study offers further evidence that visual aids likediagrams can help to build mental models in the learningprocess. Cuevas et al. [23] compared learning of aviationlessons between text-alone, and text with diagrams. The studyfound that participants who learned through text and diagramsscored higher on tests than participants who viewed the text-alone tutorial. The authors concluded that diagrams presentedwith text in tutorials could improve learning efficiency, andconsequently, lend further evidence of the benefits of visualsto help build mental models.
Mental models are often constructed from metaphors. Froma cognitive linguistic point of view, a metaphor is definedas understanding a target domain in terms of other sourcedomains [24]. Analogies and metaphors are often used to helpusers understand computer security risks such as explainingthe concept of firewalls in terms of physical barriers [25]. Abreadth of past research on the benefits of using metaphorsexist in the HCI community, but Marcus [26] cautions thatrelying solely on metaphors could be limiting, and may notgive users a complete mental model of the concepts. Forexample, when a physical security metaphor is used, the

Fig. 1. The portion of our three infographics explaining how password guessing attacks work
concept could be limited by physical barriers, such as a wall,whereas Internet security is not [25]. When a metaphor is unfitto represent the target domain, it can cause users to make errorsor to have a false sense of security. Metaphorical referencescan also vary over time across technological and culturalshifts [26]. However, the many benefits of using metaphorsto communicate to users are highly attractive, and they havebeen widely used across disciplines. Computer security isno exception. Metaphors can increase the pace of learning,memorization, ease of use, and engagement because theyleverage concepts that are familiar to users [26]. Marcus [26]argues that even though some metaphors cannot support acomplete mental model, they can help to fill in the details fromusers’ experience. Metaphorical references used in computersecurity software and user interface design include the conceptof keys, locks, and walls.
Among security experts, there is discrepancy on the “cor-rect” model that non-expert users should use to think aboutcomputer security [4]. Camp [19] proposed five possible mod-els as a framework, which included physical security, medicalrisks, crime, warfare, and markets. The concepts were exploredby Asghapour et al. [18] in a card sorting experiment, whofound that there are significant differences in the metaphorsbased on users’ expertise level. Wash [4] goes beyond priorresearch on assumptions of the usefulness of mental models,and investigated home users’ actual mental models throughinterviews. Among other insights, he found that people withlow-security knowledge do not understand how the process of“hacking” works or how hackers choose their victims.
III. DESIGN OF THE INFOGRAPHICS
We selected three metaphors for our infographic proto-types, Target, Lock, and Lifespan (see Figure 1 A, B, andC, and available at [15]). They were selected because theyrepresent a sample of metaphors commonly used in publiccommunications media (ie., [27], [28], [29]), or in computersecurity literature (ie., [19], [25], [4]). The goal was to test the
potential use of infographics in computer security compared totext-alone advice. To ensure that our findings are not specificto one design, we tested three different visualizations andassessed their effectiveness with a text-alone condition. Thefoundation of our approach is based on prior findings ineducation that supports the use of visual strategies to facilitatebetter learning compared to text-alone strategies [8], [9], [10].We provided the same basic textual information on all threeprototypes, first teaching about how guessing attacks work,by describing Brute-Force, Dictionary, and Targeted attacks.Secondly, we gave advice on creating and managing secure,memorable passwords. We used a metaphorical explanationunique to each infographic accompanied by graphic devicesthat most powerfully represented each metaphor. The amountof information included on each infographic varies from theleast complex (Target), to moderately complex (Lock), to themost complex (Lifespan).
A. Selected Metaphors
Target Metaphor: “Don’t be a Target” is a common tacticused in public safety and security communications media. Forexample, financial institutions like Royal Bank of Canada haveused this approach to raise awareness about theft prevention inpublic settings [27]. Similarity, our Target concept promotesrisk reduction. It communicates the message that weak pass-words are easier to crack than strong passwords, thereforeusers with weak passwords are bigger targets for attackers. Weillustrated the idea showing a hacker taking aim at dartboardsof various sizes. Weak passwords are represented by largedartboards, and strong passwords by smaller ones, suggestingthat weak password are more vulnerable to password guessingattacks because they are easy targets.
Lock Metaphor: The lock is a widely used securitymetaphor, due users’ familiar understanding of the use ofpadlocks and keys in the physical world. Most security pro-grams like anti-virus software, encryption software, and SSLcertificates use the lock as a verbal and visual metaphor. In “A

Fig. 2. A Portion of the password creation advice common to the Infographics
Brick Wall, a Locked Door, and a Bandit” [25], the conceptof a locked door was tested as one of the physical securitymetaphor for firewall warnings. In our prototype, we illustratedthe concept through burglary, which is one of non-expert users’mental models of hackers [4]. We use combination locks tovisually depict password strength. Length is portrayed by thenumber of dials on the lock, while strength is portrayed by thesize of each dial and how many characters it contains.
Lifespan Metaphor: In password policies, the “lifespan”of a password usually refers to the period of time before thepassword of a user account expires [29]. In our Lifespan proto-type, we used a similar metaphor to refer to password cracking,where weak passwords that are easily guessed by attackersare represented by short lifespans, and strong passwordsrepresented by exponentially longer lifespans. Based on ourexperience in authentication research, users often overestimatethe length of time it takes hackers to crack passwords, becausethey assume most passwords would be difficult for humansto guess [16]. According to research conducted by DeloitteCanada, more than 90% of user-generated passwords wouldbe vulnerable to hacking in 2013 [30]. The “life expectancy”of passwords can demonstrate how long it would take tocrack [28]. We illustrated this concept on a line graph withpasswords plotted over the time it takes to crack them. Weoverlaid animal icons on the graph to give users a reference toanimal lifespans. Our calculations are based on the estimatedtheoretical password space of attacks with the computationalpower of delivering 1000 guesses per second.
B. Password Advice
There is a body of evidence indicating that typical com-puter users suffer from “password overload” [31]. In orderto cope with remembering multiple passwords, users turn tounsafe practices such as password reuse. Standard passwordadvice recommends that users create passwords that are uniqueto each account, at least 8 characters long, and consists ofalphanumeric and special characters. Although this is idealpractice, cognitive challenges of remembering complex pass-words mean users often ignore the advice and continue touse unsafe alternatives. We believe that in addition to givingusers security advice, users should be given practical copingstrategies for remembering their passwords. With this in mind,our password advice is based on the following considerations:
• Use a strategy like a passphrase• Prioritize strong passwords for high-value accounts• Use passwords that are long enough to be secure• Choose passwords that are hard to guess
The infographics recommend that users create a personalstrategy to help them remember passwords. An example ofour recommendation is to use a passphrase such as “My sisterPeggy’s 29 years old” to make the password “MsP’29yo” (seeFigure 2). Passwords created from a personalized passphrasecan help to ease the memorability challenges of strong pass-words [32], but they should be personalized rather than usingpopular slogans, song lyrics, or other sources that are easilyaccessible by attackers building attack dictionaries. We furtherrecommended to users that they should prioritize strong pass-words, and always create unique, strong passwords for high-value accounts like banking and email.
C. Infographics Approach
We used infographics to communicate to users about therisks of password guessing attacks. The purpose of the vi-sualizations is to put technical language into a more easilyunderstood form of communication. Infographics are capableof transforming abstract, complex, or otherwise difficult tounderstand concepts into intuitive, instant knowledge [33].Compared to text documents, juxtapositions of text and imagehelps to increase ease of learning, comprehension, and engage-ment [34]. Our prototypes aim to deliver knowledge and ideasvisually, so users can understand them quickly.
IV. INFOGRAPHICS USER STUDY
A. Study Design
We performed a user study to test the effectiveness of ourthree infographics with corresponding metaphors to commu-nicate to users about password guessing attacks, as well as atext-alone condition with no metaphor. As shown in Figure 1,the Target infographic focuses on the message that people whohave weak passwords are bigger targets for hackers. The Lockinfographic illustrates the threat through a physical securityconcept, burglary, where the malicious intention of hackers isexplicitly shown. The Lifespan infographic makes the case thatpasswords have a life expectancy, based on how long it takesfor hackers to crack them. The three concepts were presentedto participants on posters measuring 36× 42 inches each. Thetext-based condition was directly from Wikipedia’s descriptionof how “password cracking” works, and included a sectiongiving advice on how to create passwords that are “easy toremember” but “hard to guess” [35]. We chose this sourcebecause the content is comparable to our infographics, writtenin plain language that is easy to understand. The source is agood example of publicly available information on the subjectof password guessing attacks. We presented the informationon letter size printouts, in 12pt font across 2 pages. We used abetween-subject design to assess which condition best facili-tates learning about the subject. Testing was conducted throughone-on-one sessions with the experimenter. The components ofthe study are described below. In the following descriptions,“prototype” refers to the user-assigned infographic poster ortext printout.
Pretest questionnaire: Before prototype viewing, we gaveparticipants a pretest questionnaire to have a base under-standing of their current knowledge of password guessingattacks, as well as their present password behaviours. This dataenabled us to make meaningful comparisons with the follow-up questionnaire completed a week later.

Demographic questionnaire: The demographic question-naire collected standard demographic information about theparticipants, such as age, gender, education, and background.Participants also provided information about whether they hadprior training on password guessing attacks.
Prototype viewing: Participants were told that they couldtake as much time as they want to view the prototype. Theinfographics took on average 2 minutes to read, and the textcondition took on average 6 minutes to read. The experimenternoted immediate reactions from the participant. Afterwards,we had a brief interview with each person to openly discusstheir opinions of the prototype. Participants were encouragedto be honest and point out if there is anything difficult tounderstand or confusing about the concepts. The experimentertook notes of the comments made by the participant, andany misunderstandings of the metaphors, layouts, and othergraphical elements on the infographics, and comments aboutthe information presented in the text condition.
Post-viewing questionnaire: After prototype viewing, par-ticipants were asked to complete a questionnaire about theprototype. It had 14 Likert scale questions, on a scale of 1(strongly disagree) to 10 (strongly agree). Participants wereasked to give a rating to each statement about the prototype.We reversed the direction of a few questions to avoid bias.
One-week follow-up questionnaire: Participants wereemailed a link to an online follow-up questionnaire one weekafter their scheduled lab session. The purpose of the ques-tionnaire was to assess information retention. We intended tocompare the results to the pretest questionnaire to evaluate ifthere are improvements in users’ understanding of guessingattacks. We included one question verbatim from the pretestquestionnaire, which asked users to describe in their ownwords how password guessing attacks work. This enabled usto compare answers from the two occasions. To assess ifparticipants learned useful password strategies, we asked themto create two strong passwords and explain how they createdthem. Additionally, we created a knowledge quiz with 7 trueand false questions and a multiple-choice question.
B. Participants
We recruited 55 participants from our university and ran-domly assigned 15 users to each infographic prototype, and 10users to the text-alone condition. Participants were recruitedthrough flyers posted on bulletin boards across campus, andthrough a faculty and staff subscribed email newsletter. Partic-ipants were given a $10 honorarium.
To obtain a small random sample of average home com-puter users, we did not specify a knowledge level of computersecurity to qualify for the study. According to our pretestquestionnaire, our randomly selected participants’ behaviourfor creating and maintaining passwords are in line withpast research on the challenges of text-based authenticationschemes [16], [36]. 50 out of 55 (91%) of our participants saidthey have difficulty remembering passwords. Other strategiesused by our participants also correspond to past findings [16],[36], including password reuse (32 participants, 58%), use ofpersonal information in passwords (24 participants, 44%), andwriting down passwords (11 participants, 20%). Ten partici-pants said they use a password manager (18%), 4 (7%) use
Fig. 3. Likert scale responses assessing the effectiveness of each prototypeat conveying information (10 = most effective, 1 = least effective)
variations of the same password, and 2 (4%) make passwordsbased on account information.
For current passwords, 47 (85%) participants reportedusing at least 6-8 alphanumeric characters or longer, and theremainder reported using insecure passwords that are less thanfive characters. Lastly, participants self-rated their knowledgeabout how password guessing attacks work. More than half(32 participants, 58%) self-declared to have very little or noidea about how the attacks work. Only three participants con-sidered themselves to be very knowledgeable, and 20 (36%)participants said they have some ideas about how passwordguessing attacks work.
V. INFOGRAPHICS STUDY RESULTS
A. Post-viewing questionnaire results and feedback
Participants evaluated their learning experience in a ques-tionnaire immediately after viewing the material. In this paper,we focus on four particular comments from the questionnaireand user feedback: effectiveness of the visualization, useful-ness of the information, persuasiveness to update current pass-words, and memorability of the information. In what follows,all Likert scale data is presented positively for readability, with10 = most positive and 1 = least positive. To analyze the Likertscale responses, we used the non-parametric Kruskal-Wallisand Mann-Whitney significance tests to evaluate whether anydifferences were apparent between the four conditions. In allcases, p < 0.05 is considered significant.
1) Effectiveness for learning: Most of our study partici-pants (84%) said they are visual learners. Less experiencedusers perceived visualizing the process of password guessingattacks to be the most helpful. Although knowledgeable usersfelt that they did not learn new information, they agreed thatvisualization was a good way to teach novice users. Partici-pants commented that they liked the graphics in Target andLock infographics and thought the metaphors were effective.The Lifespan infographic was generally perceived to be theleast effective because participants did not easily comprehendhow the metaphor is associated with passwords.
Figure 3 shows the Likert scale responses for users’perceived effectiveness of each of the infographics comparedto the text-alone condition at communicating about passwordguessing attacks. From the figure, it appears that the Target(median 10/10) and Lock (median 9/10) infographics are moreeffective than the Lifespan infographic (median 7/10), but

Fig. 4. Likert scale responses assessing the usefulness of the presentedinformation (10 = most useful, 1 = least useful)
all three infographics were considerably more effective thanthe text-alone condition (median 4.5/10). To confirm thisresult, a Kruskal-Wallis test showed a statistically significantdifference between perceived effectiveness of the four condi-tions (H(3) = 22.5 with p < 0.001). To determine wherethe differences lay, Mann-Whitney tests with a Bonferroni-corrected p-value of (p < 0.05/4 = 0.013) were used. Allthree infographics are perceived to be more effective thanthe text-alone condition: Target (U = 4.5, p < 0.001, r =−0.804), Lock infographic (U = 17, p = 0.001, r = −0.651),and Lifespan (U = 38, p = .038, r = −0.416). Resultssuggest that infographics are perceived to be significantly moreeffective by users than text-alone information.
Based on verbal feedback, participants responded mostpositively to the Target infographic and found the Lifespaninfographic most confusing. They found the concept of Lifes-pan to be too abstract for depicting password security. Theinformation also takes a long time to read. Participants didnot find password cracking times relatable to animal lifespans,since most people admit to have only vague ideas of howlong animals live. Conversely, participants said that the Targetposter took very little effort to read and understand. They feltthat the concept is concise, “simple but informative.” It is “easyto understand” and the communication of the key message isimmediate. One participant said “even if I only have the timeto look at the poster for a moment, I would at least walk awaywith the message that weak passwords are bigger targets forhackers.” For the Lock infographic, participants said the visualssuccessfully captured the intentions of hackers, and depictedpassword strength well. In general, participants commentedthat they liked the graphics in the Target and Lock posterand thought the metaphors were effective. Participants thoughtaverage users would not read the text condition with intereston their own time. Some participants found the information “alot to take in at once”, “too technical”, or “boring” to read.
2) Usefulness of the information: We received positiveevaluations across all three infographics on the usefulness ofthe material. Novice users found the information particularlyhelpful. Knowledgeable users agreed that the informationwould be suitable to teach average home users. One participantsaid “I already know most of the information, but I thinksomething like this would be great for my parents.”
Responses to the Likert scale question about the use-fulness of the information are available in Figure 4. Basedon the responses, we could not determine which infographic
Fig. 5. Likert scale responses assessing the likelihood to update currentpasswords (10 = most likely, 1 = least likely)
participants found to be the most useful. Kruskal-Wallis testshowed no statistically significant difference in the perceivedusefulness of the information between the three infographics(H(3) = 2.66 with p = 0.26). However, when comparingthe three infographics to text-based information, participantsperceive the infographics to be significantly more useful(H(3) = 16.53 with p = 0.001). Mann-Whitney tests show thedifference between each of the infographic when compared tothe text-based condition are (U = 9.5, p < 0.001, r = −0.745)for Target, (U = 23, p = 0.003, r = −0.586) for Lock, and(U = 21.5, p = 0.004, r = −0.579) for Lifespan.
During open-ended feedback, participants commented thatdepicting password strength visually through various sizes ofcombination locks in the Lock infographic is very informative.They thought the graphic successfully “depicts what the hackeris trying to do”. The Target infographic demonstrated passwordstrength on a more abstract level, linking weak passwords withbigger targets. Although participants thought the message wasstraightforward and clear, they did not learn what constitutespassword strength. Once again, participants found the Lifespaninfographic visually complex, and took more effort to decipherthe message. Participants also found that Lifespan is not a fa-miliar concept to describe passwords. The text-based documenttook longer and more effort to read than all three infographics.Participants commented that it would be challenging for usersto remember information from text descriptions.
3) Likelihood to update current passwords: Participantsevaluated how likely they were to update their passwordsafter reading the material. We found a significant differencebetween the persuasiveness of the 4 conditions (H(3) =8.186, p = 0.042). Mann-Whitney tests show that the Targetand Lock infographics are significantly more persuasive thantext-based information, (U = 23.5, p = 0.004, r = −0.577)and (U = 36, p = 0.029, r = −0.4376). We found nostatistical difference between the Lifespan infographic and text-alone conditions (U = 55.5, p = 0.272, r = −0.22). Resultsof the Likert scale question are provided in Figure 5.
During the study session, we heard comments such as “Ineed to change my passwords”, and “I will Google more aboutthis”. The evaluations show that Target and Lock infographicshave greater potential to be more persuasive than text advice.
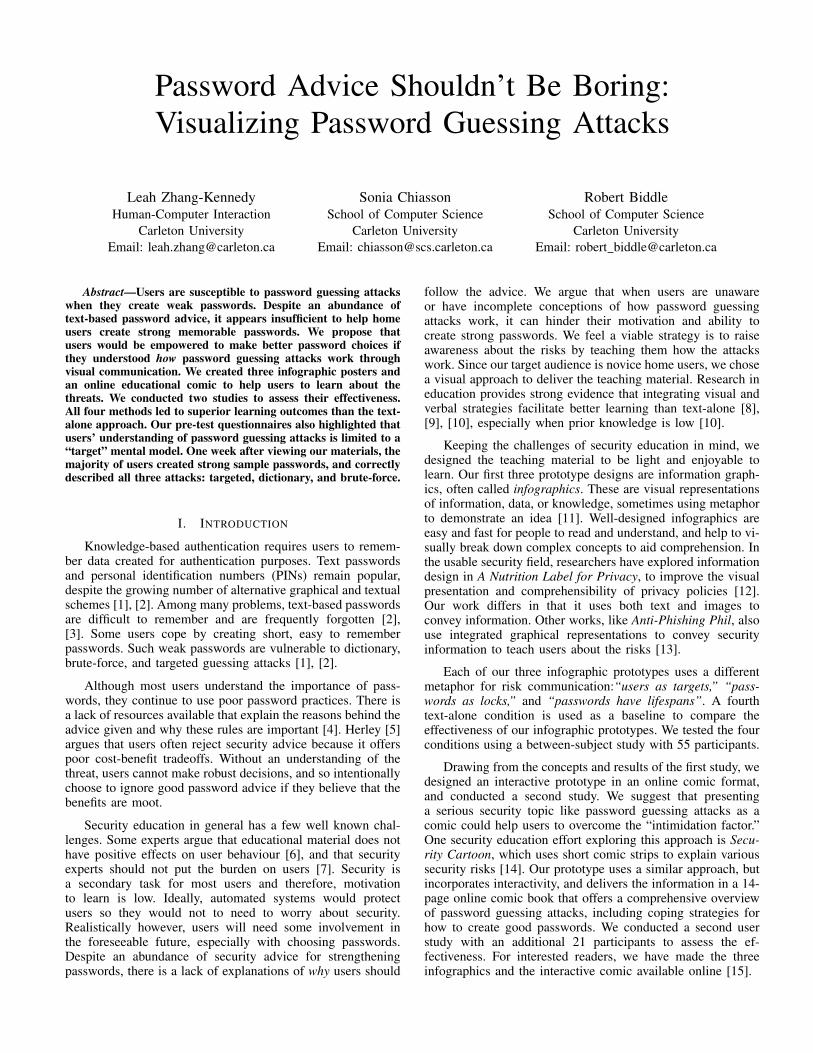
4) Memorability of information: Participants rated the like-lihood of remembering learnt information. A Kruskal-Wallistest showed a statistically significant difference between thememorability of the four conditions (H(3) = 20.369, p <
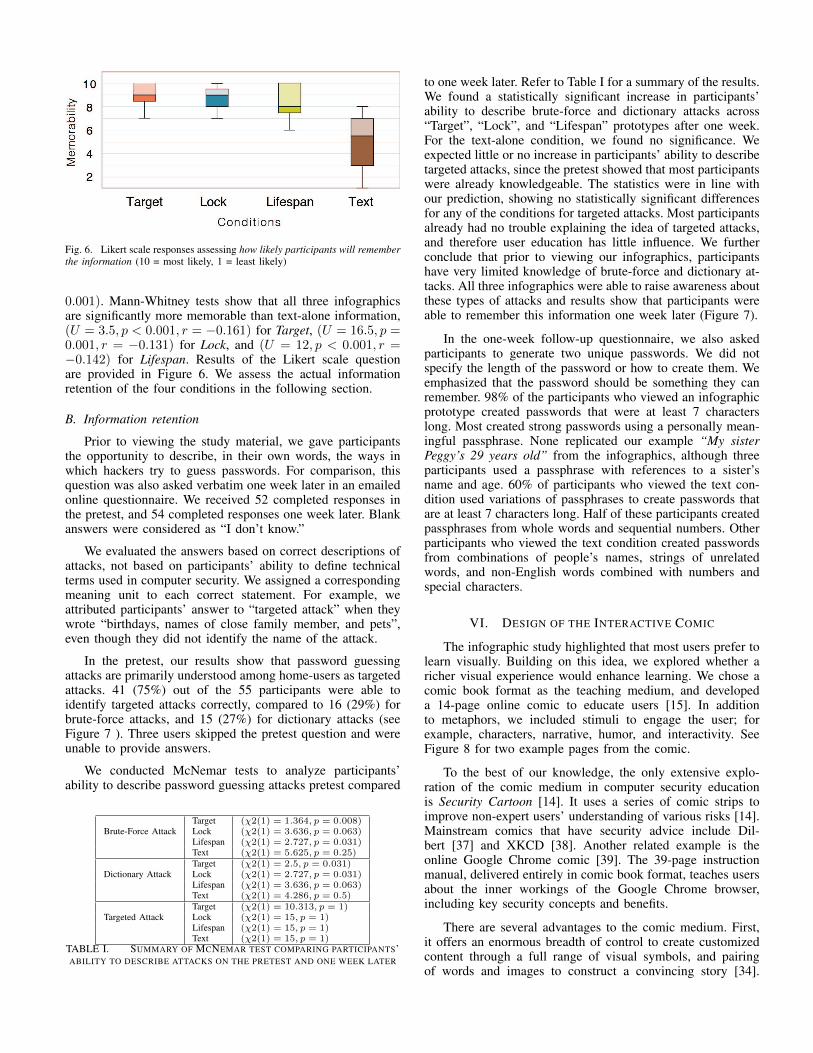
Fig. 6. Likert scale responses assessing how likely participants will rememberthe information (10 = most likely, 1 = least likely)
0.001). Mann-Whitney tests show that all three infographicsare significantly more memorable than text-alone information,(U = 3.5, p < 0.001, r = −0.161) for Target, (U = 16.5, p =0.001, r = −0.131) for Lock, and (U = 12, p < 0.001, r =−0.142) for Lifespan. Results of the Likert scale questionare provided in Figure 6. We assess the actual informationretention of the four conditions in the following section.
B. Information retention
Prior to viewing the study material, we gave participantsthe opportunity to describe, in their own words, the ways inwhich hackers try to guess passwords. For comparison, thisquestion was also asked verbatim one week later in an emailedonline questionnaire. We received 52 completed responses inthe pretest, and 54 completed responses one week later. Blankanswers were considered as “I don’t know.”
We evaluated the answers based on correct descriptions ofattacks, not based on participants’ ability to define technicalterms used in computer security. We assigned a correspondingmeaning unit to each correct statement. For example, weattributed participants’ answer to “targeted attack” when theywrote “birthdays, names of close family member, and pets”,even though they did not identify the name of the attack.
In the pretest, our results show that password guessingattacks are primarily understood among home-users as targetedattacks. 41 (75%) out of the 55 participants were able toidentify targeted attacks correctly, compared to 16 (29%) forbrute-force attacks, and 15 (27%) for dictionary attacks (seeFigure 7 ). Three users skipped the pretest question and wereunable to provide answers.
We conducted McNemar tests to analyze participants’ability to describe password guessing attacks pretest compared
Brute-Force AttackTarget (χ2(1) = 1.364, p = 0.008)Lock (χ2(1) = 3.636, p = 0.063)Lifespan (χ2(1) = 2.727, p = 0.031)Text (χ2(1) = 5.625, p = 0.25)
Dictionary AttackTarget (χ2(1) = 2.5, p = 0.031)Lock (χ2(1) = 2.727, p = 0.031)Lifespan (χ2(1) = 3.636, p = 0.063)Text (χ2(1) = 4.286, p = 0.5)
Targeted AttackTarget (χ2(1) = 10.313, p = 1)Lock (χ2(1) = 15, p = 1)Lifespan (χ2(1) = 15, p = 1)Text (χ2(1) = 15, p = 1)
TABLE I. SUMMARY OF MCNEMAR TEST COMPARING PARTICIPANTS’ABILITY TO DESCRIBE ATTACKS ON THE PRETEST AND ONE WEEK LATER
to one week later. Refer to Table I for a summary of the results.We found a statistically significant increase in participants’ability to describe brute-force and dictionary attacks across“Target”, “Lock”, and “Lifespan” prototypes after one week.For the text-alone condition, we found no significance. Weexpected little or no increase in participants’ ability to describetargeted attacks, since the pretest showed that most participantswere already knowledgeable. The statistics were in line withour prediction, showing no statistically significant differencesfor any of the conditions for targeted attacks. Most participantsalready had no trouble explaining the idea of targeted attacks,and therefore user education has little influence. We furtherconclude that prior to viewing our infographics, participantshave very limited knowledge of brute-force and dictionary at-tacks. All three infographics were able to raise awareness aboutthese types of attacks and results show that participants wereable to remember this information one week later (Figure 7).
In the one-week follow-up questionnaire, we also askedparticipants to generate two unique passwords. We did notspecify the length of the password or how to create them. Weemphasized that the password should be something they canremember. 98% of the participants who viewed an infographicprototype created passwords that were at least 7 characterslong. Most created strong passwords using a personally mean-ingful passphrase. None replicated our example “My sisterPeggy’s 29 years old” from the infographics, although threeparticipants used a passphrase with references to a sister’sname and age. 60% of participants who viewed the text con-dition used variations of passphrases to create passwords thatare at least 7 characters long. Half of these participants createdpassphrases from whole words and sequential numbers. Otherparticipants who viewed the text condition created passwordsfrom combinations of people’s names, strings of unrelatedwords, and non-English words combined with numbers andspecial characters.
VI. DESIGN OF THE INTERACTIVE COMIC
The infographic study highlighted that most users prefer tolearn visually. Building on this idea, we explored whether aricher visual experience would enhance learning. We chose acomic book format as the teaching medium, and developeda 14-page online comic to educate users [15]. In additionto metaphors, we included stimuli to engage the user; forexample, characters, narrative, humor, and interactivity. SeeFigure 8 for two example pages from the comic.
To the best of our knowledge, the only extensive explo-ration of the comic medium in computer security educationis Security Cartoon [14]. It uses a series of comic strips toimprove non-expert users’ understanding of various risks [14].Mainstream comics that have security advice include Dil-bert [37] and XKCD [38]. Another related example is theonline Google Chrome comic [39]. The 39-page instructionmanual, delivered entirely in comic book format, teaches usersabout the inner workings of the Google Chrome browser,including key security concepts and benefits.
There are several advantages to the comic medium. First,it offers an enormous breadth of control to create customizedcontent through a full range of visual symbols, and pairingof words and images to construct a convincing story [34].
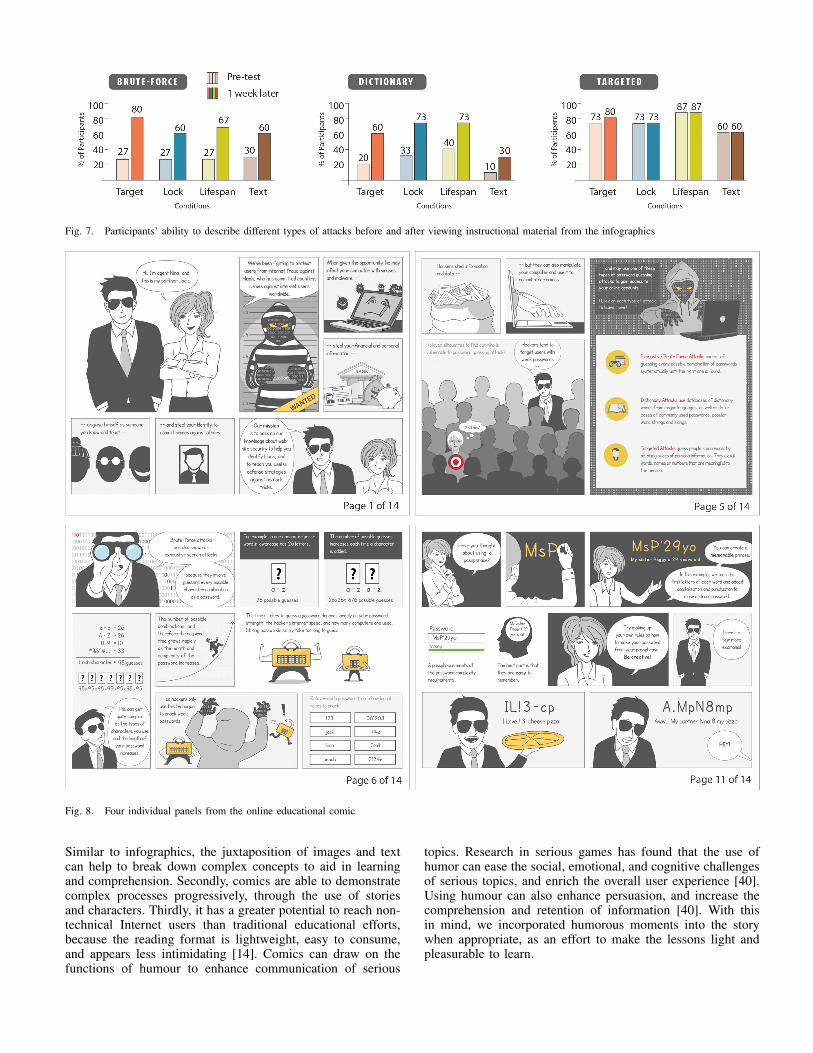
Fig. 7. Participants’ ability to describe different types of attacks before and after viewing instructional material from the infographics
Fig. 8. Four individual panels from the online educational comic
Similar to infographics, the juxtaposition of images and textcan help to break down complex concepts to aid in learningand comprehension. Secondly, comics are able to demonstratecomplex processes progressively, through the use of storiesand characters. Thirdly, it has a greater potential to reach non-technical Internet users than traditional educational efforts,because the reading format is lightweight, easy to consume,and appears less intimidating [14]. Comics can draw on thefunctions of humour to enhance communication of serious
topics. Research in serious games has found that the use ofhumor can ease the social, emotional, and cognitive challengesof serious topics, and enrich the overall user experience [40].Using humour can also enhance persuasion, and increase thecomprehension and retention of information [40]. With thisin mind, we incorporated humorous moments into the storywhen appropriate, as an effort to make the lessons light andpleasurable to learn.

We designed three main characters for the comic. Jack andNina are agents of computer security. They solve computersecurity crimes and protect users against Hack. As the nameimplies, Hack’s mysterious character embodies all computersecurity crimes. Jack and Nina take on the role of mentors whoteach users about password guessing attacks. Characters aredesigned with a sense of humour to make them well-rounded,interesting, and believable [41].
As part of the online comic, we explored interactivity tooffer users additional insights. For example, in the “Types ofAttacks” section of the comic, users can rollover silhouettesof people to see examples of strong and weak passwords.People with weak passwords are highlighted with a targeticon, indicating that they are vulnerable to password guessingattacks. The prototype uses original artwork drawn by usin Adobe Illustrator and programmed in Flash. Participantsviewed the comic as a .swf file on a Macintosh laptop computerduring the study. After study completion, we made the comicaccessible to the public online [15].
VII. INTERACTIVE COMIC USER STUDY
For the comic study, we followed the same study protocoland used identical questionnaires as the infographic study,except the comic took longer to read. Most participants com-pleted the comic in 8 to 10 minutes.
A. Participants
An additional 21 participants were recruited for the comicuser study. To prevent overlap in the learning outcome, par-ticipants from the infographic study were excluded. 20 outof 21 participants reported having difficulties rememberingpasswords (95%). 11 (52%) participants practice passwordreuse, 8 (38%) use personal information, 7 (33%) write downpasswords, 2 (10%) use a password manager, and 1 (5%) storespasswords in email.
In the pretest questionnaire, we received answers from20 out of 21 participants who self-rated their current knowl-edge of password guessing attacks. 9 participants consideredthemselves to be somewhat knowledgeable, and another 10believed they knew very little. Only one declared to be veryknowledgeable. Nine participants reported that the typicallength of the passwords they were using is 6 to 8 characters,and an additional eight said they were using passwords thatare longer than 8 characters. Two participants said the lengthof their passwords depends on the minimum allowed by thesite. Six participants said they are currently using alphanumericcharacters, and an additional 11 are using alphanumeric withspecial characters. Only two participants reported regularlyusing weak passwords (e.g., numbers only).
VIII. INTERACTIVE COMIC USER STUDY RESULTS
A. Post-viewing questionnaire results and feedback
Results of the three Likert scale questions, assessing the ef-fectiveness, usefulness, likelihood to update current passwords,and perceived memorability of the information are presentedin Figure 9. Overall, participants thought the comic was“enjoyable” and “fun”. They thought people would identifywith the characters and wanted to learn more about them. One
Fig. 9. Likert scale responses for the online comic (10 = most positive, 1 =least positive)
participant commented “I think it’s great and some parts arereally funny, I never thought that you could present securityinformation like this before.”
1) Effectiveness for learning: Teaching users about pass-word guessing attacks through a comic book format was over-all well received, with an average score of 9.2 for effectiveness.Visually, most participants found it to be appealing, and said itwas enjoyable to read. A participant said “any time you havecharacters and a story, everything becomes more relatable.”Several of the participants chuckled while reading the comic,which is a reassuring response that the use of humour wasappreciated. A few participants were unsure of the readingdirection at first, and offered layout suggestions for futureiterations.
2) Usefulness of the advice: Users said they gained usefulknowledge from reading the comic (Mean = 9.2). As ex-plained by one participant, “I’ve heard some of this advicebefore, but never in a cohesive fashion like this.” Many userswere familiar with the advice concerning password strength,but gained practical information about password guessingattacks. Participants found the coping strategies to be particu-larity useful to help them remember passwords. They thoughtthat prioritizing strong passwords for important accounts waspractical advice, and that the passphrase is a “smart” technique.
3) Likelihood to update current passwords: Participantsrated the likelihood to update their current password after view-ing the comic. 80% participants said they would most likelyupdate their current passwords. These participants thought thattheir current passwords are insecure, or moderately securebased on the information provided.
4) Memorability of information: The information pro-vided in the comic was perceived to be strongly memorable(Mean = 9.0). Participants were surprised by the visualizationof how quickly computers can crack weak passwords. Somesaid seeing how a single character can significantly increasethe time to crack a password has motivated them to maketheir passwords longer in the future. Participants thought thetips and advice section to be particularly memorable, becauseit shows practical coping strategies that can be easily adopted.
B. Information Retention
Participants’ ability to describe brute-force, dictionary,and targeted attacks was measured in the pretest and in the
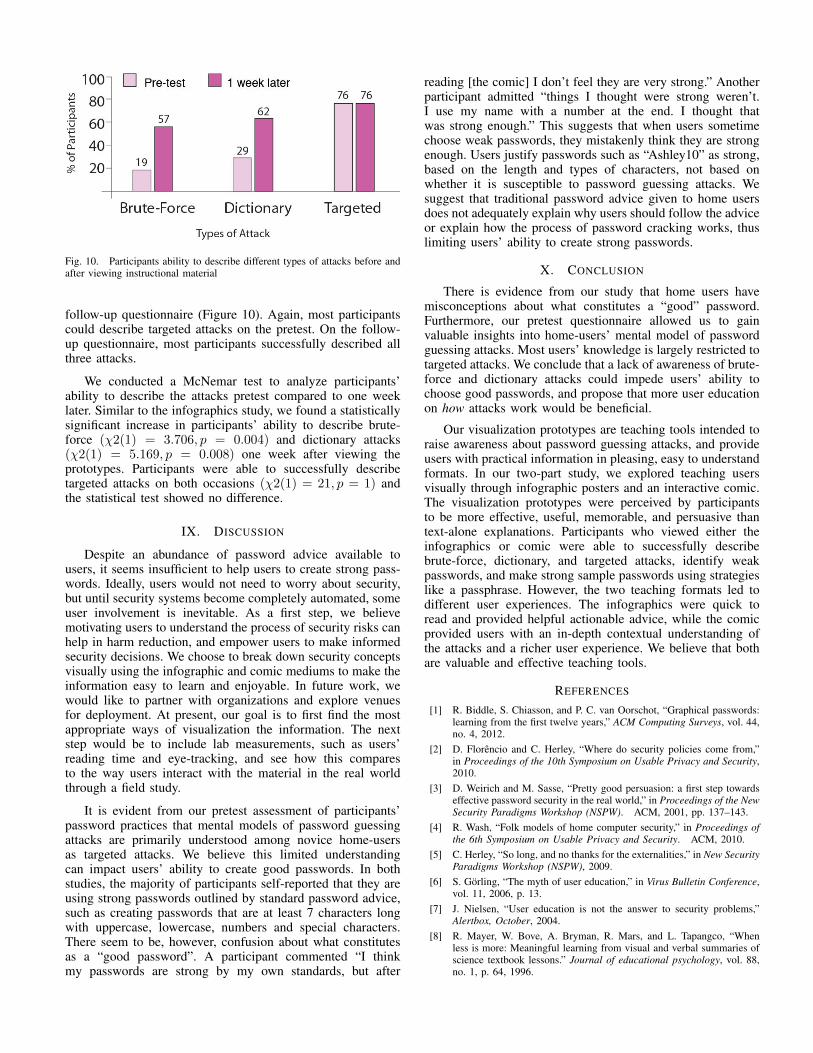
Fig. 10. Participants ability to describe different types of attacks before andafter viewing instructional material
follow-up questionnaire (Figure 10). Again, most participantscould describe targeted attacks on the pretest. On the follow-up questionnaire, most participants successfully described allthree attacks.
We conducted a McNemar test to analyze participants’ability to describe the attacks pretest compared to one weeklater. Similar to the infographics study, we found a statisticallysignificant increase in participants’ ability to describe brute-force (χ2(1) = 3.706, p = 0.004) and dictionary attacks(χ2(1) = 5.169, p = 0.008) one week after viewing theprototypes. Participants were able to successfully describetargeted attacks on both occasions (χ2(1) = 21, p = 1) andthe statistical test showed no difference.
IX. DISCUSSION
Despite an abundance of password advice available tousers, it seems insufficient to help users to create strong pass-words. Ideally, users would not need to worry about security,but until security systems become completely automated, someuser involvement is inevitable. As a first step, we believemotivating users to understand the process of security risks canhelp in harm reduction, and empower users to make informedsecurity decisions. We choose to break down security conceptsvisually using the infographic and comic mediums to make theinformation easy to learn and enjoyable. In future work, wewould like to partner with organizations and explore venuesfor deployment. At present, our goal is to first find the mostappropriate ways of visualization the information. The nextstep would be to include lab measurements, such as users’reading time and eye-tracking, and see how this comparesto the way users interact with the material in the real worldthrough a field study.
It is evident from our pretest assessment of participants’password practices that mental models of password guessingattacks are primarily understood among novice home-usersas targeted attacks. We believe this limited understandingcan impact users’ ability to create good passwords. In bothstudies, the majority of participants self-reported that they areusing strong passwords outlined by standard password advice,such as creating passwords that are at least 7 characters longwith uppercase, lowercase, numbers and special characters.There seem to be, however, confusion about what constitutesas a “good password”. A participant commented “I thinkmy passwords are strong by my own standards, but after
reading [the comic] I don’t feel they are very strong.” Anotherparticipant admitted “things I thought were strong weren’t.I use my name with a number at the end. I thought thatwas strong enough.” This suggests that when users sometimechoose weak passwords, they mistakenly think they are strongenough. Users justify passwords such as “Ashley10” as strong,based on the length and types of characters, not based onwhether it is susceptible to password guessing attacks. Wesuggest that traditional password advice given to home usersdoes not adequately explain why users should follow the adviceor explain how the process of password cracking works, thuslimiting users’ ability to create strong passwords.
X. CONCLUSION
There is evidence from our study that home users havemisconceptions about what constitutes a “good” password.Furthermore, our pretest questionnaire allowed us to gainvaluable insights into home-users’ mental model of passwordguessing attacks. Most users’ knowledge is largely restricted totargeted attacks. We conclude that a lack of awareness of brute-force and dictionary attacks could impede users’ ability tochoose good passwords, and propose that more user educationon how attacks work would be beneficial.
Our visualization prototypes are teaching tools intended toraise awareness about password guessing attacks, and provideusers with practical information in pleasing, easy to understandformats. In our two-part study, we explored teaching usersvisually through infographic posters and an interactive comic.The visualization prototypes were perceived by participantsto be more effective, useful, memorable, and persuasive thantext-alone explanations. Participants who viewed either theinfographics or comic were able to successfully describebrute-force, dictionary, and targeted attacks, identify weakpasswords, and make strong sample passwords using strategieslike a passphrase. However, the two teaching formats led todifferent user experiences. The infographics were quick toread and provided helpful actionable advice, while the comicprovided users with an in-depth contextual understanding ofthe attacks and a richer user experience. We believe that bothare valuable and effective teaching tools.
REFERENCES
[1] R. Biddle, S. Chiasson, and P. C. van Oorschot, “Graphical passwords:learning from the first twelve years,” ACM Computing Surveys, vol. 44,no. 4, 2012.
[2] D. Florencio and C. Herley, “Where do security policies come from,”in Proceedings of the 10th Symposium on Usable Privacy and Security,2010.
[3] D. Weirich and M. Sasse, “Pretty good persuasion: a first step towardseffective password security in the real world,” in Proceedings of the NewSecurity Paradigms Workshop (NSPW). ACM, 2001, pp. 137–143.
[4] R. Wash, “Folk models of home computer security,” in Proceedings ofthe 6th Symposium on Usable Privacy and Security. ACM, 2010.
[5] C. Herley, “So long, and no thanks for the externalities,” in New SecurityParadigms Workshop (NSPW), 2009.
[6] S. Gorling, “The myth of user education,” in Virus Bulletin Conference,vol. 11, 2006, p. 13.
[7] J. Nielsen, “User education is not the answer to security problems,”Alertbox, October, 2004.
[8] R. Mayer, W. Bove, A. Bryman, R. Mars, and L. Tapangco, “Whenless is more: Meaningful learning from visual and verbal summaries ofscience textbook lessons.” Journal of educational psychology, vol. 88,no. 1, p. 64, 1996.

[9] L. Chanlin, “The effects of verbal elaboration and visual elaboration onstudent learning.” International Journal of Instructional Media, vol. 24,no. 4, pp. 333–39, 1997.
[10] ——, “Animation to teach students of different knowledge levels.”Journal of Instructional Psychology, 1998.
[11] J. Risch, “On the role of metaphor in information visualization,” arXivpreprint arXiv:0809.0884, 2008.
[12] P. Kelley, J. Bresee, L. Cranor, and R. Reeder, “A nutrition label forprivacy,” in Proceedings of the 5th Symposium on Usable Privacy andSecurity. ACM, 2009, p. 4.
[13] P. Kumaraguru, S. Sheng, A. Acquisti, L. Cranor, and J. Hong,“Teaching johnny not to fall for phish,” ACM Transactions on InternetTechnology (TOIT), vol. 10, no. 2, p. 7, 2010.
[14] S. Srikwan and M. Jakobsson, “Using cartoons to teach internetsecurity,” Cryptologia, vol. 32, no. 2, pp. 137–154, 2008.
[15] Zhang-Kennedy, L. and Chiasson, S. and Biddle, R., “Versipass,”http://www.versipass.com/edusec/.
[16] S. Gaw and E. Felten, “Password management strategies for onlineaccounts,” in Proceedings of the 2nd Symposium on Usable Privacyand Security. ACM, 2006, pp. 44–55.
[17] M. Devillers, “Analyzing password strength,” Radboud University Ni-jmegen, Tech. Rep, 2010.
[18] F. Asgharpour, D. Liu, and L. Camp, “Mental models of security risks,”Financial Cryptography and Data Security, pp. 367–377, 2007.
[19] L. Camp, “Mental models of privacy and security,” Technology andSociety Magazine, IEEE, vol. 28, no. 3, pp. 37–46, 2009.
[20] R. Wash and E. Rader, “Influencing mental models of security: Aresearch agenda,” in Proceedings of the New Security ParadigmsWorkshop (NSPW). ACM, 2011, pp. 57–66.
[21] A. Paivio, “Dual coding theory: Retrospect and current status.” Cana-dian Journal of Psychology/Revue canadienne de psychologie, vol. 45,no. 3, p. 255, 1991.
[22] V. Gyselinck and H. Tardieu, “The role of illustrations in text compre-hension: What, when, for whom, and why?” 1999.
[23] H. M. Cuevas, S. M. Fiore, and R. L. Oser, “Scaffolding cognitiveand metacognitive processes in low verbal ability learners: Use of dia-grams in computer-based training environments,” Instructional Science,vol. 30, no. 6, pp. 433–464, 2002.
[24] G. Lakoff and M. Johnson, “The metaphorical structure of the humanconceptual system,” Cognitive Science, vol. 4, no. 2, pp. 195–208, 2010.
[25] F. Raja, K. Hawkey, S. Hsu, K. Wang, and K. Beznosov, “A brick wall,a locked door, and a bandit: a physical security metaphor for firewallwarnings,” in Proceedings of the 7th Symposium on Usable Privacy andSecurity. ACM, 2011.
[26] A. Marcus, “Metaphors and user interfaces in the 21st century,” inter-actions, vol. 9, no. 2, pp. 7–10, 2002.
[27] Royal Bank of Canada, “Don’t be a Target,” Accessed March 2013,http://www.rbc.com/privacysecurity/ca/popup-dont-be-a-target.html.
[28] Fontana, J., “Password life expectancy down to seconds,” AccessedMarch 2013, http://www.zdnet.com/password-life-expectancy-down-to-seconds-7000009851.
[29] Microsoft Developer Network, “Password Policy,” Accessed March2013, http://msdn.microsoft.com/en-us/library/ms161959.aspx.
[30] Deloitte, “P@$$1234: the end of strong password-only security,”Accessed March 2013, http://deloitte.com/view/en_GX/global/industries/ technologymedia-telecommunications/tmt-predictions-2013.
[31] G. Notoatmodjo and C. Thomborson, “Passwords and perceptions,”in Proceedings of the 7th Australasian Conference on InformationSecurity-Volume 98. Australian Computer Society, Inc., 2009, pp. 71–78.
[32] M. Keith, B. Shao, and P. Steinbart, “A behavioral analysis of passphrasedesign and effectiveness,” Journal of the Association for InformationSystems, vol. 10, no. 2, pp. 63–89, 2009.
[33] M. Smiciklas, The Power of Infographics: Using Pictures to Commu-nicate and Connect With Your Audiences. Que Publishing, 2012.
[34] S. McCloud, Reinventing comics: How imagination and technology arerevolutionizing an art form. William Morrow Paperbacks, 2000.
[35] Wikipedia, “Password Cracking,” Accessed March 2013,http://en.wikipedia.org/wiki/Password_cracking.
[36] J. Yan, A. Blackwell, R. Anderson, and A. Grant, “Password memora-bility and security: Empirical results,” Security & Privacy, IEEE, vol. 2,no. 5, pp. 25–31, 2004.
[37] Adams, S., “Dilbert,” Accessed December 2012,http://search.dilbert.com/comic/Security.
[38] Munroe, R., “XKCD: a webcomic of romance, sarcasm, math, andlanguage,” Accessed December 2012, http://xkcd.com/936/.
[39] Google Chrome Team, McCloud, S., “Google Chrome,” Accessed June2012, http://www.google.com/googlebooks/chrome.
[40] C. Dormann and R. Biddle, “A review of humor for computer games:Play, laugh and more,” Simulation & gaming, vol. 40, no. 6, pp. 802–824, 2009.
[41] A. Nijholt, “Embodied agents: A new impetus to humor research,” inThe April Fools’ Day Workshop on Computational Humour, ser. TwenteWorkshops on Language Technology, vol. 20. University of Twente,2002.