past, present, and future the amazing, changing lausd ... · pdf filepast, present, and future...
TRANSCRIPT

Past, Present, and FutureThe Amazing, Changing
LAUSD EnrollmentPresentation to
The Budget, Facilities, and Audit CommitteeBy Facilities Division, Master Planning and Demographics
December 11, 2014
Agenda Item #3

More Than Just Numbers Enrollment history Dynamics of enrollment change Projecting enrollment Enrollment forecasts Areas of growth – 5 year change Assessment of enrollment impacted schools Determining need for added capacity Looking forward
December 11, 2014
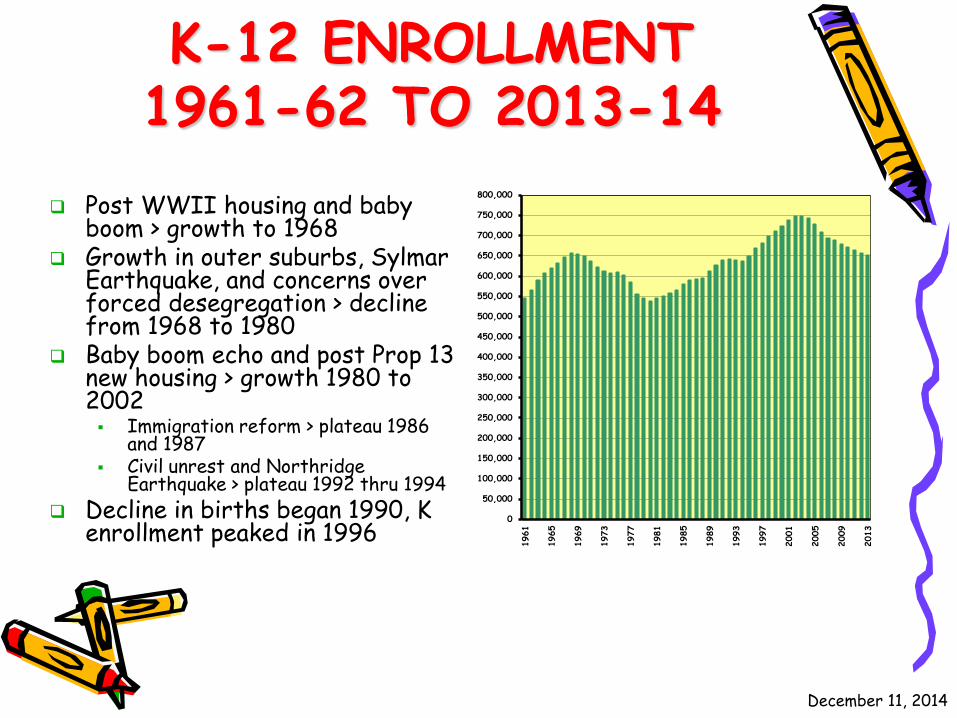
K-12 ENROLLMENT1961-62 TO 2013-14
Post WWII housing and baby boom > growth to 1968
Growth in outer suburbs, Sylmar Earthquake, and concerns over forced desegregation > decline from 1968 to 1980
Baby boom echo and post Prop 13 new housing > growth 1980 to 2002 Immigration reform > plateau 1986
and 1987 Civil unrest and Northridge
Earthquake > plateau 1992 thru 1994 Decline in births began 1990, K
enrollment peaked in 19960
50,000
100,000
150,000
200,000
250,000
300,000
350,000
400,000
450,000
500,000
550,000
600,000
650,000
700,000
750,000
800,000
1961
1965
1969
1973
1977
1981
1985
1989
1993
1997
2001
2005
2009
2013
December 11, 2014

PRIVATE SCHOOL ENROLLMENT1981-82 TO 2013-14
60,00065,00070,00075,00080,00085,00090,00095,000
100,000105,000110,000115,000120,000
1981
1985
1989
1993
1997
2001
2005
2009
2013
0%1%2%3%4%5%6%7%8%9%
10%11%12%13%14%15%16%17%18%19%20%
1981
1985
1989
1993
1997
2001
2005
2009
2013
Increases/decreases similar to LAUSD’s Declining market share within LAUSD
Source: California Department of Education, private school affidavits
529 schools in 2003; 439 schools in 2013
December 11, 2014

DYNAMICS OF CHANGE Incoming group
Births in general population Kindergarten in enrollment
Outgoing group Deaths in general population 12th grade/graduates in enrollment
Incoming minus Outgoing = Natural Increase
Fluctuation in core group = Net Change Difference of in/out migration in general population Grade to grade retention in enrollment
Natural Increase + Net Change = Overall Change
December 11, 2014

ENROLLMENT PROJECTIONS: ANALYSIS AND ASSUMPTIONS
Births in LAUSD and LA County Used to develop forecasts for Kindergarten and 1st Grade
enrollment Cohort Survival Rates
Statistics showing the percentage of students who progress from one grade to another within LAUSD
Factors considered in projection modeling Migration and immigration New housing development Ethnic shifts Health of the economy
December 11, 2014

BIRTHS IN LA COUNTY
0
25,000
50,000
75,000
100,000
125,000
150,000
175,000
200,000
225,00019
8019
8119
8219
8319
8419
8519
8619
8719
8819
8919
9019
9119
9219
9319
9419
9519
9619
9719
9819
9920
0020
0120
0220
0320
0420
0520
0620
0720
0820
0920
1020
1120
1220
1320
1420
1520
1620
1720
1820
1920
2020
2120
22
Sources: Actual births thru 2012, CA Dept. of Health Services, Ctr. for Health Statistics. Projected births: CA Dept of Finance, Demographic Research Unit.
December 11, 2014

Overall Enrollment Change
050,000
100,000150,000200,000250,000300,000350,000400,000450,000500,000550,000600,000
1972
1973
1974
1975
1976
1977
1978
1979
1980
1981
1982
1983
1984
1985
1986
1987
1988
1989
1990
1991
1992
1993
1994
1995
1996
1997
1998
1999
2000
2001
2002
2003
2004
2005
2006
2007
2008
2009
2010
2011
2012
2013
December 11, 2014

Enrollment Change by Grade
050,000
100,000150,000200,000250,000300,000350,000400,000450,000500,000550,000600,000
1972
1973
1974
1975
1976
1977
1978
1979
1980
1981
1982
1983
1984
1985
1986
1987
1988
1989
1990
1991
1992
1993
1994
1995
1996
1997
1998
1999
2000
2001
2002
2003
2004
2005
2006
2007
2008
2009
2010
2011
2012
2013
K 1 2 3 4 5 6 7 8
December 11, 2014
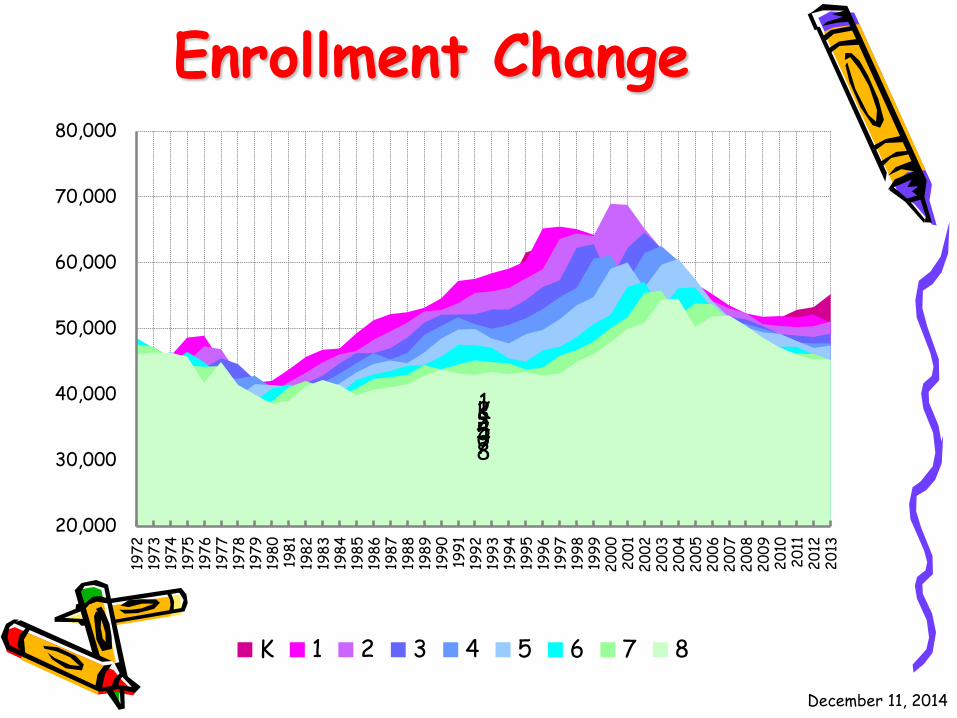
Enrollment Change
K12345678
20,000
30,000
40,000
50,000
60,000
70,000
80,00019
7219
7319
7419
7519
7619
7719
7819
7919
8019
8119
8219
8319
8419
8519
8619
8719
8819
8919
9019
9119
9219
9319
9419
9519
9619
9719
9819
9920
0020
0120
0220
0320
0420
0520
0620
0720
0820
0920
1020
1120
1220
13
K 1 2 3 4 5 6 7 8
December 11, 2014
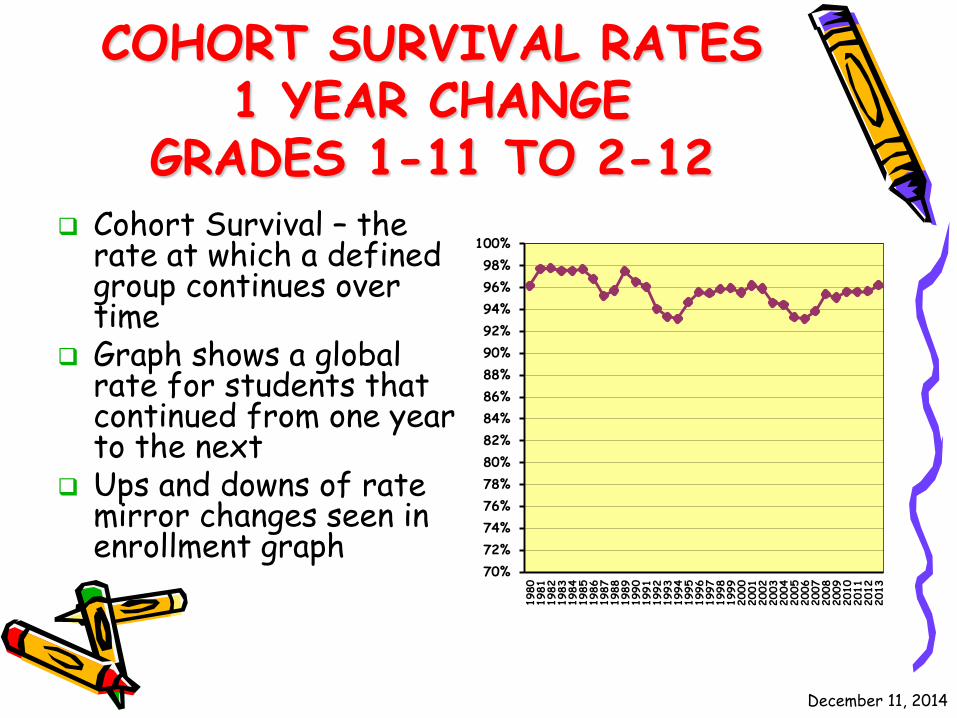
COHORT SURVIVAL RATES1 YEAR CHANGE
GRADES 1-11 TO 2-12 Cohort Survival – the
rate at which a defined group continues over time
Graph shows a global rate for students that continued from one year to the next
Ups and downs of rate mirror changes seen in enrollment graph
70%72%74%76%78%80%82%84%86%88%90%92%94%96%98%
100%
1980
1981
1982
1983
1984
1985
1986
1987
1988
1989
1990
1991
1992
1993
1994
1995
1996
1997
1998
1999
2000
2001
2002
2003
2004
2005
2006
2007
2008
2009
2010
2011
2012
2013
December 11, 2014
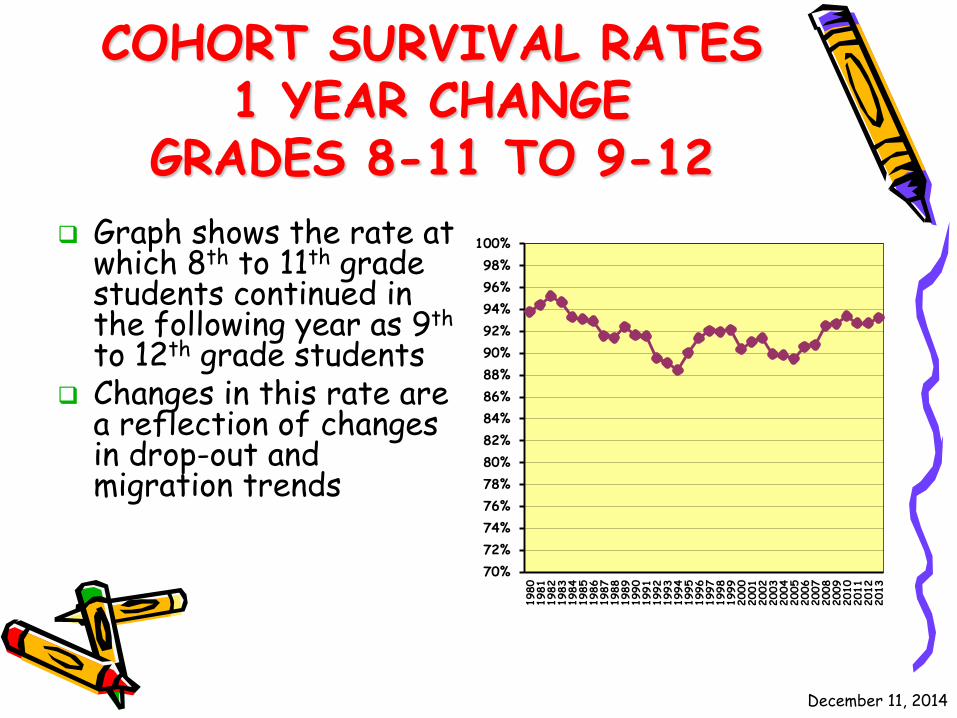
COHORT SURVIVAL RATES1 YEAR CHANGE
GRADES 8-11 TO 9-12 Graph shows the rate at
which 8th to 11th grade students continued in the following year as 9th
to 12th grade students Changes in this rate are
a reflection of changes in drop-out and migration trends
70%72%74%76%78%80%82%84%86%88%90%92%94%96%98%
100%
1980
1981
1982
1983
1984
1985
1986
1987
1988
1989
1990
1991
1992
1993
1994
1995
1996
1997
1998
1999
2000
2001
2002
2003
2004
2005
2006
2007
2008
2009
2010
2011
2012
2013
December 11, 2014
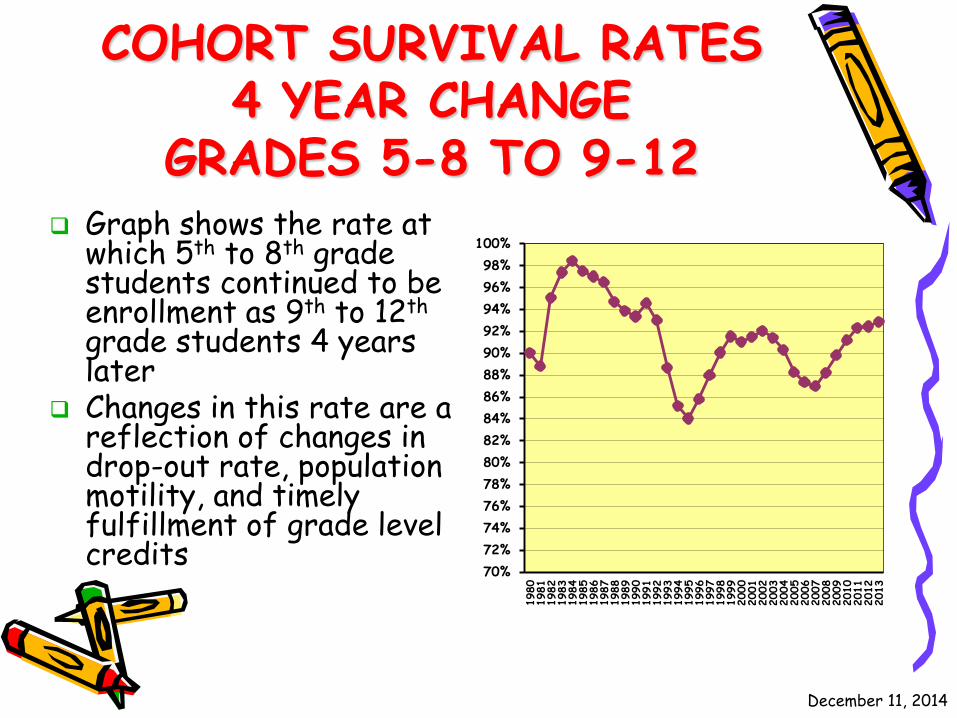
COHORT SURVIVAL RATES4 YEAR CHANGE
GRADES 5-8 TO 9-12 Graph shows the rate at
which 5th to 8th grade students continued to be enrollment as 9th to 12th
grade students 4 years later
Changes in this rate are a reflection of changes in drop-out rate, population motility, and timely fulfillment of grade level credits
70%72%74%76%78%80%82%84%86%88%90%92%94%96%98%
100%
1980
1981
1982
1983
1984
1985
1986
1987
1988
1989
1990
1991
1992
1993
1994
1995
1996
1997
1998
1999
2000
2001
2002
2003
2004
2005
2006
2007
2008
2009
2010
2011
2012
2013
December 11, 2014
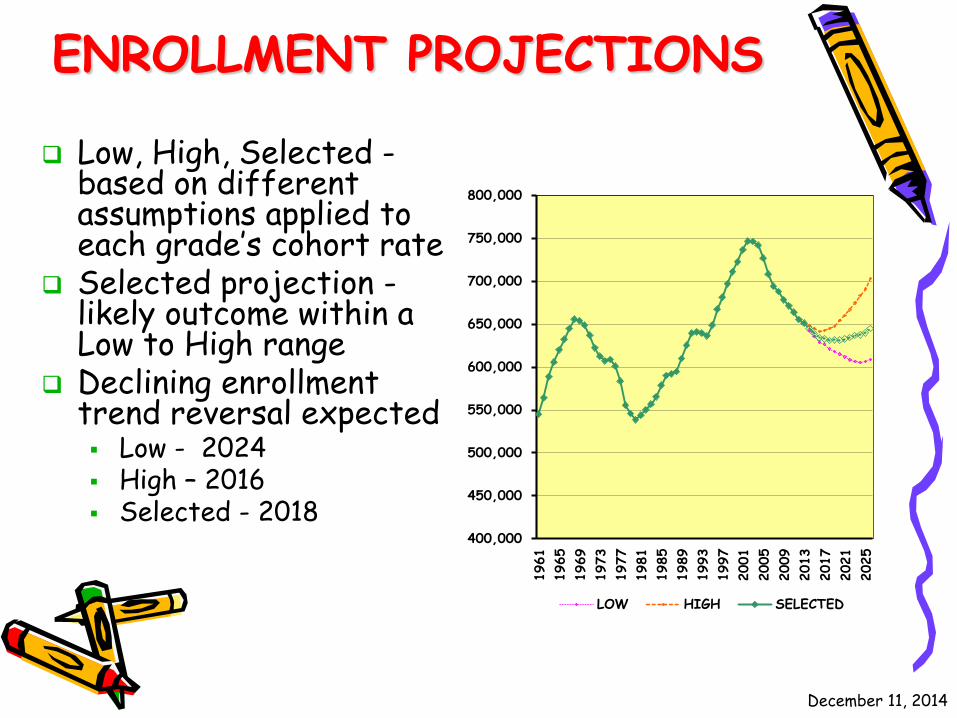
ENROLLMENT PROJECTIONS
Low, High, Selected -based on different assumptions applied to each grade’s cohort rate
Selected projection -likely outcome within a Low to High range
Declining enrollment trend reversal expected Low - 2024 High – 2016 Selected - 2018
400,000
450,000
500,000
550,000
600,000
650,000
700,000
750,000
800,000
1961
1965
1969
1973
1977
1981
1985
1989
1993
1997
2001
2005
2009
2013
2017
2021
2025
LOW HIGH SELECTED
December 11, 2014
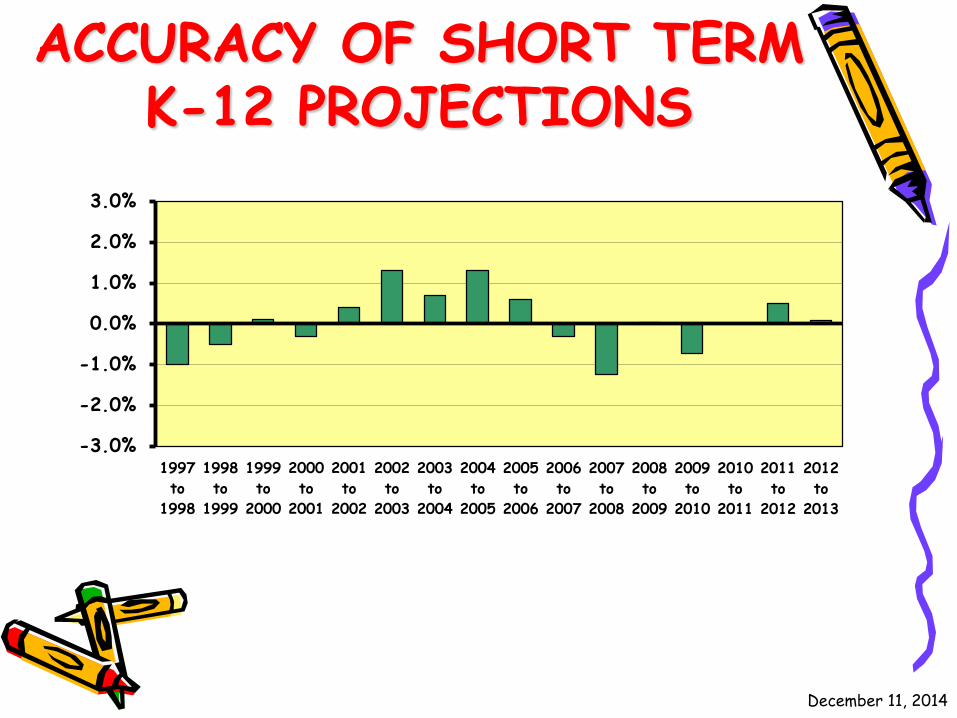
ACCURACY OF SHORT TERM K-12 PROJECTIONS
-3.0%
-2.0%
-1.0%
0.0%
1.0%
2.0%
3.0%
1997to
1998
1998to
1999
1999to
2000
2000to
2001
2001to
2002
2002to
2003
2003to
2004
2004to
2005
2005to
2006
2006to
2007
2007to
2008
2008to
2009
2009to
2010
2010to
2011
2011to
2012
2012to
2013
December 11, 2014

INVOLUNTARY BUSSING AND MULTI-TRACK
Schools withInvoluntary Bussing
0
20
40
60
80
100
120
2003
-04
2004
-05
2005
-06
2006
-07
2007
-08
2008
-09
2009
-10
2010
-11
2011
-12
2012
-13
2013
-14
Schools withMulti-track Calendar
0
50
100
150
200
250
2002
-03
2003
-04
2004
-05
2005
-06
2006
-07
2007
-08
2008
-09
2009
-10
2010
-11
2011
-12
2012
-13
2013
-14
December 11, 2014
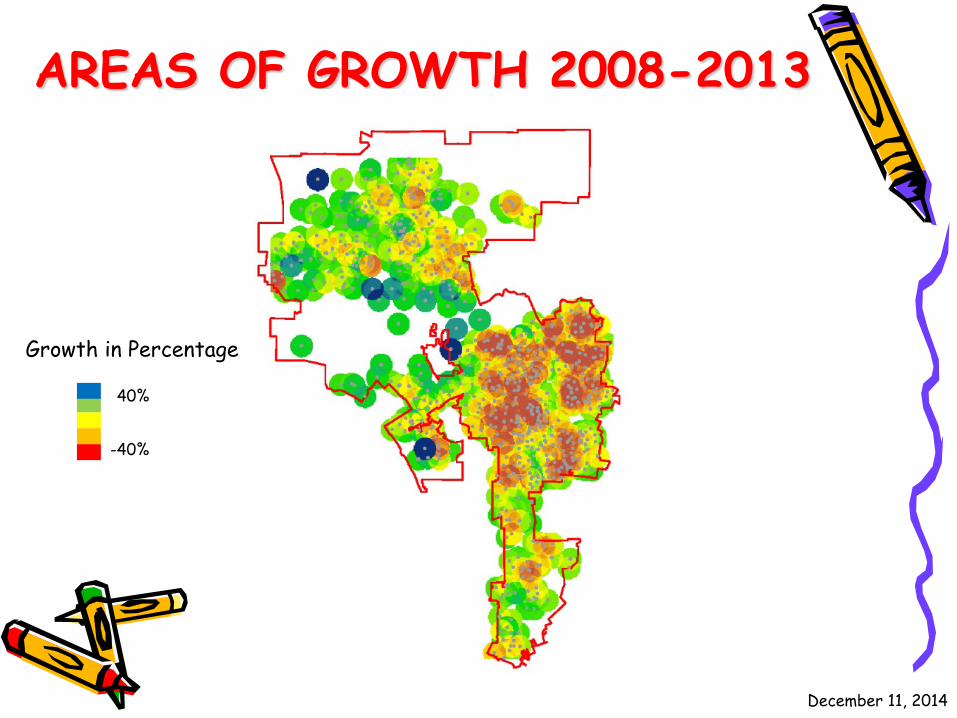
AREAS OF GROWTH 2008-2013
Growth in Percentage
40%
-40%
December 11, 2014
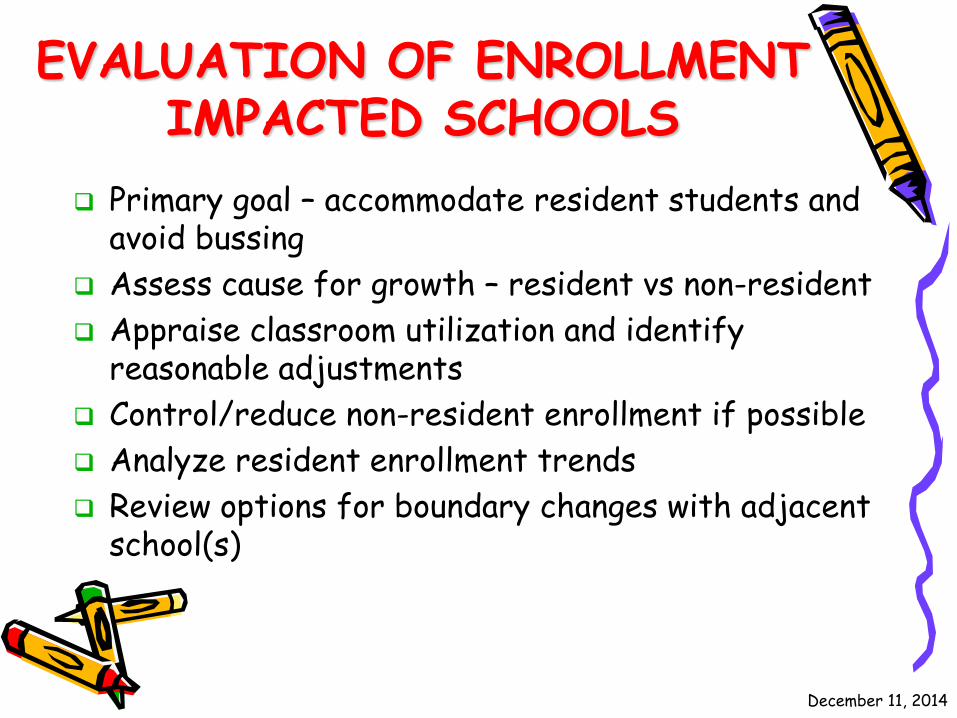
EVALUATION OF ENROLLMENT IMPACTED SCHOOLS
Primary goal – accommodate resident students and avoid bussing
Assess cause for growth – resident vs non-resident Appraise classroom utilization and identify
reasonable adjustments Control/reduce non-resident enrollment if possible Analyze resident enrollment trends Review options for boundary changes with adjacent
school(s)
December 11, 2014
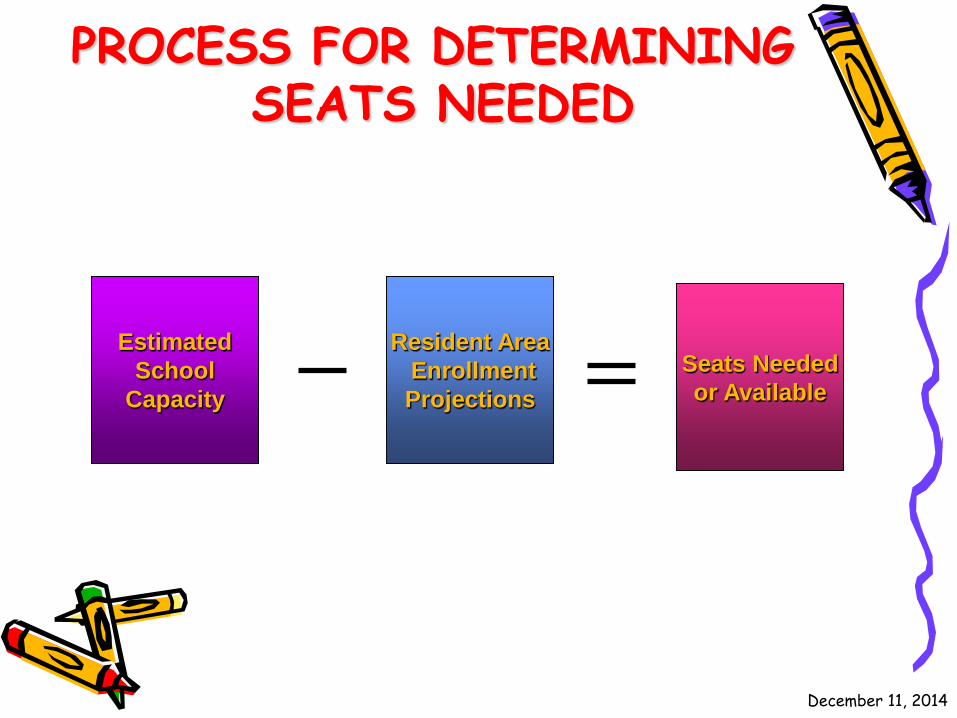
Resident AreaEnrollmentProjections
EstimatedSchool
Capacity
PROCESS FOR DETERMININGSEATS NEEDED
Seats Neededor Available
December 11, 2014

SCHOOL CAPACITY CALCULATION ASSUMPTIONS
Inventory of existing classrooms based on data validated during Capacity Assessment Roadshow
Allocation of classrooms for Special Education programs and ‘set-aside’ use based on Board approved guidelines1
Single track calendar and classroom loading as applicable based on Norm category and operational model
School configurations remain as current
1 – Policy Research and Development Communication No. 1 to the Board of Education on November 17, 1997 GOALS AND GUIDELINES TODEVELOP A FACILITIES MASTER PLAN FOR SCHOOL CONSTRUCTION
EstimatedSchool
Capacity
December 11, 2014
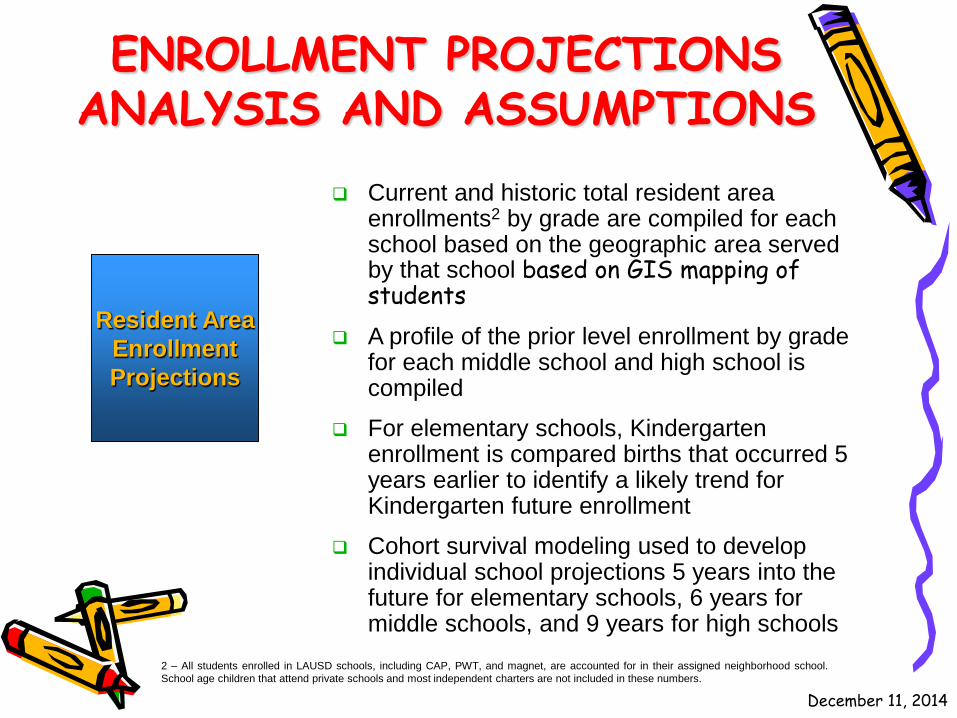
ENROLLMENT PROJECTIONS ANALYSIS AND ASSUMPTIONS
Current and historic total resident area enrollments2 by grade are compiled for each school based on the geographic area served by that school based on GIS mapping of students
A profile of the prior level enrollment by grade for each middle school and high school is compiled
For elementary schools, Kindergarten enrollment is compared births that occurred 5 years earlier to identify a likely trend for Kindergarten future enrollment
Cohort survival modeling used to develop individual school projections 5 years into the future for elementary schools, 6 years for middle schools, and 9 years for high schools
2 – All students enrolled in LAUSD schools, including CAP, PWT, and magnet, are accounted for in their assigned neighborhood school.School age children that attend private schools and most independent charters are not included in these numbers.
Resident AreaEnrollmentProjections
December 11, 2014

EstimatedSchool
Capacity
IMPACT OF POLICIES
Alternative classroom loading will increase or decrease the estimated capacity of a school
Modification of teacher traveling requirement in the utilization of classrooms will change the capacity of a school
Implementation of standard protocol for utilization of schools facilities may change capacity
Resident AreaEnrollmentProjections
Students attending another school by choice (i.e. Open Enrollment, Permit, PWT, charter) can be considered to be appropriately accommodated
Students involuntarily attending another school (i.e. CAP, Satellite Zone) are included in assessment of need at their neighborhood school.
Projected resident area enrollment 5 to 9 years from baseline enrollment
December 11, 2014
Looking ForwardSustainment of promise of single-
track, neighborhood schools Modernization planning will include
assessment of schools’ abilities to meet enrollment demands
December 11, 2014

QUESTIONS AND DISCUSSION
December 11, 2014