pasture / forage irrigation options & economicpasture / forage irrigation options & economic...
TRANSCRIPT
Pasture / Forage Irrigation Options & Economic
Lyndon KelleyMSU Extension/Purdue University Irrigation
Management Agent269/467-5511
www.msue.msu.edu - find St. Joseph Co.- then hit the Irrigation button
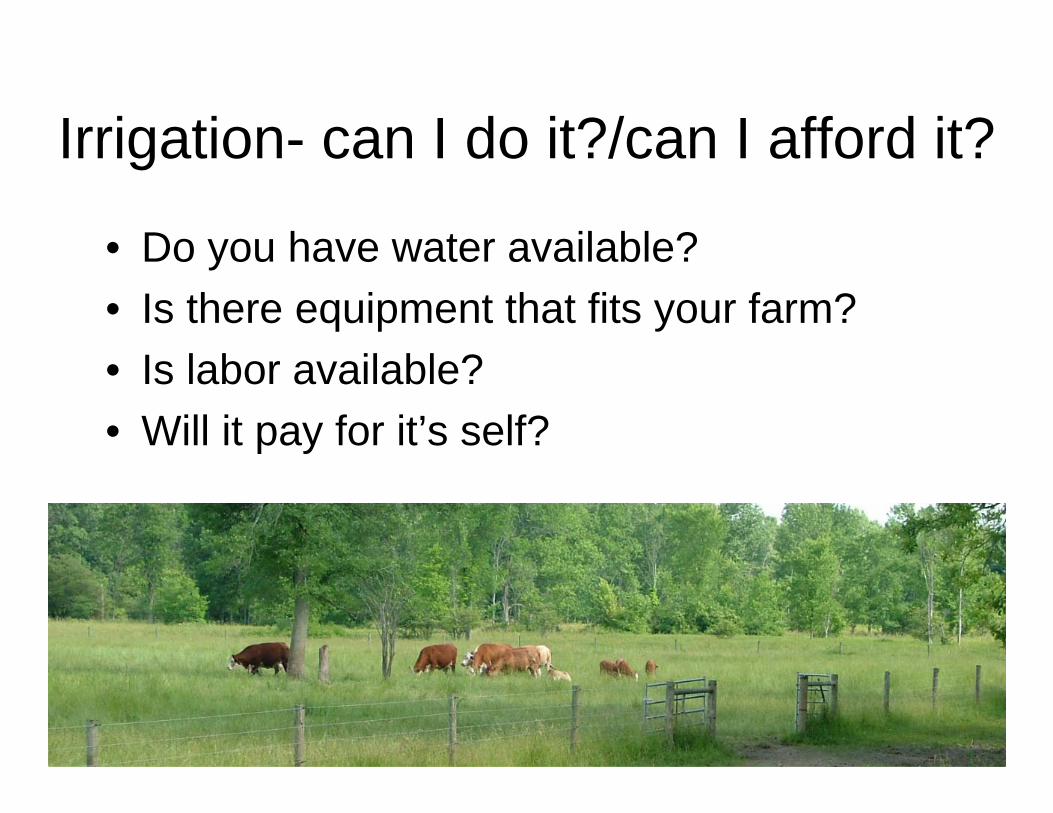
Irrigation- can I do it?/can I afford it?
• Do you have water available?• Is there equipment that fits your farm?• Is labor available?• Will it pay for it’s self?
0
1
2
3
4
5
6
7
Jan Feb Mar Apr May June July Aug Sept Oct Nov Dec
Inch
es o
f Wat
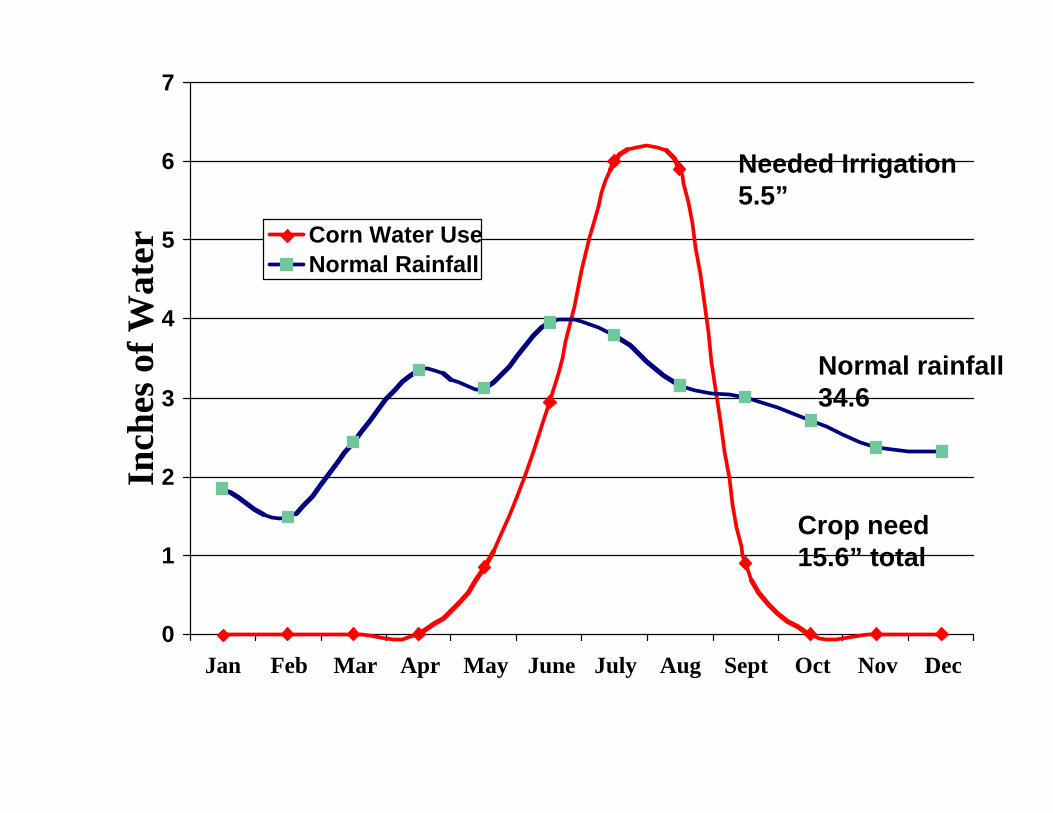
er Corn Water UseNormal Rainfall
Crop need15.6” total
Normal rainfall34.6
Needed Irrigation5.5”
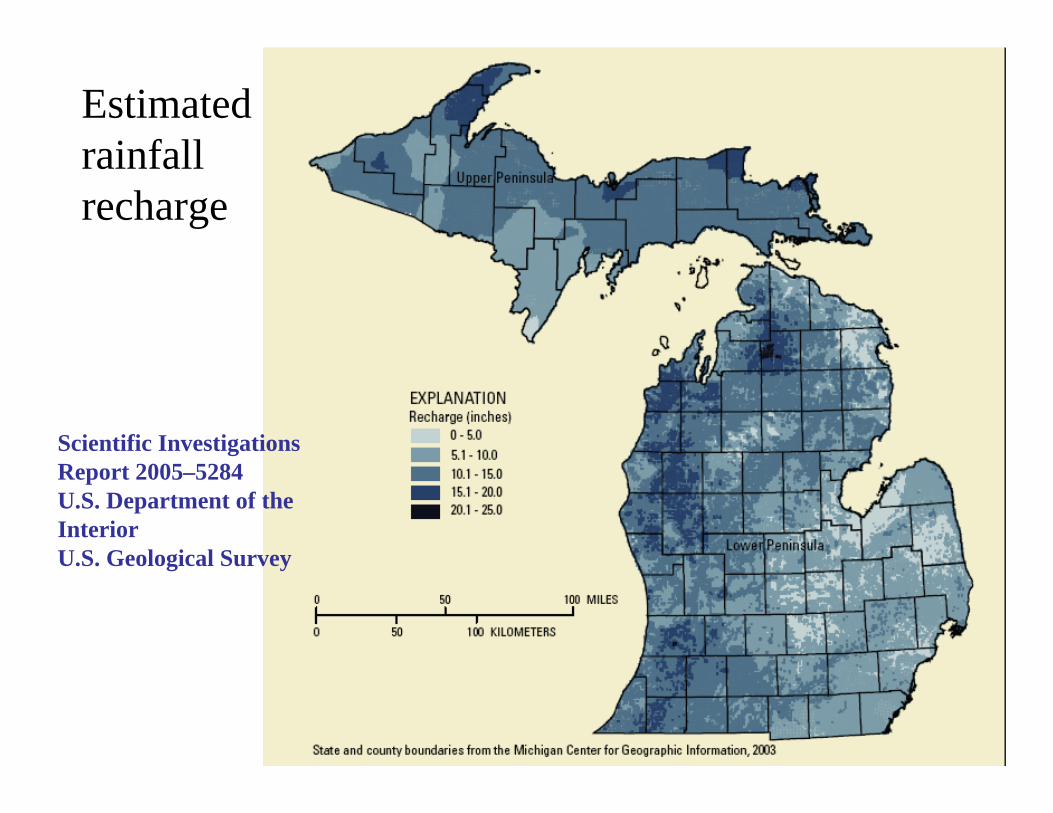
Scientific Investigations Report 2005–5284U.S. Department of the InteriorU.S. Geological Survey
Estimated rainfall recharge
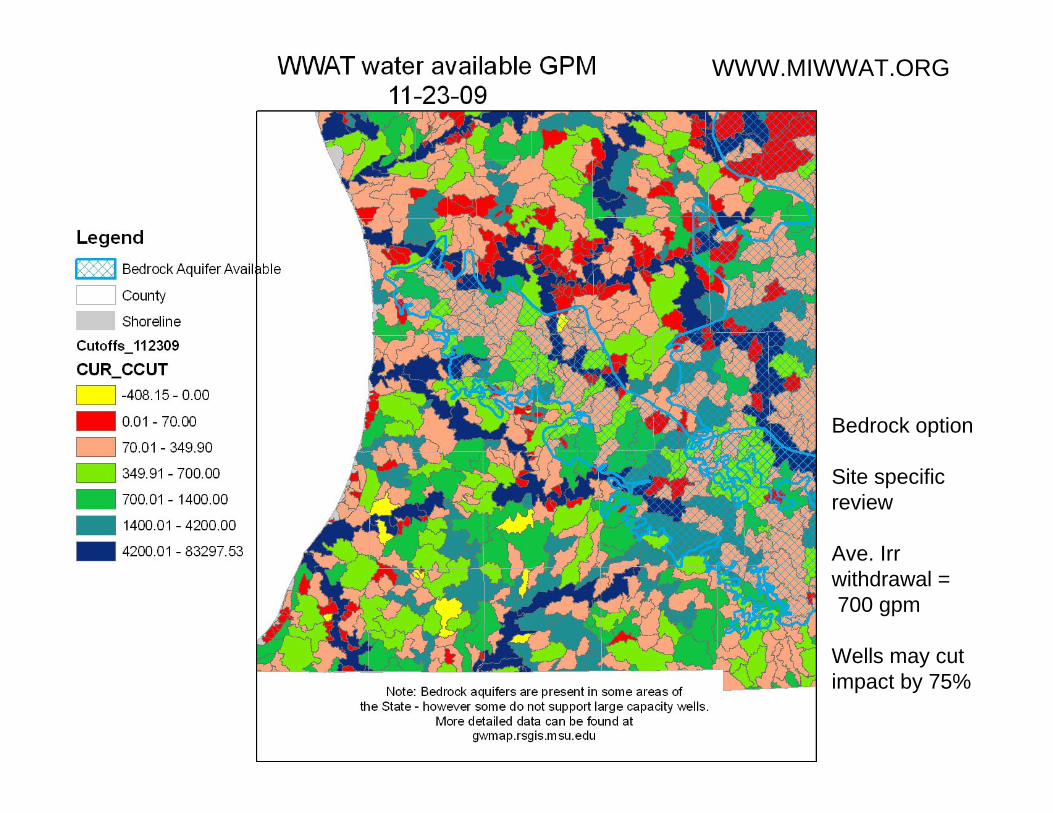
Bedrock option
Site specific review
Ave. Irr withdrawal =700 gpm
Wells may cut impact by 75%
WWW.MIWWAT.ORG
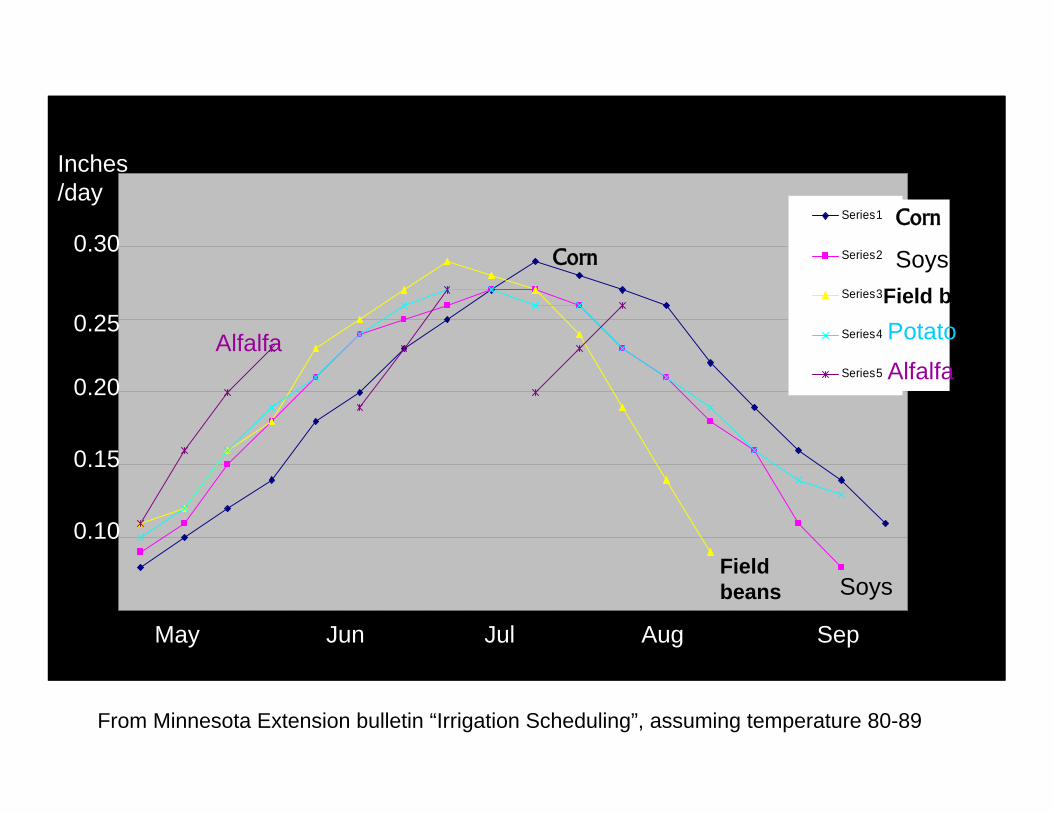
Crop Water use curve
0
0.05
0.1
0.15
0.2
0.25
0.3
1 2 3 4 5 6 7 8 9 10 11 12 13 14 15 16 17 18
Weeks after emergence
Wat
er u
se (i
nche
s)
Series1
Series2
Series3
Series4
Series5
Field beans Soys
Corn
Alfalfa
Field beans
Corn
Soys
Potato
Alfalfa
From Minnesota Extension bulletin “Irrigation Scheduling”, assuming temperature 80-89
0.30
0.25
0.20
0.10
0.15
Inches /day
May Jun Jul Aug Sep
Corn
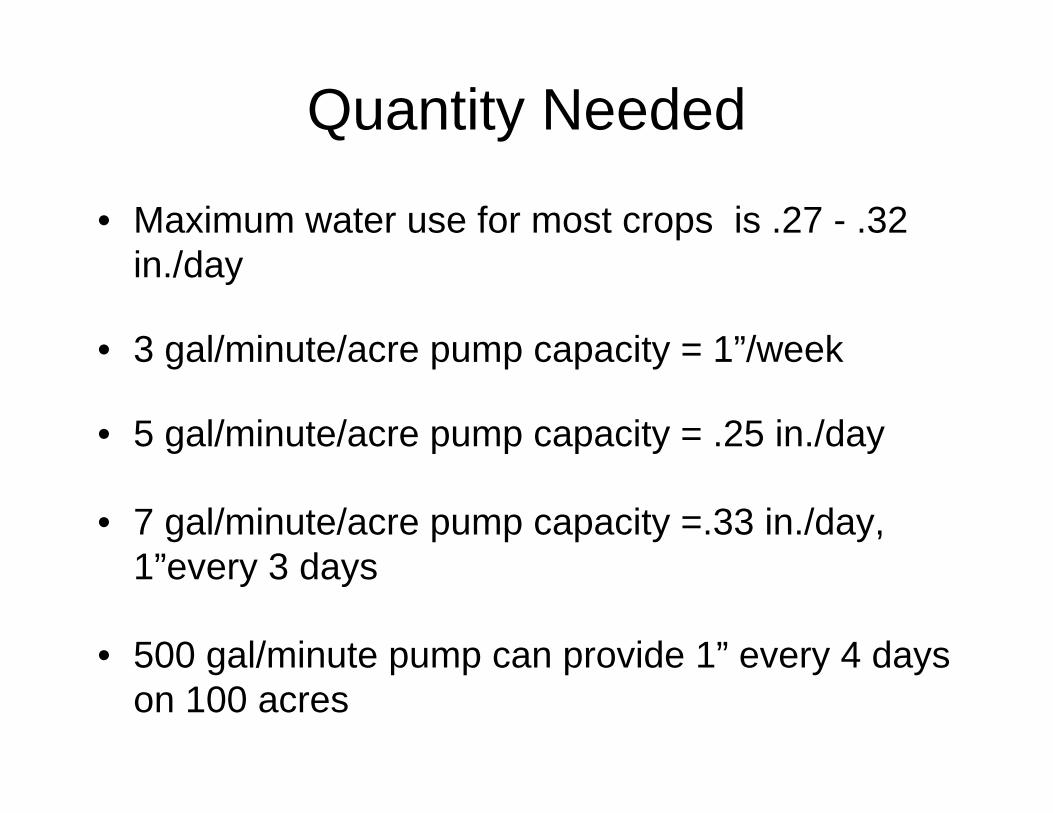
Quantity Needed
• Maximum water use for most crops is .27 - .32 in./day
• 3 gal/minute/acre pump capacity = 1”/week
• 5 gal/minute/acre pump capacity = .25 in./day
• 7 gal/minute/acre pump capacity =.33 in./day, 1”every 3 days
• 500 gal/minute pump can provide 1” every 4 days on 100 acres
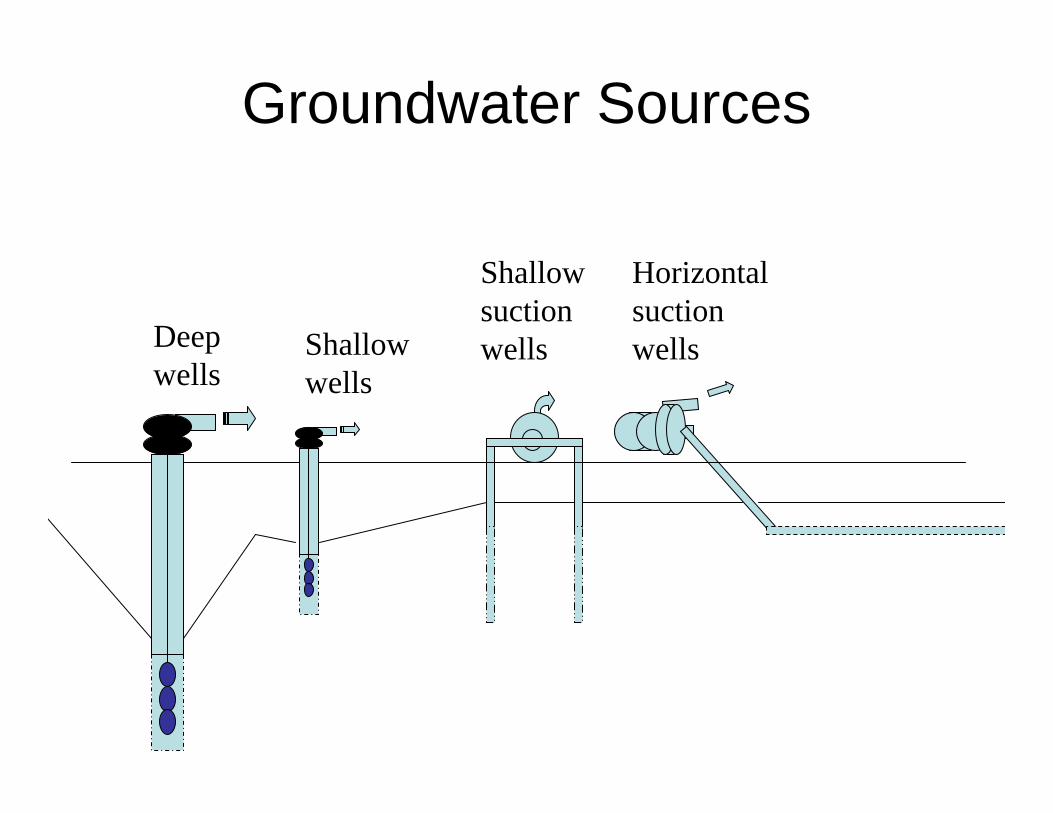
Groundwater Sources
Deep wells
Shallow wells
Shallow suction wells
Horizontal suction wells
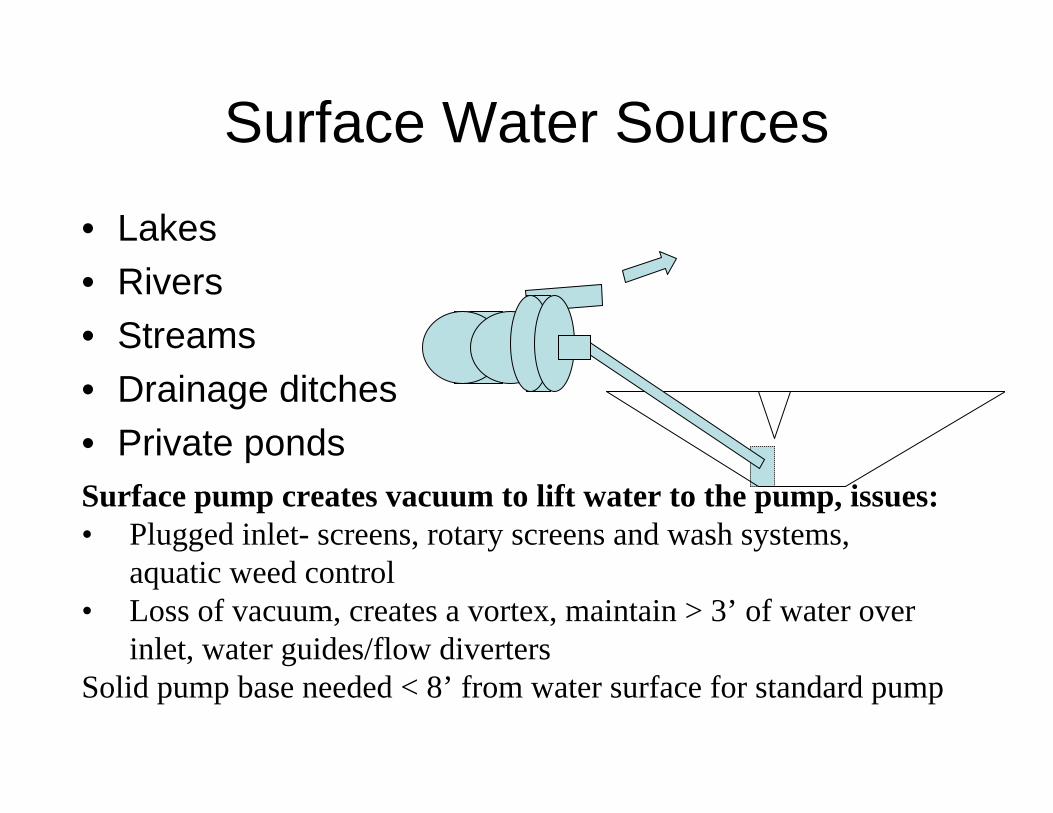
Surface Water Sources
• Lakes • Rivers• Streams• Drainage ditches• Private pondsSurface pump creates vacuum to lift water to the pump, issues:• Plugged inlet- screens, rotary screens and wash systems,
aquatic weed control• Loss of vacuum, creates a vortex, maintain > 3’ of water over
inlet, water guides/flow divertersSolid pump base needed < 8’ from water surface for standard pump
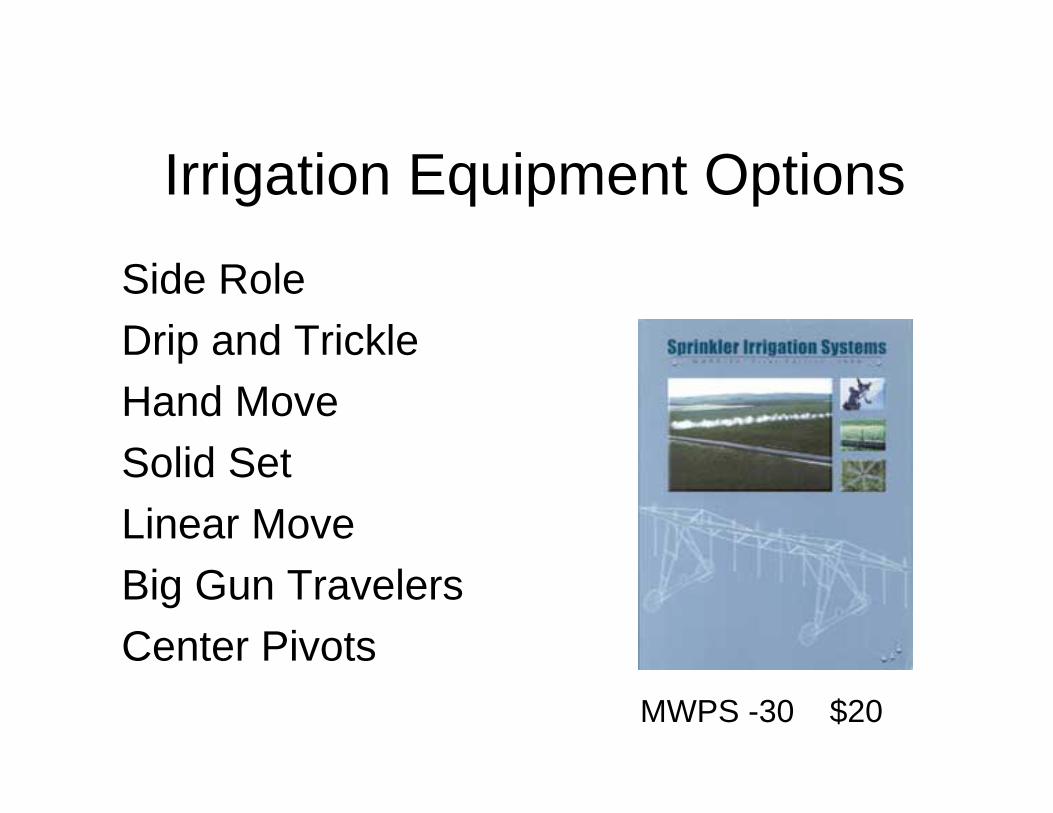
Irrigation Equipment Options
Side Role Drip and Trickle Hand Move Solid SetLinear MoveBig Gun TravelersCenter Pivots
MWPS -30 $20
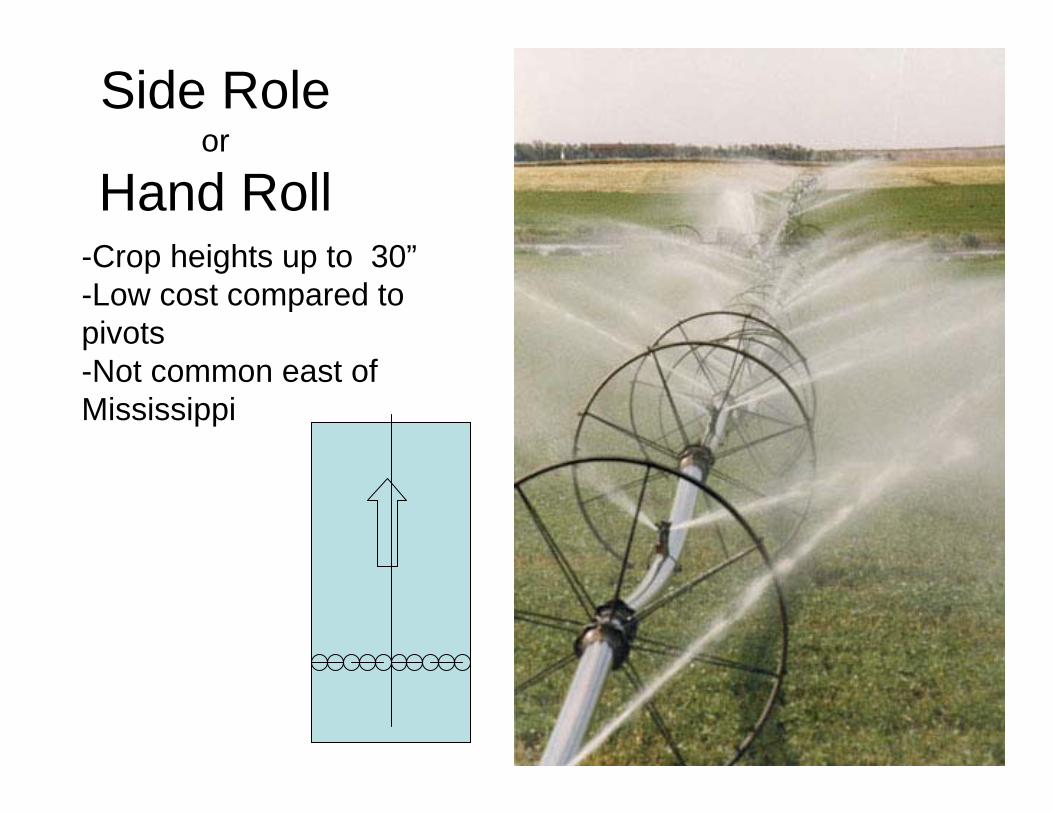
Side Roleor
Hand Roll-Crop heights up to 30”-Low cost compared to pivots-Not common east of Mississippi
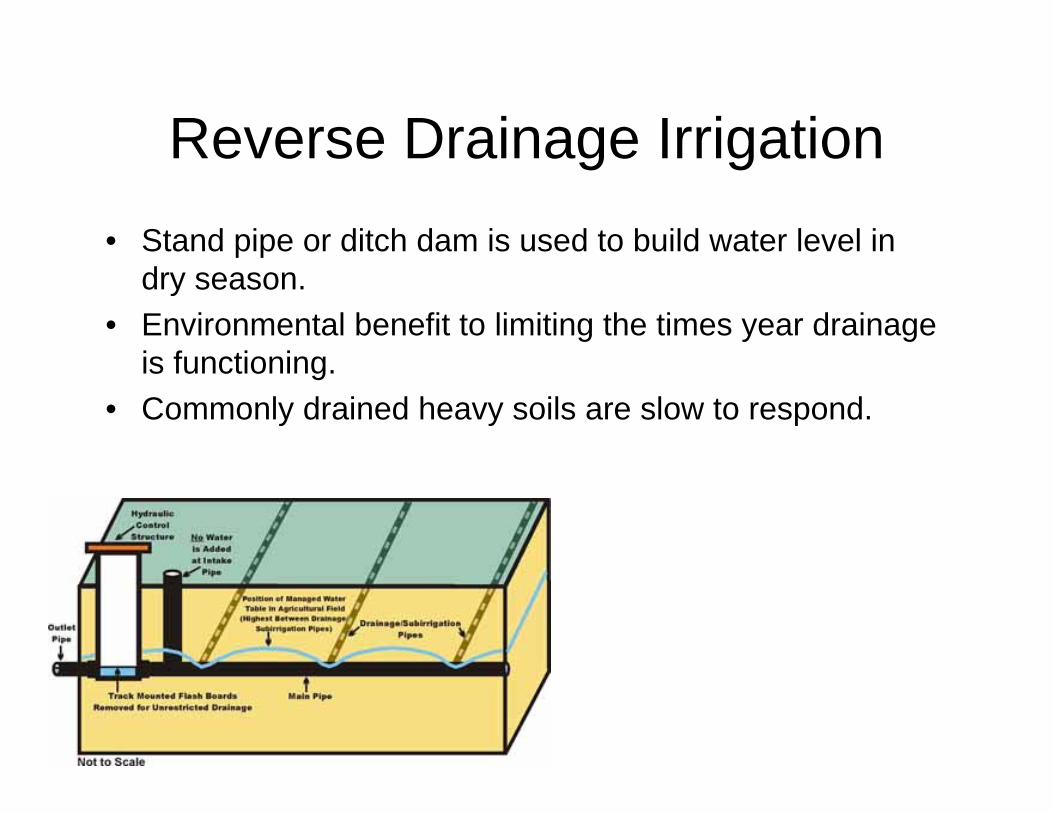
Reverse Drainage Irrigation• Stand pipe or ditch dam is used to build water level in
dry season.• Environmental benefit to limiting the times year drainage
is functioning.• Commonly drained heavy soils are slow to respond.
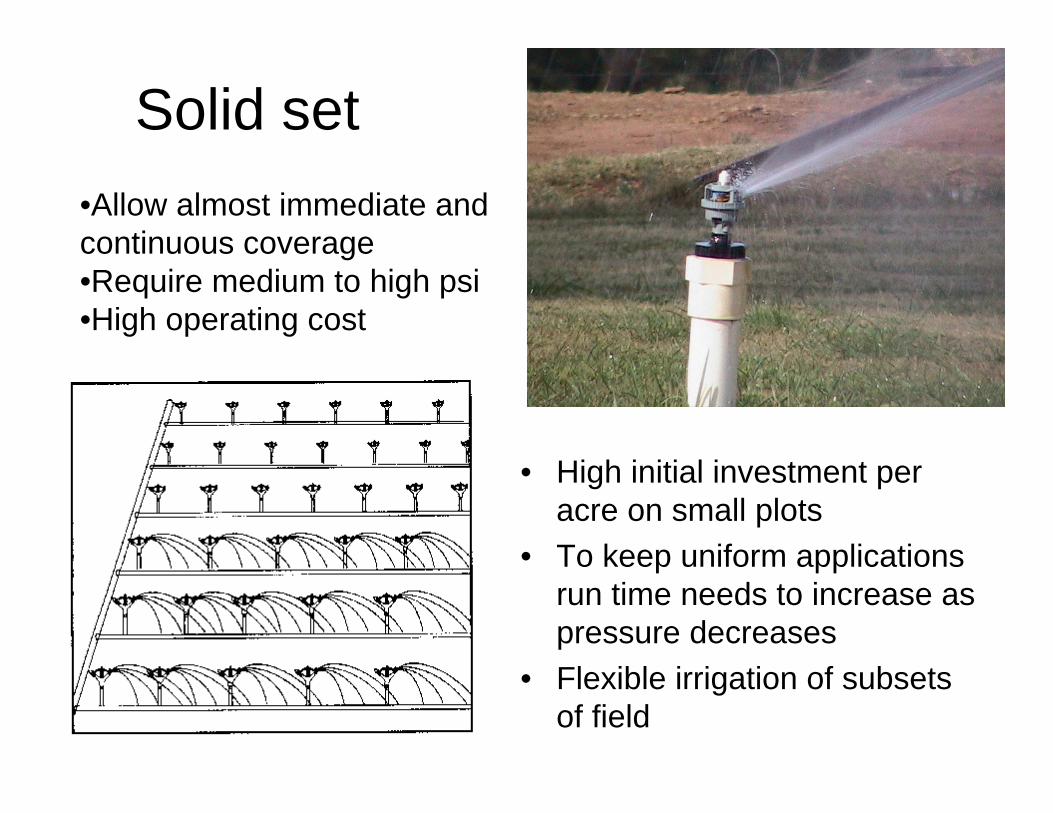
Solid set•Allow almost immediate and continuous coverage •Require medium to high psi•High operating cost
• High initial investment per acre on small plots
• To keep uniform applications run time needs to increase as pressure decreases
• Flexible irrigation of subsets of field
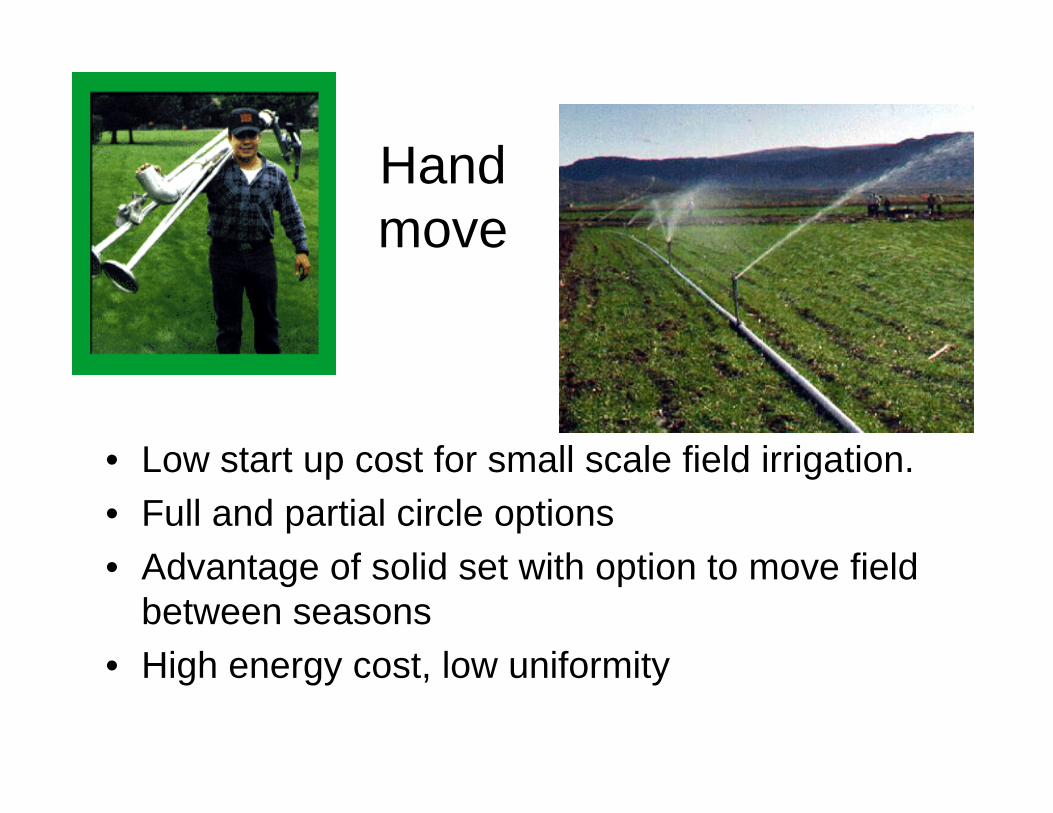
Hand move
• Low start up cost for small scale field irrigation.• Full and partial circle options• Advantage of solid set with option to move field
between seasons• High energy cost, low uniformity
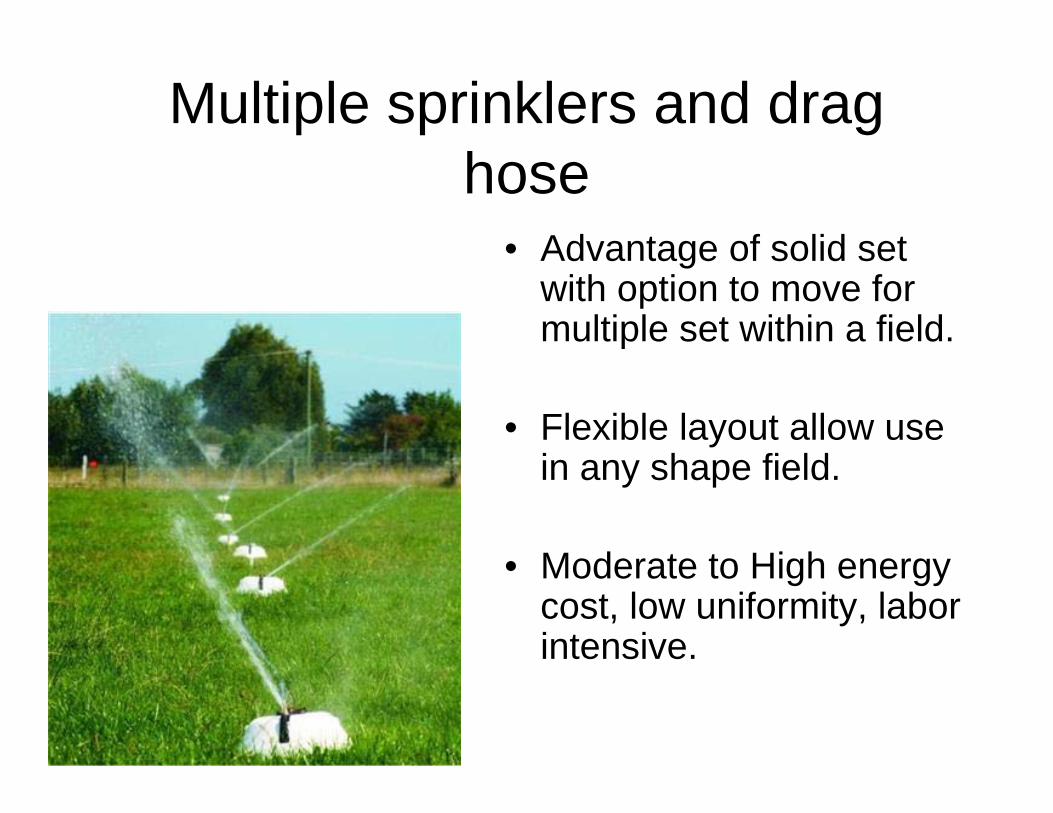
Multiple sprinklers and drag hose
• Advantage of solid set with option to move for multiple set within a field.
• Flexible layout allow use in any shape field.
• Moderate to High energy cost, low uniformity, labor intensive.
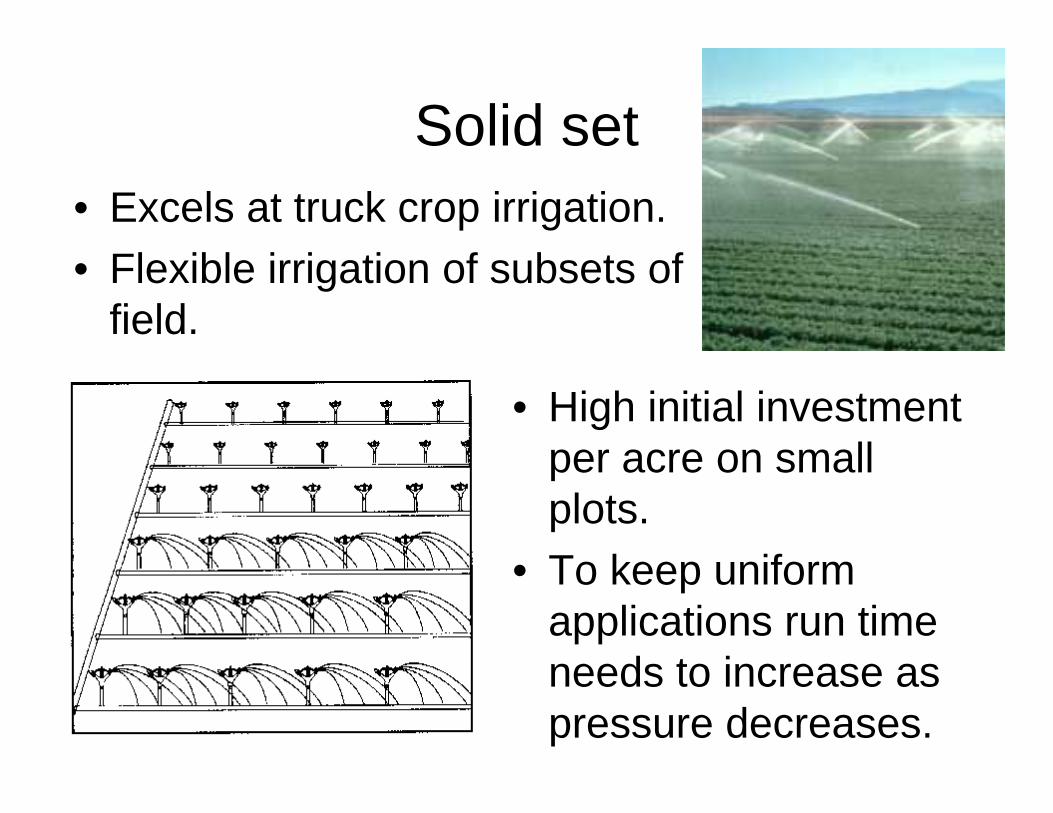
Solid set• Excels at truck crop irrigation.• Flexible irrigation of subsets of
field.
• High initial investment per acre on small plots.
• To keep uniform applications run time needs to increase as pressure decreases.
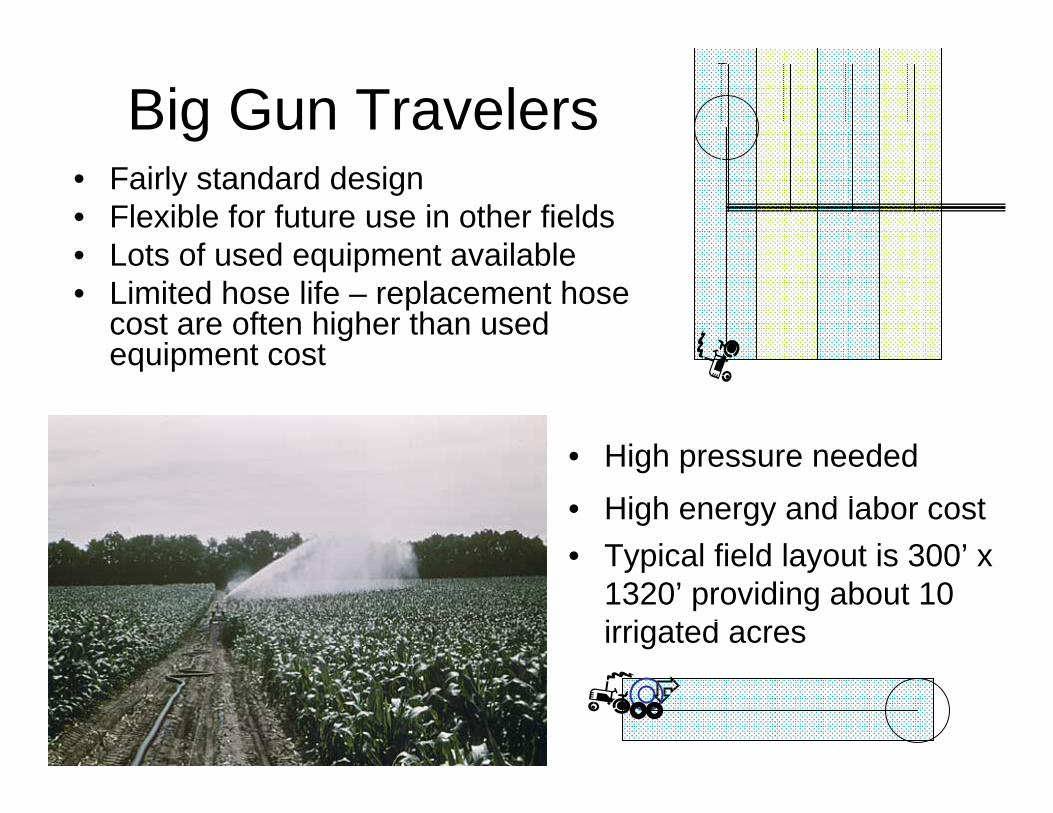
Big Gun Travelers• Fairly standard design• Flexible for future use in other fields• Lots of used equipment available• Limited hose life – replacement hose
cost are often higher than used equipment cost
• High pressure needed • High energy and labor cost• Typical field layout is 300’ x
1320’ providing about 10 irrigated acres
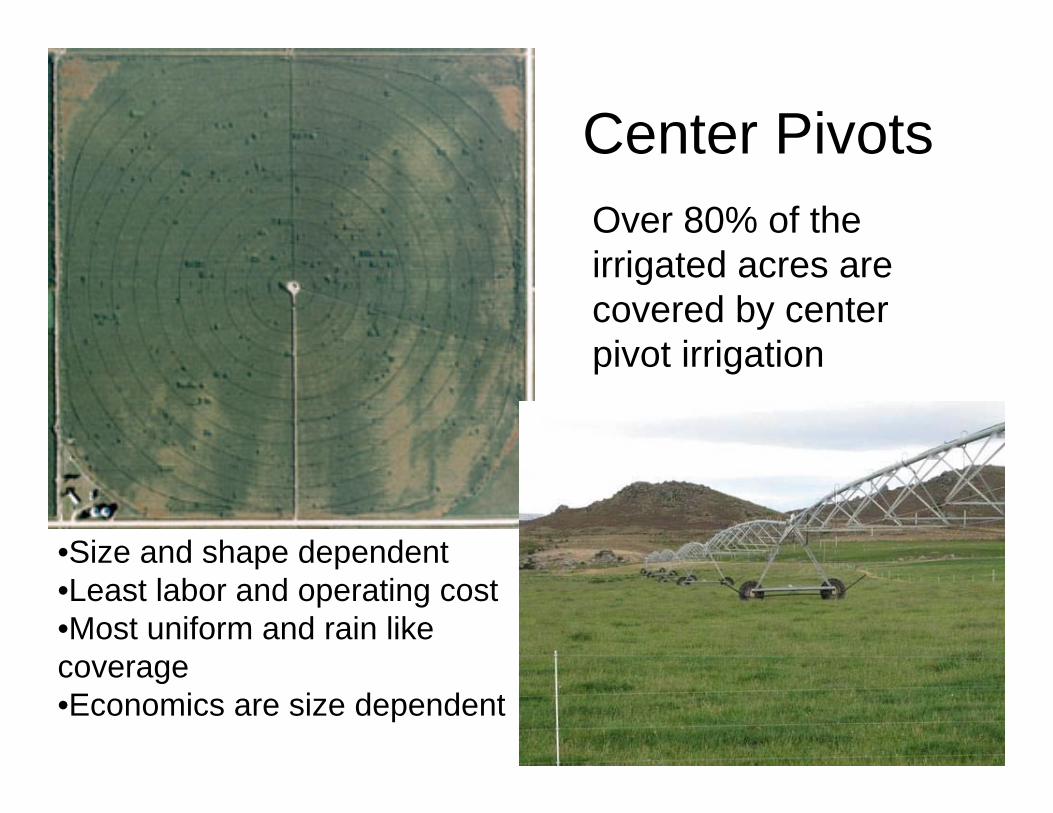
Center PivotsOver 80% of the irrigated acres are covered by center pivot irrigation
•Size and shape dependent•Least labor and operating cost•Most uniform and rain like coverage•Economics are size dependent
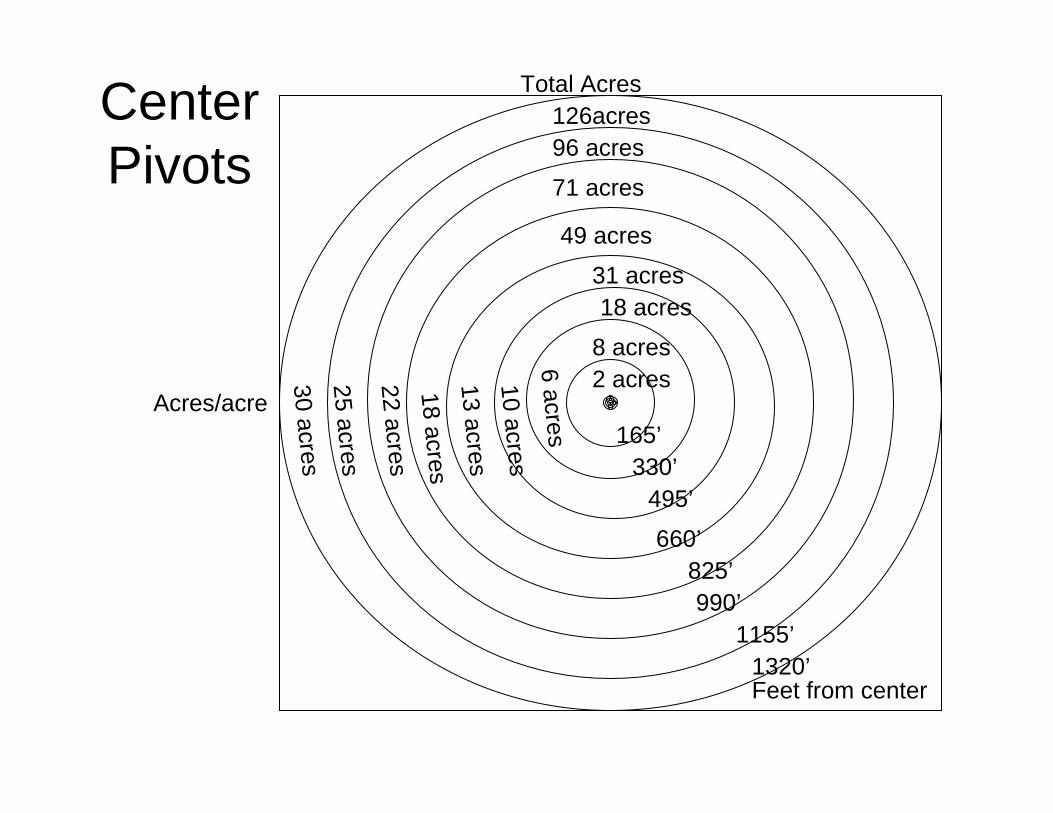
Center Pivots
165’330’
495’
660’825’990’
1320’1155’
2 acres8 acres
18 acres31 acres
49 acres
71 acres
96 acres126acres
6 acres
10 acres
13 acres
18 acres
22 acres
25 acres
30 acres
Acres/acre
Total Acres
Feet from center
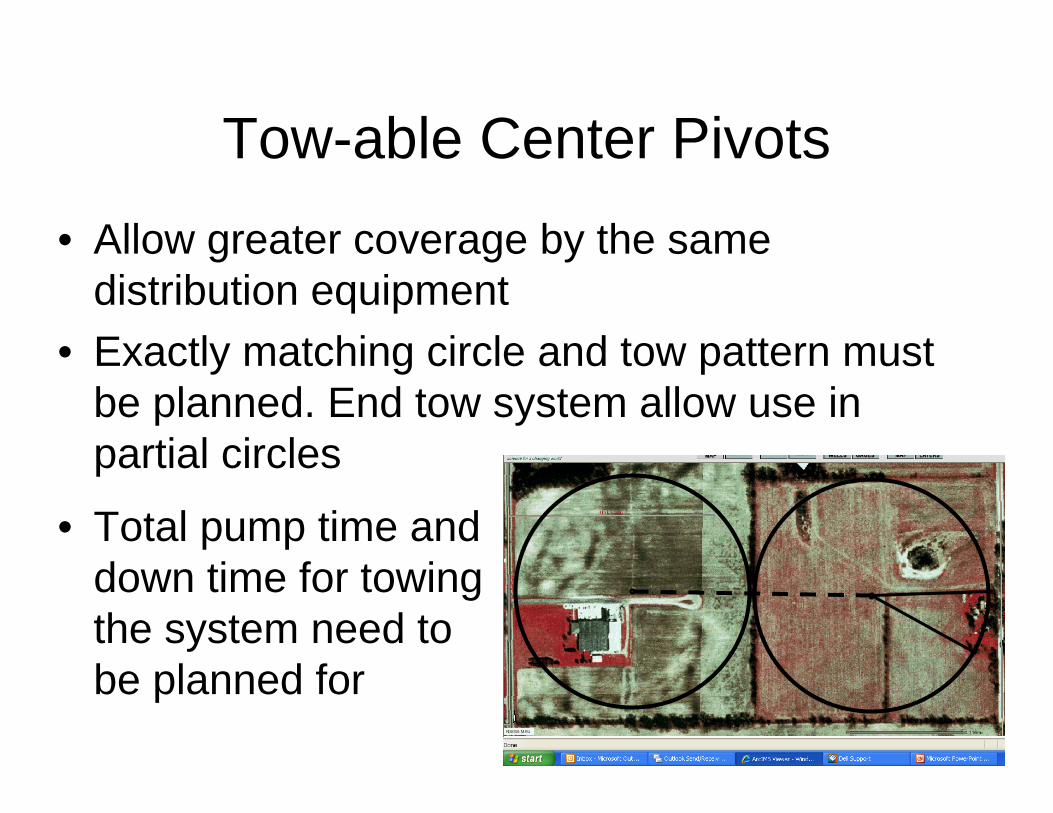
Tow-able Center Pivots• Allow greater coverage by the same
distribution equipment• Exactly matching circle and tow pattern must
be planned. End tow system allow use in partial circles
• Total pump time and down time for towing the system need to be planned for
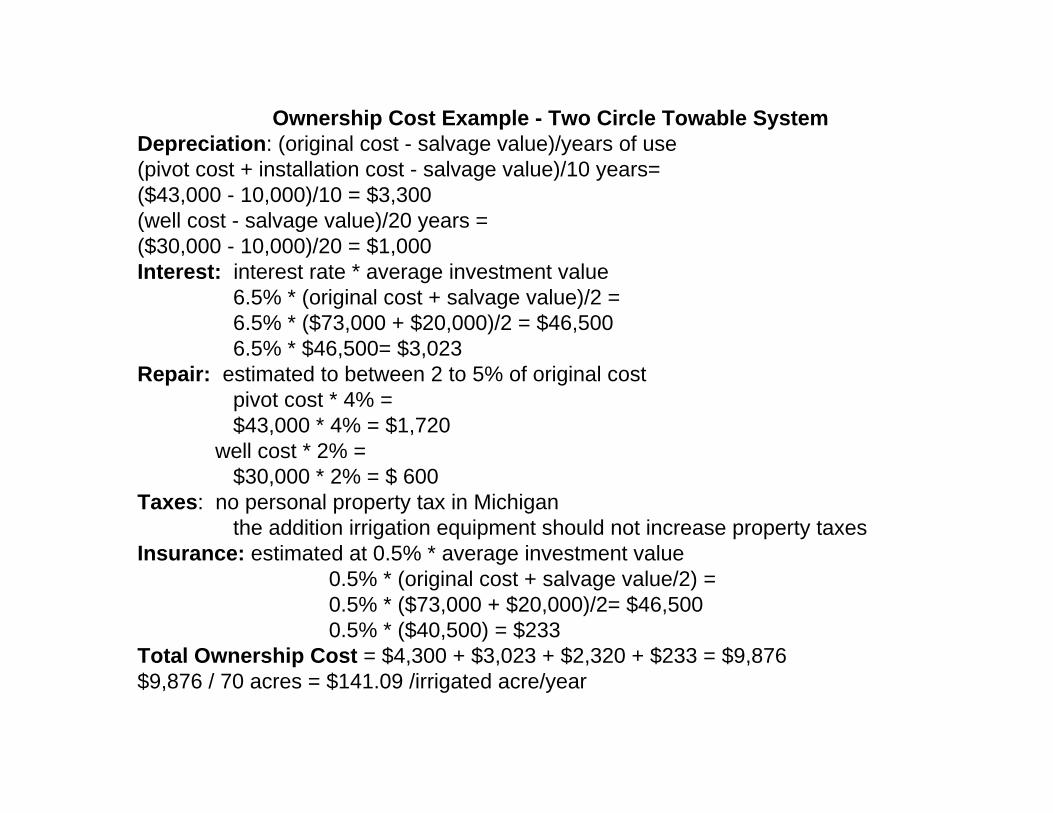
Ownership Cost Example - Two Circle Towable SystemDepreciation: (original cost - salvage value)/years of use(pivot cost + installation cost - salvage value)/10 years=($43,000 - 10,000)/10 = $3,300(well cost - salvage value)/20 years =($30,000 - 10,000)/20 = $1,000Interest: interest rate * average investment value
6.5% * (original cost + salvage value)/2 =6.5% * ($73,000 + $20,000)/2 = $46,5006.5% * $46,500= $3,023
Repair: estimated to between 2 to 5% of original costpivot cost * 4% =$43,000 * 4% = $1,720
well cost * 2% =$30,000 * 2% = $ 600
Taxes: no personal property tax in Michiganthe addition irrigation equipment should not increase property taxes
Insurance: estimated at 0.5% * average investment value0.5% * (original cost + salvage value/2) =0.5% * ($73,000 + $20,000)/2= $46,5000.5% * ($40,500) = $233
Total Ownership Cost = $4,300 + $3,023 + $2,320 + $233 = $9,876$9,876 / 70 acres = $141.09 /irrigated acre/year
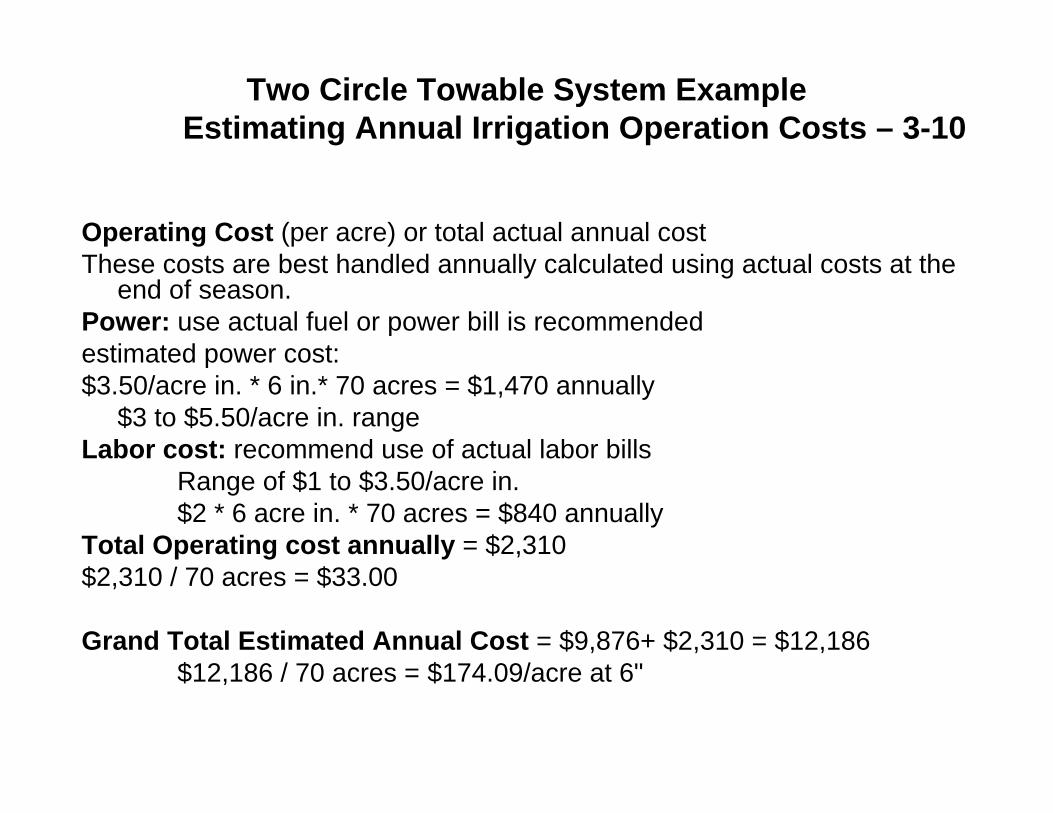
Two Circle Towable System ExampleEstimating Annual Irrigation Operation Costs – 3-10
Operating Cost (per acre) or total actual annual costThese costs are best handled annually calculated using actual costs at the
end of season.Power: use actual fuel or power bill is recommendedestimated power cost:$3.50/acre in. * 6 in.* 70 acres = $1,470 annually
$3 to $5.50/acre in. rangeLabor cost: recommend use of actual labor bills
Range of $1 to $3.50/acre in.$2 * 6 acre in. * 70 acres = $840 annually
Total Operating cost annually = $2,310 $2,310 / 70 acres = $33.00
Grand Total Estimated Annual Cost = $9,876+ $2,310 = $12,186$12,186 / 70 acres = $174.09/acre at 6"
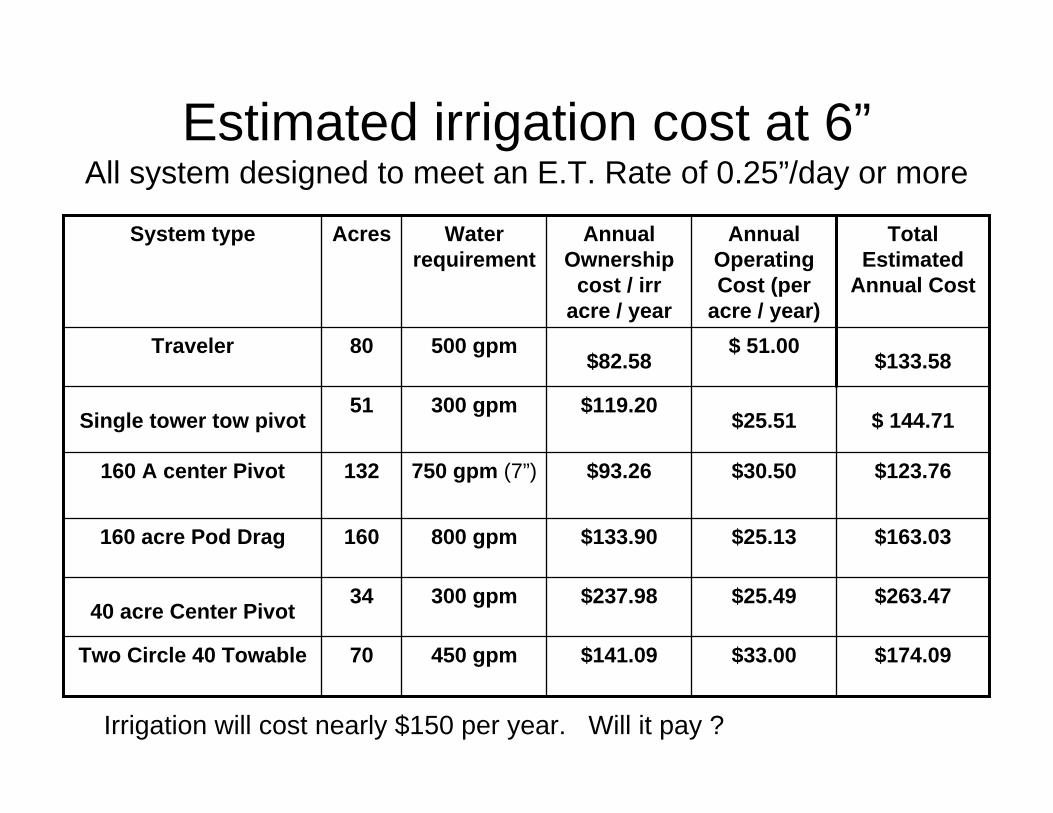
Estimated irrigation cost at 6”All system designed to meet an E.T. Rate of 0.25”/day or more
$33.00
$25.49
$25.13
$30.50
$25.51
$ 51.00
Annual Operating Cost (per
acre / year)
$174.09$141.09450 gpm70Two Circle 40 Towable
$263.47$237.98300 gpm3440 acre Center Pivot
$163.03$133.90800 gpm160160 acre Pod Drag
$123.76$93.26750 gpm (7”)132160 A center Pivot
$ 144.71$119.20300 gpm51
Single tower tow pivot
$133.58$82.58500 gpm80Traveler
Total Estimated
Annual Cost
Annual Ownership
cost / irr acre / year
Water requirement
AcresSystem type
Irrigation will cost nearly $150 per year. Will it pay ?
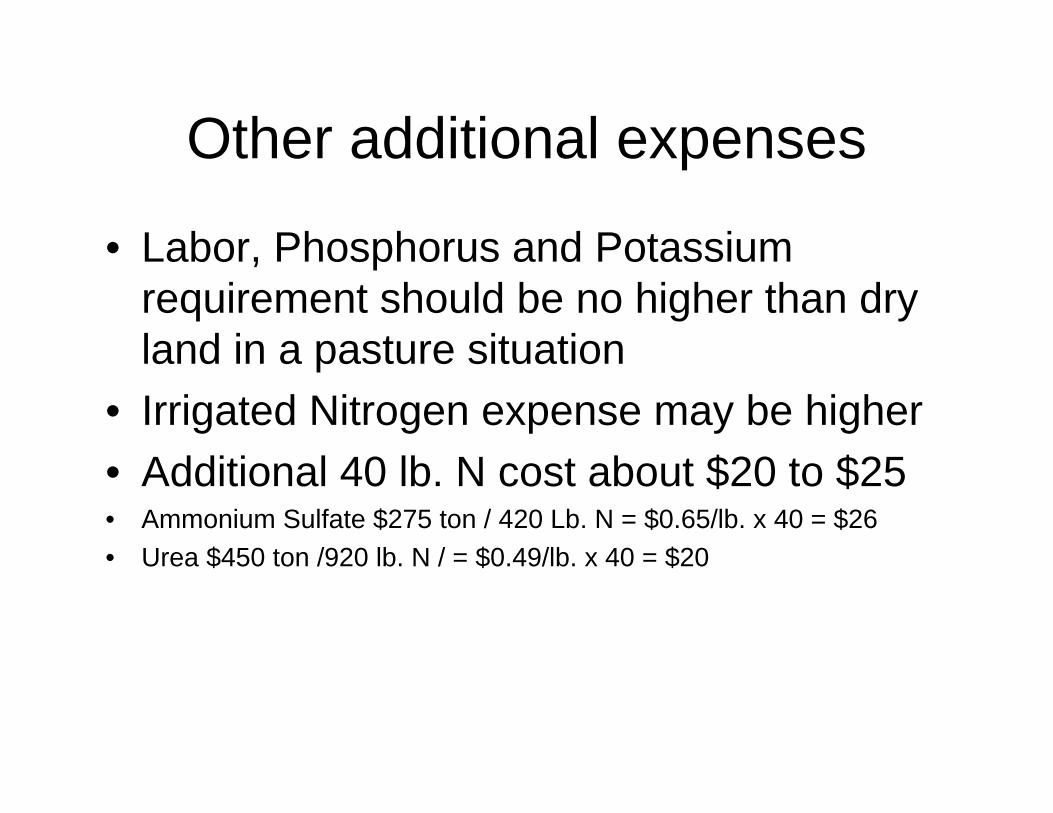
Other additional expenses
• Labor, Phosphorus and Potassium requirement should be no higher than dry land in a pasture situation
• Irrigated Nitrogen expense may be higher• Additional 40 lb. N cost about $20 to $25• Ammonium Sulfate $275 ton / 420 Lb. N = $0.65/lb. x 40 = $26• Urea $450 ton /920 lb. N / = $0.49/lb. x 40 = $20
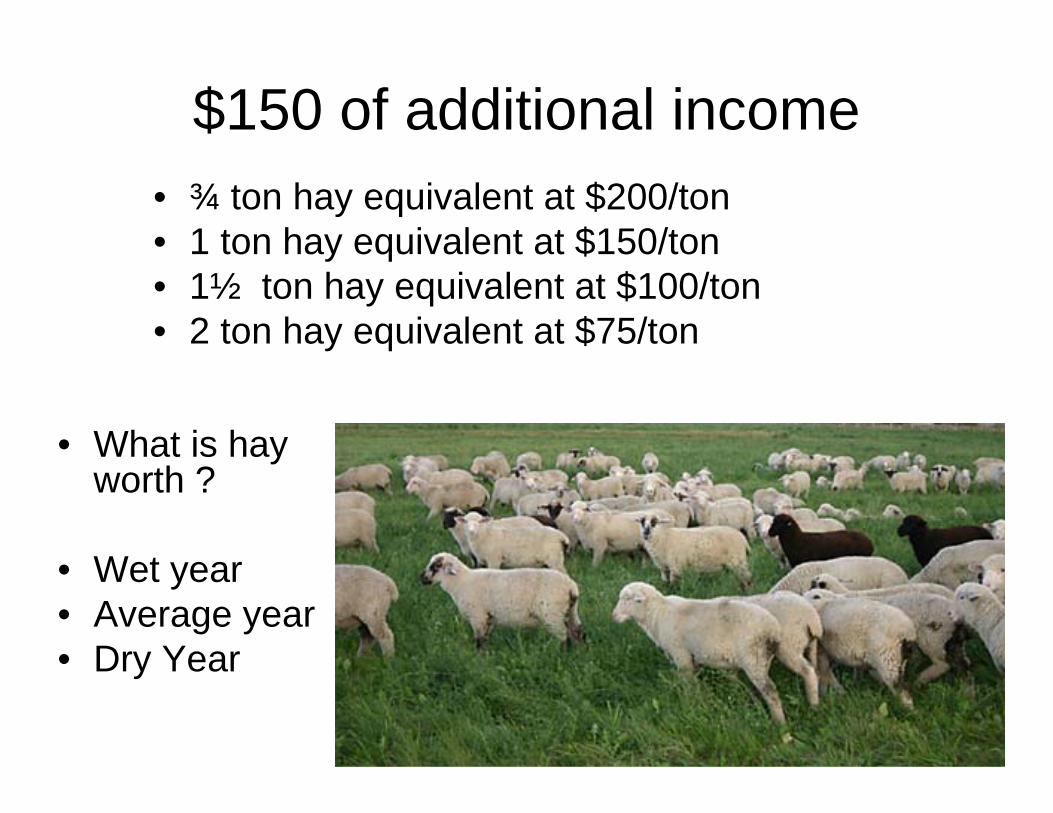
$150 of additional income• ¾ ton hay equivalent at $200/ton• 1 ton hay equivalent at $150/ton• 1½ ton hay equivalent at $100/ton• 2 ton hay equivalent at $75/ton
• What is hay worth ?
• Wet year• Average year• Dry Year
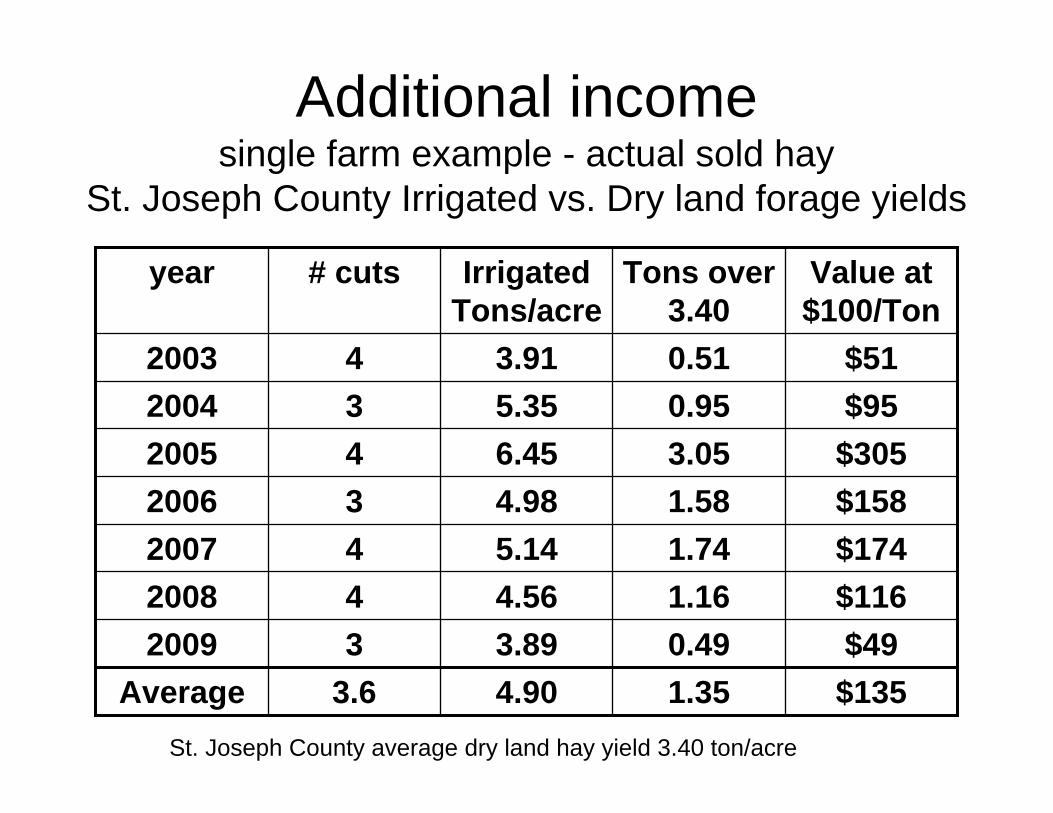
Additional income single farm example - actual sold hay
St. Joseph County Irrigated vs. Dry land forage yields
$490.493.8932009$1161.164.5642008
$1581.584.9832006$1741.745.1442007
$3053.056.4542005
$1351.354.903.6Average
$950.955.3532004$510.513.9142003
Value at $100/Ton
Tons over 3.40
Irrigated Tons/acre
# cutsyear
St. Joseph County average dry land hay yield 3.40 ton/acre