patent swot analysis report mycompany - · pdf filepatent swot analysis report mycompany ......
TRANSCRIPT

Patent SWOT Analysis ReportMyCompany
Created on October 07, 2014
Wisdomain, Inc.

SWOT Analysis
2ActionablePatents.com
This document provided by Wisdomain, Inc. only serves as referential document based on specific user inputs provided by ActionablePatents.com’s authorized users. Due to periodic database updates and as the market needs change, the content of this document may change accordingly at any time without notice. Wisdomain, Inc. does not warrant this document to be error-free, nor imply or express any other warranties. In no event shall Wisdomain, Inc. be liable for any consequential damages of any kind in association with this document.
- The information provided in this report is based on publicly available data from the patent authorities. - In no event shall Wisdomain, Inc. be liable for any consequential damages of any kind in association with this report. - Wisdomain, Inc. is not liable in any way for the use of this report. - The report may include online view feature, such as Web or database link, to appropriately reference extensive information. This online view feature is valid only for one year from the date of report download. - Due to periodic database updates, the online view content may differ from the downloaded content.
Disclaimer

SWOT Analysis
3ActionablePatents.com
Patent SWOT Analysis
The SWOT Analysis Report allows users to see how well positioned their companies are within a major technology sector by running a SWOT Analysis. In selecting up to 5 competitors and conducting the generation of this report, users are able to identify their positions against the competition that will help uncover opportunities and formulate strategies.
Delivered in this report are charts included with the results that help users break down the technological strengths by sectors,weaknesses, threats, and opportunities that point to areas which can be leveraged by the user to strengthen and secure a strong foothold within the industry.

SWOT Analysis
4ActionablePatents.com
MyCompany
Competitors
The major technology sector(s) of [MyCompany] is identified below. Any sector(s) that has more than 5% ratio out of the total filings during recent 5 years.
Major Sectors
[Fig. 1] Major Technology Sectors
* Technology Strength Score (TSS) is the sum of each patent evaluation score in the sector. High TSS means the company is technology oriented and holds numerous quality patents for the technology sector.
* R&D Concentration is filings ratio as the sector out of the total filings during recent 5 years.
Competitor 1Competitor 2Competitor 3Competitor 4Competitor 5
GENERATOR / MOTOR Household Cleaning Tools
Devices for Venting or Ae… CONTROLLING NON-ELECTRIC…

SWOT Analysis
5ActionablePatents.com
Depicted below status of technology strength between [MyCompany] and its competitors.
Technology Strength Score
TSS is a Technology Strength Score of a company measured by both quality and quantity of its patents. TSS is a sum of each patent evaluation score divided by 100. Higher the TSS higher the technology competitiveness. Refer to NOTE for more information about patent evaluation score.
[Fig. 2] Comparison of TSS (Technology Strength Score)
[Fig. 3] TSS trends during the last 5 years

SWOT Analysis
6ActionablePatents.com
Below charts are shown the current TSS(Technology Strength Score) and trends by sector during recent 5 years.
Technology Strength Score by Sector
[Fig. 4] TSS trends by major technology sector during the last 5 years
■ SECTOR : Household Cleaning Tools
■ SECTOR : CONTROLLING NON-ELECTRIC VARIABLES

SWOT Analysis
7ActionablePatents.com
[Fig. 4] TSS trends by major technology sector during the last 5 years
■ SECTOR : GENERATOR / MOTOR
■ SECTOR : Devices for Venting or Aerating

SWOT Analysis
8ActionablePatents.com
Compared to its rivalry [MyCompany] holds competitive edge in below technology sectors.
Strengths
[Fig. 5] Strong technology sectors and technical positions
■ SECTOR : GENERATOR / MOTOR
Diverse Technologygroup
Highly Competitive group
Laggards SpecializedTechnology group
■ SECTOR : Household Cleaning Tools
Diverse Technologygroup
Highly Competitive group
Laggards SpecializedTechnology group

SWOT Analysis
10ActionablePatents.com
Compared to its rivalry [MyCompany] is less competitive in below technology sectors.
Weaknesses
[Fig. 6] Weak technology sectors and technical positions
■ SECTOR : Devices for Venting or Aerating
Diverse Technologygroup
Highly Competitive group
Laggards SpecializedTechnology group
■ SECTOR : CONTROLLING NON-ELECTRIC VARIABLES
Diverse Technologygroup
Highly Competitive group
Laggards SpecializedTechnology group
APES(Average Patent Evaluation Score)

SWOT Analysis
11ActionablePatents.com
Below are [MyCompany] involved sectors that show rapid growth. In most cases such growth is triggered by unfulfilled needs, new technology arrival, or loosening of regulations. [MyCompany] should investigate these growing sectors and align its IP strategy accordingly.
*Market size data below is derived from patent and financial databases of companies actively participating in the sector.
Opportunities
(1) Growing Sector(s)
[Fig. 7] Growing sectors and growth rates
■ SECTOR : CONTROLLING NON-ELECTRIC VARIABLES
14.96%
■ SECTOR : Household Cleaning Tools
7.18%

SWOT Analysis
12ActionablePatents.com
[Fig. 8] Top 5 companies citing [MyCompany]'s patents
[MyCompany] holds the highest number of cited patents in below list. Highly cited patents hold technological influence and are capable of making broad claims therefore the sector where [MyCompany] holds most cited patents are identified as an opportunity.
Opportunities
(2) [MyCompany]'s patents that are most cited by others
Rank Patent No. No. of Cited Sector
1 US6xxxxxx 73 SWITCHES/RELAYS
2 US7xxxxxx 71 REFRIGERATION MACHINES
3 US6xxxxxx 71 CONTROLLING COMBUSTION
4 US6xxxxxx 67 EUDIOMETRY
5 US8xxxxxx 62 CONTROLLING COMBUSTION
6 US6xxxxxx 61 CONTROLLING NON-ELECTRIC VARIABLES
7 US8xxxxxx 57 REFRIGERATION MACHINES
8 US6xxxxxx 57 PRINTED CIRCUITS
9 US7xxxxxx 50 TESTING BALANCE
10 US7xxxxxx 49 CONTROLLING NON-ELECTRIC VARIABLES
Click Patent No. to view details.

SWOT Analysis
13ActionablePatents.com
[MyCompany]’s international market is depicted below highlighted in yellow. The yellow region(s) without the presence of given competitors are marked with a green bubble indicating [MyCompany] holds stronger opportunity in that region over given competitors.
Opportunities
(3) International markets without given competitors’ presence
[Fig. 9] Global market map of [MyCompany]
MyCompany and competitor's international market.
MyCompany's international market ONLY.
Country No. of Applications Status Country No. of Applications Status
United States 1,283
China 359
Canada 324
Japan 169
Australia 131
Korea (South) 88
Germany 82
Mexico 77
Spain 39
Russian Federation 36
Austria 29
Brazil 28
Poland 25
Hong Kong 18
Denmark 8
Malaysia 8
New Zealand (Aotearoa) 5
Israel 4
Great Britain (UK) 3
Norway 3
Singapore 3
Hungary 2
Indonesia 2
Switzerland 1
Italy 1
Turkey 1

SWOT Analysis
14ActionablePatents.com
MyCompany and competitor's international market.
MyCompany's international market ONLY.
Country No. of Applications Status Country No. of Applications Status
Taiwan 24
Argentina 19
South Africa 1

SWOT Analysis
15ActionablePatents.com
Below are [MyCompany] involved sector(s) showing decline. In most cases such decline is triggered by irrational exuberance in technologies, market saturation leading to price erosion, economical replacements or heightened regulations. [MyCompany] should investigate these declining sector(s) and align its IP strategy accordingly. Depicted sector size data is derived from patents and financial databases of companies actively participating in the sector.
Threats
(1) Declining sector(s)
[Fig. 10] Declining sectors and growth rates
■ SECTOR : GENERATOR / MOTOR
-5.60%

SWOT Analysis
16ActionablePatents.com
[Fig. 11] Top 5 companies cited by [MyCompany]
Below patents holds most cited by [MyCompany]. Those patents frequently cited by [MyCompany] may hold potential dispute threats. Highly cited patents hold technological influence and are capable of making broad claims therefore the most cited patents by [MyCompany] can be identified as a threat.
Threats
(2) Patents with sector that are most cited by [MyCompany].
Rank Patent No. No. of Citing Sector
1 US5xxxxxx 19 GENERATOR / MOTOR
2 US6xxxxxx 16 GENERATOR / MOTOR
3 US6xxxxxx 14 GENERATOR / MOTOR
4 US5xxxxxx 14 GENERATOR / MOTOR
5 USD5xxxxx 12 Design (Machines)
6 USD4xxxxx 12 Design (Machines)
7 USD4xxxxx 12 Design (Machines)
8 US6xxxxxx 12 GENERATOR / MOTOR
9 USD4xxxxx 11 Design (Machines)
10 USD4xxxxx 11 Design (Machines)
Click Patent No. to view details.

SWOT Analysis
17ActionablePatents.com
Below map shows given competitors' international markets without [MyCompany]'s presence. These markets may be in rapid penetration by the competitors thus may become a threat to [MyCompany]'s international business strategy.
Threats
(3) Given competitors’ international markets presence
[Fig. 12] Global market map of competitors
[MyCompany] and competitor's international market.
Competitors' international market without [MyCompany].
Country Competitor(s) Status
Chile Competitor 1
Colombia Competitor 1 , Competitor 2
Costa Rica Competitor 3
Croatia (Hrvatska) Competitor 1
Cuba Competitor 2
Czech Republic Competitor 2
Ecuador Competitor 1
Egypt Competitor 1 , Competitor 2
Estonia Competitor 2
Finland Competitor 1 , Competitor 2
France Competitor 3 , Competitor 2
Greece Competitor 2
India Competitor 1
Jordan Competitor 2

SWOT Analysis
18ActionablePatents.com
[MyCompany] and competitor's international market.
Competitors' international market without [MyCompany].
Country Competitor(s) Status
Morocco Competitor 1 , Competitor 2
Netherlands Competitor 2
Peru Competitor 1 , Competitor 2
Portugal Competitor 2
Romania Competitor 2
Slovakia Competitor 1 , Competitor 2
Sweden Competitor 2
Ukraine Competitor 1
Uruguay Competitor 1 , Competitor 2
Argentina Competitor 1 , Competitor 4 , Competitor 2
Australia Competitor 1 , Competitor 4 , Competitor 3 , Competitor 4 , Competitor 2
Austria Competitor 1 , Competitor 3 , Competitor 4 , Competitor 2
Brazil Competitor 1 , Competitor 4 , Competitor 3 , Competitor 2
Canada Competitor 1 , Competitor 4 , Competitor 3 , Competitor 4 , Competitor 2
China Competitor 1 , Competitor 3 , Competitor 4 , Competitor 2
Denmark Competitor 1 , Competitor 4 , Competitor 3 , Competitor 2
Germany Competitor 1 , Competitor 4 , Competitor 3 , Competitor 4 , Competitor 2
Great Britain (UK) Competitor 1 , Competitor 4 , Competitor 3 , Competitor 2
Hong Kong Competitor 2
Hungary Competitor 1 , Competitor 2
Indonesia Competitor 1 , Competitor 4 , Competitor 2
Israel Competitor 1 , Competitor 3 , Competitor 2
Japan Competitor 1 , Competitor 3 , Competitor 4 , Competitor 2
Korea (South) Competitor 1 , Competitor 3 , Competitor 4 , Competitor 2
Malaysia Competitor 1 , Competitor 3 , Competitor 2
Mexico Competitor 1 , Competitor 4 , Competitor 3 , Competitor 4 , Competitor 2

SWOT Analysis
19ActionablePatents.com
[MyCompany] and competitor's international market.
Competitors' international market without [MyCompany].
Country Competitor(s) Status
New Zealand (Aotearoa) Competitor 2
Norway Competitor 1 , Competitor 4 , Competitor 3 , Competitor 2
Poland Competitor 1 , Competitor 2
Russian Federation Competitor 1 , Competitor 3 , Competitor 2
Singapore Competitor 1 , Competitor 4 , Competitor 3 , Competitor 2
South Africa Competitor 1 , Competitor 2
Spain Competitor 1 , Competitor 3 , Competitor 4 , Competitor 2
Switzerland Competitor 2
Taiwan Competitor 1 , Competitor 2
Turkey Competitor 1
United States Competitor 1 , Competitor 4 , Competitor 3 , Competitor 4 , Competitor 2

SWOT Analysis
20ActionablePatents.com
Threats
(4) Sector with most patent litigations
From the major sectors defined, the sector shown below holds most patent litigation cases during last 5 years (total number of patents per sector relative to each sector’s patent litigation cases during last 5 years). The sector with most patent litigations may consists of those who frequently file patent lawsuits therefore the sector with most litigations is identified as a threat.
■ SECTOR: Devices for Venting or Aerating
[Fig. 13] Patent litigation trend during the last 5 years
- Major Plaintiffs
Litigation Filings by Year
Plaintiff 2010 2011 2012 2013 2014 Total
1 WEBSTONE CO INC 4 1 5
2 PATENT GROUP LLC 1 3 4
3 MAGNATE INTERNATIONAL LIMITED A TAIWANESE COMPANY 2 2
4 GHJ HOLDINGS LLC 2 2
5 HERBERT HOEPTNER III A UNITED STATES CITIZEN 1 1
7 JOHN BRUCKBAUER 1 1
17 ARRAY HOLDINGS INC 1 1
19 BENNETT REGULATOR GUARDS INC 1 1
34 ODOR CONTROL SPECIALTIES LLC 1 1
38 PRICE PFISTER INC 1 1
(* ordered by total number of litigations)
(*Note : Patent litigation data are from U.S. Court and U.S. ITC (International Trade Commission).)
SWOT Analysis
21ActionablePatents.com
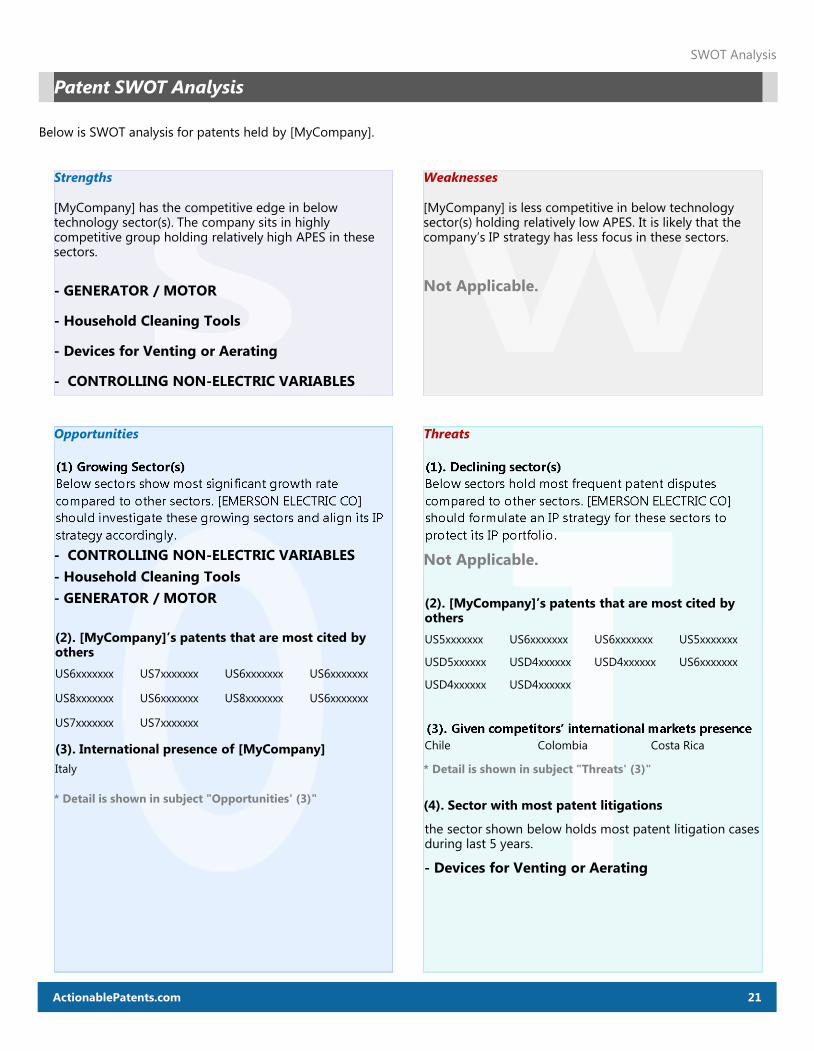
Below is SWOT analysis for patents held by [MyCompany].
Patent SWOT Analysis
[MyCompany] has the competitive edge in below technology sector(s). The company sits in highly competitive group holding relatively high APES in these sectors.
Strengths
- GENERATOR / MOTOR
- Household Cleaning Tools
- Devices for Venting or Aerating
- CONTROLLING NON-ELECTRIC VARIABLES
[MyCompany] is less competitive in below technology sector(s) holding relatively low APES. It is likely that the company’s IP strategy has less focus in these sectors.
Weaknesses
Not Applicable.
Threats
Not Applicable.
(2). [MyCompany]’s patents that are most cited by others
US5xxxxxxx US6xxxxxxx US6xxxxxxx US5xxxxxxx
USD5xxxxxx USD4xxxxxx USD4xxxxxx US6xxxxxxx
USD4xxxxxx USD4xxxxxx
Chile Colombia Costa Rica
* Detail is shown in subject "Threats' (3)"
the sector shown below holds most patent litigation cases during last 5 years.
(4). Sector with most patent litigations
- Devices for Venting or Aerating
Opportunities
- CONTROLLING NON-ELECTRIC VARIABLES
- Household Cleaning Tools
- GENERATOR / MOTOR
(2). [MyCompany]’s patents that are most cited by others
US6xxxxxxx US7xxxxxxx US6xxxxxxx US6xxxxxxx
US8xxxxxxx US6xxxxxxx US8xxxxxxx US6xxxxxxx
US7xxxxxxx US7xxxxxxx
(3). International presence of [MyCompany]
Italy
* Detail is shown in subject "Opportunities' (3)"

SWOT Analysis
22ActionablePatents.com
Note
Ranking Percentile Grades
Top 1%
Within top 1~3%
Within top 3~5%
Within top 5~10%
Within top 10~20%
Within top 20~50%
Within top 50~60%
Below 60%
Score Distribution
Patent Grading by Evaluation Score