patent trial and appeal board statistics ptab.pdf · 2 narrative: this pie chart shows the total...
TRANSCRIPT

Patent Trial and Appeal BoardStatistics4/30/2016

2
Narrative:This pie chart shows the total number of cumulative AIA petitions filed to date broken out by trial type (i.e., IPR, CBM, and PGR).
*Data current as of: 4/30/2016
442490%
4439%
241%
4891 Total AIA Petitions*
Total IPR Petitions Total CBM Petitions Total PGR Petitions
Cumulative from 09/16/2012

3
*Data current as of: 4/30/2016
Narrative:This bar graph depicts the number of AIA petitions filed each fiscal year, with each bar showing the filings for that fiscal year by trial type (i.e., IPR, CBM, and PGR).
FY 2014 FY 2015 FY 2016*
1310
1737
846
177 149612 11 11
Number of AIA Petitions Filed by Fiscal Year by TypeIPR CBM PGR

4
Narrative:These line graphs display the number of IPR, CBM, and PGR petitions filed each month and the total number of all petitions filed each month from the effective date of the AIA trial provisions.
*Data current as of: 4/30/2016
143 131184
116159
120
179
102
177
100
164131 139 145
182
117165
136106
131 13896
132107
136
0
100
200
300
Number of IPR Petitions Filed by Month*
1419
610
1621
16 13 15 14 16 137
26
9 6 95
11 105 3
12 10 10
05
101520253035404550
Number of CBM Petitions Filed by Month*
0 0 0 01 1
01
01
01
0
32
0
3
0 01 1
0
6
12
0
2
4
6
8
10
Number of PGR Petitions Filed by Month*
157 150
190
126
176142
195
116
192
115
180145 146
174193
123
177141
117142 144
99
150118
148
0
40
80
120
160
200
240Number of TOTAL Petitions Filed by Month*

5
Narrative:This pie chart shows the total number of AIA petitions filed in the current fiscal year to date as well as the number and percentageof these petitions broken down by technology.
*Data current as of: 4/30/2016
96265%
31821% 114
8%
926%
30%
1489 Total AIA Petitions in FY 14* (Technology Breakdown)
1,19363%
44323% 90
5%
1679%
40%
1897 Total AIA Petitions in FY 15* (Technology Breakdown)
50655%
23926%
546%
10812%
111%
918 Total AIA Petitions in FY 16* (Technology Breakdown)
Electrical/Computer - TCs 2100, 2400, 2600, 2800Mechanical/Business Method - TCs 3600, 3700Chemical - TC 1700Bio/Pharma - TC 1600Design - TC 2900
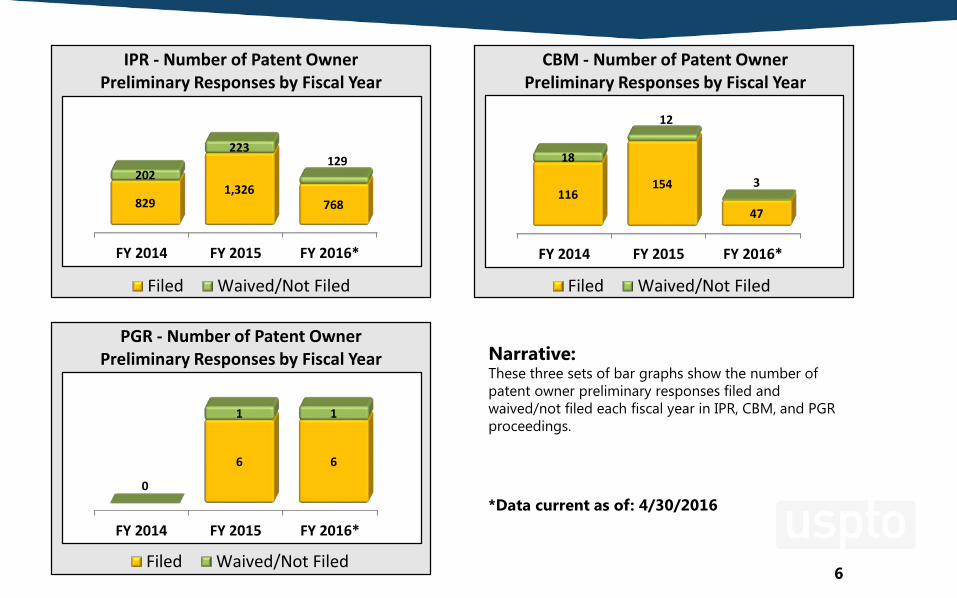
6
Narrative:These three sets of bar graphs show the number of patent owner preliminary responses filed and waived/not filed each fiscal year in IPR, CBM, and PGR proceedings.
*Data current as of: 4/30/2016
FY 2014 FY 2015 FY 2016*
8291,326
768
202
223129
IPR - Number of Patent Owner Preliminary Responses by Fiscal Year
Filed Waived/Not Filed
FY 2014 FY 2015 FY 2016*
116154
47
18
12
3
CBM - Number of Patent Owner Preliminary Responses by Fiscal Year
Filed Waived/Not Filed
FY 2014 FY 2015 FY 2016*
6 6
0
1 1
PGR - Number of Patent Owner Preliminary Responses by Fiscal Year
Filed Waived/Not Filed

7
Narrative:This chart shows the percentage of petitions instituted of all decisions on petition, by technology area.
*Data current as of: 4/30/2016
0% 10% 20% 30% 40% 50% 60% 70% 80%
Biotechnology/Pharma (167 of 275petitions)
Chemical (174 of 231 petitions)
Design (7 of 12 petitions)
Electrical/Computer (1489 of 2085petitions)
Mechanical/Business Methods (661 of917 petitions)
Percent of Petitions Instituted, by Technology

8
Narrative:These three sets of bar graphs show the number of decisions on institution by fiscal year broken out by trials instituted (including joinders) and trials denied in IPR, CBM, and PGR proceedings. A trial that is instituted in part is counted as an institution in these bar graphs.
*Data current as of: 4/30/2016
FY 2014 FY 2015 FY 2016*
557801
535
15
116
49
193
426278
IPR - Number of Decisions On Institution Per Fiscal Year by Outcome
Instituted Joinders DenialsFY 2014 FY 2015 FY 2016*
91 91
24
110
63043
32
CBM - Number of Decisions On Institution Per Fiscal Year by Outcome
Instituted Joinders Denials
FY 2014 FY 2015 FY 2016*
03
7
0 01
PGR - Number of Decisions On Institution Per Fiscal Year by Outcome
Instituted Joinders Denials

9
Narrative:These three sets of bar graphs show settlements in AIA trials broken down by settlements that occurred prior to institution and settlements that occurred after institution in IPR, CBM, and PGR proceedings.
*Data current as of: 4/30/2016
FY2014 FY 2015 FY 2016*
0
2
00 0 0
PGR - Settlements
Settled Before Institution Settled After Institution
FY 2014 FY 2015 FY 2016*
21
1410
6
32
10
CBM - Settlements
Settled Before Institution Settled After Institution
FY 2014 FY 2015 FY 2016*
106
275
131104
189
99
IPR - Settlements
Settled Before Institution Settled After Institution

10
Narrative:This graph shows a stepping stone visual depicting the outcomes for all IPR petitions filed to-date that have reached a final disposition.
*Data current as of: 4/30/2016
Disposition of IPR Petitions Completed to Date*
568Terminated
After Institution Decision:
410 Settled18 Dismissed
140 Request for Adverse
Judgement
911Petitions Denied
587Terminated
Before Institution Decision:
532 Settled36 Dismissed
19 Request for Adverse
Judgement
943Trials Completed(Reached Final
Written Decision)
681 TrialsAll Instituted Claims
Unpatentable (23% of Total Petitions, 45%of Trials Instituted,
72% of Final Written Decisions)
128 TrialsSome Instituted
Claims Unpatentable (4% of Total Petitions,
8% of Trials Instituted, 14% of
Final Written Decisions)
1498Trials Not Instituted
1511Trials
Instituted
134 TrialsNo Instituted Claims Unpatentable (4% of Total Petitions, 9% of Trials Instituted, 14%
of Final Written Decisions)
3009Total
Petitions

11*Data current as of: 4/30/2016
69Terminated
After Institution Decision:
48 Settled8 Dismissed
13 Request for Adverse
Judgement
108Petitions Denied
50Terminated
Before Institution Decision:
48 Settled2 Dismissed
0 Request for Adverse
Judgement
111Trials Completed(Reached Final
Written Decision)
86 TrialsAll Instituted Claims
Unpatentable (25% of Total Petitions, 48%of Trials Instituted,
77% of Final Written Decisions)
22 TrialsSome Instituted
Claims Unpatentable (7% of Total Petitions,
12% of Trials Instituted, 20% of
Final Written Decisions)
158Trials Not Instituted
180Trials
Instituted
3 TrialsNo Instituted Claims Unpatentable (1% of Total Petitions, 2% of Trials Instituted, 3%
of Final Written Decisions)
338Total
Petitions
Disposition of CBM Petitions Completed to Date* Narrative:This graph shows a stepping stone visual depicting the outcomes for all CBM petitions filed to-date that have reached a final disposition.

12*Data current as of: 4/30/2016
0Terminated
After Institution Decision:0 Settled
0 Dismissed0 Request for
Adverse Judgement
1Petitions Denied
2Terminated
Before Institution Decision:2 Settled
0 Dismissed0 Request for
Adverse Judgement
0Trials Completed(Reached Final
Written Decision)
0 TrialsAll Instituted Claims Unpatentable (0% of Total Petitions, 0% of Trials Instituted, 0%
of Final Written Decisions)
0 TrialsSome Instituted
Claims Unpatentable (0% of Total Petitions,
0% of Trials Instituted, 0% of Final
Written Decisions)
3Trials Not Instituted
0Trials
Instituted
0 TrialsNo Instituted Claims Unpatentable (0% of Total Petitions, 0% of Trials Instituted, 0%
of Final Written Decisions)
3Total
Petitions
Disposition of PGR Petitions Completed to Date* Narrative:This graph shows a stepping stone visual depicting the outcomes for all PGR petitions filed to-date that have reached a final disposition.

13
Narrative:This visual contains four cylinders. The first cylinder shows the total number of claims available to be challenged in the IPR petitions filed. The second cylinder shows the number of claims actually challenged and not challenged. The third cylinder shows the number of claims on which trial was instituted and not instituted. The fourth cylinder shows the total number claims found unpatentable in a final written decision, the number of claims canceled or disclaimed by patent owner after institution, the number of claims remaining patentable (not subject to a final written decision), and the number of claims found patentable by the PTAB.
Note: “Completed” petitions include terminations (before or after a decision on institution) due to settlement, request for adverse judgment, or dismissal; final written decisions; and decisions denying institution.
*Data current as of: 4/30/2016
99041
45623
2008210175
2161 Claims Found Patentable by PTAB in Final WrittenDecision
5827 Claims Remaining Patentable (Not Subject to FinalWritten Decision)
1919 Claims Cancelled or Disclaimed by Patent Owner
25541 Claims Challenged but Not Instituted
53418 Claims Not Challenged
IPR Petitions Terminated to Date*
Claims Challenged
Claims Instituted
Claims Found Unpatentable by PTAB in Final Written Decision
Total Number of Claims Available to be Challenged within 3009 Petitions

14
Narrative:This visual contains four cylinders. The first cylinder shows the total number of claims available to be challenged in the CBM petitions filed. The second cylinder shows the number of claims actually challenged and not challenged. The third cylinder shows the number of claims on which trial was instituted and not instituted. The fourth cylinder shows the total number claims found unpatentable in a final written decision, the number of claims canceled or disclaimed by patent owner after institution, the number of claims remaining patentable (not subject to a final written decision), and the number of claims found patentable by the PTAB.
Note: “Completed” petitions include terminations (before or after a decision on institution) due to settlement, request for adverse judgment, or dismissal; final written decisions; and decisions denying institution.
*Data current as of: 4/30/2016
12122
6665
30541773
73 Claims Found Patentable by PTAB in Final WrittenDecision
939 Claims Remaining Patentable (Not Subject to FinalWritten Decision)
269 Claims Cancelled or Disclaimed by Patent Owner
3611 Claims Challenged but Not Instituted
5457 Claims Not Challenged
CBM Petitions Terminated to Date*
Claims Challenged
Claims Instituted
Claims Found Unpatentable by PTAB in Final Written Decision
Total Number of Claims Available to be Challenged within 338 Petitions

15
*Data current as of: 4/30/2016
Narrative:This chart shows claim outcomes for instituted trials, by technology area.
Note: Claims involved in instituted trials that settle or are dismissed are not depicted. Accordingly, a bar may not add up to 100%.
0% 10% 20% 30% 40% 50% 60% 70% 80% 90%100%
Biotechnology/Pharma (1279 claims)
Chemical (1850 claims)
Design (5 claims)
Electrical/Computer (13159 claims)
Mechanical/Business Methods (6843 claims)
Trial Outcomes for Instituted Claims, by Technology
Claims Found Unpatentable by PTAB in Final Written Decision
Claims Cancelled or Disclaimed by Patent Owner
Claims Found Patentable by PTAB in Final Written Decision
