pathway and gene set analysis part 1
TRANSCRIPT

Pathway and Gene Set AnalysisPart 1
Alison Motsinger-Reif, PhDBranch Chief, Senior Investigator
Biostatistics and Computational Biology BranchNational Institute of Environmental Health Sciences

The early steps of a microarray study
• Scientific Question (biological)• Study design (biological/statistical)• Conducting Experiment (biological)• Preprocessing/Normalizing Data (statistical)• Finding differentially expressed genes
(statistical)

A data example
• Lee et al (2005) compared adipose tissue (abdominal subcutaenous adipocytes) between obese and lean Pima Indians
• Samples were hybridised on HGu95e-Affymetrix arrays (12639 genes/probe sets)
• Available as GDS1498 on the GEO database
• We selected the male samples only– 10 obese vs 9 lean


The “Result”Probe Set ID log.ratio pvalue adj.p73554_at 1.4971 0.0000 0.000491279_at 0.8667 0.0000 0.001774099_at 1.0787 0.0000 0.010483118_at -1.2142 0.0000 0.013981647_at 1.0362 0.0000 0.013984412_at 1.3124 0.0000 0.022290585_at 1.9859 0.0000 0.025884618_at -1.6713 0.0000 0.025891790_at 1.7293 0.0000 0.035080755_at 1.5238 0.0000 0.035185539_at 0.9303 0.0000 0.035190749_at 1.7093 0.0000 0.035174038_at -1.6451 0.0000 0.035179299_at 1.7156 0.0000 0.035172962_at 2.1059 0.0000 0.035188719_at -3.1829 0.0000 0.035172943_at -2.0520 0.0000 0.035191797_at 1.4676 0.0000 0.035178356_at 2.1140 0.0001 0.035990268_at 1.6552 0.0001 0.0421
What happened to the Biology???

Slightly more informative resultsProbe Set ID Gene SymbolGene Title go biological process termgo molecular function term log.ratio pvalue adj.p73554_at CCDC80 coiled-coil domain containing 80--- --- 1.4971 0.0000 0.000491279_at C1QTNF5 /// MFRPC1q and tumor necrosis factor related protein 5 /// membrane frizzled-related proteinvisual perception /// embryonic development /// response to stimulus--- 0.8667 0.0000 0.001774099_at --- --- --- --- 1.0787 0.0000 0.010483118_at RNF125 ring finger protein 125 immune response /// modification-dependent protein catabolic processprotein binding /// zinc ion binding /// ligase activity /// metal ion binding-1.2142 0.0000 0.013981647_at --- --- --- --- 1.0362 0.0000 0.013984412_at SYNPO2 synaptopodin 2 --- actin binding /// protein binding1.3124 0.0000 0.022290585_at C15orf59 chromosome 15 open reading frame 59--- --- 1.9859 0.0000 0.025884618_at C12orf39 chromosome 12 open reading frame 39--- --- -1.6713 0.0000 0.025891790_at MYEOV myeloma overexpressed (in a subset of t(11;14) positive multiple myelomas)--- --- 1.7293 0.0000 0.035080755_at MYOF myoferlin muscle contraction /// blood circulationprotein binding 1.5238 0.0000 0.035185539_at PLEKHH1 pleckstrin homology domain containing, family H (with MyTH4 domain) member 1--- binding 0.9303 0.0000 0.035190749_at SERPINB9 serpin peptidase inhibitor, clade B (ovalbumin), member 9anti-apoptosis /// signal transductionendopeptidase inhibitor activity /// serine-type endopeptidase inhibitor activity /// serine-type endopeptidase inhibitor activity /// protein binding1.7093 0.0000 0.035174038_at --- --- --- --- -1.6451 0.0000 0.035179299_at --- --- --- --- 1.7156 0.0000 0.035172962_at BCAT1 branched chain aminotransferase 1, cytosolicG1/S transition of mitotic cell cycle /// metabolic process /// cell proliferation /// amino acid biosynthetic process /// branched chain family amino acid metabolic process /// branched chain family amino acid biosynthetic process /// branched chain family amino acid biosynthetic processcatalytic activity /// branched-chain-amino-acid transaminase activity /// branched-chain-amino-acid transaminase activity /// transaminase activity /// transferase activity /// identical protein binding2.1059 0.0000 0.035188719_at C12orf39 chromosome 12 open reading frame 39--- --- -3.1829 0.0000 0.035172943_at --- --- --- --- -2.0520 0.0000 0.035191797_at LRRC16A leucine rich repeat containing 16A--- --- 1.4676 0.0000 0.035178356_at TRDN triadin muscle contraction receptor binding 2.1140 0.0001 0.035990268_at C5orf23 chromosome 5 open reading frame 23--- --- 1.6552 0.0001 0.0421
If we are lucky, some of the top genes mean something to us
But what if they don’t?
And how what are the results for other genes with similar biological functions

How to incorporate biological knowledge
• The type of knowledge we deal with is rather simple:
We know groups/sets of genes that for example– Belong to the same pathway– Have a similar function– Are located on the same chromosome, etc…
• We will assume these groupings to be given, i.e. we will not yet discuss methods used to detect pathways, networks, gene clusters• We will later!

What is a pathway?• No clear definition
– Wikipedia: “In biochemistry, metabolic pathways are series of chemical reactions occurring within a cell. In each pathway, a principal chemical is modified by chemical reactions.”
– These pathways describe enzymes and metabolites
• But often the word “pathway” is also used to describe gene regulatory networks or protein interaction networks
• In all cases a pathway describes a biological function very specifically

What is a Gene Set?• Just what it says: a set of genes!
– All genes involved in a pathway are an example of a Gene Set
– All genes corresponding to a Gene Ontology term are a Gene Set
– All genes mentioned in a paper of Smith et al might form a Gene Set
• A Gene Set is a much more general and less specific concept than a pathway
• Still: we will sometimes use two words interchangeably, as the analysis methods are mainly the same

Where Do Gene Sets/Lists Come From?
• Molecular profiling e.g. mRNA, protein– Identification à Gene list
– Quantification à Gene list + values– Ranking, Clustering (biostatistics)
• Interactions: Protein interactions, Transcription factor binding sites (ChIP)
• Genetic screen e.g. of knock out library• Association studies (Genome-wide)
– Single nucleotide polymorphisms (SNPs)
– Copy number variants (CNVs)
– ……..

What is Gene Set/Pathway analysis?
• The aim is to give one number (score, p-value) to a Gene Set/Pathway– Are many genes in the pathway differentially
expressed (up-regulated/downregulated)– Can we give a number (p-value) to the probability
of observing these changes just by chance?

Goals• Pathway and gene set data resources
• Gene attributes• Database resources
• GO, KeGG, Wikipathways, MsigDB• Gene identifiers and issues with mapping
• Differences between pathway analysis tools• Self contained vs. competitive tests• Cut-off methods vs. global methods• Issues with multiple testing

Gene Attributes• Functional annotation
– Biological process, molecular function, cell location
• Chromosome position• Disease association• DNA properties
– TF binding sites, gene structure (intron/exon), SNPs
• Transcript properties– Splicing, 3’ UTR, microRNA binding sites
• Protein properties– Domains, secondary and tertiary structure, PTM sites
• Interactions with other genes

Database Resources• Use functional annotation to aggregate genes
into pathways/gene sets
• A number of databases are available– Different analysis tools link to different databases– Too many databases to go into detail on every one– Commonly used resources:
• GO• KeGG• MsigDB• WikiPathways

Pathway and Gene Set data resources
• The Gene Ontology (GO) database– http://www.geneontology.org/– GO offers a relational/hierarchical database– Parent nodes: more general terms– Child nodes: more specific terms– At the end of the hierarchy there are genes/proteins– At the top there are 3 parent nodes: biological process,
molecular function and cellular component• Example: we search the database for the term
“inflammation”
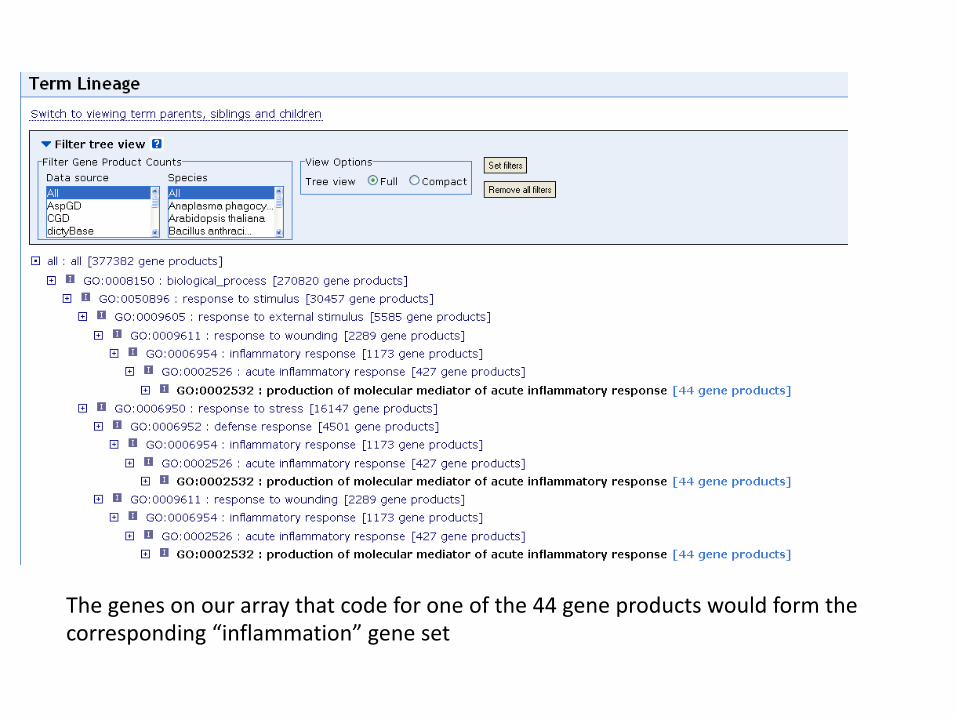
The genes on our array that code for one of the 44 gene products would form the corresponding “inflammation” gene set

What is the Gene Ontology (GO)?
• Set of biological phrases (terms) which are applied to genes:– protein kinase– apoptosis– membrane
• Ontology: A formal system for describing knowledge
• Gaudet P., Dessimoz C. (2017) Gene Ontology: Pitfalls, Biases, and Remedies. In: Dessimoz C., Škunca N. (eds) The Gene Ontology Handbook. Methods in Molecular Biology, vol 1446. Humana Press, New York, NY

GO Structure• Terms are related
within a hierarchy– is-a– part-of
• Describes multiple levels of detail of gene function
• Terms can have more than one parent or child

What GO Covers?
• GO terms divided into three aspects:– cellular component– molecular function– biological process
glucose-6-phosphate isomerase activity
Cell division
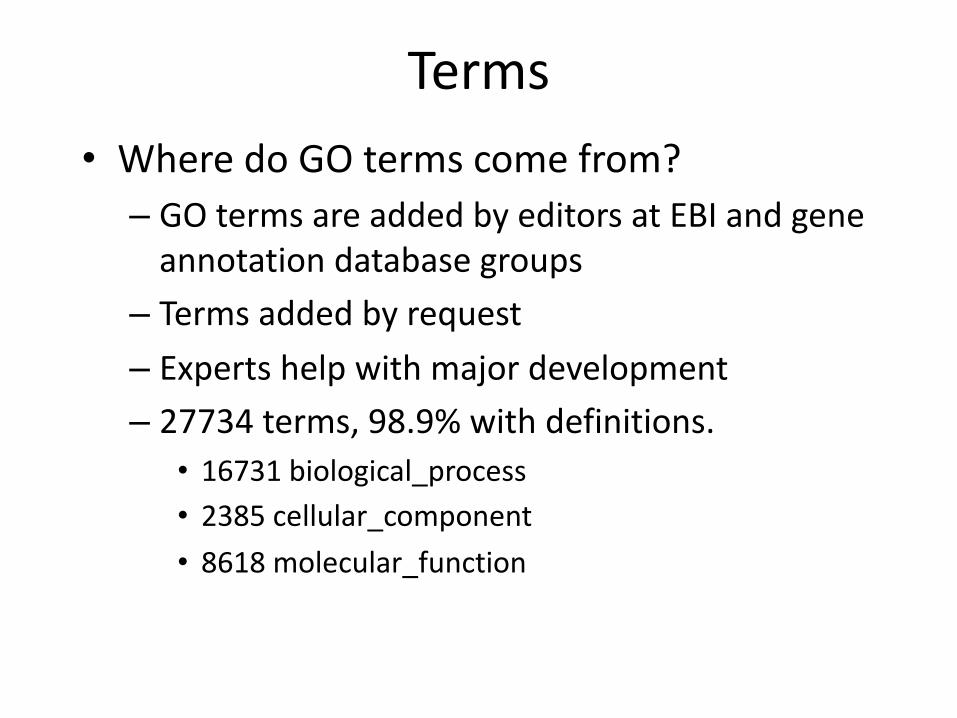
Terms• Where do GO terms come from?– GO terms are added by editors at EBI and gene
annotation database groups– Terms added by request– Experts help with major development– 27734 terms, 98.9% with definitions.• 16731 biological_process• 2385 cellular_component• 8618 molecular_function
• Genes are linked, or associated, with GO terms by trained curators at genome databases– Known as ‘gene associations’ or GO annotations– Multiple annotations per gene
• Some GO annotations created automatically
Annotations

Annotation Sources• Manual annotation– Created by scientific curators
• High quality• Small number (time-consuming to create)
• Electronic annotation– Annotation derived without human validation
• Computational predictions (accuracy varies)• Lower ‘quality’ than manual codes
• Key point: be aware of annotation origin
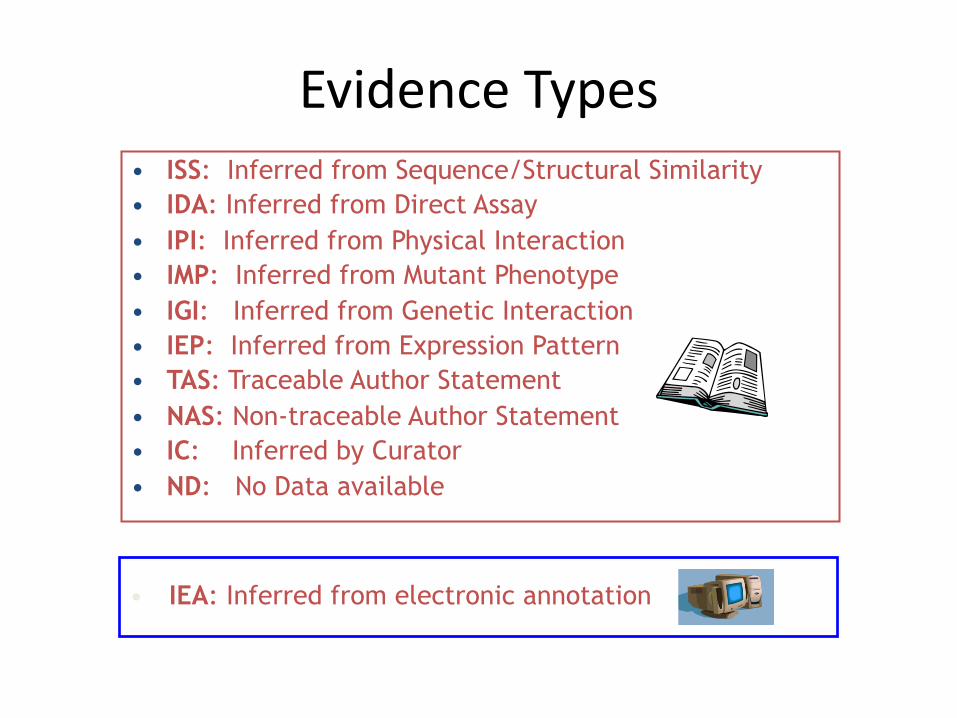
Evidence Types• ISS: Inferred from Sequence/Structural Similarity• IDA: Inferred from Direct Assay• IPI: Inferred from Physical Interaction• IMP: Inferred from Mutant Phenotype• IGI: Inferred from Genetic Interaction• IEP: Inferred from Expression Pattern• TAS: Traceable Author Statement• NAS: Non-traceable Author Statement• IC: Inferred by Curator• ND: No Data available
• IEA: Inferred from electronic annotation

Species Coverage
• All major eukaryotic model organism species
• Human via GOA group at UniProt
• Several bacterial and parasite species through TIGR and GeneDB at Sanger
• New species annotations in development

Variable Coverage
Lomax J. Get ready to GO! A biologist's guide to the Gene Ontology. Brief Bioinform. 2005 Sep;6(3):298-304.

Contributing Databases– Berkeley Drosophila Genome Project (BDGP)– dictyBase (Dictyostelium discoideum)– FlyBase (Drosophila melanogaster)– GeneDB (Schizosaccharomyces pombe, Plasmodium falciparum, Leishmania
major and Trypanosoma brucei)– UniProt Knowledgebase (Swiss-Prot/TrEMBL/PIR-PSD) and InterPro databases – Gramene (grains, including rice, Oryza) – Mouse Genome Database (MGD) and Gene Expression Database (GXD) (Mus
musculus)– Rat Genome Database (RGD) (Rattus norvegicus)– Reactome– Saccharomyces Genome Database (SGD) (Saccharomyces cerevisiae)– The Arabidopsis Information Resource (TAIR) (Arabidopsis thaliana)– The Institute for Genomic Research (TIGR): databases on several bacterial
species – WormBase (Caenorhabditis elegans)– Zebrafish Information Network (ZFIN): (Danio rerio)

GO Slim Sets• GO has too many
terms for some uses– Summaries (e.g. Pie
charts)• GO Slim is an official
reduced set of GO terms– Generic, plant, yeast

GO Software Tools
• GO resources are freely available to anyone without restriction– Includes the ontologies, gene associations and
tools developed by GO• Other groups have used GO to create tools for
many purposes– http://www.geneontology.org/GO.tools

Accessing GO: QuickGO
http://www.ebi.ac.uk/ego/

Other Ontologies
http://www.ebi.ac.uk/ontology-lookup
KEGG pathway database
• KEGG = Kyoto Encyclopedia of Genes and Genomes– http://www.genome.jp/kegg/pathway.html– The pathway database gives far more detailed
information than GO• Relationships between genes and gene products
– But: this detailed information is only available for selected organisms and processes
– Example: Adipocytokine signaling pathway
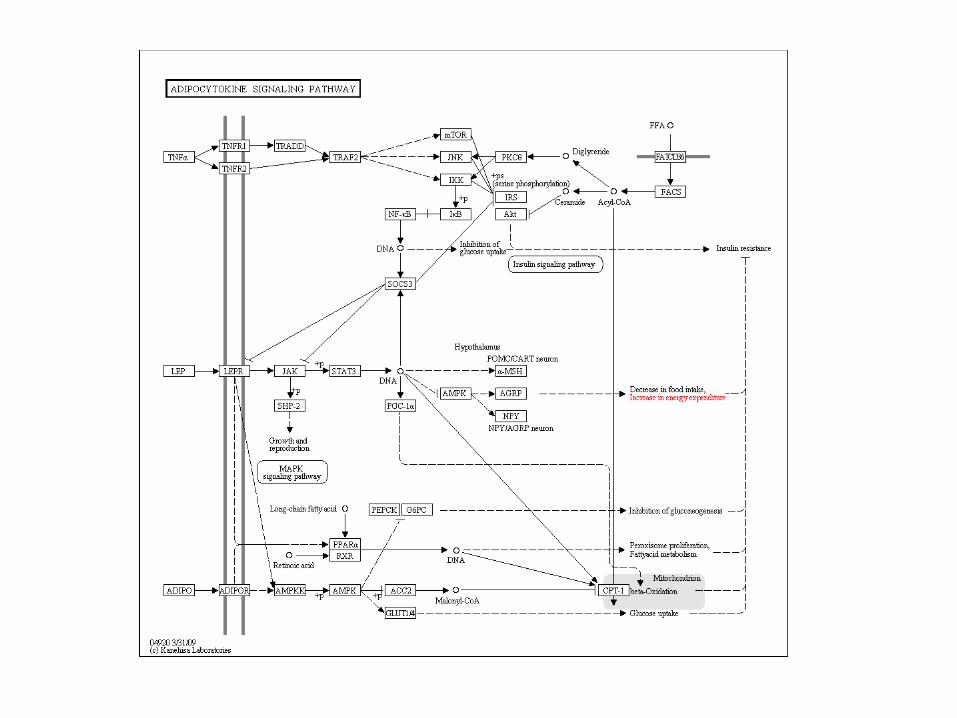
KEGG pathway database
• Clicking on the nodes in the pathway leads to more information on genes/proteins– Other pathways the node is involved with– Entries in Gene/Protein databases– References– Sequence information
• Ultimately this allows to find corresponding genes on the microarray and define a Gene Set for the pathway

Wikipathways
• http://www.wikipathways.org
• A wikipedia for pathways– One can see and download pathways– But also edit and contribute pathways
• The project is linked to the GenMAPP and Pathvisio analysis/visualisation tools


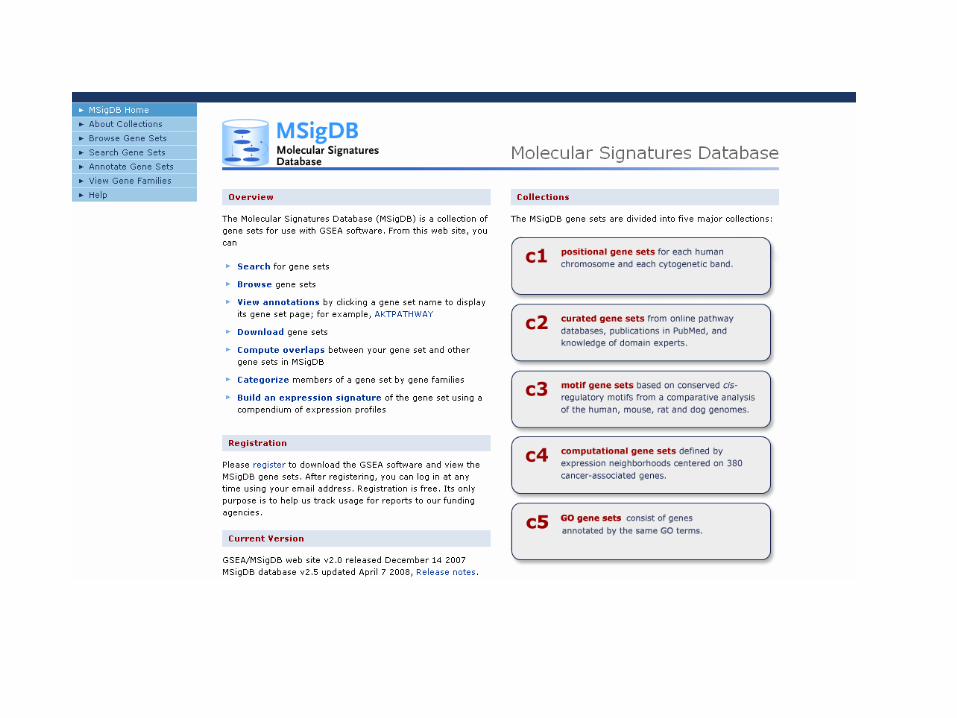
MSigDB• MSigDB = Molecular Signature Databasehttp://www.broadinstitute.org/gsea/msigdb
• Related to the the analysis program GSEA• MSigDB offers gene sets based on various
groupings– Pathways– GO terms– Chromosomal position,…

Some Warnings• In many cases the definition of a pathway/gene set in a
database might differ from that of a scientist
• The nodes in pathways are often proteins or metabolites; the activity of the corresponding gene set is not necessarily a good measurement of the activity of the pathway
• There are many more resources out there (BioCarta, BioPax)
• Commercial packages often use their own pathway/gene set definitions (Ingenuity, Metacore, Genomatix,…)
• Genes in a gene set are usually not given by a Probe Set ID, but refer to some gene data base (Entrez IDs, Unigene IDs)
• Conversion can lead to errors!

Gene Attributes• Functional annotation
– Biological process, molecular function, cell location• Chromosome position• Disease association• DNA properties
– TF binding sites, gene structure (intron/exon), SNPs• Transcript properties
– Splicing, 3’ UTR, microRNA binding sites• Protein properties
– Domains, secondary and tertiary structure, PTM sites• Interactions with other genes

Sources of Gene Attributes
• Ensembl BioMart (eukaryotes)– http://www.ensembl.org
• Entrez Gene (general)– http://www.ncbi.nlm.nih.gov/sites/entrez?db=gen
e• Model organism databases– E.g. SGD: http://www.yeastgenome.org/
• Many others…..

Gene and Protein Identifiers• Identifiers (IDs) are ideally unique, stable names or
numbers that help track database records– E.g. Social Insurance Number, Entrez Gene ID 41232
• Gene and protein information stored in many databases– à Genes have many IDs
• Records for: Gene, DNA, RNA, Protein– Important to recognize the correct record type– E.g. Entrez Gene records don’t store sequence. They link
to DNA regions, RNA transcripts and proteins.

NCBI Database
Links
http://www.ncbi.nlm.nih.gov/Database/datamodel/data_nodes.swf
NCBI:U.S. National Center for Biotechnology Information
Part of National Library of Medicine (NLM)

Common IdentifiersSpecies-specificHUGO HGNC BRCA2MGI MGI:109337RGD 2219 ZFIN ZDB-GENE-060510-3 FlyBase CG9097 WormBase WBGene00002299 or ZK1067.1SGD S000002187 or YDL029WAnnotationsInterPro IPR015252OMIM 600185Pfam PF09104Gene Ontology GO:0000724SNPs rs28897757Experimental PlatformAffymetrix 208368_3p_s_atAgilent A_23_P99452CodeLink GE60169Illumina GI_4502450-S
GeneEnsembl ENSG00000139618Entrez Gene 675Unigene Hs.34012
RNA transcriptGenBank BC026160.1RefSeq NM_000059Ensembl ENST00000380152
ProteinEnsembl ENSP00000369497RefSeq NP_000050.2UniProt BRCA2_HUMAN or A1YBP1_HUMANIPI IPI00412408.1EMBL AF309413 PDB 1MIU
Red = Recommended

Identifier Mapping• So many IDs!– Mapping (conversion) is a headache
• Four main uses– Searching for a favorite gene name– Link to related resources– Identifier translation
• E.g. Genes to proteins, Entrez Gene to Affy– Unification during dataset merging
• Equivalent records

ID Mapping Challenges
• Avoid errors: map IDs correctly
• Gene name ambiguity – not a good ID
– e.g. FLJ92943, LFS1, TRP53, p53
– Better to use the standard gene symbol: TP53
• Excel error-introduction
– OCT4 is changed to October-4
• Problems reaching 100% coverage
– E.g. due to version issues
– Use multiple sources to increase coverage
Zeeberg BR et al. Mistaken identifiers: gene name errors can be introduced inadvertently when using
Excel in bioinformatics BMC Bioinformatics. 2004 Jun 23;5:80

Summary
• Databases• Choice makes a difference• Not all use the same IDs – watch out J

Questions?