pathways data laura saenz, ph.d. assoc. vice provost cta office of undergraduate studies
TRANSCRIPT

Pathways Data Laura Saenz, Ph.D. Assoc. Vice Provost CTA Office of Undergraduate Studies

Districts Reporting DataMcAllen ISD Sharyland ISD Weslaco ISD PSJA ISDA

Questions Answered with Pathways Data? Did passing rate vary in first college course
taken at STC or UTPA by highest level high school course taken? Math
Includes AP Calculus, but no dual credit data Science
Includes dual credit, AP and AP/Dual credit Data not reported today: History and English Per FERPA guideline, data not reported for
courses with less than 5 students

Timespan of Data 2007 Graduates 2008 Graduates 2009 Graduates 2010 Graduates

STC Science Courses General Biology General Chemistry College/University Physics Anatomy and Physiology Other Science (e.g., Physical Science)

High School Courses Taken Advanced Courses
AP Biology AP Chemistry AP Physics AP/Dual credit
biology Dual credit biology
Regular & Pre-AP
Biology Chemistry IPC Physics Pre-AP Biology,
Chemistry & Physics

Did Science Performance Vary at STC by HS Course Taken? AP Biology
Across all sciences: 95% Passed (n=138) General biology: 96% (n=132)
AP Chemistry Across all sciences: 84% Passed (n=16)
General biology: 88% (n=7) AP Physics
Across all sciences: 88% Passed (n=38) College/University Physics: 97% (n=35)

Did Science Performance Vary at STC by HS Course Taken? AP/Dual Credit Biology
General biology: 100% Passed (n=21) Biology
Across all science courses: 60% passed (n= 94)
General biology: 51% (n=31) General chemistry: 75% (n=6) Anatomy and Physiology: 61% (n=35) Other sciences: 17% (n=5)

Did Science Performance Vary at STC by HS Course Taken? Chemistry
Across all science courses: 58% passed (n=100) General biology: 53% (n=40) Anatomy & Physiology: 58% (n=33) Other Sciences: 69% (n=20)

Did Science Performance Vary at STC by HS Course Taken? Dual Credit Biology
General biology: 58% Passed (n=21) No other course taken
IPC Across all sciences: 61% Passed
(n=73) General biology: 61% (n=28) Anatomy & Physiology: 55% (n=28) Other sciences: 79% (n=15)

Did Science Performance Vary at STC by HS Course Taken? Physics
Across all science courses: 66% Passed (n=50)
Anatomy & Physiology: 75% (n=15) Other Sciences: 85% (n=17)

Did Science Performance Vary at STC by HS Course Taken? Pre-AP Biology
Across all science courses: 67% passed (n=120) General biology: 57% (n=47) General chemistry: 75% (n=18) College/University Physics: 79% (n=19) Anatomy & Physiology: 72% (n=28) Other sciences: 80% (n=8)

Did Science Performance Vary at STC by HS Course Taken? Pre-AP Chemistry
Across all science courses: 65% passed (n=54) General biology: 65% (n=31) College/University Physics: 82% (n=9) Anatomy & Physiology: 56% (n=10)

Did Science Performance Vary at STC by HS Course Taken? Pre-AP Physics
Across all science courses: 78% passed (n=86) General biology: 86% (n=54) General chemistry: 71% (n=5) College/University Physics: 91% (n=10) Anatomy & Physiology: 45% (n=9) Other sciences: 80% (n=8)

UTPA Science Courses Taken General biology Anatomy and Physiology General Chemistry I Other Science (e.g., Physical science)

High School Courses Taken
Advanced AP Biology AP Chemistry AP Physics AP/Dual Credit
biology Dual Credit
biology
Regular or Pre-AP
Biology Chemistry IPC Phsyics Pre-Ap biology,
chemistry, & physics

Did Science Performance Vary at UTPA by HS Course Taken? AP Biology
Across all sciences: 81% Passed (n=72) General biology: 96% (n=17) A&P: 87% (n=13) General Chemistry I: 78% (n=36) Other: 86% (n=6)

Did Science Performance Vary at UTPA by HS Course Taken? AP Chemistry
Across all sciences: 92% Passed (n=33) General biology: 86% (n=6) General chemistry I: 91% (n=19) Other: 100% (n=6)
AP Physics Across all sciences: 82% Passed (n=14)
General chemistry I: 78% (n=7) Other: 86% (n=6)

Did Science Performance Vary at UTPA by HS Course Taken? AP/Dual Credit Biology
Across all science courses: 80% (n=16) General chemistry: 60% Passed (n=6)
Biology Across all science courses: 60%
passed (n= 97) General biology: 62% (n=45) Anatomy and Physiology: 56% (n=24) General chemistry: 50% (n=17) Other sciences: 85% (n=11)

Did Science Performance Vary at UTPA by HS Course Taken? Chemistry
Across all science courses: 47% passed (n=103)
General biology: 49% (n=42) Anatomy and Physiology: 38% (n=18) General chemistry: 46% (n=32) Other sciences: 69% (n=11)

Did Science Performance Vary at UTPA by HS Course Taken? Dual Credit Biology
Across all sciences: 92% Passed (n=11) General chemistry: 86% (n=6)
IPC Across all sciences: 55% Passed (n=70)
General biology: 59% (n=35) Anatomy & Physiology: 57% (n=12) General chemistry I: 43% (n=17) Other sciences: 75% (n=6)

Did Science Performance Vary at UTPA by HS Course Taken? Physics
Across all science courses: 69% Passed (n=64) General biology: 62% (n=23) Anatomy & Physiology: 55% (n=11) General chemistry I: 78% (n=21) Other sciences: 100% (n=9)
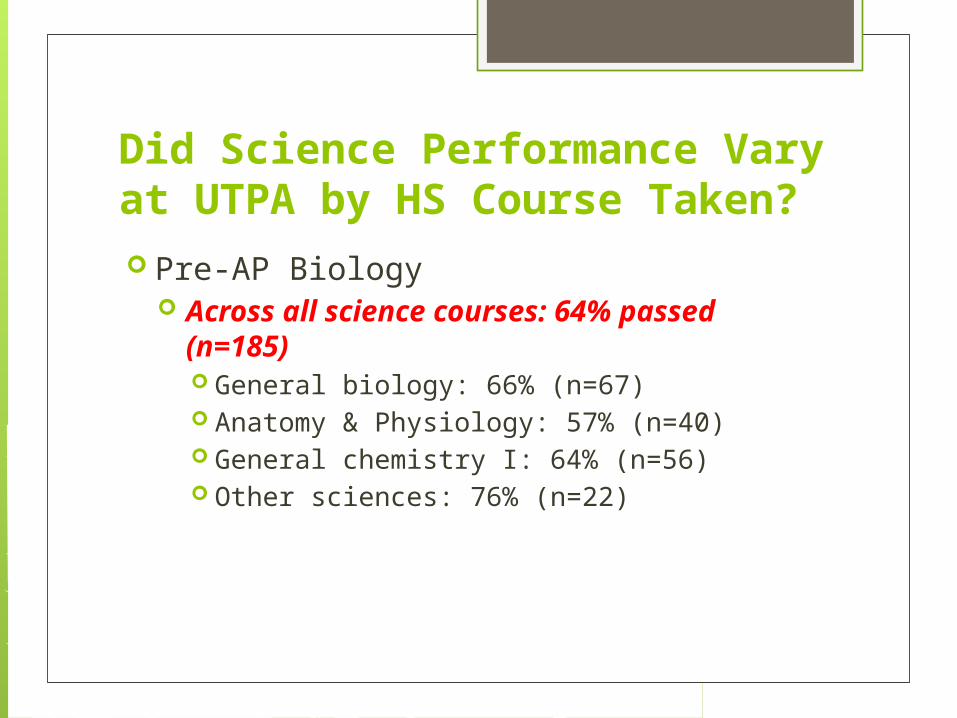
Did Science Performance Vary at UTPA by HS Course Taken? Pre-AP Biology
Across all science courses: 64% passed (n=185) General biology: 66% (n=67) Anatomy & Physiology: 57% (n=40) General chemistry I: 64% (n=56) Other sciences: 76% (n=22)

Did Science Performance Vary at UTPA by HS Course Taken? Pre-AP Chemistry
Across all science courses: 63% passed (n=118) General biology: 61% (n=33) Anatomy & Physiology: 60% (n=24) General chemistry I: 57% (n=38) Other sciences: 82% (n=23)

Did Science Performance Vary at UTPA by HS Course Taken? Pre-AP Physics
Across all science courses: 63% passed (n=162) General biology: 73% (n=64) Anatomy & Physiology: 55% (n=31) General chemistry I: 57% (n=49) Other sciences: 67% (n=18)

STC Algebra II to Chemistry Alignment Algebra II
General chemistry 73.5% passed (n =36) All chemistry 75.5% passed (n=40)
Pre-ap Algebra II General chemistry 78.6% passed (n=22) All chemistry 76.7% passed (n=23)

UTPA Algebra II to Chemistry Alignment Algebra II
General chemistry I 54.2% passed (n=148)
Chemistry for engineers 80% passed (n=12)
Organic chemistry I 71.4% passed (n=5) All chemistry 56.5% passed (n=169)
Pre-AP Algebra II

UTPA Algebra II to Chemistry Alignment
General Chemistry I 72.9% passed (n=175)
General Chemistry II 85.7% passed (n=6) Chemistry for Engineers 66.7% passed
(n=16) Organic Chemistry I 81.8% passed (n=9) All chemistry 73% passed (n=206)

Did Mathematics Performance Vary at STC by HS Course Taken?
AP Calculus Across all math course: 93% passed (n=125) College Algebra: 94% (n=120) Other math courses: <5, not reported
Pre-Calculus Across all math courses: 89% passed (n=750) Developmental Math: 90% (n=27) College Algebra: 89% (n=703) Pre-calculus math: 75% (n=6) Other math courses: 78% (n=14)

Did Mathematics Performance Vary at STC by HS Course Taken?
Algebra II Across all math course: 50% passed
(n=504) Development Math: 54% (n=266) College Algebra: 43% (n=212) Pre-calculus Math: 93% (n=13) Other math courses: 72% (n=13)

Did Mathematics Performance Vary at STC by HS Course Taken? Below Algebra II
Across all math courses: 44% Passed (n=93)
Developmental Math: 42% (n=50) College Algebra: 43% (n=35) Pre-calculus math: 100% (n=5) Other: not reported, <5

Did Mathematics Performance Vary at UTPA by HS Course Taken? AP Calculus
Across all math courses: 89% passed (n=85)
DE Math: <5, not reported College Algebra: 92% (n=23) Calculus I: 100% (n=10) Elementary Statistics: 100% (n=21) Other: 75% (n=27)

Did Mathematics Performance Vary at UTPA by HS Course Taken? Pre-Calculus
Across all math courses: 82% Passed (n=515)
DE Math: 79% (n=119) College Algebra: 88% (n=148) Calculus I: 71% (n=42) Elementary Statistics: 83% (n=89) Other Math Course: 83% (n=117)

Did Mathematics Performance Vary at UTPA by HS Course Taken? Algebra II
Across all math courses: 64% Passed (n=426)
DE Math: 57% (n=215) College Algebra: 75% (n=132) Calculus: 90% (n=9) Elementary Statistics: 66% (n=29) Other: 67% (n=41)

Did Mathematics Performance Vary at UTPA by HS Course Taken? Below Algebra II
Across all math courses: 65% Passed (n=60)
DE Math: 63% (n=30) College Algebra: 69% (n=18) Calculus: <5, not reported Elementary Statistics: <5, not reported Other: 69% (n=9)