pathways to federal government: a study of the pathways
TRANSCRIPT
University of Nebraska at Omaha University of Nebraska at Omaha
DigitalCommons@UNO DigitalCommons@UNO
Public Administration Theses, Dissertations, and Student Creative Activity School of Public Administration
4-29-2021
Pathways to Federal Government: A Study of the Pathways Pathways to Federal Government: A Study of the Pathways
Programs and Millennial Inclusion in Federal Government Programs and Millennial Inclusion in Federal Government
Nicholas J. Cordonier
Follow this and additional works at: https://digitalcommons.unomaha.edu/pubadstudent
Part of the Public Affairs Commons

RUNNING HEAD: PATHWAYS TO FEDERAL GOVERNMENT
Pathways to Federal Government:
A Study of the Pathways Programs and Millennial Inclusion in Federal Government
Nicholas J. Cordonier
University of Nebraska at Omaha

RUNNING HEAD: PATHWAYS TO FEDERAL GOVERNMENT 1
ABSTRACT
This study seeks to better understand the federal government’s “Pathways Programs”,
which are comprised of internships, recent graduate hiring priorities, and the Presidential
Management Fellowship (PMF). The purpose of the Pathways Program is to increase younger
generations’ access to federal employment. This study hopes to assess the relationship between
participation in the Pathways Programs and the percentage of the millennials working within
federal government, as a means of evaluating the success of the Pathways Programs.

RUNNING HEAD: PATHWAYS TO FEDERAL GOVERNMENT 2
EXECUTIVE SUMMARY
The purpose of this study is to assess the relationship between federal agencies’ adoption
of the Pathways Programs and employee recruitment and retention of millennials. It was
expected that federal agencies with a higher percentage of Pathways Programs employees would
have a higher percentage of millennials. This is based on the literature which indicates that
millennials are motivated by extrinsic rewards such as salary as well as intrinsic rewards such as
engagement and career development. Fully established in FY2013, the Pathways Programs are
composed of internships, recent graduate hiring authorities, and the Presidential Management
Fellowship (PMF). Prior to the Pathways Programs implementation, younger applicants
struggled with being hired into the federal government due to hiring preferences such as
veterans’ preference and hiring individuals with more experience. This was made worse by long
and burdensome hiring timelines and processes. The Pathways Programs were designed to
alleviate these hiring obstacles while also enveloping the engagement and career development
motivations of millennials as a means of recruitment and retention to federal employment.
Data was collected between FY2013 to FY2019 from the Office of Personnel
Management (OPM) as well as the Department of Veterans Affairs. The study utilized
descriptive statistics, correlations, scatterplots, and a multivariate regression. These analyses
were conducted using Microsoft Excel. The dependent variable was the percentage of millennials
within federal government. The independent variable was the percentage of Pathways Programs
Employees. Data on seven control variables was also collected to include: average salary, WLB
satisfaction, engagement, Public Service Motivation (PSM), employee satisfaction, separations,
and Presidential Administration.
The results of this study showed that there was not a statistically significant relationship
between the percentage of millennials and the percentage of Pathways Programs employees in
federal government when controlling for several variables. The study did find that over 60% of
the federal government had 20% or less of their workforce classified as millennials from FY2013
to FY2019. Over 90% of the federal government had 2% or less of their workforce classified as a
Pathways Programs employee over the same period. Additionally, participation in the Pathways
Programs grew between FY2013 and FY2016, but then declined between FY2017 and FY2019.
Four control variables did prove to have statistically significant relationships with the percentage
of millennials. The average salary, WLB satisfaction, and employee separations all had negative
relationships with the percentage of millennials. The Presidential Administration control variable
had a positive relationship with the percentage of millennials. It is expected that a federal hiring
freeze and employment reduction in 2017 may have had an effect on the results of this study but
more research would need to be done to assess this theory.
Overall, it appears the Pathways Programs are under-utilized. The mean for the
percentage of Pathways Programs employees from FY2013 to FY2019 was less than 1% of the
total federal workforce. It may prove to be beneficial for the Office of Personnel Management
(OPM) to re-educate or reinforce the benefits of the Pathways Programs for agencies in need of
recruiting millennials. Further research into hiring official preferences and experiences with the
Pathways Programs may also help to understand its effectiveness in recruiting and retaining
millennials.
RUNNING HEAD: PATHWAYS TO FEDERAL GOVERNMENT 3
INTRODUCTION
One of the most important factors for any organization is their workforce. Whether in the
goods or service industry, a workforce helps organizations realize their mission. Keeping a sharp
eye on the demographics of your workforce can help an organization maintain institutional
knowledge as one generation retires, and another is hired or moves forward to take on their
responsibilities. But what happens when the new generation is not there to step in? That is the
case for the federal workforce. President Trump’s Fiscal Year 2021 Budget notes that the federal
government’s workforce is aging. About 29% of Federal employees are older than age 55,
whereas only 7% are younger than age 30 (Office of Management and Budget, 2020).
Additionally, a 2016 Government Accountability Office (GAO) Report found that agencies with
high retirement eligibilities also have a lower percentage of millennials in their workforce
(Federal Workforce, 2016). This disparity in age leaves the federal government ill-suited to
replace retiring employees while still maintaining government services. This issue is further
compounded when we consider the recent effects of COVID-19 and the pace of retirements in
the United States. According to the Pew Research Center, the percentage of Baby Boomers,
those born between 1946 and 1964, who retired by the third quarter of 2020 rose by nearly 13%
when compared to the same quarter in 2019 (Fry, 2020). This recent uptick in retirements places
even greater pressure on the federal government to recruit and retain a younger generation of
employees. We could soon see institutional knowledge slip away with each wave of the “Silver
Tsunami”.
The term “Silver Tsunami” started back in 2001 in a Pew Research Center report on
senior citizens and their use of the internet. The term was used to describe how the baby boomer
generational cohort would retire from the workforce in massive waves (Fox, 2001, p. 1). So, if
we have known about the Silver Tsunami since 2001, what has the federal government done
since then to curb its effects on the federal workforce? One course of action has been the
implementation of the Pathways Programs. The Pathways Programs were created under an
executive order in 2010 by President Obama to combat the effects of the federal hiring structure.
It was argued that the Federal civil service hiring system favored applicants with workplace
experience over students and recent graduates; thus, prohibiting a younger generation from
entering the ranks of the Federal workforce. The executive order created a federal internship and
recent graduates hiring priority while also revitalizing the Presidential Management Fellowship
(PMF) (Exec. Order No. 13562, 2010). Through the Pathways Programs, the federal
government’s hiring system was to be reorganized to better recruit and retain a younger
generation of Federal employees. After ten years of implementation and the reality that the
federal government still lacks a younger workforce, this study seeks to understand how effective
the Pathways Programs are at recruiting and retaining a younger workforce.
The purpose of this study was to understand the relationship between the implementation
of Pathways Programs and the percentage of millennials within federal government. We know
that the Federal government is still aging today, but this study sought to learn if there were
success stories within departments and agencies that solidify the programs’ purpose and can be
beacons for the rest of government to follow. With the focus of the study being about millennials
and government, it is important to begin with a review of the motivations of millennials within
the workforce. This will help us understand if the federal government is competitive in recruiting

RUNNING HEAD: PATHWAYS TO FEDERAL GOVERNMENT 4
and retaining millennials. Next, the review transitions to understanding the relationship between
Public Service Motivation (PSM) and millennials as a means of assessing if millennials are even
attracted to government employment. Lastly, we take a more in-depth look at the Pathways
Programs and the body of research behind each of the components.
After the literature review, an introduction to this quantitative study will be offered where
the independent variable is the percentage of pathways employees within each federal
department and the dependent variable is the percentage of millennials within a select group of
departments and agencies. The expectation is that federal organizations that pursue greater
involvement with the Pathways Programs will have a greater number of millennials within their
workforce over time, which in turn places them in a greater position to address the “Silver
Tsunami”.
LITERATURE REVIEW
The Pew Research Center classifies individuals born between 1981 and 1996 as
millennials (Dimock, 2019). Since the thrust of this study revolves around recruiting and
retaining millennials to federal government, it is first important to review the factors that
motivate millennials to pursue employment in various sectors. Many studies have been
conducted to examine the motivations of the millennial generation. A common theme among
millennials is best captured by Thompson and Gregory (2012) in that “Millennials will expect
organizations to continually re-engage them and remind them of why they should stay” (p. 239).
This theme can be observed from other studies about what attracts millennials to organizations.
The literature indicates that millennials are motivated by extrinsic rewards such as salary and
benefits as well as intrinsic factors such as engagement and professional development. They are
also motivated by environmental factors such as work-life balance (WLB) practices. The
following section dives deeper into millennial motivations and how they relate to employment
choices.
Millennial Motivations – What Attracts Millennials?
Like many other generations, extrinsic rewards like salary and benefits are a high area of
attraction for millennials. A report by Deloitte (2016) studied 29 different markets globally
against 14 factors for millennial motivations and found that the largest factor contributing to a
millennial’s decision on where to work was pay and financial benefits offered by the
organization only need page number if using a direct quote. These findings were confirmed
through other studies conducted by Kuron et al. (2015), Ng, Gossett, Winter (2016), and Zaharee
et al. (2018) who found salary to be a strong motivator in millennials’ decisions on where to
work. This bodes well for the federal government when you consider a 2008 report by the U.S.
Merit Systems Protection Board (MSPB) which surveyed new hires and asked them why they
chose to work for the federal government. Over 97% of respondents said yearly salary increases
were a reason they chose the federal government over other employment options. However, the
same report also indicated that only 71% of new hires ultimately chose federal employment
because of the pay. The MSPB also found that there was little difference in survey responses
about federal benefits between employees under 30 and those over the age of 30 (U.S. Merit
Systems Protection Board, 2008,). It appears that the federal government remains competitive in

RUNNING HEAD: PATHWAYS TO FEDERAL GOVERNMENT 5
attracting millennials and other employees to seek careers in public service with regard to
extrinsic rewards. While extrinsic rewards are viewed as the strongest motivator of millennials,
intrinsic rewards still play a part in recruiting and retaining millennials.
Two intrinsic rewards have been viewed as strong motivators of millennials. They
include employee engagement and career development. Employee engagement focuses on the
capacity for employees to foster an “emotional connection” with their employer and the ability to
exhibit behaviors “consistent with good job performance” (Morrell & Abston, 2019, p. 1).
Authors Mihelic & Aleksic (2017) and Zaharee et al. (2018) cite the importance of work being
“meaningful” or “purposeful” to hold millennials’ interest within the organization. The United
States Government Accountability Office (GAO) also found that the strongest drivers of
employee engagement in millennials and non-millennials were constructive performance
conversations and career development training (Federal Workforce, 2016, p. 20).
Moving to career development, Zaharee et al. (2018) and Morrell & Abston (2019) found
that “high quality feedback” and professional development opportunities help to contribute to
employee engagement of millennials in the workplace. Zaharee et al. specifically found that 71%
of millennials said they would leave their current employer due to a lack of building professional
skills (Zaharee et al., 2018, p. 52). Ertas (2015) discovered that millennials are more satisfied
with the federal government than older employees in regard to opinions on fairness of
performance and skills development (pg. 413). This means the millennials feel more engaged
than other employees in federal government. It is important to note that one study found that the
importance of engagement declines for millennials as their career grows (Kuron et al., 2015, p.
1001). This could mean that the effects of engagement and career development in recruiting and
retaining millennials could wear off over time. Despite this it appears that intrinsic rewards like
engagement and career development are still important to millennials when considering where to
work. A final millennial motivator can be found in work-life balance.
Work-life balance (WLB) is the “balance” between an individual’s work role with their
private role (Mihelic & Aleksic, 2017, p. 398). It is the process of tending to responsibilities at
work and outside of work in a way that neither are held at the expense of the other. Technology
has afforded employees the ability to reach their own ideal WLB. Thompson and Gregory (2012)
submit that technology has broken down “time and geographic barriers” of the office and has
caused a shift in work expectations. The new expectation from millennials is that if they are
meeting performance expectations then when and where they work should not be a concern (p.
242). After removing salary as a motivator, Deloitte (2016) found that WLB was the highest
rated factor for millennials in evaluating job opportunities (p. 20). The importance of WLB to
millennials continues to be confirmed in studies by Kuron et al. (2015), Zaharee et al. (2018),
and Morrell & Abston (2019).
The most common policies related to WLB include telecommuting, flextime, and
compressed workweeks (Morrell & Abston, 2019, p. 4-5). The study by Zaharee et al. looked
specifically at which WLB policies millennials favor. Their results showed the following
expectations for employers: 91% expected flexible hours, 60% expected teleworking, and 59%
expected three weeks of vacation (Zaharee et al., 2018, p. 56). These are important realizations
for employers seeking to recruit and retain millennials. Having a robust WLB program to include

RUNNING HEAD: PATHWAYS TO FEDERAL GOVERNMENT 6
teleworking, flextime/flex schedules, and more vacation time enhances organizational
attractiveness to millennials. Conversely, when studying turnover intentions and motivations of
millennials in federal government, Ertas (2015) discovered that WLB was not particularly
important to millennials (p. 418). Despite this, the GAO found that WLB was the third strongest
driver of employee engagement in millennials and non-millennials (Federal Workforce, 2016, p.
20). WLB continues to grow as an expectation of all employees, including millennials, as a
means of improving the work environment. However, WLB’s effect on millennial recruitment
and retention is still debated.
In summary, it appears that millennials are motivated by both extrinsic and intrinsic
rewards. Additionally, they may be motivated by WLB policies as a means of making an
organization more attractive in recruiting and retaining millennials. It is also clear that the federal
government appears competitive in these areas of millennial motivation and yet the federal
government is still lagging behind the private sector when it comes to millennials in the
workforce. Some authors have speculated that Public Service Motivation could also play a factor
in attracting millennials. Could it be that millennials are changing the way we think about PSM?
The next section of this review looks at the greater relationship between PSM and millennials.
Public Service Motivation – Are millennials attracted to public service?
Public Service Motivation (PSM) is defined as a general urge to contribute to the public
good (Christensen & Wright, 2011). Ng et al. (2016) noted that PSM was the only significant
factor leading millennials to prefer public service employment (pg. 419). Henstra & McGowan
(2016) found the same to be true when analyzing the reasons why hopeful graduate students
applied to public policy & public administration programs. They found the top reasons for
applying to graduate school in public policy and public administration to be attraction to public
policy making, commitment to civic duty, public interest, and compassion. This fits with the
general idea that individuals (i.e. millennials) with characteristics of PSM (civic duty, public
interest, compassion) would want to pursue careers in government. Rose (2015) found that
students with higher PSM had a preference in pursuing social work and employment in local
government. And yet, there appears to be a wave of growing research that objects to the
relationship of PSM and millennials.
Christensen & Wright (2011) as well as Ertas (2016) both found conflicting results
against the body of research on PSM and millennials. First, high levels of PSM neither increased
the likelihood of individuals going into public service nor decreased the likelihood of individuals
pursuing careers in the private sector (Christensen & Wright, 2011). This means that millennials
may be more motivated by other extrinsic or intrinsic rewards instead of PSM. Second,
millennials appear to participate in formal and informal volunteering activities less than their
older generations, which could lead to overall lower amount of PSM in millennials than other
generations. While millennials in public and non-profit sectors participated in volunteering
activities more than private sector millennials, older generations participated more in
volunteering activities than all millennial groups (public, non-profit, and private) (Ertas, 2016).
These findings suggest that millennials may have a lower PSM which in turn could explain why
there are fewer millennials in the public sector when compared to the private sector.

RUNNING HEAD: PATHWAYS TO FEDERAL GOVERNMENT 7
A final study worth noting looked at PSM and the differences between millennials and
the generation cohort preceding them, Generation X. Generation X represents individuals born
between 1965 and 1979. This study found that there was relatively no difference in PSM levels
between millennials and generation X survey respondents. It further found that high levels of
PSM correlated positively with intentions to work in the non-profit sector and negatively with
intentions to work in the private sector, though no relationship existed between PSM and
intention to work in the public sector (Einolf, 2016, 429, 448-449). It is clear that the body of
research on PSM and millennials remains on-going. While some authors found positive
relationships between PSM and millennials, others found the opposite to be true. However, with
an eye towards this study, PSM should not be discounted in seeking to understand the
relationship between millennials and the federal government. More research must be done to
fully understand PSM and its relationship with millennials. So far, it has been established that the
federal government is competitive in factors that motivate millennials. It has also been
established that PSM may or may not influence millennials’ decision to pursue public service. If
we consider that PSM does not influence millennials, then what else could affect the relationship
between millennials and federal employment? The answer is the federal civil service hiring
system.
Federal Civil Service Hiring System – Why do millennials need pathways?
The Pathways Programs reorganized the federal government’s civil service hiring system
in order to remove barriers for students and recent graduates (i.e. millennials). President Obama
noted in his 2010 executive order that the federal civil service hiring system was complex and
favored employees with experience. To overcome these barriers, the executive order sought to
create specific “pathways” to federal employment for students and recent graduates by creating
mentoring and training programs that would usher in a younger generation of government
employees. It was President Obama’s belief that a younger generation could be attracted to work
in federal government through “meaningful” development and “exposure” to careers in
government (Exec. Order No. 13562, 2010). The Pathways Programs were meant to recruit and
retain millennials into federal government given the emphasis on students and recent graduates.
The Pathways Programs represent three specific “pathways” to federal employment. It
includes the Internship Program, the Recent Graduates Program, and the Presidential
Management Fellows (PMF) Program. The Internship Program provides paid work experience in
the federal government to students in high schools, colleges, trade schools, and other educational
institutions. The program is administered by individual agencies and a Participant Agreement is
completed to ensure interns and the agency understand the expectations of the internship. The
intern’s job will be related to their career goals or field of study and can last up to one year or
longer depending on the educational requirement. Interns are eligible to be converted to a
permanent position within 120 days of successfully completing the internship (Office of
Personnel Management, n.d.).
The Recent Graduates Program provides career development opportunities to recent
graduates who have obtained their associates, bachelors, masters, professional, doctorate,
vocational or technical degree, or certificate from a qualifying educational institution within the
last two years. Veterans are eligible under the Recent Graduates Program if they have earned

RUNNING HEAD: PATHWAYS TO FEDERAL GOVERNMENT 8
their degree within the last six years, instead of the traditional two years. Like the Internship
Program, the Recent Graduates Program is administered by each agency with a Participant
Agreement (Office of Personnel Management, n.d.). What sets the Recent Graduates Program
apart from the Internship Program is its focus on career development. The Recent Graduates
Program involves an orientation, mentorship, individual development plan, at least 40 hours of
formal training a year, and opportunities for career advancement. After completion of the
program, employees are eligible to be converted to a permanent position (Office of Personnel
Management, n.d.).
Lastly, the PMF Program has been around for over three decades. It was folded into the
Pathways Programs initiative to help attract a younger workforce into management experiences
within the federal government. PMF is administered by the Office of Personnel Management
(OPM) and develops individuals who have earned an advanced degree (masters or other
professional degree) within the last two years by introducing them to a variety of upper
management opportunities in the federal government. OPM administers the program and pushes
the names of eligible finalists to federal agencies for appointment. Only finalists who are
selected by the agencies participate in the PMF. Once appointed, PMF employees participate in
orientations, senior-level mentorships, individual development plans, at least 80 hours of formal
training each year, and are evaluated using a performance plan. PMF employees are eligible to
be converted to a permanent position at the end of their two-year deployment (Office of
Personnel Management, n.d.). In sum, the Pathways Programs are expected to offer millennials
and other eligible employees a taste of the federal government as a means of recruiting and
retaining the next generation of government employees. But why did the federal government
settle on this three-pronged approach? Next, we review the research behind internships, recent
graduates, the PMF, and their relationship to millennials.
Internships
Internships have been a part of the public sector since the early 1930s and have been
recognized as a format for transitioning temporary employees into permanent full-time
employment (Benavides et al., 2013). Benavides et al. (2013) and Gerding et al. (2020) found the
public sector internships offer a great opportunity for students to learn about the functions of
government as a full-immersion experience. Similarly, Westmoreland Gariepy (2012) and
Conley Tyler et al. (2015) found that public sector internships played a factor in interns’ career
choices. The idea here is that interns and host organizations get an opportunity to try out the
employment relationship, where each side observes if the other is a right fit. Conley Tyler et al.
(2015) & Dailey (2016) also discovered that internships lead to the skill development necessary
to be successful professionally.
However, there has been some research detailing the drawbacks of internships. Dailey
(2016) found that internships can scare interns away from their host organizations. Her study
found that only 22% of interns were able to transition to full-time positions within their host
organizations. The leading reasons for interns not transitioning were that the organization was
“not a good fit” or there were no open positions available (pg. 473). The negative side of
internships was also studied by Cole et al. (1981), Beard & Morton (1998), and Conley Tyler et
al. (2015). They all found that supervision in both quality and quantity played heavily on interns’

RUNNING HEAD: PATHWAYS TO FEDERAL GOVERNMENT 9
perception of internship programs. A study of the effects of a well-structured and relationship-
based pharmacy internship at the University of Pittsburg Medical Center (UPMC) found that
participating interns were much more likely to remain in the UPMC system than seek other
employment after the internship. Specifically, the UPMC and its 19-hospital partnership saw
pharmacist vacancies drop from 27% to 4% after implementation of the new internship structure
(Skledar et al., 2009). Overall, it appears that structured internships with ample supervision can
help students interested in the public sector to obtain the skills necessary to be successful and
transition to permanent employment. While internships focus on feeding current students’
interests in government employment, recent graduate programs focus on individuals who have
already received their degrees and how those degrees can help serve the public.
Recent Graduates
In 2016, the GAO discussed that today’s jobs require more advanced degrees. In their
study, they found that the need for employees with “specialized knowledge” and “advanced
degrees” increased from 56% in 2004 to 62% in 2012 (Federal Workforce, 2016). A 2014 report
by the Council of Economic Advisers found that more millennials have a college degree than any
other generation with 47% of individuals age 25-34 holding a postsecondary degree (associates,
bachelor’s, or graduate degree) (Council of Economic Advisers, 2014, p. 12). Despite the need
for specialized knowledge and advanced degrees and the availability of millennials with that
specialized knowledge, it appears that recent graduates do not hold federal employment in very
much esteem. Spahr (2005) & Ressler (2006) note that government struggles with retaining
younger skilled employees due to opportunities and challenges elsewhere. A 2012 study by the
Partnership for Public Service and the National Association of Colleges and Employers (NACE)
found that only 2.3% of graduates planned to work in the federal government, compared to
almost 30% planning to work in the private sector and another 18% planning to work in the non-
profit or teaching fields (Partnership for Public Service and the National Association of Colleges
and Employers, 2012).
The GAO addressed some of these concerns about recruitment and retention by pointing
out that millennials have entered the workforce at times where the federal government has been
facing “hiring freezes, sequestrations, furloughs, and a 3-year freeze on annual pay adjustments”
(Federal Workforce, 2016, p. 5). Consequentially, millennials have been forced to look
elsewhere for employment rather than considering the federal government. Martin et al. (2011)
observed over 75% of their respondents indicated that a federal recent graduates’ program should
include meetings with higher officials, formal mentorships, leadership training, job shadowing,
and rotational assignments (Martin et al., 2011). Formal mentorships and leadership training are
stipulated as parts of the Pathways Recent Graduates Program. This means that the program
could help bridge the gap between federal needs for specialized knowledge and the millennials
currently earning those advanced degrees. The next section reviews the PMF Program and how it
takes recent graduates one step further into experiencing federal government.

RUNNING HEAD: PATHWAYS TO FEDERAL GOVERNMENT 10
Presidential Management Fellowship (PMF) Program
The Federal Workforce Flexibility Act of 2004 requires federal agencies to establish a
“comprehensive management succession program to provide training to employees to develop
managers for the agency” (Federal Workforce Flexibility Act, 2004, p. 2311). Succession
planning involves the development of an individual’s skills to “meet the future needs of an
organization” with a special emphasis on replacing “key people” overtime (Reeves, 2010, p. 61).
Most of the research on PMF focuses on assessing its ability to be an effective “succession
program”. Nickels et al. (2006) note that extensive succession planning can be very cost-
prohibitive for smaller agencies but the PMF offers these smaller agencies a chance to take
advantage of the national scope and pre-screening process in order to achieve their own
succession planning (p. 338). PMF doesn’t just benefit federal agencies, it also benefits
participants. Brosnan (2015) found that 72% of traditional PMF candidates and 58% of PMF
STEM candidates received employment offers from federal agencies. Nickels et al. (2006) also
cite that PMF participants advance into management at higher rates than other employees with
advanced degrees. This is not a surprise since the PMF’s focus is immersing participants in upper
management operations. Reeves (2010) comments that mentoring programs, such as the PMF,
help to develop protégés’ knowledge, skills, and abilities. This means that the PMF could help to
attract millennials through the intrinsic motivation of career development and upwards career
projection.
The PMF is not without its own faults. Nickels et al. (2006) point out that the
administration of the PMF has become increasingly challenging for OPM. In 1996, the PMF had
less than 500 applicants; in 2006, the program had over 3,000 applicants. The increased interest
has forced OPM to implement several pre-screening assessments and has placed pressure on
testing site capabilities. The increased interest as well as assessment gaming by academic
institutions has increased pressure for OPM to update the program’s administration. Nickels et
al. (2006) also note that OPM has not conducted a thorough evaluation of the PMF and its
intended benefits for applicants and agencies. They call on OPM to assess not only the
effectiveness of the program but also the PMF pre-screening evaluation itself.
In summary, it appears that the federal government has the ability and resources to recruit
and retain millennials. The federal government remains competitive in offering extrinsic (salary
& benefits) as well as intrinsic (engagement & career development) motivations of millennials.
However, there are mixed findings about whether millennials are affected by traditional views on
Public Service Motivations (PSM), with most of the research still undecided if millennials
possess an underlying will to promote the public good like other generations. Lastly, the
components of the Pathways Programs each speak to recruiting millennials as well. All three
programs seek to recruit and retain millennials through the promise of career development and
the potential transition to permanent employment. This study seeks to take this field of research
one step further by assessing how well the Pathways Program recruits and retains millennials
since its inception. If we assume that the government has the means of attracting millennials and
millennials want to work for the federal government, then assessing the effectiveness of the
Pathways Program may help identify why the federal government still has a low percentage of
millennials within its workforce. The next section will explain the methodology used in this
study.

RUNNING HEAD: PATHWAYS TO FEDERAL GOVERNMENT 11
METHODOLOGY
After establishing the workplace motivations of millennials and the Pathways Programs,
we can now delve into the research design that was used in this project which details the
hypothesis, analysis framework, the data set, and the variables.
Hypothesis, Analysis Framework & Data Set
The literature about millennial motivations appears to indicate that millennials are drawn
to organizations based on extrinsic and intrinsic rewards. The literature also appears to be mixed
on whether or not WLB programs and Public Service Motivation have profound effects on
millennials’ decisions on where to work. We also know that certain aspects of the Pathways
Programs, such as the employee engagement and mentoring, appeal directly to millennial
intrinsic motivations. Therefore, the expectation was that federal agencies that make the
Pathways Programs a priority in their workforce will see a higher percentage of millennial
employees than federal agencies that have less participation in the Pathways Programs. This
brings about a research question (RQ) and a hypothesis (H1) that was tested as follows:
RQ: Does a relationship between federal agencies’ adoption of the Pathways Programs
and employee recruitment and retention of millennials exist?
H1: Federal agencies with a higher percentage of Pathways Programs employees
will have a higher percentage of millennials.
The hypothesis was tested through a quantitative analysis of federal data between the
years 2013 to 2019. The specific tests include the utilization of descriptive statistics, correlations,
scatterplots, and a multivariate regression. The multivariate regression controlled for several
variables that may also have an effect on a federal agency’s percentage of millennials within
their workforce. The analysis was conducted using Microsoft Excel.
Two OPM datasets as well as a Veterans Affairs (VA) data source were used in this
project. The first data source is OPM’s “FedScope” Employment Cubes. FedScope is a
collection of federal employee demographic information. This data was collected from the
“September” employment cube to denote the federal employment numbers at the end of each
fiscal year (Office of Personnel Management, 2013, 2014, 2015, 2016, 2017, 2018, 2019,
Federal Workforce Data: Employment Cubes). The second OPM data source was the
“Governmentwide Management Reports” that provide the results of the annual Federal
Employee Viewpoint Survey (FEVS) that is administered to the federal government. I used the
annual reports 2013, 2014, 2015, 2016, 2017, 2018, and 2019 to collect data for several variables
(Office of Personnel Management, 2013, 2014, 2015, 2016, 2017, 2018, 2019, Governmentwide
Management Report).
The third source used in this study was the VA All Employee Survey (AES). In 2018, the
VA merged the FEVS survey with the VA AES (U.S. Department of Veterans Affairs, n.d., VA
All Employee Survey). Data collection of control variables for FEVS responses were gathered
from the VA All Employee Survey Responses for Items from the OPM Federal Employee
RUNNING HEAD: PATHWAYS TO FEDERAL GOVERNMENT 12
Viewpoint Survey for fiscal years 2018 and 2019 (U.S. Department of Veterans Affairs, n.d.,
2018 VA All Employee Survey Responses for Items from the OPM Federal Employee
Viewpoint Survey) (U.S. Department of Veterans Affairs, n.d., 2019 VA All Employee Survey
Responses for Items from the OPM Federal Employee Viewpoint Survey). This merger resulted
in a data deficiency for two control variables which will be discussed in the findings section of
this paper.
Data was only collected between 2013 and 2019 for two reasons. Fiscal year 2013 marks
the first year that the Pathways Programs were in full operation since the final rule on the
programs was not complete until May 2012 (Excepted Service, Career and Career-Conditional
Employment; and Pathways Programs, 2012). Second, at the time of this study, OPM’s and the
VA’s most current Federal Employee Viewpoint Survey (FEVS) and VA All Employee Survey
results were for fiscal year 2019. The next section highlights the variables used in this study.
Variables
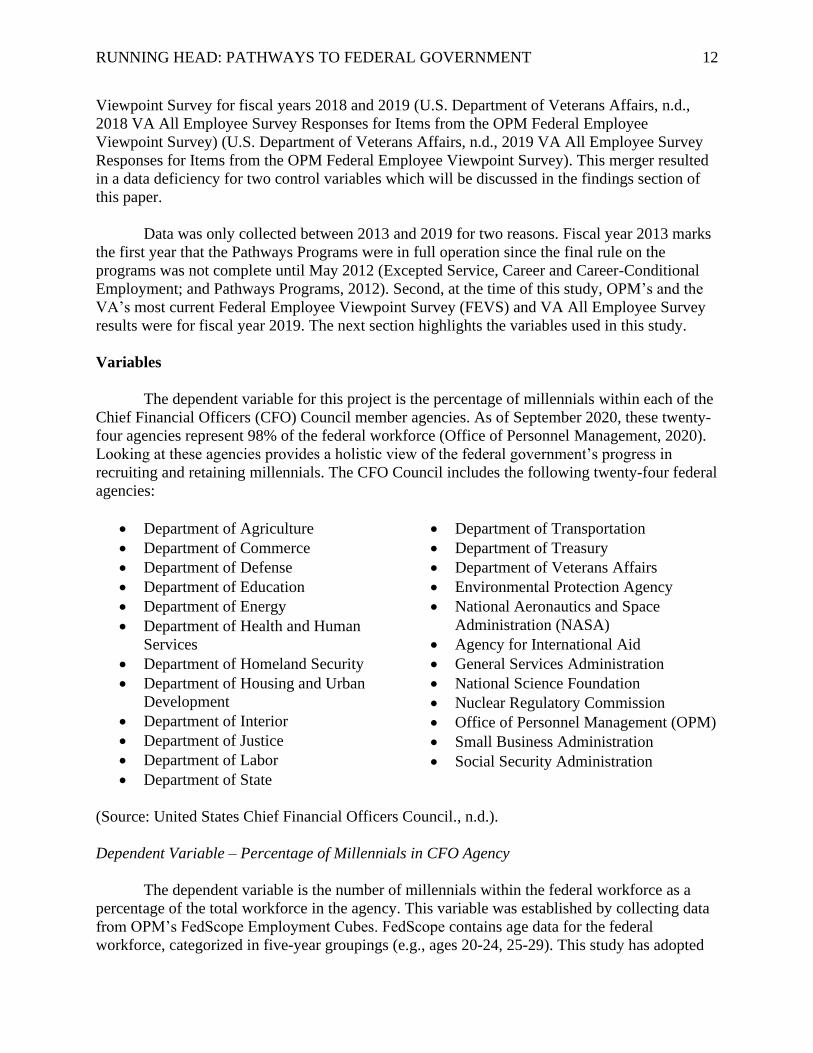
The dependent variable for this project is the percentage of millennials within each of the
Chief Financial Officers (CFO) Council member agencies. As of September 2020, these twenty-
four agencies represent 98% of the federal workforce (Office of Personnel Management, 2020).
Looking at these agencies provides a holistic view of the federal government’s progress in
recruiting and retaining millennials. The CFO Council includes the following twenty-four federal
agencies:
• Department of Agriculture
• Department of Commerce
• Department of Defense
• Department of Education
• Department of Energy
• Department of Health and Human
Services
• Department of Homeland Security
• Department of Housing and Urban
Development
• Department of Interior
• Department of Justice
• Department of Labor
• Department of State
• Department of Transportation
• Department of Treasury
• Department of Veterans Affairs
• Environmental Protection Agency
• National Aeronautics and Space
Administration (NASA)
• Agency for International Aid
• General Services Administration
• National Science Foundation
• Nuclear Regulatory Commission
• Office of Personnel Management (OPM)
• Small Business Administration
• Social Security Administration
(Source: United States Chief Financial Officers Council., n.d.).
Dependent Variable – Percentage of Millennials in CFO Agency
The dependent variable is the number of millennials within the federal workforce as a
percentage of the total workforce in the agency. This variable was established by collecting data
from OPM’s FedScope Employment Cubes. FedScope contains age data for the federal
workforce, categorized in five-year groupings (e.g., ages 20-24, 25-29). This study has adopted

RUNNING HEAD: PATHWAYS TO FEDERAL GOVERNMENT 13
the Pew Research Center’s definition of millennials, which includes individuals born between
1981 and 1996. The classification of age data provides a limitation on this study since age
groupings may contain data for generations other than millennials. Given this limitation, this
study only collected data from groupings where millennials represented a majority of that age
cluster. In order to decide which age groupings represented a majority of millennials, I calculated
millennial “high” and “low” age ranges based on a birth date of 01/01/1981 for the high end and
a birth date of 12/31/1996 on the low end. The high-end refers to the oldest birthdate an
individual could have and still be classified as a millennial. Conversely, the low-end refers to the
youngest birth date an individual could have and still be classified as a millennial. These age
ranges were based on the high-end and low-end ages as of the end of federal government’s fiscal
year (September 30). These millennial age ranges were then compared against FedScope’s age
groupings and only groupings where millennials represented a majority of the ages included (i.e.
three or more of the years in each age grouping) were collected as a part of this study. Table 1
indicates the high-end and low-end ages for millennials between 2013 and 2019. Table 2
provides a depiction of which age groupings were collected from FedScope for the dependent
variable based on groupings where millennials represent a majority of the grouping. A “X”
denotes a year where millennials represent a majority of the age grouping. Years with an “X”
represent data points that were collected and included in this study. Areas in Table 2 that are
blackened out represent years where millennials represent a minority of the age grouping.
Blackened out years were not included in this study
YEAR
2013 2014 2015 2016 2017 2018 2019
High-End (Born 01/01/1981) 32 33 34 35 36 37 38
Low-End (Born 12/31/1996) 16 17 18 19 20 21 22
Table 1: High-End and Low-End Age Ranges for Millennials
YEAR
2013 2014 2015 2016 2017 2018 2019
Age
Gro
upin
gs Below 20 X X
20-24 X X X X X X X
25-29 X X X X X X X
30-34 X X X X X X X
35-39 X X
Table 2: FedScope Age Groupings Where Millennials Represent a Majority of Grouping
After deciding which age groupings were to be included in this study, data was collected
on each of these groupings and added together to create the overall number of millennials within
each federal agency from 2013 to 2019. It is important to note that the overall millennial count
for each agency is overstated given the data limitations. By including data on age groupings
where millennials represent a majority of the grouping, other individuals outside the millennial
classification were included as a minority. Data was also collected on overall workforce numbers
for each federal agency from FedScope. The dependent variable was then created by dividing the
sum of millennials by the total number of employees for each agency. The next section discusses
the independent variable.

RUNNING HEAD: PATHWAYS TO FEDERAL GOVERNMENT 14
Independent Variable – Percentage of Pathways Programs Employees
The independent variable is the percentage of employees participating in the Pathways
Programs. OPM’s FedScope offers data on the number of employees classified under Schedule
D, which captures all Pathways Programs participants. Accordingly, the independent variable is
created by adding together the total number of permanent and non-permanent Schedule D
employees and dividing by the total number of employees within each of the included federal
departments and agencies. Data on both the number of Schedule D employees and the total
number of employees was gathered from OPM’s FedScope. As indicated in my hypothesis, it
was my expectation that agencies with higher percentages of Pathways Programs employees will
have higher percentages of millennials within the workforce. This expectation was based on the
literature surrounding millennials’ intrinsic motivation of employee engagement. The Pathways
Programs offer a younger generation the ability to receive mentoring and tailored engagement to
help spark their interest in federal government. It is my belief that the Pathways Programs fulfill
millennials’ need for engagement with the end result of recruitment and retainment for federal
agencies.
Control Variables
Given that other motivations can affect millennial employment preferences, seven control
variables were collected to include: average salary; WLB participation; employee engagement;
Public Service Motivation; job satisfaction; the percentage of separations; and the Presidential
Administration. A breakdown of these variables is provided next.
Average Salary
Average salary was collected because the literature suggests that millennials are
motivated by salary figures similar to past generations. My expectation was that federal agencies
with higher average salaries will have a higher percentage of millennials in their workforce. This
would result in a positive relationship between salary and the percentage of millennials. Data on
the average salary within federal agencies was retrieved from OPM’s FedScope Employment
Cubes.
WLB Participation
The literature is divided on the effects of WLB and millennial motivation. Some studies
indicate a positive relationship where others indicate no relationship at all. To add to the on-
going debate, I included WLB participation as a control variable. Data on this variable was
collected through responses to OPM’s FEVS. Question 42 of the FEVS asks employees “My
supervisor supports my need to balance work and other life issues” and employees’ responses are
recorded using a Likert Scale with the responses of “strongly agree, agree, neither agree nor
disagree, disagree, strongly disagree”. Responses to this question were recorded as the sum of
the percentages indicating “strongly agree” and “agree”. This sum was then recoded as the
percentage of employees “agreeing” with the WLB question (FEVS 42). For the purposes of this
study, I expected a positive relationship between WLB and the percentage of millennials within
federal agencies. I believed agencies with higher percentages of employees “agreeing” with

RUNNING HEAD: PATHWAYS TO FEDERAL GOVERNMENT 15
FEVS 42 would have higher percentages of millennials in the workforce and an overall positive
relationship.
Employee Engagement
Employee engagement has been found to be a strong intrinsic motivator of millennials.
For this reason, it is important to control for employee engagement in this study, especially since
it was my belief that employee engagement qualities of the Pathways Programs would have an
effect on millennials’ recruitment and retention. Data on this variable was collected through
responses to question 18 in OPM’s FEVS. Question 18 asks employees to reflect on the
statement “My training needs are assessed”. Responses are recorded using a Likert Scale with
the responses of “strongly agree, agree, neither agree nor disagree, disagree, strongly disagree”.
Responses to this question were recorded as the sum of the percentages indicating “strongly
agree” and “agree”. This sum was then recoded as the percentage of employees “agreeing” with
the engagement question (FEVS 18). It was my expectation that federal agencies with a higher
percentage of employees “agreeing” with FEVS 18 would have a higher percentage of
millennials in the workforce and an overall positive relationship.
Public Service Motivation (PSM)
Like WLB research, studies on the effect of PSM and millennial motivation is also
undetermined. As a means of adding to the body of research already established, it is important
to include a control variable for PSM in this study. PSM was assessed using question 13 in
OPM’s FEVS. The question asks employees, through a Likert Scale, whether or not “The work I
do is important”. Responses are recorded as “strongly agree, agree, neither agree nor disagree,
disagree, strongly disagree”. Responses to this question were recorded as the sum of the
percentages indicating “strongly agree” and “agree”. This sum was then recoded as the
percentage of employees “agreeing” with the PSM question (FEVS 13). Since some researchers
have found a positive relationship between PSM and millennial motivation, I expected the same
to be true in this study, where agencies with higher percentages of “agreeing” with FEVS 13
would have higher percentages of millennials in the workforce and an overall positive
relationship.
Job Satisfaction
A 2008 U.S. Merit Systems Protection Board (MSPB) report found that 45% of new hires
had learned about the open position through family and friends (U.S. Merit Systems Protection
Board, February 2008). This “word-of-mouth” campaign leads me to believe that prospective
millennials in search of federal employment can learn a lot from their network of family and
friends. This could have a positive effect when family and friends speak well of the federal
organization. This could also have the opposite effect if an agency is viewed in an ill light.
Accordingly, I think it is important to assess this potential effect on millennial employment
preferences by controlling for job satisfaction. Data on job satisfaction was collected from
OPM’s FEVS through Likert responses to question 71 which asks: “Considering everything, how
satisfied are you with your organization?” Employee answer choices includes “very satisfied,
satisfied, neither satisfied nor dissatisfied, dissatisfied, and very dissatisfied”. Responses to this

RUNNING HEAD: PATHWAYS TO FEDERAL GOVERNMENT 16
question were recorded as the sum of the percentages indicating “very satisfied” and “satisfied”.
This sum was then recoded as the percentage of employees “satisfied” with the job satisfaction
question (FEVS 71). My expectation was that agencies with higher job satisfaction would have a
higher percentage of millennials within the workforce and an overall positive relationship.
Separations
For this study, it is critical to evaluate the relationship of separations from federal
employment and the percentages of millennials. It was noted previously that the GAO indicated
that several negative events such as furloughs, sequestrations, and hiring freezes correlated with
millennials entering the workforce. Accordingly, it is important to assess the availability of
federal employment to millennials as measured by separations. Separations shed light on the
availability of federal employment for two reasons. First, it was expectation that federal agencies
with high separation rates (whether due to retirements, voluntary departure, inter-agency
transfers, or firings) would have a greater availability of jobs for millennials. Second, separations
also account for Reductions in Force (RIF) where federal jobs are eliminated. Overall, the
percentage of separations was collected to observe which agencies were experiencing the most
openings. This number was calculated by taking the total number of separations and subtracting
the number of positions lost to Reductions in Force (RIF) and then dividing that number by the
total number of employees. Data on separations was gathered from OPM’s FedScope
Employment Cubes for each fiscal year. It is important to note that this control variable does not
take into account intra-office transfers. This means that the separations control variable
represents permanent separations from federal employment. The expected relationship between
the percentage of separations and the percentage of millennials was positive, where higher
separation rates will lead to higher percentages of millennials over time.
Presidential Administration
Lastly, this project also controls for Presidential Administration to see if leadership has
any effect on millennial recruitment and retention. The observations in this study cover the
Presidential Administrations of President Barrack Obama (Democrat) and President Donald
Trump (Republican). For the years President Obama was in office, this variable was coded as a
“1”. For years President Trump was in office, this variable was coded as a “2”. I was uncertain of
the effect of Presidential Administration would have on the dependent variable. We know that
the Pathways Programs were created under President Obama. It could be that the effects of the
Pathways Programs would not be realized under one administration due to the time of
implementation. Conversely, the Pathways Programs may have been a priority under one
administration and not the other. Controlling for Presidential Administration offers another
avenue for assessing the federal government’s ability to recruit and retain millennials.
Table 3 provides a breakdown of the variables. The “Expected Sign” column summarizes
the expected relationships between the variable and the dependent variable which is the
percentage of millennials within federal agencies. The expected relationship was described as
either positive (+) or negative (-). The “Measurement” column summarizes how variables are
being measured within the data set. The “Source” column denotes the data source of the variable.
All data was collected from either OPM’s FedScope or OPM’s Federal Employee Viewpoint

RUNNING HEAD: PATHWAYS TO FEDERAL GOVERNMENT 17
Survey (FEVS). With the methodology in place, we now turn to the results of the research
design.

RUNNING HEAD: PATHWAYS TO FEDERAL GOVERNMENT
VARIABLE
EXPECTED
SIGN MEASUREMENT SOURCE
Dependent Variable
Percentage of Millennials
within Federal Agencies
The sum of employees from age groupings where
millennials are the majority divided by the total
number of employees
FedScope
Independent Variable
Percentage of Pathways
Programs Employees within
Federal Agencies
+ Employees classified under Schedule D divided
by the total number of employees FedScope
Control Variables
Salary + Average salary for each agency FedScope
WLB
+ FEVS #42 – My supervisor supports my need to
balance work and other life issues.
(Sum percentage of employees responding
“strongly agree & agree”)
FEVS
Employee Engagement
+ FEVS #18 – My training needs are assessed.
(Sum percentage of employees responding
“strongly agree & agree”)
FEVS
Public Service Motivation
(PSM)
+ FEVS #13 – The work I do is important.
(Sum percentage of employees responding
“strongly agree & agree”)
FEVS
Job Satisfaction
+ FEVS #71 – Considering everything, how
satisfied are you with your organization?
(Sum percentage of employees responding “very
satisfied & satisfied”
FEVS
Percentage of Separations + Total Separations minus Reductions in Force and
then divided by the total number of employees FedScope
Presidential Administration + / - President Obama = 1
President Trump =2 FedScope
Table 3: Details on Variables

RUNNING HEAD: PATHWAYS TO FEDERAL GOVERNMENT
FINDINGS
Before reviewing the findings of this study, it is important to note a data deficiency that
was discovered during data collection. There were 175 observations for every variable except for
the control variables Engagement and Public Service Motivation (PSM). For the fiscal years
2018 and 2019, the Department of Veterans Affairs opted out of the FEVS survey and instead
participated in the VA All Employee Survey (AES). While some of the questions from the VA
All Employee Survey are exactly the same as the FEVS survey, the questions regarding
engagement (FEVS #18) and PSM (FEVS #13) were not included in the VA survey.
Accordingly, only 173 observations were collected for these two control variables. With this
deficiency noted, we can now move into a discussion over this study’s overall findings for the
federal government.
The 30,000 Feet View: The Federal Government
The first discussion revolves around the overall means for the dependent, independent,
and control variables for the entire federal government between FY2013 and FY2019. This
holistic view provides a starting point to evaluating the federal government over this time-period
and offers a jumping-off point into comparisons of individual federal agencies later in the paper.
Table 4 details the means for the federal government with regard to the variables in this study.
Using FY2013 as a base year, the table is color-coded in red and green to denote reductions and
growth in the variables when compared to the prior year. Red denotes a reduction in the variable
mean and green denotes growth in the variable mean.
FY2013 FY2014 FY2015 FY2016 FY2017 FY2018 FY2019
Millennial
Employees 12.93% 12.49% 18.05% 18.49% 17.28% 38.22% 30.88%
Pathways
Employees 0.34% 0.57% 0.74% 0.78% 0.67% 0.55% 0.52%
Average Salary 90,201.72 89,774.09 91,166.24 92,752.07 95,081.97 91,000.43 103,244.00
WLB
Satisfaction 80.30% 80.72% 81.53% 81.94% 83.82% 83.79% 84.05%
Engagement 49.88% 49.27% 51.93% 53.12% 55.61% 55.85% 55.98%
PSM 89.15% 88.84% 89.31% 89.69% 90.54% 90.39% 90.36%
Satisfaction 58.09% 57.45% 59.04% 60.55% 63.71% 62.47% 63.07%
Employee
Separation 10.48% 9.88% 9.56% 9.48% 10.18% 11.56% 10.08%
Presidential
Administration 1 1 1 1 2 2 2
Table 4: Mean Data Results for the Entire Federal Government

RUNNING HEAD: PATHWAYS TO FEDERAL GOVERNMENT 20
From Table 4, we can observe that the dependent variable (percentage of millennials
within federal government) has had periods of notable growth and reduction between FY2013
and FY2019. It appears that a notable growth period for the dependent variable occurred in
FY2015 where the mean percentage of millennials in federal government jumped about 5.5%.
Similarly, there is a notable reduction from FY2018 to FY2019 where the mean percentage of
millennials dropped over 7.5%. Additionally, results for FY2018 and FY2019 are particularly
higher than the preceding five years. It appears that the dependent variable experiences positive
growth overall when comparing FY2013 to FY2019. Chart 1 shows the change in the dependent
and independent variables between FY2013 and FY2019.
Chart 1: Percentage of Millennials & Pathways Programs Employees in Federal Government
Turning to the independent variable (percentage of Pathways Employees), we see very
slight changes between FY2013 and FY2019. However, it does appear that the period of FY2013
to FY2016 can be marked as a period of continual growth whereas FY2017 to FY2019 can be
marked as a period of continual reduction. However, like the percentage of millennials, the
independent variable did experience positive growth overall when comparing FY2013 to
FY2019. Looking at the control variables, average salary grew by over $11,000; WLB
satisfaction grew by over 3.5%; engagement grew by over 6%; and satisfaction grew by over
4.5%. PSM and employee separation saw relatively little change between FY2013 and FY2019.
The Presidential Administration control variable saw a change between FY2016 and FY2017
with President Obama’s term ending and the election of President Trump. After discussing the
study’s findings for the entire federal government, we can move on to looking at the relationship
of the dependent and independent variables for individual agencies.
0.34% 0.57% 0.74% 0.78% 0.67% 0.55% 0.52%
12.93% 12.49%
18.05% 18.49%17.28%
38.22%
30.88%
0.00%
5.00%
10.00%
15.00%
20.00%
25.00%
30.00%
35.00%
40.00%
45.00%
FY2013 FY2014 FY2015 FY2016 FY2017 FY2018 FY2019
Percentage of Pathways Programs Employees Percentage of Millennials

RUNNING HEAD: PATHWAYS TO FEDERAL GOVERNMENT 21
The Microscopic View: Individual Federal Agencies
When looking at the mean percentage of millennials (dependent variable) for each of the
included federal agencies in this study, the top five agencies were:
• Department of Homeland Security (26.02%)
• Department of Agriculture (24.47%)
• Department of Justice (23.88%)
• Department of Interior (23.38%)
• Office of Personnel Management (23.12%)
The bottom five agencies were:
• Department of Housing and Urban Development (12.62%)
• Department of Treasury (13.58%)
• Small Business Administration (13.70%)
• Environmental Protection Agency (13.97%)
• Department of Health and Human Services (15.52%)
When looking at the mean percentage of Pathways Programs Employees (independent variable),
the top five agencies were:
• National Science Foundation (2.73%)
• Department of State (2.32%)
• National Aeronautics and Space Administration (1.65%)
• Department of Interior (1.64%)
• Social Security Administration (1.47%)
And the bottom five agencies were:
• Nuclear Regulatory Commission (0%)
• Small Business Administration (0.17%)
• Department of Defense – Military Only (0.20%)
• Department of Veteran Affairs (0.21%)
• Department of Treasury (0.22%)
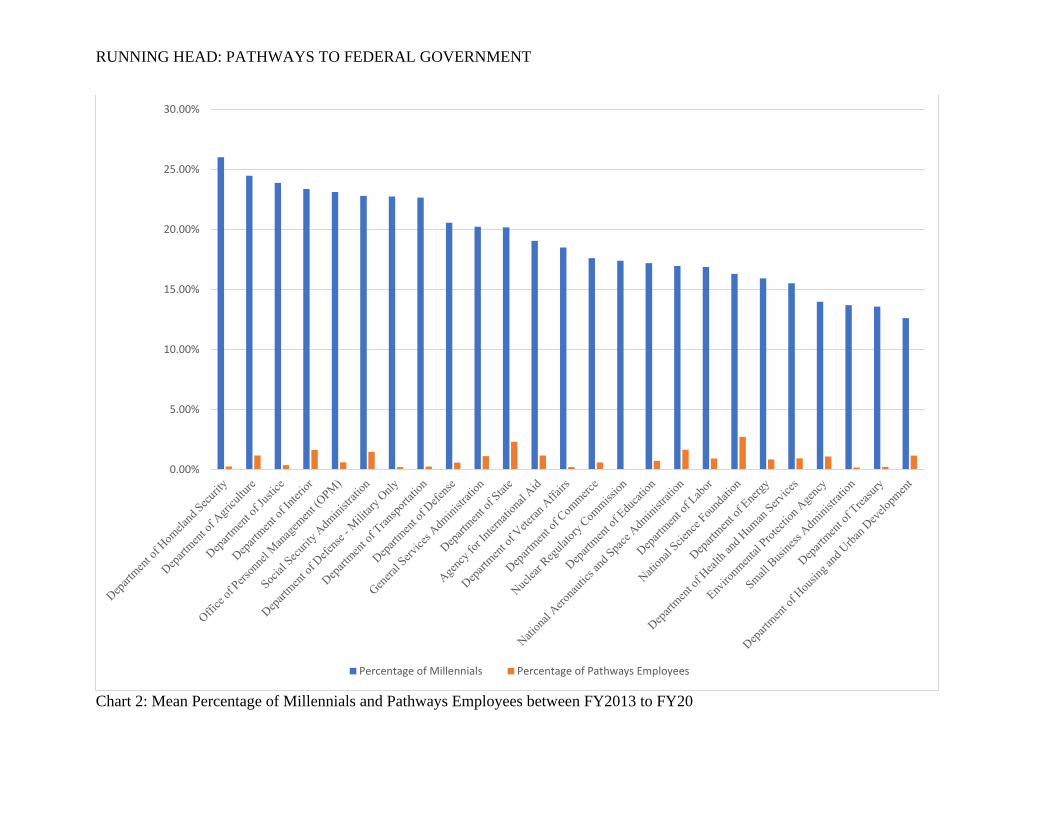
Chart 2 shows the mean percentage of millennials and Pathways Employees between FY2013 to
FY2019. Results for Chart 2 have been organized from largest to smallest based on the mean
percentage of millennials. Chart 3 dives further into the independent variable for the same time
period. Chart 3 is also organized from largest to smallest based on the mean percentage of
Pathways Employees.
RUNNING HEAD: PATHWAYS TO FEDERAL GOVERNMENT
Chart 2: Mean Percentage of Millennials and Pathways Employees between FY2013 to FY20
0.00%
5.00%
10.00%
15.00%
20.00%
25.00%
30.00%
Percentage of Millennials Percentage of Pathways Employees

RUNNING HEAD: PATHWAYS TO FEDERAL GOVERNMENT
Chart 3: Mean Percentage of Pathways Employees between FY2013 to FY2019
There are a few items to note when comparing agency results for the dependent and
independent variable. The Department of the Treasury as well as the Small Business
Administration are in the bottom five for both the mean percentage of millennials as well as the
mean percentage of Pathways Employees. The Department of the Interior is present in the top
five for both the mean percentage of millennials as well as the mean percentage of Pathways
Employees. Lastly, as evidenced from Charts 2 and 3, it appears that large independent agencies
participate slightly more in the Pathways Programs given their mean percentages when compared
to Federal Departments. Large independent agencies represent six spots out of the top ten for the
mean percentage of Pathways Employees. Conversely, it appears Federal Departments have
more agencies in the top ten for the mean percentage of millennials than large independent
agencies, occupying seven spots out of the top ten. Based on the results of Charts 1 through 3,
there does not appear to be any discernable relationship between the percentage of millennials
and the percentage of Pathways Programs Employees. With the broad and narrow views
established, we can review the descriptive statistics for this study.
Descriptive Statistics
Table 5 provides the descriptive statistics for this study. The mean for the dependent
variable (Percentage of Millennials) was 19.01%. The mean for the independent variable
(Percentage of Pathways Programs Employees) was 0.89%. The standard deviation for the
0.00%
0.50%
1.00%
1.50%
2.00%
2.50%
3.00%

RUNNING HEAD: PATHWAYS TO FEDERAL GOVERNMENT 24
dependent and independent variables were 9.16% and 0.77% respectively. It is important to note
that the number of observations for the engagement and PSM control variables is 173, which is
less than the rest of the variables. This is due to the lack of observations for the Department of
Veterans Affairs for FY0218 and FY2019 that was mentioned earlier in this paper.
Number Mean Standard
Deviation Minimum Maximum
IV: Percentage of
Pathways 175 0.89% 0.77% 0.00% 4.19%
DV: Percentage of
Millennials 175 19.01% 9.16% 3.99% 47.94%
CV: Average Salary 175 93,317.22 20,508.81 25,202.00 138,085.00
CV: WLB Satisfaction 175 82.31% 5.13% 66.90% 92.80%
CV: Engagement 173 53.06% 8.03% 32.40% 81.10%
CV: PSM 173 89.75% 2.05% 84.00% 94.60%
CV: Employee
Satisfaction 175 60.63% 7.66% 39.40% 80.30%
CV: Separations 175 10.17% 6.83% 4.49% 69.12%
CV: Presidential
Administration 175 1.43 0.50 1 2
Table 5: Descriptive Statistics
While Table 5 provides a basic picture on the details of the variables in this study, it fails to
illustrate the variation of the dependent and independent variables. In order to capture the
variation of these variables, I recoded the results of these variables into condensed groups and
created a frequency table and histogram for each variable. For the dependent variable, I recoded
the results into five groups ranging from 0% to 50% since the minimum was 3.99% and the
maximum was 47.94%. For the independent variable, I recoded the results into five groups as
well, ranging from 0% to 5 % since the minimum was 0% and the maximum was 4.19%. The
results of the recoding are presented in Table 6 and Table 7.
Range Frequency Percent Cumulative Percent
0-10% 23 13.14% 13.14%
10.01-20% 83 47.43% 60.57%
20.01-30% 46 26.29% 86.86%
30.01-40% 19 10.86% 97.71%
40.01-50% 4 2.29% 100.00%
Table 6: Recode of the Dependent Variable – Percentage of Millennials

RUNNING HEAD: PATHWAYS TO FEDERAL GOVERNMENT 25
Range Frequency Percent Cumulative Percent
0-1% 110 62.86% 62.86%
1.01-2% 52 29.71% 92.57%
2.01-3% 10 5.71% 98.29%
3.01-4% 2 1.14% 99.43%
4.01-5% 1 0.57% 100.00%
Table 7: Recode of the Independent Variable – Percentage of Pathways Programs Employees
From Table 6, we can observe that there is a good amount of variation in the dependent
variable. Over 60% of the federal government had 20% or less of their workforce classified as
millennials from FY2013 to FY2019. From Table 7, we can see less variation in the independent
variable. Over 90% of the federal government had 2% or less of their workforce classified as a
Pathways Programs employee over the same period. Circling back to Table 5, we can observe
that the control variables showed a good among of variation given their means, minimums, and
maximums. With the descriptive statistics in place, we can move onto the correlation analysis.
Correlation Analysis
A correlation analysis was executed in Microsoft Excel in order to understand the
relationship among the variables. Table 8 depicts the results of the correlation analysis.
DV: Percentage of Millennials
DV: Percentage of Millennials 1
IV: Percentage of Pathways Employees -0.076169708
CV: Average Salary -0.161580309
CV: WLB Satisfaction 0.033905364
CV: Engagement 0.084118852
CV: PSM -0.110845378
CV: Employee Satisfaction 0.125781891
CV: Separations 0.021402176
CV: Presidential Administration 0.607226121
Table 8: Correlation Analysis of Variables
The results of the correlation analysis illustrate that the independent variable and all but one
control variable had very weak correlations to the dependent variable since they were all less
than the absolute value of 0.2. The relationship between the dependent variable and the
Presidential Administration control variable was strong with a correlation of 0.61. Turning to the
correlations among the independent and control variables, all the relationships were very weak to
weak besides five pairings. The relationship of WLB satisfaction with salary, engagement, and
employee satisfaction were moderate to strong with correlation results of 0.49, 0.50, and 0.61,
respectively. The relationship of engagement with PSM and employee satisfaction were also
moderate to strong with correlations results of 0.63 and 0.53, respectively. Since none of the
variables showed a correlation of the absolute value of 0.8 or higher, there was no

RUNNING HEAD: PATHWAYS TO FEDERAL GOVERNMENT 26
multicollinearity concern. After touching on the correlation analysis, we are ready to pursue a
discussion on the multivariate regression.
Multivariate Regression
As stated earlier, I used a multivariate regression to assess the relationship between the
dependent and independent variables when controlling for several other variables. Before getting
into the regression, a scatter plot was created between the percentage of millennials (dependent)
and the percentage of Pathways Programs employees (independent) in order to examine the
relationship of these two variables visually. Chart 4 provides the results of a scatter plot between
the dependent and independent variables with a trend line.
Chart 4: Scatter Plot of the Percentage of Millennials and the Percentage of Pathways Employees
We can observe from the scatter plot that no discernable relationship exists between the
percentage of millennials and the percentage of Pathways Programs employees. The trend line
shows a negative relationship between these two variables. This fits with the results from the
correlation analysis depicted in Table 8 above. The next step is to discuss the results of the
multivariate regression and whether the control variables had an affect on the relationship
between the dependent and independent variables.
0.00%
10.00%
20.00%
30.00%
40.00%
50.00%
60.00%
0.00% 0.50% 1.00% 1.50% 2.00% 2.50% 3.00% 3.50% 4.00% 4.50%
Per
centa
ge
of
Mil
lennia
ls i
n F
eder
al G
over
nm
ent
Percentage of Pathways Programs Employees

RUNNING HEAD: PATHWAYS TO FEDERAL GOVERNMENT 27
As noted previously, there was a data limitation for the engagement and PSM control
variables due to a change in survey data for the Department of Veterans Affairs (VA) for
FY2018 and FY2019. In order to preserve all the observations from the VA for these two years,
the average was calculated for each of these control variables using the preceding data from
FY2013 to FY2017. These averages were then used for FY2018 and FY2019 for both control
variables. The regression also controlled for each fiscal year as dummy variables. After running
the multivariate regression, the model provided an adjusted R Square result of 0.734. This means
that 73% of the variation in the percentage of millennials in federal government is explained by
the independent and control variables. The detailed results of the multivariate regression are
displayed in Table 9 and Table 10.
Result
Multiple R 0.875206617
R Square 0.765986622
Adjusted R Square 0.734668771
Standard Error 0.046052774
Observations 175
Table 9: Multivariate Regression Statistics
Coefficients
Standard
Error P-value
Expected Sign
Correct
Intercept 0.442470161 0.213629211 0.039935119 -
IV: Percentage of
Pathways Employees 0.810375514 0.515594785 0.11797647 YES
CV: Average Salary -1.39897E-06 2.32906E-07 1.21975E-08 NO
CV: WLB Satisfaction -0.204012457 0.103490437 0.050401559 NO
CV: Engagement 0.062742429 0.063066746 0.321298405 YES
CV: PSM -0.402105386 0.225366119 0.076269369 NO
CV: Employee
Satisfaction 0.120409275 0.079158559 0.13019252 YES
CV: Separations -0.130433224 0.056860259 0.023087358 NO
CV: Presidential
Administration 0.224918461 0.0137921 6.36369E-36 -
Table 10: Results of Multivariate Regression
We can see several things from Table 10. First, we need to circle back to the research
question and the hypothesis which are as follows:
RQ: Does a relationship between federal agencies’ adoption of the Pathways Programs
and employee recruitment and retention of millennials exist?
H1: Federal agencies with a higher percentage of Pathways Programs employees
will have a higher percentage of millennials.
After controlling for several variables, it appears there is a positive relationship between
the percentage of millennials and the percentage of Pathways Program employees. However, this
relationship is not statistically significant given a P-value of 0.12. Similarly, the results for

RUNNING HEAD: PATHWAYS TO FEDERAL GOVERNMENT 28
engagement, PSM, and employee satisfaction control variables were all not statistically
significant. However, the average salary, WLB satisfaction, separations, and Presidential
Administration were all statistically significant. However, each of these relationships showed
results against this study’s initial expected signs. For average salary, it was expected that the
percentage of millennials would be higher for agencies with higher average salaries given their
extrinsic motivations. This study has shown that the opposite is true. For WLB satisfaction, it
was expected that the percentage of millennials would be higher for agencies with higher
employee WLB satisfaction given their intrinsic motivations. Again, this study has shown the
opposite to be true. With separations, it was expected that agencies with higher separation rates
would have higher percentages of millennials due to greater availability of open positions. It
appears the opposite is true given the results of this study. Lastly, there was no expected
relationship between Presidential Administration and the percentage of millennials. This study
has shown a positive relationship that is statistically significant. This means that under the
Trump Administration, the percentage of millennials was higher than the Obama Administration
and this relationship is statistically significant.
CONCLUSION
Overall, this study sought to assess the relationship between federal agencies’ adoption of
the Pathways Programs and employee recruitment and retention of millennials. Given the results
of this study, there does not appear to be a relationship between the adoption of the Pathways
Programs and the percentage of millennials within federal government. This could be due to
several factors. First, when examining the top five agencies for the dependent and independent
variable, it appears that federal agencies with relatively high percentages of millennials did not
have relatively high percentages of Pathways Program employees (except for the Department of
Interior). This could be because agencies with relatively high percentages of millennials are able
to recruit through means other than the Pathways Programs. Second, it appears that the entire
federal government has pursued very little development of the Pathways Programs. The mean
percentage for Pathways Programs employees was less than 1% between FY2013 to FY2019.
This effect was hurt further by three years of decline in the percentage of Pathways Programs
employees from FY2017 to FY2019. One possible reason for the reduction in the Pathways
Programs could be the hiring freeze and subsequent reductions in the federal workforce that were
instituted at the beginning of President Trump’s term in 2017. President Trump ordered a hiring
freeze and reduction plan that looked to re-evaluate the federal workforce and its priorities (Katz,
2017). This idea is supported partially given the slight increase of separations in federal
government for FY2017 and FY2018 and the statistical significance of the Presidential
Administration control variable in this study. However, more research would need to be
conducted to assess this hypothesis.
This study also found interesting relationships between the percentage of millennials and
some of the control variables. When considering the control variables that were statistically
significant, it was expected that average salary, WLB satisfaction, and separations would all have
positive relationships with the percentage of millennials in the federal workforce. Instead, these
variables displayed a negative relationship that was statistically significant. For average salary, it
could be that millennials are hired into federal government at lower paying positions which
negatively affects the relationship between the percentage of millennials and the average salary.

RUNNING HEAD: PATHWAYS TO FEDERAL GOVERNMENT 29
For employee separation, it could be that agencies with higher separation rates have trouble
retaining all employees. There could be some other underlying issue that results in agencies with
higher separation rates being unable to attract millennials into their workforce. Lastly, I am
unsure why WLB satisfaction would have a negative affect on the percentage of millennials in
the federal workforce. It could be that higher WLB satisfaction could lead to lower separation
rates, which in turn would leave less opportunities for millennials to be hired into the federal
government. Going back to the literature, the body of research on this topic was split on the
effect of WLB on millennial motivations. The results of this study go against the literature which
indicates either a positive or no effect of WLB on millennial motivations. More research is
needed to better assess WLB and millennial motivations.
Lastly, like other studies and warnings, this study continues to sound the alarm on the
rate of recruiting and retaining millennials in federal government. Over 60% of the federal
government had 20% or less of their workforce classified as millennials from FY2013 to
FY2019. This is a problem when about 29% of Federal employees are older than age 55 and only
7% are younger than age 30 (Office of Management and Budget, 2020). The need for the federal
government to assess its own hiring abilities in relation to recruiting and retaining millennials
remains unchanged. While the Pathways Programs were implemented with the hopes of cutting
red tape and attracting millennials to federal government, it appears that the execution of the
programs has fizzled in recent years. A greater effort must be made to assess the Pathways
Programs as a means of recruiting and retaining millennials if the federal government hopes to
usher in a new generation of civil servants.
Limitations (Internal and External Validity)
The largest limitation for this project was the use of secondary data. On one hand, the
Office of Personnel Management (OPM) is an invaluable source of information. On the other
hand, the data collection process by OPM as well as some of the variable definitions did not
measure up to the intentions of this project. First, OPM collects age data on all employees and
organizes this data in five-year increments. This meant the results of the dependent variable were
not exact representations of reality. As evidenced in FY0218 and FY2019, the dependent
variable grew by over 13-20% due to the inclusion of the age range of 34-39 for those years. It is
expected that part of this difference can be attributed to the inclusion of the age grouping 34-39
from OPM’s FedScope for these two years in this study. However, it is difficult to determine if
this increase is due to the inclusion of another age group in the millennial counts or if other
factors are present. Data on the actual number of millennials within federal government would
improve the accuracy of this study and its underlying model.
Another limitation is the categorization of Pathways Programs employees into one group
in FedScope. The Pathways Programs represented a three-pronged strategy of internships, recent
graduate hiring authorities, and the Presidential Management Fellowship (PMF). While this
study found little variation and adoption of the Pathways Programs as a percentage of the total
federal workforce (independent variable), it could be beneficial to see how many interns, recent
graduates, and PMF candidates are hired each year by the federal government. It may be that
most of the Pathways Programs employees are PMF candidates, which would mean that more
research should be done into the reasons why internships and recent graduate hiring authorities

RUNNING HEAD: PATHWAYS TO FEDERAL GOVERNMENT 30
are not being utilized. With the largest limitation detailed, it is time to move onto the internal and
external validity of this study.
This project has good internal validity. The federal government is in short supply of
millennials to replace its current aging workforce. The literature suggests that millennials are
motivated by salary and engagement in their work. The literature is still undecided on the effects
of Work-Life Balance (WLB) as well as Public Service Motivation (PSM) on millennials’
motivations. It was also noted that the federal government has certain hiring limitations that
favor other groups of individuals over millennials, such as veterans’ preference or work
experience. The Pathways Programs were established to help streamline the federal hiring
process and attract millennials to the workforce. The Pathways Programs build upon the body of
research on millennial motivations and engagement by creating internships, mentoring
opportunities, and career development within the various programs. This leads me to believe that
the more resources the federal government puts into the Pathways Programs, the more attractive
they would be to millennials. Secondary data for the dependent, independent, and control
variables was gathered from a reputable source, the Office of Personnel Management and the
Department of Veterans Affairs. Even though the results of the project went against the
literature, the process or rather the internal validity remained strong.
Unlike the internal validity, the external validity of this project is weak. I believe the
generalizability of this project lies simply within the observations discussed. While it was found
that no relationship exists between the percentage of millennials and the percentage of Pathways
Programs employees, this conclusion is for the federal government. This does not mean that the
same would be true for state governments, non-profits, or private businesses that pursue a similar
hiring and development priority as the Pathways Programs. I believe the variables and their
results apply specifically to the federal government. The limitation of assessing the federal
government’s true millennial count as well as the lack of specific data on the underlying
programs that make up the Pathways Programs discussed earlier in this section may also have an
effect on the generalizability of this project for the federal government itself. Further research
must be done to continue to understand the motivations of millennials. This brings me to the
final section of this project, policy suggestions and future research.
Policy Suggestions
The mean for the percentage of Pathways Programs employees from FY2013 to FY2019
was less than 1% of the total federal workforce. Additionally, it appears that the first four years
of the Pathways Programs showed growth but was met with three years of decline. This leads me
to believe that the Pathways Programs as a whole are under-utilized by most of the federal
government. The literature indicates that the engagement and career development aspects of the
Pathways Programs fit with millennial motivations. This means that hiring officials within the
federal government should become better educated about the Pathways Programs as an
alternative to traditional hiring authorities. The Department of Treasury and the Small Business
Administration were among the bottom five agencies for the percentage of millennials as well as
the percentage of Pathways Programs employees. It may prove to be beneficial for the Office of
Personnel Management (OPM) to re-educate or reinforce the benefits of the Pathways Programs
for agencies in need of recruiting millennials.

RUNNING HEAD: PATHWAYS TO FEDERAL GOVERNMENT 31
Future Research
This study found that no relationship exists between the percentage of millennials and the
percentage of Pathways Programs employees. However, external factors such as the federal
hiring freeze and federal reductions of 2017 may have adversely affected this relationship. More
research should be conducted to assess this theory. Additionally, this study focuses on reviewing
quantitative, secondary data to assess the relationship between millennials and the Pathways
Programs. It would be helpful to supplement this research with qualitative, primary data to assess
the utilization of the Pathways Programs across the federal government. The quantitative data
suggestion little utilization, but is this due to a lack of execution or a lack of interest? A survey of
federal hiring officials about their preferences and experience with the Pathways Programs may
help to shed light on the programs’ usefulness in attracting millennials to the federal workforce.
Lastly, the literature suggests that millennials are motivated by extrinsic benefits such as salary.
Focusing on extrinsic motivators, I would recommend further research on the relationship
between tuition reimbursement or public service loan forgiveness and the percentage of
millennials within the federal government. The financial aspect of tuition reimbursement or
public service loan forgiveness might provide for a similar relationship between millennials and
salary as a motivator. Overall, the federal government should continue reviewing its recruitment
and retention policies and their relationship with millennial motivations. Without millennials
taking up the mantle of public service, we may face a loss in the government’s ability to provide
for the public good.

RUNNING HEAD: PATHWAYS TO FEDERAL GOVERNMENT 32
REFERENCES
Beard, F. & Morton, L. (1998). Effects of Internship Predictors on Successful Field Experience.
Journalism & Mass Communication Educator, 53(4), 42-53. Retrieved from
https://doi.org/10.1177/107769589805300404
Benavides, A., Dicke, L., & Holt, A. (2013). Internships Adrift? Anchoring Internship Programs
in Collaboration. Journal of Public Affairs Education, 19(2), 325-353. Retrieved from
https://www.jstor.org/stable/23608953
Brosnan, I. (2015). An analysis of the relative success of applicants to the new STEM
Presidential Management Fellowship and the NASA context. Space Policy, 34, 47-49.
Retrieved from https://doi.org/10.1016/j.spacepol.2015.09.001
Christensen, R. & Wright, B. (2011). The Effects of Public Service Motivation on Job Choice
Decisions: Disentangling the Contributions of Person-Organization Fit and Person-Job
Fit. Journal of Public Administration Research and Theory, 21(4), 723-743. Retrieved
from https://www.jstor.org/stable/41342602
Cole, M., Kolko, D., & Craddick, R. (1981). The Quality and Process of the Internship
Experience. Professional Psychology, 12(5), 570-577. Retrieved from
https://doi.org/10.1037/0735-7028.12.5.570
Conley Tyler, M., Rothnie-Jones, O., McCambridge, K., & Walsh, E. (2015). Building the next
generation of foreign policy professionals: One internship at a time. International
Journal, 70(4), 556-572. Retrieved from https://doi.org/10.1177/0020702015593046
Council of Economic Advisers, The. (October 2014). 15 Economic Facts About Millennials.
Executive Office of the President of the United States. Retrieved from
https://obamawhitehouse.archives.gov/sites/default/files/docs/millennials_report.pdf
Dailey, S. (2016). What Happens Before Full-Time Employment> Internships as a Mechanism
of Anticipatory Socialization. Western Journal of Communication, 80(4), 453-480.
Retrieved from https://doi.org/10.1080/10570314.2016.1159727
Deloitte Touche Tohmatsu Limited. (2016). The 2016 Deloitte Millennial Survey – Winning over
the next generation of leaders. Retrieved from
https://www2.deloitte.com/content/dam/Deloitte/global/Documents/About-Deloitte/gx-
millenial-survey-2016-exec-summary.pdf
Dimock, M. (2019, January 17). Defining generations: Where Millennials end and Generation Z
begins. Pew Research Center. Retrieved from https://www.pewresearch.org/fact-
tank/2019/01/17/where-millennials-end-and-generation-z-begins/

RUNNING HEAD: PATHWAYS TO FEDERAL GOVERNMENT 33
Einolf, C. (2016). Millennials and Public Service Motivation: Findings from a survey of master’s
degree students. Public Administration Quarterly, 40(3), 429-457. Retrieved from
https://www.jstor.org/stable/24772878
Ertas, N. (2015). Turnover Intentions and Work Motivations of Millennial Employees in Federal
Service. Public Personnel Management, 44(3), 401-423.
https://doi.org/10.1177/0091026015588193
Ertas, N. (2016). Millennials and Volunteering: Sector Differences and Implications for Public
Service Motivation Theory. Public Administration Quarterly, 40(3), 517-558. Retrieved
from https://www.jstor.org/stable/24772881
Excepted Service, Career and Career-Conditional Employment; and Pathways Programs, 5
C.F.R. § 213, 302, 315, 330, 334, 362, 531, 536, 537, 550, 575, and 890 (2012).
https://www.govinfo.gov/content/pkg/FR-2012-05-11/pdf/2012-11068.pdf
Exec. Order No. 13562, 3 C.F.R. 291-295. (2010). Retrieved from
https://www.govinfo.gov/content/pkg/CFR-2011-title3-vol1/pdf/CFR-2011-title3-vol1-
eo13562.pdf
Federal Workforce Act of 2004, 5 U.S.C. § 4121 (2004).
https://www.govinfo.gov/content/pkg/PLAW-108publ411/pdf/PLAW-108publ411.pdf
Federal Workforce: Lessons Learned for Engaging Millennials and Other Age Groups, U.S.
Senate Subcommittee on Regulatory Affairs and Federal Management, 114th Cong.
(2016) (testimony of Robert Goldenkoff). Retrieved from
https://www.gao.gov/assets/690/680107.pdf
Fox, S. (2001, September 9). Wired Seniors. Pew Research Center. Retrieved from
https://www.pewresearch.org/internet/2001/09/09/wired-seniors/
Fry, R. (2020, November 9). The pace of Boomer retirements has accelerated in the past year.
Pew Research Center. Retrieved from https://www.pewresearch.org/fact-
tank/2020/11/09/the-pace-of-boomer-retirements-has-accelerated-in-the-past-year/
Gerding, J, Hall, K., & Ortiz Gumina, C. (2020). Exploring the Benefits and Value of Public
Health Department Internships for Environmental Health Students. Journal of
Environmental Health, 83(4), 20-25.
Henstra, D. & McGowan, R. (2016). Millennials and Public Service: An Exploratory Analysis of
Graduate Student Career Motivations and Expectations. Public Administration Quarterly,
40(3), 490-516. Retrieved from https://www.jstor.org/stable/24772880
Katz, E. (2017, April 11). Trump Ends Federal Hiring Freeze, but Workforce Cuts Loom.
Government Executive. Retrieved from

RUNNING HEAD: PATHWAYS TO FEDERAL GOVERNMENT 34
https://www.govexec.com/management/2017/04/trump-ends-federal-hiring-freeze-
workforce-cuts-loom/136942/
Kuron, L., Lyons, S., Schweitzer, L., & Ng, E. S. W. (2015). Millennials’ work values:
differences across the school to work transition. Personnel Review, 44(6), 991-1009.
Retrieved from https://doi.org/10.1108/PR-01-2014-0024
Martin, L., Riddle, C., Robinson, T., & Uejio, D. (2011). Charting Clearer Pathways into Public
Service. The Public Manager, 40(3), 6-9.
Mihelic, K. K., Aleksic, D. (2017). “Dear Employer, Let me Introduce Myself” – Flow,
Satisfaction with Work-Life Balance and Millennials’ Creativity, Creativity Research
Journal, 29(4), 397-408. Retrieved from https://doi.org/10.1080/10400419.2017.1376503
Morrell, D. L., & Abston, K. A. (2019). Millennial Motivation Issues Related to Compensation
and Benefits: Suggestions for Improved Retention. Compensation & Benefits Review.
Sage Publications. 1-7. Retrieved from https://doi.org/10.1177/0886368718822053
Ng, E. S. W., Gossett, C., Winter, R. (2016). Millennials and Public Service Renewal:
introduction on Millennials and Public Service Motivation (PSM). Public Administration
Quarterly, 40(3), 412-428. Retrieved from https://www.jstor.org/stable/24772877
Nickels, B., Sharpe, J.P., Bauhs, K., & Halloway-Lundy, A. (2006). The Presidential
Management Fellows Program: Lessons learned during 27 years of program success.
Human Resource Management Review, 16(3), 324-339. Retrieved from
https://doi.org/10.1016/j.hrmr.2006.05.005
Office of Management and Budget. (2020). Fiscal Year 2021 - A Budget for America’s Future –
Analytical Perspectives. The White House. Retrieved from
https://www.whitehouse.gov/wp-content/uploads/2020/02/spec_fy21.pdf
Office of Personnel Management. (n.d.). Students & Recent Graduates – Program Fact Sheets.
Retrieved from https://www.opm.gov/policy-data-oversight/hiring-information/students-
recent-graduates/#pmf=&url=Program-Fact-Sheets
Office of Personnel Management. (2013, 2014, 2015, 2016, 2017, 2018, 2019, 2020). Federal
Workforce Data: Employment Cubes. [Database]. Retrieved from
https://www.fedscope.opm.gov/employment.asp
Office of Personnel Management. (2013, 2014, 2015, 2016, 2017, 2018, 2019). Governmentwide
Management Report. Retrieved from
https://www.opm.gov/fevs/reports/governmentwide-reports/
Partnership for Public Service and the National Association of Colleges and Employers. (2012).
Federal Leaders Face Challenges Attracting Top College Graduates to Government

RUNNING HEAD: PATHWAYS TO FEDERAL GOVERNMENT 35
Service. Retrieved from https://ourpublicservice.org/wp-
content/uploads/2012/02/034ac10089537746da79ef95a6860f61-1402673627.pdf
Reeves, T.Z. (2010). Mentoring Programs in Succession Planning. State and Local Government
Review, 42(1), 61-66. Retrieved from https://doi.org/10.1177/0160323X10368036
Ressler, S. (2006). Recruiting and retaining Young IT Leaders. The Public Manager, 35(1), 49-
52.
Rose, R. (2015). Student Preferences for Federal, State, and Local Government Careers: national
Opportunities and Local Service. Journal of Public Affairs Education, 21(1). 83-100.
Retrieved from https://www.jstor.org/stable/24369706
Skledar, S., Martinelli, B., Wasicek, K., Mark, S., & Weber, R. (2009). Training and recruiting
future pharmacists through a hospital-based student internship program. American
Journal of Health-System Pharmacy, 66(17), 1560-1564. Retrieved from
https://doi.org/10.2146/ajhp080474
Spahr, A. (2005). Changing Practices Attracting Graduates to Government. The Public Manger,
34(4), 14-15.
Thompson, C. & Gregory J. B. (2012). Managing Millennials: A Framework for Improving
Attraction, Motivation, and Retention. The Psychologist Manager Journal, 55, 237-246.
Retrieved from https://doi.org/10.1080/10887156.2012.730444
United States Chief Financial Officers Council. (n.d.) About the Chief Financial Officers
Council. Retrieved from https://www.cfo.gov/about-the-council/#council-agencies
U.S. Department of Veterans Affairs. (n.d.). VA All Employee Survey. Retrieved from
https://www.va.gov/NCOD/VAworkforcesurveys.asp.
U.S. Department of Veterans Affairs. (n.d.). 2018 VA All Employee Survey Responses for Items
from the OPM Federal Employee Viewpoint Survey. Retrieved from
https://www.va.gov/NCOD/docs/AES2018_FEVS_Percent_Accessible.pdf
U.S. Department of Veterans Affairs. (n.d.). 2019 VA All Employee Survey Responses for Items
from the OPM Federal Employee Viewpoint Survey. Retrieved from
https://www.va.gov/NCOD/AES/AES2019_FEVS_Percent.html
U.S. Merit Systems Protection Board. (2008, January). Attracting the Next Generation – A Look
at Federal Entry-Level New Hires. Retrieved from
https://www.mspb.gov/mspbsearch/viewdocs.aspx?docnumber=314895&version=31530
6&application=ACROBAT
U.S. Merit Systems Protection Board. (2008, February). In Search of Highly Skilled Workers – A
Study on the Hiring of Upper Level Employees From Outside the Federal Government.

RUNNING HEAD: PATHWAYS TO FEDERAL GOVERNMENT 36
Retrieved from
https://www.mspb.gov/mspbsearch/viewdocs.aspx?docnumber=323118&version=32356
4&application=ACROBAT
Westmoreland Gariepy, L. (2012) The Environmental Protection Agency/National Institute of
Environmental Health Sciences Libraries Internship Program: An Analysis of Former
Interns’ Careers. Journal of Education for Library and Information Science, 53(1), 20-31.
Retrieved from https://www.jstor.org/stable/23249094
Zaharee, M., Lipkie, T., Mehlman, S., & Neylon, S. (2018). Recruitment and Retention of Early-
Career Technical Talent. Research-Technology Management, 61(3), 51-61. Retrieved
from https://doi.org/10.1080/08956308.2018.1495966