patients speak out 2009 - transforming lives speak out 2009 felix rodriguez, ph.d. the edward r....
TRANSCRIPT

PPaattiieennttss SSppeeaakk OOuutt
22000099
Felix Rodriguez, Ph.D.The Edward R. Murrow College of Communication
Washington State University
December 2009

An electronic copy of this report may be obtained from the Division of Behavioral Health and Recovery website: http://www.dshs.wa.gov/dasa

Patients Speak Out 2009
iii
Contents
CONTENTS ............................................................................................................................................ III
ACKNOWLEDGMENTS............................................................................................................................ 1
EXECUTIVE SUMMARY ........................................................................................................................... 3 The 2009 Statewide Patient Satisfaction Survey ................................................................................... 3 Key Findings ......................................................................................................................................... 3
INTRODUCTION ..................................................................................................................................... 5 Purpose of the Survey ........................................................................................................................... 5 Administration of the Survey ................................................................................................................ 5 Survey Response Rate ........................................................................................................................... 6 Interpretation of Survey Results ........................................................................................................... 6 Patient Responses to Open-ended Questions ........................................................................................ 6 Organization of the Report .................................................................................................................... 7
PART 1: COMMUNITY TREATMENT PROGRAMS ..................................................................................... 9
Adult Patient Satisfaction in Community Treatment Programs by Modality ........................................ 9 In an overall, general sense, how satisfied are you with the service you have received? ........................ 11 In general, how satisfied are you with the comfort and appearance of this facility? ............................... 11 Would you say our staff treated you with respect? .................................................................................. 12 How do you rate the helpfulness of the group sessions? ......................................................................... 12 How do you rate the helpfulness of the individual counseling? .............................................................. 13 If you were to seek help again, would you come back to the same program? ......................................... 13 Did you need legal services? ................................................................................................................... 14 If yes, how helpful were we in assisting you to identify and find legal services? ................................... 14 Did you need medical services? ............................................................................................................... 15 If yes, how helpful were we in assisting you to identify and find medical services? .............................. 15 Did you need family services? ................................................................................................................. 16 If yes, how helpful were we in assisting you to identify and find family services? ................................. 16 Did you need mental health services? ...................................................................................................... 17 If yes, how helpful were we in assisting you to identify and find mental health services? ...................... 17 Did you need educational or vocational services? ................................................................................... 18 If yes, how helpful were we in assisting you to identify and find educational or vocational services? ... 18 Did you need employment services? ....................................................................................................... 19 If yes, how helpful were we in assisting you to identify and find employment services? ....................... 19 What do you like about this program? ..................................................................................................... 20
Intensive Inpatient: Selected Responses ............................................................................................. 20 Recovery House: Selected Responses ................................................................................................. 20 Long-term Residential: Selected Responses ....................................................................................... 21 Outpatient/Intensive Outpatient: Selected Responses ......................................................................... 22 Opiate Substitution: Selected Responses ............................................................................................ 23
Is there anything you would change about this program? ........................................................................ 24 Intensive Inpatient: Selected Responses ............................................................................................. 24 Recovery House: Selected Responses ................................................................................................. 24 Long-term Residential: Selected Responses ....................................................................................... 25 Outpatient/Intensive Outpatient: Selected Responses ......................................................................... 25 Opiate Substitution: Selected Responses ............................................................................................ 26

Patients Speak Out 2009 Contents
iv
Group Differences in Adult Patient Satisfaction in Community Treatment Programs ....................... 27 Gender and Patient Satisfaction ............................................................................................................... 29
Satisfaction with Service Received ..................................................................................................... 29 Respect from Staff .............................................................................................................................. 29
Ethnicity/Race and Patient Satisfaction ................................................................................................... 30 Satisfaction with Service Received ..................................................................................................... 30 Respect from Staff .............................................................................................................................. 30
Length of Stay in Treatment and Patient Satisfaction .............................................................................. 31 Satisfaction with Service Received ..................................................................................................... 31 Respect from Staff .............................................................................................................................. 31
Source of Funding and Patient Satisfaction ............................................................................................. 32 Satisfaction with Service Received ..................................................................................................... 32 Respect from Staff .............................................................................................................................. 32
Comparing Responses Between English and Spanish Adult Patient Satisfaction Survey ................... 33 Satisfaction with Service Received .......................................................................................................... 35 Respect from Staff ................................................................................................................................... 35 Need for Services ..................................................................................................................................... 36 Helpfulness of Treatment Program in Identifying and Finding Needed Services .................................... 36
Five-Year Trend in Adult Patient Satisfaction in Community Treatment Programs .......................... 37 Satisfaction with Service Received .......................................................................................................... 39 Respect from Staff ................................................................................................................................... 40
Youth Patient Satisfaction in Community Treatment Programs by Modality ..................................... 41 How satisfied are you with the service you have received? ..................................................................... 43 How satisfied are you with the comfort and appearance of the facility? ................................................. 43 Would you say our staff treated you with respect? .................................................................................. 44 How safe do you feel in this program? .................................................................................................... 44 How helpful are the group sessions? ....................................................................................................... 45 How helpful is the individual counseling? ............................................................................................... 45 If you were to seek help again, would you come back to this program? ................................................. 46 What do you like about this program? ..................................................................................................... 47
Intensive Inpatient: Selected Responses ............................................................................................. 47 Recovery House: Selected Responses ................................................................................................. 47 Outpatient/Intensive Outpatient: Selected Responses ......................................................................... 47
What do you not like about this program? ............................................................................................... 49 Intensive Inpatient: Selected Responses ............................................................................................. 49 Recovery House: Selected Responses ................................................................................................. 49 Outpatient/Intensive Outpatient: Selected Responses ......................................................................... 49
Group Differences in Youth Patient Satisfaction in Community Treatment Programs ...................... 51 Gender and Youth Patient Satisfaction .................................................................................................... 53
Satisfaction with Service Received ..................................................................................................... 53 Respect from Staff .............................................................................................................................. 53
Ethnicity/Race and Youth Patient Satisfaction ........................................................................................ 54 Satisfaction with Service Received ..................................................................................................... 54 Respect from Staff .............................................................................................................................. 54
Length of Stay in Treatment and Youth Patient Satisfaction ................................................................... 55 Satisfaction with Service Received ..................................................................................................... 55 Respect from Staff .............................................................................................................................. 55
Source of Funding and Youth Patient Satisfaction .................................................................................. 56 Satisfaction with Service Received ..................................................................................................... 56 Respect from Staff .............................................................................................................................. 56

Patients Speak Out 2009 Contents
v
Five-Year Trend in Youth Patient Satisfaction in Community Treatment Programs ......................... 57 Satisfaction with Service Received .......................................................................................................... 59 Respect from Staff ................................................................................................................................... 59
PART 2: CORRECTIONAL TREATMENT PROGRAMS ............................................................................... 61
Patient Satisfaction in Department of Corrections (DOC) Treatment Programs by Modality ........... 61 In an overall, general sense, how satisfied are you with the service you have received? ........................ 63 In general, how satisfied are you with the comfort and appearance of this facility? ............................... 63 Would you say our staff treated you with respect? .................................................................................. 64 How do you rate the helpfulness of the group sessions? ......................................................................... 64 How do you rate the helpfulness of the individual counseling? .............................................................. 65 If you were to seek help again, would you come back to this program? ...................................... 65 Did you need legal services? ................................................................................................................... 66 If yes, how helpful were we in assisting you identify and find legal services? ....................................... 66 Did you need medical services? ............................................................................................................... 67 If yes, how helpful were we in assisting you to identify and find medical services? .............................. 67 Did you need family services? ................................................................................................................. 68 If yes, how helpful were we in assisting you to identify and find family services? ................................. 68 Did you need mental health services? ...................................................................................................... 69 If yes, how helpful were we in assisting you to identify and find mental health services? ...................... 69 Did you need educational or vocational services? ................................................................................... 70 If yes, how helpful were we in assisting you to identify and find educational or vocational services? ... 70 Did you need employment services? ....................................................................................................... 71 If yes, how helpful were we in assisting you to identify and find employment services? ....................... 71 What do you like about this program? ..................................................................................................... 72
Recovery House: Selected Responses ................................................................................................. 72 Long-term Residential: Selected Responses ....................................................................................... 72 Outpatient/Intensive Outpatient: Selected Responses ......................................................................... 73
Is there anything you would change about this program? ........................................................................ 74 Recovery House: Selected Responses ................................................................................................. 74 Long-term Residential: Selected Responses ....................................................................................... 74 Outpatient/Intensive Outpatient: Selected Responses ......................................................................... 75
Adult Patient Satisfaction in Community Compared to DOC Treatment Programs ........................... 77 Was there a difference in patient satisfaction between community and DOC treatment programs? ....... 79
Satisfaction with Service Received ..................................................................................................... 79 Respect from Staff .............................................................................................................................. 79
Five-Year Trend in Patient Satisfaction in DOC Treatment Programs ................................................ 81 Satisfaction with Service Received .......................................................................................................... 83 Respect from Staff ................................................................................................................................... 83
Patient Satisfaction in Juvenile Rehabilitation Administration (JRA) Treatment Programs ............. 85 How satisfied are you with the service you have received? ..................................................................... 87 How satisfied are you with the comfort and appearance of this facility? ................................................ 87 Would you say our staff treated you with respect? .................................................................................. 88 How safe do you feel in this program? .................................................................................................... 88 How helpful are the group sessions? ....................................................................................................... 89 How helpful is the individual counseling? ............................................................................................... 89 If you were to seek help again, would you come back to this program? ................................................. 90 What do you like about this program? ..................................................................................................... 91
Residential Program: Selected Responses .......................................................................................... 91 Outpatient/Intensive Outpatient Program: Selected Responses .......................................................... 91

Patients Speak Out 2009 Contents
vi
What do you not like about this program? ............................................................................................... 92 Residential Program: Selected Responses .......................................................................................... 92 Outpatient/Intensive Outpatient: Selected Responses ......................................................................... 92
Youth Patient Satisfaction in Community Compared to JRA Treatment Programs ........................... 93 Was there a difference in youth patient satisfaction between community and JRA treatment programs?95
Satisfaction with Service Received ..................................................................................................... 95 Respect from Staff .............................................................................................................................. 95
Five-Year Trend in Patient Satisfaction in JRA Treatment Programs ................................................. 97 Satisfaction with Service Received .......................................................................................................... 99 Respect from Staff ................................................................................................................................... 99
TREATMENT PROVIDERS VALUE THE RESULTS OF THE PATIENT SATISFACTION SURVEY ...................... 101
TECHNICAL NOTES ............................................................................................................................. 105
APPENDIX A: TABLES ......................................................................................................................... 107
3APPENDIX B: SURVEY INSTRUMENTS ................................................................................................. 169
3APPENDIX C: DSHS WASHINGTON STATE MAP OF COUNTY BY REGIONS ............................................ 189
Patients Speak Out 2009
1
Acknowledgments The Statewide Patient Satisfaction Survey has continued through eight administrations since 2001 owing to the collaboration of Washington State chemical dependency (CD) treatment providers, their staff, and their patients. To them I offer my most heartfelt gratitude. I thank John Taylor who served as Acting Director of the former Division of Alcohol and Substance Abuse (DASA), now renamed the Division of Behavioral Health and Recovery (DBHR). My appreciation goes to David Dickinson, DBHR Director, for keeping alive our mission to deliver high quality chemical dependency treatment to patients. This mission can only be realized by continuing to listen to patients and their concerns as this report attempts to document. I thank the following staff of DBHR’s Evaluation and Quality Assurance Section (EQA): Alice Huber, for reviewing the draft of this report; Kevin (Buzz) Campbell, for producing the provider‐ and county‐level reports; and Beverly Smith, for always giving her patient and outstanding administrative support. I thank the treatment providers who very kindly responded to my question about how they were using the results from the 2007 survey. Their names appear on pages 101‐104. The administration of the survey involves various tasks. Student interns – Thomas Oeun, DeRayne Lewis, and Candace Rose – skillfully completed many of those tasks. I am indebted to the following DBHR staff for their assistance: Mary Testa‐Smith, Harvey Funai, Bob Leonard, Dennis Malmer, Jennifer Fine, Victoria Roberts, Cheryl Wilcox, MaryLou McKinlay, and Kasey Leonard. Thanks to: Melinda Marks, Li Yang, and Mark Wu, University of Washington Office of Educational Assessment, for giving the best customer service in scanning our surveys; and Lisa Kaiser, Data Recognition Corporation, for ensuring that our surveys are printed under the highest standards and that they arrive on time.
Felix Rodriguez, Ph.D.

Patients Speak Out 2009
2

Patients Speak Out 2009
3
Executive Summary The 2009 Statewide Patient Satisfaction Survey
The Division of Behavioral Health and Recovery (DBHR), formerly known as the Division of Alcohol and Substance Abuse (DASA), has regularly commissioned a survey to assess patient satisfaction with chemical dependency (CD) treatment services in Washington State. In 2009, the Statewide Patient Satisfaction Survey took place during the week of March 23. A total of 490 CD treatment providers participated in the survey, representing 95 percent of the certified agencies offering any of the following treatment services: intensive inpatient, recovery house, long‐term residential, outpatient or intensive outpatient (OP/IOP), or opiate substitution treatment. Ninety‐eight percent of the public and 90 percent of the private treatment agencies in the state participated in the survey. DBHR received a total of 22,224 completed surveys, representing 72 percent of the adult and youth patients receiving CD treatment in participating community‐based and correctional treatment programs during the week of the survey.
Key Findings
The survey shows that overall satisfaction was high. In community treatment programs, 96 percent of adult and 91 percent of youth patients reported they were very or mostly satisfied with the service they received. Most adult patients felt positive about their program with 90 percent saying they would return to the same program if they were to seek help again. Ninety‐five percent of youth patients felt very or somewhat safe in their program. In correctional treatment programs, 89 percent of Department of Corrections and 91 percent of Juvenile Rehabilitation Administration patients reported they were very or mostly satisfied with the service they received. While patient perception of the quality of services was generally positive, the survey reveals a number of challenges in the following areas:
Respect
• African American patients in community residential treatment reported a lower rate of being treated with respect than other ethnic/racial groups. This was not the case for African Americans in other modalities. page 30
• Youth in community residential treatment reported lower rates of being treated with
respect than those in outpatient settings. page 54
Unmet Need for Co‐Occurring Disorder Services
• Overall, a fourth of adult patients in community treatment programs reported a need for mental health services; however, of those who needed mental health services only half found their program to be very helpful in assisting them to identify and find mental health services. page 17
• Over 40 percent of adults in community recovery house and long‐term residential, and a
third in intensive inpatient and opiate substitution programs reported a need for mental health services. page 17

Patients Speak Out 2009 Executive Summary
4
Recovery Support Services
• Among adults in community treatment who needed employment services, less than a third rated their program as very helpful in assisting them to identify and find employment services. page 19
• More monolingual Hispanic patients reported a need for a variety of support services
(especially legal, medical, and employment) than English‐speaking Hispanics and non‐Hispanics. page 36
Youth
• Regardless of modality, fewer youth patients in community treatment found group sessions
to be very helpful when compared to individual counseling. page 45
• Youth patients in community residential programs were less satisfied overall than youth in outpatient programs. page 54
Department of Corrections
Wide differences suggest a need for greater consistency in the quality of services:
• Less than 75 percent in long‐term residential treatment* reported they were very or mostly satisfied with the service they received compared to 94 percent in outpatient. page 63
• Eighty‐six percent in long‐term residential* reported that staff treated them with respect all
or some of the time compared to 97 percent in outpatient. page 64
* Operated in DOC institutions.

Patients Speak Out 2009
5
Introduction Purpose of the Survey
The Division of Behavioral Health and Recovery (DBHR), formerly known as the Division of Alcohol and Substance Abuse (DASA), has regularly commissioned a survey to assess patient satisfaction with chemical dependency (CD) treatment services. The survey aims to collect information that can help providers and policy‐makers improve the quality of CD treatment services in Washington State. This report presents the results of the statewide survey that took place during the week of March 23, 2009. In addition to this statewide report, DBHR prepares reports summarizing provider‐level results for participating agencies. DBHR also prepares county‐level reports aggregating the results for counties represented in the survey.
Administration of the Survey
In early 2009, DBHR sent letters to certified CD treatment providers in Washington State inviting them to participate in the survey. Treatment providers who agreed to participate were requested to ask all of their patients who were receiving treatment during the week of March 23 to complete the survey. The survey consists of six core questions asking patients to rate overall satisfaction with the service they received, satisfaction with the comfort and appearance of the facility, respect from staff, the helpfulness of the group and individual sessions, and the likelihood of participating in the same program if they were to seek help again. The survey has an adult and youth version and is available in English, Spanish, Vietnamese, and Cambodian (see Appendix B, page 169). A total of 490 agencies participated in the survey representing 95 percent of the certified treatment centers that were identified as actively operating in Washington State during the week of the survey, and were offering any of the following treatment services: intensive inpatient, recovery house, long‐term residential, outpatient or intensive outpatient (OP/IOP), or opiate substitution. At least 91 percent of the agencies in each region participated in the survey as the table below shows. The survey captured 98 percent of the public and 90 percent of the private treatment agencies in the state.*
Regional Distribution of DBHR‐Certified Treatment Agencies Participating in the 2009 Statewide Patient Satisfaction Survey
Regions† Participating Providers Non‐Participating Providers Total
Number Percent (%) Number Percent (%)
Region 1 (Spokane) 65 92.9 5 7.1 70
Region 2 (Yakima) 57 96.6 2 3.4 59
Region 3 (Snohomish) 63 91.3 6 8.7 69
Region 4 (King) 126 94.0 8 6.0 134
Region 5 (Pierce) 75 96.2 3 3.8 78
Region 6 (Clark) 104 97.2 3 2.8 107
TOTAL 490 94.8 27 5.2 517
* For details, see Technical Notes, page 105. † See map in Appendix C, page 191.

Patients Speak Out 2009 Introduction
6
Survey Response Rate
DBHR received a total of 22,224 completed surveys, representing 72 percent of an estimated 30,938 adult and youth patients receiving treatment in participating community‐based and correctional treatment programs during the week of the survey. The table below shows that the survey response rate was highest in long‐term residential programs followed by recovery house, intensive inpatient, OP/IOP, and opiate substitution.
2009 Statewide Patient Satisfaction Survey Survey Response Rate by Treatment Modality
Treatment Modality Number of Patients
Completing the Survey Number of Patients Receiving Treatment March 23‐27, 2009
Survey Response Rate (%)
Intensive Inpatient 1,002 1,114 90
Recovery House 127 139 91
Long‐term Residential 982 1,025 96
Outpatient/Intensive Outpatient (OP/IOP) 17,095 23,269 73
Total Excluding Opiate Substitution 19,206 25,547 75
Opiate Substitution 3,018 5,391 56
Total Including Opiate Substitution 22,224 30,938 72
*Figures were based on data provided by participating treatment agencies.
The survey response rate for opiate substitution programs, which historically has been the lowest among treatment modalities represented in the survey, has tended to reduce the overall survey response rate. If opiate substitution programs were excluded, the survey response rate overall would have been 75 percent. DBHR received completed surveys from community‐based treatment agencies and from correctional treatment programs administered by the Department of Corrections (DOC) and the Juvenile Rehabilitation Administration (JRA). Of the 22,224 completed surveys, 18,985 or 85.4 percent came from adults participating in community‐based treatment programs; 1,541 or 6.9 percent from youth patients enrolled in community‐based treatment programs; 1,642 or 7.4 percent from DOC treatment programs; and 56 or 0.3 percent from JRA treatment programs.
Interpretation of Survey Results
Results in this report are presented in percentages. In comparing treatment modalities or groups, the following guide is used: a difference of five percent or less is small and is considered not significant; a difference between six percent and ten percent is sizeable, and is moderately significant; over ten percent is large and considerably, clinically significant.
Patient Responses to Open‐ended Questions
The survey asked patients what they like and what they do not like about their treatment program. Patient responses were selected for each population group and treatment modality, and are quoted in this report. Reponses touched upon the following themes: perceived effects of treatment on recovery and self‐transformation, attitude of counselors and other staff, program activities, food and nutrition, physical and social environment, funding, and cost of treatment.

Patients Speak Out 2009 Introduction
7
Organization of the Report
The results presented in this report are aggregated on a state level for each treatment modality and are divided into two main parts: community treatment programs and correctional treatment programs. The results for community treatment programs are separated into adult and youth sections. The part devoted to correctional treatment programs is split between the DOC and the JRA. The report also includes a section on how providers used the results from the 2007 survey. The Technical Notes section (pages 105‐106) presents further information related to the administration of the survey. The charts presented in the report are based on tables appearing in Appendix A (pages 107‐168). The survey instruments and administration guidelines can be found in Appendix B (pages 169‐187).

Patients Speak Out 2009
8

Patients Speak Out 2009
9
PART 1: COMMUNITY TREATMENT PROGRAMS
Adult Patient Satisfaction in Community Treatment Programs by Modality

Patients Speak Out 2009
10

Patients Speak Out 2009 Adult Patient Satisfaction in Community Treatment Programs by Modality
11
48.0
34.132.0
60.6
40.7
55.9
47.7
63.459.8
36.5
50.8
40.1
3.7 2.46.5
1.85.6
2.70.52.4 1.3 0.6 2.3 0.9
0%
10%
20%
30%
40%
50%
60%
70%
IntensiveInpatient(n=884)
RecoveryHouse(n=85)
Long-termResidential
(n=413)
Outpatient/Intensive OP(n=13912)
OpiateSubstitution
(n=2158)
Overall(n=17452)
Source: Table 1, Appendix A.
Very satisfied Mostly satisfied Dissatisfied Very dissatisfied
43.8
56.1
30.7
59.1
40.5
54.6
46.143.9
56.6
37.5
49.0
40.4
8.6
0.0
10.9
2.47.0
3.61.1 0.0 0.9 0.6 2.4
0.90%
10%
20%
30%
40%
50%
60%
70%
IntensiveInpatient(n=790)
RecoveryHouse(n=41)
Long-termResidential
(n=632)
Outpatient/Intensive OP
(n=14504)
OpiateSubstitution
(n=3018)
Overall(n=18985)
Source: Table 1, Appendix A.
Very satisfied Mostly satisfied Dissatisfied Very dissatisfied
In an overall, general sense, how satisfied are you with the service you have received?
In general, how satisfied are you with the comfort and appearance of this facility?
* Results for opiate substitution should be interpreted with caution since fewer than 70 percent of patients receiving treatment in participating opiate substitution programs completed the survey during the week of March 23, 2009.
Overall, 96 percent of adult patients treated in community‐based programs reported they were very or mostly satisfied with the service they received.* The highest rates of being very satisfied occurred in outpatient and in intensive inpatient.
Ninety‐five percent said they were very or mostly satisfied with the comfort and appearance of their facility.* Less than a third of long‐term residential patients reported being very satisfied with the comfort and appearance of their facility.
96.0
91.6
97.1
91.8
97.6
95.7
Overall
OpiateSubstitution
OP/IOP
Long-termResidential
RecoveryHouse
IntensiveInpatient
Percent Reporting Very or Mostly Satisfied
95.0
89.5
96.7
87.3
100.0
89.9
Overall
OpiateSubstitution
OP/IOP
Long-termResidential
RecoveryHouse
IntensiveInpatient
Percent Reporting Very or Mostly Satisfied

Patients Speak Out 2009 Adult Patient Satisfaction in Community Treatment Programs by Modality
12
Would you say our staff treated you with respect?
How do you rate the helpfulness of the group sessions?
* Results for opiate substitution should be interpreted with caution since fewer than 70 percent of patients receiving treatment in participating opiate substitution programs completed the survey during the week of March 23, 2009.
Ninety‐seven percent overall said that staff treated them with respect all or some of the time.* About 90 percent in outpatient programs reported that staff treated them with respect all of the time.
Overall, 91 percent found the group sessions to be very or somewhat helpful. Over 65 percent in intensive inpatient and outpatient programs rated group sessions as very helpful.*
64.7
39.0
47.2
87.7
63.7
81.4
30.0
39.0
46.8
10.9
29.8
15.9
3.9
22.0
5.10.8
4.81.70.3 0.0 0.0 0.2 0.5 0.2
0%
10%
20%
30%
40%
50%
60%
70%
80%
90%
IntensiveInpatient(n=790)
RecoveryHouse(n=41)
Long-termResidential
(n=632)
Outpatient/Intensive OP(n=14504)
OpiateSubstitution
(n=3018)
Overall(n=18985)
Source: Table 1, Appendix A.
All of the time Some of the time Little of the time Never
97.4
93.5
98.5
94.0
78.0
94.7
Overall
OpiateSubstitution
OP/IOP
Long-termResidential
RecoveryHouse
IntensiveInpatient
Percent Reporting All or Some of the Time
69.5
26.8
56.8
65.6
39.3
61.2
26.8
65.9
38.4
29.232.0 29.9
1.84.9 3.2 2.2
6.83.0
0.32.4 0.2 0.2 1.1 0.4
0%
10%
20%
30%
40%
50%
60%
70%
80%
IntensiveInpatient(n=790)
RecoveryHouse(n=41)
Long-termResidential
(n=632)
Outpatient/Intensive OP(n=14504)
OpiateSubstitution
(n=3018)
Overall(n=18985)
Source: Table 1, Appendix A.
Very helpful Somewhat helpful Not helpful Made things worse
91.1
71.2
94.8
95.3
92.7
96.3
Overall
OpiateSubstitution
OP/IOP
Long-termResidential
RecoveryHouse
IntensiveInpatient
Percent Reporting Very or Somewhat Helpful

Patients Speak Out 2009 Adult Patient Satisfaction in Community Treatment Programs by Modality
13
How do you rate the helpfulness of the individual counseling?
If you were to seek help again, would you come back to the same program?
* Results for opiate substitution should be interpreted with caution since fewer than 70 percent of patients receiving treatment in participating opiate substitution programs completed the survey during the week of March 23, 2009.
Nearly 89 percent rated individual counseling as very or somewhat helpful.* Individual counseling was rated very helpful by over 60 percent in intensive inpatient and outpatient programs.
Overall, 90 percent reported that they would definitely or probably come back to the same program.* Recovery house and long‐term residential appeared to have the lowest proportion of patients who would definitely or probably return to the same program if they were to seek help again.
61.5
41.5
57.0
67.0
54.7
64.5
23.2
53.7
29.4
22.2
31.8
24.1
3.3 4.9 4.62.4
7.13.3
0.0 0.0 0.5 0.3 1.3 0.40%
10%
20%
30%
40%
50%
60%
70%
80%
IntensiveInpatient(n=790)
RecoveryHouse(n=41)
Long-termResidential
(n=632)
Outpatient/Intensive OP(n=14504)
OpiateSubstitution
(n=3018)
Overall(n=18985)
Source: Table 1, Appendix A.
Very helpful Somewhat helpful Not helpful Made things worse
88.5
86.5
89.2
86.4
95.1
84.7
Overall
OpiateSubstitution
OP/IOP
Long-termResidential
RecoveryHouse
IntensiveInpatient
Percent Reporting Very or Somewhat Helpful
51.4
36.6
30.5
63.1 63.961.6
29.9 31.7
41.8
28.423.8
28.2
12.7
22.0
16.5
4.55.9 5.53.5 4.9 7.4
1.5 2.4 1.90%
10%
20%
30%
40%
50%
60%
70%
IntensiveInpatient(n=790)
RecoveryHouse(n=41)
Long-termResidential
(n=632)
Outpatient/Intensive OP(n=14504)
OpiateSubstitution
(n=3018)
Overall(n=18985)
Source: Table 1, Appendix A.
Yes, definitely Yes, probably No, probably not No, definitely not
89.8
87.7
91.5
72.3
68.3
81.3
Overall
OpiateSubstitution
OP/IOP
Long-termResidential
RecoveryHouse
IntensiveInpatient
Percent Reporting Yes, Definitely or Yes, Probably

Patients Speak Out 2009 Adult Patient Satisfaction in Community Treatment Programs by Modality
14
Did you need legal services?
If yes, how helpful were we in assisting you to identify and find legal services?
Overall, 28 percent of adult patients treated in community‐based programs reported they needed legal services. A somewhat higher proportion in recovery house, long‐term residential and outpatient programs said they needed legal services.
Overall, 77 percent of patientswho reported a need for legal services rated their program as very or somewhat helpful in assisting them to identify and find legal services. Half of those in outpatient needing legal services rated their program as very helpful in identifying and finding legal services.
22.7
34.131.6 30.4
16.2
27.9
76.7
65.9 68.0 67.4
82.4
70.2
0%
10%
20%
30%
40%
50%
60%
70%
80%
90%
IntensiveInpatient(n=790)
RecoveryHouse(n=41)
Long-termResidential
(n=632)
Outpatient/Intensive OP(n=14504)
OpiateSubstitution
(n=3018)
Overall(n=18985)
Source: Table 2, Appendix A.
Yes No
45.8
21.4
35.0
51.6
32.4
48.9
28.5 28.630.0
27.7 28.8 27.9
12.3
21.4 21.0
7.9
14.9
9.29.5
28.6
9.56.8
15.1
7.8
0%
10%
20%
30%
40%
50%
60%
IntensiveInpatient(n=179)
RecoveryHouse(n=14)
Long-termResidential
(n=200)
Outpatient/Intensive OP
(n=4413)
OpiateSubstitution
(n=490)
Overall(n=5296)
Source: Table 2, Appendix A.
Very helpful Somewhat helpful Not very helpful Not helpful at all
76.8
61.2
79.3
65.0
50.0
74.3
Overall
OpiateSubstitution
OP/IOP
Long-termResidential
RecoveryHouse
IntensiveInpatient
Percent Reporting Very or Somewhat Helpful

Patients Speak Out 2009 Adult Patient Satisfaction in Community Treatment Programs by Modality
15
Did you need medical services?
If yes, how helpful were we in assisting you to identify and find medical services?
Overall, 28 percent reported a need for medical services. More than 75 percent of long‐term residential and recovery house patients said they needed medical services.
Among those who reported a need for medical services, 79 percent overall rated their program as very or somewhat helpful in assisting them to identify and find medical services. Half of those in intensive inpatient and outpatient needing medical care rated their program as very helpful in identifying and finding medical services.
55.9
80.576.7
21.9
36.5
27.6
43.5
19.523.1
75.9
61.9
70.4
0%
10%
20%
30%
40%
50%
60%
70%
80%
90%
IntensiveInpatient(n=790)
RecoveryHouse(n=41)
Long-termResidential
(n=632)
Outpatient/Intensive OP(n=14504)
OpiateSubstitution
(n=3018)
Overall(n=18985)
Source: Table 2, Appendix A.
Yes No
50.0
39.4
46.6
53.4
46.2
50.9
29.433.3
36.3
27.2 28.0 28.4
13.8
18.2
11.18.0
10.99.4
4.36.1
3.9 5.5 6.2 5.4
0%
10%
20%
30%
40%
50%
60%
IntensiveInpatient(n=442)
RecoveryHouse(n=33)
Long-termResidential
(n=485)
Outpatient/Intensive OP
(n=3180)
OpiateSubstitution
(n=1103)
Overall(n=5243)
Source: Table 2, Appendix A.
Very helpful Somewhat helpful Not very helpful Not helpful at all
79.3
74.3
80.5
82.9
72.7
79.4
Overall
OpiateSubstitution
OP/IOP
Long-termResidential
RecoveryHouse
IntensiveInpatient
Percent Reporting Very or Somewhat Helpful

Patients Speak Out 2009 Adult Patient Satisfaction in Community Treatment Programs by Modality
16
Did you need family services?
If yes, how helpful were we in assisting you to identify and find family services?
Fifteen percent of adult patients overall reported needing family services. Over 30 percent of patients in residential programs said they needed family services.
Among those who reported a need for family services, 74.1 percent overall rated their program as very or somewhat helpful in assisting them to identify and find family services. In intensive inpatient and long‐term residential, more than half of those who needed family services found their program to be very helpful in identifying and finding family services.
30.134.1 36.1
12.918.1
15.3
69.165.9
63.4%
84.780.3
82.6
0%
10%
20%
30%
40%
50%
60%
70%
80%
90%
IntensiveInpatient(n=790)
RecoveryHouse(n=41)
Long-termResidential
(n=632)
Outpatient/Intensive OP(n=14504)
OpiateSubstitution
(n=3018)
Overall(n=18985)
Source: Table 2, Appendix A.
Yes No
54.2
42.9
51.347.9
39.9
47.1
26.9
21.4
31.1
26.128.2 26.9
10.5
0.0
8.310.8
13.511.0
4.2
0.0
6.6 7.79.1
7.7
0%
10%
20%
30%
40%
50%
60%
IntensiveInpatient(n=238)
RecoveryHouse(n=14)
Long-termResidential
(n=228)
Outpatient/Intensive OP
(n=1871)
OpiateSubstitution
(n=547)
Overall(n=2898)
Source: Table 2, Appendix A.
Very helpful Somewhat helpful Not very helpful Not helpful at all
74.1
68.0
74.0
82.5
64.3
81.1
Overall
OpiateSubstitution
OP/IOP
Long-termResidential
RecoveryHouse
IntensiveInpatient
Percent Reporting Very or Somewhat Helpful

Patients Speak Out 2009 Adult Patient Satisfaction in Community Treatment Programs by Modality
17
Did you need mental health services?
If yes, how helpful were we in assisting you to identify and find mental health services?
Overall, a fourth of adult patients reported a need for mental health services. Over 40 percent of recovery house and long‐term residential and close to a third of intensive inpatient and opiate substitution patients said they needed mental health services.
Among those who reported a need for mental health services, about half rated their program as very helpful in assisting them to identify and find mental health services.
31.6
41.544.6
22.5
31.9
25.1
67.7
58.554.9
75.3
66.2
72.8
0%
10%
20%
30%
40%
50%
60%
70%
80%
IntensiveInpatient(n=790)
RecoveryHouse(n=41)
Long-termResidential
(n=632)
Outpatient/Intensive OP(n=14504)
OpiateSubstitution
(n=3018)
Overall(n=18985)
Source: Table 2, Appendix A.
Yes No
38.8
64.7
35.8
55.0
36.2
49.3
22.0 23.5
36.9
23.7
29.325.5
16.8
5.9
14.9
8.712.5
10.2
16.0
0.0
9.95.8
11.17.6
0%
10%
20%
30%
40%
50%
60%
70%
IntensiveInpatient(n=250)
RecoveryHouse(n=17)
Long-termResidential
(n=282)
Outpatient/Intensive OP
(n=3260)
OpiateSubstitution
(n=963)
Overall(n=4772)
Source: Table 2, Appendix A.
Very helpful Somewhat helpful Not very helpful Not helpful at all
74.8
65.5
78.7
72.7
88.2
60.8
Overall
OpiateSubstitution
OP/IOP
Long-termResidential
RecoveryHouse
IntensiveInpatient
Percent Reporting Very or Somewhat Helpful

Patients Speak Out 2009 Adult Patient Satisfaction in Community Treatment Programs by Modality
18
Did you need educational or vocational services?
If yes, how helpful were we in assisting you to identify and find educational or vocational services?
Overall, less than a fifth of patients reported they needed educational or vocational services. More patients in recovery house and long‐term residential programs needed educational or vocational services than in other modalities.
Overall, 65 percent of patients needing educational or vocational services rated their program as very or somewhat helpful in assisting them to identify and find educational or vocational services. In outpatient, two out five who needed educational or vocational services rated their program as very helpful in identifying and finding these services.
18.2
41.538.3
13.917.1 15.5
81.1
58.561.4
83.8 81.2 82.5
0%
10%
20%
30%
40%
50%
60%
70%
80%
90%
IntensiveInpatient(n=790)
RecoveryHouse(n=41)
Long-termResidential
(n=632)
Outpatient/Intensive OP(n=14504)
OpiateSubstitution
(n=3018)
Overall(n=18985)
Source: Table 2, Appendix A.
Yes No
34.7
29.4 30.2
41.6
27.0
37.7
17.4
35.333.1
26.628.5
27.1
22.9
11.8
18.6
13.516.7
14.9
18.1
23.5
14.9
8.9
13.010.6
0%
10%
20%
30%
40%
50%
IntensiveInpatient(n=144)
RecoveryHouse(n=17)
Long-termResidential
(n=242)
Outpatient/Intensive OP
(n=2019)
OpiateSubstitution
(n=515)
Overall(n=2937)
Source: Table 2, Appendix A.
Very helpful Somewhat helpful Not very helpful Not helpful at all
64.8
55.5
68.2
63.2
64.7
52.1
Overall
OpiateSubstitution
OP/IOP
Long-termResidential
RecoveryHouse
IntensiveInpatient
Percent Reporting Very or Somewhat Helpful

Patients Speak Out 2009 Adult Patient Satisfaction in Community Treatment Programs by Modality
19
Did you need employment services?
If yes, how helpful were we in assisting you to identify and find employment services?
Overall, less than 20percent of adult patients in community‐based treatment programs reported a need for employment services. Two out of five long‐term residential and nearly three out of five recovery house patients said they needed employment services.
Overall, 55 percent of patients needing employment services rated their program as very or somewhat helpful in assisting them to identify and find employment services. Less than a third overall rated their program as very helpful in assisting them to identify and find employment services.
24.4
56.1
40.3
14.817.2 16.6
74.9
43.9
59.0
82.9 81.1 81.4
0%
10%
20%
30%
40%
50%
60%
70%
80%
90%
IntensiveInpatient(n=790)
RecoveryHouse(n=41)
Long-termResidential
(n=632)
Outpatient/Intensive OP(n=14504)
OpiateSubstitution
(n=3018)
Overall(n=18985)
Source: Table 2, Appendix A.
Yes No
54.6
45.1
58.5
54.5
56.5
36.8
Overall
OpiateSubstitution
OP/IOP
Long-termResidential
RecoveryHouse
IntensiveInpatient
Percent Reporting Very or Somewhat Helpful
16.6
26.123.9
32.1
23.1
29.0
20.2
30.4 30.6
26.4
22.0
25.6
20.221.7
18.4 17.6 18.3 18.0
34.7
21.722.7
13.7
21.0
17.0
0%
10%
20%
30%
40%
IntensiveInpatient(n=193)
RecoveryHouse(n=23)
Long-termResidential
(n=255)
Outpatient/Intensive OP
(n=2153)
OpiateSubstitution
(n=519)
Overall(n=3143)
Source: Table 2, Appendix A.
Very helpful Somewhat helpful Not very helpful Not helpful at all

Patients Speak Out 2009 Adult Patient Satisfaction in Community Treatment Programs by Modality
20
What do you like about this program? Intensive Inpatient: Selected Responses
“Everything. I am allowed and encouraged to have my own truth and allowed to take the necessary time whatever that is to get through emotional pain and confusion. The staff overall is kind, warm and caring, easily approachable and trustworthy. They are here to help and guide us in professional and compassionate ways.” “I have been to a private‐paid facility and already I can tell that this treatment program will be more beneficial to keeping me sober. The counselors are in recovery which makes me able to relate to them and help understand the tools I need to stay in recovery.” “I compare this program to my last inpatient program at (name of facility). There are many differences, and they are all good ones. I like the smaller class size, staying busy throughout the week with group meetings and homework. Looking forward to my girlfriend bringing me barbecue ribs and steak on the weekend.”
“That I am learning better ways to be a clean and sober man, dad, friend. Dealing with my past as a child growing up. My anger management.”
“Behavioral modification, one‐on‐ones.”
“Smart recovery, excellent counselors, good nursing staff.” “The skills and tools it teaches you about your disease.”
“The staff here is very helpful and informative. I have learned a lot.”
Recovery House: Selected Responses
“I am stronger and don’t take half as much crap as I used to before I got here. I have more acceptance for negative things that come my way.”
“I have learned so much. Reframing, the 12 Steps, my old behaviors and how to change them.” “I like the fact that the counselors have been through this so they do know what they are talking about.”

Patients Speak Out 2009 Adult Patient Satisfaction in Community Treatment Programs by Modality
21
“That it’s a blackout with no contact to the world which keeps the mind on treatment. The intense groups cover every aspect I need for my recovery.”
“Program changed my thinking, outlook, and plans. Now I have dreams and goals.” “Home‐like setting, being able to focus on recovery and see it, and use it daily. The counselor is always available. The chores and clean up bring the house together.”
Long‐term Residential: Selected Responses
“This program gives moms and moms‐to‐be an opportunity to better their parenting skills and/or gain custody of their children back.” “They are here to help you, and they will do anything to be at your level and help you do one step at a time. It is the best place I ever went to get help. I’m grateful for each person that makes (name of facility) what it is.” “My medical needs are being met promptly – very impressed.” “The staff, the classes (lots of interaction with the whole class). We are able to participate in discussions, and I feel free to speak my mind about community issues or topics in classes.” “The hard work they put you through to keep your mind off of the old ways and habits you have. To learn to work with others even when not comfortable because we are not used to it.” “It is based on the individual, and it is for families and reuniting mothers and children.” “I like the attitudes, willingness, and helpfulness in general and for the most part I like the relaxed learning atmosphere.” “The choice theory concept. Also the tools you can acquire to learn how to work on other issues besides just your addiction.” “The group time, meals.” “Therapeutic value is amazing.” “I like the help you can get here, and it has good structure. I like how people help you here.”

Patients Speak Out 2009 Adult Patient Satisfaction in Community Treatment Programs by Modality
22
Outpatient/Intensive Outpatient: Selected Responses
“That it makes me accountable for something. I have other people that have similar issues, helps me through the beginning of my recovery.” “The fact that the counselor made me set goals and assisted me in achieving them.” “First off, it’s keeping me in compliance with the court, and the group sessions are much more involved than previous programs I’ve been in. Far more helpful.” “The educational videos; I like how the counselors have been so supportive about everything and involved. I especially like the advice I get in my one‐on‐one sessions. This treatment center is very comfortable and makes me feel at home when I’m here.” “That I can go to one place for my treatment and my medication.” “How helpful everyone is and how supportive. I learned how to get new housing and what medication I need to get off pills and be sober and not be sick.” “Counselors treat people with respect.” “That it has continuing care.” “That it is available to recovering addicts of all ethnic backgrounds and ages.” “I like this program ‘cause it’s a lot different than regular outpatient groups that I’ve been in; DBT, Relapse Awareness and Seeking Safety; so I think this will help me out a lot.”
“My counselor. She rocks. (Name) is the best counselor I’ve ever had. I like the low key atmosphere. I feel comfortable most of the time. I appreciate the sliding fee scale.” “Being able to process my triggers and thoughts.” “What is never really thought seriously – how dangerous drinking and driving could be.” “Personal and practical advice and help; flexible meeting times.” “That I’m in a male group so it’s easier to open up.” “The counselor is intelligent, lets me figure out things for myself when possible; is fair and reasonable.”

Patients Speak Out 2009 Adult Patient Satisfaction in Community Treatment Programs by Modality
23
Opiate Substitution: Selected Responses
“How helpful everyone is to me. The in‐charge nurse is super helpful. The director is one of the best managers I’ve seen, always on the floor working and helping everyone. My counselor is very helpful and knowledgeable. All the counselors that I’ve seen work very well together.” “When I come here, there isn’t a long line (most of the time) before receiving my dose. The staff is usually very nice. The staff is also very helpful in keeping someone stay on the program if they are having addiction issues instead of just giving up on the client.” “Having my life back! The one‐on‐one counseling meetings and the group meetings, and support.” “The front desk staff is very helpful and considerate.” “I love my counseling sessions, and the special help I get due to my medical situation, diabetic, and hope link cab rides for medical purposes. This is a very good treatment program.” “Location is convenient.” “I’m feeling better about myself and not feeling sick from withdrawal.” “I like the fact that they try and help you in every way that they can. They really do want to help you here if you are willing to work hard on your recovery.” “It gives me incentives to stay clean and begin to gradually have a normal life then help others to do the same.” “I like the flexibility of dosing hours, and I can see that most of the staff are genuinely helpful if you are lost or confused or upset. I really appreciate that public funds were made available to me.”

Patients Speak Out 2009 Adult Patient Satisfaction in Community Treatment Programs by Modality
24
Is there anything you would change about this program? Intensive Inpatient: Selected Responses
“I think some physical program daily is necessary for a healthy recovery. It would be nice if upon arrival the administrative staff had more information to give to family members, i.e. phone call times, visiting times, etc. Nothing was given to them.”
“I would not have so many meetings—after one, and then another after another. It is not productive. Some of the nurses are very mean‐spirited. They are just mean.”
“I would try and provide better food and a more comfortable living situation. The atmosphere is very familiar to a hospital which can be limiting to fully wanting recovery. You feel like a sick patient in such living conditions.” “I would hope there could be more services offered to HIV/AIDS patients and that there could be more individual counseling and therapy and not such a wide range of open group settings which de‐focus from the individual and their more personal problem afflictions.” “Less preferential treatment especially male staff to female resident. More professional, respectful staff. Competent medical care. I was almost killed in this facility.” “ALANON classes optional for patients. Staff should prepare for the classes they instruct so we patients get the best out of them. Support staff to have better knowledge of addiction. I was told that oxycontin was a benzo when in fact it is an opioid.” “More open sharing, more free time. I believe with free time we get to know each other better. Get staff to know we’re not in jail, and we deserve respect, and we are trying to better our lives, no rolling of the eyes, and they shouldn’t be able to text and talk on the phone/cell phone with their friends.” “There needs to be more communication training between staff. Very inconsistent. Everyone seems to carry their own ‘rule book’. Makes anger build up between staff and clients.”
Recovery House: Selected Responses
“More info on resources for after treatment: education, community college, vocational or retraining, funding.”

Patients Speak Out 2009 Adult Patient Satisfaction in Community Treatment Programs by Modality
25
“I would change the fact that staff does not listen when we suggest things that need to be changed or things that used to work 20 years ago that don’t work today 20 years later.” “Have some certified counselors with experience that respect persons’ individualities and respect a person’s religion and not get judged by the color of their skin.” “Allow access to at least some of our TANF dollars for our personal expenses.” “Maybe more one‐on‐one time and also more staff on hand when needed.”
Long‐term Residential: Selected Responses
“Yes, I would like to see this program offer more and better services (health services, mental health evaluations and treatment, better family, legal, and vocational information/help guidance, and a bit more recreation time out, and better nutrition that is more up to date with what is healthy and what isn’t.” “I would offer medical and mental help sooner. I have a deep depression and haven’t been sleeping, but I wasn’t allowed a doctor’s appointment until three weeks out so I almost left over that because I felt I needed help sooner.” “I would like to see it cleaned up a bit – have residents paint and maybe make a garden for residents to tend to. Food, more veggies and fruit. Healthier choices.” “Most of time in treatment is spent waiting. Time could be used in more productive way. Getting up at 6:30 a.m. after being woken up every hour by room checks is hard.” “The gossiping and more structure with staff and patients.” “More freedom for residents, more special events like going to mall or zoo as a group. Staff to make themselves more available to patients’ questions and needs. Patients should be able to fully engage in church activity for treatment pass. Patients should be able to use food stamps for special occasions for children such as Easter and birthdays for cakes, etc.”
Outpatient/Intensive Outpatient: Selected Responses
“Yes, speakers, testimonials from people that changed life style, long‐term success, and stories.”

Patients Speak Out 2009 Adult Patient Satisfaction in Community Treatment Programs by Modality
26
“More time to have groups, like different time slots I can pick from – mornings, afternoons, evenings.” “I think the counselors are overloaded with work. There should be a limit on how many people are in each group session.” “I would have more counselors with mental health expertise.” “The counselors coming and going.” “To know and learn a little bit better how to use my DBT skills and how to use the DBT diary card ‘cause I’ve never taken DBT before so this is all new for me, that’s all.” “Groups to be in room with tables. Often we have reading material and/or need to write, and it’s hard without a table.” “Some of the staff treating us with disrespect, having more attitude than us, and treating us like kids.” “More personal attention.” “The cost of the drug tests. It is too expensive.” “If I could, I would make it an all female group.”
Opiate Substitution: Selected Responses
“Shorter waits in the dosing lines. Counselors that respect HIPAA regulations and rules in general. Clients should be treated with some respect.” “Counselors need to actually know about resources. My counselor never remembers anything we talk about. I spend most of my sessions repeating what I talked about beforehand. An example of not knowing resources is, like, help with housing, and I’m just handed a piece of paper with a bunch of numbers written on it. I need guidance. I need help. I need my counselor to remember.” “More help getting mental health services provided, maybe more AA or NA meetings.” “I think if there was one think I would like changed, it might be that if a person is asked to take a random UA and they bring the pink slip back to the dispensary nurse, there should be no questions asked if the UA will be clean or dirty because the results will show up soon after the lab tests the UA I do understand for the safety of the client the dispensary nurse may need to know though. Plus quicker time on take homes.”
Patients Speak Out 2009
27
Group Differences in Adult Patient Satisfaction in Community Treatment Programs

Patients Speak Out 2009
28

Patients Speak Out 2009 Group Differences in Adult Patient Satisfaction in Community Treatment Programs
29
Gender and Patient Satisfaction Satisfaction with Service Received
Respect from Staff
* The results for recovery house should be interpreted with caution because of the comparatively smaller number of patients completing the survey.
In outpatient programs, a nearly equal proportion of males and females reported being very or mostly satisfied with the service they received. In intensive inpatient, long‐term residential, and opiate substitution, the numbers showed very small, insignificant differences.*
In outpatient programs, an equal proportion of men and women reported that staff treated them with respect all or some of the time. In intensive inpatient, long‐term residential, and opiate substitution, only small, insignificant differences can be observed between males and females in the proportion saying that staff treated them with respect all or some of the time.*
96.0100.0
92.297.2
91.895.3
91.7 91.197.4
92.1
0%
20%
40%
60%
80%
100%
IntensiveInpatient
(n=500) (n=277)
RecoveryHouse*
(n=29) (n=12)
Long-termResidential
(n=360) (n=259)
Outpatient/Intensive OP
(n=9671) (n=4408)
Opiate Substitution(n=1374) (n=1409)
Source: Table 4, Appendix A.
Percent of Patients Reporting They Were Very or Mostly Satisfied with Service Received
Male Female
95.2
79.3
94.298.7
94.094.2
75.0
93.498.7
93.2
0%
20%
40%
60%
80%
100%
IntensiveInpatient
(n=500) (n=277)
RecoveryHouse*
(n=29) (n=12)
Long-termResidential
(n=360) (n=259)
Outpatient/Intensive OP
(n=9671) (n=4408)
Opiate Substitution(n=1374) (n=1409)
Source: Table 4, Appendix A.
Percent of Patients Reporting that Staff Treated Them with Respect All or Some of the Time
Male Female

Patients Speak Out 2009 Group Differences in Adult Patient Satisfaction in Community Treatment Programs
30
Ethnicity/Race and Patient Satisfaction Satisfaction with Service Received
Respect from Staff
* The results for Asian/PI in residential and opiate substitution should be interpreted with caution because of the small number of cases represented in these programs.
In outpatient programs, ethnic/racial groups showed only small, insignificant differences in the proportion of patients reporting they were very or mostly satisfied with the service they received. In opiate substitution programs, the proportion was lowest among those identifying themselves as multiracial or other.*
In residential programs, a significantly lower proportion of African American patients reported that staff treated them with respect all or some of the time than other groups.*
94.297.3
91.794.2 95.8
92.488.2
98.3 100
93.497.4 95.797.1 97.7
92.992.596.2
90.3
40%
60%
80%
100%
Residential(n=953) (n=121) (n=17)* (n=136)
(n=103) (n=93)
OP/IOP(n=9627) (n=826) (n=416) (n=873)
(n=1496) (n=836)
Opiate Substitution(n=2160) (n=144) (n=34)* (n=188)
(n=85) (n=186)
Source: Table 5, Appendix A.
Percent of Patients Reporting They Were Very or Mostly Satisfied with Service Received
White Black/African American Asian/PI* Native American Hispanic Multiracial/Other
94.198.9
93.890.1
98.394.4
100 98.3 100
93.497.9
94.197.1 98.1
94.193.597.8
92.5
40%
60%
80%
100%
Residential(n=953) (n=121) (n=17)* (n=136)
(n=103) (n=93)
OP/IOP(n=9627) (n=826) (n=416) (n=873)
(n=1496) (n=836)
Opiate Substitution(n=2160) (n=144) (n=34)* (n=188)
(n=85) (n=186)
Source: Table 5, Appendix A.
Percent of Patients Reporting that Staff Treated Them with Respect All or Some of the Time
White Black/African American Asian/PI* Native American Hispanic Multiracial/Other

Patients Speak Out 2009 Group Differences in Adult Patient Satisfaction in Community Treatment Programs
31
Length of Stay in Treatment and Patient Satisfaction Satisfaction with Service Received
In long‐term residential programs, a higher proportion of shorter‐term patients reported they were very or mostly satisfied with the service they received compared to longer‐term patients although the difference was not significant. In outpatient, the rate was higher in longer‐term patients but the difference was also not significant.*
Respect from Staff
In long‐term residential programs, a somewhat higher proportion of shorter‐term patients reported that staff treated them with respect all or some of the time compared to longer‐term patients although the difference was not significant, less than five percent. In outpatient programs, the proportion was nearly equal across groups of varying lengths of stay in treatment. *
* For length of stay in treatment and patient satisfaction in other treatment modalities, see Table 6 in Appendix A, page 119.
93.2 90.6 91.2
0%
20%
40%
60%
80%
100%
30 Daysor Less(n=309)
31 - 60Days
(n=149)
Over 60Days
(n=91)
Source: Table 6, Appendix A.
Long-term ResidentialPercent of Patients Reporting They Were Very or Mostly
Satisfied with Service Received
96.7 97.4 97.7
0%
20%
40%
60%
80%
100%
30 Daysor Less
(n=2797)
31 - 60Days
(n=1489)
Over 60Days
(n=7617)
Source: Table 6, Appendix A.
Outpatient/Intensive OPPercent of Patients Reporting They Were Very or Mostly
Satisfied with Service Received
98.3 98.8 98.7
0%
20%
40%
60%
80%
100%
30 Daysor Less
(n=2797)
31 - 60Days
(n=1489)
Over 60Days
(n=7617)
Source: Table 6, Appendix A.
Outpatient/Intensive OPPercent of Patients Reporting That Staff Treated Them
with Respect All or Some of the Time
95.4 94.4 90.9
0%
20%
40%
60%
80%
100%
30 Daysor Less(n=151)
31 - 60Days
(n=124)
Over 60Days
(n=66)
Source: Table 6, Appendix A.
Long-term ResidentialPercent of Patients Reporting That Staff Treated Them
with Respect All or Some of the Time

Patients Speak Out 2009 Group Differences in Adult Patient Satisfaction in Community Treatment Programs
32
Source of Funding and Patient Satisfaction Satisfaction with Service Received
Respect from Staff
* Results for opiate substitution programs should be interpreted with caution since fewer than 70 percent of patients in participating opiate substitution programs completed the survey during the week of March 23, 2009.
In residential treatment, a lower proportion of publicly funded patients reported they were very or mostly satisfied with the service they received compared to private pays although the difference was not significant. The rates were very similar in outpatient, and nearly equal in opiate substitution.*
The proportion of publicly funded patients reporting that staff treated them with respect all or some of the time was somewhat lower compared to private pays in residential and opiate substitution programs, but the differences were small and not significant. The rates were similar in outpatient programs.*
96.5 97.892.492.9
96.692.2
0%
20%
40%
60%
80%
100%
Residential(n=202) (n=1007)
Outpatient/Intensive OP
(n=6990) (n=4799)
Opiate Substitution(n=961) (n=1184)
Source: Table 7, Appendix A.
Percent of Patients Reporting They Were Very or Mostly Satisfied with Service Received
Private Public
95.599.0
95.293.298.2
93.2
0%
20%
40%
60%
80%
100%
Residential(n=202) (n=1007)
Outpatient/Intensive OP
(n=6990) (n=4799)
Opiate Substitution(n=961) (n=1184)
Source: Table 7, Appendix A.
Percent of Patients Reporting that Staff Treated Them with Respect All or Some of the Time
Private Public
Patients Speak Out 2009
33
Comparing Responses Between English and Spanish Adult Patient Satisfaction Survey

Patients Speak Out 2009
34

Patients Speak Out 2009 Comparing Responses Between English and Spanish Adult Patient Satisfaction Survey
35
Satisfaction with Service Received
Respect from Staff
* The patients included in this analysis were those enrolled in adult community outpatient programs only.
Monolingual Hispanics and English speaking Hispanics and non‐Hispanics showed no significant differences in the rates reporting very or mostly satisfied with the service they received, although more monolingual Hispanics appeared to be very satisfied compared to the other groups by a significant margin.*
There were no significant differences between monolingual Hispanics and English speaking Hispanics and non‐Hispanics in the rate of being treated with respect all or some of the time.*
89.4
63.058.9
8.1
35.038.2
0.8 1.0 2.00.4 0.8 0.60%
20%
40%
60%
80%
100%
HispanicsCompletingthe SpanishTranslation
(n=715)
HispanicsCompletingthe English
Version(n=781)
Non-HispanicsCompletingthe English
Version(n=12970)
Source: Table 8, Appendix A.
Very satisfied Mostly satisfied Dissatisfied Very dissatisfied
92.488.7 87.3
4.910.0 11.3
0.8 0.8 0.80.4 0.1 0.20%
20%
40%
60%
80%
100%
HispanicsCompletingthe SpanishTranslation
(n=715)
HispanicsCompletingthe English
Version(n=781)
Non-HispanicsCompletingthe English
Version(n=12970)
Source: Table 8, Appendix A.
All of the time Some of the time Little of the time Never
97.1
97.1
98.0
97.5
Overall
Non-HispanicsUsing English
Survey
HispanicsUsing English
Survey
HispanicsUsing Spanish
Translation
Percent Reporting Very or Mostly Satisfied
98.5
98.6
98.7
97.3
Overall
Non-HispanicsUsing English
Survey
HispanicsUsing English
Survey
HispanicsUsing Spanish
Translation
Percent Reporting All or Some of the Time

Patients Speak Out 2009 Comparing Responses Between English and Spanish Adult Patient Satisfaction Survey
36
Need for Services
Helpfulness of Treatment Program in Identifying and Finding Needed Services
* The patients included in this analysis were those enrolled in adult community outpatient programs only.
More monolingual Hispanics reported a need for services than English speaking Hispanics and non‐Hispanics. The most needed were legal, medical, and employment services.*
Among those who reported a need for services, fewer monolingual Hispanics found their program to be very helpful in assisting them to identify and find those services than English speaking Hispanics and non‐Hispanics.*
53.7
38.3
26.722.9
29.131.5
33.5
20.5
15.016.9
12.5 13.3
28.9
21.0
11.9
22.7
13.1 13.9
0%
10%
20%
30%
40%
50%
60%
LegalServices
MedicalServices
FamilyServices
MentalHealth
Services
Educational/VocationalServices
EmploymentServices
Source: Table 9, Appendix A.
Hispanics Completingthe SpanishTranslation(n=715)
Hispanics Completingthe EnglishVersion(n=781)
Non-HispanicsCompletingthe EnglishVersion(n=12970)
64.860.9
43.536.0
57.252.4
85.9 83.178.6 79.5
69.4
58.7
80.2 82.277.2 81.0
69.358.9
0%
15%
30%
45%
60%
75%
90%
LegalServices(n=384)(n=262)
(n=3744)
MedicalServices(n=274)(n=160)
(n=2722)
FamilyServices(n=191)(n=117)
(n=1547)
MentalHealth
Services(n=164)(n=132)
(n=2949)
Educational/VocationalServices(n=208)(n=98)
(n=1698)
EmploymentServices(n=225)(n=104)
(n=1804)
Source: Table 9, Appendix A.
Hispanics Completingthe SpanishTranslation
Hispanics Completingthe EnglishVersion
Non-HispanicsCompletingthe EnglishVersion

Patients Speak Out 2009
37
Five‐Year Trend in Adult Patient Satisfaction in Community Treatment Programs

Patients Speak Out 2009
38

Patients Speak Out 2009 Five ‐Year Trend in Adult Patient Satisfaction in Community Treatment Programs
39
Satisfaction with Service Received
* The results for recovery house should be interpreted with caution due to the comparatively smaller number of recovery house patients completing the survey in 2006 and 2009.
The proportion of patients reporting they were very or mostly satisfied with the service they received has remained at the same level for outpatient programs. The number showed some degree of fluctuation in other modalities, with the percentage in long‐term residential rising from 88 percent in 2007 to 92 percent in 2009.*
94.6 95.1 94.8 95.1 95.7
40%
60%
80%
100%
2004(n=596)
2005(n=690)
2006(n=782)
2007(n=884)
2009(n=790)
Source: Table 11a, Appendix A.
Intensive Inpatient
93.6 94.4
89.3 90.6
97.6
40%
60%
80%
100%
2004(n=110)
2005(n=108)
2006(n=56)
2007(n=85)
2009(n=41)
Source: Table 11b, Appendix A.
Recovery House
96.0 97.1 97.1 97.1 97.1
40%
60%
80%
100%
2004(n=12276)
2005(n=12869)
2006(n=13563)
2007(n=13912)
2009(n=14504)
Source: Table 11d, Appendix A.
Outpatient/Intensive OP
91.7 93.4 93.1 92.3 91.6
40%
60%
80%
100%
2004(n=1713)
2005(n=1868)
2006(n=2170)
2007(n=2158)
2009(n=3018)
Source: Table 11e, Appendix A.
Opiate Substitution
90.3 90.9 92.187.9
91.8
40%
60%
80%
100%
2004(n=444)
2005(n=427)
2006(n=443)
2007(n=413)
2009(n=632)
Source: Table 11c, Appendix A.
Long-term Residential

Patients Speak Out 2009 Five ‐Year Trend in Adult Patient Satisfaction in Community Treatment Programs
40
Respect from Staff
* The results for recovery house should be interpreted with caution due to the comparatively smaller number of recovery house patients completing the survey in 2006 and 2009.
Similarly, the proportion of patients reporting that staff treated them with respect all or some of the time remained at similar levels for outpatient programs but showed minor fluctuations for other modalities.*
97.1 95.8 95.9 96.794.7
40%
60%
80%
100%
2004(n=596)
2005(n=690)
2006(n=782)
2007(n=884)
2009(n=790)
Source: Table 11a, Appendix A.
Intensive Inpatient
97.3 96.3 94.6 95.3
78.0
40%
60%
80%
100%
2004(n=110)
2005(n=108)
2006(n=56)
2007(n=86)
2009(n=41)
Source: Table 11b, Appendix A.
Recovery House
92.696.0
93.9 92.7 94.0
40%
60%
80%
100%
2004(n=444)
2005(n=427)
2006(n=443)
2007(n=413)
2009(n=632)
Source: Table 11c, Appendix A.
Long-term Residential
97.5 98.6 98.5 98.5 98.5
40%
60%
80%
100%
2004(n=12276)
2005(n=12869)
2006(n=13563)
2007(n=13912)
2009(n=14504)
Source: Table 11d, Appendix A.
Outpatient/Intensive OP
94.0 95.6 95.1 94.9 93.5
40%
60%
80%
100%
2004(n=1713)
2005(n=1868)
2006(n=2170)
2007(n=2158)
2009(n=3018)
Source: Table 11e, Appendix A.
Opiate Substitution

Patients Speak Out 2009
41
Youth Patient Satisfaction in Community Treatment Programs by Modality

Patients Speak Out 2009
42
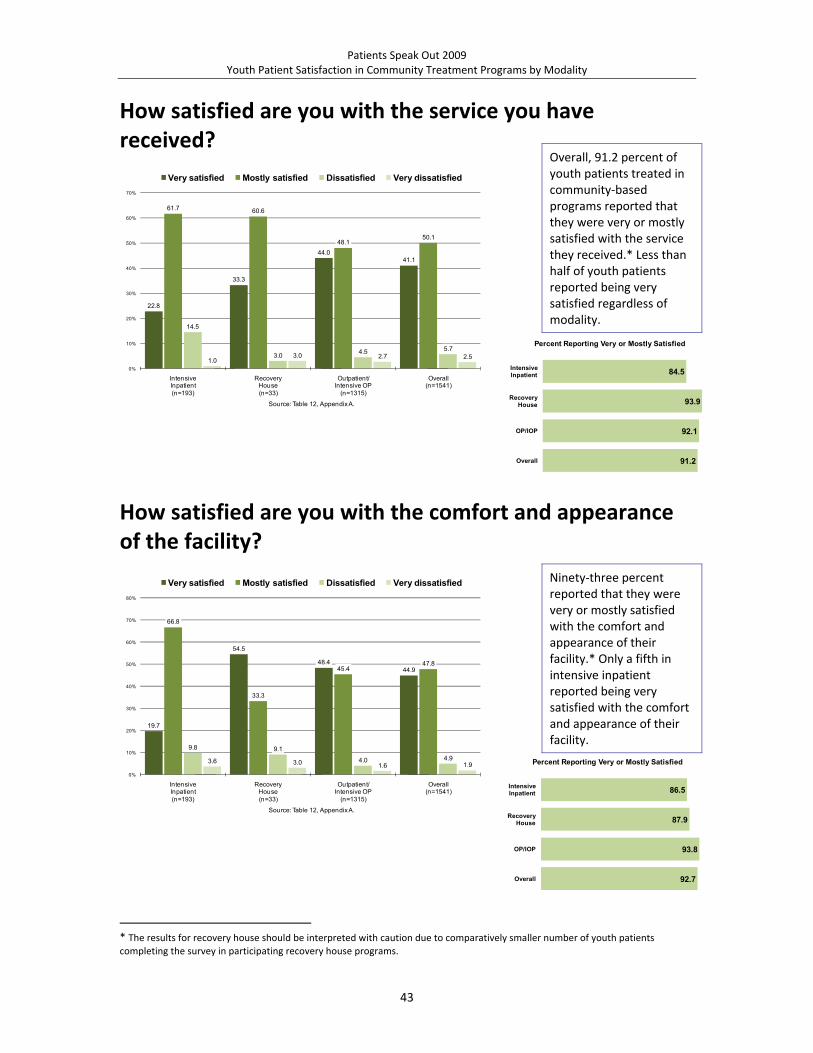
Patients Speak Out 2009 Youth Patient Satisfaction in Community Treatment Programs by Modality
43
How satisfied are you with the service you have received?
How satisfied are you with the comfort and appearance of the facility?
* The results for recovery house should be interpreted with caution due to comparatively smaller number of youth patients completing the survey in participating recovery house programs.
Overall, 91.2 percent of youth patients treated in community‐based programs reported that they were very or mostly satisfied with the service they received.* Less than half of youth patients reported being very satisfied regardless of modality.
Ninety‐three percent reported that they were very or mostly satisfied with the comfort and appearance of their facility.* Only a fifth in intensive inpatient reported being very satisfied with the comfort and appearance of their facility.
22.8
33.3
44.041.1
61.7 60.6
48.150.1
14.5
3.0 4.5 5.7
1.03.0 2.7 2.5
0%
10%
20%
30%
40%
50%
60%
70%
IntensiveInpatient(n=193)
RecoveryHouse(n=33)
Outpatient/Intensive OP
(n=1315)
Overall(n=1541)
Source: Table 12, Appendix A.
Very satisfied Mostly satisfied Dissatisfied Very dissatisfied
91.2
92.1
93.9
84.5
Overall
OP/IOP
RecoveryHouse
IntensiveInpatient
Percent Reporting Very or Mostly Satisfied
19.7
54.5
48.444.9
66.8
33.3
45.447.8
9.8 9.1
4.0 4.93.6 3.0 1.6 1.90%
10%
20%
30%
40%
50%
60%
70%
80%
IntensiveInpatient(n=193)
RecoveryHouse(n=33)
Outpatient/Intensive OP
(n=1315)
Overall(n=1541)
Source: Table 12, Appendix A.
Very satisfied Mostly satisfied Dissatisfied Very dissatisfied
92.7
93.8
87.9
86.5
Overall
OP/IOP
RecoveryHouse
IntensiveInpatient
Percent Reporting Very or Mostly Satisfied

Patients Speak Out 2009 Youth Patient Satisfaction in Community Treatment Programs by Modality
44
Would you say our staff treated you with respect?
How safe do you feel in this program?
* The results for recovery house should be interpreted with caution due to the comparatively smaller number of youth patients completing the survey in participating recovery house programs.
Nearly 96 percent reported that staff treated them with respect all or some of the time.* Four out of five in outpatient reported that staff treated them with respect all of the time compared to a third in intensive inpatient.
Ninety‐five percent said they felt very or somewhat safe in their program.* More than half in intensive inpatient and more than two‐thirds in outpatient reported feeling very safe in their program.
34.7
63.6
81.1
75.0
52.8
36.4
15.420.6
10.9
0.0 1.9 3.01.0 0.0 1.0 1.00%
10%
20%
30%
40%
50%
60%
70%
80%
90%
IntensiveInpatient(n=193)
RecoveryHouse(n=33)
Outpatient/Intensive OP
(n=1315)
Overall(n=1541)
Source: Table 12, Appendix A.
All of the time Some of the time Little of the time Never
95.5
96.6
100.0
87.6
Overall
OP/IOP
RecoveryHouse
IntensiveInpatient
Percent Reporting All or Some of the Time
56.5
66.770.6 68.8
37.8
30.3
24.0 25.9
4.10.0
2.3 2.51.03.0 1.3 1.3
0%
10%
20%
30%
40%
50%
60%
70%
80%
IntensiveInpatient(n=193)
RecoveryHouse(n=33)
Outpatient/Intensive OP
(n=1315)
Overall(n=1541)
Source: Table 12, Appendix A.
Very safe Somewhat safe Not very safe Not safe at all
94.7
94.7
97.0
94.3
Overall
OP/IOP
RecoveryHouse
IntensiveInpatient
Percent Reporting Very or Somewhat Safe

Patients Speak Out 2009 Youth Patient Satisfaction in Community Treatment Programs by Modality
45
How helpful are the group sessions?
How helpful is the individual counseling?
* The results for recovery house should be interpreted with caution due to the comparatively smaller number youth patients completing the survey in participating recovery house programs.
Overall, 84 percent of youth patients rated group sessions as very or somewhat helpful.* Fewer youth patients found groups sessions to be very helpful compared to individual counseling (see below).
Eighty‐two percent of youth patients rated individual counseling as very or somewhat helpful.* Forty‐six percent rated it as very helpful.
34.230.3
37.9 37.2
50.8
54.5
45.6 46.5
13.5
9.1 8.7 9.3
0.53.0
1.5 1.40%
10%
20%
30%
40%
50%
60%
IntensiveInpatient(n=193)
RecoveryHouse(n=33)
Outpatient/Intensive OP
(n=1315)
Overall(n=1541)
Source: Table 12, Appendix A.
Very helpful Somewhat helpful Not helpful Made things worse
83.7
83.5
84.8
85.0
Overall
OP/IOP
RecoveryHouse
IntensiveInpatient
Percent Reporting Very or Mostly Satisfied
49.7
39.4
45.2 45.6
37.8
54.5
35.7 36.3
6.7
0.0
6.5 6.4
1.03.0
1.1 1.10%
10%
20%
30%
40%
50%
60%
IntensiveInpatient(n=193)
RecoveryHouse(n=33)
Outpatient/Intensive OP
(n=1315)
Overall(n=1542)
Source: Table 12, Appendix A.
Very helpful Somewhat helpful Not helpful Made things worse
82.0
80.8
93.9
87.6
Overall
OP/IOP
RecoveryHouse
IntensiveInpatient
Percent Reporting Very or Somewhat Helpful

Patients Speak Out 2009 Youth Patient Satisfaction in Community Treatment Programs by Modality
46
If you were to seek help again, would you come back to this program?
* The results for recovery house should be interpreted with caution due to the comparatively smaller number of youth patients completing the survey in participating recovery house programs.
Overall, 82 percent of youth patients reported that they would definitely or probably return to the same program if they were to seek help again.* A fifth in intensive inpatient and two out of five in outpatient reported they would return to the same program if they were to seek help again.
22.8
48.5
42.740.4
45.6
36.4
40.7 41.2
18.1
9.1 9.9 10.912.4
6.1 5.2 6.2
0%
10%
20%
30%
40%
50%
60%
IntensiveInpatient(n=193)
RecoveryHouse(n=33)
Outpatient/Intensive OP
(n=1315)
Overall(n=1541)
Source: Table 12, Appendix A.
Yes, definitely Yes, probably No, probably not No, definitely not
81.6
83.4
84.8
68.4
Overall
OP/IOP
RecoveryHouse
IntensiveInpatient
Percent Reporting Yes, Definitely or Yes, Probably

Patients Speak Out 2009 Youth Patient Satisfaction in Community Treatment Programs by Modality
47
What do you like about this program? Intensive Inpatient: Selected Responses
“I feel an incredible support system and the personal counseling had given me support in a way no counselor has with her experience, empathy, and interest in my journey.” “I like the skills I learn here to help me with being on the outs; the food is good.” “I like the routine because I know what to expect. The food isn’t bad; I like it tastewise.” “That it’s not a lock down facility so you don’t feel in trouble.” “The staff meeting, new people learning about native culture, the sobriety.” “It’s pretty helpful, but it would be better to have no boys. Being able to go out and just take time to self and others, having fun, and going to meetings.” “I like how we get to handle our anger in a positive way, and there’s always someone to talk to.” “Our group sessions.”
Recovery House: Selected Responses
“It is not like some hardcore rehab. It’s more like helpful into getting kids to change for the best and showing them that you can have fun and live without the use of drugs.” “The freedom, but there’s still structure.” “People to talk to. Fun activities, MRT, groups, learning experiences.” “The one‐on‐ones with my counselor.”
Outpatient/Intensive Outpatient: Selected Responses
“The talking and expression, the feedback I get, and tips to stay clean. I also love giving other people feedback and help them from what I’ve learned.”

Patients Speak Out 2009 Youth Patient Satisfaction in Community Treatment Programs by Modality
48
“There are people here who can help me with my treatment, and I get to talk about my problems.” “My counselor (name), and how despite the bull she makes everyone feel comfortable.” “It works for my schedule, and it’s nice to have someone to talk to about family matters.” “Individual counseling, better interaction to get across without the thoughts of a group.” “It’s a very comfortable environment.” “I like that everybody is respectful, and we get snacks every time.” “Letting my feelings out and listening to others.” “I like how friendly people are. If you are ever in trouble or need help they are always there to help. They will do anything possible to make you succeed.” “This is a very helpful program. It teaches me to ask for help when needed. This program gives me a place to feel cared about.”

Patients Speak Out 2009 Youth Patient Satisfaction in Community Treatment Programs by Modality
49
What do you not like about this program? Intensive Inpatient: Selected Responses
“That every day we did the same things, we need variety, it gets really repetitive.” “I don’t like the sleeping arrangement because it is kinda crowded. The food makes my skin really oily. The shower products are way too cheap, and I would never use them on the outs. And caseload is way, way too crowded.” “The sometimes patronizing tone of the staff to me.:” “The phone times and no smoking.” “Having boys in the same building with girls.” “How staff deals with the issues addressed and how the kids treat one another.” “That we cannot just talk to the boys for 30 minutes with staff watching because we have so much free time.”
Recovery House: Selected Responses
“Too many people relapsing or just leaving, not enough one‐on‐ones.” “Physical education is too short.”
Outpatient/Intensive Outpatient: Selected Responses
“Not being able to be here on Mondays because I have no babysitter for my son.” “Conflicts between peers in group.” “The texting rule.” “No candy, no free pop, not being able to smoke inside.” “You have to take UAs.” “The only thing I don’t like about this program is that it’s only one hour a week.” “Other females in group.”

Patients Speak Out 2009
50

Patients Speak Out 2009
51
Group Differences in Youth Patient Satisfaction in Community Treatment Programs

Patients Speak Out 2009
52

Patients Speak Out 2009 Group Differences in Youth Patient Satisfaction in Community Treatment Programs
53
Gender and Youth Patient Satisfaction Satisfaction with Service Received
Respect from Staff
In outpatient, more female youth patients reported being very or mostly satisfied with the service they received than males, while the reverse is true for intensive inpatient, although the differences were small and not significant. The small number of cases in recovery house did not allow a fair comparison of this measure; it is excluded from this chart.
A higher proportion of female than male youth patients reported that staff treated them with respect all or some of the time in intensive inpatient and outpatient, although the differences were small and not significant. The small number of cases in recovery house did not allow a valid comparison of this measure; it is not included in this chart.
84.890.7
83.1
94.4
0%
20%
40%
60%
80%
100%
Intensive Inpatient(n=112) (n=77)
Outpatient/Intensive OP
(n=836) (n=444)
Source: Table 14, Appendix A.
Percent of Youth Patients Reporting They Were Very or Mostly Satisfied with the Service They Received
Male Female
85.7
96.790.9
97.3
0%
20%
40%
60%
80%
100%
Intensive Inpatient(n=112) (n=77)
Outpatient/Intensive OP
(n=836) (n=444)
Source: Table 14, Appendix A.
Percent of Youth Patients Reporting that Staff Treated Them with Respect All or Some of the Time
Male Female

Patients Speak Out 2009 Group Differences in Youth Patient Satisfaction in Community Treatment Programs
54
Ethnicity/Race and Youth Patient Satisfaction Satisfaction with Service Received
Respect from Staff
* Youth patients identifying themselves as African American, Asian/Pacific Islander, Native American, Hispanic, multiracial, or other were grouped together as non‐Whites, while intensive inpatient and recovery house were grouped together as residential in order to obtain a more even distribution of cases across ethnic/racial groups and treatment modalities.
Within modalities, the proportion of youth patients reporting they were very or mostly satisfied with the service they received was very similar between White and non‐White youth patients.* However, across modalities, youth in residential treatment appeared to be less satisfied overall than those in outpatient, and the difference was moderately significant.
Within modalities, a lowerproportion of non‐White than White youth patients reported that staff treated them with respect all or some of the time, although the differences were small and not significant.* Across modalities, youth in residential treatment reported lower rates of being treated with respect than those in outpatient, and the difference was moderately significant.
86.091.5
85.692.6
0%
20%
40%
60%
80%
100%
Residential(n=114) (n=111)
Outpatient/Intensive OP(n=694) (n=598)
Source: Table 15, Appendix A.
Percent of Youth Patients Reporting They Were Very or Mostly Satisfied with the Service They Received
White Non-White
92.198.0
86.5
95.5
0%
20%
40%
60%
80%
100%
Residential(n=114) (n=111)
Outpatient/Intensive OP(n=694) (n=598)
Source: Table 15, Appendix A.
Percent of Youth Patients Reporting that Staff Treated Them with Respect All or Most of the Time
White Non-White

Patients Speak Out 2009 Group Differences in Youth Patient Satisfaction in Community Treatment Programs
55
Length of Stay in Treatment and Youth Patient Satisfaction Satisfaction with Service Received
Respect from Staff
* For length of stay in treatment and youth patient satisfaction in intensive inpatient and recovery house, see Table 16, Appendix A, page 145.
In outpatient, a lower proportion of youth patients midway through treatment reported being very or mostly satisfied with the service they received than either shorter‐ or longer‐term patients, although the differences were small and not significant.*
Similarly, a lower proportion of mid‐term youth patients reported that staff treated them with respect all or some of the time than either shorter‐ or longer‐term patients, although the differences were small and not significant.*
95.090.7 93.2
0%
20%
40%
60%
80%
100%
30 Daysor Less(n=299)
31 - 60Days
(n=172)
Over 60Days
(n=556)
Source: Table 16, Appendix A.
Percent of Youth Patients Reporting They Were Very or Mostly Satisfied with the Service They Received in Outpatient
Treatment
98.395.3 97.5
0%
20%
40%
60%
80%
100%
30 Daysor Less(n=229)
31 - 60Days
(n=172)
Over 60Days
(n=558)
Source: Table 16, Appendix A.
Percent of Youth Patients Reporting That Staff Treated Them with Respect All or Some of the Time in Outpatient Treatment

Patients Speak Out 2009 Group Differences in Youth Patient Satisfaction in Community Treatment Programs
56
Source of Funding and Youth Patient Satisfaction Satisfaction with Service Received
Respect from Staff
Regardless of modality, a lower proportion of publicly funded youth patients reported they were very or mostly satisfied with the service they received than privately paying youth patients, although the differences were small and not significant.
In outpatient programs, similar levels of privately paying and publicly funded youth patients reported that staff treated them with respect all or some of the time. In residential treatment, a lower proportion of publicly funded youth patients reported that staff treated them with respect all or some of the time than privately paying patients, although the difference was small and not significant.
87.595.5
86.393.2
0%
20%
40%
60%
80%
100%
Residential(n=56) (n=117)
Outpatient/Intensive OP
(n=268) (n=561)
Source: Table 17, Appendix A.
Percent of Youth Patients Reporting They Were Very or Mostly Satisfied with the Service They Received
Private Public
92.698.5
88.9
97.7
0%
20%
40%
60%
80%
100%
Residential(n=56) (n=117)
Outpatient/Intensive OP
(n=268) (n=561)
Source: Table 17, Appendix A.
Percent of Youth Patients Reporting that Staff Treated Them with Respect All or Some of the Time
Private Public

Patients Speak Out 2009
57
Five‐Year Trend in Youth Patient Satisfaction in Community Treatment Programs

Patients Speak Out 2009
58

Patients Speak Out 2009 Five‐Year Trend in Youth Patient Satisfaction in Community Treatment Programs
59
Satisfaction with Service Received
Respect from Staff
In residential treatment, the proportion of youth patients reporting they were very or mostly satisfied with the service they received fluctuated over the course of five years with the level rising moderately from 82 percent in 2007 to 86 percent in 2009. In outpatient, the rates have stayed at nearly similar levels.
In residential treatment, the percentage of youth patients reporting that staff treated them with respect all or some of the time rose from 81 percent in 2007 to 89 percent in 2009. In outpatient programs, the rates have remained at nearly equal levels over the course of five years.
90.491.7
81.9
90.889.6
91.9
81.9
91.9
85.8
92.1
60%
65%
70%
75%
80%
85%
90%
95%
Residential(n=208) (n=210) (n=270) (n=238) (n=226)
Outpatient/Intensive OP(n=1256) (n=1272) (n=1254) (n=1141) (n=1315)
Source: Table 18a-b, Appendix A.
2004 2005 2006 2007 2009
92.3
96.7
89.5
97.0
88.1
96.7
81.1
96.8
89.4
96.6
60%
65%
70%
75%
80%
85%
90%
95%
100%
Residential(n=208) (n=210) (n=270) (n=238) (n=226)
Outpatient/Intensive OP(n=1256) (n=1272) (n=1254) (n=1141) (n=1315)
Source: Table 18a-b, Appendix A.
2004 2005 2006 2007 2009

Patients Speak Out 2009
60

Patients Speak Out 2009
61
Part 2: Correctional Treatment Programs
Patient Satisfaction in Department of Corrections (DOC) Treatment Programs by Modality

Patients Speak Out 2009
62

Patients Speak Out 2009 Patient Satisfaction in DOC Treatment Programs by Modality
63
In an overall, general sense, how satisfied are you with the service you have received?
In general, how satisfied are you with the comfort and appearance of this facility?
* Results for DOC recovery house treatment should be interpreted with caution due to the comparatively smaller number of completed surveys returned. ** Operated in DOC work release facilities. *** Operated in DOC institutions.
Overall, 89 percent of DOC patients reported that they were very or mostly satisfied with the service they received. Lowest rates of being very satisfied were reported in recovery house and long‐term residential programs.*
DOC provides treatment in an institutional setting. Overall, 80 percent of DOC patients reported that they were very or mostly satisfied with the comfort and appearance of their facility.* Lowest rates of being very satisfied occurred in recovery house and long‐term residential.
21.4
10.3
46.1
37.8
52.4
62.3
47.951.1
9.5
20.9
3.47.27.1 6.3
2.0 3.0
0%
10%
20%
30%
40%
50%
60%
70%
DOC RecoveryHouse**(n=42)
DOC Long-termResidential***
(n=350)
DOC Outpatient/Intensive OP
(n=1250)
DOCOverall
(n=1642)
Source: Table 19, Appendix A.
Very satisfied Mostly satisfied Dissatisfied Very dissatisfied
88.9
94.0
72.6
73.8
Overall
OP/IOP
Long-termResidential
RecoveryHouse
Percent Reporting Very or Mostly Satisfied
19.0
5.4
28.6
23.4
61.959.4
55.4 56.5
16.7
26.3
11.514.8
0.0
8.6
3.7 4.6
0%
10%
20%
30%
40%
50%
60%
70%
DOC RecoveryHouse**(n=42)
DOC Long-termResidential***
(n=350)
DOC Outpatient/Intensive OP
(n=1250)
DOCOverall
(n=1642)
Source: Table 19, Appendix A.
Very satisfied Mostly satisfied Dissatisfied Very dissatisfied
79.9
84.1
64.9
81.0
Overall
OP/IOP
Long-termResidential
RecoveryHouse
Percent Reporting Very or Mostly Satisfied

Patients Speak Out 2009 Patient Satisfaction in DOC Treatment Programs by Modality
64
Would you say our staff treated you with respect?
How do you rate the helpfulness of the group sessions?
* Results for DOC recovery house treatment should be interpreted due to the comparatively smaller number of completed surveys returned. ** Operated in DOC work release facilities. *** Operated in DOC institutions.
Overall, 94 percent of DOC patients reported that staff treated them with respect all or some of the time.*
Overall, 93 percent of DOC patients rated group sessions as very or somewhat helpful.* Less than a third of long‐term residential and less than a fourth of DOC recovery house patients rated group sessions as very helpful.
54.8
36.3
76.5
67.4
35.7
50.0
20.2
27.0
7.1
12.0
2.14.3
0.0 1.1 0.7 0.80%
10%
20%
30%
40%
50%
60%
70%
80%
DOC RecoveryHouse**(n=42)
DOC Long-termResidential***
(n=350)
DOC Outpatient/Intensive OP
(n=1250)
DOCOverall
(n=1642)Source: Table 19, Appendix A.
All of the time Some of the time Little of the time Never
94.3
96.7
86.3
90.5
Overall
OP/IOP
Long-termResidential
RecoveryHouse
Percent Reporting All or Some of the Time
23.8
30.3
58.9
51.950.0
57.7
35.5
40.6
21.4
8.3
3.8 5.2
0.02.3 0.6 0.9
0%
10%
20%
30%
40%
50%
60%
70%
DOC RecoveryHouse**(n=42)
DOC Long-termResidential***
(n=350)
DOC Outpatient/Intensive OP
(n=1250)
DOCOverall
(n=1642)
Source: Table 19, Appendix A.
Very helpful Somewhat helpful Not helpful Made things worse
92.5
94.4
88.0
73.8
Overall
OP/IOP
Long-termResidential
RecoveryHouse
Percent Reporting Very or Somewhat Helpful

Patients Speak Out 2009 Patient Satisfaction in DOC Treatment Programs by Modality
65
How do you rate the helpfulness of the individual counseling?
If you were to seek help again, would you come back to this program?
* Results for DOC recovery house treatment should be interpreted with caution due to the comparatively smaller number of completed surveys returned. ** Operated in DOC work release facilities. *** Operated in DOC institutions.
Overall, 84 percent of DOC patients rated individual counseling as very or somewhat helpful.* Nearly two out five in recovery house and long‐term residential rated individual counseling as very helpful.
The DOC provides treatment in a highly restrictive setting. Overall, 64 percent of DOC patients said that they would definitely or probably return to the same program if they were to seek help again.*
38.1 39.4
59.1
54.4
31.0
39.7
26.629.5
7.1
12.0
3.55.4
0.02.9
0.3 0.90%
10%
20%
30%
40%
50%
60%
70%
DOC RecoveryHouse**(n=42)
DOC Long-termResidential***
(n=350)
DOC Outpatient/Intensive OP
(n=1250)
DOCOverall
(n=1642)
Source: Table 19, Appendix A.
Very helpful Somewhat helpful Not helpful Made things worse
83.9
85.7
79.1
69.0
Overall
OP/IOP
Long-termResidential
RecoveryHouse
Percent Reporting Very or Somewhat Helpful
19.0
6.9
36.9
30.0
42.9
24.0
37.034.3
16.7
30.0
15.218.419.0
37.1
9.3
15.5
0%
10%
20%
30%
40%
50%
60%
DOC RecoveryHouse** (n=42)
DOC Long-termResidential***
(n=350)
DOC Outpatient/Intensive OP
(n=1250)
DOCOverall
(n=1642)Source: Table 19, Appendix A.
Yes, definitely Yes, probably No, probably not No, definitely not
64.4
73.8
30.9
61.9
Overall
OP/IOP
Long-termResidential
RecoveryHouse
Percent Reporting Yes, Definitely orYes, Probably

Patients Speak Out 2009 Patient Satisfaction in DOC Treatment Programs by Modality
66
Did you need legal services?
If yes, how helpful were we in assisting you identify and find legal services?
* Offenders participating in DOC chemical dependency treatment are involved with the criminal justice system and may be expressing a need for legal services beyond the ability of the contracted treatment provider to address. Treatment staff is required to redirect offenders to their DOC counselors for assistance. ** Operated in DOC work release facilities. *** Operated in DOC institutions.
One out of five DOC patients reported they needed legal services.* More DOC patients in recovery house and long‐term residential said they needed legal services than in outpatient.
Overall, half of DOC patients needing legal services reported that their program was very or somewhat helpful in assisting them to identify and find legal services.* The chart excludes recovery house because it had only 16 cases.
38.1
30.0
17.120.4
61.9
69.7
82.178.9
0%
10%
20%
30%
40%
50%
60%
70%
80%
90%
DOC RecoveryHouse**(n=41)
DOC Long-termResidential***
(n=350)
DOC Outpatient/Intensive OP
(n=1250)
DOCOverall
(n=1642)
Source: Table 20, Appendix A.
Yes No
4.8
29.4
20.6
28.6 29.4 28.427.6
15.4
21.2
39.0
22.0
27.5
0%
10%
20%
30%
40%
50%
DOC Long-termResidential***
(n=105)
DOC Outpatient/Intensive OP
(n=214)
DOCOverall(n=335)
Source: Table 20, Appendix A.
Very helpful Somewhat helpful Not very helpful Not helpful at all
49.0
58.9
33.3
Overall
OP/IOP
Long-termResidential
Percent Reporting Very or Somewhat Helpful

Patients Speak Out 2009 Patient Satisfaction in DOC Treatment Programs by Modality
67
Did you need medical services?
If yes, how helpful were we in assisting you to identify and find medical services?
* The DOC provides medical services to incarcerated offenders at the direction of DOC policy and medical staff. Offenders in the community are not eligible for DOC‐funded medical services and, hence, are directed to publicly or privately funded resources. ** Operated in DOC work release facilities. *** Operated in DOC institutions.
While a third of DOCpatients overall reported a need for medical services, two thirds of those in recovery house and long‐term residential needed medical services.*
Fifty‐six percent of DOC patients who needed medical services rated their program as very or somewhat helpful in assisting them to identify and find medical services.* The chart excludes recovery house because it had only 27 cases.
64.366.9
23.9
34.135.7
32.6
74.8
64.8
0%
10%
20%
30%
40%
50%
60%
70%
80%
DOC RecoveryHouse**(n=42)
DOC Long-termResidential***
(n=350)
DOC Outpatient/Intensive OP
(n=1250)
DOCOverall
(n=1642)
Source: Table 20, Appendix A.
Yes No
19.7
29.1
24.8
33.8
27.8
31.2
21.419.4 20.4
23.1
18.720.0
0%
10%
20%
30%
40%
DOC Long-termResidential***
(n=234)
DOC Outpatient/Intensive OP
(n=299)
DOCOverall(n=560)
Source: Table 20, Appendix A.
Very helpful Somewhat helpful Not very helpful Not helpful at all
56.1
56.9
53.4
Overall
OP/IOP
Long-termResidential
Percent Reporting Very or Somewhat Helpful

Patients Speak Out 2009 Patient Satisfaction in DOC Treatment Programs by Modality
68
Did you need family services?
If yes, how helpful were we in assisting you to identify and find family services?
* Incarcerated offenders are separated from their families by nature of their circumstances. Those in the community have often lost contact with family due to criminal activity. ** Operated in DOC work release facilities. *** Operated in DOC institutions.
Two out of five DOC long‐term residential patients reported a need for family services compared to one out of five DOC patients overall.*
Close to 60 percent of DOC patients reporting a need for family services, overall rated their program as very or somewhat helpful in assisting them to identify and find family services. The chart excludes recovery house because it had only 12 cases.
28.6
44.0
13.1
20.1
71.4
54.6
85.6
78.6
0%
10%
20%
30%
40%
50%
60%
70%
80%
90%
DOC RecoveryHouse**(n=42)
DOC Long-termResidential***
(n=350)
DOC Outpatient/Intensive OP
(n=1250)
DOCOverall
(n=1642)
Source: Table 20, Appendix A.
Yes No
34.4
29.931.531.2
24.4
27.9
16.218.3 17.6
16.2
22.619.7
0%
10%
20%
30%
40%
50%
DOC Long-termResidential***
(n=154)
DOC Outpatient/Intensive OP
(n=164)
DOCOverall(n=330)
Source: Table 20, Appendix A.
Very helpful Somewhat helpful Not very helpful Not helpful at all
59.4
54.3
65.6
Overall
OP/IOP
Long-termResidential
Percent Reporting Very or Somewhat Helpful

Patients Speak Out 2009 Patient Satisfaction in DOC Treatment Programs by Modality
69
Did you need mental health services?
If yes, how helpful were we in assisting you to identify and find mental health services?
* The DOC is limited to providing mental health services to incarcerated offenders only. ** Operated in DOC work release facilities. *** Operated in DOC institutions.
More than a third of DOC long‐term residential patients reported a need for mental health services compared to nearly a fourth of DOC patients overall.
Sixty‐two percent of DOC patients who needed mental health services rated their program as very or somewhat helpful in assisting them to identify and find mental health services.* A third rated their program as very helpful. The chart excludes recovery house because it had only 21 cases.
50.0
36.0
19.924.1
50.0
62.3
79.374.9
0%
10%
20%
30%
40%
50%
60%
70%
80%
90%
DOC RecoveryHouse**(n=42)
DOC Long-termResidential***
(n=350)
DOC Outpatient/Intensive OP
(n=1250)
DOCOverall
(n=1642)
Source: Table 20, Appendix A.
Yes No
33.3
35.7 34.8
27.024.9
27.0
20.6
16.1 16.918.3
16.9 16.9
0%
10%
20%
30%
40%
DOC Long-termResidential***
(n=126)
DOC Outpatient/Intensive OP
(n=249)
DOCOverall(n=396)
Source: Table 20, Appendix A.
Very helpful Somewhat helpful Not very helpful Not helpful at all
61.9%
60.6%
60.3%
Overall
OP/IOP
Long-termResidential
Percent Reporting Very or Somewhat Helpful

Patients Speak Out 2009 Patient Satisfaction in DOC Treatment Programs by Modality
70
Did you need educational or vocational services?
If yes, how helpful were we in assisting you to identify and find educational or vocational services?
* Offenders are referred to educational and vocational programs during their incarceration as per DOC policy. ** Operated in DOC work release facilities. *** Operated in DOC institutions.
While less than a third of DOC patients overall said they needed educational or vocational services, close to two –thirds in long‐term residential reported a need for the same services.
About two‐thirds of DOC patients needing educational or vocational services rated their program as very or somewhat helpful in assisting them to identify and find educational or vocational services.* About a third rated their program as very helpful. The chart excludes recovery house because it had only 16 cases.
38.1
61.7
22.1
30.9
61.9
37.4
77.0
68.1
0%
10%
20%
30%
40%
50%
60%
70%
80%
90%
DOC RecoveryHouse**(n=42)
DOC Long-termResidential***
(n=350)
DOC Outpatient/Intensive OP
(n=1250)
DOCOverall
(n=1642)
Source: Table 20, Appendix A.
Yes No
33.832.2 32.7
33.8
27.9
30.5
9.3
13.412.0
20.418.8 19.5
0%
10%
20%
30%
40%
DOC Long-termResidential***
(n=216)
DOC Outpatient/Intensive OP
(n=276)
DOCOverall(n=508)
Source: Table 20, Appendix A.
Very helpful Somewhat helpful Not very helpful Not helpful at all
63.2
60.1
67.6
Overall
OP/IOP
Long-termResidential
Percent Reporting Very or Somewhat Helpful

Patients Speak Out 2009 Patient Satisfaction in DOC Treatment Programs by Modality
71
Did you need employment services?
If yes, how helpful were we in assisting you to identify and find employment services?
* In long‐term residential, jobs are available to participants during treatment. Those progressing to subsequent or later phases of treatment are increasingly eligible for work programs. ** Operated in DOC work release facilities. *** Operated in DOC institutions.
While overall more than a third of DOC patients reported a need for employment services, two‐thirds of recovery house and long‐term residential patients needed employment services.
Fifty‐two percent of DOC patients who needed employment services rated their program as very or somewhat helpful in assisting them to identify and find employment services.* One out of four rated their program as very helpful. The chart excludes recovery house because it had only 28 cases.
66.762.3
27.0
35.633.3
36.6
71.8
63.3
0%
10%
20%
30%
40%
50%
60%
70%
80%
DOC RecoveryHouse**(n=42)
DOC Long-termResidential***
(n=350)
DOC Outpatient/Intensive OP
(n=1250)
DOCOverall
(n=1642)
Source: Table 20, Appendix A.
Yes No
25.7 25.7 25.727.5
25.4 26.2
20.6
17.518.8
24.3
22.223.3
0%
10%
20%
30%
DOC Long-termResidential***
(n=218)
DOC Outpatient/Intensive OP
(n=338)
DOCOverall(n=584)
Source: Table 20, Appendix A.
Very helpful Somewhat helpful Not very helpful Not helpful at all
51.9
51.2
53.2
Overall
OP/IOP
Long-termResidential
Percent Reporting Very or Somewhat Helpful

Patients Speak Out 2009 Patient Satisfaction in DOC Treatment Programs by Modality
72
What do you like about this program? Recovery House: Selected Responses
“The area of changing our internal representation of who we are by taking a deeper look at our inner selves and thinking before acting, being conscious of thoughts, making decisions at the same time weighing the consequences.” “The fact that the counselors were ‘human’ in that I could relate to them because they stayed connected with us and treated us with respect.” “I like the fact that they are willing to help in any area you need help in.” “It helps you re‐establish yourself in community.”
Long‐term Residential: Selected Responses
“That I’m coming to understand the levels of change and addiction.” “It’s helped me change my behaviors and love myself again. I see healthy relationships for myself now. I’ve found the real me again without drugs.” “I like that there is structure: rights and responsibilities are clear‐cut and non‐negotiable. I like the process groups.” “Group sessions and learning how others have dealt with their addictions. Interaction with certain CDPs.” “That I can work on my relapse prevention.” “That I get to address my needs and learn about and how to change my destructive behaviors.” “I like the CDP and the helpful nature of most people. I feel like I might succeed this time.”

Patients Speak Out 2009 Patient Satisfaction in DOC Treatment Programs by Modality
73
Outpatient/Intensive Outpatient: Selected Responses
“I really like our facilitator – she’s very understanding and makes it very easy to open up to her.” “(Name of counselor) is obviously genuinely interested in my recovery. He is helpful with my problems and gives me honest feedback even if he’s telling me something about me that I’m not prepared to accept.” “I have an opportunity to give my feedback and get positive feedback toward things that will help me grow in recovery.” “It’s once a week, and you can make suggestions to your treatment plans.” “It’s helped me identify my self‐destructive behavior and learning about my high‐risk situations and how to control them.” “I like to have a group talking so I can process my thoughts.” “Was given lots of tools to learn and the instructor was very good, and he actually does care about us. Most staff are just here to get a paycheck. (Name of counselor) actually does care about all of us.” “I’m learning new ways to stay clean and sober and respect other people.” “The intensity of the program.” “Increases self‐awareness.” “The workbooks are insightful. Counselor was very good at presenting information.” “The relapse prevention counseling really helped me. (Name of counselor) is a good teacher.” “Cutting my time in half.”

Patients Speak Out 2009 Patient Satisfaction in DOC Treatment Programs by Modality
74
Is there anything you would change about this program? Recovery House: Selected Responses
“Yes, I would lessen the structure a little to let people go at their own pace.” “Bus tickets should be made available at least your first couple of weeks here. Funds are very hard at first.” “I would have the counselors do one‐on‐ones and have more depth in getting to the problem that is within each individual. We need to anchor our state to do habitually what’s right, just and fair, by and through disciplining our neurological system.” “The staff needs to be more respectful. They tend to be condescending and rude.” “Some of the phase up requirements, because some people are poor like me and do not have the money to do much in life.”
Long‐term Residential: Selected Responses
“Yes, I would have vocational training, i.e. welding, construction, woodwork, horticulture, electrical, wind, solar, bio‐fuels, plant and tree identification, farming. I believe these would help prepare inmates better for re‐entry.” “Yes, some type of work opportunity in order to save some money so we can have some financial resources immediately available for the people that need it. Or make sure the offenders that are approximately six months away from their early release date are not hindered from going to work release – need the resource to help maintain the work done here in the program.” “That more classes are taught by CDPs.” “Mostly it would be very nice to have current material in our classes. Most material we learn from is at least 10 to 20 years old. Also, there are not enough activities.” “The dorms, the mattresses, medical treatment; vindictive behavior by other inmates. I think the education classes could be better.”

Patients Speak Out 2009 Patient Satisfaction in DOC Treatment Programs by Modality
75
Outpatient/Intensive Outpatient: Selected Responses
“I would request more programming hours and more relapse prevention teaching; also program to go out in the community to get involved in self‐help program.” “Better curriculum.” “New videos. Take out sex offender scenarios. Provide non‐religious treatment program. Provide new workbooks that concentrate upon the inmate instead of his family: family information has no place in this class. Follow the DSM‐IV and ASAM PPM when doing assessments.” “Focus on drug treatment not on unrelated issues.” “Bring back all of the vocational training programs at all institutions.” “That it would target people who really are chemically dependent, not just filling up the class with people who don’t have it in judgment and sentence, and who aren’t chemically dependent.” “Yes, about if you miss one you’re out, that’s a little extreme.” “Just that I would like to see less negative people in here.” “Class smaller and more organized.”

Patients Speak Out 2009
76

Patients Speak Out 2009
77
Adult Patient Satisfaction in Community Compared to DOC Treatment Programs

Patients Speak Out 2009
78

Patients Speak Out 2009 Adult Patient Satisfaction in Community Compared to DOC Treatment Programs
79
Was there a difference in patient satisfaction between community and DOC treatment programs? Satisfaction with Service Received
Respect from Staff
* Note that for DOC, recovery house programs are operated in work release facilities, while long‐term residential programs are operated in institutions.
In recovery house and long‐term residential, a significantly higher proportion of patients in community‐based programs reported that they were very or mostly satisfied with the service they received than patients in DOC programs.* The same result can be observed in outpatient although the difference is small and not significant.
In recovery house, a significantly higher proportion of patients in DOC programs reported that staff treated them with respect all or some of the time than patients in community‐based programs.* The reverse is true in long‐term residential. In outpatient, only a small, insignificant difference can be observed between the two groups.
97.691.8
97.1
73.8 72.6
94.0
0%
20%
40%
60%
80%
100%
Recovery House*(n=41) (n=42)
Long-term Residential*(n=632) (n=350)
Outpatient/Intensive OP(n=14504) (n=1250)
Source: Tables 1 and 19, Appendix A.
Percent of Patients Reporting They Were Very or Mostly Satisfied with Service Received in Community versus DOC
Treatment Programs
Community Programs DOC
78.0
94.098.5
90.586.3
96.7
0%
20%
40%
60%
80%
100%
Recovery House*(n=41) (n=42)
Long-term Residential*(n=632) (n=350)
Outpatient/Intensive OP(n=14505) (n=1250)
Source: Tables 1 and 19, Appendix A.
Percent of Patients Reporting that Staff Treated Them with Respect All or Some of the Time in Community versus DOC
Treatment Programs
Community Programs DOC

Patients Speak Out 2009
80
Patients Speak Out 2009
81
Five‐Year Trend in Patient Satisfaction in DOC Treatment Programs

Patients Speak Out 2009
82

Patients Speak Out 2009 Five‐Year Trend in Adult Patient Satisfaction in DOC Treatment Programs
83
Satisfaction with Service Received
Respect from Staff
* Operated in DOC institutions.
In long‐term residential, the proportion of DOC patients reporting they were very or mostly satisfied with the service they received increased somewhat from 71 percent in 2007 to 73 percent in 2009.* In outpatient, the numbers have remained at similar levels over the course of five years.
Similarly in long‐term residential, the proportion of patients reporting that staff treated them with respect all or some of the time rose slightly from 85 percent in 2007 to 86 percent in 2009.* In outpatient programs, the proportion has remained at nearly similar levels.
83.0
93.087.3
91.5
78.1
93.8
71.0
92.9
72.6
94.0
0%
20%
40%
60%
80%
100%
DOC Long-termResidential*
(n=212) (n=221) (n=301) (n=376) (n=350)
DOC Outpatient/Intensive OP
(n=1024) (n=981) (n=935) (n=945) (n=1250)
Source: Table 22a-b, Appendix A.
2004 2005 2006 2007 2009
96.7 96.693.2 95.5
88.0
96.4
84.6
94.9
86.3
96.7
0%
20%
40%
60%
80%
100%
DOC Long-termResidential*
(n=212) (n=221) (n=301) (n=376) (n=350)
DOC Outpatient/Intensive OP
(n=1024) (n=981) (n=935) (n=945) (n=1250)
Source: Table 22a-b, Appendix A.
2004 2005 2006 2007 2009

Patients Speak Out 2009
84

Patients Speak Out 2009
85
Patient Satisfaction in Juvenile Rehabilitation Administration (JRA) Treatment Programs

Patients Speak Out 2009
86

Patients Speak Out 2009 Patient Satisfaction in JRA Treatment Programs
87
Youth offenders are committed to JRA facilities involuntarily. The JRA provides chemical dependency treatment to youth offenders within a highly supervised institutional setting. JRA youth responses from intensive inpatient and recovery house were combined under one residential category in order to keep confidential the identity of the only recovery house program participating in the survey.
How satisfied are you with the service you have received?
How satisfied are you with the comfort and appearance of this facility?
* These results should be interpreted with caution since there were only 26 patients from JRA outpatient versus 30 in combined recovery house and intensive inpatient treatment completing the survey.
Overall, 91 percent of JRA patients reported that they were very or mostly satisfied with the service they received.* Less than a quarter said they were very satisfied.
Overall, a lower proportion of JRA youth in outpatient reported being very or mostly satisfied with the comfort and appearance of their facility than those in residential treatment.*
20.023.1 21.4
73.3
65.469.6
6.7 7.7 7.1
0.03.8
1.80%
10%
20%
30%
40%
50%
60%
70%
80%
JRA Residential(n=30)
JRA Outpatient/Intenisve OP(n=26)
JRA Overall(n=56)
Source: Table 23, Appendix A.
Very satisfied Mostly satisfied Dissatisfied Very dissatisfied
91.1
88.5
93.3
Overall
JRA OP/IOP
JRA Residential
Percent Reporting Very or Mostly Satisfied
23.3
34.6
28.6
70.0
30.8
51.8
3.3
30.8
16.1
0.03.8
1.80%
10%
20%
30%
40%
50%
60%
70%
80%
JRA Residential(n=30)
JRA Outpatient/Intenisve OP(n=26)
JRA Overall(n=56)
Source: Table 23, Appendix A.
Very satisfied Mostly satisfied Dissatisfied Very dissatisfied
80.4
65.4
93.3
Overall
JRA OP/IOP
JRA Residential
Percent Reporting Very or Mostly Satisfied
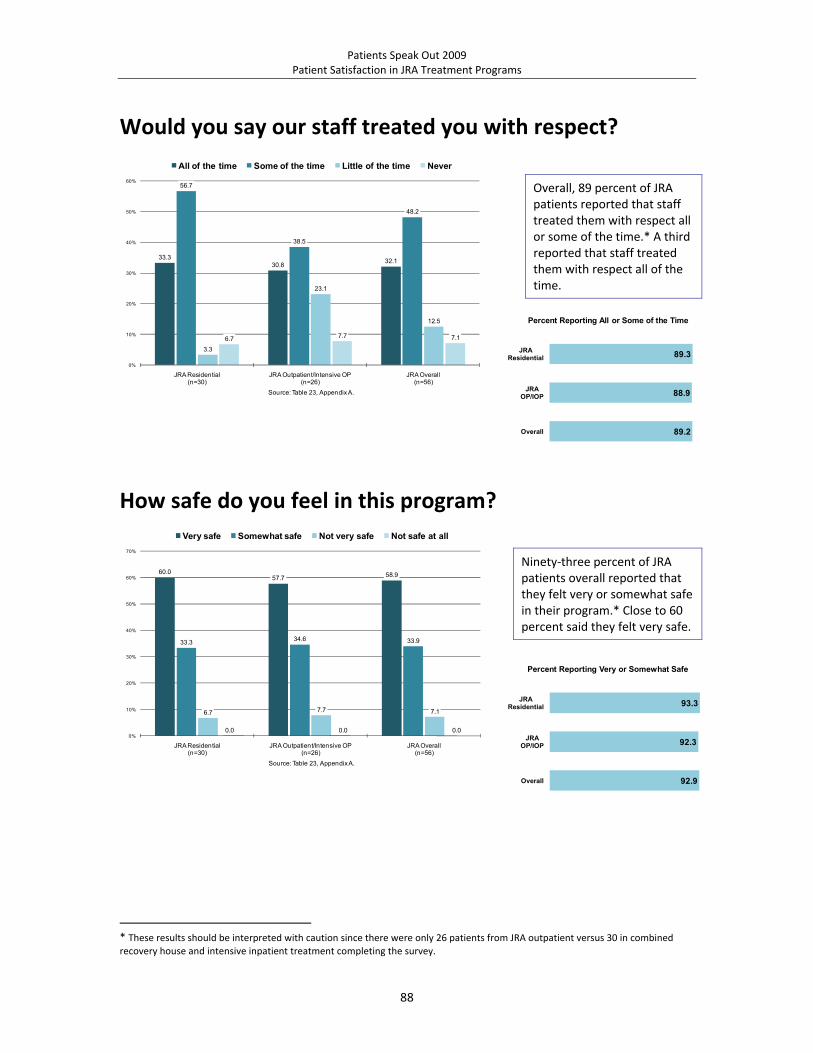
Patients Speak Out 2009 Patient Satisfaction in JRA Treatment Programs
88
Would you say our staff treated you with respect?
How safe do you feel in this program?
* These results should be interpreted with caution since there were only 26 patients from JRA outpatient versus 30 in combined recovery house and intensive inpatient treatment completing the survey.
Overall, 89 percent of JRA patients reported that staff treated them with respect all or some of the time.* A third reported that staff treated them with respect all of the time.
Ninety‐three percent of JRApatients overall reported that they felt very or somewhat safe in their program.* Close to 60 percent said they felt very safe.
33.330.8 32.1
56.7
38.5
48.2
3.3
23.1
12.5
6.7 7.7 7.1
0%
10%
20%
30%
40%
50%
60%
JRA Residential(n=30)
JRA Outpatient/Intensive OP(n=26)
JRA Overall(n=56)
Source: Table 23, Appendix A.
All of the time Some of the time Little of the time Never
89.2
88.9
89.3
Overall
JRA OP/IOP
JRA Residential
Percent Reporting All or Some of the Time
60.057.7 58.9
33.3 34.6 33.9
6.7 7.7 7.1
0.0 0.0 0.00%
10%
20%
30%
40%
50%
60%
70%
JRA Residential(n=30)
JRA Outpatient/Intensive OP(n=26)
JRA Overall(n=56)
Source: Table 23, Appendix A.
Very safe Somewhat safe Not very safe Not safe at all
92.9
92.3
93.3
Overall
JRA OP/IOP
JRA Residential
Percent Reporting Very or Somewhat Safe

Patients Speak Out 2009 Patient Satisfaction in JRA Treatment Programs
89
How helpful are the group sessions?
How helpful is the individual counseling?
* These results should be interpreted with caution since there were only 26 patients from JRA outpatient versus 30 in combined recovery house and intensive inpatient treatment completing the survey.
Overall, 88 percent of JRA patients rated group sessions as very or somewhat helpful.* In residential treatment, fewer JRA youth found group sessions to be very helpful compared to individual counseling below.
Seventy‐five percent overall rated individual counseling as very or somewhat helpful.* More than half considered individual counseling as very helpful.
33.3
46.2
39.3
50.0
46.248.2
13.3
3.8
8.9
0.0 0.0 0.00%
10%
20%
30%
40%
50%
60%
JRA Residential(n=30)
JRA Outpatient/Intensive OP(n=26)
JRA Overall(n=56)
Source: Table 23, Appendix A.
Very helpful Somewhat helpful Not helpful Made things worse
87.5
92.3
83.3
Overall
JRA OP/IOP
JRA Residential
Percent Reporting Very of Somewhat Helpful
56.7
46.2
51.8
26.7
19.2
23.2
6.7
15.4
10.7
0.0 0.0 0.00%
10%
20%
30%
40%
50%
60%
JRA Residential(n=30)
JRA Outpatient/Intensive OP(n=26)
JRA Overall(n=56)
Source: Table 23, Appendix A.
Very helpful Somewhat helpful Not helpful Made things worse
75.0
65.4
83.3
Overall
JRA OP/IOP
JRA Residential
Percent Reporting Very or Somewhat Helpful

Patients Speak Out 2009 Patient Satisfaction in JRA Treatment Programs
90
If you were to seek help again, would you come back to this program?
* These results should be interpreted with caution since there were only 26 patients from JRA outpatient versus 30 in combined recovery house and intensive inpatient treatment completing the survey.
Youth offenders are committed involuntarily to JRA facilities. They receive treatment within an institutional setting. Overall, 52 percent of JRA patients reported they would definitely or probably return to the same program if they were to seek help again.*
20.0 19.2 19.6
36.7
26.9
32.1
16.7
30.8
23.223.3
19.221.4
0%
10%
20%
30%
40%
JRA Residential(n=30)
JRA Outpatient/Intensive OP(n=26)
JRA Overall(n=56)
Source: Table 23, Appendix A.
Yes, definitely Yes, probably No, probably not No, definitely not
51.8
46.2
56.7
Overall
JRA OP/IOP
JRA Residential
Percent Reporting Yes, Definitely orYes, Probably

Patients Speak Out 2009 Patient Satisfaction in JRA Treatment Programs
91
What do you like about this program? Residential Program: Selected Responses
“I like that I’m able to be active in the community, as well as working on my treatment in community support meetings. I really like being able to go to school and play sports, doing all that makes me feel like I’m capable of living a better life.” “The staff and the groups and the way the program is run.” “I like how staff has been so helpful and how supportive they have been.” “More freedom than institutions.” “Working, education, and some activities.” “The food and the staff.” “It’s kind of helpful by giving me skills to use for the outs.”
Outpatient/Intensive Outpatient Program: Selected Responses
“That it helps me get through grief and loss.” “It concentrates on drugs and alcohol, and I liked the way I was treated.” “I like that it shows us movies of real people smoking drugs, and what will really happen to me if I keep using these drugs.” “I get to express what’s happened and what’s on my mind about things. I get to sit down one‐on‐one with someone who will listen and give me advice.” “I like that it shows us movies of real people smoking drugs, and what will really happen to me if I keep using these drugs.” “I like that I can share personal experiences openly. I feel safe in the group, and enjoy learning information that I never knew. The person that directs my tides group is very nice.” “If I complete this I won’t have to do it in the outs.” “I like how I can trust the people in our group and how we actually talk about serious things.” “It helps my addiction.”

Patients Speak Out 2009 Patient Satisfaction in JRA Treatment Programs
92
What do you not like about this program? Residential Program: Selected Responses
“How the rules micromanage my life when I’m in a group home to learn how to live in the community on my own. When I get back out, there won’t be people breathing down my neck saying don’t do that. I’ll have to learn on my own which I should be doing now.” “The staff for the most part is not motivated to help me get ready for the real world.” “There’s nothing to do really, and it’s in the middle of nowhere; not enough activities to do here.” “Some of the staff kind of talk down to us. There is lot of work.” “Overall, the program is cool but the food sucks.” “Drama; people in the cottage; some residents.”
Outpatient/Intensive Outpatient: Selected Responses
“I have to get put down; I get told what to do, wear, eat; I don’t have the rights I should; and there’s a mistake in the program that makes it not work all the time.” “(Name of counselor) talks a lot.” “Being told what to do and when; also how to do things.” “It is long.” “Certain staff.” “Everything; mostly the staff.”

Patients Speak Out 2009
93
Youth Patient Satisfaction in Community Compared to JRA Treatment Programs

Patients Speak Out 2009
94

Patients Speak Out 2009 Youth Patient Satisfaction in Community Compared to JRA Treatment Programs
95
Was there a difference in youth patient satisfaction between community and JRA treatment programs? Satisfaction with Service Received
Respect from Staff
* Comparing the outpatient results between JRA and community‐based programs should be done with caution since JRA provides outpatient treatment in a highly restricted institutional setting and because fewer than 30 completed outpatient surveys were received from JRA.
In residential treatment, a lower proportion of community youth patients reported that they were very or mostly satisfied with the service they received than JRA youth. The reverse is true in outpatient. The differences between the two groups were moderately significant.*
In residential treatment, the proportion of patients reporting that staff treated them with respect was lower in community than in JRA program, and the difference was moderately significant. In outpatient, JRA youth reported a considerably significant lower rate than community youth patients.*
85.8
92.193.3
88.5
60%
80%
100%
Residential(n=226) (n=30)
OP/IOP(n=1315) (n=26)
Source:Table 25, Appendix A.
Percent of Patients Reporting They Were Very or Mostly Satisfied with Service Received in Community Youth versus
JRA Programs
Community Youth JRA
89.4 90.0
96.6
69.2
60%
80%
100%
Residential(n=226) (n=30)
OP/IOP(n=1315) (n=26)
Source: Table 25, Appendix A.
Percent of Patients Reporting that Staff Treated Them with Respect All or Some of the Time in Community Youth versus
JRA Programs
Community Youth JRA

Patients Speak Out 2009
96

Patients Speak Out 2009
97
Five‐Year Trend in Patient Satisfaction in JRA Treatment Programs

Patients Speak Out 2009
98

Patients Speak Out 2009 Five‐Year Trend in Patient Satisfaction in JRA Treatment Programs
99
Satisfaction with Service Received
Respect from Staff
* These results should be interpreted with caution because fewer than 60 completed surveys were received from JRA in 2009.
In residential treatment,the percentage of JRA patients reporting that they were very or mostly satisfied with the service they received rose from 84 percent in 2007 to 93 percent in 2009, while in outpatient the level rose from 82 percent to 89 percent during the same time interval.*
In outpatient treatment, asignificantly lower proportion reported being treated with respect all or some of the time in 2009 than in 2007. In residential treatment, the proportion has remained near or at 90 percent in 2007 and 2009.*
70.565.2
75.4 73.2
60.0
66.7
83.981.5
93.388.5
0%
20%
40%
60%
80%
100%
Residential(n=61) (n=61) (n=65) (n=56) (n=30)
Outpatient/Intensive OP(n=23) (n=41) (n=24) (n=27) (n=26)
Source: Table 26a-b, Appendix A.
2004 2005 2006 2007 2009
67.269.6
85.2
73.276.9
70.8
89.3 88.990.0
69.2
0%
20%
40%
60%
80%
100%
Residential(n=61) (n=61) (n=65) (n=56) (n=30)
Outpatient/Intensive OP(n=23) (n=41) (n=24) (n=27) (n=26)
Source: Table 26a-b, Appendix A.
2004 2005 2006 2007 2009

Patients Speak Out 2009
100

Patients Speak Out 2009
101
Treatment Providers Value the Results of the Patient Satisfaction Survey
Agencies that participate in the statewide patient satisfaction survey receive a confidential copy of their results. To understand how agencies benefit from the survey, DBHR asked treatment providers that participated in the 2007 survey to describe how they used their results. The following are some of their responses.
“The DBHR patient satisfaction survey is used by the Dependency Health
Services (DHS) as a measurement tool for quality improvement and Joint Commission accreditation. The data provided in the survey are beneficial in structuring programs to meet client needs and identify staff training needs. The statewide data allow DHS to compile historic information and measure progress. The value of this information is a critical part of the yearly reporting process to Leadership and Board of Directors. The data are extremely valuable to our agency and we plan to continue participating in any upcoming surveys.”
Michael Cunningham
Director of CD Programs Dependency Health Services
“Recovery Centers of King County (RCKC) utilizes the results to evaluate the
needs of our patients. They are also used to assess patient satisfaction with basic and newly added program components and to review where we are in relation to other similar programs in the state. The results were carefully evaluated by each of the program coordinators and were used to provide positive and constructive feedback to the staff. The 2007 results showed that 87.9% of our intensive inpatient, 97.5% of our Kent, and 89% of our Seattle patients were either very satisfied or mostly satisfied with our services. The report indicated that between 48% ‐ 73% of our patients at all three sites found the group sessions very helpful and 49% ‐ 66% found the individual counseling very helpful. RCKC recognizes that that there is always room for improvement which motivates it to implement regular internal satisfaction surveys to gather regular feedback and respond quickly to comments or suggestions if possible. The internal satisfaction survey allows RCKC to monitor the temporary projects that are conducted at the agency and determine whether we need to prolong the project or discontinue it. Due to the results from the DBHR survey, the Kent site continues to provide specialized treatment to specific groups, such as specific drug related groups: methamphetamine and marijuana weekly groups.”
Jessica DiCenzo
Research Coordinator Recovery Centers of King County
Patients Speak Out 2009 Treatment Providers Value the Results of the Patient Satisfaction Survey
102
“Kitsap Mental Health Services (KMHS) Pathways Program took the following actions as a result of the 2007 patient satisfaction survey:
• We implemented an additional layer of screening and informed consent about
our capability of addressing DUI and Deferred Prosecution Status to clarify this for clients so there is no confusion or expectation that we will provide DUI assessment and treatment.
• We have individualized our family component to offer more flexibility in serving
families and or family members.
• We continue to work with clients to find educational or vocational options and have partnered with our Community Integration and Vocational Program to better assist clients with this goal. In addition, we have offered a Peer Group Leader Role as part of a client’s ongoing recovery journey to assist them in building confidence and skill in recovery as well as to generalize these skills in the workplace or in a role as Life Coach at our agency.
• We have utilized the results in our annual Quality Program Review Presentation
to the Executive Leadership and Board of Directors.”
Cheryl Mogensen, MA, CDP Coordinator, Co‐occurring Disorders Program
Kitsap Mental Health Services
“We used the 2007 Patient Satisfaction Survey results to improve our client care in several ways. We were able to see what parts of each program we provided needed adjusting to better serve the clients. What we have seen as a result of those changes is that all of our groups are full, and we have wait lists now due to clients remaining in groups and completing treatment. We have been able to begin a couple of new groups to suit the needs of our clients in Aftercare and Suboxone. We updated our Suboxone program so there are now three phases to the two‐year program with each phase moving toward the client being off Suboxone completely and remaining in stable recovery. We also added some staff training to our calendar that has been very fruitful for our counselors and program. All in all, we have been able to become a tighter, more professional program with more clients completing treatment and less recidivism. Thank you for making this happen.”
Susan Cummings, CDP, ICADC, NBCC
Clinical Supervisor Lummi Counseling Services
“I always use the results as a springboard for change. We discuss the outcomes with staff and formulate plans to address areas of need.”
Corky Hundahl, CDP
Administrator Phoenix Recovery Services, LLC

Patients Speak Out 2009 Treatment Providers Value the Results of the Patient Satisfaction Survey
103
“The results of the survey were used to look at how we could be more customer‐oriented and how we could ensure clients to feel more satisfied with the services they received as well as feeling that they were in a safe environment. Our focus was on training staff to adopt a more therapeutic approach with the clients instead of a punitive approach. We also look at our approach in dealing with client safety and took a less tolerant approach with these issues.”
Michael Ott Inpatient Director
Daybreak Youth Services
“I always look forward to the results of the survey. When doing a comparison with prior survey results, we can identify areas of improvement and new or ongoing areas that may need to be addressed to improve services. My goals are always about process and service improvement that benefits both the consumers of our services and the agency so the survey is helpful in that analysis. I also like to review the results with staff. In most instances it is very positive feedback to the individuals who work very hard doing this work.”
Carole Hayes Outpatient Treatment Director
Evergreen Manor “The patient satisfaction survey results are very beneficial to our agency. The results assist our organization to identify areas of improvement and include the patient voice throughout the different levels of the organization. The survey results are discussed with senior management, the Board, and the direct service staff. New service strategies are developed and implemented as appropriate. The survey results are used to train our youth, adult substance abuse staff and front desk personnel on how to improve services to our clients. The data are used when writing proposals, marketing the program, and training managers on the strengths and areas of improvement for Consejo.”
Mario E. Paredes Executive Director
Consejo Counseling and Referral Service
“There was a decrease in patients who reported feeling respected by staff all of the time to some of the time. We focused on training staff to utilize de‐escalation skills to deal with potentially volatile situations to improve that area.’’
Angela Grout Treatment Administrator
Seadrunar

Patients Speak Out 2009 Treatment Providers Value the Results of the Patient Satisfaction Survey
104
“We did use the information from the 2007 Statewide Patient Satisfaction Survey as part of our ongoing QI process. I found many of the patients commented on their appreciation of our culturally competent treatment. This reaffirmed that we were making a positive difference in the lives of many Native Americans. We continue to train new staff on cultural practices.”
Debbie Norberg, BS, CDP Clinical Supervisor
Cowlitz Tribal Treatment
“By reviewing the survey results, I was able to see what was working
for patients and what methods and techniques were less effective. For example, patients seemed to respond better to treatment when group process was interactive, versus didactic, and thereby improve the quality of care and patient treatment outcome. When I shared the survey results with patients, they were able to visualize that their voices were heard and their opinions mattered. In the long‐run, the satisfaction survey helped us with program curriculum planning and development, and staff training.”
Lindsy McGowan‐Anderson, MS, CDP, MAC
Owner Cascadia Addiction Treatment Services
“One of the things I had determined from a previous survey was that our patients did not understand the definition of the words ‘respect’ and ‘disrespect’. One patient explained to me that for some of our patients any kind of holding them accountable in anyway was translated into ‘disrespect’. So we did a training on respect, first for the staff and then for patients. We defined what it is and what the behaviors might be that would indicate both respect and disrespect. We gave examples and elicited examples. We made it clear to the staff what behavior was disrespectful and that we expect them to be respectful of patients at all times, regardless of how stressed or tired they are. I believe this has helped us, at least, to obtain a more accurate indication of how patients feel the staff is treating them.”
Jennie Lindberg
Residential Services Clinical Manager Evergreen Manor

Patients Speak Out 2009
105
Technical Notes What instruments were used in the statewide survey?
The instruments used in the survey were the Adult Patient Satisfaction Survey and the Youth Patient Satisfaction Survey. These surveys are available in English, Spanish, Vietnamese, and Cambodian languages (see Appendix B, pages 169‐186).
Who administered the survey, to whom, and when?
The survey was administered by participating DBHR‐certified alcohol and drug treatment providers to adult and youth patients who were receiving treatment during the week of March 23, 2009.
How were agencies selected to participate in the statewide survey?
Agencies volunteered to participate in the survey. Agencies must be DBHR‐certified for any of the following treatment services: intensive inpatient, recovery house, long‐term residential, outpatient/intensive outpatient, or opiate substitution. An initial list of 548 treatment agencies meeting this requirement was generated on December 1, 2008, using data from the DBHR chemical dependency management information system, Treatment and Assessment Report Generation Tool (TARGET). Using this initial list, invitations were mailed on January 5, 2009, to directors requesting their agency to participate in the statewide survey to be held during the week of March 23, 2009. The invitation included: (a) a cover letter stating the purpose of the survey and the offer that they will receive a confidential report of their agency’s results; (b) copies of the survey instruments; (c) a copy of the “Guidelines for Administration” (see Appendix B, page 187); and (d) a confirmation form to be returned to DBHR. Agencies interested in participating were asked to indicate on the confirmation form the type and number of surveys they will need during the week of the survey. Follow‐up calls were made to agencies that have not returned their confirmation form right up to the week before the survey. It was through these follow‐up calls that information regarding the agency’s certification status (for example: closed, suspended) and the service they provide was verified. As a result, 31 agencies were dropped from the initial list either because they have been suspended, have closed, were not offering any of the treatment services as required for participation in the survey, or were not actually providing any treatment services but have chosen to retain their certification. The process of eliminating non‐qualifying or inactive treatment agencies produced a final number of 517 agencies that during the week of the survey were actively operating and were offering the aforementioned treatment services.
How many agencies participated in the survey?
The table below shows that 490 agencies, or 95 percent, of the 517 certified treatment centers, identified to have been actively operating in Washington State and offering any of the
Agency Participation by Funding Status
Participation Status Public*(n=309)
Private(n=208)
Total (n=500)
Participating 302 (97.7%) 188 (90.4%) 490 (94.8%)
Non‐participating 7 (2.3%) 20 (9.6%) 27 (5.2%)
*Publicly‐funded agencies provide a certified treatment service funded by any of the following sources: city, county, federal, tribal, or state.

Patients Speak Out 2009 Technical Notes
106
following treatment services, such as, intensive inpatient, recovery house, long‐term residential, outpatient/intensive outpatient, or opiate substitution, volunteered to administer the survey. Among the 309 public treatment agencies 302, or 97.7 percent, participated in the survey. Out of the 208 agencies identified as private 188, or 90.4 percent, volunteered to participate in the survey.
How did treatment agencies administer the survey?
Participating providers were asked to follow the “Guidelines for Administration,” a one‐page document prepared by DBHR. It provides suggestions and other helpful tips on how providers can administer the survey in their agency (see Appendix B, page 187). DASA provided treatment agencies with copies of the survey and pencils for the use of patients.
How were patients selected to participate in the survey?
Participating agencies asked all of their patients who were receiving treatment during the week of March 23, 2009, to complete the survey. According to a study conducted by DBHR in 1998, the sampling method most commonly used by states that have a statewide, standardized system of assessing patient satisfaction is to give the survey to all patients who are participating in treatment during a designated week of the year.* This method results in a snapshot or cross‐section of patients receiving chemical dependency treatment in the state for a given week during the year.
Who was responsible for analyzing the survey data?
Participating treatment agencies returned completed surveys to DBHR. Completed surveys were scanned at the University of Washington Office of Educational Assessment. At DBHR, Felix Rodriguez, Ph.D., oversaw the statewide administration of the survey, analyzed the survey data, and wrote the statewide report. Provider‐level and county‐level reports were also produced. Participating agencies receive a confidential copy of their provider‐level report. County alcohol and drug coordinators receive copies of the county‐level reports.
* Rodriguez, F.I., Krupski, A., Wrede, A.F., Malmer, D.W., and Stark K.D. 1998. Assessing Client Satisfaction with Substance Abuse Treatment: What are states doing? Olympia, Washington: Division of Alcohol and Substance Abuse.

Patients Speak Out 2009
107
Appendix A: Tables

Patients Speak Out 2009
108

Patients Speak Out 2009 Appendix A: Results for Community Treatment Programs
109
Table 1 Responses to Questions 1‐6 of the DBHR Adult Patient Satisfaction Survey by Treatment Modality, March 23‐27, 2009
Treatment Modality
Intensive Inpatient
Recovery House
Long‐term Residential OP/IOP
Opiate Substitution* Total
CountColumn
% CountColumn
% CountColumn
% CountColumn
% Count Column
% CountColumn
%
In an overall, general sense, how satisfied are you with the service you have received?
Very satisfied 379 48.0% 14 34.1% 202 32.0% 8795 60.6% 1229 40.7% 10619 55.9%
Mostly satisfied
377 47.7% 26 63.4% 378 59.8% 5294 36.5% 1534 50.8% 7609 40.1%
Subtotal 756 95.7% 40 97.6% 580 91.8% 14089 97.1% 2763 91.6% 18228 96.0%
Dissatisfied 29 3.7% 0 .0% 41 6.5% 267 1.8% 168 5.6% 505 2.7%
Very dissatisfied
4 .5% 1 2.4% 8 1.3% 87 .6% 68 2.3% 168 .9%
Subtotal 33 4.2% 1 2.4% 49 7.8% 354 2.4% 236 7.8% 673 3.5%
Did not respond
1 .1% 0 .0% 3 .5% 61 .4% 19 .6% 84 .4%
Total 790 100.0% 41 100.0% 632 100.0% 14504 100.0% 3018 100.0% 18985 100.0%
In general, how satisfied are you with the comfort and appearance of this facility?
Very satisfied 346 43.8% 23 56.1% 194 30.7% 8578 59.1% 1222 40.5% 10363 54.6%
Mostly satisfied
364 46.1% 18 43.9% 358 56.6% 5446 37.5% 1479 49.0% 7665 40.4%
Subtotal 710 89.9% 41 100.0% 552 87.3% 14024 96.7% 2701 89.5% 18028 95.0%
Dissatisfied 68 8.6% 0 .0% 69 10.9% 342 2.4% 210 7.0% 689 3.6%
Very dissatisfied
9 1.1% 0 .0% 6 .9% 81 .6% 71 2.4% 167 .9%
Subtotal 77 9.7% 0 .0% 75 11.9% 423 2.9% 281 9.3% 856 4.5%
Did not respond
3 .4% 0 .0% 5 .8% 57 .4% 36 1.2% 101 .5%
Total 790 100.0% 41 100.0% 632 100.0% 14504 100.0% 3018 100.0% 18985 100.0%
Would you say our staff treated you with respect?
All of the time
511 64.7% 16 39.0% 298 47.2% 12715 87.7% 1923 63.7% 15463 81.4%
Some of the time
237 30.0% 16 39.0% 296 46.8% 1574 10.9% 898 29.8% 3021 15.9%
Subtotal 748 94.7% 32 78.0% 594 94.0% 14289 98.5% 2821 93.5% 18484 97.4%
Little of the time
31 3.9% 9 22.0% 32 5.1% 114 .8% 144 4.8% 330 1.7%
Never 2 .3% 0 .0% 0 .0% 25 .2% 15 .5% 42 .2%
Subtotal 33 4.2% 9 22.0% 32 5.1% 139 1.0% 159 5.3% 372 2.0%
Did not respond
9 1.1% 0 .0% 6 .9% 76 .5% 38 1.3% 129 .7%
Total 790 100.0% 41 100.0% 632 100.0% 14504 100.0% 3018 100.0% 18985 100.0%
How do you rate the helpfulness of the group sessions?
Very helpful 549 69.5% 11 26.8% 359 56.8% 9511 65.6% 1185 39.3% 11615 61.2%
Somewhat helpful
212 26.8% 27 65.9% 243 38.4% 4236 29.2% 965 32.0% 5683 29.9%
Subtotal 761 96.3% 38 92.7% 602 95.3% 13747 94.8% 2150 71.2% 17298 91.1%
Not helpful 14 1.8% 2 4.9% 20 3.2% 326 2.2% 206 6.8% 568 3.0%
Made things worse
2 .3% 1 2.4% 1 .2% 35 .2% 33 1.1% 72 .4%
Subtotal 16 2.0% 3 7.3% 21 3.3% 361 2.5% 239 7.9% 640 3.4%
Did not receive
8 1.0% 0 .0% 5 .8% 247 1.7% 556 18.4% 816 4.3%
Did not respond
5 .6% 0 .0% 4 .6% 149 1.0% 73 2.4% 231 1.2%
Total 790 100.0% 41 100.0% 632 100.0% 14504 100.0% 3018 100.0% 18985 100.0%
Continued next page.
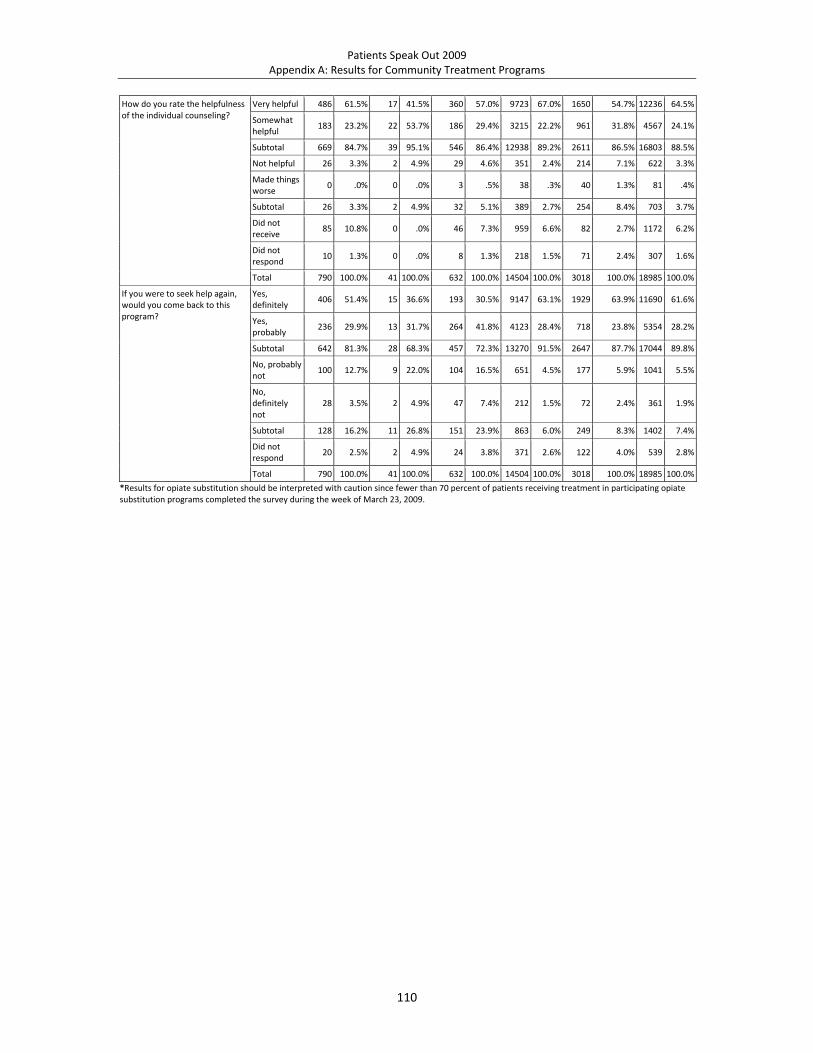
Patients Speak Out 2009 Appendix A: Results for Community Treatment Programs
110
How do you rate the helpfulness of the individual counseling?
Very helpful 486 61.5% 17 41.5% 360 57.0% 9723 67.0% 1650 54.7% 12236 64.5%
Somewhat helpful
183 23.2% 22 53.7% 186 29.4% 3215 22.2% 961 31.8% 4567 24.1%
Subtotal 669 84.7% 39 95.1% 546 86.4% 12938 89.2% 2611 86.5% 16803 88.5%
Not helpful 26 3.3% 2 4.9% 29 4.6% 351 2.4% 214 7.1% 622 3.3%
Made things worse
0 .0% 0 .0% 3 .5% 38 .3% 40 1.3% 81 .4%
Subtotal 26 3.3% 2 4.9% 32 5.1% 389 2.7% 254 8.4% 703 3.7%
Did not receive
85 10.8% 0 .0% 46 7.3% 959 6.6% 82 2.7% 1172 6.2%
Did not respond
10 1.3% 0 .0% 8 1.3% 218 1.5% 71 2.4% 307 1.6%
Total 790 100.0% 41 100.0% 632 100.0% 14504 100.0% 3018 100.0% 18985 100.0%
If you were to seek help again, would you come back to this program?
Yes, definitely
406 51.4% 15 36.6% 193 30.5% 9147 63.1% 1929 63.9% 11690 61.6%
Yes, probably
236 29.9% 13 31.7% 264 41.8% 4123 28.4% 718 23.8% 5354 28.2%
Subtotal 642 81.3% 28 68.3% 457 72.3% 13270 91.5% 2647 87.7% 17044 89.8%
No, probably not
100 12.7% 9 22.0% 104 16.5% 651 4.5% 177 5.9% 1041 5.5%
No, definitely not
28 3.5% 2 4.9% 47 7.4% 212 1.5% 72 2.4% 361 1.9%
Subtotal 128 16.2% 11 26.8% 151 23.9% 863 6.0% 249 8.3% 1402 7.4%
Did not respond
20 2.5% 2 4.9% 24 3.8% 371 2.6% 122 4.0% 539 2.8%
Total 790 100.0% 41 100.0% 632 100.0% 14504 100.0% 3018 100.0% 18985 100.0%
*Results for opiate substitution should be interpreted with caution since fewer than 70 percent of patients receiving treatment in participating opiate substitution programs completed the survey during the week of March 23, 2009.
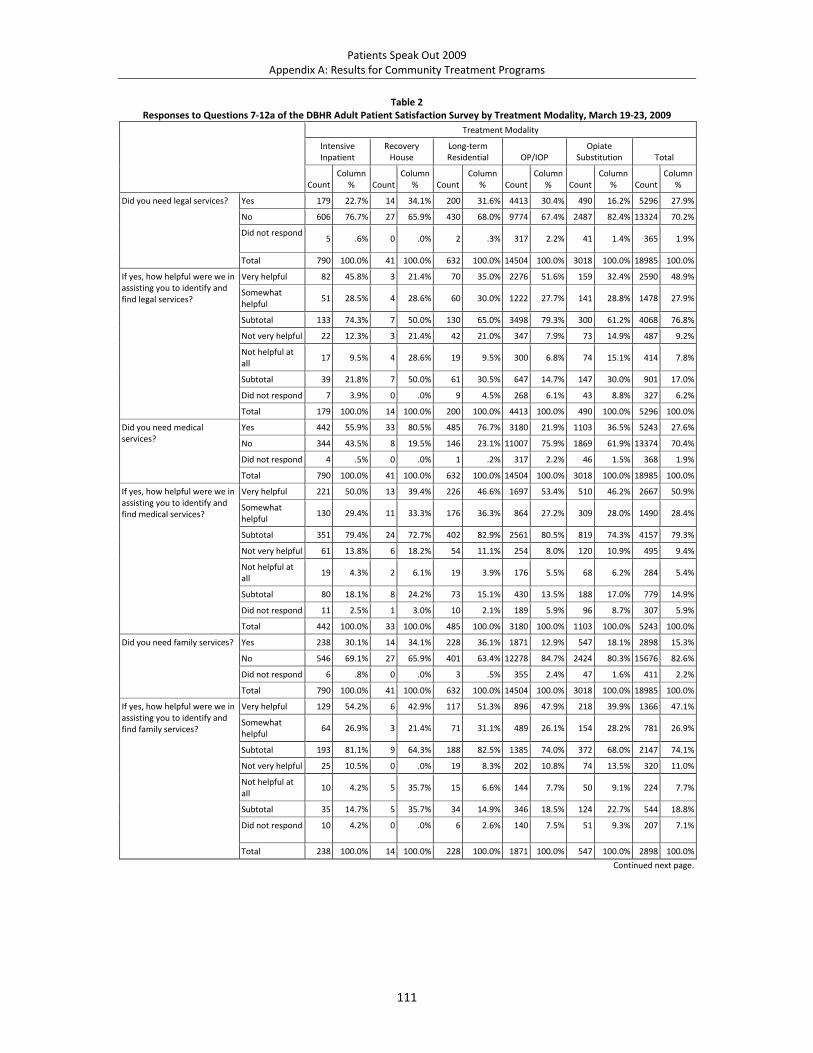
Patients Speak Out 2009 Appendix A: Results for Community Treatment Programs
111
Table 2 Responses to Questions 7‐12a of the DBHR Adult Patient Satisfaction Survey by Treatment Modality, March 19‐23, 2009
Treatment Modality
Intensive Inpatient
Recovery House
Long‐term Residential OP/IOP
Opiate Substitution Total
CountColumn
% CountColumn
% CountColumn
% CountColumn
% Count Column
% CountColumn
%
Did you need legal services? Yes 179 22.7% 14 34.1% 200 31.6% 4413 30.4% 490 16.2% 5296 27.9%
No 606 76.7% 27 65.9% 430 68.0% 9774 67.4% 2487 82.4% 13324 70.2%
Did not respond 5 .6% 0 .0% 2 .3% 317 2.2% 41 1.4% 365 1.9%
Total 790 100.0% 41 100.0% 632 100.0% 14504 100.0% 3018 100.0% 18985 100.0%
If yes, how helpful were we in assisting you to identify and find legal services?
Very helpful 82 45.8% 3 21.4% 70 35.0% 2276 51.6% 159 32.4% 2590 48.9%
Somewhat helpful
51 28.5% 4 28.6% 60 30.0% 1222 27.7% 141 28.8% 1478 27.9%
Subtotal 133 74.3% 7 50.0% 130 65.0% 3498 79.3% 300 61.2% 4068 76.8%
Not very helpful 22 12.3% 3 21.4% 42 21.0% 347 7.9% 73 14.9% 487 9.2%
Not helpful at all
17 9.5% 4 28.6% 19 9.5% 300 6.8% 74 15.1% 414 7.8%
Subtotal 39 21.8% 7 50.0% 61 30.5% 647 14.7% 147 30.0% 901 17.0%
Did not respond 7 3.9% 0 .0% 9 4.5% 268 6.1% 43 8.8% 327 6.2%
Total 179 100.0% 14 100.0% 200 100.0% 4413 100.0% 490 100.0% 5296 100.0%
Did you need medical services?
Yes 442 55.9% 33 80.5% 485 76.7% 3180 21.9% 1103 36.5% 5243 27.6%
No 344 43.5% 8 19.5% 146 23.1% 11007 75.9% 1869 61.9% 13374 70.4%
Did not respond 4 .5% 0 .0% 1 .2% 317 2.2% 46 1.5% 368 1.9%
Total 790 100.0% 41 100.0% 632 100.0% 14504 100.0% 3018 100.0% 18985 100.0%
If yes, how helpful were we in assisting you to identify and find medical services?
Very helpful 221 50.0% 13 39.4% 226 46.6% 1697 53.4% 510 46.2% 2667 50.9%
Somewhat helpful
130 29.4% 11 33.3% 176 36.3% 864 27.2% 309 28.0% 1490 28.4%
Subtotal 351 79.4% 24 72.7% 402 82.9% 2561 80.5% 819 74.3% 4157 79.3%
Not very helpful 61 13.8% 6 18.2% 54 11.1% 254 8.0% 120 10.9% 495 9.4%
Not helpful at all
19 4.3% 2 6.1% 19 3.9% 176 5.5% 68 6.2% 284 5.4%
Subtotal 80 18.1% 8 24.2% 73 15.1% 430 13.5% 188 17.0% 779 14.9%
Did not respond 11 2.5% 1 3.0% 10 2.1% 189 5.9% 96 8.7% 307 5.9%
Total 442 100.0% 33 100.0% 485 100.0% 3180 100.0% 1103 100.0% 5243 100.0%
Did you need family services? Yes 238 30.1% 14 34.1% 228 36.1% 1871 12.9% 547 18.1% 2898 15.3%
No 546 69.1% 27 65.9% 401 63.4% 12278 84.7% 2424 80.3% 15676 82.6%
Did not respond 6 .8% 0 .0% 3 .5% 355 2.4% 47 1.6% 411 2.2%
Total 790 100.0% 41 100.0% 632 100.0% 14504 100.0% 3018 100.0% 18985 100.0%
If yes, how helpful were we in assisting you to identify and find family services?
Very helpful 129 54.2% 6 42.9% 117 51.3% 896 47.9% 218 39.9% 1366 47.1%
Somewhat helpful
64 26.9% 3 21.4% 71 31.1% 489 26.1% 154 28.2% 781 26.9%
Subtotal 193 81.1% 9 64.3% 188 82.5% 1385 74.0% 372 68.0% 2147 74.1%
Not very helpful 25 10.5% 0 .0% 19 8.3% 202 10.8% 74 13.5% 320 11.0%
Not helpful at all
10 4.2% 5 35.7% 15 6.6% 144 7.7% 50 9.1% 224 7.7%
Subtotal 35 14.7% 5 35.7% 34 14.9% 346 18.5% 124 22.7% 544 18.8%
Did not respond 10 4.2% 0 .0% 6 2.6% 140 7.5% 51 9.3% 207 7.1%
Total 238 100.0% 14 100.0% 228 100.0% 1871 100.0% 547 100.0% 2898 100.0%
Continued next page.

Patients Speak Out 2009 Appendix A: Results for Community Treatment Programs
112
Did you need mental health services?
Yes 250 31.6% 17 41.5% 282 44.6% 3260 22.5% 963 31.9% 4772 25.1%
No 535 67.7% 24 58.5% 347 54.9% 10921 75.3% 1998 66.2% 13825 72.8%
Did not respond 5 .6% 0 .0% 3 .5% 323 2.2% 57 1.9% 388 2.0%
Total 790 100.0% 41 100.0% 632 100.0% 14504 100.0% 3018 100.0% 18985 100.0%
If yes, how helpful were we in assisting you to identify and find mental health services?
Very helpful 97 38.8% 11 64.7% 101 35.8% 1794 55.0% 349 36.2% 2352 49.3%
Somewhat helpful
55 22.0% 4 23.5% 104 36.9% 773 23.7% 282 29.3% 1218 25.5%
Subtotal 152 60.8% 15 88.2% 205 72.7% 2567 78.7% 631 65.5% 3570 74.8%
Not very helpful 42 16.8% 1 5.9% 42 14.9% 282 8.7% 120 12.5% 487 10.2%
Not helpful at all
40 16.0% 0 .0% 28 9.9% 189 5.8% 107 11.1% 364 7.6%
Subtotal 82 32.8% 1 5.9% 70 24.8% 471 14.4% 227 23.6% 851 17.8%
Did not respond 16 6.4% 1 5.9% 7 2.5% 222 6.8% 105 10.9% 351 7.4%
Total 250 100.0% 17 100.0% 282 100.0% 3260 100.0% 963 100.0% 4772 100.0%
Did you need educational or vocational services?
Yes 144 18.2% 17 41.5% 242 38.3% 2019 13.9% 515 17.1% 2937 15.5%
No 641 81.1% 24 58.5% 388 61.4% 12154 83.8% 2450 81.2% 15657 82.5%
Did not respond 5 .6% 0 .0% 2 .3% 331 2.3% 53 1.8% 391 2.1%
Total 790 100.0% 41 100.0% 632 100.0% 14504 100.0% 3018 100.0% 18985 100.0%
If yes, how helpful were we in assisting you to identify and find educational or vocational services?
Very helpful 50 34.7% 5 29.4% 73 30.2% 840 41.6% 139 27.0% 1107 37.7%
Somewhat helpful
25 17.4% 6 35.3% 80 33.1% 537 26.6% 147 28.5% 795 27.1%
Subtotal 75 52.1% 11 64.7% 153 63.2% 1377 68.2% 286 55.5% 1902 64.8%
Not very helpful 33 22.9% 2 11.8% 45 18.6% 273 13.5% 86 16.7% 439 14.9%
Not helpful at all
26 18.1% 4 23.5% 36 14.9% 179 8.9% 67 13.0% 312 10.6%
Subtotal 59 41.0% 6 35.3% 81 33.5% 452 22.4% 153 29.7% 751 25.6%
Did not respond 10 6.9% 0 .0% 8 3.3% 190 9.4% 76 14.8% 284 9.7%
Total 144 100.0% 17 100.0% 242 100.0% 2019 100.0% 515 100.0% 2937 100.0%
Did you need employment services?
Yes 193 24.4% 23 56.1% 255 40.3% 2153 14.8% 519 17.2% 3143 16.6%
No 592 74.9% 18 43.9% 373 59.0% 12028 82.9% 2447 81.1% 15458 81.4%
Did not respond 5 .6% 0 .0% 4 .6% 323 2.2% 52 1.7% 384 2.0%
Total 790 100.0% 41 100.0% 632 100.0% 14504 100.0% 3018 100.0% 18985 100.0%
If yes, how helpful were we in assisting you to identify and find employment services?
Very helpful 32 16.6% 6 26.1% 61 23.9% 692 32.1% 120 23.1% 911 29.0%
Somewhat helpful
39 20.2% 7 30.4% 78 30.6% 568 26.4% 114 22.0% 806 25.6%
Subtotal 71 36.8% 13 56.5% 139 54.5% 1260 58.5% 234 45.1% 1717 54.6%
Not very helpful 39 20.2% 5 21.7% 47 18.4% 379 17.6% 95 18.3% 565 18.0%
Not helpful at all
67 34.7% 5 21.7% 58 22.7% 295 13.7% 109 21.0% 534 17.0%
Subtotal 106 54.9% 10 43.5% 105 41.2% 674 31.3% 204 39.3% 1099 35.0%
Did not respond 16 8.3% 0 .0% 11 4.3% 219 10.2% 81 15.6% 327 10.4%
Total 193 100.0% 23 100.0% 255 100.0% 2153 100.0% 519 100.0% 3143 100.0%
*Results for opiate substitution should be interpreted with caution since fewer than 70 percent of patients receiving treatment in participating opiate substitution programs completed the survey during the week of March 23, 2009.

Patients Speak Out 2009 Appendix A: Results for Community Treatment Programs
113
Table 3 Characteristics of Patients Completing the DBHR Adult Patient Satisfaction Survey by Treatment Modality, March 23‐27, 2009
Treatment Modality
Intensive Inpatient
Recovery House
Long‐term Residential OP/IOP
Opiate Substitution Total
Count Column
% CountColumn
% CountColumn
% CountColumn
% Count Column
% CountColumn
%
Age 20 and younger 57 7.2% 5 12.2% 47 7.4% 734 5.1% 63 2.1% 906 4.8%
21 ‐ 25 128 16.2% 14 34.1% 104 16.5% 2374 16.4% 352 11.7% 2972 15.7%
26 ‐ 30 114 14.4% 5 12.2% 134 21.2% 2401 16.6% 490 16.2% 3144 16.6%
31 ‐ 35 82 10.4% 7 17.1% 68 10.8% 1701 11.7% 361 12.0% 2219 11.7%
36 ‐ 40 85 10.8% 3 7.3% 91 14.4% 1607 11.1% 298 9.9% 2084 11.0%
41 ‐ 45 91 11.5% 3 7.3% 55 8.7% 1648 11.4% 322 10.7% 2119 11.2%
46 ‐ 50 93 11.8% 1 2.4% 72 11.4% 1481 10.2% 306 10.1% 1953 10.3%
51 ‐ 55 56 7.1% 1 2.4% 29 4.6% 1061 7.3% 339 11.2% 1486 7.8%
Over 55 44 5.6% 1 2.4% 15 2.4% 799 5.5% 251 8.3% 1110 5.8%
Unknown 40 5.1% 1 2.4% 17 2.7% 698 4.8% 236 7.8% 992 5.2%
Total 790 100.0% 41 100.0% 632 100.0% 14504 100.0% 3018 100.0% 18985 100.0%
Gender Male 500 63.3% 29 70.7% 360 57.0% 9671 66.7% 1374 45.5% 11934 62.9%
Female 277 35.1% 12 29.3% 259 41.0% 4408 30.4% 1409 46.7% 6365 33.5%
Unknown 13 1.6% 0 .0% 13 2.1% 425 2.9% 235 7.8% 686 3.6%
Total 790 100.0% 41 100.0% 632 100.0% 14504 100.0% 3018 100.0% 18985 100.0%
Ethnic/Racial Background
White/European American
535 67.7% 28 68.3% 390 61.7% 9627 66.4% 2160 71.6% 12740 67.1%
Black/African American 57 7.2% 2 4.9% 62 9.8% 826 5.7% 144 4.8% 1091 5.7%
Asian/Pacific Islander 8 1.0% 0 .0% 9 1.4% 416 2.9% 34 1.1% 467 2.5%
Native American/Eskimo/Aleut
67 8.5% 2 4.9% 67 10.6% 873 6.0% 188 6.2% 1197 6.3%
Hispanic 63 8.0% 3 7.3% 37 5.9% 1496 10.3% 85 2.8% 1684 8.9%
Multiracial 24 3.0% 3 7.3% 32 5.1% 549 3.8% 132 4.4% 740 3.9%
Other 18 2.3% 1 2.4% 15 2.4% 287 2.0% 54 1.8% 375 2.0%
Unknown 18 2.3% 2 4.9% 20 3.2% 430 3.0% 221 7.3% 691 3.6%
Total 790 100.0% 41 100.0% 632 100.0% 14504 100.0% 3018 100.0% 18985 100.0%
Length of Stay in Treatment
15 days or less 418 52.9% 18 43.9% 196 31.0% 1791 12.3% 182 6.0% 2605 13.7%
16 ‐ 30 days 198 25.1% 2 4.9% 113 17.9% 1006 6.9% 70 2.3% 1389 7.3%
31 ‐ 45 days 19 2.4% 2 4.9% 83 13.1% 706 4.9% 58 1.9% 868 4.6%
46 ‐ 60 days 15 1.9% 5 12.2% 66 10.4% 783 5.4% 55 1.8% 924 4.9%
61 ‐ 75 days 2 .3% 6 14.6% 36 5.7% 645 4.4% 48 1.6% 737 3.9%
76 ‐ 90 days 2 .3% 3 7.3% 22 3.5% 668 4.6% 50 1.7% 745 3.9%
Over 90 days 9 1.1% 2 4.9% 33 5.2% 6304 43.5% 1434 47.5% 7782 41.0%
Unknown 127 16.1% 3 7.3% 83 13.1% 2601 17.9% 1121 37.1% 3935 20.7%
Total 790 100.0% 41 100.0% 632 100.0% 14504 100.0% 3018 100.0% 18985 100.0%
Source of Funding Private 178 22.5% 9 22.0% 15 2.4% 6990 48.2% 961 31.8% 8153 42.9%
Public 442 55.9% 28 68.3% 537 85.0% 4799 33.1% 1184 39.2% 6990 36.8%
Unknown 170 21.5% 4 9.8% 80 12.7% 2715 18.7% 873 28.9% 3842 20.2%
Total 790 100.0% 41 100.0% 632 100.0% 14504 100.0% 3018 100.0% 18985 100.0%

Patients Speak Out 2009 Appendix A: Results for Community Treatment Programs
114
Table 4 Adult Patient Responses to Questions 1 and 3 by Treatment Modality and Gender
Intensive Inpatient
Gender
Male Female Unknown Total
CountColumn
% CountColumn
% Count Column
% CountColumn
%
Q1. In an overall, general sense, how satisfied are you with the service you have received?
Very satisfied 236 47.2% 138 49.8% 5 38.5% 379 48.0%
Mostly satisfied
244 48.8% 126 45.5% 7 53.8% 377 47.7%
Subtotal 480 96.0% 264 95.3% 12 92.3% 756 95.7%
Dissatisfied 16 3.2% 12 4.3% 1 7.7% 29 3.7%
Very dissatisfied
3 .6% 1 .4% 0 .0% 4 .5%
Subtotal 19 3.8% 13 4.7% 1 7.7% 33 4.2%
Did not respond
1 .2% 0 .0% 0 .0% 1 .1%
Total 500 100.0% 277 100.0% 13 100.0% 790 100.0%
Q3. Would you say our staff treated you with respect? All of the time 327 65.4% 177 63.9% 7 53.8% 511 64.7%
Some of the time
149 29.8% 84 30.3% 4 30.8% 237 30.0%
Subtotal 476 95.2% 261 94.2% 11 84.6% 748 94.7%
Little of the time
17 3.4% 13 4.7% 1 7.7% 31 3.9%
Never 2 .4% 0 .0% 0 .0% 2 .3%
Subtotal 19 3.8% 13 4.7% 1 7.7% 33 4.2%
Did not respond
5 1.0% 3 1.1% 1 7.7% 9 1.1%
Total 500 100.0% 277 100.0% 13 100.0% 790 100.0%
Recovery House
Gender
Male Female Unknown Total
CountColumn
% CountColumn
% Count Column
% CountColumn
%
Q1. In an overall, general sense, how satisfied are you with the service you have received?
Very satisfied 12 41.4% 2 16.7% 0 .0% 14 34.1%
Mostly satisfied
17 58.6% 9 75.0% 0 .0% 26 63.4%
Subtotal 29 100.0% 11 91.7% 0 .0% 40 97.6%
Dissatisfied 0 .0% 0 .0% 0 .0% 0 .0%
Very dissatisfied
0 .0% 1 8.3% 0 .0% 1 2.4%
Subtotal 0 .0% 1 8.3% 0 .0% 1 2.4%
Did not respond
0 .0% 0 .0% 0 .0% 0 .0%
Total 29 100.0% 12 100.0% 0 .0% 41 100.0%
Q3. Would you say our staff treated you with respect? All of the time 12 41.4% 4 33.3% 0 .0% 16 39.0%
Some of the time
11 37.9% 5 41.7% 0 .0% 16 39.0%
Subtotal 23 79.3% 9 75.0% 0 .0% 32 78.0%
Little of the time
6 20.7% 3 25.0% 0 .0% 9 22.0%
Never 0 .0% 0 .0% 0 .0% 0 .0%
Subtotal 6 20.7% 3 25.0% 0 .0% 9 22.0%
Did not respond
0 .0% 0 .0% 0 .0% 0 .0%
Total 29 100.0% 12 100.0% 0 .0% 41 100.0%
Continued next page.

Patients Speak Out 2009 Appendix A: Results for Community Treatment Programs
115
Long‐term Residential
Gender
Male Female Unknown Total
CountColumn
% CountColumn
% Count Column
% CountColumn
%
Q1. In an overall, general sense, how satisfied are you with the service you have received?
Very satisfied 123 34.2% 76 29.3% 3 23.1% 202 32.0%
Mostly satisfied
209 58.1% 160 61.8% 9 69.2% 378 59.8%
Subtotal 332 92.2% 236 91.1% 12 92.3% 580 91.8%
Dissatisfied 22 6.1% 18 6.9% 1 7.7% 41 6.5%
Very dissatisfied
4 1.1% 4 1.5% 0 .0% 8 1.3%
Subtotal 26 7.2% 22 8.5% 1 7.7% 49 7.8%
Did not respond
2 .6% 1 .4% 0 .0% 3 .5%
Total 360 100.0% 259 100.0% 13 100.0% 632 100.0%
Q3. Would you say our staff treated you with respect? All of the time 193 53.6% 99 38.2% 6 46.2% 298 47.2%
Some of the time
146 40.6% 143 55.2% 7 53.8% 296 46.8%
Subtotal 339 94.2% 242 93.4% 13 100.0% 594 94.0%
Little of the time
18 5.0% 14 5.4% 0 .0% 32 5.1%
Never 0 .0% 0 .0% 0 .0% 0 .0%
Subtotal 18 5.0% 14 5.4% 0 .0% 32 5.1%
Did not respond
3 .8% 3 1.2% 0 .0% 6 .9%
Total 360 100.0% 259 100.0% 13 100.0% 632 100.0%
Outpatient/Intensive Outpatient
Gender
Male Female Unknown Total
CountColumn
% CountColumn
% Count Column
% CountColumn
%
Q1. In an overall, general sense, how satisfied are you with the service you have received?
Very satisfied 5763 59.6% 2784 63.2% 248 58.4% 8795 60.6%
Mostly satisfied
3636 37.6% 1510 34.3% 148 34.8% 5294 36.5%
Subtotal 9399 97.2% 4294 97.4% 396 93.2% 14089 97.1%
Dissatisfied 185 1.9% 74 1.7% 8 1.9% 267 1.8%
Very dissatisfied
55 .6% 23 .5% 9 2.1% 87 .6%
Subtotal 240 2.5% 97 2.2% 17 4.0% 354 2.4%
Did not respond
32 .3% 17 .4% 12 2.8% 61 .4%
Total 9671 100.0% 4408 100.0% 425 100.0% 14504 100.0%
Q3. Would you say our staff treated you with respect? All of the time 8522 88.1% 3852 87.4% 341 80.2% 12715 87.7%
Some of the time
1019 10.5% 498 11.3% 57 13.4% 1574 10.9%
Subtotal 9541 98.7% 4350 98.7% 398 93.6% 14289 98.5%
Little of the time
77 .8% 31 .7% 6 1.4% 114 .8%
Never 16 .2% 6 .1% 3 .7% 25 .2%
Subtotal 93 1.0% 37 .8% 9 2.1% 139 1.0%
Did not respond
37 .4% 21 .5% 18 4.2% 76 .5%
Total 9671 100.0% 4408 100.0% 425 100.0% 14504 100.0%
Continued next page.

Patients Speak Out 2009 Appendix A: Results for Community Treatment Programs
116
Opiate Substitution*
Gender
Male Female Unknown Total
CountColumn
% CountColumn
% Count Column
% CountColumn
%
Q1. In an overall, general sense, how satisfied are you with the service you have received?
Very satisfied 583 42.4% 566 40.2% 80 34.0% 1229 40.7%
Mostly satisfied
678 49.3% 732 52.0% 124 52.8% 1534 50.8%
Subtotal 1261 91.8% 1298 92.1% 204 86.8% 2763 91.6%
Dissatisfied 80 5.8% 68 4.8% 20 8.5% 168 5.6%
Very dissatisfied
26 1.9% 33 2.3% 9 3.8% 68 2.3%
Subtotal 106 7.7% 101 7.2% 29 12.3% 236 7.8%
Did not respond
7 .5% 10 .7% 2 .9% 19 .6%
Total 1374 100.0% 1409 100.0% 235 100.0% 3018 100.0%
Q3. Would you say our staff treated you with respect? All of the time 943 68.6% 862 61.2% 118 50.2% 1923 63.7%
Some of the time
349 25.4% 451 32.0% 98 41.7% 898 29.8%
Subtotal 1292 94.0% 1313 93.2% 216 91.9% 2821 93.5%
Little of the time
55 4.0% 77 5.5% 12 5.1% 144 4.8%
Never 7 .5% 6 .4% 2 .9% 15 .5%
Subtotal 62 4.5% 83 5.9% 14 6.0% 159 5.3%
Did not respond
20 1.5% 13 .9% 5 2.1% 38 1.3%
Total 1374 100.0% 1409 100.0% 235 100.0% 3018 100.0%
*Results for opiate substitution should be interpreted with caution since fewer than 70 percent of patients receiving treatment in participating opiate substitution programs completed the survey during the week of March 23, 2009.

Patients Speak Out 2009 Appendix A: Results for Community Treatment Programs
117
Table 5 Adult Responses to Questions 1 and 3 by Treatment Modality and Ethnic/Racial Background
Residential Treatment
Ethnic/Racial Background
White/European American
Black/African American
Asian/Pacific Islander
Native American Hispanic Multiracial Other Total
Count Column
% Count Column
% CountColumn
% CountColumn
% CountColumn
% Count Column
% Count Column
% CountColumn
%
Q1. In an overall, general sense, how satisfied are you with the service you have received?
Very satisfied
384 40.3% 56 46.3% 7 41.2% 49 36.0% 56 54.4% 17 28.8% 12 35.3% 581 40.8%
Mostly satisfied
514 53.9% 58 47.9% 8 47.1% 78 57.4% 44 42.7% 37 62.7% 20 58.8% 759 53.3%
Subtotal 898 94.2% 114 94.2% 15 88.2% 127 93.4% 100 97.1% 54 91.5% 32 94.1% 1340 94.2%
Dissatisfied 46 4.8% 5 4.1% 1 5.9% 7 5.1% 3 2.9% 4 6.8% 0 .0% 66 4.6%
Very dissatisfied
8 .8% 1 .8% 1 5.9% 1 .7% 0 .0% 1 1.7% 1 2.9% 13 .9%
Subtotal 54 5.7% 6 5.0% 2 11.8% 8 5.9% 3 2.9% 5 8.5% 1 2.9% 79 5.6%
Did not respond
1 .1% 1 .8% 0 .0% 1 .7% 0 .0% 0 .0% 1 2.9% 4 .3%
Total 953 100.0% 121 100.0% 17 100.0% 136 100.0% 103 100.0% 59 100.0% 34 100.0% 1423 100.0%
Q3. Would you say our staff treated you with respect?
All of the time
550 57.7% 59 48.8% 10 58.8% 75 55.1% 69 67.0% 26 44.1% 19 55.9% 808 56.8%
Some of the time
347 36.4% 50 41.3% 7 41.2% 52 38.2% 31 30.1% 29 49.2% 13 38.2% 529 37.2%
Subtotal 897 94.1% 109 90.1% 17 100.0% 127 93.4% 100 97.1% 55 93.2% 32 94.1% 1337 94.0%
Little of the time
45 4.7% 9 7.4% 0 .0% 8 5.9% 2 1.9% 3 5.1% 2 5.9% 69 4.8%
Never 1 .1% 0 .0% 0 .0% 0 .0% 1 1.0% 0 .0% 0 .0% 2 .1%
Subtotal 46 4.8% 9 7.4% 0 .0% 8 5.9% 3 2.9% 3 5.1% 2 5.9% 71 5.0%
Did not respond
10 1.0% 3 2.5% 0 .0% 1 .7% 0 .0% 1 1.7% 0 .0% 15 1.1%
Total 953 100.0% 121 100.0% 17 100.0% 136 100.0% 103 100.0% 59 100.0% 34 100.0% 1423 100.0%
Outpatient/Intensive Outpatient
Ethnic/Racial Background
White/European American
Black/African American
Asian/Pacific Islander
Native American Hispanic Multiracial Other Total
Count Column
% Count Column
% CountColumn
% CountColumn
% CountColumn
% Count Column
% Count Column
% CountColumn
%
Q1. In an overall, general sense, how satisfied are you with the service you have received?
Very satisfied 5665 58.8% 502 60.8% 273 65.6% 499 57.2% 1131 75.6% 324 59.0% 148 51.6% 8542 60.7%
Mostly satisfied
3704 38.5% 289 35.0% 136 32.7% 351 40.2% 331 22.1% 211 38.4% 121 42.2% 5143 36.5%
Subtotal 9369 97.3% 791 95.8% 409 98.3% 850 97.4% 1462 97.7% 535 97.4% 269 93.7% 13685 97.2%
Dissatisfied 182 1.9% 23 2.8% 5 1.2% 12 1.4% 14 .9% 10 1.8% 14 4.9% 260 1.8%
Very dissatisfied
43 .4% 12 1.5% 1 .2% 6 .7% 9 .6% 4 .7% 3 1.0% 78 .6%
Subtotal 225 2.3% 35 4.2% 6 1.4% 18 2.1% 23 1.5% 14 2.6% 17 5.9% 338 2.4%
Did not respond
33 .3% 0 .0% 1 .2% 5 .6% 11 .7% 0 .0% 1 .3% 51 .4%
Total 9627 100.0% 826 100.0% 416 100.0% 873 100.0% 1496 100.0% 549 100.0% 287 100.0% 14074 100.0%
Q3. Would you say our staff treated you with respect?
All of the time 8514 88.4% 688 83.3% 375 90.1% 743 85.1% 1354 90.5% 464 84.5% 234 81.5% 12372 87.9%
Some of the time
1005 10.4% 124 15.0% 34 8.2% 112 12.8% 113 7.6% 79 14.4% 41 14.3% 1508 10.7%
Subtotal 9519 98.9% 812 98.3% 409 98.3% 855 97.9% 1467 98.1% 543 98.9% 275 95.8% 13880 98.6%
Little of the time
64 .7% 7 .8% 4 1.0% 11 1.3% 12 .8% 3 .5% 10 3.5% 111 .8%
Never 8 .1% 2 .2% 1 .2% 2 .2% 4 .3% 3 .5% 1 .3% 21 .1%
Subtotal 72 .7% 9 1.1% 5 1.2% 13 1.5% 16 1.1% 6 1.1% 11 3.8% 132 .9%
Did not respond
36 .4% 5 .6% 2 .5% 5 .6% 13 .9% 0 .0% 1 .3% 62 .4%
Total 9627 100.0% 826 100.0% 416 100.0% 873 100.0% 1496 100.0% 549 100.0% 287 100.0% 14074 100.0%
Continued next page.

Patients Speak Out 2009 Appendix A: Results for Community Treatment Programs
118
Opiate Substitution*
Ethnic/Racial Background
White/European American
Black/African American
Asian/Pacific Islander
Native American Hispanic Multiracial Other Total
Count
Column % Count
Column % Count
Column % Count
Column % Count
Column % Count
Column % Count
Column % Count
Column %
Q1. In an overall, general sense, how satisfied are you with the service you have received?
Very satisfied
888 41.1% 62 43.1% 16 47.1% 78 41.5% 39 45.9% 58 43.9% 18 33.3% 1159 41.4%
Mostly satisfied
1092 50.6% 71 49.3% 18 52.9% 102 54.3% 40 47.1% 63 47.7% 29 53.7% 1415 50.6%
Subtotal 1980 91.7% 133 92.4% 34 100.0% 180 95.7% 79 92.9% 121 91.7% 47 87.0% 2574 92.0%
Dissatisfied 125 5.8% 7 4.9% 0 .0% 4 2.1% 3 3.5% 4 3.0% 5 9.3% 148 5.3%
Very dissatisfied
43 2.0% 4 2.8% 0 .0% 2 1.1% 2 2.4% 5 3.8% 2 3.7% 58 2.1%
Subtotal 168 7.8% 11 7.6% 0 .0% 6 3.2% 5 5.9% 9 6.8% 7 13.0% 206 7.4%
Did not respond
12 .6% 0 .0% 0 .0% 2 1.1% 1 1.2% 2 1.5% 0 .0% 17 .6%
Total 2160 100.0% 144 100.0% 34 100.0% 188 100.0% 85 100.0% 132 100.0% 54 100.0% 2797 100.0%
Q2. Would you say our staff treated you with respect?
All of the time
1412 65.4% 89 61.8% 24 70.6% 117 62.2% 59 69.4% 82 62.1% 25 46.3% 1808 64.6%
Some of the time
613 28.4% 47 32.6% 10 29.4% 60 31.9% 21 24.7% 42 31.8% 23 42.6% 816 29.2%
Subtotal 2025 93.8% 136 94.4% 34 100.0% 177 94.1% 80 94.1% 124 93.9% 48 88.9% 2624 93.8%
Little of the time
104 4.8% 7 4.9% 0 .0% 8 4.3% 3 3.5% 4 3.0% 5 9.3% 131 4.7%
Never 13 .6% 0 .0% 0 .0% 0 .0% 0 .0% 0 .0% 1 1.9% 14 .5%
Subtotal 117 5.4% 7 4.9% 0 .0% 8 4.3% 3 3.5% 4 3.0% 6 11.1% 145 5.2%
Did not respond
18 .8% 1 .7% 0 .0% 3 1.6% 2 2.4% 4 3.0% 0 .0% 28 1.0%
Total 2160 100.0% 144 100.0% 34 100.0% 188 100.0% 85 100.0% 132 100.0% 54 100.0% 2797 100.0%
*Results for opiate substitution should be interpreted with caution since fewer than 70 percent of patients receiving treatment in participating opiate substitution programs completed the survey during the week of March 23, 2009.

Patients Speak Out 2009 Appendix A: Results for Community Treatment Programs
119
Table 6 Adult Patient Responses to Questions 1 and 3 by Treatment Modality and Length of Stay in Treatment
Intensive Inpatient
Length of Stay in Treatment
7 days or less 8 ‐ 14 days Over 14 days Unknown Total
CountColumn
% CountColumn
% CountColumn
% Count Column
% CountColumn
%
Q1. In an overall, general sense, how satisfied are you with the service you have received?
Very satisfied 106 43.8% 67 44.1% 140 52.0% 66 52.0% 379 48.0%
Mostly satisfied
124 51.2% 78 51.3% 121 45.0% 54 42.5% 377 47.7%
Subtotal 230 95.0% 145 95.4% 261 97.0% 120 94.5% 756 95.7%
Dissatisfied 12 5.0% 4 2.6% 6 2.2% 7 5.5% 29 3.7%
Very dissatisfied
0 .0% 2 1.3% 2 .7% 0 .0% 4 .5%
Subtotal 12 5.0% 6 3.9% 8 3.0% 7 5.5% 33 4.2%
Did not respond
0 .0% 1 .7% 0 .0% 0 .0% 1 .1%
Total 242 100.0% 152 100.0% 269 100.0% 127 100.0% 790 100.0%
Q3. Would you say our staff treated you with respect?
All of the time 180 74.4% 94 61.8% 157 58.4% 80 63.0% 511 64.7%
Some of the time
50 20.7% 51 33.6% 99 36.8% 37 29.1% 237 30.0%
Subtotal 230 95.0% 145 95.4% 256 95.2% 117 92.1% 748 94.7%
Little of the time
9 3.7% 3 2.0% 11 4.1% 8 6.3% 31 3.9%
Never 2 .8% 0 .0% 0 .0% 0 .0% 2 .3%
Subtotal 11 4.5% 3 2.0% 11 4.1% 8 6.3% 33 4.2%
Did not respond
1 .4% 4 2.6% 2 .7% 2 1.6% 9 1.1%
Total 242 100.0% 152 100.0% 269 100.0% 127 100.0% 790 100.0%
Recovery House
Length of Stay in Treatment
20 days or less 21 ‐ 40 days Over 40 days Unknown Total
CountColumn
% CountColumn
% CountColumn
% Count Column
% CountColumn
%
Q1. In an overall, general sense, how satisfied are you with the service you have received?
Very satisfied 5 27.8% 3 75.0% 5 31.2% 1 33.3% 14 34.1%
Mostly satisfied
12 66.7% 1 25.0% 11 68.8% 2 66.7% 26 63.4%
Subtotal 17 94.4% 4 100.0% 16 100.0% 3 100.0% 40 97.6%
Dissatisfied 0 .0% 0 .0% 0 .0% 0 .0% 0 .0%
Very dissatisfied
1 5.6% 0 .0% 0 .0% 0 .0% 1 2.4%
Subtotal 1 5.6% 0 .0% 0 .0% 0 .0% 1 2.4%
Did not respond
0 .0% 0 .0% 0 .0% 0 .0% 0 .0%
Total 18 100.0% 4 100.0% 16 100.0% 3 100.0% 41 100.0%
Q3. Would you say our staff treated you with respect?
All of the time 5 27.8% 3 75.0% 7 43.8% 1 33.3% 16 39.0%
Some of the time
7 38.9% 1 25.0% 6 37.5% 2 66.7% 16 39.0%
Subtotal 12 66.7% 4 100.0% 13 81.2% 3 100.0% 32 78.0%
Little of the time
6 33.3% 0 .0% 3 18.8% 0 .0% 9 22.0%
Never 0 .0% 0 .0% 0 .0% 0 .0% 0 .0%
Subtotal 6 33.3% 0 .0% 3 18.8% 0 .0% 9 22.0%
Did not respond
0 .0% 0 .0% 0 .0% 0 .0% 0 .0%
Total 18 100.0% 4 100.0% 16 100.0% 3 100.0% 41 100.0%
Continued next page.

Patients Speak Out 2009 Appendix A: Results for Community Treatment Programs
120
Long‐term Residential
Length of Stay in Treatment
30 days or less 31 ‐ 60 days Over 60 days Unknown Total
CountColumn
% CountColumn
% CountColumn
% Count Column
% CountColumn
%
Q1. In an overall, general sense, how satisfied are you with the service you have received?
Very satisfied 106 34.3% 48 32.2% 24 26.4% 24 28.9% 202 32.0%
Mostly satisfied
182 58.9% 87 58.4% 59 64.8% 50 60.2% 378 59.8%
Subtotal 288 93.2% 135 90.6% 83 91.2% 74 89.2% 580 91.8%
Dissatisfied 18 5.8% 10 6.7% 7 7.7% 6 7.2% 41 6.5%
Very dissatisfied
3 1.0% 2 1.3% 1 1.1% 2 2.4% 8 1.3%
Subtotal 21 6.8% 12 8.1% 8 8.8% 8 9.6% 49 7.8%
Did not respond
0 .0% 2 1.3% 0 .0% 1 1.2% 3 .5%
Total 309 100.0% 149 100.0% 91 100.0% 83 100.0% 632 100.0%
Q3. Would you say our staff treated you with respect?
All of the time 148 47.9% 79 53.0% 40 44.0% 31 37.3% 298 47.2%
Some of the time
143 46.3% 62 41.6% 44 48.4% 47 56.6% 296 46.8%
Subtotal 291 94.2% 141 94.6% 84 92.3% 78 94.0% 594 94.0%
Little of the time
14 4.5% 7 4.7% 7 7.7% 4 4.8% 32 5.1%
Never 0 .0% 0 .0% 0 .0% 0 .0% 0 .0%
Subtotal 14 4.5% 7 4.7% 7 7.7% 4 4.8% 32 5.1%
Did not respond
4 1.3% 1 .7% 0 .0% 1 1.2% 6 .9%
Total 309 100.0% 149 100.0% 91 100.0% 83 100.0% 632 100.0%
Outpatient/Intensive Outpatient
Length of Stay in Treatment
30 days or less 31 ‐ 60 days Over 60 days Unknown Total
CountColumn
% CountColumn
% CountColumn
% Count Column
% CountColumn
%
Q1. In an overall, general sense, how satisfied are you with the service you have received?
Very satisfied 1582 56.6% 910 61.1% 4759 62.5% 1544 59.4% 8795 60.6%
Mostly satisfied
1124 40.2% 540 36.3% 2683 35.2% 947 36.4% 5294 36.5%
Subtotal 2706 96.7% 1450 97.4% 7442 97.7% 2491 95.8% 14089 97.1%
Dissatisfied 58 2.1% 27 1.8% 121 1.6% 61 2.3% 267 1.8%
Very dissatisfied
19 .7% 5 .3% 36 .5% 27 1.0% 87 .6%
Subtotal 77 2.8% 32 2.1% 157 2.1% 88 3.4% 354 2.4%
Did not respond
14 .5% 7 .5% 18 .2% 22 .8% 61 .4%
Total 2797 100.0% 1489 100.0% 7617 100.0% 2601 100.0% 14504 100.0%
Q3. Would you say our staff treated you with respect?
All of the time 2471 88.3% 1336 89.7% 6688 87.8% 2220 85.4% 12715 87.7%
Some of the time
279 10.0% 135 9.1% 830 10.9% 330 12.7% 1574 10.9%
Subtotal 2750 98.3% 1471 98.8% 7518 98.7% 2550 98.0% 14289 98.5%
Little of the time
32 1.1% 7 .5% 57 .7% 18 .7% 114 .8%
Never 1 .0% 3 .2% 14 .2% 7 .3% 25 .2%
Subtotal 33 1.2% 10 .7% 71 .9% 25 1.0% 139 1.0%
Did not respond
14 .5% 8 .5% 28 .4% 26 1.0% 76 .5%
Total 2797 100.0% 1489 100.0% 7617 100.0% 2601 100.0% 14504 100.0%
Continued next page.

Patients Speak Out 2009 Appendix A: Results for Community Treatment Programs
121
Opiate Substitution*
Length of Stay in Treatment
90 days or less 91 ‐ 180 days Over 180 days Unknown Total
CountColumn
% CountColumn
% CountColumn
% Count Column
% CountColumn
%
Q1. In an overall, general sense, how satisfied are you with the service you have received?
Very satisfied 218 47.1% 83 40.7% 501 40.7% 427 38.1% 1229 40.7%
Mostly satisfied
206 44.5% 104 51.0% 626 50.9% 598 53.3% 1534 50.8%
Subtotal 424 91.6% 187 91.7% 1127 91.6% 1025 91.4% 2763 91.6%
Dissatisfied 25 5.4% 11 5.4% 67 5.4% 65 5.8% 168 5.6%
Very dissatisfied
10 2.2% 5 2.5% 30 2.4% 23 2.1% 68 2.3%
Subtotal 35 7.6% 16 7.8% 97 7.9% 88 7.9% 236 7.8%
Did not respond
4 .9% 1 .5% 6 .5% 8 .7% 19 .6%
Total 463 100.0% 204 100.0% 1230 100.0% 1121 100.0% 3018 100.0%
Q3. Would you say our staff treated you with respect?
All of the time 322 69.5% 134 65.7% 782 63.6% 685 61.1% 1923 63.7%
Some of the time
118 25.5% 57 27.9% 371 30.2% 352 31.4% 898 29.8%
Subtotal 440 95.0% 191 93.6% 1153 93.7% 1037 92.5% 2821 93.5%
Little of the time
19 4.1% 9 4.4% 56 4.6% 60 5.4% 144 4.8%
Never 0 .0% 1 .5% 7 .6% 7 .6% 15 .5%
Subtotal 19 4.1% 10 4.9% 63 5.1% 67 6.0% 159 5.3%
Did not respond
4 .9% 3 1.5% 14 1.1% 17 1.5% 38 1.3%
Total 463 100.0% 204 100.0% 1230 100.0% 1121 100.0% 3018 100.0%
*Results for opiate substitution should be interpreted with caution since fewer than 70 percent of patients receiving treatment in participating opiate substitution programs completed the survey during the week of March 23, 2009.

Patients Speak Out 2009 Appendix A: Results for Community Treatment Programs
122
Table 7 Adult Patient Responses to Questions 1 and 3 by Treatment Modality and Funding
Residential Treatment
Source of Funding
Private Public Unknown Total
CountColumn
% CountColumn
% Count Column
% CountColumn
%
Q1. In an overall, general sense, how satisfied are you with the service you have received?
Very satisfied 107 53.0% 374 37.1% 114 44.9% 595 40.7%
Mostly satisfied
88 43.6% 561 55.7% 132 52.0% 781 53.4%
Subtotal 195 96.5% 935 92.9% 246 96.9% 1376 94.1%
Dissatisfied 5 2.5% 58 5.8% 7 2.8% 70 4.8%
Very dissatisfied
1 .5% 11 1.1% 1 .4% 13 .9%
Subtotal 6 3.0% 69 6.9% 8 3.1% 83 5.7%
Did not respond
1 .5% 3 .3% 0 .0% 4 .3%
Total 202 100.0% 1007 100.0% 254 100.0% 1463 100.0%
Q3. Would you say our staff treated you with respect? All of the time 146 72.3% 524 52.0% 155 61.0% 825 56.4%
Some of the time
47 23.3% 415 41.2% 87 34.3% 549 37.5%
Subtotal 193 95.5% 939 93.2% 242 95.3% 1374 93.9%
Little of the time
6 3.0% 59 5.9% 7 2.8% 72 4.9%
Never 0 .0% 2 .2% 0 .0% 2 .1%
Subtotal 6 3.0% 61 6.1% 7 2.8% 74 5.1%
Did not respond
3 1.5% 7 .7% 5 2.0% 15 1.0%
Total 202 100.0% 1007 100.0% 254 100.0% 1463 100.0%
Outpatient/Intensive Outpatient
Source of Funding
Private Public Unknown Total
CountColumn
% CountColumn
% Count Column
% CountColumn
%
Q1. In an overall, general sense, how satisfied are you with the service you have received?
Very satisfied 4347 62.2% 2832 59.0% 1616 59.5% 8795 60.6%
Mostly satisfied
2487 35.6% 1806 37.6% 1001 36.9% 5294 36.5%
Subtotal 6834 97.8% 4638 96.6% 2617 96.4% 14089 97.1%
Dissatisfied 105 1.5% 102 2.1% 60 2.2% 267 1.8%
Very dissatisfied
27 .4% 38 .8% 22 .8% 87 .6%
Subtotal 132 1.9% 140 2.9% 82 3.0% 354 2.4%
Did not respond
24 .3% 21 .4% 16 .6% 61 .4%
Total 6990 100.0% 4799 100.0% 2715 100.0% 14504 100.0%
Q3. Would you say our staff treated you with respect? All of the time 6302 90.2% 4095 85.3% 2318 85.4% 12715 87.7%
Some of the time
616 8.8% 618 12.9% 340 12.5% 1574 10.9%
Subtotal 6918 99.0% 4713 98.2% 2658 97.9% 14289 98.5%
Little of the time
44 .6% 44 .9% 26 1.0% 114 .8%
Never 10 .1% 12 .3% 3 .1% 25 .2%
Subtotal 54 .8% 56 1.2% 29 1.1% 139 1.0%
Did not respond
18 .3% 30 .6% 28 1.0% 76 .5%
Total 6990 100.0% 4799 100.0% 2715 100.0% 14504 100.0%
Continued next page.

Patients Speak Out 2009 Appendix A: Results for Community Treatment Programs
123
Opiate Substitution*
Source of Funding
Private Public Unknown Total
CountColumn
% CountColumn
% Count Column
% CountColumn
%
Q1. In an overall, general sense, how satisfied are you with the service you have received?
Very satisfied 421 43.8% 471 39.8% 337 38.6% 1229 40.7%
Mostly satisfied
467 48.6% 621 52.4% 446 51.1% 1534 50.8%
Subtotal 888 92.4% 1092 92.2% 783 89.7% 2763 91.6%
Dissatisfied 49 5.1% 57 4.8% 62 7.1% 168 5.6%
Very dissatisfied
22 2.3% 25 2.1% 21 2.4% 68 2.3%
Subtotal 71 7.4% 82 6.9% 83 9.5% 236 7.8%
Did not respond
2 .2% 10 .8% 7 .8% 19 .6%
Total 961 100.0% 1184 100.0% 873 100.0% 3018 100.0%
Q3. Would you say our staff treated you with respect? All of the time 673 70.0% 730 61.7% 520 59.6% 1923 63.7%
Some of the time
242 25.2% 374 31.6% 282 32.3% 898 29.8%
Subtotal 915 95.2% 1104 93.2% 802 91.9% 2821 93.5%
Little of the time
35 3.6% 65 5.5% 44 5.0% 144 4.8%
Never 4 .4% 6 .5% 5 .6% 15 .5%
Subtotal 39 4.1% 71 6.0% 49 5.6% 159 5.3%
Did not respond
7 .7% 9 .8% 22 2.5% 38 1.3%
Total 961 100.0% 1184 100.0% 873 100.0% 3018 100.0%
*Results for opiate substitution should be interpreted with caution since fewer than 70 percent of patients receiving treatment in participating methadone programs completed the survey during the week of March 23, 2009.

Patients Speak Out 2009 Appendix A: Results for Community Treatment Programs
124
Table 8 Comparing Responses Between Hispanic Patients Completing the Spanish Translation and Hispanic
and Non‐Hispanic Patients Completing the English Version Adult Community OP/IOP
Hispanics‐Spanish Survey
Hispanics‐English Survey
Non‐Hispanics‐English Survey Total
Count Column % Count Column % Count Column % CountColumn
%
In an overall, general sense, how satisfied are you with the service you have received?
Very satisfied 639 89.4% 492 63.0% 7635 58.9% 8766 60.6%
Mostly satisfied
58 8.1% 273 35.0% 4954 38.2% 5285 36.5%
Subtotal 697 97.5% 765 98.0% 12589 97.1% 14051 97.1%
Dissatisfied 6 .8% 8 1.0% 253 2.0% 267 1.8%
Very dissatisfied
3 .4% 6 .8% 78 .6% 87 .6%
Subtotal 9 1.3% 14 1.8% 331 2.6% 354 2.4%
Did not respond
9 1.3% 2 .3% 50 .4% 61 .4%
Total 715 100.0% 781 100.0% 12970 100.0% 14466 100.0%
In general, how satisfied are you with the comfort and appearance of this facility?
Very satisfied 608 85.0% 472 60.4% 7471 57.6% 8551 59.1%
Mostly satisfied
93 13.0% 283 36.2% 5059 39.0% 5435 37.6%
Subtotal 701 98.0% 755 96.7% 12530 96.6% 13986 96.7%
Dissatisfied 0 .0% 20 2.6% 322 2.5% 342 2.4%
Very dissatisfied
4 .6% 5 .6% 72 .6% 81 .6%
Subtotal 4 .6% 25 3.2% 394 3.0% 423 2.9%
Did not respond
10 1.4% 1 .1% 46 .4% 57 .4%
Total 715 100.0% 781 100.0% 12970 100.0% 14466 100.0%
Would you say our staff treated you with respect? All of the time 661 92.4% 693 88.7% 11325 87.3% 12679 87.6%
Some of the time
35 4.9% 78 10.0% 1460 11.3% 1573 10.9%
Subtotal 696 97.3% 771 98.7% 12785 98.6% 14252 98.5%
Little of the time
6 .8% 6 .8% 101 .8% 113 .8%
Never 3 .4% 1 .1% 21 .2% 25 .2%
Subtotal 9 1.3% 7 .9% 122 .9% 138 1.0%
Did not respond
10 1.4% 3 .4% 63 .5% 76 .5%
Total 715 100.0% 781 100.0% 12970 100.0% 14466 100.0%
How do you rate the helpfulness of the group sessions?
Very helpful 657 91.9% 590 75.5% 8236 63.5% 9483 65.6%
Somewhat helpful
35 4.9% 165 21.1% 4027 31.0% 4227 29.2%
Subtotal 692 96.8% 755 96.7% 12263 94.5% 13710 94.8%
Not helpful 1 .1% 12 1.5% 312 2.4% 325 2.2%
Made things worse
0 .0% 2 .3% 33 .3% 35 .2%
Subtotal 1 .1% 14 1.8% 345 2.7% 360 2.5%
Did not receive 4 .6% 7 .9% 236 1.8% 247 1.7%
Did not respond
18 2.5% 5 .6% 126 1.0% 149 1.0%
Total 715 100.0% 781 100.0% 12970 100.0% 14466 100.0%
Continued next page.

Patients Speak Out 2009 Appendix A: Results for Community Treatment Programs
125
How do you rate the helpfulness of the individual counseling?
Very helpful 604 84.5% 585 74.9% 8506 65.6% 9695 67.0%
Somewhat helpful
57 8.0% 138 17.7% 3011 23.2% 3206 22.2%
Subtotal 661 92.4% 723 92.6% 11517 88.8% 12901 89.2%
Not helpful 2 .3% 13 1.7% 336 2.6% 351 2.4%
Made things worse
1 .1% 5 .6% 31 .2% 37 .3%
Subtotal 3 .4% 18 2.3% 367 2.8% 388 2.7%
Did not receive
26 3.6% 30 3.8% 903 7.0% 959 6.6%
Did not respond
25 3.5% 10 1.3% 183 1.4% 218 1.5%
Total 715 100.0% 781 100.0% 12970 100.0% 14466 100.0%
If you were to seek help again, would you come back to this program?
Yes, definitely 571 79.9% 535 68.5% 8014 61.8% 9120 63.0%
Yes, probably 107 15.0% 185 23.7% 3821 29.5% 4113 28.4%
Subtotal 678 94.8% 720 92.2% 11835 91.2% 13233 91.5%
No, probably not
9 1.3% 28 3.6% 614 4.7% 651 4.5%
No, definitely not
8 1.1% 14 1.8% 189 1.5% 211 1.5%
Subtotal 17 2.4% 42 5.4% 803 6.2% 862 6.0%
Did not respond
20 2.8% 19 2.4% 332 2.6% 371 2.6%
Total 715 100.0% 781 100.0% 12970 100.0% 14466 100.0%

Patients Speak Out 2009 Appendix A: Results for Community Treatment Programs
126
Table 9 Comparing Responses Between Hispanic Patients Completing the Spanish Translation and Hispanic
and Non‐Hispanic Patients Completing the English Version Adult Community OP/IOP
Hispanics‐Spanish Survey
Hispanics‐English Survey
Non‐Hispanics‐English Survey Total
Count Column % Count Column % Count Column % CountColumn
%
Did you need legal services? Yes 384 53.7% 262 33.5% 3744 28.9% 4390 30.3%
No 296 41.4% 490 62.7% 8973 69.2% 9759 67.5%
Did not respond 35 4.9% 29 3.7% 253 2.0% 317 2.2%
Total 715 100.0% 781 100.0% 12970 100.0% 14466 100.0%
If yes, how helpful were we in assisting you to identify and find legal services?
Very helpful 178 46.4% 152 58.0% 1929 51.5% 2259 51.5%
Somewhat helpful 71 18.5% 73 27.9% 1073 28.7% 1217 27.7%
Subtotal 249 64.8% 225 85.9% 3002 80.2% 3476 79.2%
Not very helpful 52 13.5% 12 4.6% 283 7.6% 347 7.9%
Not helpful at all 11 2.9% 16 6.1% 273 7.3% 300 6.8%
Subtotal 63 16.4% 28 10.7% 556 14.9% 647 14.7%
Did not respond 72 18.8% 9 3.4% 186 5.0% 267 6.1%
Total 384 100.0% 262 100.0% 3744 100.0% 4390 100.0%
Did you need medical services? Yes 274 38.3% 160 20.5% 2722 21.0% 3156 21.8%
No 411 57.5% 597 76.4% 9985 77.0% 10993 76.0%
Did not respond 30 4.2% 24 3.1% 263 2.0% 317 2.2%
Total 715 100.0% 781 100.0% 12970 100.0% 14466 100.0%
If yes, how helpful were we in assisting you to identify and find medical services?
Very helpful 90 32.8% 95 59.4% 1492 54.8% 1677 53.1%
Somewhat helpful 77 28.1% 38 23.8% 746 27.4% 861 27.3%
Subtotal 167 60.9% 133 83.1% 2238 82.2% 2538 80.4%
Not very helpful 59 21.5% 7 4.4% 187 6.9% 253 8.0%
Not helpful at all 9 3.3% 11 6.9% 156 5.7% 176 5.6%
Subtotal 68 24.8% 18 11.2% 343 12.6% 429 13.6%
Did not respond 39 14.2% 9 5.6% 141 5.2% 189 6.0%
Total 274 100.0% 160 100.0% 2722 100.0% 3156 100.0%
Did you need family services? Yes 191 26.7% 117 15.0% 1547 11.9% 1855 12.8%
No 489 68.4% 640 81.9% 11127 85.8% 12256 84.7%
Did not respond 35 4.9% 24 3.1% 296 2.3% 355 2.5%
Total 715 100.0% 781 100.0% 12970 100.0% 14466 100.0%
If yes, how helpful were we in assisting you to identify and find family services?
Very helpful 42 22.0% 67 57.3% 773 50.0% 882 47.5%
Somewhat helpful 41 21.5% 25 21.4% 421 27.2% 487 26.3%
Subtotal 83 43.5% 92 78.6% 1194 77.2% 1369 73.8%
Not very helpful 67 35.1% 9 7.7% 126 8.1% 202 10.9%
Not helpful at all 9 4.7% 11 9.4% 124 8.0% 144 7.8%
Subtotal 76 39.8% 20 17.1% 250 16.2% 346 18.7%
Did not respond 32 16.8% 5 4.3% 103 6.7% 140 7.5%
Total 191 100.0% 117 100.0% 1547 100.0% 1855 100.0%
Continued next page.

Patients Speak Out 2009 Appendix A: Results for Community Treatment Programs
127
Did you need mental health services? Yes 164 22.9% 132 16.9% 2949 22.7% 3245 22.4%
No 521 72.9% 623 79.8% 9754 75.2% 10898 75.3%
Did not respond 30 4.2% 26 3.3% 267 2.1% 323 2.2%
Total 715 100.0% 781 100.0% 12970 100.0% 14466 100.0%
If yes, how helpful were we in assisting you to identify and find mental health services?
Very helpful 32 19.5% 73 55.3% 1675 56.8% 1780 54.9%
Somewhat helpful 27 16.5% 32 24.2% 713 24.2% 772 23.8%
Subtotal 59 36.0% 105 79.5% 2388 81.0% 2552 78.6%
Not very helpful 77 47.0% 6 4.5% 199 6.7% 282 8.7%
Not helpful at all 10 6.1% 12 9.1% 167 5.7% 189 5.8%
Subtotal 87 53.0% 18 13.6% 366 12.4% 471 14.5%
Did not respond 18 11.0% 9 6.8% 195 6.6% 222 6.8%
Total 164 100.0% 132 100.0% 2949 100.0% 3245 100.0%
Did you need educational or vocational services?
Yes 208 29.1% 98 12.5% 1698 13.1% 2004 13.9%
No 472 66.0% 655 83.9% 11004 84.8% 12131 83.9%
Did not respond 35 4.9% 28 3.6% 268 2.1% 331 2.3%
Total 715 100.0% 781 100.0% 12970 100.0% 14466 100.0%
If yes, how helpful were we in assisting you to identify and find educational or vocational services?
Very helpful 72 34.6% 39 39.8% 716 42.2% 827 41.3%
Somewhat helpful 47 22.6% 29 29.6% 460 27.1% 536 26.7%
Subtotal 119 57.2% 68 69.4% 1176 69.3% 1363 68.0%
Not very helpful 60 28.8% 10 10.2% 202 11.9% 272 13.6%
Not helpful at all 6 2.9% 13 13.3% 160 9.4% 179 8.9%
Subtotal 66 31.7% 23 23.5% 362 21.3% 451 22.5%
Did not respond 23 11.1% 7 7.1% 160 9.4% 190 9.5%
Total 208 100.0% 98 100.0% 1698 100.0% 2004 100.0%
Did you need employment services? Yes 225 31.5% 104 13.3% 1804 13.9% 2133 14.7%
No 458 64.1% 651 83.4% 10901 84.0% 12010 83.0%
Did not respond 32 4.5% 26 3.3% 265 2.0% 323 2.2%
Total 715 100.0% 781 100.0% 12970 100.0% 14466 100.0%
If yes, how helpful were we in assisting you to identify and find employment services?
Very helpful 82 36.4% 32 30.8% 563 31.2% 677 31.7%
Somewhat helpful 36 16.0% 29 27.9% 499 27.7% 564 26.4%
Subtotal 118 52.4% 61 58.7% 1062 58.9% 1241 58.2%
Not very helpful 66 29.3% 14 13.5% 298 16.5% 378 17.7%
Not helpful at all 7 3.1% 19 18.3% 269 14.9% 295 13.8%
Subtotal 73 32.4% 33 31.7% 567 31.4% 673 31.6%
Did not respond 34 15.1% 10 9.6% 175 9.7% 219 10.3%
Total 225 100.0% 104 100.0% 1804 100.0% 2133 100.0%

Patients Speak Out 2009 Appendix A: Results for Community Treatment Programs
128
Table 10 Comparing Patient Characteristics Between Hispanic Patients Completing the Spanish Translation and Hispanic
and Non‐Hispanic Patients Completing the English Version of the Adult Patient Satisfaction Survey
Adult Community Outpatient/Intensive Outpatient
Hispanics Completing Spanish Survey
Hispanics Completing English Survey
Non‐Hispanics Completing English Survey
Count Column % Count Column % Count Column % Age 20 and younger 23 3.0% 55 8.1% 604 4.9%
21 ‐ 25 152 20.0% 174 25.6% 2081 16.8%
26 ‐ 30 170 22.4% 129 18.9% 1829 14.7%
31 ‐ 35 122 16.1% 88 12.9% 1406 11.3%
36 ‐ 40 101 13.3% 66 9.7% 1495 12.0%
41 ‐ 45 62 8.2% 61 9.0% 1519 12.2%
46 ‐ 50 33 4.3% 47 6.9% 1292 10.4%
51 ‐ 55 21 2.8% 30 4.4% 820 6.6%
Over 55 21 2.8% 13 1.9% 818 6.6%
Unknown 55 7.2% 18 2.6% 559 4.5%
Total 760 100.0% 681 100.0% 12423 100.0%
Gender Male 726 95.5% 521 76.5% 8384 67.5%
Female 13 1.7% 150 22.0% 3668 29.5%
Unknown 21 2.8% 10 1.5% 371 3.0%
Total 760 100.0% 681 100.0% 12423 100.0%
Ethnic/Racial Background
White/European American 0 .0% 0 .0% 9405 75.7%
Black/African American 0 .0% 0 .0% 667 5.4%
Asian/Pacific Islander 0 .0% 0 .0% 358 2.9%
Native American/Eskimo/Aleut 0 .0% 0 .0% 854 6.9%
Hispanic 760 100.0% 681 100.0% 0 .0%
Multiracial 0 .0% 0 .0% 255 2.1%
Other 0 .0% 0 .0% 273 2.2%
Unknown 0 .0% 0 .0% 611 4.9%
Total 760 100.0% 681 100.0% 12423 100.0%
Length of Stay in Treatment
15 days or less 37 4.9% 61 9.0% 1010 8.1%
16 ‐ 30 days 56 7.4% 43 6.3% 947 7.6%
31 ‐ 45 days 53 7.0% 30 4.4% 643 5.2%
46 ‐ 60 days 32 4.2% 45 6.6% 612 4.9%
61 ‐ 75 days 50 6.6% 29 4.3% 605 4.9%
76 ‐ 90 days 38 5.0% 22 3.2% 394 3.2%
Over 90 days 387 50.9% 250 36.7% 4848 39.0%
Unknown 107 14.1% 201 29.5% 3364 27.1%
Total 760 100.0% 681 100.0% 12423 100.0%
Source of Funding
Private 565 74.3% 338 49.6% 6142 49.4%
Public 131 17.2% 206 30.2% 3658 29.4%
Unknown 64 8.4% 137 20.1% 2623 21.1%
Total 760 100.0% 681 100.0% 12423 100.0%

Patients Speak Out 2009 Appendix A: Results for Community Treatment Programs
129
Table 11a Responses to Questions 1‐6 of the DBHR Adult Patient Satisfaction Survey by Year of Survey in Intensive Inpatient
Year
2004 2005 2006 2007 2009 Total
CountColumn
% CountColumn
% CountColumn
% CountColumn
% Count Column
% CountColumn
%
In an overall, general sense, how satisfied are you with the service you have received?
Very satisfied 307 51.5% 335 48.6% 379 48.5% 398 45.0% 379 48.0% 1798 48.0%
Mostly satisfied
257 43.1% 321 46.5% 362 46.3% 443 50.1% 377 47.7% 1760 47.0%
Subtotal 564 94.6% 656 95.1% 741 94.8% 841 95.1% 756 95.7% 3558 95.1%
Dissatisfied 21 3.5% 25 3.6% 24 3.1% 35 4.0% 29 3.7% 134 3.6%
Very dissatisfied
8 1.3% 6 .9% 11 1.4% 6 .7% 4 .5% 35 .9%
Subtotal 29 4.9% 31 4.5% 35 4.5% 41 4.6% 33 4.2% 169 4.5%
Did not respond
3 .5% 3 .4% 6 .8% 2 .2% 1 .1% 15 .4%
Total 596 100.0% 690 100.0% 782 100.0% 884 100.0% 790 100.0% 3742 100.0%
In general, how satisfied are you with the comfort and appearance of this facility?
Very satisfied 296 49.7% 319 46.2% 379 48.5% 376 42.5% 346 43.8% 1716 45.9%
Mostly satisfied
247 41.4% 307 44.5% 333 42.6% 403 45.6% 364 46.1% 1654 44.2%
Subtotal 543 91.1% 626 90.7% 712 91.0% 779 88.1% 710 89.9% 3370 90.1%
Dissatisfied 41 6.9% 49 7.1% 54 6.9% 85 9.6% 68 8.6% 297 7.9%
Very dissatisfied
8 1.3% 14 2.0% 12 1.5% 17 1.9% 9 1.1% 60 1.6%
Subtotal 49 8.2% 63 9.1% 66 8.4% 102 11.5% 77 9.7% 357 9.5%
Did not respond
4 .7% 1 .1% 4 .5% 3 .3% 3 .4% 15 .4%
Total 596 100.0% 690 100.0% 782 100.0% 884 100.0% 790 100.0% 3742 100.0%
Would you say our staff treated you with respect?
All of the time
399 66.9% 452 65.5% 488 62.4% 564 63.8% 511 64.7% 2414 64.5%
Some of the time
180 30.2% 209 30.3% 262 33.5% 291 32.9% 237 30.0% 1179 31.5%
Subtotal 579 97.1% 661 95.8% 750 95.9% 855 96.7% 748 94.7% 3593 96.0%
Little of the time
12 2.0% 24 3.5% 20 2.6% 19 2.1% 31 3.9% 106 2.8%
Never 1 .2% 3 .4% 4 .5% 2 .2% 2 .3% 12 .3%
Subtotal 13 2.2% 27 3.9% 24 3.1% 21 2.4% 33 4.2% 118 3.2%
Did not respond
4 .7% 2 .3% 8 1.0% 8 .9% 9 1.1% 31 .8%
Total 596 100.0% 690 100.0% 782 100.0% 884 100.0% 790 100.0% 3742 100.0%
How do you rate the helpfulness of the group sessions?
Very helpful 390 65.4% 438 63.5% 512 65.5% 561 63.5% 549 69.5% 2450 65.5%
Somewhat helpful
181 30.4% 225 32.6% 240 30.7% 289 32.7% 212 26.8% 1147 30.7%
Subtotal 571 95.8% 663 96.1% 752 96.2% 850 96.2% 761 96.3% 3597 96.1%
Not helpful 12 2.0% 11 1.6% 17 2.2% 17 1.9% 14 1.8% 71 1.9%
Made things worse
2 .3% 1 .1% 1 .1% 2 .2% 2 .3% 8 .2%
Subtotal 14 2.3% 12 1.7% 18 2.3% 19 2.1% 16 2.0% 79 2.1%
Did not receive
8 1.3% 9 1.3% 9 1.2% 7 .8% 8 1.0% 41 1.1%
Did not respond
3 .5% 6 .9% 3 .4% 8 .9% 5 .6% 25 .7%
Total 596 100.0% 690 100.0% 782 100.0% 884 100.0% 790 100.0% 3742 100.0%
Continued next page.

Patients Speak Out 2009 Appendix A: Results for Community Treatment Programs
130
How do you rate the helpfulness of the individual counseling?
Very helpful 349 58.6% 389 56.4% 448 57.3% 512 57.9% 486 61.5% 2184 58.4%
Somewhat helpful
109 18.3% 167 24.2% 202 25.8% 212 24.0% 183 23.2% 873 23.3%
Subtotal 458 76.8% 556 80.6% 650 83.1% 724 81.9% 669 84.7% 3057 81.7%
Not helpful 19 3.2% 23 3.3% 23 2.9% 39 4.4% 26 3.3% 130 3.5%
Made things worse
1 .2% 1 .1% 2 .3% 1 .1% 0 .0% 5 .1%
Subtotal 20 3.4% 24 3.5% 25 3.2% 40 4.5% 26 3.3% 135 3.6%
Did not receive
113 19.0% 95 13.8% 92 11.8% 109 12.3% 85 10.8% 494 13.2%
Did not respond
5 .8% 15 2.2% 15 1.9% 11 1.2% 10 1.3% 56 1.5%
Total 596 100.0% 690 100.0% 782 100.0% 884 100.0% 790 100.0% 3742 100.0%
Would you come back to this program?
Yes, definitely
314 52.7% 348 50.4% 420 53.7% 422 47.7% 406 51.4% 1910 51.0%
Yes, probably
188 31.5% 201 29.1% 234 29.9% 302 34.2% 236 29.9% 1161 31.0%
Subtotal 502 84.2% 549 79.6% 654 83.6% 724 81.9% 642 81.3% 3071 82.1%
No, probably not
56 9.4% 94 13.6% 79 10.1% 107 12.1% 100 12.7% 436 11.7%
No, definitely not
19 3.2% 23 3.3% 29 3.7% 28 3.2% 28 3.5% 127 3.4%
Subtotal 75 12.6% 117 17.0% 108 13.8% 135 15.3% 128 16.2% 563 15.0%
Did not respond
19 3.2% 24 3.5% 20 2.6% 25 2.8% 20 2.5% 108 2.9%
Total 596 100.0% 690 100.0% 782 100.0% 884 100.0% 790 100.0% 3742 100.0%

Patients Speak Out 2009 Appendix A: Results for Community Treatment Programs
131
Table 11b Responses to Questions 1‐6 of the DBHR Adult Patient Satisfaction Survey by Year of Survey in Recovery House
Year
2004 2005 2006 2007 2009 Total
CountColumn
% CountColumn
% CountColumn
% CountColumn
% Count Column
% CountColumn
%
In an overall, general sense, how satisfied are you with the service you have received?
Very satisfied 61 55.5% 49 45.4% 25 44.6% 25 29.4% 14 34.1% 174 43.5%
Mostly satisfied
42 38.2% 53 49.1% 25 44.6% 52 61.2% 26 63.4% 198 49.5%
Subtotal 103 93.6% 102 94.4% 50 89.3% 77 90.6% 40 97.6% 372 93.0%
Dissatisfied 4 3.6% 4 3.7% 3 5.4% 8 9.4% 0 .0% 19 4.8%
Very dissatisfied
1 .9% 2 1.9% 2 3.6% 0 .0% 1 2.4% 6 1.5%
Subtotal 5 4.5% 6 5.6% 5 8.9% 8 9.4% 1 2.4% 25 6.2%
Did not respond
2 1.8% 0 .0% 1 1.8% 0 .0% 0 .0% 3 .8%
Total 110 100.0% 108 100.0% 56 100.0% 85 100.0% 41 100.0% 400 100.0%
In general, how satisfied are you with the comfort and appearance of this facility?
Very satisfied 46 41.8% 40 37.0% 20 35.7% 26 30.6% 23 56.1% 155 38.8%
Mostly satisfied
58 52.7% 58 53.7% 25 44.6% 40 47.1% 18 43.9% 199 49.8%
Subtotal 104 94.5% 98 90.7% 45 80.4% 66 77.6% 41 100.0% 354 88.5%
Dissatisfied 5 4.5% 7 6.5% 8 14.3% 16 18.8% 0 .0% 36 9.0%
Very dissatisfied
0 .0% 3 2.8% 3 5.4% 3 3.5% 0 .0% 9 2.2%
Subtotal 5 4.5% 10 9.3% 11 19.6% 19 22.4% 0 .0% 45 11.2%
Did not respond
1 .9% 0 .0% 0 .0% 0 .0% 0 .0% 1 .2%
Total 110 100.0% 108 100.0% 56 100.0% 85 100.0% 41 100.0% 400 100.0%
Would you say our staff treated you with respect?
All of the time
72 65.5% 64 59.3% 23 41.1% 34 40.0% 16 39.0% 209 52.2%
Some of the time
35 31.8% 40 37.0% 30 53.6% 47 55.3% 16 39.0% 168 42.0%
Subtotal 107 97.3% 104 96.3% 53 94.6% 81 95.3% 32 78.0% 377 94.2%
Little of the time
1 .9% 3 2.8% 3 5.4% 3 3.5% 9 22.0% 19 4.8%
Never 0 .0% 1 .9% 0 .0% 0 .0% 0 .0% 1 .2%
Subtotal 1 .9% 4 3.7% 3 5.4% 3 3.5% 9 22.0% 20 5.0%
Did not respond
2 1.8% 0 .0% 0 .0% 1 1.2% 0 .0% 3 .8%
Total 110 100.0% 108 100.0% 56 100.0% 85 100.0% 41 100.0% 400 100.0%
How do you rate the helpfulness of the group sessions?
Very helpful 76 69.1% 63 58.3% 34 60.7% 49 57.6% 11 26.8% 233 58.2%
Somewhat helpful
29 26.4% 41 38.0% 19 33.9% 34 40.0% 27 65.9% 150 37.5%
Subtotal 105 95.5% 104 96.3% 53 94.6% 83 97.6% 38 92.7% 383 95.8%
Not helpful 2 1.8% 4 3.7% 3 5.4% 2 2.4% 2 4.9% 13 3.2%
Made things worse
1 .9% 0 .0% 0 .0% 0 .0% 1 2.4% 2 .5%
Subtotal 3 2.7% 4 3.7% 3 5.4% 2 2.4% 3 7.3% 15 3.8%
Did not receive
0 .0% 0 .0% 0 .0% 0 .0% 0 .0% 0 .0%
Did not respond
2 1.8% 0 .0% 0 .0% 0 .0% 0 .0% 2 .5%
Total 110 100.0% 108 100.0% 56 100.0% 85 100.0% 41 100.0% 400 100.0%
Continued next page.

Patients Speak Out 2009 Appendix A: Results for Community Treatment Programs
132
How do you rate the helpfulness of the individual counseling?
Very helpful 82 74.5% 71 65.7% 33 58.9% 54 63.5% 17 41.5% 257 64.2%
Somewhat helpful
20 18.2% 29 26.9% 18 32.1% 25 29.4% 22 53.7% 114 28.5%
Subtotal 102 92.7% 100 92.6% 51 91.1% 79 92.9% 39 95.1% 371 92.8%
Not helpful 3 2.7% 5 4.6% 0 .0% 3 3.5% 2 4.9% 13 3.2%
Made things worse
0 .0% 0 .0% 0 .0% 0 .0% 0 .0% 0 .0%
Subtotal 3 2.7% 5 4.6% 0 .0% 3 3.5% 2 4.9% 13 3.2%
Did not receive
2 1.8% 1 .9% 4 7.1% 2 2.4% 0 .0% 9 2.2%
Did not respond
3 2.7% 2 1.9% 1 1.8% 1 1.2% 0 .0% 7 1.8%
Total 110 100.0% 108 100.0% 56 100.0% 85 100.0% 41 100.0% 400 100.0%
Would you come back to this program?
Yes, definitely 65 59.1% 55 50.9% 27 48.2% 32 37.6% 15 36.6% 194 48.5%
Yes, probably 26 23.6% 31 28.7% 16 28.6% 27 31.8% 13 31.7% 113 28.2%
Subtotal 91 82.7% 86 79.6% 43 76.8% 59 69.4% 28 68.3% 307 76.8%
No, probably not
14 12.7% 16 14.8% 6 10.7% 22 25.9% 9 22.0% 67 16.8%
No, definitely not
3 2.7% 6 5.6% 4 7.1% 3 3.5% 2 4.9% 18 4.5%
Subtotal 17 15.5% 22 20.4% 10 17.9% 25 29.4% 11 26.8% 85 21.2%
Did not respond
2 1.8% 0 .0% 3 5.4% 1 1.2% 2 4.9% 8 2.0%
Total 110 100.0% 108 100.0% 56 100.0% 85 100.0% 41 100.0% 400 100.0%

Patients Speak Out 2009 Appendix A: Results for Community Treatment Programs
133
Table 11c Responses to Questions 1‐6 of the DBHR Adult Patient Satisfaction Survey by Year of Survey in Long‐term Residential
Year
2004 2005 2006 2007 2009 Total
CountColumn
% CountColumn
% CountColumn
% CountColumn
% Count Column
% CountColumn
%
In an overall, general sense, how satisfied are you with the service you have received?
Very satisfied 133 30.0% 134 31.4% 143 32.3% 121 29.3% 202 32.0% 733 31.1%
Mostly satisfied
268 60.4% 254 59.5% 265 59.8% 242 58.6% 378 59.8% 1407 59.6%
Subtotal 401 90.3% 388 90.9% 408 92.1% 363 87.9% 580 91.8% 2140 90.7%
Dissatisfied 33 7.4% 30 7.0% 22 5.0% 39 9.4% 41 6.5% 165 7.0%
Very dissatisfied
7 1.6% 4 .9% 9 2.0% 9 2.2% 8 1.3% 37 1.6%
Subtotal 40 9.0% 34 8.0% 31 7.0% 48 11.6% 49 7.8% 202 8.6%
Did not respond
3 .7% 5 1.2% 4 .9% 2 .5% 3 .5% 17 .7%
Total 444 100.0% 427 100.0% 443 100.0% 413 100.0% 632 100.0% 2359 100.0%
In general, how satisfied are you with the comfort and appearance of this facility?
Very satisfied 163 36.7% 157 36.8% 147 33.2% 125 30.3% 194 30.7% 786 33.3%
Mostly satisfied
241 54.3% 219 51.3% 243 54.9% 216 52.3% 358 56.6% 1277 54.1%
Subtotal 404 91.0% 376 88.1% 390 88.0% 341 82.6% 552 87.3% 2063 87.5%
Dissatisfied 29 6.5% 48 11.2% 38 8.6% 56 13.6% 69 10.9% 240 10.2%
Very dissatisfied
8 1.8% 1 .2% 12 2.7% 13 3.1% 6 .9% 40 1.7%
Subtotal 37 8.3% 49 11.5% 50 11.3% 69 16.7% 75 11.9% 280 11.9%
Did not respond
3 .7% 2 .5% 3 .7% 3 .7% 5 .8% 16 .7%
Total 444 100.0% 427 100.0% 443 100.0% 413 100.0% 632 100.0% 2359 100.0%
Would you say our staff treated you with respect?
All of the time
217 48.9% 245 57.4% 206 46.5% 200 48.4% 298 47.2% 1166 49.4%
Some of the time
194 43.7% 165 38.6% 210 47.4% 183 44.3% 296 46.8% 1048 44.4%
Subtotal 411 92.6% 410 96.0% 416 93.9% 383 92.7% 594 94.0% 2214 93.9%
Little of the time
24 5.4% 14 3.3% 19 4.3% 23 5.6% 32 5.1% 112 4.7%
Never 2 .5% 0 .0% 4 .9% 3 .7% 0 .0% 9 .4%
Subtotal 26 5.9% 14 3.3% 23 5.2% 26 6.3% 32 5.1% 121 5.1%
Did not respond
7 1.6% 3 .7% 4 .9% 4 1.0% 6 .9% 24 1.0%
Total 444 100.0% 427 100.0% 443 100.0% 413 100.0% 632 100.0% 2359 100.0%
How do you rate the helpfulness of the group sessions?
Very helpful 228 51.4% 213 49.9% 228 51.5% 209 50.6% 359 56.8% 1237 52.4%
Somewhat helpful
188 42.3% 190 44.5% 190 42.9% 174 42.1% 243 38.4% 985 41.8%
Subtotal 416 93.7% 403 94.4% 418 94.4% 383 92.7% 602 95.3% 2222 94.2%
Not helpful 18 4.1% 21 4.9% 17 3.8% 17 4.1% 20 3.2% 93 3.9%
Made things worse
3 .7% 0 .0% 2 .5% 4 1.0% 1 .2% 10 .4%
Subtotal 21 4.7% 21 4.9% 19 4.3% 21 5.1% 21 3.3% 103 4.4%
Did not receive
1 .2% 1 .2% 4 .9% 5 1.2% 5 .8% 16 .7%
Did not respond
6 1.4% 2 .5% 2 .5% 4 1.0% 4 .6% 18 .8%
Total 444 100.0% 427 100.0% 443 100.0% 413 100.0% 632 100.0% 2359 100.0%
Continued next page.

Patients Speak Out 2009 Appendix A: Results for Community Treatment Programs
134
How do you rate the helpfulness of the individual counseling?
Very helpful 215 48.4% 201 47.1% 224 50.6% 206 49.9% 360 57.0% 1206 51.1%
Somewhat helpful
130 29.3% 120 28.1% 124 28.0% 115 27.8% 186 29.4% 675 28.6%
Subtotal 345 77.7% 321 75.2% 348 78.6% 321 77.7% 546 86.4% 1881 79.7%
Not helpful 20 4.5% 17 4.0% 23 5.2% 18 4.4% 29 4.6% 107 4.5%
Made things worse
1 .2% 0 .0% 0 .0% 2 .5% 3 .5% 6 .3%
Subtotal 21 4.7% 17 4.0% 23 5.2% 20 4.8% 32 5.1% 113 4.8%
Did not receive
64 14.4% 79 18.5% 68 15.3% 46 11.1% 46 7.3% 303 12.8%
Did not respond
14 3.2% 10 2.3% 4 .9% 26 6.3% 8 1.3% 62 2.6%
Total 444 100.0% 427 100.0% 443 100.0% 413 100.0% 632 100.0% 2359 100.0%
Would you come back to this program?
Yes, definitely
154 34.7% 154 36.1% 151 34.1% 134 32.4% 193 30.5% 786 33.3%
Yes, probably
157 35.4% 158 37.0% 165 37.2% 159 38.5% 264 41.8% 903 38.3%
Subtotal 311 70.0% 312 73.1% 316 71.3% 293 70.9% 457 72.3% 1689 71.6%
No, probably not
73 16.4% 75 17.6% 85 19.2% 75 18.2% 104 16.5% 412 17.5%
No, definitely not
46 10.4% 25 5.9% 27 6.1% 34 8.2% 47 7.4% 179 7.6%
Subtotal 119 26.8% 100 23.4% 112 25.3% 109 26.4% 151 23.9% 591 25.1%
Did not respond
14 3.2% 15 3.5% 15 3.4% 11 2.7% 24 3.8% 79 3.3%
Total 444 100.0% 427 100.0% 443 100.0% 413 100.0% 632 100.0% 2359 100.0%

Patients Speak Out 2009 Appendix A: Results for Community Treatment Programs
135
Table 11d Responses to Questions 1‐6 of the DBHR Adult Patient Satisfaction Survey by Year of Survey in Outpatient/Intensive Outpatient
Year
2004 2005 2006 2007 2009 Total
CountColumn
% CountColumn
% CountColumn
% CountColumn
% Count Column
% CountColumn
%
In an overall, general sense, how satisfied are you with the service you have received?
Very satisfied 6923 56.4% 7473 58.1% 7874 58.1% 8197 58.9% 8795 60.6% 39262 58.5%
Mostly satisfied
4856 39.6% 5019 39.0% 5292 39.0% 5317 38.2% 5294 36.5% 25778 38.4%
Subtotal 11779 96.0% 12492 97.1% 13166 97.1% 13514 97.1% 14089 97.1% 65040 96.9%
Dissatisfied 245 2.0% 229 1.8% 244 1.8% 240 1.7% 267 1.8% 1225 1.8%
Very dissatisfied
80 .7% 78 .6% 86 .6% 75 .5% 87 .6% 406 .6%
Subtotal 325 2.6% 307 2.4% 330 2.4% 315 2.3% 354 2.4% 1631 2.4%
Did not respond
172 1.4% 70 .5% 67 .5% 83 .6% 61 .4% 453 .7%
Total 12276 100.0% 12869 100.0% 13563 100.0% 13912 100.0% 14504 100.0% 67124 100.0%
In general, how satisfied are you with the comfort and appearance of this facility?
Very satisfied 6782 55.2% 7283 56.6% 7661 56.5% 7839 56.3% 8578 59.1% 38143 56.8%
Mostly satisfied
4939 40.2% 5103 39.7% 5375 39.6% 5564 40.0% 5446 37.5% 26427 39.4%
Subtotal 11721 95.5% 12386 96.2% 13036 96.1% 13403 96.3% 14024 96.7% 64570 96.2%
Dissatisfied 315 2.6% 360 2.8% 389 2.9% 361 2.6% 342 2.4% 1767 2.6%
Very dissatisfied
67 .5% 62 .5% 68 .5% 68 .5% 81 .6% 346 .5%
Subtotal 382 3.1% 422 3.3% 457 3.4% 429 3.1% 423 2.9% 2113 3.1%
Did not respond
173 1.4% 61 .5% 70 .5% 80 .6% 57 .4% 441 .7%
Total 12276 100.0% 12869 100.0% 13563 100.0% 13912 100.0% 14504 100.0% 67124 100.0%
Would you say our staff treated you with respect?
All of the time
10554 86.0% 11298 87.8% 11850 87.4% 12109 87.0% 12715 87.7% 58526 87.2%
Some of the time
1420 11.6% 1385 10.8% 1513 11.2% 1594 11.5% 1574 10.9% 7486 11.2%
Subtotal 11974 97.5% 12683 98.6% 13363 98.5% 13703 98.5% 14289 98.5% 66012 98.3%
Little of the time
88 .7% 83 .6% 87 .6% 83 .6% 114 .8% 455 .7%
Never 19 .2% 25 .2% 25 .2% 21 .2% 25 .2% 115 .2%
Subtotal 107 .9% 108 .8% 112 .8% 104 .7% 139 1.0% 570 .8%
Did not respond
195 1.6% 78 .6% 88 .6% 105 .8% 76 .5% 542 .8%
Total 12276 100.0% 12869 100.0% 13563 100.0% 13912 100.0% 14504 100.0% 67124 100.0%
How do you rate the helpfulness of the group sessions?
Very helpful 7705 62.8% 8230 64.0% 8558 63.1% 8913 64.1% 9511 65.6% 42917 63.9%
Somewhat helpful
3846 31.3% 4030 31.3% 4335 32.0% 4335 31.2% 4236 29.2% 20782 31.0%
Subtotal 11551 94.1% 12260 95.3% 12893 95.1% 13248 95.2% 13747 94.8% 63699 94.9%
Not helpful 242 2.0% 257 2.0% 277 2.0% 255 1.8% 326 2.2% 1357 2.0%
Made things worse
22 .2% 31 .2% 23 .2% 39 .3% 35 .2% 150 .2%
Subtotal 264 2.2% 288 2.2% 300 2.2% 294 2.1% 361 2.5% 1507 2.2%
Did not receive
265 2.2% 220 1.7% 238 1.8% 233 1.7% 247 1.7% 1203 1.8%
Did not respond
196 1.6% 101 .8% 132 1.0% 137 1.0% 149 1.0% 715 1.1%
Total 12276 100.0% 12869 100.0% 13563 100.0% 13912 100.0% 14504 100.0% 67124 100.0%
Continued next page.

Patients Speak Out 2009 Appendix A: Results for Community Treatment Programs
136
How do you rate the helpfulness of the individual counseling?
Very helpful 7654 62.3% 8073 62.7% 8496 62.6% 8749 62.9% 9723 67.0% 42695 63.6%
Somewhat helpful
2909 23.7% 3133 24.3% 3223 23.8% 3366 24.2% 3215 22.2% 15846 23.6%
Subtotal 10563 86.0% 11206 87.1% 11719 86.4% 12115 87.1% 12938 89.2% 58541 87.2%
Not helpful 287 2.3% 282 2.2% 294 2.2% 291 2.1% 351 2.4% 1505 2.2%
Made things worse
18 .1% 17 .1% 21 .2% 36 .3% 38 .3% 130 .2%
Subtotal 305 2.5% 299 2.3% 315 2.3% 327 2.4% 389 2.7% 1635 2.4%
Did not receive
1118 9.1% 1175 9.1% 1314 9.7% 1255 9.0% 959 6.6% 5821 8.7%
Did not respond
290 2.4% 189 1.5% 215 1.6% 215 1.5% 218 1.5% 1127 1.7%
Total 12276 100.0% 12869 100.0% 13563 100.0% 13912 100.0% 14504 100.0% 67124 100.0%
Would you come back to this program?
Yes, definitely
7096 57.8% 7668 59.6% 8106 59.8% 8408 60.4% 9147 63.1% 40425 60.2%
Yes, probably
4020 32.7% 4074 31.7% 4291 31.6% 4294 30.9% 4123 28.4% 20802 31.0%
Subtotal 11116 90.6% 11742 91.2% 12397 91.4% 12702 91.3% 13270 91.5% 61227 91.2%
No, probably not
548 4.5% 619 4.8% 598 4.4% 649 4.7% 651 4.5% 3065 4.6%
No, definitely not
188 1.5% 176 1.4% 190 1.4% 179 1.3% 212 1.5% 945 1.4%
Subtotal 736 6.0% 795 6.2% 788 5.8% 828 6.0% 863 6.0% 4010 6.0%
Did not respond
424 3.5% 332 2.6% 378 2.8% 382 2.7% 371 2.6% 1887 2.8%
Total 12276 100.0% 12869 100.0% 13563 100.0% 13912 100.0% 14504 100.0% 67124 100.0%

Patients Speak Out 2009 Appendix A: Results for Community Treatment Programs
137
Table 11e Responses to Questions 1‐6 of the DBHR Adult Patient Satisfaction Survey by Year of Survey in Opiate Substitution*
year
2004 2005 2006 2007 2009 Total
CountColumn
% CountColumn
% CountColumn
% CountColumn
% Count Column
% CountColumn
%
In an overall, general sense, how satisfied are you with the service you have received?
Very satisfied 680 39.7% 851 45.6% 931 42.9% 926 42.9% 1229 40.7% 4617 42.3%
Mostly satisfied
891 52.0% 894 47.9% 1089 50.2% 1065 49.4% 1534 50.8% 5473 50.1%
Subtotal 1571 91.7% 1745 93.4% 2020 93.1% 1991 92.3% 2763 91.6% 10090 92.3%
Dissatisfied 83 4.8% 77 4.1% 90 4.1% 109 5.1% 168 5.6% 527 4.8%
Very dissatisfied
34 2.0% 34 1.8% 45 2.1% 41 1.9% 68 2.3% 222 2.0%
Subtotal 117 6.8% 111 5.9% 135 6.2% 150 7.0% 236 7.8% 749 6.9%
Did not respond
25 1.5% 12 .6% 15 .7% 17 .8% 19 .6% 88 .8%
Total 1713 100.0% 1868 100.0% 2170 100.0% 2158 100.0% 3018 100.0% 10927 100.0%
In general, how satisfied are you with the comfort and appearance of this facility?
Very satisfied 708 41.3% 881 47.2% 949 43.7% 962 44.6% 1222 40.5% 4722 43.2%
Mostly satisfied
866 50.6% 863 46.2% 1047 48.2% 1011 46.8% 1479 49.0% 5266 48.2%
Subtotal 1574 91.9% 1744 93.4% 1996 92.0% 1973 91.4% 2701 89.5% 9988 91.4%
Dissatisfied 84 4.9% 88 4.7% 129 5.9% 140 6.5% 210 7.0% 651 6.0%
Very dissatisfied
30 1.8% 23 1.2% 33 1.5% 27 1.3% 71 2.4% 184 1.7%
Subtotal 114 6.7% 111 5.9% 162 7.5% 167 7.7% 281 9.3% 835 7.6%
Did not respond
25 1.5% 13 .7% 12 .6% 18 .8% 36 1.2% 104 1.0%
Total 1713 100.0% 1868 100.0% 2170 100.0% 2158 100.0% 3018 100.0% 10927 100.0%
Would you say our staff treated you with respect?
All of the time
1104 64.4% 1279 68.5% 1444 66.5% 1411 65.4% 1923 63.7% 7161 65.5%
Some of the time
507 29.6% 506 27.1% 619 28.5% 638 29.6% 898 29.8% 3168 29.0%
Subtotal 1611 94.0% 1785 95.6% 2063 95.1% 2049 94.9% 2821 93.5% 10329 94.5%
Little of the time
58 3.4% 47 2.5% 69 3.2% 68 3.2% 144 4.8% 386 3.5%
Never 6 .4% 9 .5% 13 .6% 13 .6% 15 .5% 56 .5%
Subtotal 64 3.7% 56 3.0% 82 3.8% 81 3.8% 159 5.3% 442 4.0%
Did not respond
38 2.2% 27 1.4% 25 1.2% 28 1.3% 38 1.3% 156 1.4%
Total 1713 100.0% 1868 100.0% 2170 100.0% 2158 100.0% 3018 100.0% 10927 100.0%
How do you rate the helpfulness of the group sessions?
Very helpful 612 35.7% 652 34.9% 764 35.2% 785 36.4% 1185 39.3% 3998 36.6%
Somewhat helpful
645 37.7% 640 34.3% 745 34.3% 758 35.1% 965 32.0% 3753 34.3%
Subtotal 1257 73.4% 1292 69.2% 1509 69.5% 1543 71.5% 2150 71.2% 7751 70.9%
Not helpful 137 8.0% 124 6.6% 160 7.4% 159 7.4% 206 6.8% 786 7.2%
Made things worse
15 .9% 19 1.0% 25 1.2% 24 1.1% 33 1.1% 116 1.1%
Subtotal 152 8.9% 143 7.7% 185 8.5% 183 8.5% 239 7.9% 902 8.3%
Did not receive
258 15.1% 389 20.8% 432 19.9% 390 18.1% 556 18.4% 2025 18.5%
Did not respond
46 2.7% 44 2.4% 44 2.0% 42 1.9% 73 2.4% 249 2.3%
Total 1713 100.0% 1868 100.0% 2170 100.0% 2158 100.0% 3018 100.0% 10927 100.0%
Continued next page.

Patients Speak Out 2009 Appendix A: Results for Community Treatment Programs
138
How do you rate the helpfulness of the individual counseling?
Very helpful 960 56.0% 1075 57.5% 1183 54.5% 1134 52.5% 1650 54.7% 6002 54.9%
Somewhat helpful
577 33.7% 577 30.9% 747 34.4% 733 34.0% 961 31.8% 3595 32.9%
Subtotal 1537 89.7% 1652 88.4% 1930 88.9% 1867 86.5% 2611 86.5% 9597 87.8%
Not helpful 93 5.4% 100 5.4% 121 5.6% 151 7.0% 214 7.1% 679 6.2%
Made things worse
8 .5% 17 .9% 27 1.2% 42 1.9% 40 1.3% 134 1.2%
Subtotal 101 5.9% 117 6.3% 148 6.8% 193 8.9% 254 8.4% 813 7.4%
Did not receive
31 1.8% 49 2.6% 40 1.8% 56 2.6% 82 2.7% 258 2.4%
Did not respond
44 2.6% 50 2.7% 52 2.4% 42 1.9% 71 2.4% 259 2.4%
Total 1713 100.0% 1868 100.0% 2170 100.0% 2158 100.0% 3018 100.0% 10927 100.0%
Would you come back to this program?
Yes, definitely 1131 66.0% 1233 66.0% 1443 66.5% 1383 64.1% 1929 63.9% 7119 65.2%
Yes, probably 414 24.2% 455 24.4% 510 23.5% 546 25.3% 718 23.8% 2643 24.2%
Subtotal 1545 90.2% 1688 90.4% 1953 90.0% 1929 89.4% 2647 87.7% 9762 89.3%
No, probably not
72 4.2% 89 4.8% 102 4.7% 115 5.3% 177 5.9% 555 5.1%
No, definitely not
24 1.4% 28 1.5% 32 1.5% 43 2.0% 72 2.4% 199 1.8%
Subtotal 96 5.6% 117 6.3% 134 6.2% 158 7.3% 249 8.3% 754 6.9%
Did not respond
72 4.2% 63 3.4% 83 3.8% 71 3.3% 122 4.0% 411 3.8%
Total 1713 100.0% 1868 100.0% 2170 100.0% 2158 100.0% 3018 100.0% 10927 100.0%
*Results for opiate substitution should be interpreted with caution since fewer than 70 percent of patients receiving treatment in participating opiate substitution programs completed the survey in each year.

Patients Speak Out 2009 Appendix A: Results for Community Treatment Programs
139
Table 12 Responses to Questions 1‐7 of the DBHR Youth Patient Satisfaction Survey, March 23‐27, 2009
Treatment Modality
Intensive Inpatient Recovery House OP/IOP Total
Count Column % CountColumn
% Count Column
% Count Column
%
How satisfied are you with the service you have received? Very satisfied 44 22.8% 11 33.3% 578 44.0% 633 41.1%
Mostly satisfied 119 61.7% 20 60.6% 633 48.1% 772 50.1%
Subtotal 163 84.5% 31 93.9% 1211 92.1% 1405 91.2%
Dissatisfied 28 14.5% 1 3.0% 59 4.5% 88 5.7%
Very dissatisfied 2 1.0% 1 3.0% 35 2.7% 38 2.5%
Subtotal 30 15.5% 2 6.1% 94 7.1% 126 8.2%
Did not respond 0 .0% 0 .0% 10 .8% 10 .6%
Total 193 100.0% 33 100.0% 1315 100.0% 1541 100.0%
How satisfied are you with the comfort and appearance of this facility?
Very satisfied 38 19.7% 18 54.5% 636 48.4% 692 44.9%
Mostly satisfied 129 66.8% 11 33.3% 597 45.4% 737 47.8%
Subtotal 167 86.5% 29 87.9% 1233 93.8% 1429 92.7%
Dissatisfied 19 9.8% 3 9.1% 53 4.0% 75 4.9%
Very dissatisfied 7 3.6% 1 3.0% 21 1.6% 29 1.9%
Subtotal 26 13.5% 4 12.1% 74 5.6% 104 6.7%
Did not respond 0 .0% 0 .0% 8 .6% 8 .5%
Total 193 100.0% 33 100.0% 1315 100.0% 1541 100.0%
Would you say our staff treated you with respect? All of the time 67 34.7% 21 63.6% 1067 81.1% 1155 75.0%
Some of the time
102 52.8% 12 36.4% 203 15.4% 317 20.6%
Subtotal 169 87.6% 33 100.0% 1270 96.6% 1472 95.5%
Little of the time
21 10.9% 0 .0% 25 1.9% 46 3.0%
Never 2 1.0% 0 .0% 13 1.0% 15 1.0%
Subtotal 23 11.9% 0 .0% 38 2.9% 61 4.0%
Did not respond 1 .5% 0 .0% 7 .5% 8 .5%
Total 193 100.0% 33 100.0% 1315 100.0% 1541 100.0%
How safe do you feel in this program? Very safe 109 56.5% 22 66.7% 929 70.6% 1060 68.8%
Somewhat safe 73 37.8% 10 30.3% 316 24.0% 399 25.9%
Subtotal 182 94.3% 32 97.0% 1245 94.7% 1459 94.7%
Not very safe 8 4.1% 0 .0% 30 2.3% 38 2.5%
Not safe at all 2 1.0% 1 3.0% 17 1.3% 20 1.3%
Subtotal 10 5.2% 1 3.0% 47 3.6% 58 3.8%
Did not respond 1 .5% 0 .0% 23 1.7% 24 1.6%
Total 193 100.0% 33 100.0% 1315 100.0% 1541 100.0%
Continued next page.

Patients Speak Out 2009 Appendix A: Results for Community Treatment Programs
140
How helpful are the group sessions? Very helpful 66 34.2% 10 30.3% 498 37.9% 574 37.2%
Somewhat helpful
98 50.8% 18 54.5% 600 45.6% 716 46.5%
Subtotal 164 85.0% 28 84.8% 1098 83.5% 1290 83.7%
Not helpful 26 13.5% 3 9.1% 115 8.7% 144 9.3%
Made things worse
1 .5% 1 3.0% 20 1.5% 22 1.4%
Subtotal 27 14.0% 4 12.1% 135 10.3% 166 10.8%
Did not receive 0 .0% 1 3.0% 67 5.1% 68 4.4%
Did not respond 2 1.0% 0 .0% 15 1.1% 17 1.1%
Total 193 100.0% 33 100.0% 1315 100.0% 1541 100.0%
How helpful is the individual counseling? Very helpful 96 49.7% 13 39.4% 594 45.2% 703 45.6%
Somewhat helpful
73 37.8% 18 54.5% 469 35.7% 560 36.3%
Subtotal 169 87.6% 31 93.9% 1063 80.8% 1263 82.0%
Not helpful 13 6.7% 0 .0% 86 6.5% 99 6.4%
Made things worse
2 1.0% 1 3.0% 14 1.1% 17 1.1%
Subtotal 15 7.8% 1 3.0% 100 7.6% 116 7.5%
Did not receive 9 4.7% 1 3.0% 135 10.3% 145 9.4%
Did not respond 0 .0% 0 .0% 17 1.3% 17 1.1%
Total 193 100.0% 33 100.0% 1315 100.0% 1541 100.0%
If you were to seek help again, would you come back to this program?
Yes, definitely 44 22.8% 16 48.5% 562 42.7% 622 40.4%
Yes, probably 88 45.6% 12 36.4% 535 40.7% 635 41.2%
Subtotal 132 68.4% 28 84.8% 1097 83.4% 1257 81.6%
No, probably not
35 18.1% 3 9.1% 130 9.9% 168 10.9%
No, definitely not
24 12.4% 2 6.1% 69 5.2% 95 6.2%
Subtotal 59 30.6% 5 15.2% 199 15.1% 263 17.1%
Did not respond 2 1.0% 0 .0% 19 1.4% 21 1.4%
Total 193 100.0% 33 100.0% 1315 100.0% 1541 100.0%

Patients Speak Out 2009 Appendix A: Results for Community Treatment Programs
141
Table 13 Characteristics of Patients Completing the DBHR Youth Patient Satisfaction Survey, March 23‐27, 2009
Treatment Modality
Intensive Inpatient Recovery House OP/IOP Total
Count Column % Count Column % Count Column % Count Column %
Age 13 and younger 4 2.1% 0 .0% 48 3.7% 52 3.4%
14 ‐ 15 44 22.8% 4 12.1% 371 28.2% 419 27.2%
16 ‐ 17 130 67.4% 23 69.7% 681 51.8% 834 54.1%
18 ‐ 23 14 7.3% 6 18.2% 161 12.2% 181 11.7%
Unknown 1 .5% 0 .0% 54 4.1% 55 3.6%
Total 193 100.0% 33 100.0% 1315 100.0% 1541 100.0%
Gender Male 112 58.0% 24 72.7% 836 63.6% 972 63.1%
Female 77 39.9% 9 27.3% 444 33.8% 530 34.4%
Unknown 4 2.1% 0 .0% 35 2.7% 39 2.5%
Total 193 100.0% 33 100.0% 1315 100.0% 1541 100.0%
Ethnic/Racial Background White 94 48.7% 20 60.6% 694 52.8% 808 52.4%
Black/African American 12 6.2% 2 6.1% 97 7.4% 111 7.2%
Asian/Pacific Islander 4 2.1% 1 3.0% 44 3.3% 49 3.2%
Native American/Eskimo/Aleut 28 14.5% 2 6.1% 82 6.2% 112 7.3%
Hispanic 23 11.9% 4 12.1% 193 14.7% 220 14.3%
Multiracial 26 13.5% 2 6.1% 136 10.3% 164 10.6%
Other 6 3.1% 1 3.0% 46 3.5% 53 3.4%
Unknown 0 .0% 1 3.0% 23 1.7% 24 1.6%
Total 193 100.0% 33 100.0% 1315 100.0% 1541 100.0%
Length of Stay in Treatment 15 days or less 60 31.1% 7 21.2% 196 14.9% 263 17.1%
16 ‐ 30 days 56 29.0% 6 18.2% 103 7.8% 165 10.7%
31 ‐ 45 days 18 9.3% 3 9.1% 80 6.1% 101 6.6%
46 ‐ 60 days 16 8.3% 4 12.1% 92 7.0% 112 7.3%
61 ‐ 75 days 12 6.2% 5 15.2% 81 6.2% 98 6.4%
76 ‐ 90 days 7 3.6% 1 3.0% 63 4.8% 71 4.6%
Over 90 days 4 2.1% 3 9.1% 412 31.3% 419 27.2%
Unknown 20 10.4% 4 12.1% 288 21.9% 312 20.2%
Total 193 100.0% 33 100.0% 1315 100.0% 1541 100.0%
Source of Funding Private 45 23.3% 11 33.3% 268 20.4% 324 21.0%
Public 105 54.4% 12 36.4% 561 42.7% 678 44.0%
Other 22 11.4% 5 15.2% 230 17.5% 257 16.7%
Unknown 21 10.9% 5 15.2% 256 19.5% 282 18.3%
Total 193 100.0% 33 100.0% 1315 100.0% 1541 100.0%

Patients Speak Out 2009 Appendix A: Results for Community Treatment Programs
142
Table 14 Responses to Questions 1 and 3 of the DBHR Youth Patient Satisfaction Survey by Treatment Modality and Gender
Intensive Inpatient
Gender
Male Female Unknown Total
Count Column % Count Column % Count Column % Count Column %
How satisfied are you with the service you have received? Very satisfied 27 24.1% 17 22.1% 0 .0% 44 22.8%
Mostly satisfied 68 60.7% 47 61.0% 4 100.0% 119 61.7%
Subtotal 95 84.8% 64 83.1% 4 100.0% 163 84.5%
Dissatisfied 15 13.4% 13 16.9% 0 .0% 28 14.5%
Very dissatisfied 2 1.8% 0 .0% 0 .0% 2 1.0%
Subtotal 17 15.2% 13 16.9% 0 .0% 30 15.5%
Did not respond 0 .0% 0 .0% 0 .0% 0 .0%
Total 112 100.0% 77 100.0% 4 100.0% 193 100.0%
Would you say our staff treated you with respect? All of the time 43 38.4% 24 31.2% 0 .0% 67 34.7%
Some of the time 53 47.3% 46 59.7% 3 75.0% 102 52.8%
Subtotal 96 85.7% 70 90.9% 3 75.0% 169 87.6%
Little of the time 14 12.5% 6 7.8% 1 25.0% 21 10.9%
Never 2 1.8% 0 .0% 0 .0% 2 1.0%
Subtotal 16 14.3% 6 7.8% 1 25.0% 23 11.9%
Did not respond 0 .0% 1 1.3% 0 .0% 1 .5%
Total 112 100.0% 77 100.0% 4 100.0% 193 100.0%
Recovery House
Gender
Male Female Unknown Total
Count Column % Count Column % Count Column % Count Column %
How satisfied are you with the service you have received? Very satisfied 9 37.5% 2 22.2% 0 .0% 11 33.3%
Mostly satisfied 15 62.5% 5 55.6% 0 .0% 20 60.6%
Subtotal 24 100.0% 7 77.8% 0 .0% 31 93.9%
Dissatisfied 0 .0% 1 11.1% 0 .0% 1 3.0%
Very dissatisfied 0 .0% 1 11.1% 0 .0% 1 3.0%
Subtotal 0 .0% 2 22.2% 0 .0% 2 6.1%
Did not respond 0 .0% 0 .0% 0 .0% 0 .0%
Total 24 100.0% 9 100.0% 0 .0% 33 100.0%
Would you say our staff treated you with respect? All of the time 16 66.7% 5 55.6% 0 .0% 21 63.6%
Some of the time 8 33.3% 4 44.4% 0 .0% 12 36.4%
Subtotal 24 100.0% 9 100.0% 0 .0% 33 100.0%
Little of the time 0 .0% 0 .0% 0 .0% 0 .0%
Never 0 .0% 0 .0% 0 .0% 0 .0%
Subtotal 0 .0% 0 .0% 0 .0% 0 .0%
Did not respond 0 .0% 0 .0% 0 .0% 0 .0%
Total 24 100.0% 9 100.0% 0 .0% 33 100.0%
Continued next page.

Patients Speak Out 2009 Appendix A: Results for Community Treatment Programs
143
Outpatient/Intensive Outpatient
Gender
Male Female Unknown Total
Count Column % Count Column % Count Column % Count Column %
How satisfied are you with the service you have received? Very satisfied 335 40.1% 227 51.1% 16 45.7% 578 44.0%
Mostly satisfied 423 50.6% 192 43.2% 18 51.4% 633 48.1%
Subtotal 758 90.7% 419 94.4% 34 97.1% 1211 92.1%
Dissatisfied 43 5.1% 16 3.6% 0 .0% 59 4.5%
Very dissatisfied 28 3.3% 6 1.4% 1 2.9% 35 2.7%
Subtotal 71 8.5% 22 5.0% 1 2.9% 94 7.1%
Did not respond 7 .8% 3 .7% 0 .0% 10 .8%
Total 836 100.0% 444 100.0% 35 100.0% 1315 100.0%
Would you say our staff treated you with respect? All of the time 677 81.0% 366 82.4% 24 68.6% 1067 81.1%
Some of the time 131 15.7% 66 14.9% 6 17.1% 203 15.4%
Subtotal 808 96.7% 432 97.3% 30 85.7% 1270 96.6%
Little of the time 16 1.9% 7 1.6% 2 5.7% 25 1.9%
Never 9 1.1% 2 .5% 2 5.7% 13 1.0%
Subtotal 25 3.0% 9 2.0% 4 11.4% 38 2.9%
Did not respond 3 .4% 3 .7% 1 2.9% 7 .5%
Total 836 100.0% 444 100.0% 35 100.0% 1315 100.0%

Patients Speak Out 2009 Appendix A: Results for Community Treatment Programs
144
Table 15 Responses to Questions 1 and 3 of the DBHR Youth Patient Satisfaction Survey by Treatment Modality
and Ethnic/Racial Background Residential Treatment
Ethnic/Racial Background
White Non‐White Unknown Total
Count Column % Count Column % Count Column % Count Column %
How satisfied are you with the service you have received? Very satisfied 32 28.1% 23 20.7% 0 .0% 55 24.3%
Mostly satisfied 66 57.9% 72 64.9% 1 100.0% 139 61.5%
Subtotal 98 86.0% 95 85.6% 1 100.0% 194 85.8%
Dissatisfied 15 13.2% 14 12.6% 0 .0% 29 12.8%
Very dissatisfied 1 .9% 2 1.8% 0 .0% 3 1.3%
Subtotal 16 14.0% 16 14.4% 0 .0% 32 14.2%
Did not respond 0 .0% 0 .0% 0 .0% 0 .0%
Total 114 100.0% 111 100.0% 1 100.0% 226 100.0%
Would you say our staff treated you with respect? All of the time 44 38.6% 43 38.7% 1 100.0% 88 38.9%
Some of the time 61 53.5% 53 47.7% 0 .0% 114 50.4%
Subtotal 105 92.1% 96 86.5% 1 100.0% 202 89.4%
Little of the time 9 7.9% 12 10.8% 0 .0% 21 9.3%
Never 0 .0% 2 1.8% 0 .0% 2 .9%
Subtotal 9 7.9% 14 12.6% 0 .0% 23 10.2%
Did not respond 0 .0% 1 .9% 0 .0% 1 .4%
Total 114 100.0% 111 100.0% 1 100.0% 226 100.0%
Outpatient/Intensive Outpatient
Ethnic/Racial Background
White Non‐White Unknown Total
Count Column % Count Column % Count Column % Count Column %
How satisfied are you with the service you have received? Very satisfied 316 45.5% 252 42.1% 10 43.5% 578 44.0%
Mostly satisfied 319 46.0% 302 50.5% 12 52.2% 633 48.1%
Subtotal 635 91.5% 554 92.6% 22 95.7% 1211 92.1%
Dissatisfied 38 5.5% 21 3.5% 0 .0% 59 4.5%
Very dissatisfied 16 2.3% 19 3.2% 0 .0% 35 2.7%
Subtotal 54 7.8% 40 6.7% 0 .0% 94 7.1%
Did not respond 5 .7% 4 .7% 1 4.3% 10 .8%
Total 694 100.0% 598 100.0% 23 100.0% 1315 100.0%
Would you say our staff treated you with respect? All of the time 569 82.0% 482 80.6% 16 69.6% 1067 81.1%
Some of the time 111 16.0% 89 14.9% 3 13.0% 203 15.4%
Subtotal 680 98.0% 571 95.5% 19 82.6% 1270 96.6%
Little of the time 8 1.2% 16 2.7% 1 4.3% 25 1.9%
Never 6 .9% 7 1.2% 0 .0% 13 1.0%
Subtotal 14 2.0% 23 3.8% 1 4.3% 38 2.9%
Did not respond 0 .0% 4 .7% 3 13.0% 7 .5%
Total 694 100.0% 598 100.0% 23 100.0% 1315 100.0%
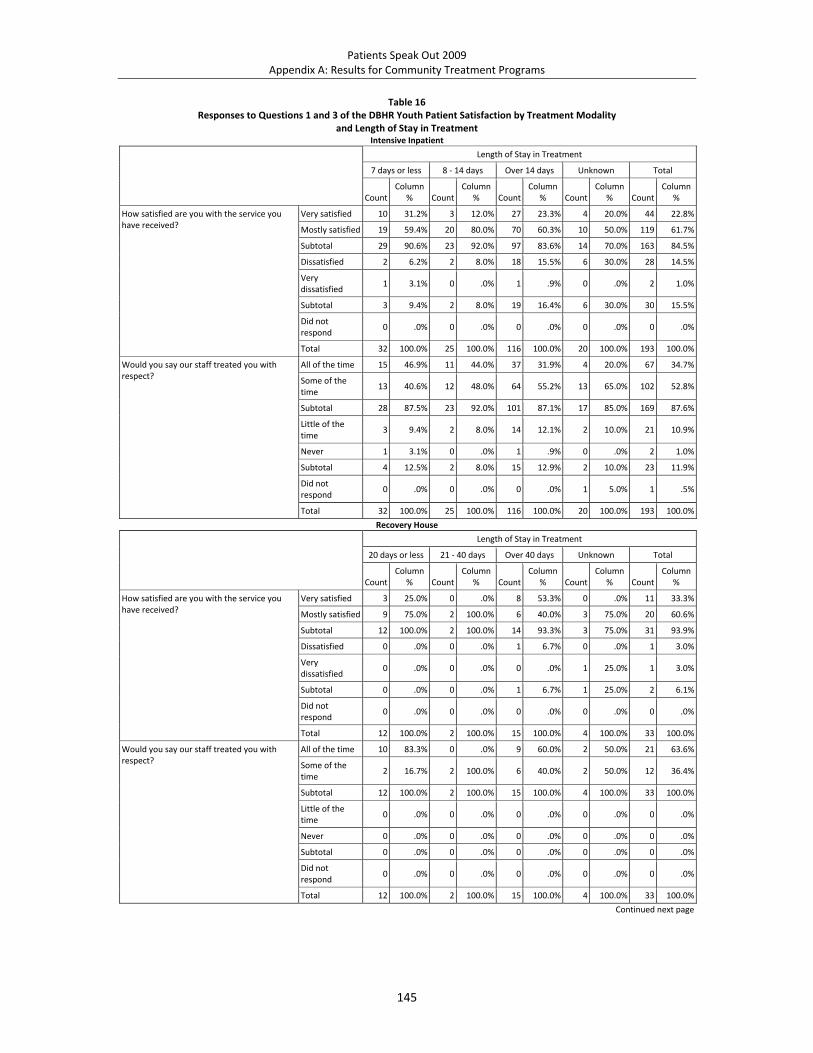
Patients Speak Out 2009 Appendix A: Results for Community Treatment Programs
145
Table 16 Responses to Questions 1 and 3 of the DBHR Youth Patient Satisfaction by Treatment Modality
and Length of Stay in Treatment Intensive Inpatient
Length of Stay in Treatment
7 days or less 8 ‐ 14 days Over 14 days Unknown Total
CountColumn
% CountColumn
% CountColumn
% Count Column
% CountColumn
%
How satisfied are you with the service you have received?
Very satisfied 10 31.2% 3 12.0% 27 23.3% 4 20.0% 44 22.8%
Mostly satisfied 19 59.4% 20 80.0% 70 60.3% 10 50.0% 119 61.7%
Subtotal 29 90.6% 23 92.0% 97 83.6% 14 70.0% 163 84.5%
Dissatisfied 2 6.2% 2 8.0% 18 15.5% 6 30.0% 28 14.5%
Very dissatisfied
1 3.1% 0 .0% 1 .9% 0 .0% 2 1.0%
Subtotal 3 9.4% 2 8.0% 19 16.4% 6 30.0% 30 15.5%
Did not respond
0 .0% 0 .0% 0 .0% 0 .0% 0 .0%
Total 32 100.0% 25 100.0% 116 100.0% 20 100.0% 193 100.0%
Would you say our staff treated you with respect?
All of the time 15 46.9% 11 44.0% 37 31.9% 4 20.0% 67 34.7%
Some of the time
13 40.6% 12 48.0% 64 55.2% 13 65.0% 102 52.8%
Subtotal 28 87.5% 23 92.0% 101 87.1% 17 85.0% 169 87.6%
Little of the time
3 9.4% 2 8.0% 14 12.1% 2 10.0% 21 10.9%
Never 1 3.1% 0 .0% 1 .9% 0 .0% 2 1.0%
Subtotal 4 12.5% 2 8.0% 15 12.9% 2 10.0% 23 11.9%
Did not respond
0 .0% 0 .0% 0 .0% 1 5.0% 1 .5%
Total 32 100.0% 25 100.0% 116 100.0% 20 100.0% 193 100.0%
Recovery House
Length of Stay in Treatment
20 days or less 21 ‐ 40 days Over 40 days Unknown Total
CountColumn
% CountColumn
% CountColumn
% Count Column
% CountColumn
%
How satisfied are you with the service you have received?
Very satisfied 3 25.0% 0 .0% 8 53.3% 0 .0% 11 33.3%
Mostly satisfied 9 75.0% 2 100.0% 6 40.0% 3 75.0% 20 60.6%
Subtotal 12 100.0% 2 100.0% 14 93.3% 3 75.0% 31 93.9%
Dissatisfied 0 .0% 0 .0% 1 6.7% 0 .0% 1 3.0%
Very dissatisfied
0 .0% 0 .0% 0 .0% 1 25.0% 1 3.0%
Subtotal 0 .0% 0 .0% 1 6.7% 1 25.0% 2 6.1%
Did not respond
0 .0% 0 .0% 0 .0% 0 .0% 0 .0%
Total 12 100.0% 2 100.0% 15 100.0% 4 100.0% 33 100.0%
Would you say our staff treated you with respect?
All of the time 10 83.3% 0 .0% 9 60.0% 2 50.0% 21 63.6%
Some of the time
2 16.7% 2 100.0% 6 40.0% 2 50.0% 12 36.4%
Subtotal 12 100.0% 2 100.0% 15 100.0% 4 100.0% 33 100.0%
Little of the time
0 .0% 0 .0% 0 .0% 0 .0% 0 .0%
Never 0 .0% 0 .0% 0 .0% 0 .0% 0 .0%
Subtotal 0 .0% 0 .0% 0 .0% 0 .0% 0 .0%
Did not respond
0 .0% 0 .0% 0 .0% 0 .0% 0 .0%
Total 12 100.0% 2 100.0% 15 100.0% 4 100.0% 33 100.0%
Continued next page

Patients Speak Out 2009 Appendix A: Results for Community Treatment Programs
146
Outpatient/Intensive Outpatient
Length of Stay in Treatment
30 days or less 31 ‐ 60 days Over 60 days Unknown Total
CountColumn
% CountColumn
% CountColumn
% Count Column
% CountColumn
%
How satisfied are you with the service you have received?
Very satisfied 120 40.1% 64 37.2% 273 49.1% 121 42.0% 578 44.0%
Mostly satisfied 164 54.8% 92 53.5% 245 44.1% 132 45.8% 633 48.1%
Subtotal 284 95.0% 156 90.7% 518 93.2% 253 87.8% 1211 92.1%
Dissatisfied 8 2.7% 11 6.4% 21 3.8% 19 6.6% 59 4.5%
Very dissatisfied
6 2.0% 3 1.7% 13 2.3% 13 4.5% 35 2.7%
Subtotal 14 4.7% 14 8.1% 34 6.1% 32 11.1% 94 7.1%
Did not respond
1 .3% 2 1.2% 4 .7% 3 1.0% 10 .8%
Total 299 100.0% 172 100.0% 556 100.0% 288 100.0% 1315 100.0%
Would you say our staff treated you with respect?
All of the time 246 82.3% 137 79.7% 450 80.9% 234 81.2% 1067 81.1%
Some of the time
48 16.1% 27 15.7% 92 16.5% 36 12.5% 203 15.4%
Subtotal 294 98.3% 164 95.3% 542 97.5% 270 93.8% 1270 96.6%
Little of the time
4 1.3% 5 2.9% 8 1.4% 8 2.8% 25 1.9%
Never 1 .3% 1 .6% 4 .7% 7 2.4% 13 1.0%
Subtotal 5 1.7% 6 3.5% 12 2.2% 15 5.2% 38 2.9%
Did not respond
0 .0% 2 1.2% 2 .4% 3 1.0% 7 .5%
Total 299 100.0% 172 100.0% 556 100.0% 288 100.0% 1315 100.0%

Patients Speak Out 2009 Appendix A: Results for Community Treatment Programs
147
Table 17 Responses to Questions 1 and 3 of the DBHR Youth Patient Satisfaction Survey by Treatment Modality and Funding
Residential Treatment
Source of Funding
Private Public Other Unknown Total
CountColumn
% CountColumn
% CountColumn
% Count Column
% CountColumn
%
How satisfied are you with the service you have received?
Very satisfied 14 25.0% 28 23.9% 6 22.2% 7 26.9% 55 24.3%
Mostly satisfied 35 62.5% 73 62.4% 15 55.6% 16 61.5% 139 61.5%
Subtotal 49 87.5% 101 86.3% 21 77.8% 23 88.5% 194 85.8%
Dissatisfied 5 8.9% 15 12.8% 6 22.2% 3 11.5% 29 12.8%
Very dissatisfied
2 3.6% 1 .9% 0 .0% 0 .0% 3 1.3%
Subtotal 7 12.5% 16 13.7% 6 22.2% 3 11.5% 32 14.2%
Did not respond
0 .0% 0 .0% 0 .0% 0 .0% 0 .0%
Total 56 100.0% 117 100.0% 27 100.0% 26 100.0% 226 100.0%
Would you say our staff treated you with respect?
All of the time 26 46.4% 43 36.8% 13 48.1% 6 23.1% 88 38.9%
Some of the time
26 46.4% 61 52.1% 10 37.0% 17 65.4% 114 50.4%
Subtotal 52 92.9% 104 88.9% 23 85.2% 23 88.5% 202 89.4%
Little of the time
2 3.6% 12 10.3% 4 14.8% 3 11.5% 21 9.3%
Never 1 1.8% 1 .9% 0 .0% 0 .0% 2 .9%
Subtotal 3 5.4% 13 11.1% 4 14.8% 3 11.5% 23 10.2%
Did not respond
1 1.8% 0 .0% 0 .0% 0 .0% 1 .4%
Total 56 100.0% 117 100.0% 27 100.0% 26 100.0% 226 100.0%
Outpatient/Intensive Outpatient
Source of Funding
Private Public Other Unknown Total
CountColumn
% CountColumn
% CountColumn
% Count Column
% CountColumn
%
How satisfied are you with the service you have received?
Very satisfied 129 48.1% 243 43.3% 99 43.0% 107 41.8% 578 44.0%
Mostly satisfied 127 47.4% 280 49.9% 102 44.3% 124 48.4% 633 48.1%
Subtotal 256 95.5% 523 93.2% 201 87.4% 231 90.2% 1211 92.1%
Dissatisfied 7 2.6% 23 4.1% 19 8.3% 10 3.9% 59 4.5%
Very dissatisfied
5 1.9% 9 1.6% 9 3.9% 12 4.7% 35 2.7%
Subtotal 12 4.5% 32 5.7% 28 12.2% 22 8.6% 94 7.1%
Did not respond
0 .0% 6 1.1% 1 .4% 3 1.2% 10 .8%
Total 268 100.0% 561 100.0% 230 100.0% 256 100.0% 1315 100.0%
Would you say our staff treated you with respect?
All of the time 232 86.6% 467 83.2% 177 77.0% 191 74.6% 1067 81.1%
Some of the time
32 11.9% 81 14.4% 43 18.7% 47 18.4% 203 15.4%
Subtotal 264 98.5% 548 97.7% 220 95.7% 238 93.0% 1270 96.6%
Little of the time
4 1.5% 8 1.4% 4 1.7% 9 3.5% 25 1.9%
Never 0 .0% 2 .4% 4 1.7% 7 2.7% 13 1.0%
Subtotal 4 1.5% 10 1.8% 8 3.5% 16 6.2% 38 2.9%
Did not respond
0 .0% 3 .5% 2 .9% 2 .8% 7 .5%
Total 268 100.0% 561 100.0% 230 100.0% 256 100.0% 1315 100.0%

Patients Speak Out 2009 Appendix A: Results for Community Treatment Programs
148
Table 18a Responses to Questions 1‐7 of the DBHR Youth Patient Satisfaction Survey by Year of Survey in Residential Treatment
Year
2004 2005 2006 2007 2009 Total
CountColumn
% CountColumn
% CountColumn
% CountColumn
% Count Column
% CountColumn
%
How satisfied are you with the service you have received?
Very satisfied 58 27.9% 36 17.1% 78 28.9% 64 26.9% 55 24.3% 291 25.3%
Mostly satisfied
130 62.5% 136 64.8% 164 60.7% 131 55.0% 139 61.5% 700 60.8%
Subtotal 188 90.4% 172 81.9% 242 89.6% 195 81.9% 194 85.8% 991 86.0%
Dissatisfied 15 7.2% 25 11.9% 20 7.4% 35 14.7% 29 12.8% 124 10.8%
Very dissatisfied
2 1.0% 13 6.2% 7 2.6% 7 2.9% 3 1.3% 32 2.8%
Subtotal 17 8.2% 38 18.1% 27 10.0% 42 17.6% 32 14.2% 156 13.5%
Did not respond
3 1.4% 0 .0% 1 .4 % 1 .4% 0 .0% 5 .4%
Total 208 100.0% 210 100.0% 270 100.0% 238 100.0% 226 100.0% 1152 100.0%
How satisfied are you with the comfort and appearance of this facility?
Very satisfied 52 25.0% 46 21.9% 65 24.1% 57 23.9% 56 24.8% 276 24.0%
Mostly satisfied
124 59.6% 110 52.4% 158 58.5% 129 54.2% 140 61.9% 661 57.4%
Subtotal 176 84.6% 156 74.3% 223 82.6% 186 78.2% 196 86.7% 937 81.3%
Dissatisfied 30 14.4% 43 20.5% 36 13.3% 43 18.1% 22 9.7% 174 15.1%
Very dissatisfied
0 .0% 10 4.8% 11 4.1% 8 3.4% 8 3.5% 37 3.2%
Subtotal 30 14.4% 53 25.2% 47 17.4% 51 21.4% 30 13.3% 211 18.3%
Did not respond
2 1.0% 1 .5% 0 .0% 1 .4% 0 .0% 4 .3%
Total 208 100.0% 210 100.0% 270 100.0% 238 100.0% 226 100.0% 1152 100.0%
Would you say our staff treated you with respect?
All of the time
90 43.3% 74 35.2% 107 39.6% 77 32.4% 88 38.9% 436 37.8%
Some of the time
102 49.0% 114 54.3% 131 48.5% 116 48.7% 114 50.4% 577 50.1%
Subtotal 192 92.3% 188 89.5% 238 88.1% 193 81.1% 202 89.4% 1013 87.9%
Little of the time
13 6.2% 16 7.6% 27 10.0% 39 16.4% 21 9.3% 116 10.1%
Never 1 .5% 2 1.0% 4 1.5% 4 1.7% 2 .9% 13 1.1%
Subtotal 14 6.7% 18 8.6% 31 11.5% 43 18.1% 23 10.2% 129 11.2%
Did not respond
2 1.0% 4 1.9% 1 .4% 2 .8% 1 .4% 10 .9%
Total 208 100.0% 210 100.0% 270 100.0% 238 100.0% 226 100.0% 1152 100.0%
How safe do you feel in this program?
Very safe 126 60.6% 104 49.5% 151 55.9% 132 55.5% 131 58.0% 644 55.9%
Somewhat safe
74 35.6% 83 39.5% 105 38.9% 72 30.3% 83 36.7% 417 36.2%
Subtotal 200 96.2% 187 89.0% 256 94.8% 204 85.7% 214 94.7% 1061 92.1%
Not very safe 5 2.4% 17 8.1% 10 3.7% 11 4.6% 8 3.5% 51 4.4%
Not safe at all
3 1.4% 6 2.9% 3 1.1% 5 2.1% 3 1.3% 20 1.7%
Subtotal 8 3.8% 23 11.0% 13 4.8% 16 6.7% 11 4.9% 71 6.2%
Did not respond
0 .0% 0 .0% 1 .4% 18 7.6% 1 .4% 20 1.7%
Total 208 100.0% 210 100.0% 270 100.0% 238 100.0% 226 100.0% 1152 100.0%
Continued next page.

Patients Speak Out 2009 Appendix A: Results for Community Treatment Programs
149
How helpful are the group sessions?
Very helpful 83 39.9% 73 34.8% 116 43.0% 84 35.3% 76 33.6% 432 37.5%
Somewhat helpful
99 47.6% 106 50.5% 129 47.8% 116 48.7% 116 51.3% 566 49.1%
Subtotal 182 87.5% 179 85.2% 245 90.7% 200 84.0% 192 85.0% 998 86.6%
Not helpful 20 9.6% 22 10.5% 21 7.8% 30 12.6% 29 12.8% 122 10.6%
Made things worse
2 1.0% 4 1.9% 3 1.1% 6 2.5% 2 .9% 17 1.5%
Subtotal 22 10.6% 26 12.4% 24 8.9% 36 15.1% 31 13.7% 139 12.1%
Did not receive
2 1.0% 4 1.9% 0 .0% 1 .4% 1 .4% 8 .7%
Did not respond
2 1.0% 1 .5% 1 .4% 1 .4% 2 .9% 7 .6%
Total 208 100.0% 210 100.0% 270 100.0% 238 100.0% 226 100.0% 1152 100.0%
How helpful is the individual counseling?
Very helpful 104 50.0% 101 48.1% 138 51.1% 122 51.3% 109 48.2% 574 49.8%
Somewhat helpful
73 35.1% 85 40.5% 88 32.6% 78 32.8% 91 40.3% 415 36.0%
Subtotal 177 85.1% 186 88.6% 226 83.7% 200 84.0% 200 88.5% 989 85.9%
Not helpful 9 4.3% 8 3.8% 20 7.4% 10 4.2% 13 5.8% 60 5.2%
Made things worse
1 .5% 4 1.9% 1 .4% 8 3.4% 3 1.3% 17 1.5%
Subtotal 10 4.8% 12 5.7% 21 7.8% 18 7.6% 16 7.1% 77 6.7%
Did not receive
18 8.7% 11 5.2% 23 8.5% 19 8.0% 10 4.4% 81 7.0%
Did not respond
3 1.4% 1 .5% 0 .0% 1 .4% 0 .0% 5 .4%
Total 208 100.0% 210 100.0% 270 100.0% 238 100.0% 226 100.0% 1152 100.0%
If you were to seek help again, would you come back to this program?
Yes, definitely
65 31.2% 55 26.2% 88 32.6% 81 34.0% 60 26.5% 349 30.3%
Yes, probably
96 46.2% 77 36.7% 108 40.0% 83 34.9% 100 44.2% 464 40.3%
Subtotal 161 77.4% 132 62.9% 196 72.6% 164 68.9% 160 70.8% 813 70.6%
No, probably not
22 10.6% 46 21.9% 51 18.9% 48 20.2% 38 16.8% 205 17.8%
No, definitely not
22 10.6% 30 14.3% 21 7.8% 23 9.7% 26 11.5% 122 10.6%
Subtotal 44 21.2% 76 36.2% 72 26.7% 71 29.8% 64 28.3% 327 28.4%
Did not respond
3 1.4% 2 1.0% 2 .7% 3 1.3% 2 .9% 12 1.0%
Total 208 100.0% 210 100.0% 270 100.0% 238 100.0% 226 100.0% 1152 100.0%

Patients Speak Out 2009 Appendix A: Results for Community Treatment Programs
150
Table 18b Responses to Questions 1‐7 of the DBHR Youth Patient Satisfaction Survey by Year of Survey in Outpatient Treatment
Year
2004 2005 2006 2007 2009 Total
CountColumn
% CountColumn
% CountColumn
% CountColumn
% Count Column
% CountColumn
%
How satisfied are you with the service you have received?
Very satisfied 505 40.2% 502 39.5% 517 41.2% 515 45.1% 578 44.0% 2617 42.0%
Mostly satisfied
647 51.5% 653 51.3% 636 50.7% 534 46.8% 633 48.1% 3103 49.7%
Subtotal 1152 91.7% 1155 90.8% 1153 91.9% 1049 91.9% 1211 92.1% 5720 91.7%
Dissatisfied 63 5.0% 79 6.2% 65 5.2% 69 6.0% 59 4.5% 335 5.4%
Very dissatisfied
32 2.5% 33 2.6% 32 2.6% 20 1.8% 35 2.7% 152 2.4%
Subtotal 95 7.6% 112 8.8% 97 7.7% 89 7.8% 94 7.1% 487 7.8%
Did not respond
9 .7% 5 .4% 4 .3 % 3 .3% 10 .8% 31 .5%
Total 1256 100.0% 1272 100.0% 1254 100.0% 1141 100.0% 1315 100.0% 6238 100.0%
How satisfied are you with the comfort and appearance of this facility?
Very satisfied 573 45.6% 556 43.7% 582 46.4% 547 47.9% 636 48.4% 2894 46.4%
Mostly satisfied
600 47.8% 617 48.5% 586 46.7% 503 44.1% 597 45.4% 2903 46.5%
Subtotal 1173 93.4% 1173 92.2% 1168 93.1% 1050 92.0% 1233 93.8% 5797 92.9%
Dissatisfied 55 4.4% 68 5.3% 53 4.2% 65 5.7% 53 4.0% 294 4.7%
Very dissatisfied
21 1.7% 25 2.0% 29 2.3% 21 1.8% 21 1.6% 117 1.9%
Subtotal 76 6.1% 93 7.3% 82 6.5% 86 7.5% 74 5.6% 411 6.6%
Did not respond
7 .6% 6 .5% 4 .3% 5 .4% 8 .6% 30 .5%
Total 1256 100.0% 1272 100.0% 1254 100.0% 1141 100.0% 1315 100.0% 6238 100.0%
Would you say our staff treated you with respect?
All of the time
985 78.4% 1016 79.9% 1000 79.7% 953 83.5% 1067 81.1% 5021 80.5%
Some of the time
230 18.3% 218 17.1% 213 17.0% 151 13.2% 203 15.4% 1015 16.3%
Subtotal 1215 96.7% 1234 97.0% 1213 96.7% 1104 96.8% 1270 96.6% 6036 96.8%
Little of the time
19 1.5% 23 1.8% 18 1.4% 24 2.1% 25 1.9% 109 1.7%
Never 12 1.0% 14 1.1% 18 1.4% 8 .7% 13 1.0% 65 1.0%
Subtotal 31 2.5% 37 2.9% 36 2.9% 32 2.8% 38 2.9% 174 2.8%
Did not respond
10 .8% 1 .1% 5 .4% 5 .4% 7 .5% 28 .4%
Total 1256 100.0% 1272 100.0% 1254 100.0% 1141 100.0% 1315 100.0% 6238 100.0%
How safe do you feel in this program?
Very safe 874 69.6% 857 67.4% 857 68.3% 820 71.9% 929 70.6% 4337 69.5%
Somewhat safe
314 25.0% 333 26.2% 338 27.0% 278 24.4% 316 24.0% 1579 25.3%
Subtotal 1188 94.6% 1190 93.6% 1195 95.3% 1098 96.2% 1245 94.7% 5916 94.8%
Not very safe 34 2.7% 32 2.5% 28 2.2% 18 1.6% 30 2.3% 142 2.3%
Not safe at all
21 1.7% 20 1.6% 22 1.8% 19 1.7% 17 1.3% 99 1.6%
Subtotal 55 4.4% 52 4.1% 50 4.0% 37 3.2% 47 3.6% 241 3.9%
Did not respond
13 1.0% 30 2.4% 9 .7% 6 .5% 23 1.7% 81 1.3%
Total 1256 100.0% 1272 100.0% 1254 100.0% 1141 100.0% 1315 100.0% 6238 100.0%
Continued next page.

Patients Speak Out 2009 Appendix A: Results for Community Treatment Programs
151
How helpful are the group sessions?
Very helpful 479 38.1% 444 34.9% 468 37.3% 432 37.9% 498 37.9% 2321 37.2%
Somewhat helpful 572 45.5% 615 48.3% 590 47.0% 521 45.7% 600 45.6% 2898 46.5%
Subtotal 1051 83.7% 1059 83.3% 1058 84.4% 953 83.5% 1098 83.5% 5219 83.7%
Not helpful 110 8.8% 118 9.3% 109 8.7% 101 8.9% 115 8.7% 553 8.9%
Made things worse 17 1.4% 23 1.8% 10 .8% 15 1.3% 20 1.5% 85 1.4%
Subtotal 127 10.1% 141 11.1% 119 9.5% 116 10.2% 135 10.3% 638 10.2%
Did not receive 61 4.9% 61 4.8% 64 5.1% 61 5.3% 67 5.1% 314 5.0%
Did not respond 17 1.4% 11 .9% 13 1.0% 11 1.0% 15 1.1% 67 1.1%
Total 1256 100.0% 1272 100.0% 1254 100.0% 1141 100.0% 1315 100.0% 6238 100.0%
How helpful is the individual counseling?
Very helpful 521 41.5% 527 41.4% 511 40.7% 528 46.3% 594 45.2% 2681 43.0%
Somewhat helpful 497 39.6% 463 36.4% 459 36.6% 387 33.9% 469 35.7% 2275 36.5%
Subtotal 1018 81.1% 990 77.8% 970 77.4% 915 80.2% 1063 80.8% 4956 79.4%
Not helpful 88 7.0% 96 7.5% 83 6.6% 78 6.8% 86 6.5% 431 6.9%
Made things worse 13 1.0% 20 1.6% 11 .9% 13 1.1% 14 1.1% 71 1.1%
Subtotal 101 8.0% 116 9.1% 94 7.5% 91 8.0% 100 7.6% 502 8.0%
Did not receive 113 9.0% 154 12.1% 177 14.1% 123 10.8% 135 10.3% 702 11.3%
Did not respond 24 1.9% 12 .9% 13 1.0% 12 1.1% 17 1.3% 78 1.3%
Total 1256 100.0% 1272 100.0% 1254 100.0% 1141 100.0% 1315 100.0% 6238 100.0%
If you were to seek help again, would you come back to this program?
Yes, definitely 514 40.9% 502 39.5% 522 41.6% 513 45.0% 562 42.7% 2613 41.9%
Yes, probably 504 40.1% 541 42.5% 521 41.5% 442 38.7% 535 40.7% 2543 40.8%
Subtotal 1018 81.1% 1043 82.0% 1043 83.2% 955 83.7% 1097 83.4% 5156 82.7%
No, probably not 144 11.5% 134 10.5% 129 10.3% 129 11.3% 130 9.9% 666 10.7%
No, definitely not 78 6.2% 79 6.2% 67 5.3% 50 4.4% 69 5.2% 343 5.5%
Subtotal 222 17.7% 213 16.7% 196 15.6% 179 15.7% 199 15.1% 1009 16.2%
Did not respond 16 1.3% 16 1.3% 15 1.2% 7 .6% 19 1.4% 73 1.2%
Total 1256 100.0% 1272 100.0% 1254 100.0% 1141 100.0% 1315 100.0% 6238 100.0%

Patients Speak Out 2009 Appendix A: Results for DOC Treatment Programs
152
Table 19 Responses to Questions 1‐6 of the DBHR Adult Patient Satisfaction Survey by Treatment Modality, March 23‐27, 2009
Treatment Modality
Recovery HouseLong‐term Residential OP/IOP Total
CountColumn
% Count Column % Count Column
% CountColumn
%
In an overall, general sense, how satisfied are you with the service you have received?
Very satisfied 9 21.4% 36 10.3% 576 46.1% 621 37.8%
Mostly satisfied 22 52.4% 218 62.3% 599 47.9% 839 51.1%
Subtotal 31 73.8% 254 72.6% 1175 94.0% 1460 88.9%
Dissatisfied 4 9.5% 73 20.9% 42 3.4% 119 7.2%
Very dissatisfied 3 7.1% 22 6.3% 25 2.0% 50 3.0%
Subtotal 7 16.7% 95 27.1% 67 5.4% 169 10.3%
Did not respond 4 9.5% 1 .3% 8 .6% 13 .8%
Total 42 100.0% 350 100.0% 1250 100.0% 1642 100.0%
In general, how satisfied are you with the comfort and appearance of this facility?
Very satisfied 8 19.0% 19 5.4% 358 28.6% 385 23.4%
Mostly satisfied 26 61.9% 208 59.4% 693 55.4% 927 56.5%
Subtotal 34 81.0% 227 64.9% 1051 84.1% 1312 79.9%
Dissatisfied 7 16.7% 92 26.3% 144 11.5% 243 14.8%
Very dissatisfied 0 .0% 30 8.6% 46 3.7% 76 4.6%
Subtotal 7 16.7% 122 34.9% 190 15.2% 319 19.4%
Did not respond 1 2.4% 1 .3% 9 .7% 11 .7%
Total 42 100.0% 350 100.0% 1250 100.0% 1642 100.0%
Would you say our staff treated you with respect? All of the time 23 54.8% 127 36.3% 956 76.5% 1106 67.4%
Some of the time
15 35.7% 175 50.0% 253 20.2% 443 27.0%
Subtotal 38 90.5% 302 86.3% 1209 96.7% 1549 94.3%
Little of the time
3 7.1% 42 12.0% 26 2.1% 71 4.3%
Never 0 .0% 4 1.1% 9 .7% 13 .8%
Subtotal 3 7.1% 46 13.1% 35 2.8% 84 5.1%
Did not respond 1 2.4% 2 .6% 6 .5% 9 .5%
Total 42 100.0% 350 100.0% 1250 100.0% 1642 100.0%
How do you rate the helpfulness of the group sessions? Very helpful 10 23.8% 106 30.3% 736 58.9% 852 51.9%
Somewhat helpful
21 50.0% 202 57.7% 444 35.5% 667 40.6%
Subtotal 31 73.8% 308 88.0% 1180 94.4% 1519 92.5%
Not helpful 9 21.4% 29 8.3% 47 3.8% 85 5.2%
Made things worse
0 .0% 8 2.3% 7 .6% 15 .9%
Subtotal 9 21.4% 37 10.6% 54 4.3% 100 6.1%
Did not receive 1 2.4% 3 .9% 10 .8% 14 .9%
Did not respond 1 2.4% 2 .6% 6 .5% 9 .5%
Total 42 100.0% 350 100.0% 1250 100.0% 1642 100.0%
Continued next page.

Patients Speak Out 2009 Appendix A: Results for DOC Treatment Programs
153
How do you rate the helpfulness of the individual counseling?
Very helpful 16 38.1% 138 39.4% 739 59.1% 893 54.4%
Somewhat helpful 13 31.0% 139 39.7% 332 26.6% 484 29.5%
Subtotal 29 69.0% 277 79.1% 1071 85.7% 1377 83.9%
Not helpful 3 7.1% 42 12.0% 44 3.5% 89 5.4%
Made things worse 0 .0% 10 2.9% 4 .3% 14 .9%
Subtotal 3 7.1% 52 14.9% 48 3.8% 103 6.3%
Did not receive 8 19.0% 19 5.4% 110 8.8% 137 8.3%
Did not respond 2 4.8% 2 .6% 21 1.7% 25 1.5%
Total 42 100.0% 350 100.0% 1250 100.0% 1642 100.0%
If you were to seek help again, would you come back to this program?
Yes, definitely 8 19.0% 24 6.9% 461 36.9% 493 30.0%
Yes, probably 18 42.9% 84 24.0% 462 37.0% 564 34.3%
Subtotal 26 61.9% 108 30.9% 923 73.8% 1057 64.4%
No, probably not 7 16.7% 105 30.0% 190 15.2% 302 18.4%
No, definitely not 8 19.0% 130 37.1% 116 9.3% 254 15.5%
Subtotal 15 35.7% 235 67.1% 306 24.5% 556 33.9%
Did not respond 1 2.4% 7 2.0% 21 1.7% 29 1.8%
Total 42 100.0% 350 100.0% 1250 100.0% 1642 100.0%

Patients Speak Out 2009 Appendix A: Results for DOC Treatment Programs
154
Table 20 Responses to Questions 7‐12a of the DBHR Adult Patient Satisfaction Survey by Treatment Modality, March 23‐27, 2009
Treatment Modality
Recovery HouseLong‐term Residential OP/IOP Total
CountColumn
% Count Column % Count Column
% CountColumn
%
Did you need legal services? Yes 16 38.1% 105 30.0% 214 17.1% 335 20.4%
No 26 61.9% 244 69.7% 1026 82.1% 1296 78.9%
Did not respond
0 .0% 1 .3% 10 .8% 11 .7%
Total 42 100.0% 350 100.0% 1250 100.0% 1642 100.0%
If yes, how helpful were we in assisting you to identify and find legal services?
Very helpful 1 6.2% 5 4.8% 63 29.4% 69 20.6%
Somewhat helpful
2 12.5% 30 28.6% 63 29.4% 95 28.4%
Subtotal 3 18.8% 35 33.3% 126 58.9% 164 49.0%
Not very helpful
9 56.2% 29 27.6% 33 15.4% 71 21.2%
Not helpful at all
4 25.0% 41 39.0% 47 22.0% 92 27.5%
Subtotal 13 81.2% 70 66.7% 80 37.4% 163 48.7%
Did not respond
0 .0% 0 .0% 8 3.7% 8 2.4%
Total 16 100.0% 105 100.0% 214 100.0% 335 100.0%
Did you need medical services? Yes 27 64.3% 234 66.9% 299 23.9% 560 34.1%
No 15 35.7% 114 32.6% 935 74.8% 1064 64.8%
Did not respond
0 .0% 2 .6% 16 1.3% 18 1.1%
Total 42 100.0% 350 100.0% 1250 100.0% 1642 100.0%
If yes, how helpful were we in assisting you to identify and find medical services?
Very helpful 6 22.2% 46 19.7% 87 29.1% 139 24.8%
Somewhat helpful
13 48.1% 79 33.8% 83 27.8% 175 31.2%
Subtotal 19 70.4% 125 53.4% 170 56.9% 314 56.1%
Not very helpful
6 22.2% 50 21.4% 58 19.4% 114 20.4%
Not helpful at all
2 7.4% 54 23.1% 56 18.7% 112 20.0%
Subtotal 8 29.6% 104 44.4% 114 38.1% 226 40.4%
Did not respond
0 .0% 5 2.1% 15 5.0% 20 3.6%
Total 27 100.0% 234 100.0% 299 100.0% 560 100.0%
Did you need family services? Yes 12 28.6% 154 44.0% 164 13.1% 330 20.1%
No 30 71.4% 191 54.6% 1070 85.6% 1291 78.6%
Did not respond
0 .0% 5 1.4% 16 1.3% 21 1.3%
Total 42 100.0% 350 100.0% 1250 100.0% 1642 100.0%
If yes, how helpful were we in assisting you to identify and find family services?
Very helpful 2 16.7% 53 34.4% 49 29.9% 104 31.5%
Somewhat helpful
4 33.3% 48 31.2% 40 24.4% 92 27.9%
Subtotal 6 50.0% 101 65.6% 89 54.3% 196 59.4%
Not very helpful
3 25.0% 25 16.2% 30 18.3% 58 17.6%
Not helpful at all
3 25.0% 25 16.2% 37 22.6% 65 19.7%
Subtotal 6 50.0% 50 32.5% 67 40.9% 123 37.3%
Did not respond
0 .0% 3 1.9% 8 4.9% 11 3.3%
Total 12 100.0% 154 100.0% 164 100.0% 330 100.0%
Continued next page.

Patients Speak Out 2009 Appendix A: Results for DOC Treatment Programs
155
Did you need mental health services? Yes 21 50.0% 126 36.0% 249 19.9% 396 24.1%
No 21 50.0% 218 62.3% 991 79.3% 1230 74.9%
Did not respond 0 .0% 6 1.7% 10 .8% 16 1.0%
Total 42 100.0% 350 100.0% 1250 100.0% 1642 100.0%
If yes, how helpful were we in assisting you to identify and find mental health services?
Very helpful 7 33.3% 42 33.3% 89 35.7% 138 34.8%
Somewhat helpful
11 52.4% 34 27.0% 62 24.9% 107 27.0%
Subtotal 18 85.7% 76 60.3% 151 60.6% 245 61.9%
Not very helpful 1 4.8% 26 20.6% 40 16.1% 67 16.9%
Not helpful at all
2 9.5% 23 18.3% 42 16.9% 67 16.9%
Subtotal 3 14.3% 49 38.9% 82 32.9% 134 33.8%
Did not respond 0 .0% 1 .8% 16 6.4% 17 4.3%
Total 21 100.0% 126 100.0% 249 100.0% 396 100.0%
Did you need educational or vocational services? Yes 16 38.1% 216 61.7% 276 22.1% 508 30.9%
No 26 61.9% 131 37.4% 962 77.0% 1119 68.1%
Did not respond 0 .0% 3 .9% 12 1.0% 15 .9%
Total 42 100.0% 350 100.0% 1250 100.0% 1642 100.0%
If yes, how helpful were we in assisting you to identify and find educational or vocational services?
Very helpful 4 25.0% 73 33.8% 89 32.2% 166 32.7%
Somewhat helpful
5 31.2% 73 33.8% 77 27.9% 155 30.5%
Subtotal 9 56.2% 146 67.6% 166 60.1% 321 63.2%
Not very helpful 4 25.0% 20 9.3% 37 13.4% 61 12.0%
Not helpful at all
3 18.8% 44 20.4% 52 18.8% 99 19.5%
Subtotal 7 43.8% 64 29.6% 89 32.2% 160 31.5%
Did not respond 0 .0% 6 2.8% 21 7.6% 27 5.3%
Total 16 100.0% 216 100.0% 276 100.0% 508 100.0%
Did you need employment services? Yes 28 66.7% 218 62.3% 338 27.0% 584 35.6%
No 14 33.3% 128 36.6% 898 71.8% 1040 63.3%
Did not respond 0 .0% 4 1.1% 14 1.1% 18 1.1%
Total 42 100.0% 350 100.0% 1250 100.0% 1642 100.0%
If yes, how helpful were we in assisting you to identify and find employment services?
Very helpful 7 25.0% 56 25.7% 87 25.7% 150 25.7%
Somewhat helpful
7 25.0% 60 27.5% 86 25.4% 153 26.2%
Subtotal 14 50.0% 116 53.2% 173 51.2% 303 51.9%
Not very helpful 6 21.4% 45 20.6% 59 17.5% 110 18.8%
Not helpful at all
8 28.6% 53 24.3% 75 22.2% 136 23.3%
Subtotal 14 50.0% 98 45.0% 134 39.6% 246 42.1%
Did not respond 0 .0% 4 1.8% 31 9.2% 35 6.0%
Total 28 100.0% 218 100.0% 338 100.0% 584 100.0%

Patients Speak Out 2009 Appendix A: Results for DOC Treatment Programs
156
Table 21 Characteristics of DOC Patients by Treatment Modality, March 23‐27, 2009
Treatment Modality
Recovery House Long‐term Residential OP/IOP Total
Count Column % Count Column % Count Column % Count Column %
Age 20 and younger 0 .0% 7 2.0% 37 3.0% 44 2.7%
21 ‐ 25 3 7.1% 43 12.3% 193 15.4% 239 14.6%
26 ‐ 30 7 16.7% 70 20.0% 226 18.1% 303 18.5%
31 ‐ 35 3 7.1% 47 13.4% 187 15.0% 237 14.4%
36 ‐ 40 12 28.6% 57 16.3% 191 15.3% 260 15.8%
41 ‐ 45 4 9.5% 56 16.0% 154 12.3% 214 13.0%
46 ‐ 50 4 9.5% 35 10.0% 125 10.0% 164 10.0%
51 ‐ 55 4 9.5% 15 4.3% 55 4.4% 74 4.5%
Over 55 2 4.8% 11 3.1% 36 2.9% 49 3.0%
Unknown 3 7.1% 9 2.6% 46 3.7% 58 3.5%
Total 42 100.0% 350 100.0% 1250 100.0% 1642 100.0%
Gender Male 24 57.1% 283 80.9% 940 75.2% 1247 75.9%
Female 17 40.5% 67 19.1% 263 21.0% 347 21.1%
Unknown 1 2.4% 0 .0% 47 3.8% 48 2.9%
Total 42 100.0% 350 100.0% 1250 100.0% 1642 100.0%
Ethnic/Racial Background White/European American 24 57.1% 237 67.7% 782 62.6% 1043 63.5%
Black/African American 6 14.3% 34 9.7% 160 12.8% 200 12.2%
Asian/Pacific Islander 0 .0% 9 2.6% 34 2.7% 43 2.6%
Native American/Eskimo/Aleut 3 7.1% 18 5.1% 55 4.4% 76 4.6%
Hispanic 4 9.5% 10 2.9% 76 6.1% 90 5.5%
Multiracial 5 11.9% 25 7.1% 53 4.2% 83 5.1%
Other 0 .0% 14 4.0% 36 2.9% 50 3.0%
Unknown 0 .0% 3 .9% 54 4.3% 57 3.5%
Total 42 100.0% 350 100.0% 1250 100.0% 1642 100.0%
Length of Stay in Treatment 15 days or less 12 28.6% 225 64.3% 274 21.9% 511 31.1%
16 ‐ 30 days 2 4.8% 15 4.3% 174 13.9% 191 11.6%
31 ‐ 45 days 8 19.0% 9 2.6% 146 11.7% 163 9.9%
46 ‐ 60 days 11 26.2% 9 2.6% 133 10.6% 153 9.3%
61 ‐ 75 days 2 4.8% 15 4.3% 108 8.6% 125 7.6%
76 ‐ 90 days 1 2.4% 6 1.7% 73 5.8% 80 4.9%
Over 90 days 1 2.4% 39 11.1% 164 13.1% 204 12.4%
Unknown 5 11.9% 32 9.1% 178 14.2% 215 13.1%
Total 42 100.0% 350 100.0% 1250 100.0% 1642 100.0%
Source of Funding Private 2 4.8% 7 2.0% 37 3.0% 46 2.8%
Public 30 71.4% 291 83.1% 951 76.1% 1272 77.5%
Unknown 10 23.8% 52 14.9% 262 21.0% 324 19.7%
Total 42 100.0% 350 100.0% 1250 100.0% 1642 100.0%
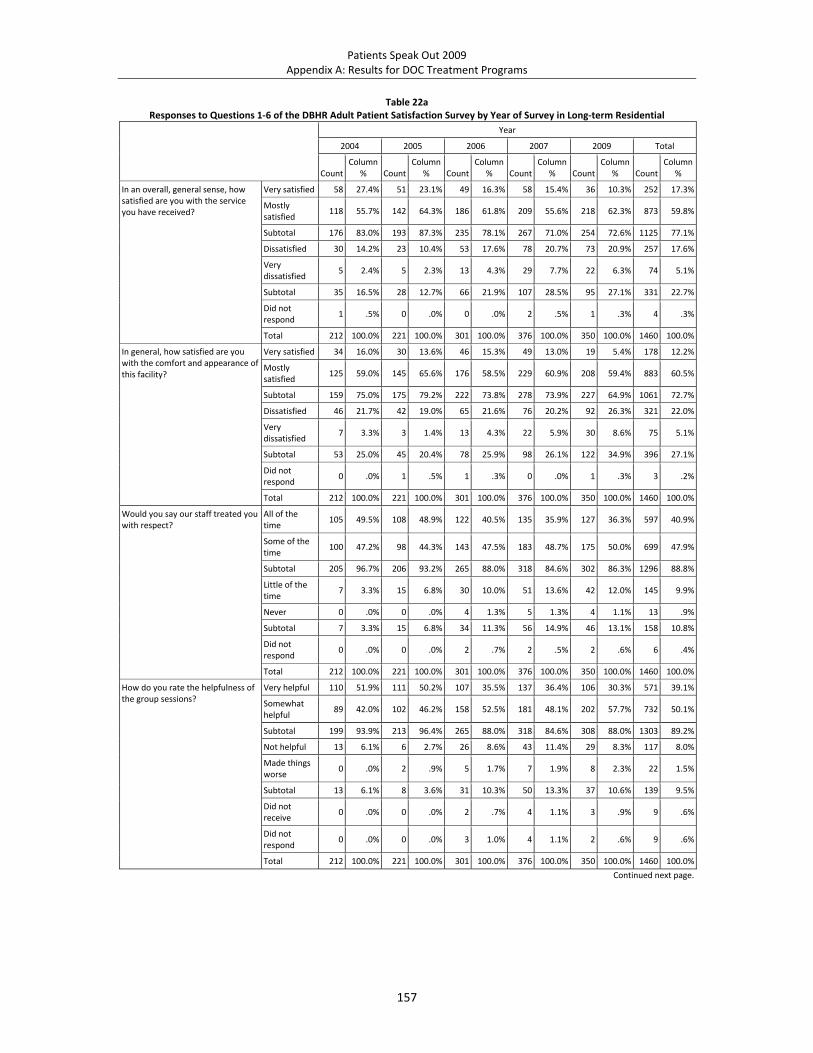
Patients Speak Out 2009 Appendix A: Results for DOC Treatment Programs
157
Table 22a Responses to Questions 1‐6 of the DBHR Adult Patient Satisfaction Survey by Year of Survey in Long‐term Residential
Year
2004 2005 2006 2007 2009 Total
CountColumn
% CountColumn
% CountColumn
% CountColumn
% Count Column
% CountColumn
%
In an overall, general sense, how satisfied are you with the service you have received?
Very satisfied 58 27.4% 51 23.1% 49 16.3% 58 15.4% 36 10.3% 252 17.3%
Mostly satisfied
118 55.7% 142 64.3% 186 61.8% 209 55.6% 218 62.3% 873 59.8%
Subtotal 176 83.0% 193 87.3% 235 78.1% 267 71.0% 254 72.6% 1125 77.1%
Dissatisfied 30 14.2% 23 10.4% 53 17.6% 78 20.7% 73 20.9% 257 17.6%
Very dissatisfied
5 2.4% 5 2.3% 13 4.3% 29 7.7% 22 6.3% 74 5.1%
Subtotal 35 16.5% 28 12.7% 66 21.9% 107 28.5% 95 27.1% 331 22.7%
Did not respond
1 .5% 0 .0% 0 .0% 2 .5% 1 .3% 4 .3%
Total 212 100.0% 221 100.0% 301 100.0% 376 100.0% 350 100.0% 1460 100.0%
In general, how satisfied are you with the comfort and appearance of this facility?
Very satisfied 34 16.0% 30 13.6% 46 15.3% 49 13.0% 19 5.4% 178 12.2%
Mostly satisfied
125 59.0% 145 65.6% 176 58.5% 229 60.9% 208 59.4% 883 60.5%
Subtotal 159 75.0% 175 79.2% 222 73.8% 278 73.9% 227 64.9% 1061 72.7%
Dissatisfied 46 21.7% 42 19.0% 65 21.6% 76 20.2% 92 26.3% 321 22.0%
Very dissatisfied
7 3.3% 3 1.4% 13 4.3% 22 5.9% 30 8.6% 75 5.1%
Subtotal 53 25.0% 45 20.4% 78 25.9% 98 26.1% 122 34.9% 396 27.1%
Did not respond
0 .0% 1 .5% 1 .3% 0 .0% 1 .3% 3 .2%
Total 212 100.0% 221 100.0% 301 100.0% 376 100.0% 350 100.0% 1460 100.0%
Would you say our staff treated you with respect?
All of the time
105 49.5% 108 48.9% 122 40.5% 135 35.9% 127 36.3% 597 40.9%
Some of the time
100 47.2% 98 44.3% 143 47.5% 183 48.7% 175 50.0% 699 47.9%
Subtotal 205 96.7% 206 93.2% 265 88.0% 318 84.6% 302 86.3% 1296 88.8%
Little of the time
7 3.3% 15 6.8% 30 10.0% 51 13.6% 42 12.0% 145 9.9%
Never 0 .0% 0 .0% 4 1.3% 5 1.3% 4 1.1% 13 .9%
Subtotal 7 3.3% 15 6.8% 34 11.3% 56 14.9% 46 13.1% 158 10.8%
Did not respond
0 .0% 0 .0% 2 .7% 2 .5% 2 .6% 6 .4%
Total 212 100.0% 221 100.0% 301 100.0% 376 100.0% 350 100.0% 1460 100.0%
How do you rate the helpfulness of the group sessions?
Very helpful 110 51.9% 111 50.2% 107 35.5% 137 36.4% 106 30.3% 571 39.1%
Somewhat helpful
89 42.0% 102 46.2% 158 52.5% 181 48.1% 202 57.7% 732 50.1%
Subtotal 199 93.9% 213 96.4% 265 88.0% 318 84.6% 308 88.0% 1303 89.2%
Not helpful 13 6.1% 6 2.7% 26 8.6% 43 11.4% 29 8.3% 117 8.0%
Made things worse
0 .0% 2 .9% 5 1.7% 7 1.9% 8 2.3% 22 1.5%
Subtotal 13 6.1% 8 3.6% 31 10.3% 50 13.3% 37 10.6% 139 9.5%
Did not receive
0 .0% 0 .0% 2 .7% 4 1.1% 3 .9% 9 .6%
Did not respond
0 .0% 0 .0% 3 1.0% 4 1.1% 2 .6% 9 .6%
Total 212 100.0% 221 100.0% 301 100.0% 376 100.0% 350 100.0% 1460 100.0%
Continued next page.

Patients Speak Out 2009 Appendix A: Results for DOC Treatment Programs
158
How do you rate the helpfulness of the individual counseling?
Very helpful 92 43.4% 103 46.6% 119 39.5% 142 37.8% 138 39.4% 594 40.7%
Somewhat helpful
90 42.5% 79 35.7% 117 38.9% 156 41.5% 139 39.7% 581 39.8%
Subtotal 182 85.8% 182 82.4% 236 78.4% 298 79.3% 277 79.1% 1175 80.5%
Not helpful 15 7.1% 14 6.3% 43 14.3% 35 9.3% 42 12.0% 149 10.2%
Made things worse
1 .5% 1 .5% 2 .7% 7 1.9% 10 2.9% 21 1.4%
Subtotal 16 7.5% 15 6.8% 45 15.0% 42 11.2% 52 14.9% 170 11.6%
Did not receive
12 5.7% 23 10.4% 17 5.6% 27 7.2% 19 5.4% 98 6.7%
Did not respond
2 .9% 1 .5% 3 1.0% 9 2.4% 2 .6% 17 1.2%
Total 212 100.0% 221 100.0% 301 100.0% 376 100.0% 350 100.0% 1460 100.0%
Would you come back to this program?
Yes, definitely 39 18.4% 44 19.9% 54 17.9% 42 11.2% 24 6.9% 203 13.9%
Yes, probably 59 27.8% 66 29.9% 64 21.3% 82 21.8% 84 24.0% 355 24.3%
Subtotal 98 46.2% 110 49.8% 118 39.2% 124 33.0% 108 30.9% 558 38.2%
No, probably not
61 28.8% 56 25.3% 87 28.9% 106 28.2% 105 30.0% 415 28.4%
No, definitely not
48 22.6% 51 23.1% 87 28.9% 131 34.8% 130 37.1% 447 30.6%
Subtotal 109 51.4% 107 48.4% 174 57.8% 237 63.0% 235 67.1% 862 59.0%
Did not respond
5 2.4% 4 1.8% 9 3.0% 15 4.0% 7 2.0% 40 2.7%
Total 212 100.0% 221 100.0% 301 100.0% 376 100.0% 350 100.0% 1460 100.0%

Patients Speak Out 2009 Appendix A: Results for DOC Treatment Programs
159
Table 22b Responses to Questions 1‐6 of the DBHR Adult Patient Satisfaction Survey by Year of Survey
in Outpatient/Intensive Outpatient
Year
2004 2005 2006 2007 2009 Total
CountColumn
% CountColumn
% CountColumn
% CountColumn
% Count Column
% CountColumn
%
In an overall, general sense, how satisfied are you with the service you have received?
Very satisfied 443 43.3% 383 39.0% 445 47.6% 408 43.2% 576 46.1% 2255 43.9%
Mostly satisfied
509 49.7% 515 52.5% 432 46.2% 470 49.7% 599 47.9% 2525 49.2%
Subtotal 952 93.0% 898 91.5% 877 93.8% 878 92.9% 1175 94.0% 4780 93.1%
Dissatisfied 43 4.2% 58 5.9% 32 3.4% 49 5.2% 42 3.4% 224 4.4%
Very dissatisfied
17 1.7% 18 1.8% 18 1.9% 13 1.4% 25 2.0% 91 1.8%
Subtotal 60 5.9% 76 7.7% 50 5.3% 62 6.6% 67 5.4% 315 6.1%
Did not respond
12 1.2% 7 .7% 8 .9% 5 .5% 8 .6% 40 .8%
Total 1024 100.0% 981 100.0% 935 100.0% 945 100.0% 1250 100.0% 5135 100.0%
In general, how satisfied are you with the comfort and appearance of this facility?
Very satisfied 310 30.3% 276 28.1% 319 34.1% 274 29.0% 358 28.6% 1537 29.9%
Mostly satisfied
561 54.8% 542 55.2% 483 51.7% 528 55.9% 693 55.4% 2807 54.7%
Subtotal 871 85.1% 818 83.4% 802 85.8% 802 84.9% 1051 84.1% 4344 84.6%
Dissatisfied 108 10.5% 112 11.4% 95 10.2% 102 10.8% 144 11.5% 561 10.9%
Very dissatisfied
34 3.3% 46 4.7% 33 3.5% 34 3.6% 46 3.7% 193 3.8%
Subtotal 142 13.9% 158 16.1% 128 13.7% 136 14.4% 190 15.2% 754 14.7%
Did not respond
11 1.1% 5 .5% 5 .5% 7 .7% 9 .7% 37 .7%
Total 1024 100.0% 981 100.0% 935 100.0% 945 100.0% 1250 100.0% 5135 100.0%
Would you say our staff treated you with respect?
All of the time
775 75.7% 724 73.8% 728 77.9% 716 75.8% 956 76.5% 3899 75.9%
Some of the time
214 20.9% 213 21.7% 173 18.5% 181 19.2% 253 20.2% 1034 20.1%
Subtotal 989 96.6% 937 95.5% 901 96.4% 897 94.9% 1209 96.7% 4933 96.1%
Little of the time
18 1.8% 30 3.1% 19 2.0% 38 4.0% 26 2.1% 131 2.6%
Never 4 .4% 7 .7% 7 .7% 2 .2% 9 .7% 29 .6%
Subtotal 22 2.1% 37 3.8% 26 2.8% 40 4.2% 35 2.8% 160 3.1%
Did not respond
13 1.3% 7 .7% 8 .9% 8 .8% 6 .5% 42 .8%
Total 1024 100.0% 981 100.0% 935 100.0% 945 100.0% 1250 100.0% 5135 100.0%
How do you rate the helpfulness of the group sessions?
Very helpful 594 58.0% 540 55.0% 557 59.6% 549 58.1% 736 58.9% 2976 58.0%
Somewhat helpful
371 36.2% 378 38.5% 318 34.0% 353 37.4% 444 35.5% 1864 36.3%
Subtotal 965 94.2% 918 93.6% 875 93.6% 902 95.4% 1180 94.4% 4840 94.3%
Not helpful 33 3.2% 38 3.9% 34 3.6% 29 3.1% 47 3.8% 181 3.5%
Made things worse
8 .8% 7 .7% 8 .9% 4 .4% 7 .6% 34 .7%
Subtotal 41 4.0% 45 4.6% 42 4.5% 33 3.5% 54 4.3% 215 4.2%
Did not receive
8 .8% 10 1.0% 9 1.0% 6 .6% 10 .8% 43 .8%
Did not respond
10 1.0% 8 .8% 9 1.0% 4 .4% 6 .5% 37 .7%
Total 1024 100.0% 981 100.0% 935 100.0% 945 100.0% 1250 100.0% 5135 100.0%
Continued next page.

Patients Speak Out 2009 Appendix A: Results for DOC Treatment Programs
160
How do you rate the helpfulness of the individual counseling?
Very helpful 568 55.5% 512 52.2% 539 57.6% 501 53.0% 739 59.1% 2859 55.7%
Somewhat helpful
277 27.1% 290 29.6% 251 26.8% 272 28.8% 332 26.6% 1422 27.7%
Subtotal 845 82.5% 802 81.8% 790 84.5% 773 81.8% 1071 85.7% 4281 83.4%
Not helpful 30 2.9% 32 3.3% 29 3.1% 48 5.1% 44 3.5% 183 3.6%
Made things worse
4 .4% 3 .3% 5 .5% 4 .4% 4 .3% 20 .4%
Subtotal 34 3.3% 35 3.6% 34 3.6% 52 5.5% 48 3.8% 203 4.0%
Did not receive
132 12.9% 131 13.4% 91 9.7% 106 11.2% 110 8.8% 570 11.1%
Did not respond
13 1.3% 13 1.3% 20 2.1% 14 1.5% 21 1.7% 81 1.6%
Total 1024 100.0% 981 100.0% 935 100.0% 945 100.0% 1250 100.0% 5135 100.0%
Would you come back to this program?
Yes, definitely
352 34.4% 322 32.8% 365 39.0% 356 37.7% 461 36.9% 1856 36.1%
Yes, probably
383 37.4% 406 41.4% 352 37.6% 372 39.4% 462 37.0% 1975 38.5%
Subtotal 735 71.8% 728 74.2% 717 76.7% 728 77.0% 923 73.8% 3831 74.6%
No, probably not
151 14.7% 141 14.4% 109 11.7% 116 12.3% 190 15.2% 707 13.8%
No, definitely not
107 10.4% 88 9.0% 86 9.2% 84 8.9% 116 9.3% 481 9.4%
Subtotal 258 25.2% 229 23.3% 195 20.9% 200 21.2% 306 24.5% 1188 23.1%
Did not respond
31 3.0% 24 2.4% 23 2.5% 17 1.8% 21 1.7% 116 2.3%
Total 1024 100.0% 981 100.0% 935 100.0% 945 100.0% 1250 100.0% 5135 100.0%

Patients Speak Out 2009 Appendix A: Results for JRA Treatment Programs
161
Table 23 Responses to Questions 1‐7 of the DBHR Youth Patient Satisfaction Survey by Treatment Modality, March 23‐27, 2009
Treatment Modality
JRA Residential JRA OP/IOP Total
Count Column % Count Column % Count Column %
How satisfied are you with the service you have received? Very satisfied 6 20.0% 6 23.1% 12 21.4%
Mostly satisfied 22 73.3% 17 65.4% 39 69.6%
Subtotal 28 93.3% 23 88.5% 51 91.1%
Dissatisfied 2 6.7% 2 7.7% 4 7.1%
Very dissatisfied 0 .0% 1 3.8% 1 1.8%
Subtotal 2 6.7% 3 11.5% 5 8.9%
Did not respond 0 .0% 0 .0% 0 .0%
Total 30 100.0% 26 100.0% 56 100.0%
How satisfied are you with the comfort and appearance of this facility? Very satisfied 7 23.3% 9 34.6% 16 28.6%
Mostly satisfied 21 70.0% 8 30.8% 29 51.8%
Subtotal 28 93.3% 17 65.4% 45 80.4%
Dissatisfied 1 3.3% 8 30.8% 9 16.1%
Very dissatisfied 0 .0% 1 3.8% 1 1.8%
Subtotal 1 3.3% 9 34.6% 10 17.9%
Did not respond 1 3.3% 0 .0% 1 1.8%
Total 30 100.0% 26 100.0% 56 100.0%
Would you say our staff treated you with respect? All of the time 10 33.3% 8 30.8% 18 32.1%
Some of the time 17 56.7% 10 38.5% 27 48.2%
Subtotal 27 90.0% 18 69.2% 45 80.4%
Little of the time 1 3.3% 6 23.1% 7 12.5%
Never 2 6.7% 2 7.7% 4 7.1%
Subtotal 3 10.0% 8 30.8% 11 19.6%
Did not respond 0 .0% 0 .0% 0 .0%
Total 30 100.0% 26 100.0% 56 100.0%
How safe do you feel in this program? Very safe 18 60.0% 15 57.7% 33 58.9%
Somewhat safe 10 33.3% 9 34.6% 19 33.9%
Subtotal 28 93.3% 24 92.3% 52 92.9%
Not very safe 2 6.7% 2 7.7% 4 7.1%
Not safe at all 0 .0% 0 .0% 0 .0%
Subtotal 2 6.7% 2 7.7% 4 7.1%
Did not respond 0 .0% 0 .0% 0 .0%
Total 30 100.0% 26 100.0% 56 100.0%
Continued next page.

Patients Speak Out 2009 Appendix A: Results for JRA Treatment Programs
162
How helpful are the group sessions? Very helpful 10 33.3% 12 46.2% 22 39.3%
Somewhat helpful
15 50.0% 12 46.2% 27 48.2%
Subtotal 25 83.3% 24 92.3% 49 87.5%
Not helpful 4 13.3% 1 3.8% 5 8.9%
Made things worse
0 .0% 0 .0% 0 .0%
Subtotal 4 13.3% 1 3.8% 5 8.9%
Did not receive 0 .0% 1 3.8% 1 1.8%
Did not respond 1 3.3% 0 .0% 1 1.8%
Total 30 100.0% 26 100.0% 56 100.0%
How helpful is the individual counseling? Very helpful 17 56.7% 12 46.2% 29 51.8%
Somewhat helpful
8 26.7% 5 19.2% 13 23.2%
Subtotal 25 83.3% 17 65.4% 42 75.0%
Not helpful 2 6.7% 4 15.4% 6 10.7%
Made things worse
0 .0% 0 .0% 0 .0%
Subtotal 2 6.7% 4 15.4% 6 10.7%
Did not receive 3 10.0% 4 15.4% 7 12.5%
Did not respond 0 .0% 1 3.8% 1 1.8%
Total 30 100.0% 26 100.0% 56 100.0%
If you were to seek help again, would you come back to this program?
Yes, definitely 6 20.0% 5 19.2% 11 19.6%
Yes, probably 11 36.7% 7 26.9% 18 32.1%
Subtotal 17 56.7% 12 46.2% 29 51.8%
No, probably not 5 16.7% 8 30.8% 13 23.2%
No, definitely not 7 23.3% 5 19.2% 12 21.4%
Subtotal 12 40.0% 13 50.0% 25 44.6%
Did not respond 1 3.3% 1 3.8% 2 3.6%
Total 30 100.0% 26 100.0% 56 100.0%

Patients Speak Out 2009 Appendix A: Results for JRA Treatment Programs
163
Table 24 Characteristics of JRA Patients by Treatment Modality, March 23‐27, 2009
Treatment Modality
JRA Residential JRA OP/IOP Total
Count Column % Count Column % Count Column %
Age 13 and younger 0 .0% 0 .0% 0 .0%
14 ‐ 15 5 16.7% 6 23.1% 11 19.6%
16 ‐ 17 16 53.3% 11 42.3% 27 48.2%
18 ‐ 23 9 30.0% 9 34.6% 18 32.1%
Unknown 0 .0% 0 .0% 0 .0%
Total 30 100.0% 26 100.0% 56 100.0%
Gender Male 26 86.7% 22 84.6% 48 85.7%
Female 4 13.3% 3 11.5% 7 12.5%
Unknown 0 .0% 1 3.8% 1 1.8%
Total 30 100.0% 26 100.0% 56 100.0%
Ethnic/Racial Background White 13 43.3% 9 34.6% 22 39.3%
Black/African American 3 10.0% 2 7.7% 5 8.9%
Asian/Pacific Islander 1 3.3% 2 7.7% 3 5.4%
Native American/Eskimo/Aleut 3 10.0% 3 11.5% 6 10.7%
Hispanic 4 13.3% 6 23.1% 10 17.9%
Multiracial 2 6.7% 0 .0% 2 3.6%
Other 4 13.3% 1 3.8% 5 8.9%
Unknown 0 .0% 3 11.5% 3 5.4%
Total 30 100.0% 26 100.0% 56 100.0%
Length of Stay in Treatment 15 days or less 8 26.7% 3 11.5% 11 19.6%
16 ‐ 30 days 6 20.0% 2 7.7% 8 14.3%
31 ‐ 45 days 6 20.0% 5 19.2% 11 19.6%
46 ‐ 60 days 0 .0% 3 11.5% 3 5.4%
61 ‐ 75 days 4 13.3% 2 7.7% 6 10.7%
76 ‐ 90 days 1 3.3% 0 .0% 1 1.8%
Over 90 days 3 10.0% 3 11.5% 6 10.7%
Unknown 2 6.7% 8 30.8% 10 17.9%
Total 30 100.0% 26 100.0% 56 100.0%
Source of Funding Private 0 .0% 2 7.7% 2 3.6%
Public 25 83.3% 19 73.1% 44 78.6%
Other 1 3.3% 3 11.5% 4 7.1%
Unknown 4 13.3% 2 7.7% 6 10.7%
Total 30 100.0% 26 100.0% 56 100.0%

Patients Speak Out 2009 Appendix A: Results for JRA Treatment Programs
164
Table 25 Comparing Responses to Questions 1 and 3 of the DBHR Youth Patient Satisfaction Survey
Between Community Youth and JRA Patients Residential Treatment
Community Youth JRA Youth Total
Count Column N % Count Column N % Count Column N %
How satisfied are you with the service you have received? Very satisfied 55 24.3% 6 20.0% 61 23.8%
Mostly satisfied 139 61.5% 22 73.3% 161 62.9%
Subtotal 194 85.8% 28 93.3% 222 86.7%
Dissatisfied 29 12.8% 2 6.7% 31 12.1%
Very dissatisfied 3 1.3% 0 .0% 3 1.2%
Subtotal 32 14.2% 2 6.7% 34 13.3%
Did not respond 0 .0% 0 .0% 0 .0%
Total 226 100.0% 30 100.0% 256 100.0%
Would you say our staff treated you with respect? All of the time 88 38.9% 10 33.3% 98 38.3%
Some of the time 114 50.4% 17 56.7% 131 51.2%
Subtotal 202 89.4% 27 90.0% 229 89.5%
Little of the time 21 9.3% 1 3.3% 22 8.6%
Never 2 .9% 2 6.7% 4 1.6%
Subtotal 23 10.2% 3 10.0% 26 10.2%
Did not respond 1 .4% 0 .0% 1 .4%
Total 226 100.0% 30 100.0% 256 100.0%
Outpatient/Intensive Outpatient Community Youth JRA Youth Total
Count Column N % Count Column N % Count Column N %
How satisfied are you with the service you have received? Very satisfied 578 44.0% 6 23.1% 584 43.5%
Mostly satisfied 633 48.1% 17 65.4% 650 48.5%
Subtotal 1211 92.1% 23 88.5% 1234 92.0%
Dissatisfied 59 4.5% 2 7.7% 61 4.5%
Very dissatisfied 35 2.7% 1 3.8% 36 2.7%
Subtotal 94 7.1% 3 11.5% 97 7.2%
Did not respond 10 .8% 0 .0% 10 .7%
Total 1315 100.0% 26 100.0% 1341 100.0%
Would you say our staff treated you with respect? All of the time 1067 81.1% 8 30.8% 1075 80.2%
Some of the time 203 15.4% 10 38.5% 213 15.9%
Subtotal 1270 96.6% 18 69.2% 1288 96.0%
Little of the time 25 1.9% 6 23.1% 31 2.3%
Never 13 1.0% 2 7.7% 15 1.1%
Subtotal 38 2.9% 8 30.8% 46 3.4%
Did not respond 7 .5% 0 .0% 7 .5%
Total 1315 100.0% 26 100.0% 1341 100.0%

Patients Speak Out 2009 Appendix A: Results for JRA Treatment Programs
165
Table 26a Responses to Questions 1‐7 of the DBHR Youth Patient Satisfaction Survey by Year of Survey in Residential Treatment
Year
2004 2005 2006 2007 2009 Total
CountColumn
% CountColumn
% CountColumn
% CountColumn
% Count Column
% CountColumn
%
How satisfied are you with the service you have received?
Very satisfied 10 16.4% 8 13.1% 6 9.2% 9 16.1% 6 20.0% 39 14.3%
Mostly satisfied
33 54.1% 38 62.3% 33 50.8% 38 67.9% 22 73.3% 164 60.1%
Subtotal 43 70.5% 46 75.4% 39 60.0% 47 83.9% 28 93.3% 203 74.4%
Dissatisfied 12 19.7% 6 9.8% 17 26.2% 7 12.5% 2 6.7% 44 16.1%
Very dissatisfied
6 9.8% 9 14.8% 9 13.8% 1 1.8% 0 .0% 25 9.2%
Subtotal 18 29.5% 15 24.6% 26 40.0% 8 14.3% 2 6.7% 69 25.3%
Did not respond
0 .0% 0 .0% 0 .0% 1 1.8% 0 .0% 1 .4%
Total 61 100.0% 61 100.0% 65 100.0% 56 100.0% 30 100.0% 273 100.0%
How satisfied are you with the comfort and appearance of this facility?
Very satisfied 8 13.1% 8 13.1% 5 7.7% 13 23.2% 7 23.3% 41 15.0%
Mostly satisfied
31 50.8% 38 62.3% 33 50.8% 33 58.9% 21 70.0% 156 57.1%
Subtotal 39 63.9% 46 75.4% 38 58.5% 46 82.1% 28 93.3% 197 72.2%
Dissatisfied 19 31.1% 7 11.5% 11 16.9% 8 14.3% 1 3.3% 46 16.8%
Very dissatisfied
3 4.9% 8 13.1% 15 23.1% 2 3.6% 0 .0% 28 10.3%
Subtotal 22 36.1% 15 24.6% 26 40.0% 10 17.9% 1 3.3% 74 27.1%
Did not respond
0 .0% 0 .0% 1 1.5% 0 .0% 1 3.3% 2 .7%
Total 61 100.0% 61 100.0% 65 100.0% 56 100.0% 30 100.0% 273 100.0%
Would you say our staff treated you with respect?
All of the time
7 11.5% 18 29.5% 16 24.6% 23 41.1% 10 33.3% 74 27.1%
Some of the time
34 55.7% 34 55.7% 34 52.3% 27 48.2% 17 56.7% 146 53.5%
Subtotal 41 67.2% 52 85.2% 50 76.9% 50 89.3% 27 90.0% 220 80.6%
Little of the time
15 24.6% 4 6.6% 13 20.0% 3 5.4% 1 3.3% 36 13.2%
Never 3 4.9% 5 8.2% 1 1.5% 2 3.6% 2 6.7% 13 4.8%
Subtotal 18 29.5% 9 14.8% 14 21.5% 5 8.9% 3 10.0% 49 17.9%
Did not respond
2 3.3% 0 .0% 1 1.5% 1 1.8% 0 .0% 4 1.5%
Total 61 100.0% 61 100.0% 65 100.0% 56 100.0% 30 100.0% 273 100.0%
How safe do you feel in this program?
Very safe 14 23.0% 20 32.8% 21 32.3% 26 46.4% 18 60.0% 99 36.3%
Somewhat safe
32 52.5% 27 44.3% 33 50.8% 25 44.6% 10 33.3% 127 46.5%
Subtotal 46 75.4% 47 77.0% 54 83.1% 51 91.1% 28 93.3% 226 82.8%
Not very safe 11 18.0% 7 11.5% 8 12.3% 5 8.9% 2 6.7% 33 12.1%
Not safe at all
2 3.3% 7 11.5% 3 4.6% 0 .0% 0 .0% 12 4.4%
Subtotal 13 21.3% 14 23.0% 11 16.9% 5 8.9% 2 6.7% 45 16.5%
Did not respond
2 3.3% 0 .0% 0 .0% 0 .0% 0 .0% 2 .7%
Total 61 100.0% 61 100.0% 65 100.0% 56 100.0% 30 100.0% 273 100.0%
Continued next page.

Patients Speak Out 2009 Appendix A: Results for JRA Treatment Programs
166
How helpful are the group sessions?
Very helpful 10 16.4% 13 21.3% 10 15.4% 19 33.9% 10 33.3% 62 22.7%
Somewhat helpful
30 49.2% 31 50.8% 35 53.8% 30 53.6% 15 50.0% 141 51.6%
Subtotal 40 65.6% 44 72.1% 45 69.2% 49 87.5% 25 83.3% 203 74.4%
Not helpful 12 19.7% 15 24.6% 15 23.1% 7 12.5% 4 13.3% 53 19.4%
Made things worse
5 8.2% 1 1.6% 2 3.1% 0 .0% 0 .0% 8 2.9%
Subtotal 17 27.9% 16 26.2% 17 26.2% 7 12.5% 4 13.3% 61 22.3%
Did not receive
1 1.6% 1 1.6% 3 4.6% 0 .0% 0 .0% 5 1.8%
Did not respond
3 4.9% 0 .0% 0 .0% 0 .0% 1 3.3% 4 1.5%
Total 61 100.0% 61 100.0% 65 100.0% 56 100.0% 30 100.0% 273 100.0%
How helpful is the individual counseling?
Very helpful 21 34.4% 23 37.7% 23 35.4% 23 41.1% 17 56.7% 107 39.2%
Somewhat helpful
24 39.3% 25 41.0% 25 38.5% 22 39.3% 8 26.7% 104 38.1%
Subtotal 45 73.8% 48 78.7% 48 73.8% 45 80.4% 25 83.3% 211 77.3%
Not helpful 7 11.5% 6 9.8% 8 12.3% 9 16.1% 2 6.7% 32 11.7%
Made things worse
3 4.9% 1 1.6% 3 4.6% 0 .0% 0 .0% 7 2.6%
Subtotal 10 16.4% 7 11.5% 11 16.9% 9 16.1% 2 6.7% 39 14.3%
Did not receive
5 8.2% 6 9.8% 6 9.2% 2 3.6% 3 10.0% 22 8.1%
Did not respond
1 1.6% 0 .0% 0 .0% 0 .0% 0 .0% 1 .4%
Total 61 100.0% 61 100.0% 65 100.0% 56 100.0% 30 100.0% 273 100.0%
If you were to seek help again, would you come back to this program?
Yes, definitely 8 13.1% 6 9.8% 5 7.7% 8 14.3% 6 20.0% 33 12.1%
Yes, probably 9 14.8% 23 37.7% 22 33.8% 22 39.3% 11 36.7% 87 31.9%
Subtotal 17 27.9% 29 47.5% 27 41.5% 30 53.6% 17 56.7% 120 44.0%
No, probably not
25 41.0% 15 24.6% 16 24.6% 12 21.4% 5 16.7% 73 26.7%
No, definitely not
19 31.1% 17 27.9% 21 32.3% 14 25.0% 7 23.3% 78 28.6%
Subtotal 44 72.1% 32 52.5% 37 56.9% 26 46.4% 12 40.0% 151 55.3%
Did not respond
0 .0% 0 .0% 1 1.5% 0 .0% 1 3.3% 2 .7%
Total 61 100.0% 61 100.0% 65 100.0% 56 100.0% 30 100.0% 273 100.0%

Patients Speak Out 2009 Appendix A: Results for JRA Treatment Programs
167
Table 26b Responses to Questions 1‐7 of the DBHR Youth Patient Satisfaction Survey by Year of Survey
in Outpatient/Intensive Outpatient
Year
2004 2005 2006 2007 2009 Total
CountColumn
% CountColumn
% CountColumn
% CountColumn
% Count Column
% CountColumn
%
How satisfied are you with the service you have received?
Very satisfied 8 34.8% 14 34.1% 8 33.3% 10 37.0% 6 23.1% 46 32.6%
Mostly satisfied
7 30.4% 16 39.0% 8 33.3% 12 44.4% 17 65.4% 60 42.6%
Subtotal 15 65.2% 30 73.2% 16 66.7% 22 81.5% 23 88.5% 106 75.2%
Dissatisfied 3 13.0% 4 9.8% 4 16.7% 4 14.8% 2 7.7% 17 12.1%
Very dissatisfied
5 21.7% 6 14.6% 4 16.7% 1 3.7% 1 3.8% 17 12.1%
Subtotal 8 34.8% 10 24.4% 8 33.3% 5 18.5% 3 11.5% 34 24.1%
Did not respond
0 .0% 1 2.4% 0 .0% 0 .0% 0 .0% 1 .7%
Total 23 100.0% 41 100.0% 24 100.0% 27 100.0% 26 100.0% 141 100.0%
How satisfied are you with the comfort and appearance of this facility?
Very satisfied 6 26.1% 11 26.8% 3 12.5% 3 11.1% 9 34.6% 32 22.7%
Mostly satisfied
10 43.5% 13 31.7% 13 54.2% 19 70.4% 8 30.8% 63 44.7%
Subtotal 16 69.6% 24 58.5% 16 66.7% 22 81.5% 17 65.4% 95 67.4%
Dissatisfied 4 17.4% 10 24.4% 3 12.5% 3 11.1% 8 30.8% 28 19.9%
Very dissatisfied
3 13.0% 7 17.1% 5 20.8% 2 7.4% 1 3.8% 18 12.8%
Subtotal 7 30.4% 17 41.5% 8 33.3% 5 18.5% 9 34.6% 46 32.6%
Did not respond
0 .0% 0 .0% 0 .0% 0 .0% 0 .0% 0 .0%
Total 23 100.0% 41 100.0% 24 100.0% 27 100.0% 26 100.0% 141 100.0%
Would you say our staff treated you with respect?
All of the time
8 34.8% 14 34.1% 7 29.2% 12 44.4% 8 30.8% 49 34.8%
Some of the time
8 34.8% 16 39.0% 10 41.7% 12 44.4% 10 38.5% 56 39.7%
Subtotal 16 69.6% 30 73.2% 17 70.8% 24 88.9% 18 69.2% 105 74.5%
Little of the time
5 21.7% 9 22.0% 5 20.8% 3 11.1% 6 23.1% 28 19.9%
Never 2 8.7% 2 4.9% 2 8.3% 0 .0% 2 7.7% 8 5.7%
Subtotal 7 30.4% 11 26.8% 7 29.2% 3 11.1% 8 30.8% 36 25.5%
Did not respond
0 .0% 0 .0% 0 .0% 0 .0% 0 .0% 0 .0%
Total 23 100.0% 41 100.0% 24 100.0% 27 100.0% 26 100.0% 141 100.0%
How safe do you feel in this program?
Very safe 13 56.5% 19 46.3% 10 41.7% 17 63.0% 15 57.7% 74 52.5%
Somewhat safe
7 30.4% 16 39.0% 11 45.8% 10 37.0% 9 34.6% 53 37.6%
Subtotal 20 87.0% 35 85.4% 21 87.5% 27 100.0% 24 92.3% 127 90.1%
Not very safe 2 8.7% 2 4.9% 2 8.3% 0 .0% 2 7.7% 8 5.7%
Not safe at all
1 4.3% 3 7.3% 1 4.2% 0 .0% 0 .0% 5 3.5%
Subtotal 3 13.0% 5 12.2% 3 12.5% 0 .0% 2 7.7% 13 9.2%
Did not respond
0 .0% 1 2.4% 0 .0% 0 .0% 0 .0% 1 .7%
Total 23 100.0% 41 100.0% 24 100.0% 27 100.0% 26 100.0% 141 100.0%
Continued next page.

Patients Speak Out 2009 Appendix A: Results for JRA Treatment Programs
168
How helpful are the group sessions?
Very helpful 7 30.4% 13 31.7% 11 45.8% 9 33.3% 12 46.2% 52 36.9%
Somewhat helpful
9 39.1% 16 39.0% 8 33.3% 14 51.9% 12 46.2% 59 41.8%
Subtotal 16 69.6% 29 70.7% 19 79.2% 23 85.2% 24 92.3% 111 78.7%
Not helpful 4 17.4% 8 19.5% 5 20.8% 3 11.1% 1 3.8% 21 14.9%
Made things worse
1 4.3% 1 2.4% 0 .0% 0 .0% 0 .0% 2 1.4%
Subtotal 5 21.7% 9 22.0% 5 20.8% 3 11.1% 1 3.8% 23 16.3%
Did not receive
2 8.7% 2 4.9% 0 .0% 1 3.7% 1 3.8% 6 4.3%
Did not respond
0 .0% 1 2.4% 0 .0% 0 .0% 0 .0% 1 .7%
Total 23 100.0% 41 100.0% 24 100.0% 27 100.0% 26 100.0% 141 100.0%
How helpful is the individual counseling?
Very helpful 11 47.8% 15 36.6% 8 33.3% 14 51.9% 12 46.2% 60 42.6%
Somewhat helpful
5 21.7% 16 39.0% 10 41.7% 9 33.3% 5 19.2% 45 31.9%
Subtotal 16 69.6% 31 75.6% 18 75.0% 23 85.2% 17 65.4% 105 74.5%
Not helpful 3 13.0% 4 9.8% 3 12.5% 2 7.4% 4 15.4% 16 11.3%
Made things worse
0 .0% 1 2.4% 0 .0% 0 .0% 0 .0% 1 .7%
Subtotal 3 13.0% 5 12.2% 3 12.5% 2 7.4% 4 15.4% 17 12.1%
Did not receive
4 17.4% 5 12.2% 3 12.5% 2 7.4% 4 15.4% 18 12.8%
Did not respond
0 .0% 0 .0% 0 .0% 0 .0% 1 3.8% 1 .7%
Total 23 100.0% 41 100.0% 24 100.0% 27 100.0% 26 100.0% 141 100.0%
If you were to seek help again, would you come back to this program?
Yes, definitely
4 17.4% 5 12.2% 3 12.5% 6 22.2% 5 19.2% 23 16.3%
Yes, probably
8 34.8% 16 39.0% 11 45.8% 11 40.7% 7 26.9% 53 37.6%
Subtotal 12 52.2% 21 51.2% 14 58.3% 17 63.0% 12 46.2% 76 53.9%
No, probably not
7 30.4% 8 19.5% 3 12.5% 5 18.5% 8 30.8% 31 22.0%
No, definitely not
4 17.4% 12 29.3% 7 29.2% 5 18.5% 5 19.2% 33 23.4%
Subtotal 11 47.8% 20 48.8% 10 41.7% 10 37.0% 13 50.0% 64 45.4%
Did not respond
0 .0% 0 .0% 0 .0% 0 .0% 1 3.8% 1 .7%
Total 23 100.0% 41 100.0% 24 100.0% 27 100.0% 26 100.0% 141 100.0%

Patients Speak Out 2009
169
Appendix B: Survey Instruments

Patients Speak Out 2009
170
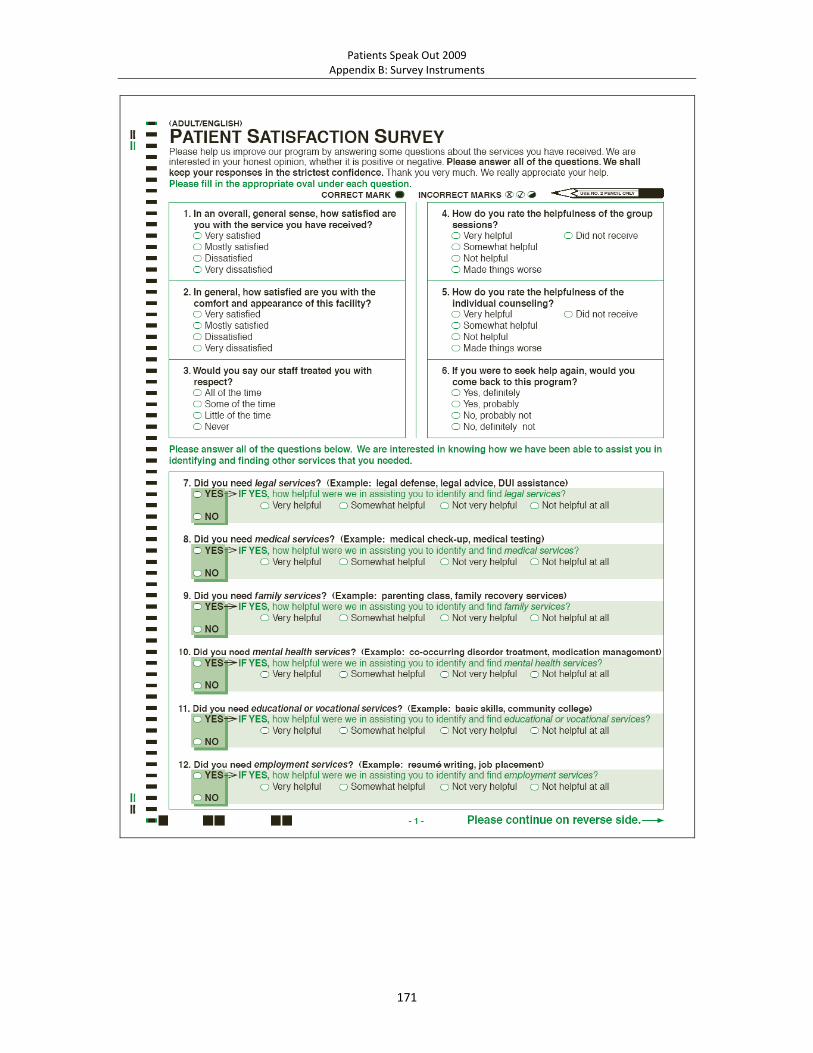
Patients Speak Out 2009 Appendix B: Survey Instruments
171

Patients Speak Out 2009 Appendix B: Survey Instruments
172

Patients Speak Out 2009 Appendix B: Survey Instruments
173

Patients Speak Out 2009 Appendix B: Survey Instruments
174

Patients Speak Out 2009 Appendix B: Survey Instruments
175

Patients Speak Out 2009 Appendix B: Survey Instruments
176

Patients Speak Out 2009 Appendix B: Survey Instruments
177
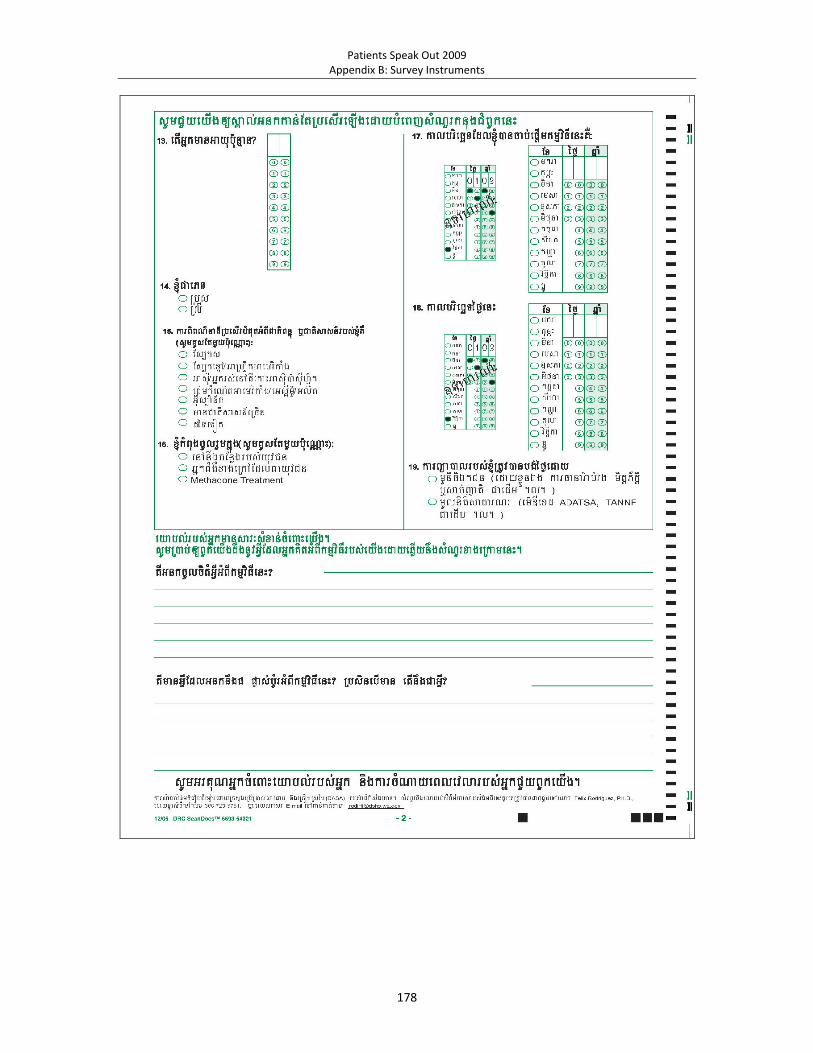
Patients Speak Out 2009 Appendix B: Survey Instruments
178

Patients Speak Out 2009 Appendix B: Survey Instruments
179

Patients Speak Out 2009 Appendix B: Survey Instruments
180

Patients Speak Out 2009 Appendix B: Survey Instruments
181

Patients Speak Out 2009 Appendix B: Survey Instruments
182

Patients Speak Out 2009 Appendix B: Survey Instruments
183

Patients Speak Out 2009 Appendix B: Survey Instruments
184

Patients Speak Out 2009 Appendix B: Survey Instruments
185

Patients Speak Out 2009 Appendix B: Survey Instruments
186

Patients Speak Out 2009 Appendix B: Guidelines for Administration
187

Patients Speak Out 2009
188

Patients Speak Out 2009
189
Appendix C: DSHS Washington State Map of County by Regions

Patients Speak Out 2009
190

Patients Speak Out 2009 Appendix C: DSHS Washington State Map of County by Regions
191
Region 3
Region 4
Region 5
Region 6Region 2
Region 1
Lewis
Thurston
Pacific
Cowlitz
Kittitas
Klickitat
Benton
Yakima
OkanoganIsland
Pierce
Mason King
Jefferson
GraysHarbor
Asotin
Columbia
Garfield
Clark
Kitsap
Clallam
San Juan
Franklin
WhitmanAdamsGrant
Wahkiakum
Snohomish
Skagit
ChelanDouglas Lincoln Spokane
Stevens
FerryWhatcom
Skamania Walla Walla
PendOreille
Department of Social and Health Services - County by Regions
DEPARTMENT OFSOCIAL & HEALTH
SERVICES
Washington State

Patients Speak Out 2009
192