pat's - review of technology and applications
DESCRIPTION
Presentation of Pumps as TurbinesTRANSCRIPT

C if l P T biCentrifugal Pumps as Turbines:
A Review of Technology and ApplicationsA Review of Technology and Applications
Arthur Williams – University of Nottingham(School of Electrical & Electronic Engineering)

C if l P T biCentrifugal Pumps as Turbines:
A Review of Technology and ApplicationsA Review of Technology and Applications
ThThemes:
1. Improved Prediction using Cordier Diagram
2. Applications in Water Industry & Rural Development

Typical pump and Pump as Turbine (PAT) curvesTurbine (PAT) curves
16
18 7000
12
14
16
5000
6000
)PAT Head
10
12
ad (m
) 4000
pow
er (W
Pump best
PAT Head
Eff. 73%
6
8Hea
2000
3000
Turb
ine efficiency: 72%
PAT Power
2
4
1000
00 10 20 30 40 50 60
Flow (litre/s)
0
( )
End-suction centrifugal pump with 4-pole motor

Pump as Turbine (PAT) efficiencies can be as good as pump mode – but not always
1.15
good as pump mode – but not always
1 05
1.1
1
1.05
ency
ratio
+/- 5%
0 9
0.95
Pum
p ef
ficie
>2% lower efficiency
+/- 2% efficiency
0.85
0.9
PA
T:P % y
>2% higher efficiency
Double suction pumps
0.8
Double suction pumps
Cylindrical volute pump
0.7510 100 1000
Pump Specific Speed (Nq - metric units - logarithmic scale)

Using dimensionless parameters for PAT performance predictionperformance prediction
90 End‐suction Pumps
70
80End suction Pumps
End‐suction PATs
Pumps PSingh
50
60
fic Speed
Pumps PSingh
PATs PSingh
Pump Trend Spe
ed
20
30
40
Specif Pump Trend
PAT Trend
pecific
0
10
20S
1 2 3 4 5 6 7Specific Diameter
Specific Diameter

Turbine and Pump Specific Speeds
80Nqt
60
NqtP Singh's Data
P Singh Trendline
40Linear Correlation
20
Correlation
20
Nqp
00 20 40 60 80 100
Specific Speed of PAT is not = Specific Speed of PumpSpecific Speed of PAT is not = Specific Speed of Pump

Turbine and Pump Specific Speeds
80 End suction pumps
60
80Nqt End-suction pumps
P Singh's Data
40
P Singh Trendline
Outside +/- 3% error range
20
0 Nqp0 20 40 60 80 100

Cordier Diagram for Pumps and PATs
100
End‐suction Pumps
End‐suction PATs
Pumps (PSingh)
(log scale)
Pumps (PSingh)
PATs (PSingh)
Pump Trend
ific Speed (
PAT Trend
Unusual Pumps
Spec Unusual PATs
A conclusion: Trend lines h ld b b d
Specific Diameter (log scale)
should be based on similar designs of pump
10
1 10
Specific Diameter (log scale)

DH‐supply Energy Recovery Applications
Control Valve
Applications
PAT used in district heating (DH)
Circulation Pump Approx. 1 kW unit
Prevents heating from closing down in event of
PAT
closing down in event of electric supply failure
PAT(Wollerstrand & Fredericksen,
Lund University, 2008)
DH‐return Heat Exchanger

Applications in Water Industry
13 kW energy recovery unit in13 kW energy recovery unit in Switzerland.
Advantages quoted:
• Less surge than Pelton in case of loss of mains
• Easier maintenance and• Easier maintenance and quicker delivery of parts

Applications in Water Industry
Control of Pressure => Flow Reduction of 25%
0:00 6:00 12:00 18:00 24.00
(Graph from J Thornton, 2003)Time of Day

Applications in Water Industry
Significant Pressure Reduction Needed
Could be achieved by valve and PAT
in parallelTime of Day >
in parallel

Applications in Water Industry
Example from www.atb-becker.com
(Austria)
Typical system with valve and PAT
in parallel
Positive displacement
PAT from in parallelPAT from Zeropex
(Norway)

Applications in Rural Electrification
Border Green Energy have built six village Pump-as-Border Green Energy have built six village Pump-as-turbine projects on the Thai/Burma border area from 3 kW to 10 kW in capacity, and all produce power at
expected levelsexpected levels.

(Mae Wei, Thailand)Thailand)

Applications in Rural Electrification
Heksa Prakarsa Teknik include Pumps-as-turbines among their turbine options and
have installed several in Indonesia. These projects use an electronic load controllerprojects use an electronic load controller
designed by Dr Nigel Smith for use with off-grid asynchronous (induction) generators.

Conclusions:
1. Pump-as-Turbine prediction is better with Cordier plot
2. Similar Designs of pumps will have similar PAT trends
3. Useful for pump manufacturers
(in combination with CFD to identify effects of geometry inidentify effects of geometry in turbine operation)
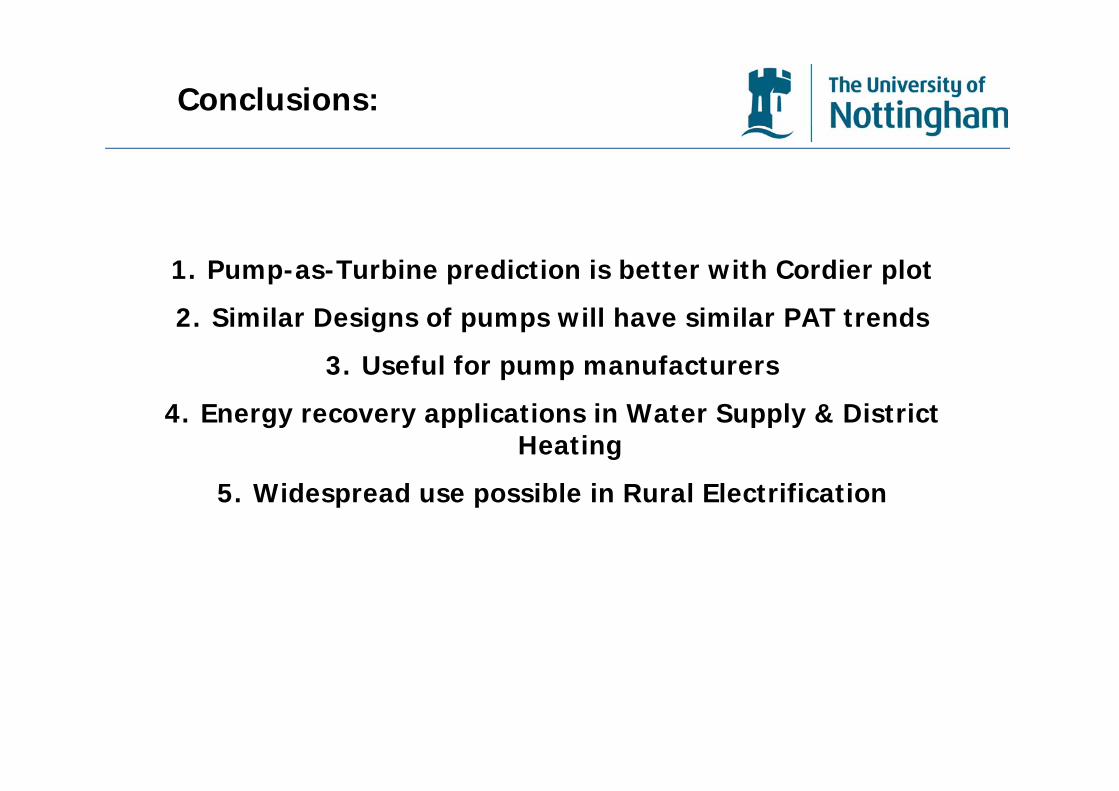
Conclusions:
1. Pump-as-Turbine prediction is better with Cordier plot
2. Similar Designs of pumps will have similar PAT trends
3. Useful for pump manufacturers
4. Energy recovery applications in Water Supply & District Heating
5 Wid d ibl i R l El t ifi ti5. Widespread use possible in Rural Electrification