pattern recognition and machine...
TRANSCRIPT

PATTERN RECOGNITION AND MACHINE LEARNING CHAPTER 2: PROBABILITY DISTRIBUTIONS

Parametric Distributions
Basic building blocks:
Need to determine given
Representation: or ?
Recall Curve Fitting

Binary Variables (1)
Coin flipping: heads=1, tails=0
Bernoulli Distribution

Binary Variables (2)
N coin flips:
Binomial Distribution

Binomial Distribution
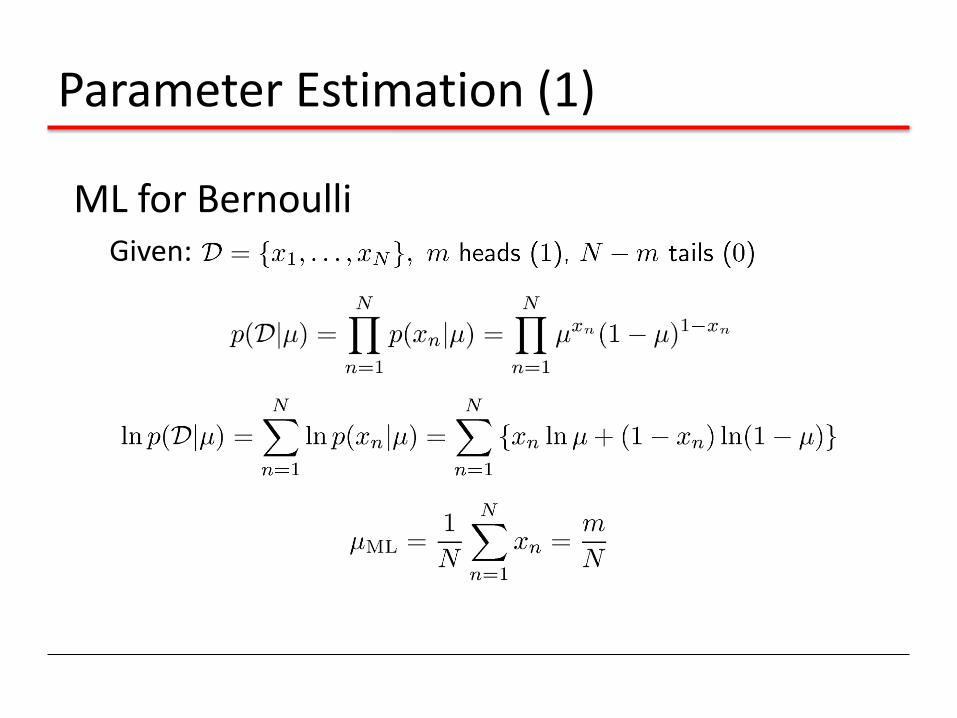
Parameter Estimation (1)
ML for Bernoulli Given:

Parameter Estimation (2)
Example:
Prediction: all future tosses will land heads up
Overfitting to D

Beta Distribution
Distribution over .

Bayesian Bernoulli
The Beta distribution provides the conjugate prior for the Bernoulli distribution.

Beta Distribution

Prior ∙ Likelihood = Posterior

Properties of the Posterior
As the size of the data set, N , increase

Prediction under the Posterior
What is the probability that the next coin toss will land heads up?

Multinomial Variables
1-of-K coding scheme:

ML Parameter estimation
Given:
Ensure , use a Lagrange multiplier, ¸.
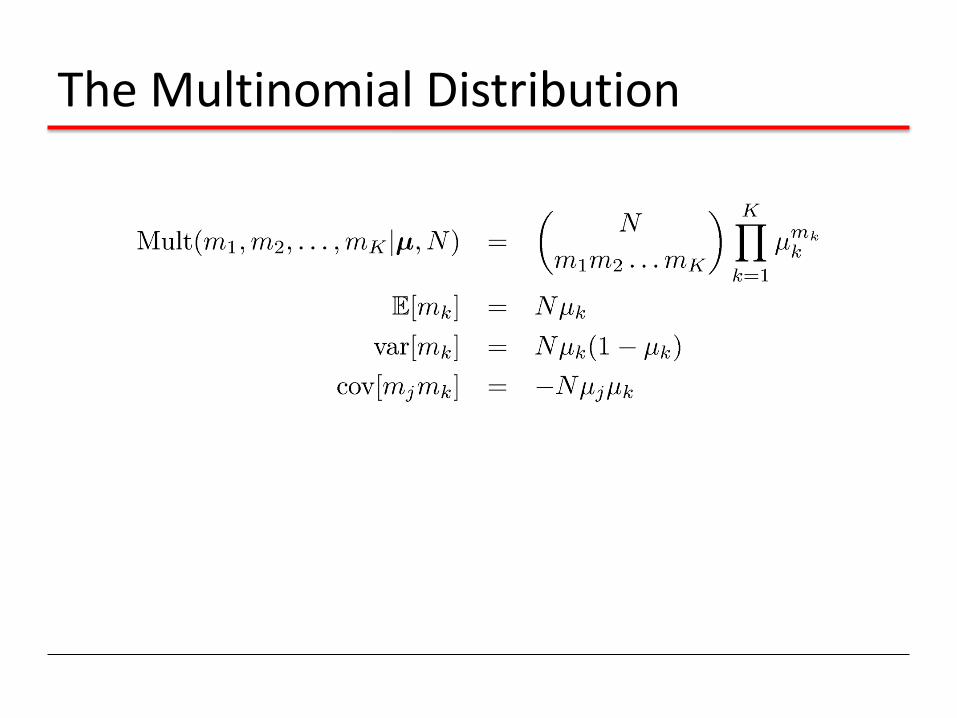
The Multinomial Distribution

The Dirichlet Distribution
Conjugate prior for the multinomial distribution.

Bayesian Multinomial (1)

Bayesian Multinomial (2)

The Gaussian Distribution

Central Limit Theorem
The distribution of the sum of N i.i.d. random variables becomes increasingly Gaussian as N grows.
Example: N uniform [0,1] random variables.

Geometry of the Multivariate Gaussian

Moments of the Multivariate Gaussian (1)
thanks to anti-symmetry of z
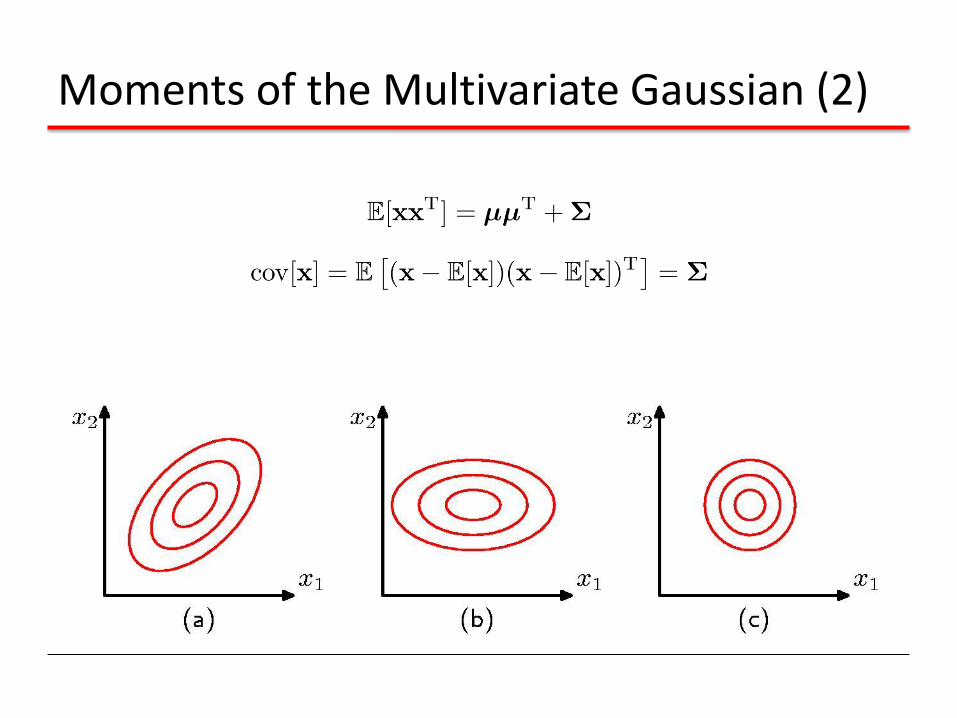
Moments of the Multivariate Gaussian (2)

Partitioned Gaussian Distributions
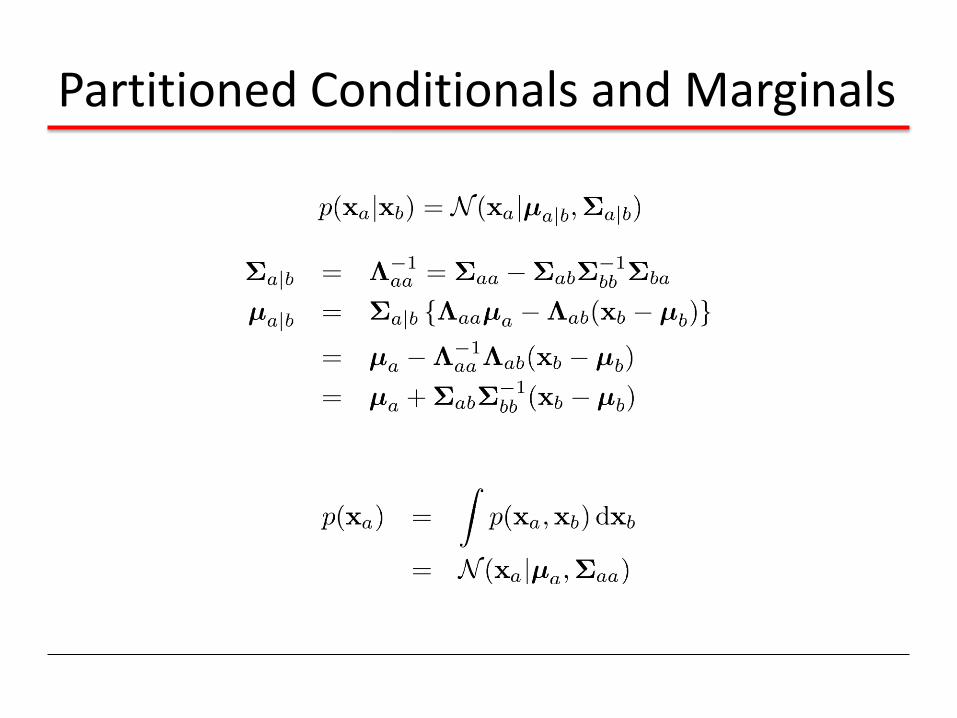
Partitioned Conditionals and Marginals

Partitioned Conditionals and Marginals

Bayes’ Theorem for Gaussian Variables
Given
we have
where

Maximum Likelihood for the Gaussian (1)
Given i.i.d. data , the log likeli-hood function is given by
Sufficient statistics

Maximum Likelihood for the Gaussian (2)
Set the derivative of the log likelihood function to zero,
and solve to obtain
Similarly
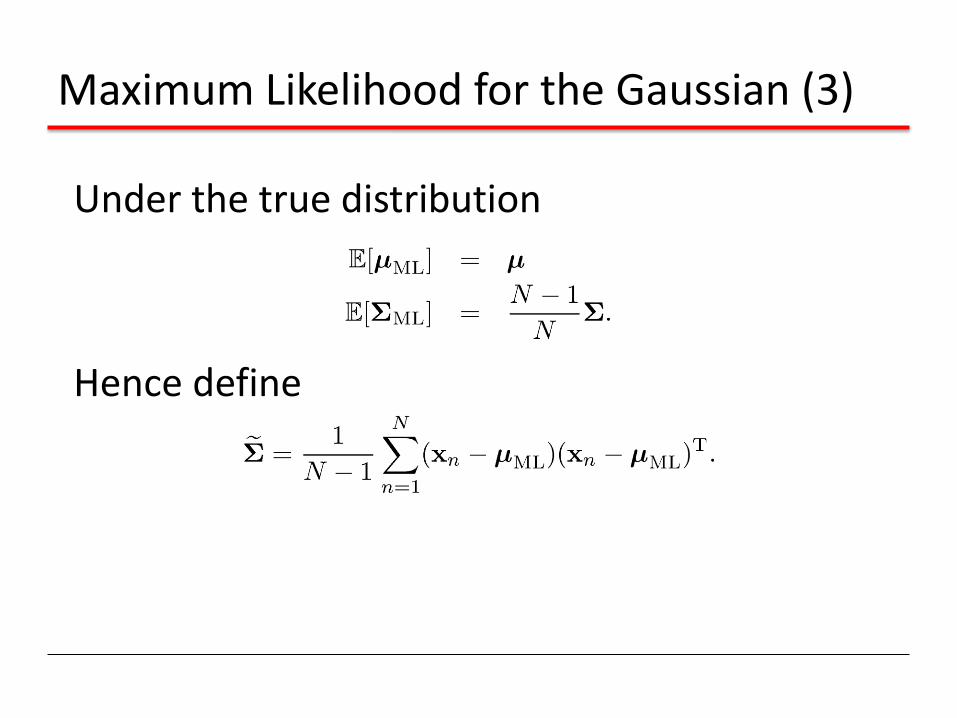
Maximum Likelihood for the Gaussian (3)
Under the true distribution
Hence define

Contribution of the N th data point, xN
Sequential Estimation
correction given xN correction weight
old estimate
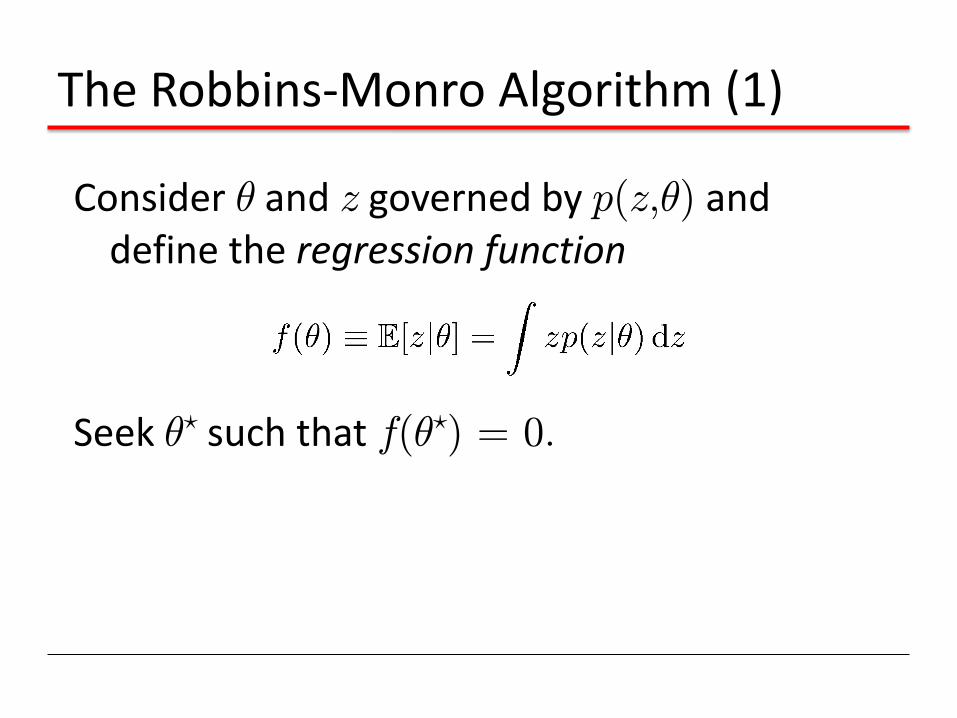
Consider µ and z governed by p(z,µ) and define the regression function
Seek µ? such that f(µ?) = 0.
The Robbins-Monro Algorithm (1)

Assume we are given samples from p(z,µ), one at the time.
The Robbins-Monro Algorithm (2)

Successive estimates of µ? are then given by
Conditions on aN for convergence :
The Robbins-Monro Algorithm (3)

Regarding
as a regression function, finding its root is equivalent to finding the maximum likelihood solution µML. Thus
Robbins-Monro for Maximum Likelihood (1)
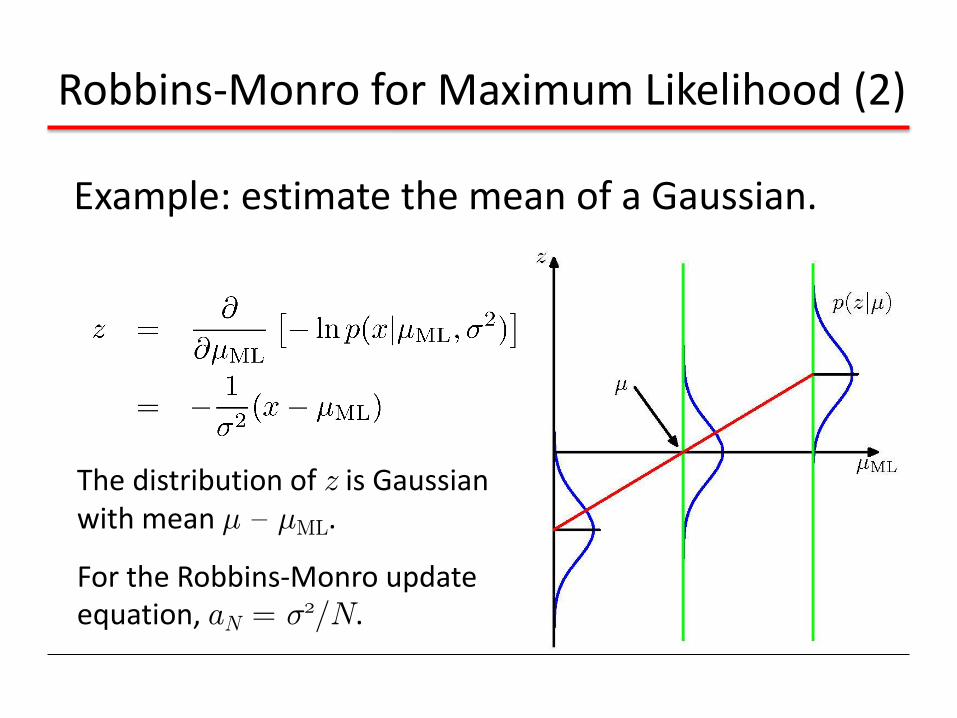
Example: estimate the mean of a Gaussian.
Robbins-Monro for Maximum Likelihood (2)
The distribution of z is Gaussian with mean ¹ { ¹ML.
For the Robbins-Monro update equation, aN = ¾2=N.
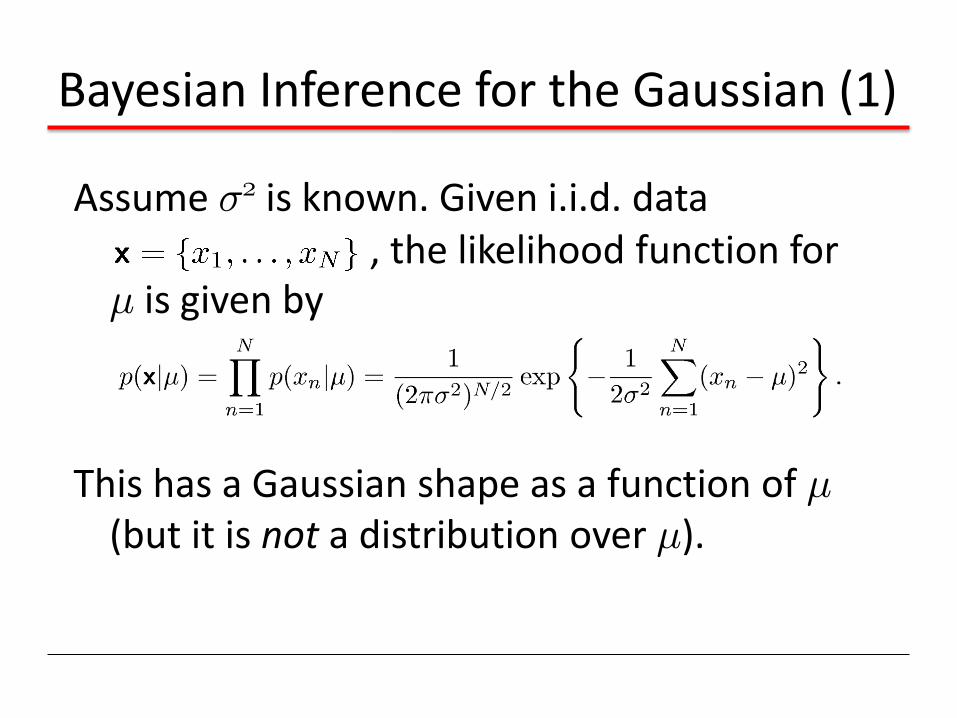
Bayesian Inference for the Gaussian (1)
Assume ¾2 is known. Given i.i.d. data , the likelihood function for ¹ is given by
This has a Gaussian shape as a function of ¹ (but it is not a distribution over ¹).
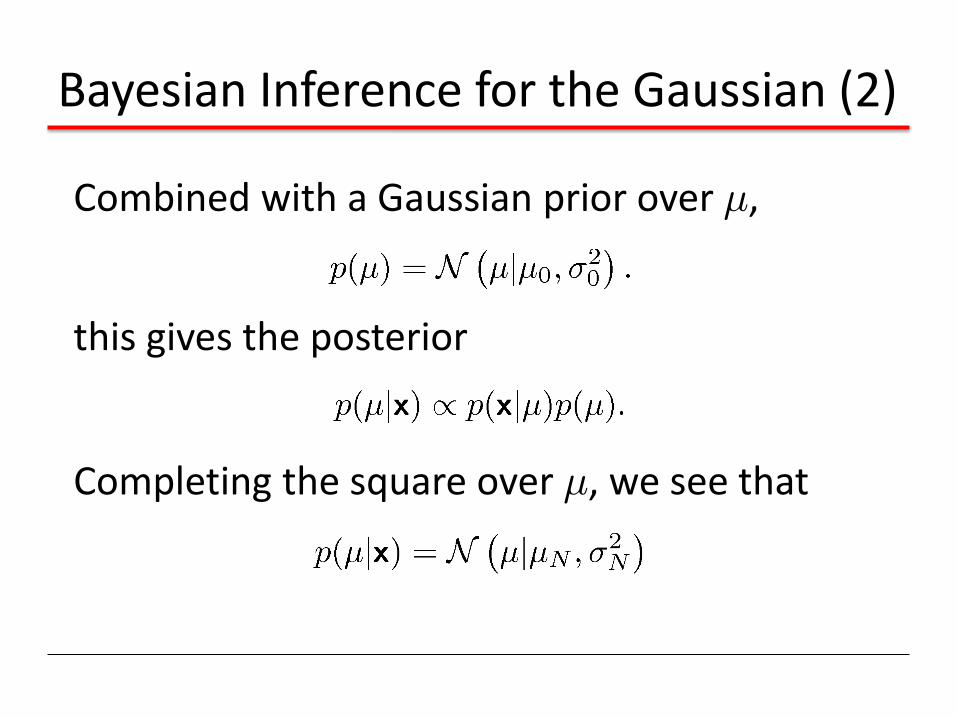
Bayesian Inference for the Gaussian (2)
Combined with a Gaussian prior over ¹,
this gives the posterior
Completing the square over ¹, we see that

Bayesian Inference for the Gaussian (3)
… where
Note:

Bayesian Inference for the Gaussian (4)
Example: for N = 0, 1, 2
and 10.

Bayesian Inference for the Gaussian (5)
Sequential Estimation
The posterior obtained after observing N { 1 data points becomes the prior when we observe the N
th data point.

Bayesian Inference for the Gaussian (6)
Now assume ¹ is known. The likelihood function for ̧ = 1/¾2 is given by
This has a Gamma shape as a function of ¸.

Bayesian Inference for the Gaussian (7)
The Gamma distribution

Bayesian Inference for the Gaussian (8)
Now we combine a Gamma prior, , with the likelihood function for ¸ to obtain
which we recognize as with

Bayesian Inference for the Gaussian (9)
If both ¹ and ¸ are unknown, the joint likelihood function is given by
We need a prior with the same functional dependence on ¹ and ¸.

Bayesian Inference for the Gaussian (10)
The Gaussian-gamma distribution
• Quadratic in ¹. • Linear in ¸.
• Gamma distribution over ¸. • Independent of ¹.

Bayesian Inference for the Gaussian (11)
The Gaussian-gamma distribution

Bayesian Inference for the Gaussian (12)
Multivariate conjugate priors
• ¹ unknown, ¤ known: p(¹) Gaussian.
• ¤ unknown, ¹ known: p(¤) Wishart,
• ¤ and ¹ unknown: p(¹,¤) Gaussian-Wishart,

where
Infinite mixture of Gaussians.
Student’s t-Distribution

Student’s t-Distribution

Student’s t-Distribution
Robustness to outliers: Gaussian vs t-distribution.

Student’s t-Distribution
The D-variate case:
where .
Properties:

Periodic variables
• Examples: calendar time, direction, …
• We require

von Mises Distribution (1)
This requirement is satisfied by
where
is the 0th order modified Bessel function of the 1st kind.

von Mises Distribution (4)

Maximum Likelihood for von Mises
Given a data set, , the log likelihood function is given by
Maximizing with respect to µ0 we directly obtain
Similarly, maximizing with respect to m we get
which can be solved numerically for mML.

Mixtures of Gaussians (1)
Old Faithful data set
Single Gaussian Mixture of two Gaussians

Mixtures of Gaussians (2)
Combine simple models into a complex model:
Component
Mixing coefficient
K=3

Mixtures of Gaussians (3)

Mixtures of Gaussians (4)
Determining parameters ¹, §, and ¼ using maximum log likelihood
Solution: use standard, iterative, numeric optimization methods or the expectation maximization algorithm (Chapter 9).
Log of a sum; no closed form maximum.

The Exponential Family (1)
where ´ is the natural parameter and
so g(´) can be interpreted as a normalization coefficient.

The Exponential Family (2.1)
The Bernoulli Distribution
Comparing with the general form we see that
and so
Logistic sigmoid
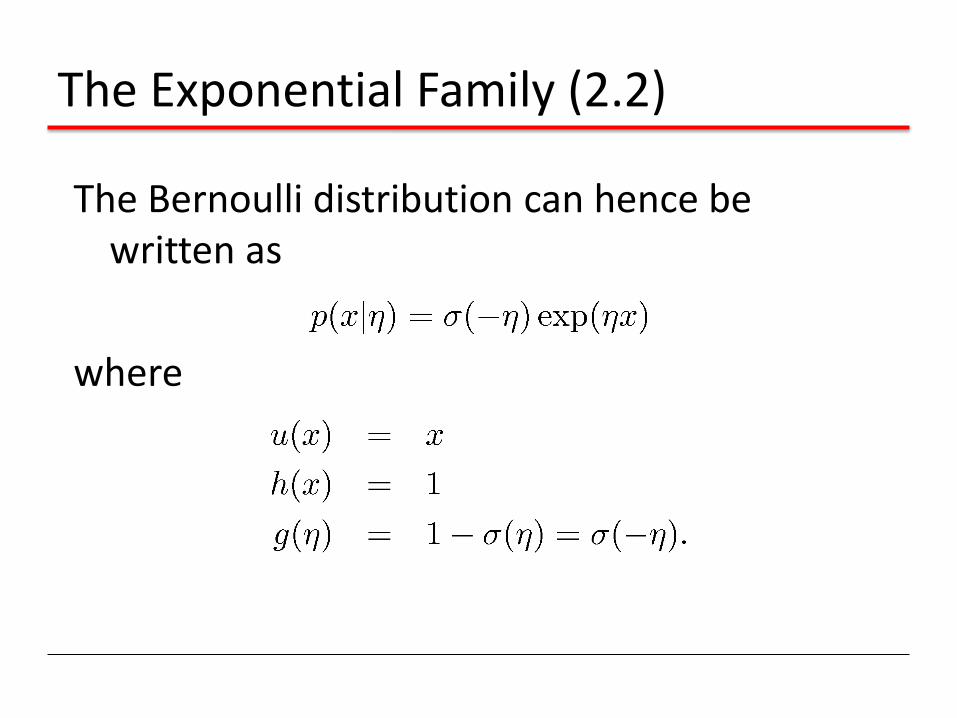
The Exponential Family (2.2)
The Bernoulli distribution can hence be written as
where

The Exponential Family (3.1)
The Multinomial Distribution
where, , and
NOTE: The ´ k parameters are not independent since the corresponding ¹k must satisfy
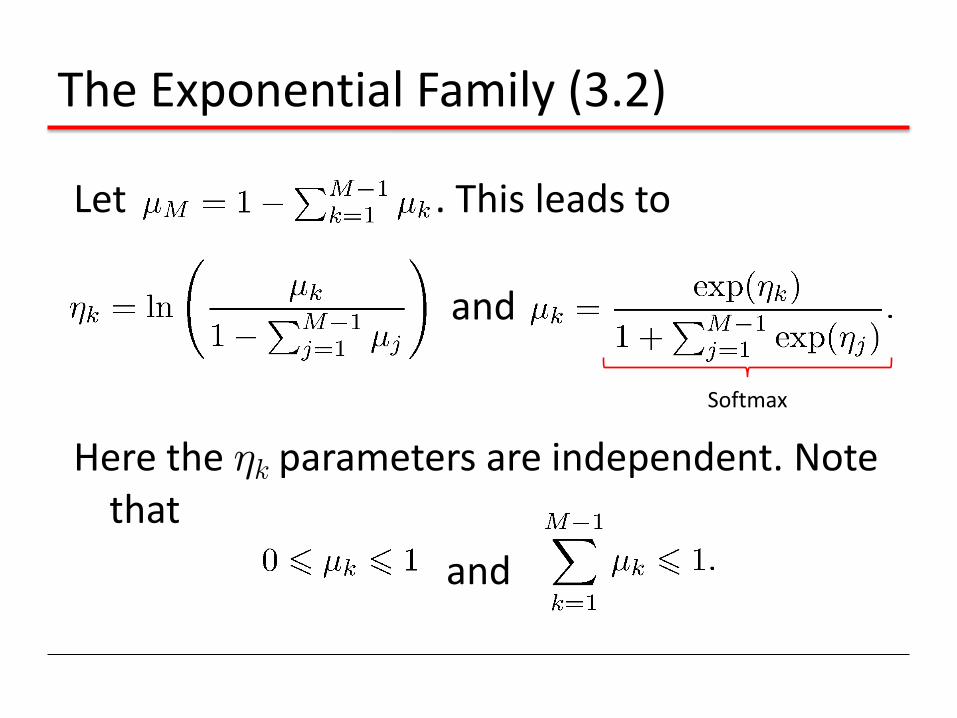
The Exponential Family (3.2)
Let . This leads to
and
Here the ´ k parameters are independent. Note that
and
Softmax

The Exponential Family (3.3)
The Multinomial distribution can then be written as
where

The Exponential Family (4)
The Gaussian Distribution
where
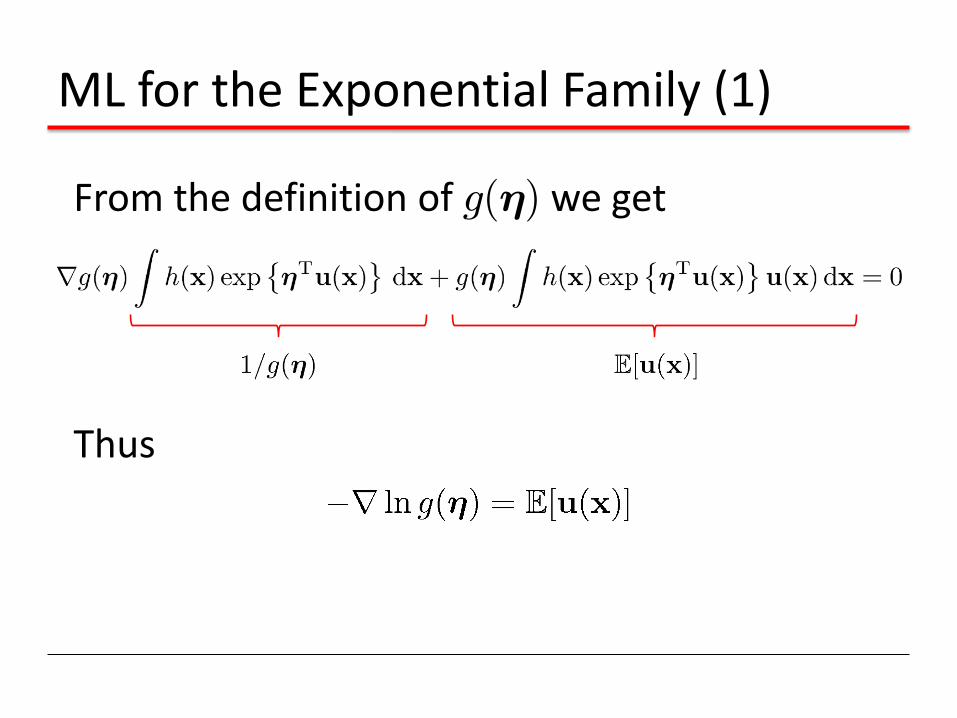
ML for the Exponential Family (1)
From the definition of g(´) we get
Thus

ML for the Exponential Family (2)
Give a data set, , the likelihood function is given by
Thus we have
Sufficient statistic

Conjugate priors
For any member of the exponential family, there exists a prior
Combining with the likelihood function, we get
Prior corresponds to º pseudo-observations with value Â.

Noninformative Priors (1)
With little or no information available a-priori, we might choose a non-informative prior.
• ¸ discrete, K-nomial :
• ¸2[a,b] real and bounded:
• ¸ real and unbounded: improper!
A constant prior may no longer be constant after a change of variable; consider p(¸) constant and ¸=´2:

Noninformative Priors (2)
Translation invariant priors. Consider
For a corresponding prior over ¹, we have
for any A and B. Thus p(¹) = p(¹ { c) and p(¹) must be constant.
Noninformative Priors (3)
Example: The mean of a Gaussian, ¹ ; the conjugate prior is also a Gaussian,
As , this will become constant over ¹ .

Noninformative Priors (4)
Scale invariant priors. Consider and make the change of variable
For a corresponding prior over ¾, we have
for any A and B. Thus p(¾) / 1/¾ and so this prior is improper too. Note that this corresponds to p(ln ¾) being constant.

Noninformative Priors (5)
Example: For the variance of a Gaussian, ¾2, we have
If ¸ = 1/¾2 and p(¾) / 1/¾ , then p(¸) / 1/ ¸.
We know that the conjugate distribution for ¸ is the Gamma distribution,
A noninformative prior is obtained when a0 = 0 and b0 = 0.

Nonparametric Methods (1)
Parametric distribution models are restricted to specific forms, which may not always be suitable; for example, consider modelling a multimodal distribution with a single, unimodal model.
Nonparametric approaches make few assumptions about the overall shape of the distribution being modelled.

Nonparametric Methods (2)
Histogram methods partition the data space into distinct bins with widths ¢i and count the number of observations, ni, in each bin.
•Often, the same width is used for all bins, ¢i = ¢.
•¢ acts as a smoothing parameter.
•In a D-dimensional space, using M bins in each dimen-sion will require MD bins!
Nonparametric Methods (3)
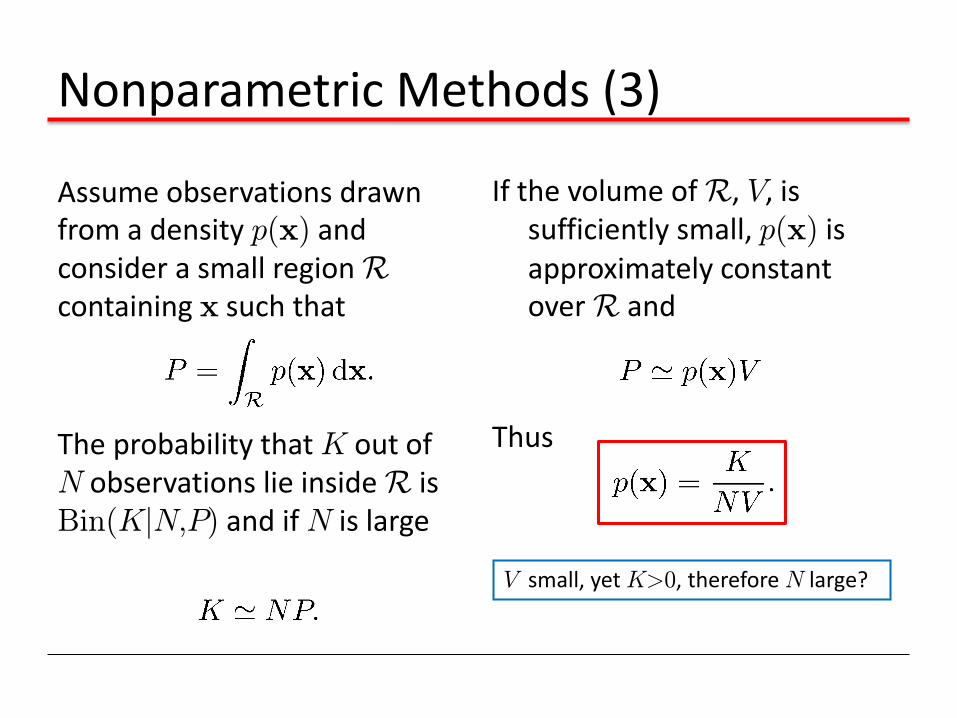
Assume observations drawn from a density p(x) and consider a small region R containing x such that
The probability that K out of N observations lie inside R is Bin(KjN,P ) and if N is large
If the volume of R, V, is sufficiently small, p(x) is approximately constant over R and
Thus
V small, yet K>0, therefore N large?

Nonparametric Methods (4)
Kernel Density Estimation: fix V, estimate K from the data. Let R be a hypercube centred on x and define the kernel function (Parzen window)
It follows that
and hence

Nonparametric Methods (5)
To avoid discontinuities in p(x), use a smooth kernel, e.g. a Gaussian
Any kernel such that
will work.
h acts as a smoother.
Nonparametric Methods (6)
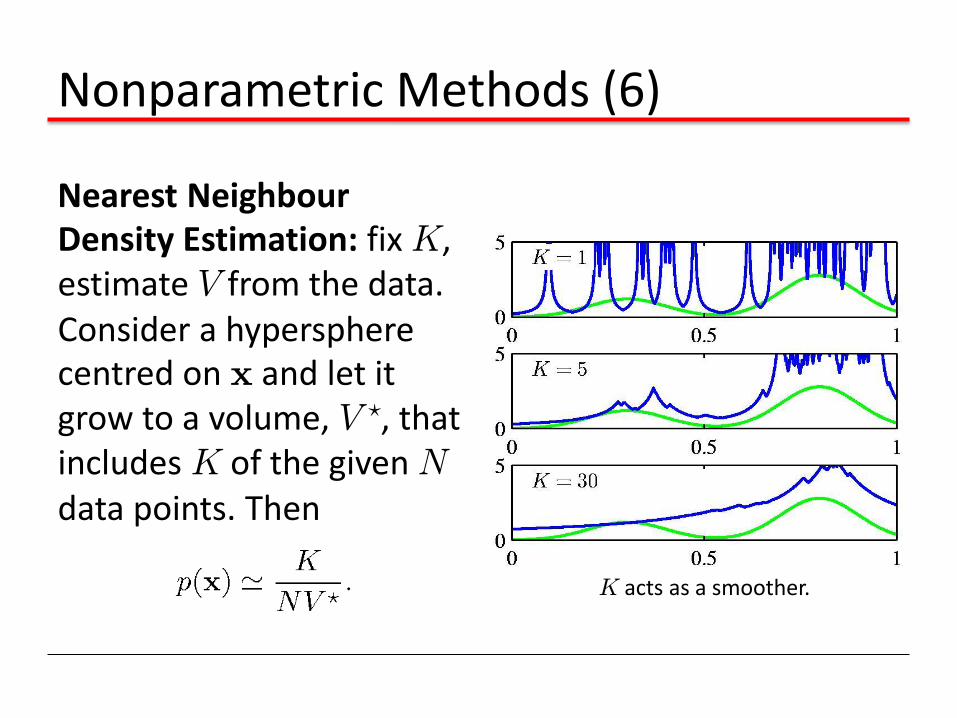
Nearest Neighbour Density Estimation: fix K, estimate V from the data. Consider a hypersphere centred on x and let it grow to a volume, V ?, that includes K of the given N data points. Then
K acts as a smoother.
Nonparametric Methods (7)
Nonparametric models (not histograms) requires storing and computing with the entire data set.
Parametric models, once fitted, are much more efficient in terms of storage and computation.

K-Nearest-Neighbours for Classification (1)
Given a data set with Nk data points from class Ck and , we have
and correspondingly
Since , Bayes’ theorem gives
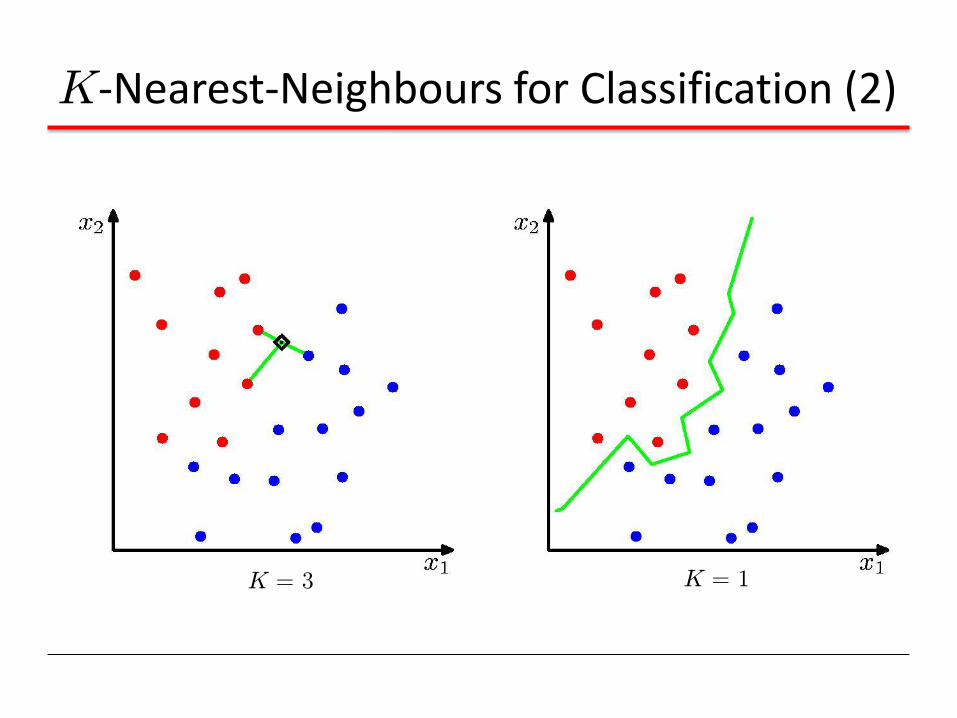
K-Nearest-Neighbours for Classification (2)
K = 1 K = 3

K-Nearest-Neighbours for Classification (3)
• K acts as a smother • For , the error rate of the 1-nearest-neighbour classifier is never more than twice the optimal error (obtained from the true conditional class distributions).