patterns of family formation and change in new zealand · patterns of family formation and change...
TRANSCRIPT

Patterns of Family Formation
and Change in New Zealand
Arunachalam Dharmalingam,
Ian Pool, Janet Sceats and Ross Mackay
Raising Children in New Zealand
ISBN: 0-478-18311-9
Centre for Social Research and Evaluation
Patterns of Family Formation and Change in New Zealand
Arunachalam Dharmalingam, Ian Pool, Janet Sceats and Ross Mackay
Disclaimer
Any opinions expressed in the report are those of the authors.
They do not necessarily represent the views of the Ministry of Social Development.
Patterns of Family Formation in New Zealand
ISBN: 0-478-18311-9
was published by
Centre for Social Research and Evaluation, Ministry of Social Development, Te Manatu Whakahiato Ora
2004
Copies of this report can be obtained from:
Ministry of Social Development, Bowen State Building, PO Box 12 136, Wellington
[email protected], +64 4 916 3300, or it can be viewed on: www.msd.govt.nz
Design and print management by Skulduggery Design Ltd
Acknowledgements
The 1995 New Zealand Women: Family, Education and Employment survey, on which this report is
based, was funded by the Foundation for Research, Science and Technology, the Ministries of Health
and Women’s Affairs, the Social Policy Agency, Te Puni Kokiri, and the Midland Regional Health
Authority. The Population Studies Centre, University of Waikato, also contributed to the funding.
Thanks are due to Sandra Baxendine, Research Fellow Statistician at the Population Studies Centre, for
data extraction and derivation of the life-table estimates and to Bev Campbell for preparing the tables.
Funding for the present study by the Ministry of Social Development is gratefully acknowledged.
Contents Page
About the Authors 4
Foreword 5
Overview 6
Chapter 1: Introduction 7
1a Rationale for the Study 8
1b Objectives of the Study 8
1c Data Source 8
1d Definition of Variables 9
1e Method of Analysis 9
1f Structure of Report 11
Box 1.1 Fixed and Time-Varying Variables 11
Chapter 2: Marriage and Cohabitation 13
2a First Unions 14
2b First Marriage 14
2c Cohabitation 16
2d Duration of Cohabitation 17
2e Shift-share between Cohabitation and Marriage 18
2f Living-Apart-Together Relationships 19
2g Number of Unions 19
2h Summary 19
Chapter 3: Separation from Marriage and Repartnering 29
3a Separation from First Marriage 30
3b Repartnering after Separation 32
3c Summary 33
Chapter 4: Timing of Parenthood and Birth Interval 43
4a First Births 44
4b Non-Marital First Births 45
4c Spacing of Births 46
4d Childbearing Intentions of Childless Women 47
4e Summary 47
Chapter 5: Sole Parenthood 53
5a Sole Parenthood: Experience among Mothers 54
5b Sole Parenthood: Experience among Children 57
5c Summary 59
Chapter 6: Blended Families 71
6a Identifying Blended Families in the NZWFEE Sample 72
6b Definition of Blended Families 72
6c Blended Families: Experience among Mothers 72
6d Blended Families: Experience among Children 73
6e Summary 74
Box 6.1 The Procedure used to Identify Blended Families 75
Chapter 7: Children’s Patterns of Leaving Home 81
7a Leaving Home 82
7b Summary 83
Chapter 8: Summary and Conclusions 86
References 89

Rai
sin
g C
hil
dre
n in
New
Zea
lan
dA
bou
t th
e A
uth
ors
4
About the AuthorsArunachalam Dharmalingam is a Senior Lecturer in Population Studies in the Department of
Sociology and Social Policy, University of Waikato. He has a PhD in Demography from the Australian
National University. Dr Dharmalingam has published papers in journals such as Population Studies,
Demography, International Family Planning Perspectives and Social Science and Medicine. He is
co-editor of the New Zealand Population Review.
Ian Pool is Professor of Demography at the University of Waikato. He has a PhD from the Australian
National University and is an Elected Member of the Academy Council, Royal Society of New
Zealand. He has taught and carried out research in New Zealand, Australia, Africa, Canada, the
United States and the United Kingdom. Professor Pool has authored over 130 books, monographs
and articles in refereed journals. His most recent major New Zealand works are Te Iwi Maori
(Auckland University Press 1991) and New Zealand’s Contraceptive Revolution, Waikato University,
Social Science Monograph Series (Pool et al. 1999). He was appointed to the Panel on Scientific
Capacities, International Council of Science (Paris) in 2004, has been an Honorary Scientific
Consultant, CICRED (Comité International de Coopération dans les Recherches Nationales en
Démographie) since 1999 and was a member of the Scientific Committee on Age Structure and
Policy, International Union for the Scientific Study of Population from 1998 to 2002. Professor Pool
also undertakes numerous speaking engagements to various groups in New Zealand.
Janet Sceats is Managing Director of Portal Consulting and Associates Ltd in Hamilton. She has a
PhD in Medical Demography from the University of London. She has worked for many years in the
health sector in New Zealand and Canada. Dr Sceats is the author of articles and monographs on
aspects of fertility, family and the impact of these on the role of women, as well as on work–life
balance and its impact on low fertility. She was awarded the 1993 Suffrage Medal for services to
Health and Statistics.
Ross Mackay is a Principal Advisor in the Ministry of Social Development, where he has broad
responsibility for oversight of the quality of research and evaluation work and utilisation of the
results of this work to build a sounder knowledge base for the Ministry’s policy advice. He has spent
most of his career working in the Ministry and its predecessor organisations, including 10 years
as Director of Research in the Department of Social Welfare. He has published a range of papers
on various topics, including chapters on the New Zealand experience in a series of three books on
international currents in welfare reform. In recent years, his work has focused on issues concerned
with child development and family functioning.

Forew
ord
5
Raisin
g Ch
ildren
in N
ew Zealan
d
ForewordChange is endemic to family life. Families are forged out of dynamic processes, through the formation of
unions between adults and the birth of children within or outside such unions, and they grow and evolve
through other dynamic processes, as unions are dissolved and reconstituted and as children grow up and
eventually leave home. Moreover, these fundamental processes that shape families have themselves been
undergoing profound change over recent decades in all countries across the developed world. In New Zealand,
there has been a dearth of research that has studied these dynamic processes.
This new report in the Raising Children in New Zealand series was commissioned from the Population
Studies Centre at the University of Waikato to begin to fill this gap. The report draws on data from the 1995
New Zealand Women: Family, Education and Employment survey, which was partially funded by the Social
Policy Agency, a predecessor organisation to the Ministry of Social Development. The report represents a
double change of focus from earlier reports in the series, which had largely involved synthetic reviews of the
international literature. The focus now switches to New Zealand and, rather than relying on secondary sources,
the report provides an empirical analysis of the changing shape of New Zealand families and examines how
these changes have altered the contexts in which children grow up.
The report shows that, in the years since the Second World War, the dynamic processes that shape families
have undergone profound and multifaceted change. Fewer women are marrying than among earlier
generations and those who do marry do so at a later age. In place of marriage, cohabitation has emerged as
a preferred form of first union among younger women. Women are having fewer children and are having them
at a much later time in their reproductive lifespan. Rates of separation from marriage have increased, as have
rates of repartnering. These changes have had significant implications for the shape of families: in particular,
they have fuelled the growth of sole-parent families and blended families. There is also a systematic pattern
of ethnic differences in these changes: Ma-ori women enter into unions and have children at earlier ages than
non-Ma-ori women. These differences have deep historical origins and continue to the present day.
Many of the results presented in the report have implications for public policy. They indicate that we
cannot rely on a single or narrow conceptualisation of the family. Families now encompass a variety of forms.
This raises questions about whether public policies reflect the current reality of New Zealand families. The
report provides a firmer basis for understanding that reality and will help the task of building appropriate
policy frameworks.
Results on the family contexts in which children are reared also raise important policy issues. Many children
now spend at least part of their lives in sole-parent families or blended families, which means that they have
generally experienced one or more (possibly traumatic) family transitions, as their parents separate and
repartner. This raises questions about whether public policies are in place to meet the needs of such families
and to help to ensure the optimal development of their children.
One thing that is clearly evident is that families are continuing to evolve over time. Indeed, many of the most
interesting shifts concern members of the youngest age cohorts. It is clear that these changes should not be
seen as historical shifts that have brought us to a new stable model of the family. Rather, we are in the midst
of ongoing processes of change, some of which will have consequences that are yet to emerge. This indicates
a strong need for continuing research in this field. It is to be hoped that, in addition to throwing light on some
aspects of family changes that have not been well documented to date, the report will also provide a stimulus
for future research.
Anne Jackson
General Manager
Centre for Social Research and Evaluation
OverviewOver the past 50 years, there have been major changes across the developed world in the
fundamental processes that shape families – the formation, dissolution and reconstitution of adult
unions, and the patterns of childbearing that occur within and outside these unions. The report
provides a detailed account of how these changes have occurred in New Zealand, drawing on data
from the 1995 New Zealand Women: Family, Education and Employment survey, which collected
information on the family histories of a large random sample of New Zealand women.
Patterns of union formation have changed significantly. Age at first marriage has been rising and
more women are forgoing marriage entirely. The overwhelming majority of younger women enter
cohabitation as a first union. These trends have counterbalanced each other, with the net result
that there has been little change in the overall proportions of women living in a union. In effect,
cohabitation appears to be replacing marriage as a preferred first union. Most cohabiting unions do
not last long: more than half are either dissolved or converted into a marriage within two years. The
number of unions women enter during their lifetime has also been increasing.
Significant increases have occurred in the dissolution of unions, most notably between the 1960s
and 1970s. While rates of separation continued to grow in the 1980s, there was little further increase
in the 1990s, indicating that they may now have stabilised. Around one woman in three can be
expected to separate within the first 20 years of marriage. The increases in propensity to separate
have also been mirrored by increases in propensity to repartner. Around one woman in three can be
expected to repartner within two years of a separation.
Patterns of childbearing have also undergone significant changes. The age of women at first
birth has been rising, so that decreasing proportions of women have had children by any given
age. However, results on women’s future childbearing intentions suggest that most of those who
postpone childbearing in their 20s are likely to catch up in their 30s. Another notable change has
been a widening of intervals between births. Rates of childbearing outside marriage have also been
rising. Almost all teenage mothers now give birth outside marriage.
The incidence of sole parenthood has grown significantly in recent decades. Nearly half of all
mothers had spent some time as a sole parent before they turned 50; among the youngest age
group, nearly a fifth had already spent some time as a sole parent before they turned 20. For
many women, sole parenting is a transitory state: more than half had ceased to be a sole parent
within five years. Around a quarter of women had spent some time living in a blended family, with
children from a previous union of one or both partners. Children’s experience of blended families
was generally short: for nearly half, the spell had ended within five years. Children in such families,
especially girls, left home at an earlier age than children in other family circumstances.
An important aspect of the findings is a pattern of distinct differences between Ma-ori and
non-Ma-ori. While Ma-ori women are equally as likely to form a partnership and to have children as
non-Ma-ori women, Ma-ori women tend to experience these events at an earlier age than non-Ma-ori
women. In particular, Ma-ori women have a significantly elevated likelihood of entering a union and
giving birth before the age of 20, compared with their non-Ma-ori peers.
Overall, the results show that changes affecting families have been significant and profound, and
encompass all aspects of fundamental family dynamics. Moreover, the changes continue, with some
of the most significant shifts involving members of the youngest cohorts. This indicates a need for
continuing research both to document changes and to understand their implications.
Rai
sin
g C
hil
dre
n in
New
Zea
lan
dO
verv
iew
6
1
Introduction

8
Rai
sin
g C
hil
dre
n in
New
Zea
lan
dIn
tro
du
ctio
n
1a Rationale for the StudyThe primary purpose of this report is to provide a
better understanding of patterns of family formation,
dissolution and reconstitution in New Zealand and how
these patterns have changed in recent decades. It is
also motivated by a desire to understand how these
changes have affected the family contexts in which
children grow up. Thus, in addition to providing a
picture of broad shifts over time in dynamic processes of
family formation and change, the report focuses on the
proportions of children who spend part of their lives in
sole-parent and reconstituted or “blended” families, the
duration of time children spend in sole-parent families
and patterns of leaving home among children in different
family circumstances.
An empirical analysis of family formation, dissolution
and reconstitution in New Zealand at the individual level
is long overdue. The absence of such an analysis until
recently has been due to the lack of good survey data in
New Zealand on various aspects of family formation. This
gap was almost unique among OECD countries. But with
the availability of data from the New Zealand Women:
Family, Education and Employment (NZWFEE) survey,
it has become possible to analyse changes in family
formation, dissolution and reconstitution through the
lens of women’s individual histories.
1b Objectives of the StudyThe broad objective of the study was to document and
describe the dynamic processes of family formation,
dissolution and reconstitution as experienced by a
sample of New Zealand women born during the period
1936–1975 and covering the period 1950–1995.
More specifically, we investigated:
• the patterns and correlates of marriage and cohabitation
• the patterns and correlates of marriage dissolution
and repartnering
• the patterns and correlates of parenthood,
non-marital births and birth intervals
• the incidence and duration of sole parenthood and
their correlates
• the prevalence of reconstituted families and the
duration of time children spend living in such
families and
• patterns of leaving home among children in different
family circumstances.
1c Data SourceWe used the data set that was already available from
the NZWFEE survey, which had been undertaken in 1995
by the Population Studies Centre, University of Waikato.
This was the first comprehensive and nationwide
retrospective survey of women to be undertaken in New
Zealand with the aim of investigating dynamic processes
of family formation and change.
The sample
The survey involved interviews with 3,017 women aged
20–59 in 1995 and collected retrospective information
on their partnerships, use of contraception, pregnancies,
births, education and work histories, among other things.
The respondents were selected using a multi-stage
proportionally stratified cluster sampling procedure.
ince the 1940s, patterns of family formation, dissolution and reconstitution have undergone major
changes in New Zealand, as they have in the rest of the developed world. While the proportion of
women marrying has declined, cohabitation, divorce and remarriage have all increased. Over 90
percent of first marriages, for recent birth cohorts, are preceded by one or more periods of cohabitation.
Compared with the 1950s and 1960s, relatively fewer women marry; they also marry later, have fewer
children and have them at a much later time in their reproductive span. As a mechanism facilitating all
these changes, contraception has played an important role. These changes affect all subsequent aspects
of women’s family life cycles. For Ma-ori women, an equally important pattern for the entire family life cycle
is the propensity for early union formation (and dissolution) and early childbearing. Both Ma-ori and
non-Ma-ori women today are more likely to get divorced and remarried than was true for their mothers’
generation, and children today are more likely to have stepsiblings as they grow up.
S

Intro
du
ction
9
Raisin
g Ch
ildren
in N
ew Zealan
d
Ma-ori were oversampled, using the same multi-stage
cluster sampling procedure, to give sufficient numbers
of observations for meaningful analysis. The overall
response rate was 67 percent. Comparison of selected
sample characteristics with 1991 census data showed a
high degree of representativeness. A detailed analysis
of both sampling and non-sampling errors showed that,
on most issues, the data are robust (for details, see
Marsault et al. 1997). As the survey did not collect data
on same-sex couple relationships, the results presented
in this study are based only on unions involving partners
of the opposite sex.
Missing data
An important issue in the analysis of survey data is how to
deal with cases that have missing or not-specified values
for one or more variables. In the NZWFEE survey, the overall
amount of missing information in the entire survey was
small. For the large majority of variables, the proportion
of missing data was less than one percent. In the process
of cleaning the data, we imputed missing values for
many cases based on the values of other variables. The
imputation of missing values helped to further reduce
the volume of missing values. In each of the analyses
presented here, we dropped those cases for which we
could not impute missing values of variables that were
pertinent to the analysis in question. For example, if a
case had a missing value on one variable that was used in
the analysis of sole parenthood, it was dropped from this
analysis; however, the case was included in other analyses
if full data were available in these other areas.
Weighting
The data used in the analyses were weighted to make
sure that the sample reflected the composition of the total
population. Weights were developed to adjust for over- or
under-representation of subgroups within the sample
according to a number of characteristics: age; ethnicity;
region; education; occupation; and marital status. Data
from the 1996 census for women aged 20–59 cross-
classified by age, ethnicity, region, education, occupation
and marital status were used to compute the weights.
While all statistics presented in the report are based on
weighted data, the total Ns reported in tables are based on
the unweighted sample numbers.
1d Definition of VariablesIn most of the analyses presented in the report, the
dependent variables are either age at the time of a
particular event (such as marriage, separation from a
union or the birth of a child) or duration in a particular
status (such as marriage or sole parenthood). Variation
in the dependent variables is analysed in terms of
variation in a set of independent or explanatory
variables. We refer to these variables, interchangeably,
as covariates, correlates, factors or determinants. The
selection of independent variables was based on both
their theoretical and empirical importance as borne out
by the international literature and their availability in the
NZWFEE data set.
For analytical purposes, we classified the independent
variables into fixed or time-varying variables. Fixed
variables take values that remain constant for the
period under observation. A person’s ethnicity and
gender are examples of fixed variables. Such variables
take the same value at different times. But a variable
like occupation or age can change over time – either
regularly (in the case of age) or irregularly (in the case
of occupation). We allowed those variables that are
time-varying to take a different value every year. Thus,
for instance, a woman’s occupation was represented by
a variable that recorded her occupation at each year of
her age.
Time-varying variables are used only in multivariate
analyses, while the fixed variables are used in both
bivariate and multivariate analyses (see section 1e
Method of Analysis).
A list of the fixed and time-varying variables used in
the analyses is contained in Box 1.1 at the end of
this chapter.
1e Method of Analysis
Censoring
All aspects of family formation that we examined in
this study are time- or duration-dependent and are
also censored. Duration in single conjugal status,
for instance, is a primary determinant of timing of
union formation, whether the union is cohabitation or
marriage. A second issue in family formation analysis
10
Rai
sin
g C
hil
dre
n in
New
Zea
lan
dIn
tro
du
ctio
n
is the censored nature of the experience of individual
women as this is reflected in the data set. At the time of
the survey, some women had not had a full opportunity
to experience the event under consideration. For
instance, a woman aged 20 and single at the time of
the survey in 1995 may or may not form a union in the
future, but we are in no position to predict whether or
not this will occur. Censoring occurs when we have some
information about individual survival time in a particular
status (eg single, married, childless), but we do not
know how much time is yet to elapse before the next
status is achieved (eg entering a union, becoming a sole
parent, having a first birth) (Allison 1984). The reason
censoring occurs in our study is that the woman may
not yet have experienced the event under consideration
before the time of the survey. The statistical method
that is commonly used to take into account the
censored nature of such data is survival analysis based
on life-table techniques.
Bivariate analysis
Each chapter begins with bivariate life-table analyses of
selected key events in the process of family formation,
dissolution and reconstitution (eg marriage, entry into
cohabitation, first birth, separation, repartnering).
The dependent variables in these analyses are either
cumulative proportions or rates, typically of women
who had achieved a certain status by varying ages. In
the case of marriage, for instance, we report both the
cumulative proportion who had married by a given age
and age-specific rates of marriage. At the bivariate level,
we derive life-table measures for each subgroup of
three independent variables: birth cohort; ethnicity; and
education. For example, in the case of the independent
variable “birth cohort”, we derive life-table measures
relating to various events for each five- or 10-year cohort.
We have not provided standard errors and confidence
intervals for the life-table measures for practical
reasons. The life-table procedure contained in the
statistical package we used (STATA; StataCorp
2001) generates confidence intervals for each of the
cumulative proportions and age-specific rates we have
presented, but we have not reported these as this would
have made the tables very clumsy. In interpreting the
bivariate results, however, we have generally highlighted
only those results that are statistically significant.
Wherever possible, we have also interpreted the
bivariate results in conjunction with the results of the
multivariate analysis.
Multivariate analysis
As the analysis becomes more complex when dealing
with more than three variables at a time, we also
employed multivariate statistical modelling. This
provides a measure of the strength of the effect of
each independent variable on the dependent variable,
with the influence of other variables held constant.
Some associations that appear at the bivariate level
vanish in the multivariate analysis, because they arise
entirely out of correlations with other variables and
have no independent effect on the dependent variable.
The multivariate analysis thus provides a deeper
understanding of the main sources of variation in the
dependent variable.
We included several independent variables in the
multivariate analysis that could not be used in the
bivariate life-table analyses, because they change
in value over the observation period. These include:
occupation; age; calendar period; age of youngest co-
residing child; and number of co-residing children. For
instance, a woman’s occupation might change over her
life course, while she may also experience changes in
her union status, in her parenthood status and in the
number of children she has given birth to. Her age also
naturally varies with time. The appropriate multivariate
statistical technique that can be applied to this type
of data is discrete-time hazards modelling (Allison
1984; Aitkin et al. 1989). Discrete-time hazards models
combine life-table and regression methods.
The estimated effects of independent variables in the
multivariate hazards models are presented as incidence
rate ratios (IRRs). IRRs are ratios of two incidence rates.
They are computed as follows: one value of the
independent variable is selected as the reference
category; for any other value of the independent
variable, the IRR is given by the incidence rate for that
value expressed as a ratio of the incidence rate for the
reference category.
Let us take as an example the likelihood of living with
a sole mother and consider how this likelihood might
be affected by an independent variable, say, the gender
of the child. The variable gender has two values: male
and female. If we designate “female” as the reference
category, then the estimated effect of gender is the ratio
of the incidence rate of living with a sole mother among
male children over the incidence rate of living with a
sole mother among female children. An IRR that is equal

Intro
du
ction
11
Raisin
g Ch
ildren
in N
ew Zealan
d
to 1 means that there is no difference in the likelihood
of living with a sole mother between male children and
female children. If the IRR is greater than 1, then male
children are more likely than female children to live with
a sole mother. Similarly, if the IRR is less than 1, then
male children are less likely to live with a sole mother
than female children.
1f Structure of the ReportThis introductory chapter is followed by six chapters
that present the substantive results of the study and
a chapter that provides a summary and conclusion.
In Chapter 2, we examine patterns and changes in
first marriage and cohabitation. In Chapter 3, we
investigate patterns of separation from first marriage
and repartnering. This is followed by an examination of
timing of parenthood, birth intervals and non-marital
births in Chapter 4. In Chapter 5, we analyse sole
parenthood from the perspective of both the mothers
and the children. Chapter 6 provides a limited analysis
of some aspects of reconstituted or blended families.
Chapter 7 examines the ages at which children in
different family circumstances leave home. In Chapter 8,
we provide a summary of the major findings and some
concluding remarks.
Fixed and Time-Varying Variables
Fixed variables
Ethnicity
This refers to the ethnicity of the woman as reported
by her at the time of the NZWFEE survey. If a woman
reported multiple ethnicities, then we followed the
Statistics New Zealand prioritisation procedure in
assigning a single ethnicity.1 Ethnicity is used as a
dichotomous categorical variable (Ma-ori and
non-Ma-ori) in almost all analyses. We could not treat
Pacific women separately in most of the analyses,
as there were insufficient cases to allow meaningful
statistical analysis. However, in the analyses of children
living with sole parents in Chapter 5 and of children
leaving home in Chapter 7, we used a three-way
breakdown – Ma-ori, Pacific and Other – as the number
of children was large enough to permit analysis of
Pacific children separately. It is important to note that
the “Other” category in this analysis includes both the
European/Pa-keha- group and those of ethnicities other
than Ma-ori, Pacific or European/Pa-keha-.
It is also important to note that the ethnicity of both
the mother and her children was recorded at the time of
NZWFEE survey. However, people sometimes change the
way they describe their ethnicity, which leads to mobility
between ethnic groups. Ethnic mobility is known to peak
during transitions in living arrangements.
Educational qualification
This refers to the highest educational qualification
the woman had completed at the time of the survey. It
takes four values: no qualification obtained, secondary
qualification, tertiary – other qualification and university
qualification. It may be noted that, in some cases,
women with tertiary – other qualifications may not have
a high school qualification; these types of qualifications
may therefore be closer to a secondary qualification than
to a university degree. University qualification includes
both bachelors and post-graduate degrees.
1 This procedure operated as follows: if NZ Ma-ori was one of the ethnic groups reported, then ethnicity was classified as Ma-ori; otherwise, if any Pacific group was one of the ethnic groups reported, then ethnicity was classified as Pacific; otherwise, if any group other than a European/Pa-keha- group was one of the ethnic groups reported, then ethnicity was classified as Other; otherwise, ethnicity was classified as European/Pa-keha- (Department of Statistics 1993).
Box 1.1

12
Rai
sin
g C
hil
dre
n in
New
Zea
lan
dIn
tro
du
ctio
n
Birth cohort of women
This refers to the calendar year in which the woman was
born. It has been reclassified into four categories: 1936–
1949; 1950–1959; 1960–1969; and 1970–1975.
Year of marriage
This refers to the calendar year in which the woman was
married. It has been reclassified into a small number of
categories.
Year of entering first cohabitation
This refers to the calendar year in which the woman
entered her first cohabitation. It has been reclassified
into a small number of categories.
Age at marriage
This refers to the age at which the woman married for
the first time. It has been reclassified into five- or 10-
year age groups.
Age at first cohabitation
This refers to the age at which the woman entered her
first cohabitation. It has been reclassified into a small
number of age groups.
Gender of child
This refers to the child’s gender: female or male.
Ethnicity of child
In the NZWFEE survey, the respondents were asked
to report the ethnicity of each of their own children
(but not that of any adopted or foster children). Thus,
the ethnicity of children was reported directly and not
derived indirectly from their mothers’ ethnicity. This
variable takes three values: Ma-ori, Pacific and Other. If
a woman reported multiple ethnicities for a child, then
we followed the Statistics New Zealand prioritisation
procedure in assigning a single ethnicity to the child.
Birth cohort of child
This refers to the calendar year in which the child was
born. It has been reclassified into four categories: before
1970; 1970–1979; 1980–1989; and 1990–1995. It is used
only in Chapters 5, 6 and 7.
Number of live births the mother had
This refers to the number of live births the woman had
had up to the time of the survey. It has been reclassified
into a small number of categories.
Time-varying variables
Age of woman or child
This refers to the woman’s age when an event occurred.
It has been reclassified into five- or 10-year age groups.
Calendar period
This refers to the calendar year in which an event
occurred. It has generally been reclassified into 10-year
periods.
Occupation
This variable refers to the woman’s occupation at any
given age or event. It takes four values: professional;
semi-professional; non-professional; and not working.
It was measured for every year of the woman’s age. A
woman was considered to be not working if she did not
work for at least six months in a year.
Number of years worked by any age
This refers to the number of years the woman had
worked by any given age or event. It has been
reclassified into four values: not worked; worked for less
than two years; worked for more than two years but less
than five years; and worked for more than five years.
Number of co-residing children
This refers to the number of co-residing children the
woman had at any given age or event. It has been
reclassified into three categories: one child; two
children; and three or more children. We included
all children, irrespective of their age, in deriving this
variable. We did not make any distinction between
“dependent” and “independent” children (eg those aged
over 16 years) in deriving this variable.
Age of the youngest co-residing child
This refers to the age of the youngest co-residing child
the woman had at any given age or event. It has been
reclassified into a small number of categories.
Marriage and Cohabitation
2

Mar
riag
e an
d C
oh
abit
atio
n
14
Rai
sin
g C
hil
dre
n in
New
Zea
lan
d
n this chapter, we present results on the first stage in the family life cycle: union formation.
The chapter opens with an examination of the first unions of New Zealand women (including
both marriage and cohabitation). This is followed by separate analyses of first marriage and
cohabitation as a first union. Some results on the duration of time women spend in cohabitation are
also presented, including an examination of whether this varies for second-order cohabitations. Then
we discuss how delayed first marriage has been counterbalanced by an increased propensity to cohabit
among more recent cohorts. The chapter concludes with a discussion of an emerging form of union
among younger cohorts (“living-apart-together”) and a brief analysis of trends in the number of unions
women have entered during their lifetime.
2a First UnionsLife-table estimates of the cumulative proportion of
women who had entered a first union of any type
(marriage or cohabitation) before a given age are given
in Table 2.1. Before reaching 30 years of age, over 90
percent of New Zealand women had entered their first
union. This remained more or less unchanged across the
two cohorts of women who had reached the age of 30 by
the time of the survey (those born before 1950 and those
born in the 1950s). However, there appears to have been
a significant change in the probability of entering a first
union before 20 years of age between the pre- and post-
1950 cohorts. Whereas only a quarter of women born
before 1950 had entered their first union before 20 years
of age, around 40 percent of those born after 1950 had
entered a first union before they turned 20.
Ethnic differentials are evident in the teen years, but not
once women are past their teens. Over half of
Ma-ori women were living in some form of union before
reaching 20 years of age, compared with a third of non-
Ma-ori women. However, in age groups beyond age 20,
there was no difference between Ma-ori and non-Ma-ori
women in the proportion who had entered a first union.
There were also some differences by education in the
proportion of women entering first unions. A noticeable
difference existed between those with a university
degree and those with lower educational qualifications
or no qualifications at all. Moreover, the difference was
greater at younger ages than at older ages. While only
14 percent of women with a university qualification had
entered their first union before 20 years of age, the
corresponding proportion was around a third among
those with secondary or other tertiary qualifications, and
nearly half among those with no qualifications. By 30
years of age, however, the educational differential
had narrowed. There was only a 10 percentage point
difference between university-qualified women and
those with no qualifications in the proportion who had
entered their first union before the age of 30.
In the following two sections, we explore changes
in the type of first union that women enter: marriage
or cohabitation.
2b First Marriage
Bivariate results
In Table 2.2, we show the cumulative proportion of
women who had entered a first marriage before a given
age, again classified by birth cohort, ethnicity and
educational qualifications. It is clear from this table that
there are substantial differences between younger and
older birth cohorts. Women of recent birth cohorts have
been less likely to enter into a first marriage before any
given age. Among those born during the 1960s, only
49 percent had entered a first marriage before age 25,
compared with 71 percent among those born in the
1950s. The change is even more noticeable at younger
ages: only four percent of those born in the early 1970s
had married before 20 years of age, compared with 11
percent and 25 percent of those born in the 1960s and
1950s respectively.
Table 2.3 gives the proportion of women marrying at
different ages, given that they had not married until
then. These proportions could also be interpreted as
probabilities of entering a first marriage in each age band.
Consistent with the results in Table 2.2, Table 2.3
shows that the likelihood of marriage has declined
between older and younger birth cohorts. Those born
I

Marriag
e and
Coh
abitation
15
Raisin
g Ch
ildren
in N
ew Zealan
d
before 1950 who remained unmarried at age 20 had a
71 percent chance of marriage between the ages of 20
and 24, while the corresponding figure for those born
during the 1960s was 43 percent. The probability of
marriage remained relatively high (around 50 percent)
among women aged 25–29 across the two birth cohorts
for which data are available and declined to around 30
percent in the 30–34 year age group.
Across the table, there is a clear pattern of reducing
probability of marriage for successive cohorts of
women, as far as data are available on this. However,
because of the nature of the data, some questions
remain unanswered. In particular, it is not possible
to determine whether the significantly reduced
probabilities of marriage at younger ages for the most
recent cohorts simply reflect postponement of entry into
marriage or whether they prefigure a shift away from
marriage altogether.
With the exception of those under 20 years of age,
Ma-ori women had a lower probability of marriage at
all ages (Table 2.3). Consequently, while 76 percent
of non-Ma-ori women had married by 30 years of age,
the corresponding percentage for Ma-ori women was
61 percent (Table 2.2). Although no data on this are
presented in the table, the ethnic differential persisted
across all birth cohorts.
Although higher education was associated with an
overall reduction in the probability of marriage, there
was some variation on this pattern by age. While women
with a tertiary qualification (particularly a university
degree) were less likely than those with no qualifications
to marry before the age of 25, the relationship reversed
once they reached 25 (Table 2.3). University-qualified
women were especially unlikely to marry before the
age of 20: only three percent had done so compared
with a quarter of those without any qualifications.
These differentials in the propensity to enter a first
marriage are reflected in the cumulative proportion
married before a given age. While 67 percent of women
with no qualifications had married before age 25, the
figure was just 39 percent for those with a university
qualification. By age 30, the educational differential had
narrowed, although it had not entirely disappeared even
by age 35 (Table 2.2).
Multivariate results
In Table 2.4, we present the results from the multivariate
analysis. The results in the table confirm what has been
described above based on the bivariate results. Of the
three time-related variables included in the multivariate
model (birth cohort, calendar period and age), birth
cohort and age were found to be associated with the
likelihood of a first marriage. In general, women of more
recent birth cohorts were much less likely to marry than
women born in earlier decades. For instance, women
born during the 1960s were only about half as likely as
those born before 1950 to have married, while women
born in the 1970s were only a fifth as likely to have
married. The propensity to marry peaked in the early 20s
and then declined. For instance, a woman’s chances of
marrying in her early 30s were less than half her chances
of marrying in her early 20s.
Non-Ma-ori women were in general about 50 percent
more likely to marry than their Ma-ori counterparts.
University-level education was associated with a
reduced likelihood of marriage. Women with a university
qualification were about 30 percent less likely to marry
than those with no qualifications. Although women with
no educational qualifications were more likely to marry
than others, this differential was not substantial enough
to offset the much lower likelihood of marriage among
Ma-ori women. Thus, the net outcome for Ma-ori women
was that they were more likely to remain unmarried than
non-Ma-ori women.
Participation in the labour force increased women’s
chances of marriage. Those working were between 52
and 66 percent more likely to marry than those not
working. Interestingly, there was not much difference in
the likelihood of marriage by type of occupation, as this
rather narrow range of probabilities shows.
We also included in the analysis three variables that
are related to processes of family formation: duration
of prior cohabitation at any age; whether a woman was
pregnant at any age; and whether she had given birth by
any age. Duration of cohabitation was derived from all
past cohabiting unions, as well as the current union, if
the woman was cohabiting at the given age. The chances
of marriage were highest when a woman had cohabited
for a short period only – up to six months. If a woman
had cohabited for more than six months, or if she had
not cohabited at all, then her likelihood of marriage was

Mar
riag
e an
d C
oh
abit
atio
n
16
Rai
sin
g C
hil
dre
n in
New
Zea
lan
d
substantially reduced. For example, if a woman had not
cohabited in the past and was not currently cohabiting,
then her chances of marriage were only 46 percent of
those of women who had cohabited for six months. The
probability of marriage was even lower among women
who had cohabited for long periods: women who had
cohabited for more than five years were only a third
as likely to marry as women who had cohabited for
six months or less.
It is also interesting to note that, while pregnancy
enhanced the chance of a subsequent marriage, having
a birth outside marriage had little effect on the chances
of marriage. Being pregnant at any age increased the
propensity to marry at that age by six-and-a-half times,
compared with those who were not pregnant. But there
was no difference in the likelihood of marriage between
those who had already given birth and those who
had not.
2c Cohabitation as a First Union
Bivariate results
The postponement and decline of marriage has
coincided with a parallel rise and spread of cohabitation.
The following analyses of patterns of cohabitation
are based on women who had not yet married. Thus,
they have a slightly different interpretation from the
preceding results on first marriage, which covered all
women in the sample. Here the proportions are based on
a diminishing pool of women as age increases (ie those
who remained unmarried at that age).
Among those born during the 1950s who remained
unmarried, 71 percent had entered cohabitation as their
first union before they reached 30 years of age (see
Table 2.5). The corresponding figure for those born
before 1950 was only 29 percent. While only 22 percent
among the 1950s birth cohort who remained unmarried
were in a cohabiting union by 20 years of age, the
proportion had increased considerably to 38 percent
among the most recent birth cohort of 1970–1975. For
cohorts born prior to 1950, cohabitation before the age
of 20 had been very rare (only four percent of those who
remained unmarried).
Age-specific proportions of women entering cohabitation
as a first union by birth cohort, ethnicity and education
are given in Table 2.6. It is clear that the younger
the birth cohort, the greater the chances of entering
cohabitation as a first union, at any given age. Increasing
numbers of women are moving into cohabitation as
a first union in their late teens and early 20s. Among
the most recent cohorts for which data are available,
over a third of women aged less than 20 who remained
unmarried had entered cohabitation as a first union,
while half of women in their early 20s who remained
unmarried had entered cohabitation as a first union.
Ma-ori women were, in general, more likely to enter
cohabitation as their first union than non-Ma-ori women,
except at ages 25–29. Indeed, the difference is relatively
large at younger ages: before age 20, Ma-ori women
were twice as likely as non-Ma-ori women to cohabit.
However, the higher proportion of Ma-ori women who
were cohabiting did not seem to translate into a higher
proportion who subsequently married (as documented in
section 2b First Marriage). This could partly be because,
once six months’ duration of cohabitation has passed,
the likelihood of marriage declines (see Table 2.4).
Women’s level of educational qualifications also had
a strong influence on the likelihood of cohabitation.
Among those with no qualifications who remained
unmarried, 30 percent had entered a cohabiting union
before reaching the age of 20, compared with 11 percent
of those with university qualifications (Table 2.5). The
difference reduced, although it did not vanish entirely, as
age increased. Up to the age of 35, university-qualified
women remained less likely than other women to have
entered cohabitation as a first union. These results
parallel those for marriage and show that university-
qualified women were least likely either to marry or to
enter cohabitation right up to their mid-30s.
The results on age-specific rates of entry into
cohabitation as a first union show a more complex
pattern across the different educational qualification
groups (Table 2.6). For the three groups of women with
different types of qualifications, a similar pattern was
evident: low rates of entry into cohabitation below
age 20 and after turning 30, and higher rates during
their 20s. University-qualified women exemplified this
trend to the strongest degree: among this group, only
11 percent of those who remained unmarried entered
cohabitation as a first union before age 20 and after
turning 30, while 38 percent entered cohabitation
as a first union in their early 20s. Women with no
qualifications stood apart from this typical pattern.
Marriag
e and
Coh
abitation
17
Raisin
g Ch
ildren
in N
ew Zealan
d
This group of women showed little change in the
probability of entering cohabitation across the four age
bands and they were actually a little less likely to enter
cohabitation during their 20s than before age 20 or
after age 30.
Multivariate results
Results from the multivariate analysis of the propensity
to enter cohabitation as a first union are given in
Table 2.7. They confirm what has been described so
far: that women born after 1950, Ma-ori women and
women without qualifications were more likely to enter
cohabitation as their first union.
Those born after 1950 were about twice as likely to
enter cohabitation as a first union as those born before
1950. As well as a cohort effect, a period effect was also
evident. Compared with the 1960s, women have been
more than four times as likely to enter cohabitation as a
first union in the years since 1980. By contrast, women
were only a quarter as likely to enter cohabitation as a
first union before 1960 as they were during the 1960s.
Thus, the propensity to enter cohabitation as a first
union has increased several-fold both among younger
birth cohorts and in more recent calendar periods.
An age effect was also evident: women’s propensity to
enter cohabitation as a first union peaked in their early
20s and then declined substantially after age 30. Women
who remained unmarried in their early 30s were only
just over half as likely to enter cohabitation as a first
union as those aged less than 20.
Non-Ma-ori women were 33 percent less likely to enter
cohabitation as their first union than Ma-ori women.
Women with some form of educational qualification
were between 20 and 30 percent less likely to enter
cohabitation as a first union than those with no
qualifications at all, university-qualified women being
least likely to do so. Type of occupation was not related
to the propensity to cohabit. However, length of work
experience was positively associated with the propensity
to enter cohabitation as a first union. Those with at least
one year of work experience were three to four times
more likely to enter cohabitation as a first union than
those who had had no work experience.
2d Duration of CohabitationGiven the rise in the propensity to cohabit as a first
union, it is of interest to explore the duration of time
women spend in cohabiting unions. There were 1,389
women whose first union was cohabitation. At the
time of the survey in 1995, only 11 percent of these
cohabitations were still intact; almost half (48 percent)
had been converted into a marriage and the rest (41
percent) had been dissolved. In Table 2.8, we present
life-table estimates of the cumulative proportion of
first cohabitations that had been either dissolved or
converted into a marriage within varying durations
of time. The table shows that about 30 percent of
cohabiting unions had either been dissolved or
converted into a marriage within the first year, and
more than half had been dissolved or converted into a
marriage within two years. Within five years, the vast
majority of first cohabiting unions (86 percent) had
ended in one way or the other.
As these figures are much higher than rates of
separation from first marriages (see Table 3.1), it is
tempting to speculate that cohabiting unions are
less stable than marriages. However, it should be
remembered that the figures in Table 2.8 include
cohabitations that ended because the couple married.
The results indicate clearly that cohabiting unions are
less enduring than marriages, but it is less easy to draw
inferences about the stability of such unions compared
with marriages. Other evidence, however, shows
that cohabiting unions are more likely to lead to sole
parenthood (see Chapter 5), which lends support to the
hypothesis that they are less stable than marriages.
Table 2.8 shows that there were differentials in the
duration of cohabitation by birth cohort and by age at
cohabitation. In general, the cohabiting relationships
of younger birth cohorts were less likely than those
of older cohorts either to dissolve or to be converted
into marriage. For instance, among women born in the
period 1970–1975, 22 percent of cohabiting relationships
had either been dissolved or converted into a marriage
within the first year, compared with 37 percent among
women born before 1950. Similarly, among women born
in the 1960s, 51 percent of cohabiting relationships
had either been dissolved or converted into a marriage
within two years, compared with 69 percent among

Mar
riag
e an
d C
oh
abit
atio
n
18
Rai
sin
g C
hil
dre
n in
New
Zea
lan
d
those born before 1950. On the face of it, these results
would seem to indicate that cohabiting relationships
may be becoming more enduring.
Age at cohabitation was also associated with the duration
of the relationship. In particular, the cohabitation
relationships of younger women were less likely to end
quickly. While nearly two-thirds of first cohabitations (64
percent) ended within two years among women who had
entered the union after they turned 25, the corresponding
figure among women who had entered the union before
the age of 18 was 45 percent. Although there were some
ethnic and educational differences, they were neither
large nor clear.
To examine whether the average duration of cohabiting
unions varied between the first cohabitation and
subsequent cohabitations, we derived life-table
estimates of the cumulative proportions of second-order
cohabiting unions that had ended by various ages. Three
groups of women were included in this analysis: those
who were in a second cohabitation that was a second
union (ie cohabitation–cohabitation); those who were
in a second cohabitation that was a third union (ie
cohabitation–marriage–cohabitation); and those who
were in a first cohabitation that was a second union (ie
marriage–cohabitation). In the last group, the union
was in fact their first cohabitation, but because of their
similarity with the second group of women in terms
of their prior marital union experience, we decided to
include them as part of the group of “second-order
cohabitants”. Thus, we derived life-table estimates
separately for those second-order cohabitations that had
been immediately preceded by a first cohabitation and
those that had been immediately preceded by a marital
union (which might in turn have been preceded by an
earlier cohabitation). The results are given in Table 2.9.
It is interesting that the pattern of duration of second-
order cohabitations was different depending on whether
the cohabitation had been preceded immediately
by a marital union or by a prior cohabitation. Where
a cohabitation had been preceded by an earlier
cohabitation, the pattern of dissolution was very similar
to the pattern for first cohabitations, as can be seen
from the second row of Table 2.9. However, where a
cohabitation had been preceded by a marital union,
then the union was less likely to end within a given
duration. For instance, only 37 percent of cohabitations
that had been preceded by a marital union had ended
within two years, compared with 57 percent of those that
had been preceded by an earlier cohabitation. These
results suggest that cohabiting unions that follow the
termination of a marriage are more enduring than other
cohabiting relationships.
As there were insufficient cases to derive life-table
estimates for Ma-ori, for some birth cohorts and for the
various educational groups, we did not examine the
differentials across the various subgroups within each
of these variables as we did above for the duration of
first cohabitations. The sparse data that were available,
however, suggested that there were no major socio-
demographic differentials in terms of the duration of
second-order cohabitations.
2e Shift-share between Cohabitation and Marriage
The above results show that trends and patterns in
cohabitation and marriage are moving in opposite
directions. While cohabitation has become the preferred
first union for most women of the youngest birth cohort,
marriage has increasingly been postponed to later ages
and even forgone by a significant minority. Table 2.10
shows the scale of this shift. Among those born before
1950 who had entered a first union before the age of
20, the overwhelming majority had married rather than
cohabited. Indeed, among this birth cohort, 22 percent
of all women had married by the age of 20, compared
with only four percent who had entered cohabitation,
a ratio of more than five to one. In contrast, among
those born in the early 1970s who had entered a first
union before the age of 20, an even larger majority had
entered cohabitation rather than marriage. Among this
cohort, 38 percent had entered cohabitation as a first
union, while only two percent had married, a ratio of
nearly 20 to one.
The increase in cohabitation and decline of marriage
have more or less counterbalanced each other, with the
net effect that the proportion of women living in a union
of any type (whether cohabitation or marriage) has
remained very similar at any given age for the various
birth cohorts and time periods (see Table 2.1 and Table
2.10). For instance, among the two birth cohorts for
which data are available, very similar proportions of
women had entered a first union before 30 years of age

Marriag
e and
Coh
abitation
19
Raisin
g Ch
ildren
in N
ew Zealan
d
(92 percent and 94 percent) and before 35 years of age
(95 percent and 96 percent). This shift-share between
cohabitation and marriage may indicate that one form of
conjugal union is gradually replacing another.
2f Living-Apart-Together Relationships
A separate, but related, emerging development is the
tendency for couples to live separately, often with their
parents, but at the same time to pursue an intimate
relationship. Such relationships have been referred to by
other researchers as living-apart-together relationships
(Villeneuve-Gokalp 1990; Pool 1998; Burch and Belanger
1999). This phenomenon seems to be predominant
among young people in their early 20s, as can be seen
in Table 2.11. Respondents to the NZWFEE survey were
asked “Are you currently having an intimate relationship
with someone who lives in a separate household?”. This
question was preceded by one that sought to identify
current cohabitation: “Are you currently living in the
same household with someone with whom you have an
intimate relationship but to whom you are not married?”
(emphases in both questions in the original). Thus,
the survey contextually defined living-apart-together
relationships as very much like cohabiting relationships,
except that the parties did not live in the same
household. In the analysis of cohabitation presented
above, these living-apart-together relationships were not
included. For all analytical purposes in this report, only
marriage and cohabitation were considered as unions.
The distribution of women’s union status at the time of
the survey in 1995 is given in Table 2.11. In the 20–24
age group, 20 percent of women were in a living-
apart-together relationship, compared with 27 percent
who were cohabiting. This percentage increases to 32
percent if it is based only on women who were living in
a relationship of any form: that is to say, about a third
of women in their early 20s who were in a relationship
were in a living-apart-together relationship. Similar
patterns of living-apart-together relationships are also
recorded for Sweden, France and Australia, among other
countries. This constitutes a major shift in patterns of
union formation at the younger ages (Villeneuve-Gokalp
1997 documents this for France; see also Villeneuve-
Gokalp 1990 and Burch and Bélanger 1999).
2g Number of UnionsAlongside the emergence of cohabitation as the
preferred first union, there has also been an increase in
the number of unions entered during a lifetime. This
may be linked to the nature of cohabitational
relationships, which are less enduring than marriages,
although cohabitation itself is likely to be undergoing
major changes. As can be seen in Table 2.11, 22 percent
of women aged 25–29 at the time of the survey had lived
in two or more unions before they reached 25 years of
age. This group corresponds approximately to those
born in the period 1965–1969. The corresponding figure
for those born 10 years earlier was only 14 percent.
Seven percent of women aged 25–29 at the time of the
survey had lived in two or more unions by the age of 20.
This had grown from one percent among those born 10
years earlier.
2h SummaryThe various results presented above show that major
changes have been occurring in patterns of union
formation in New Zealand. While women who were
mothers during the baby boom of the 1950s and 1960s
generally entered marriage as their first union, an
overwhelming proportion of women born during and
since the baby boom have entered cohabitation as their
first union. The propensity for women to delay marriage
continued to increase among the most recent birth
cohorts. A question which must remain unanswered
for the present is whether this simply reflects a further
postponement of entry into marriage or whether it
prefigures a shift away from marriage altogether.
Even among women who did marry, the vast majority
of those who were born after 1960 had lived in a
cohabitation relationship before they married. These
unions did not generally last long: the great bulk of first
cohabitations (86 percent) were either converted into
a marriage or dissolved within five years. Indeed, over
a quarter were dissolved or converted into a marriage
within a year and over a half were dissolved or converted
into a marriage within two years. It is interesting that
cohabitations that had been preceded by a marital union
lasted longer than those where the woman had not
previously been married.
The overall trends in cohabitation and marriage are
systematic and parallel, but run in opposite directions.

Mar
riag
e an
d C
oh
abit
atio
n
20
Rai
sin
g C
hil
dre
n in
New
Zea
lan
d
As a result, the cumulative proportion of women
entering any form of first union, whether marriage or
cohabitation, has remained high and stable.
There were some significant differences between
Ma-ori and non-Ma-ori. Ma-ori women were generally more
likely to enter cohabitation as a first union, particularly
at young ages, than their non-Ma-ori counterparts. On
the other hand, they were less likely to marry than
non-Ma-ori women, except during their teens. Although
Ma-ori women were more likely to be in a union of any
form at younger ages, by 30 years of age, there was no
difference between Ma-ori and non-Ma-ori women in
the proportions who had entered into a first union of
any type.
Two other changes in union formation have occurred
alongside changes in cohabitation and marriage. First,
there has been an increasing propensity for New Zealand
women to have lived in more than one union in their
lifetime: among more recent cohorts of women, more
than a fifth had lived in at least two unions by the age
of 25 and seven percent had lived in at least two unions
by the age of 20. Secondly, there has been an increasing
tendency among younger women to be in a living-apart-
together relationship. In 1995, about one in three women
in their early 20s who were in a union of any form were
living apart from their partners, typically with their
parents. This phenomenon is not unique to New Zealand.
It is also found in Australia, Sweden and France.
Table 2.1
Cumulative proportion in fi rst union before: NumberCharacteristics 20 yrs 25 yrs 30 yrs 35 yrs of women
Birth cohort
1936–1949 0.25 0.80 0.92 0.95 803
1950–1959 0.39 0.85 0.94 0.96 934
1960–1969 0.39 0.80 860
1970–1975 0.40 420
Ethnicity
Ma-ori 0.53 0.83 0.90 0.94 513
Non-Ma-ori 0.33 0.80 0.92 0.95 2,504
Education
No qualifi cations 0.47 0.85 0.93 0.97 787
Secondary qualifi cations 0.35 0.83 0.95 0.97 765
Tertiary – other qualifi cations 0.31 0.79 0.91 0.94 1,163
University qualifi cations 0.14 0.66 0.83 0.87 302
Overall 0.35 0.81 0.92 0.95 3,017
Life-table estimates of the cumulative proportion of women entering a fi rst union
(cohabitation or marriage) before a given age, by selected socio-demographic characteristics

Marriag
e and
Coh
abitation
21
Raisin
g Ch
ildren
in N
ew Zealan
d
Cumulative proportion married before: NumberCharacteristics 20 yrs 25 yrs 30 yrs 35 yrs of women
Birth cohort
1936–1949 0.23 0.78 0.90 0.93 803
1950–1959 0.25 0.71 0.84 0.88 934
1960–1969 0.11 0.49 860
1970–1975 0.04 420
Ethnicity
Ma-ori 0.21 0.47 0.61 0.67 513
Non-Ma-ori 0.16 0.62 0.79 0.85 2,504
Education
No qualifi cations 0.25 0.67 0.79 0.83 787
Secondary qualifi cations 0.16 0.63 0.80 0.85 765
Tertiary – other qualifi cations 0.14 0.58 0.75 0.83 1,163
University qualifi cations 0.03 0.39 0.64 0.75 302
Overall 0.17 0.61 0.77 0.83 3,017
Rate of fi rst marriage NumberCharacteristics 15–19 yrs 20–24 yrs 25–29 yrs 30–34 yrs of women
Birth cohort
1936–1949 0.23 0.71 0.54 0.34 803
1950–1959 0.25 0.61 0.45 0.28 934
1960–1969 0.11 0.43 860
1970–1975 0.04 420
Ethnicity
Ma-ori 0.21 0.32 0.26 0.15 513
Non-Ma-ori 0.16 0.55 0.44 0.29 2,504
Education
No qualifi cations 0.25 0.56 0.36 0.21 787
Secondary qualifi cations 0.16 0.56 0.46 0.23 765
Tertiary – other qualifi cations 0.14 0.51 0.41 0.32 1,163
University qualifi cations 0.03 0.37 0.41 0.30 302
Overall 0.17 0.53 0.41 0.27 3,017
Rate of fi rst marriage in various age groups, for selected socio-demographic characteristics
Life-table estimates of the cumulative proportion of women entering a fi rst marriage before a given
age, by selected socio-demographic characteristics
Table 2.2
Table 2.3

Mar
riag
e an
d C
oh
abit
atio
n
22
Rai
sin
g C
hil
dre
n in
New
Zea
lan
d
Multivariate hazards model estimates of the effects of socio-demographic covariates on the
propensity to enter into a first marriage
Covariates Incidence Rate Ratio Z-Statistic
Birth cohort Before 1950R 1.00 –
1950–1959 0.80 2.40 **
1960–1969 0.48 5.59 **
1970–1975 0.18 7.91 **
Calendar period (tv) Before 1960 0.74 2.50
1960–1969R 1.00 –
1970–1979 0.98 0.21
1980–1989 0.85 1.28
1990–1995 0.81 1.15
Age of woman (tv) Under 20 years 0.27 20.02 **
20–24 yearsR 1.00 –
25–29 years 0.73 3.94 **
30–34 years 0.45 5.84 **
35–59 years 0.16 7.31 **
Ethnicity Ma-oriR 1.00 –
Non-Ma-ori 1.47 4.64 **
Education No qualifi cationsR 1.00 –
Secondary qualifi cations 1.10 1.31
Tertiary – other qualifi cations 0.92 1.19
University qualifi cations 0.70 3.80 **
Occupation (tv) Professional 1.66 6.41 **
Semi-professional 1.52 6.18 **
Non-professional 1.53 4.76 **
Not workingR 1.00 –
Duration of cohabitation (tv) No cohabitation 0.46 7.07 **
1–6 monthsR 1.00 –
7–12 months 0.67 2.69 **
13–24 months 0.77 1.99 **
25–60 months 0.58 4.24 **
61+ months 0.36 6.01 **
Pregnant at any given age (tv) NoR 1.00 –
Yes 6.51 22.42 **
Had given birth by any given age (tv) NoR 1.00 –
Yes 0.94 0.56
Log likelihood = 10662 tv = time-varying covariate ** = p ≤ 0.05
χ2 (df = 25) = 2065 R = reference category
Table 2.4

Marriag
e and
Coh
abitation
23
Raisin
g Ch
ildren
in N
ew Zealan
d
Cumulative proportion entering cohabitation before: Characteristics 20 yrs 25 yrs 30 yrs 35 yrs
Birth cohort
1936–1949 0.04 0.12 0.29 0.40
1950–1959 0.22 0.53 0.71 0.78
1960–1969 0.34 0.67
1970–1975 0.38
Ethnicity
Ma-ori 0.44 0.70 0.78 0.83
Non-Ma-ori 0.21 0.48 0.65 0.72
Education
No qualifi cations 0.30 0.48 0.61 0.71
Secondary qualifi cations 0.24 0.54 0.73 0.78
Tertiary – other qualifi cations 0.22 0.51 0.66 0.72
University qualifi cations 0.11 0.45 0.61 0.66
Overall 0.24 0.51 0.66 0.73
Note: Sample numbers are not reported for this table, because the number of women on which the proportions
were based diminished with increasing age (ie the number who remained unmarried at each age).
Life-table estimates of the cumulative proportion of women entering cohabitation as a first union
(given that they are not married) before a given age, by selected socio-demographic characteristics
Table 2.5
Table 2.6
Rate of cohabitation Characteristics 15–19 yrs 20–24 yrs 25–29 yrs 30–34 yrs
Birth cohort
1936–1949 0.04 0.09 0.19 0.16
1950–1959 0.22 0.39 0.39 0.25
1960–1969 0.34 0.50
1970–1975 0.37
Ethnicity
Ma-ori 0.43 0.47 0.27 0.24
Non-Ma-ori 0.21 0.34 0.33 0.19
Education
No qualifi cations 0.30 0.25 0.25 0.27
Secondary qualifi cations 0.24 0.39 0.42 0.17
Tertiary – other qualifi cations 0.22 0.37 0.31 0.19
University qualifi cations 0.11 0.38 0.30 0.11
Overall 0.24 0.35 0.32 0.20
Note: Sample numbers are not reported for this table, because the number of women on which the proportions
were based diminished with increasing age (ie the number who remained unmarried at each age).
Rate of entry of women into cohabitation as a first union (given that they are not married)
in various age groups, by selected socio-demographic characteristics

Mar
riag
e an
d C
oh
abit
atio
n
24
Rai
sin
g C
hil
dre
n in
New
Zea
lan
d
Multivariate hazards model estimates of the effects of socio-demographic covariates on the
propensity to enter into cohabitation as a first union
Covariates Incidence Rate Ratio Z-Statistic
Birth cohort Before 1950R 1.00 –
1950–1959 1.81 3.77 **
1960–1969 1.95 3.40 **
1970–1975 2.36 3.52 **
Calendar period (tv) Before 1960 0.25 3.05 **
1960–1969R 1.00 –
1970–1979 3.09 6.94 **
1980–1989 4.15 6.98 **
1990–1995 4.28 5.74 **
Age of woman (tv) Under 20R 1.00 –
20–24 years 1.26 2.61 **
25–29 years 1.02 0.10
30–34 years 0.56 2.17 **
Ethnicity Ma-oriR 1.00 –
Non-Ma-ori 0.67 4.71 **
Education No qualifi cationsR 1.00 –
Secondary qualifi cations 0.82 2.13 **
Tertiary – other qualifi cations 0.80 2.44 **
University qualifi cations 0.68 2.79 **
Occupation (tv) Professional 1.10 0.84
Semi-professional 1.05 0.54
Non-professional 1.16 1.14
Not workingR 1.00 –
Years worked by any given age (tv) Not workedR 1.00 –
< 2.0 years 3.32 10.31 **
2.1 – 5.0 years 3.81 9.41 **
5.1 and over 3.42 6.87 **
Log likelihood = 5759 tv = time-varying covariate ** = p ≤ 0.05
χ2 (df = 21) = 670 R = reference category
Table 2.7
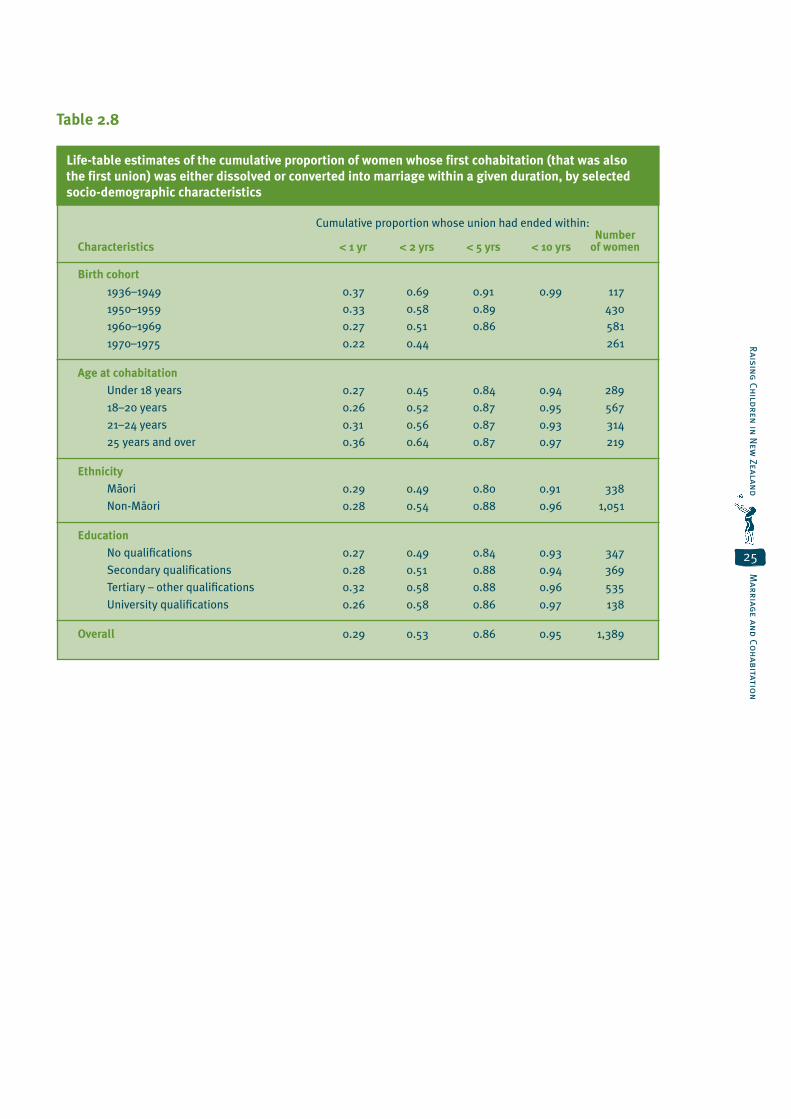
Marriag
e and
Coh
abitation
25
Raisin
g Ch
ildren
in N
ew Zealan
d
Cumulative proportion whose union had ended within: NumberCharacteristics < 1 yr < 2 yrs < 5 yrs < 10 yrs of women
Birth cohort
1936–1949 0.37 0.69 0.91 0.99 117
1950–1959 0.33 0.58 0.89 430
1960–1969 0.27 0.51 0.86 581
1970–1975 0.22 0.44 261
Age at cohabitation
Under 18 years 0.27 0.45 0.84 0.94 289
18–20 years 0.26 0.52 0.87 0.95 567
21–24 years 0.31 0.56 0.87 0.93 314
25 years and over 0.36 0.64 0.87 0.97 219
Ethnicity
Ma-ori 0.29 0.49 0.80 0.91 338
Non-Ma-ori 0.28 0.54 0.88 0.96 1,051
Education
No qualifi cations 0.27 0.49 0.84 0.93 347
Secondary qualifi cations 0.28 0.51 0.88 0.94 369
Tertiary – other qualifi cations 0.32 0.58 0.88 0.96 535
University qualifi cations 0.26 0.58 0.86 0.97 138
Overall 0.29 0.53 0.86 0.95 1,389
Life-table estimates of the cumulative proportion of women whose first cohabitation (that was also
the first union) was either dissolved or converted into marriage within a given duration, by selected
socio-demographic characteristics
Table 2.8
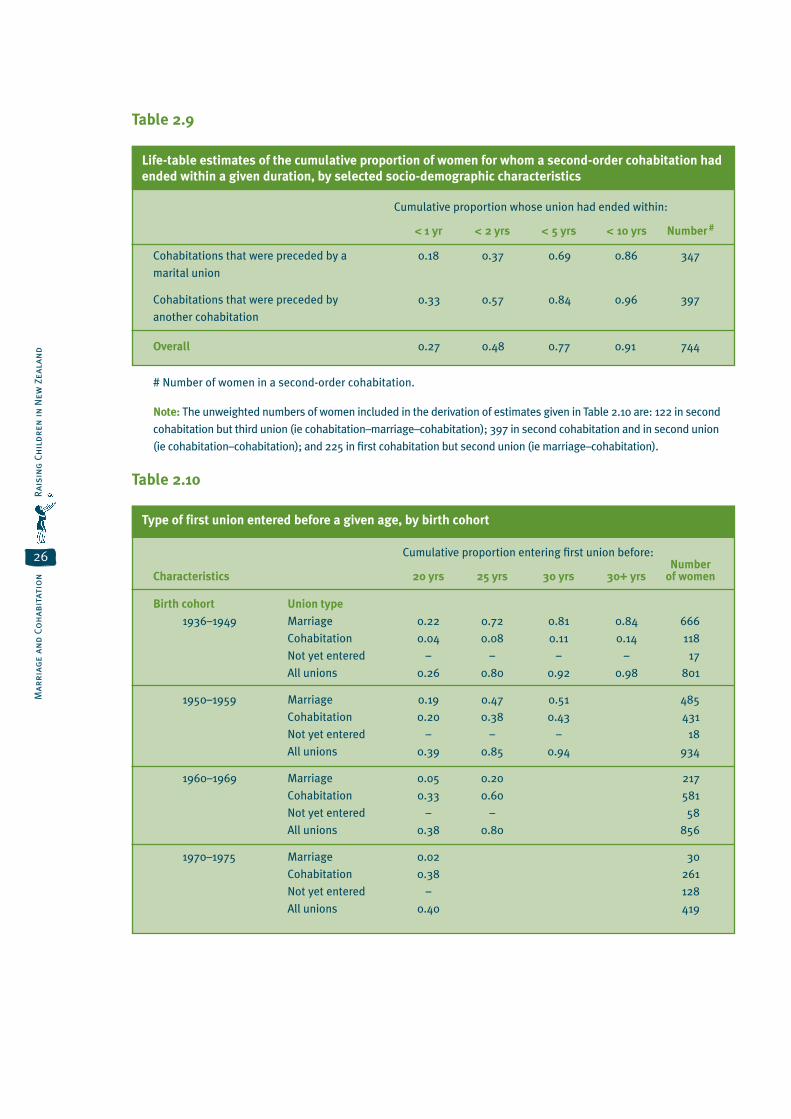
Mar
riag
e an
d C
oh
abit
atio
n
26
Rai
sin
g C
hil
dre
n in
New
Zea
lan
d
Cumulative proportion entering fi rst union before: NumberCharacteristics 20 yrs 25 yrs 30 yrs 30+ yrs of women
Birth cohort Union type
1936–1949 Marriage 0.22 0.72 0.81 0.84 666
Cohabitation 0.04 0.08 0.11 0.14 118
Not yet entered – – – – 17
All unions 0.26 0.80 0.92 0.98 801
1950–1959 Marriage 0.19 0.47 0.51 485
Cohabitation 0.20 0.38 0.43 431
Not yet entered – – – 18
All unions 0.39 0.85 0.94 934
1960–1969 Marriage 0.05 0.20 217
Cohabitation 0.33 0.60 581
Not yet entered – – 58
All unions 0.38 0.80 856
1970–1975 Marriage 0.02 30
Cohabitation 0.38 261
Not yet entered – 128
All unions 0.40 419
Type of first union entered before a given age, by birth cohort
Cumulative proportion whose union had ended within: < 1 yr < 2 yrs < 5 yrs < 10 yrs Number #
Cohabitations that were preceded by a 0.18 0.37 0.69 0.86 347
marital union
Cohabitations that were preceded by 0.33 0.57 0.84 0.96 397
another cohabitation
Overall 0.27 0.48 0.77 0.91 744
# Number of women in a second-order cohabitation.
Note: The unweighted numbers of women included in the derivation of estimates given in Table 2.10 are: 122 in second
cohabitation but third union (ie cohabitation–marriage–cohabitation); 397 in second cohabitation and in second union
(ie cohabitation–cohabitation); and 225 in fi rst cohabitation but second union (ie marriage–cohabitation).
Life-table estimates of the cumulative proportion of women for whom a second-order cohabitation had
ended within a given duration, by selected socio-demographic characteristics
Table 2.9
Table 2.10

Marriag
e and
Coh
abitation
27
Raisin
g Ch
ildren
in N
ew Zealan
d
Age at interview in 1995 (percent) 20–24 25–29 30–34 35–39
Union status
Cohabiting 27 20 14 9
Partnership but living apart 20 8 7 6
Married 14 50 62 70
No current relationship 37 18 11 7
Other 2 4 6 8
Number of unions before age 20 years
None 61 61 62 58
1 union 32 32 34 41
2+ unions 7 7 4 1
Number of unions before age 25 years
None – 18 22 13
1 union – 60 60 73
2+ unions – 22 18 14
Number of women 353 398 441 503
Union status at the time of the survey and number of unions before 25 years of age for women aged
under 40 (percentages)
Table 2.11

Mar
riag
e an
d C
oh
abit
atio
n
28
Rai
sin
g C
hil
dre
n in
New
Zea
lan
d

Separation from Marriage
and Repartnering
3

30
Rai
sin
g C
hil
dre
n in
New
Zea
lan
dSe
para
tio
n f
rom
Mar
riag
e an
d R
epar
tner
ing
ajor changes have occurred in recent decades not only in the formation of unions but
also in their dissolution. In addition to the shift to older age at marriage and the growing
preference for cohabitation as a first union described in Chapter 2, the period since the
1970s has witnessed substantial increases in separation and divorce. In this chapter, we describe the
pattern of dissolution of first marriages and repartnering after separation. Three points should be noted
about the results on separation. First, the analysis focuses only on dissolution of legal marriages.
Separations from periods of cohabitation are not covered. Secondly, the analysis includes separations
only from first, and not subsequent, marriages. Thirdly, because the NZWFEE survey included
information on the age at which a woman separated but not on her age at divorce, the analysis of
marriage dissolutions focuses on separation, rather than divorce. In support of this approach, it may
be noted that, while a marriage ends legally only with a divorce, most marriages are effectively ended
when spouses separate.
M
3a Separation from First Marriage
Bivariate analysis
Life-table estimates of the cumulative proportions of
women who had separated from a first marriage by
varying durations of marriage are given in Table 3.1.
About one in five first marriages had ended in separation
within 10 years and about a third of first marriages had
ended in separation within 20 years.
The table shows that younger birth cohorts and more
recent marriage cohorts have higher rates of separation
than older and earlier cohorts. For instance, within the
first 10 years of marriage, 28 percent of those born in
the 1960s had separated, compared with 13 percent
of those born before 1950. Similarly, among those
who had married in the period 1980–1995, 26 percent
had separated before their 10th wedding anniversary,
compared with 13 percent of those who had married
before 1970.
Age at marriage is also strongly correlated with the
likelihood of separation. Among those who had married
before 20 years of age, 25 percent were separated
within 10 years of marriage, compared with 16 percent
among women who had married after they turned 25.
Ma-ori women had a greater likelihood of separation by
any given duration of marriage than non-Ma-ori women.
For instance, 25 percent of Ma-ori women had separated
within 10 years of marriage, compared with 19 percent
of non-Ma-ori women. It is interesting that there were
no significant educational differentials in the likelihood
of separation, but there were differences by occupation
at marriage. Relatively fewer professional women had
separated than non-professional or non-working women.
In Table 3.2, we present rates of separation within
varying durations of marriage classified by the usual
socio-demographic variables. To determine whether the
risk of separation varied as the duration of the marriage
increased, it is necessary to combine the figures for the
first two columns, since these two columns together
cover the first five years of the marriage, an equivalent
period to the other intervals in the table. It is evident
that, overall, there was no association between duration
of marriage and probability of separation. Ten percent of
marriages had ended in separation within the first five
years, compared with 11 percent, nine percent and nine
percent for the following three five-year periods. It should
be noted, however, that this result was not confirmed by
the multivariate analysis (see the following discussion).
Rates of separation were greater for younger birth
cohorts and more recent marriage cohorts, those who
had married before 20 years of age and Ma-ori: all of
these results are consistent with the earlier results on
cumulative proportions separated by varying durations
of marriage. Among younger birth cohorts and more
recent marriage cohorts, marriages were more likely
to break down quickly: 18 percent of those born in the
period 1970–1975 had separated before reaching their
second wedding anniversary, compared with only two
percent of those born before 1950. And 10 percent of
those who had married in the period 1980–1995 had
separated more than two years but less than five years
after they had married, compared with only one percent
of those who had married before 1970.
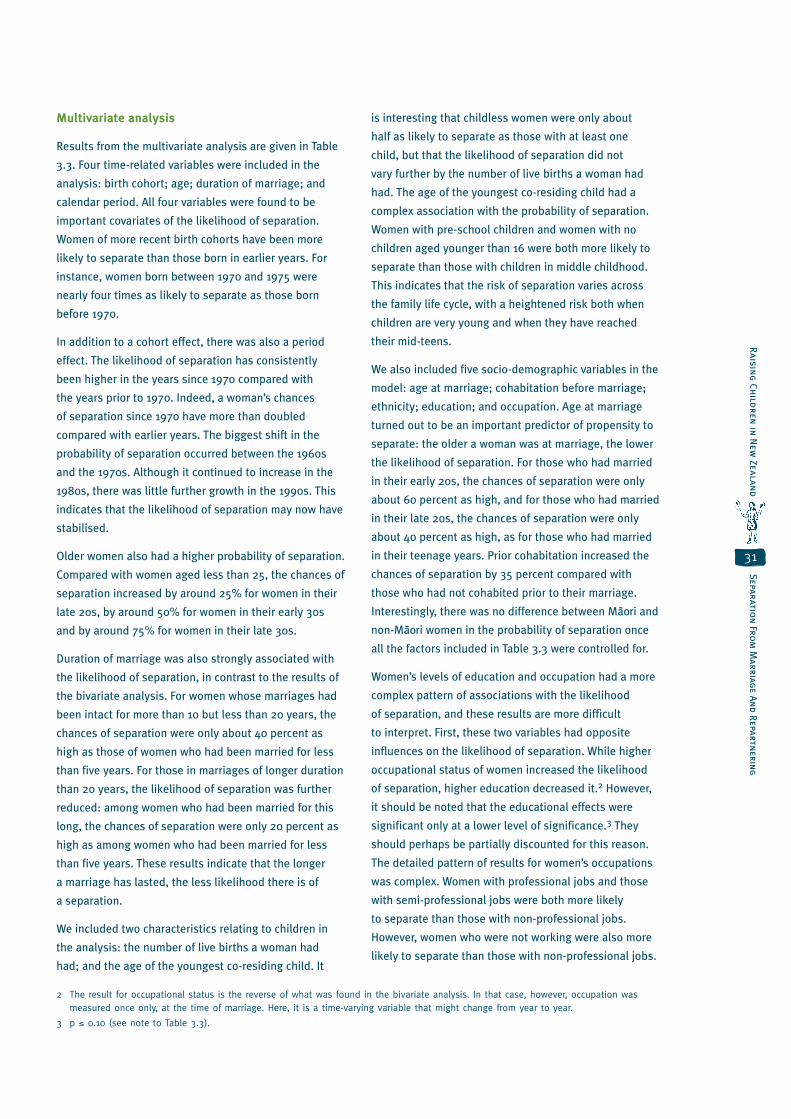
31
Raisin
g Ch
ildren
in N
ew Zealan
dSeparatio
n Fro
m M
arriage An
d Repartn
ering
Multivariate analysis
Results from the multivariate analysis are given in Table
3.3. Four time-related variables were included in the
analysis: birth cohort; age; duration of marriage; and
calendar period. All four variables were found to be
important covariates of the likelihood of separation.
Women of more recent birth cohorts have been more
likely to separate than those born in earlier years. For
instance, women born between 1970 and 1975 were
nearly four times as likely to separate as those born
before 1970.
In addition to a cohort effect, there was also a period
effect. The likelihood of separation has consistently
been higher in the years since 1970 compared with
the years prior to 1970. Indeed, a woman’s chances
of separation since 1970 have more than doubled
compared with earlier years. The biggest shift in the
probability of separation occurred between the 1960s
and the 1970s. Although it continued to increase in the
1980s, there was little further growth in the 1990s. This
indicates that the likelihood of separation may now have
stabilised.
Older women also had a higher probability of separation.
Compared with women aged less than 25, the chances of
separation increased by around 25% for women in their
late 20s, by around 50% for women in their early 30s
and by around 75% for women in their late 30s.
Duration of marriage was also strongly associated with
the likelihood of separation, in contrast to the results of
the bivariate analysis. For women whose marriages had
been intact for more than 10 but less than 20 years, the
chances of separation were only about 40 percent as
high as those of women who had been married for less
than five years. For those in marriages of longer duration
than 20 years, the likelihood of separation was further
reduced: among women who had been married for this
long, the chances of separation were only 20 percent as
high as among women who had been married for less
than five years. These results indicate that the longer
a marriage has lasted, the less likelihood there is of
a separation.
We included two characteristics relating to children in
the analysis: the number of live births a woman had
had; and the age of the youngest co-residing child. It
is interesting that childless women were only about
half as likely to separate as those with at least one
child, but that the likelihood of separation did not
vary further by the number of live births a woman had
had. The age of the youngest co-residing child had a
complex association with the probability of separation.
Women with pre-school children and women with no
children aged younger than 16 were both more likely to
separate than those with children in middle childhood.
This indicates that the risk of separation varies across
the family life cycle, with a heightened risk both when
children are very young and when they have reached
their mid-teens.
We also included five socio-demographic variables in the
model: age at marriage; cohabitation before marriage;
ethnicity; education; and occupation. Age at marriage
turned out to be an important predictor of propensity to
separate: the older a woman was at marriage, the lower
the likelihood of separation. For those who had married
in their early 20s, the chances of separation were only
about 60 percent as high, and for those who had married
in their late 20s, the chances of separation were only
about 40 percent as high, as for those who had married
in their teenage years. Prior cohabitation increased the
chances of separation by 35 percent compared with
those who had not cohabited prior to their marriage.
Interestingly, there was no difference between Ma-ori and
non-Ma-ori women in the probability of separation once
all the factors included in Table 3.3 were controlled for.
Women’s levels of education and occupation had a more
complex pattern of associations with the likelihood
of separation, and these results are more difficult
to interpret. First, these two variables had opposite
influences on the likelihood of separation. While higher
occupational status of women increased the likelihood
of separation, higher education decreased it.2 However,
it should be noted that the educational effects were
significant only at a lower level of significance.3 They
should perhaps be partially discounted for this reason.
The detailed pattern of results for women’s occupations
was complex. Women with professional jobs and those
with semi-professional jobs were both more likely
to separate than those with non-professional jobs.
However, women who were not working were also more
likely to separate than those with non-professional jobs.
2 The result for occupational status is the reverse of what was found in the bivariate analysis. In that case, however, occupation was measured once only, at the time of marriage. Here, it is a time-varying variable that might change from year to year.
3 p ≤ 0.10 (see note to Table 3.3).
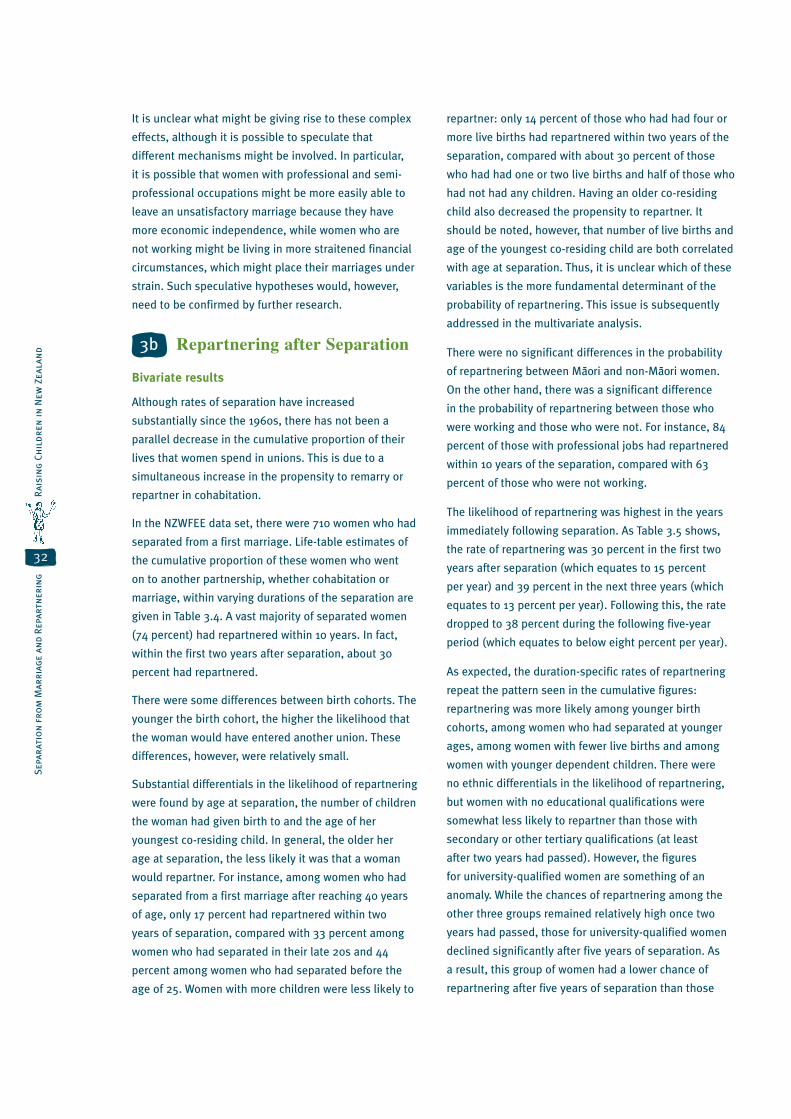
32
Rai
sin
g C
hil
dre
n in
New
Zea
lan
dSe
para
tio
n f
rom
Mar
riag
e an
d R
epar
tner
ing
It is unclear what might be giving rise to these complex
effects, although it is possible to speculate that
different mechanisms might be involved. In particular,
it is possible that women with professional and semi-
professional occupations might be more easily able to
leave an unsatisfactory marriage because they have
more economic independence, while women who are
not working might be living in more straitened financial
circumstances, which might place their marriages under
strain. Such speculative hypotheses would, however,
need to be confirmed by further research.
3b Repartnering after Separation
Bivariate results
Although rates of separation have increased
substantially since the 1960s, there has not been a
parallel decrease in the cumulative proportion of their
lives that women spend in unions. This is due to a
simultaneous increase in the propensity to remarry or
repartner in cohabitation.
In the NZWFEE data set, there were 710 women who had
separated from a first marriage. Life-table estimates of
the cumulative proportion of these women who went
on to another partnership, whether cohabitation or
marriage, within varying durations of the separation are
given in Table 3.4. A vast majority of separated women
(74 percent) had repartnered within 10 years. In fact,
within the first two years after separation, about 30
percent had repartnered.
There were some differences between birth cohorts. The
younger the birth cohort, the higher the likelihood that
the woman would have entered another union. These
differences, however, were relatively small.
Substantial differentials in the likelihood of repartnering
were found by age at separation, the number of children
the woman had given birth to and the age of her
youngest co-residing child. In general, the older her
age at separation, the less likely it was that a woman
would repartner. For instance, among women who had
separated from a first marriage after reaching 40 years
of age, only 17 percent had repartnered within two
years of separation, compared with 33 percent among
women who had separated in their late 20s and 44
percent among women who had separated before the
age of 25. Women with more children were less likely to
repartner: only 14 percent of those who had had four or
more live births had repartnered within two years of the
separation, compared with about 30 percent of those
who had had one or two live births and half of those who
had not had any children. Having an older co-residing
child also decreased the propensity to repartner. It
should be noted, however, that number of live births and
age of the youngest co-residing child are both correlated
with age at separation. Thus, it is unclear which of these
variables is the more fundamental determinant of the
probability of repartnering. This issue is subsequently
addressed in the multivariate analysis.
There were no significant differences in the probability
of repartnering between Ma-ori and non-Ma-ori women.
On the other hand, there was a significant difference
in the probability of repartnering between those who
were working and those who were not. For instance, 84
percent of those with professional jobs had repartnered
within 10 years of the separation, compared with 63
percent of those who were not working.
The likelihood of repartnering was highest in the years
immediately following separation. As Table 3.5 shows,
the rate of repartnering was 30 percent in the first two
years after separation (which equates to 15 percent
per year) and 39 percent in the next three years (which
equates to 13 percent per year). Following this, the rate
dropped to 38 percent during the following five-year
period (which equates to below eight percent per year).
As expected, the duration-specific rates of repartnering
repeat the pattern seen in the cumulative figures:
repartnering was more likely among younger birth
cohorts, among women who had separated at younger
ages, among women with fewer live births and among
women with younger dependent children. There were
no ethnic differentials in the likelihood of repartnering,
but women with no educational qualifications were
somewhat less likely to repartner than those with
secondary or other tertiary qualifications (at least
after two years had passed). However, the figures
for university-qualified women are something of an
anomaly. While the chances of repartnering among the
other three groups remained relatively high once two
years had passed, those for university-qualified women
declined significantly after five years of separation. As
a result, this group of women had a lower chance of
repartnering after five years of separation than those

33
Raisin
g Ch
ildren
in N
ew Zealan
dSeparatio
n Fro
m M
arriage An
d Repartn
ering
with no qualifications. Women in employment were
also more likely to repartner than those who were
not working, and those with professional occupations
tended to have a higher probability of repartnering.
Multivariate results
The results of the multivariate analysis presented in
Table 3.6 only partially support the observations made
from the bivariate analyses. The analysis confirmed
that two of the strongest influences on the probability
of repartnering were duration of separation and age at
separation. The longer a woman had been separated,
the less likely it was that she would repartner. The
propensity to enter another union was highest in the
first two years after separation from a first marriage; it
then decreased progressively. For women who had not
repartnered within the first five years after separation,
their chances of repartnering in the next five years were
only about 40 percent as high as in the first two years
after separation. After 10 years had passed, a woman had
only a 16 percent chance of repartnering compared with
her chances during the first two years after separation.
The analysis also confirmed that a woman’s chances of
repartnering were highest if she had separated before
the age of 30. If she had separated after turning 40, her
chances of repartnering were greatly diminished. The
chances of repartnering among women who were aged
over 40 when they separated were only a little over a
quarter of those of women who were aged under 30
when they separated.
For the two child-related variables, the pattern of
results was different from that observed in the bivariate
analysis. In the case of the age of the youngest co-
residing child, the pattern was reversed: those with no
children aged less than 16 were significantly more likely
to repartner than those with a child aged under 10.
The number of live births was no longer important, in
contrast to the results of the bivariate analysis. Rather,
what was important was whether the woman had had
any children or none at all: childless women were about
60 percent more likely to repartner than those with at
least one child.
There was no significant ethnic differential in the
propensity to repartner. Similarly, there were no
differences in the propensity to repartner between less
educated and more educated women. However,
the occupational status of women made some
difference: women with professional jobs were about
70 percent more likely to repartner than those who
were not working.
3c SummaryThe major findings on patterns of separation and
repartnering among New Zealand women are broadly
consistent with results from North America, Australia
and Europe. The post-1970 period has seen substantial
increases in rates of separation. Although the probability
of separation continued to increase in the 1980s, the
major change was between the 1960s and 1970s; the
increase in the 1980s was more modest and there was
little further growth in the 1990s. This indicates that
rates of separation may now have stabilised.
In addition to this period effect, women in the most
recent birth cohort (1970–1975) have been nearly four
times more likely to separate than those born in
earlier years.
Within the first 20 years of marriage, one in three women
can be expected to separate from their husbands.
Getting married at a young age increased the probability
of separation: among women who married at ages
25–29, the chances of separation were only about 40
percent as high as among those who had married before
the age of 20.
The probability of separation declined as the duration
of the marriage lengthened: for women who had been
married for 20 years, the chances of separation were
only a fifth as high as those of women who had been
married for less than five years. Furthermore, a woman’s
chances of separation diminished with increasing age.
The age of her youngest co-residing child also influenced
a woman’s chances of separation: those whose youngest
child was in middle childhood or early adolescence
(ie between five and 14 years of age) were less likely
to separate than those whose youngest child was a
pre-schooler or an older adolescent.
Although ethnicity was an important correlate of
separation at the bivariate level, it was no longer
significant when other factors were statistically
controlled for in the multivariate analyses.

34
Rai
sin
g C
hil
dre
n in
New
Zea
lan
dSe
para
tio
n f
rom
Mar
riag
e an
d R
epar
tner
ing
Parallel to the increased propensity to separate since
the 1960s is an increased tendency to enter a new
partnership after separation. In fact, about one in
three women had repartnered within two years of
separation (in either cohabitation or marriage) and
about three in four women had repartnered within 10
years of separation. Duration of separation had the
strongest effect on a woman’s chances of repartnering.
In particular, repartnering was most likely shortly after
separation. Being of a younger age at the time of the
separation, being childless, having no co-residing
children under the age of 15 years and holding a
professional occupation all increased the propensity of
a separated woman to enter into a new union. There was
no difference, however, between Ma-ori and non-Ma-ori
women in the likelihood of repartnering after separation.
Cumulative proportion separated within: Number of women inCharacteristics < 2 yrs < 5 yrs < 10 yrs < 15 yrs < 20 yrs fi rst marriage
Birth cohort
1936–1949 0.02 0.04 0.13 0.19 0.24 766
1950–1959 0.04 0.09 0.19 0.28 0.37 850
1960–1969 0.06 0.17 0.28 593
1970–1975 0.18 86
Year of marriage
Before 1970 0.02 0.03 0.13 0.19 0.25 549
1970–1979 0.04 0.09 0.18 0.26 0.34 1,254
1980–1995 0.07 0.16 0.26 492
Age at marriage
Under 20 years 0.06 0.11 0.25 0.32 0.41 616
20–24 years 0.04 0.09 0.18 0.25 0.30 751
25 years and over 0.04 0.08 0.16 0.23 0.29 928
Ethnicity
Ma-ori 0.07 0.15 0.25 0.32 0.39 294
Non-Ma-ori 0.04 0.09 0.19 0.26 0.32 2,001
Education
No qualifi cations 0.06 0.10 0.20 0.27 0.34 618
Secondary qualifi cations 0.04 0.10 0.21 0.27 0.31 563
Tertiary – other qualifi cations 0.03 0.08 0.17 0.24 0.32 903
University qualifi cations 0.04 0.10 0.17 0.26 0.37 211
Occupation at marriage
Professional 0.03 0.07 0.14 0.19 0.28 504
Semi-professional 0.04 0.08 0.19 0.26 0.32 887
Non-professional 0.04 0.09 0.22 0.30 0.36 244
Not working 0.06 0.13 0.23 0.30 0.37 640
Overall 0.04 0.09 0.19 0.26 0.33 2,295
Life-table estimates of the cumulative proportion of women separated from a first marriage within a
given duration, by selected socio-demographic characteristics
Table 3.1
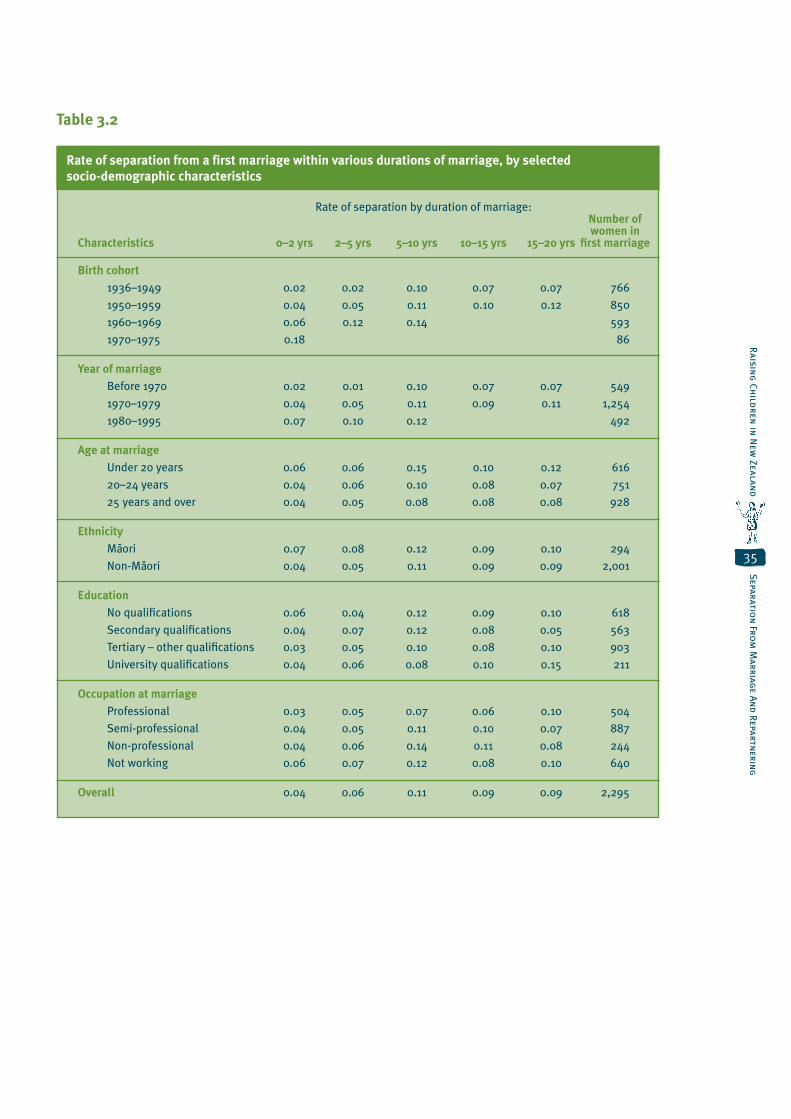
35
Raisin
g Ch
ildren
in N
ew Zealan
dSeparatio
n Fro
m M
arriage An
d Repartn
ering
Rate of separation by duration of marriage: Number of women inCharacteristics 0–2 yrs 2–5 yrs 5–10 yrs 10–15 yrs 15–20 yrs fi rst marriage
Birth cohort
1936–1949 0.02 0.02 0.10 0.07 0.07 766
1950–1959 0.04 0.05 0.11 0.10 0.12 850
1960–1969 0.06 0.12 0.14 593
1970–1975 0.18 86
Year of marriage
Before 1970 0.02 0.01 0.10 0.07 0.07 549
1970–1979 0.04 0.05 0.11 0.09 0.11 1,254
1980–1995 0.07 0.10 0.12 492
Age at marriage
Under 20 years 0.06 0.06 0.15 0.10 0.12 616
20–24 years 0.04 0.06 0.10 0.08 0.07 751
25 years and over 0.04 0.05 0.08 0.08 0.08 928
Ethnicity
Ma-ori 0.07 0.08 0.12 0.09 0.10 294
Non-Ma-ori 0.04 0.05 0.11 0.09 0.09 2,001
Education
No qualifi cations 0.06 0.04 0.12 0.09 0.10 618
Secondary qualifi cations 0.04 0.07 0.12 0.08 0.05 563
Tertiary – other qualifi cations 0.03 0.05 0.10 0.08 0.10 903
University qualifi cations 0.04 0.06 0.08 0.10 0.15 211
Occupation at marriage
Professional 0.03 0.05 0.07 0.06 0.10 504
Semi-professional 0.04 0.05 0.11 0.10 0.07 887
Non-professional 0.04 0.06 0.14 0.11 0.08 244
Not working 0.06 0.07 0.12 0.08 0.10 640
Overall 0.04 0.06 0.11 0.09 0.09 2,295
Rate of separation from a first marriage within various durations of marriage, by selected
socio-demographic characteristics
Table 3.2

36
Rai
sin
g C
hil
dre
n in
New
Zea
lan
dSe
para
tio
n f
rom
Mar
riag
e an
d R
epar
tner
ing
Multivariate hazards model estimates of the effects of selected covariates on the likelihood of
separation from a first marriage
Covariates Incidence Rate Ratio Z-Statistic
Birth cohort 1936–1949R 1.00 –
1950–1959 1.10 0.68
1960–1969 1.52 1.96 **
1970–1975 3.70 3.35 **
Calendar period (tv) Before 1960 1.01 0.02
1960–1969R 1.00 –
1970–1979 2.06 3.07 **
1980–1989 2.37 3.10 **
1990–1995 2.39 2.73 **
Age of woman (tv) 15–24 yearsR 1.00 –
25–29 years 1.28 1.54
30–34 years 1.55 1.98 **
35–59 years 1.75 2.07 **
Marriage duration (tv) 0–5 yearsR 1.00 –
5–10 years 0.85 1.11
10–20 years 0.42 3.83 **
20+ years 0.20 4.69 **
Number of live births (tv) 0 0.53 2.77 **
1R 1.00 –
2 1.15 1.02
3 1.01 0.09
4+ 1.06 0.32
Age of co-residing youngest child (tv) 0–4 yearsR 1.00 –
5–9 years 0.59 3.00 **
10–14 years 0.74 2.00 **
15 years and over 1.07 0.41
Age at marriage Under 20R 1.00 –
20–24 0.62 4.56 **
25–29 0.41 4.36 **
Cohabitation before marriage NoR 1.00 –
Yes 1.35 3.09 **
Ethnicity Ma-oriR 1.00 –
Non-Ma-ori 0.92 0.62
Table 3.3

37
Raisin
g Ch
ildren
in N
ew Zealan
dSeparatio
n Fro
m M
arriage An
d Repartn
ering
Multivariate hazards model estimates of the effects of selected covariates on the likelihood of
separation from a fi rst marriage … Continued
Covariates Incidence Rate Ratio Z-Statistic
Education No qualifi cationsR 1.00 –
Secondary qualifi cations 0.80 1.93 *
Tertiary – other qualifi cations 0.81 1.98 **
University qualifi cations 0.82 1.08
Occupation (tv) Professional 1.80 3.38 **
Semi-professional 1.60 2.92 **
Non-professionalR 1.00 –
Not working 1.38 2.04 **
Log likelihood = 4275 tv = time-varying covariate ** = p ≤ 0.05
χ2 (df = 30) = 171 R = reference category * = p ≤ 0.10
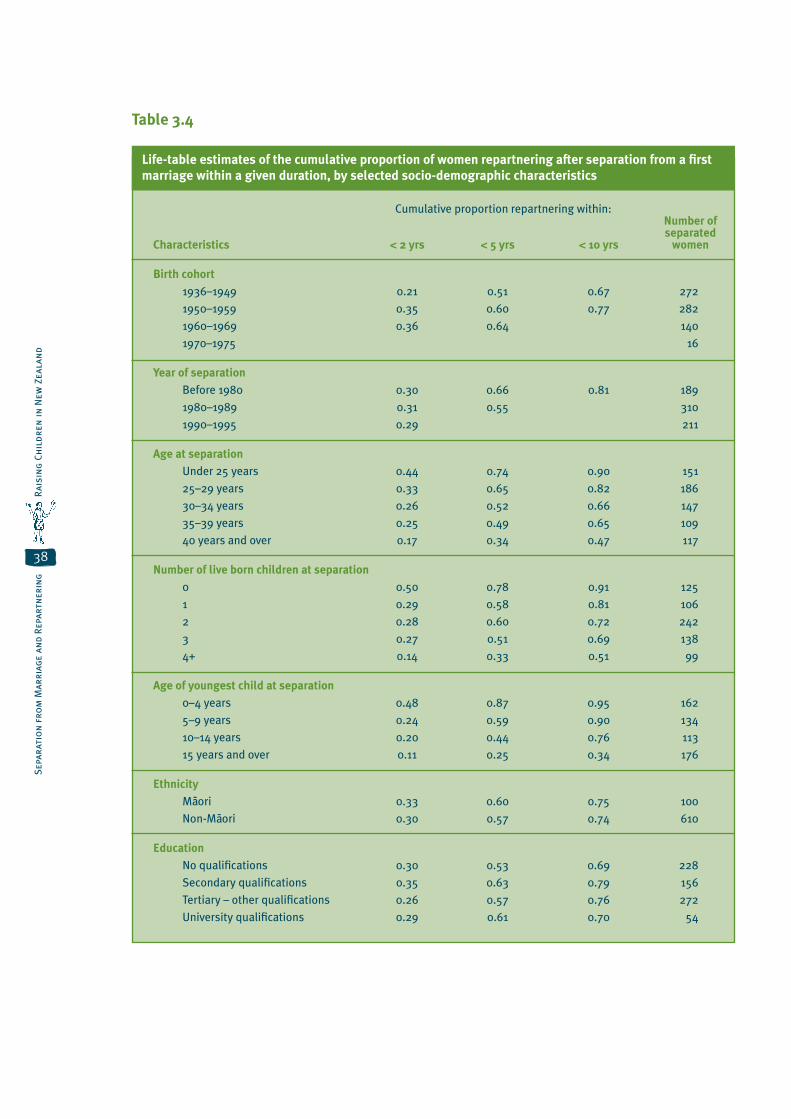
38
Rai
sin
g C
hil
dre
n in
New
Zea
lan
dSe
para
tio
n f
rom
Mar
riag
e an
d R
epar
tner
ing
Table 3.4
Cumulative proportion repartnering within: Number of separatedCharacteristics < 2 yrs < 5 yrs < 10 yrs women
Birth cohort
1936–1949 0.21 0.51 0.67 272
1950–1959 0.35 0.60 0.77 282
1960–1969 0.36 0.64 140
1970–1975 16
Year of separation
Before 1980 0.30 0.66 0.81 189
1980–1989 0.31 0.55 310
1990–1995 0.29 211
Age at separation
Under 25 years 0.44 0.74 0.90 151
25–29 years 0.33 0.65 0.82 186
30–34 years 0.26 0.52 0.66 147
35–39 years 0.25 0.49 0.65 109
40 years and over 0.17 0.34 0.47 117
Number of live born children at separation
0 0.50 0.78 0.91 125
1 0.29 0.58 0.81 106
2 0.28 0.60 0.72 242
3 0.27 0.51 0.69 138
4+ 0.14 0.33 0.51 99
Age of youngest child at separation
0–4 years 0.48 0.87 0.95 162
5–9 years 0.24 0.59 0.90 134
10–14 years 0.20 0.44 0.76 113
15 years and over 0.11 0.25 0.34 176
Ethnicity
Ma-ori 0.33 0.60 0.75 100
Non-Ma-ori 0.30 0.57 0.74 610
Education
No qualifi cations 0.30 0.53 0.69 228
Secondary qualifi cations 0.35 0.63 0.79 156
Tertiary – other qualifi cations 0.26 0.57 0.76 272
University qualifi cations 0.29 0.61 0.70 54
Life-table estimates of the cumulative proportion of women repartnering after separation from a fi rst
marriage within a given duration, by selected socio-demographic characteristics
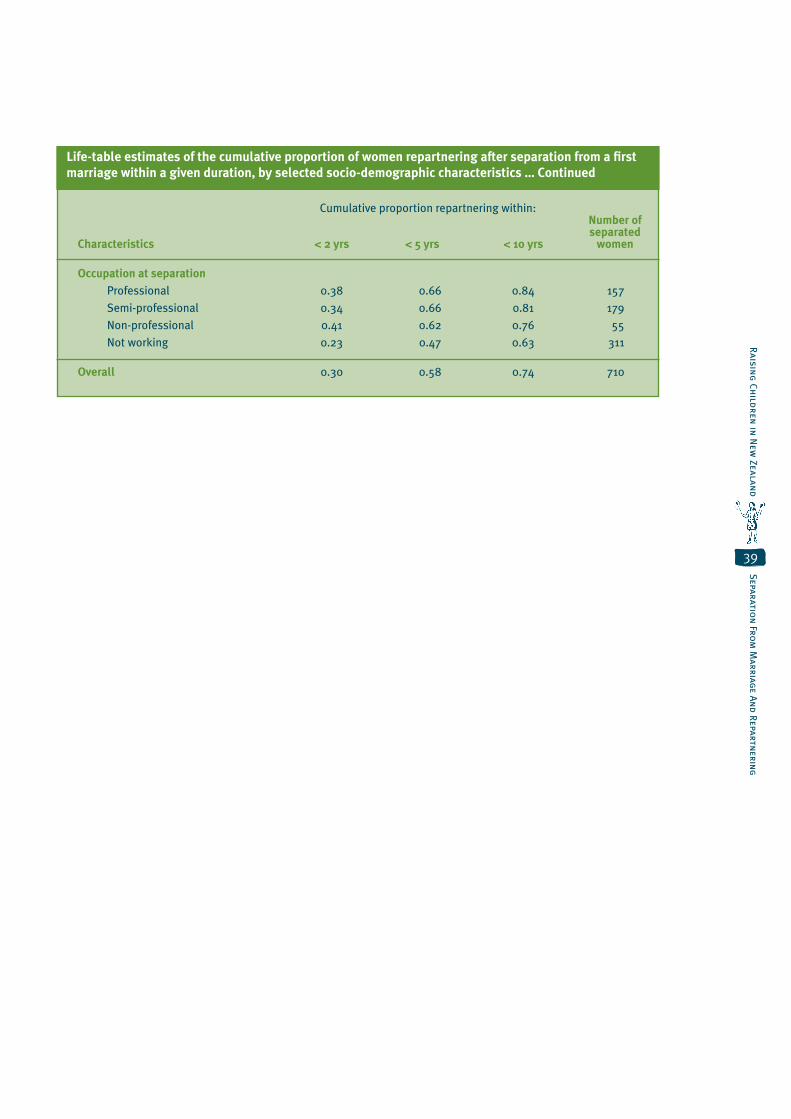
39
Raisin
g Ch
ildren
in N
ew Zealan
dSeparatio
n Fro
m M
arriage An
d Repartn
ering
Cumulative proportion repartnering within: Number of separatedCharacteristics < 2 yrs < 5 yrs < 10 yrs women
Occupation at separation
Professional 0.38 0.66 0.84 157
Semi-professional 0.34 0.66 0.81 179
Non-professional 0.41 0.62 0.76 55
Not working 0.23 0.47 0.63 311
Overall 0.30 0.58 0.74 710
Life-table estimates of the cumulative proportion of women repartnering after separation from a fi rst
marriage within a given duration, by selected socio-demographic characteristics … Continued

40
Rai
sin
g C
hil
dre
n in
New
Zea
lan
dSe
para
tio
n f
rom
Mar
riag
e an
d R
epar
tner
ing
Table 3.5
Rate of repartnership by duration Number of separatedCharacteristics 0–2 yrs 2–5 yrs 5–10 yrs women
Birth cohort
1936–1949 0.21 0.38 0.32 272
1950–1959 0.35 0.39 0.43 282
1960–1969 0.36 140
1970–1975 16
Year of separation
Before 1980 0.30 0.52 0.44 189
1980–1989 0.31 0.35 310
1990–1995 0.29 211
Age group at separation
Under 25 years 0.44 0.53 0.62 151
25–29 years 0.33 0.47 0.50 186
30–34 years 0.26 0.35 0.28 147
35–39 years 0.25 0.32 0.31 109
40 years and over 0.17 0.21 0.19 117
Number of live born children at separation
0 0.50 0.56 0.60 125
1 0.29 0.41 0.56 106
2 0.28 0.44 0.31 242
3 0.27 0.33 0.38 138
4+ 0.14 0.22 0.28 99
Age of youngest child at separation
0–4 years 0.48 0.75 0.60 162
5–9 years 0.24 0.47 0.75 134
10–14 years 0.20 0.30 0.57 113
15 years and over 0.11 0.16 0.12 176
Ethnicity
Ma-ori 0.33 0.40 0.38 100
Non-Ma-ori 0.30 0.39 0.38 610
Education
No qualifi cations 0.30 0.32 0.34 228
Secondary qualifi cations 0.35 0.43 0.43 156
Tertiary – other qualifi cations 0.26 0.43 0.44 272
University qualifi cations 0.29 0.45 0.23 54
Occupation at separation
Professional 0.38 0.45 0.51 157
Semi-professional 0.34 0.48 0.45 179
Non-professional 0.41 0.35 0.36 55
Not working 0.23 0.32 0.29 311
Overall 0.30 0.39 0.38 710
Rate of repartnership among separated women within various durations, by selected
socio-demographic characteristics

41
Raisin
g Ch
ildren
in N
ew Zealan
dSeparatio
n Fro
m M
arriage An
d Repartn
ering
Table 3.6
Multivariate hazards model estimates of the effects of socio-demographic covariates on the
propensity to repartner after separation from a fi rst marriage
Covariates Incidence Rate Ratio Z-Statistic
Age at separation of marriage < 30 yearsR 1.00 –
30–34 years 0.65 2.97 **
35–39 years 0.55 3.02 **
40+ 0.28 4.73 **
Year of separation of fi rst marriage Before 1980R 1.00 –
1980–1989 0.88 1.21
1990–1995 0.74 1.66
Duration of separation (tv) 0–2 yearsR 1.00 –
2–5 years 0.71 3.09 **
5–10 years 0.41 5.42 **
10+ years 0.16 5.54 **
Number of live births (tv) 0 1.62 2.69 **
1R 1.00 –
2 1.06 0.42
3+ 1.05 0.31
Age of youngest co-residing child (tv) 0–4 yearsR 1.00 –
5–9 years 0.97 0.22
10–14 years 1.33 1.41
15+ years 1.82 2.26 **
Ethnicity Ma-oriR 1.00 –
Non-Ma-ori 0.81 1.44
Education No qualifi cationsR 1.00 –
Secondary qualifi cations 1.26 1.64
Tertiary – other qualifi cations 0.96 0.32
University qualifi cations 0.95 0.25
Occupation at exposure (tv) Professional 1.70 3.23 **
Semi-professional 1.14 1.03
Non-professional 1.31 1.32
Not workingR 1.00 –
Log likelihood = 4299 tv = time-varying covariate ** = p ≤ 0.05
χ2 (df = 25) = 128 R = reference category

42
Rai
sin
g C
hil
dre
n in
New
Zea
lan
dSe
para
tio
n f
rom
Mar
riag
e an
d R
epar
tner
ing

Timing of Parenthood
and Birth Interval
4

Tim
ing
of
pare
nth
oo
d a
nd
Bir
th In
terv
al
44
Rai
sin
g C
hil
dre
n in
New
Zea
lan
d
his chapter examines whether and when New Zealand women have children and what changes
have occurred in patterns of childbearing over recent decades. As with union formation, the
timing of first births has undergone substantial change since the baby-boom period. We first
provide life-table estimates of the proportion of women having children before varying ages. We then
discuss marital status at first birth and the interval between births. This is followed by an examination
of the future childbearing intentions of childless women. We also carried out a multivariate analysis of
timing of first births, but have not presented the results here as they were not very different from the
bivariate results. More importantly, the bivariate analysis provided a more detailed picture of the results
by birth cohort and ethnicity.
T
4a First Births
Life-table estimates of the cumulative proportions of
women having a first birth before varying ages are given
in Table 4.1. Although the overall figures show that
close to 90 percent of New Zealand women have had a
child before 40 years of age, this may not necessarily
prove to be true for the youngest cohorts of women. For
instance, while 60 percent of women born before 1950
had had their first child before they turned 25 years of
age, only 42 percent of those born during the 1960s had
done so. Similarly, there are differences between birth
cohorts in the proportion of women who had had a child
before reaching 30 and 35 years of age, although the
differences narrow as the age of the women increases.
A pertinent question here is whether the lower rates of
birth at younger ages are simply a reflection of delays
in childbearing or whether they prefigure a reduction in
the total proportion of women who will eventually give
birth. These data do not allow us to answer this question
in a definitive way. The future childbearing intentions of
childless women, examined later in this chapter, provide
an additional perspective on this issue.
Ma-ori and non-Ma-ori women differ significantly in the
timing of their first births. While 72 percent of Ma-ori
women had had a first birth before the age of 25, only
46 percent of non-Ma-ori women had done so. Similarly,
a higher proportion of Ma-ori women had had their
first child in their teenage years (around one in three),
compared with non-Ma-ori women (around one in eight).
However, the higher rates of earlier childbirth among
Ma-ori are almost counterbalanced by higher rates of
later childbirth among non-Ma-ori, leaving only a small
residual difference in the proportions of women who had
given birth by age 40.
There are clear differences by educational qualifications
in the proportions reaching parenthood at younger ages.
Before they turned 25, 70 percent of women with no
qualifications had had their first child, compared with
47 percent among those with secondary qualifications
and just 17 percent of those with university
qualifications. The differentials persist, although they
narrow, as the age of the women rises.
To complement the data on the cumulative proportions
of women attaining parenthood discussed above, we
provide in Table 4.2 rates of first births in different
age groups by the same set of socio-demographic
characteristics. It is clear from this table that the
likelihood of having a first child was greatest in the
25–29 age group; following this, the chances of having
a first birth were more or less equal in the 20–24 and
30–35 age groups. If a woman was childless at age 25,
she had a 52 percent chance of having a child in the next
five years; whereas her chances of having a child in the
next five years were 40 percent at age 20 and 41 percent
at age 30.
The birth cohort and ethnic differentials in first birth
probabilities are of particular interest. The younger their
birth cohort, the less likely women were to have their
first child before the age of 25 and, correspondingly, the
more likely they were to have their first child in their
30s. This has resulted in a shift in women’s relative odds
of having a first child in their early 20s compared with
their early 30s. This can be seen by comparing the rates
of first births among women born before 1950 and those
born in the 1950s. While the probability of a first birth
peaked in the 25–29 age range for both groups, those
born in the 1950s had a higher probability of having
their first birth after they turned 30 than before age
25; in contrast, those born before 1950 had a higher
Timin
g o
f parenth
oo
d an
d B
irth In
terval
45
Raisin
g Ch
ildren
in N
ew Zealan
d
probability of having their first birth before age 25
than after they turned 30. The further reduction in the
probability of a first birth before age 25 for the cohort
of women born in the 1960s suggests that this trend is
likely to intensify in the future.
For Ma-ori, the probability of a first birth peaked in
the age range 20–24 (at 58 percent), followed by the
age range 25–29 (37 percent). But for non-Ma-ori, the
peak rate was in the age range 25–29 (at 53 percent),
followed by the age range 30–34 (42 percent). It is
interesting that, for Ma-ori women, the chances of having
a first birth in their teenage years were very similar to
the chances of having a first birth in their early 30s, but
for non-Ma-ori women, the chances of a teenage birth
were less than a third of the chances of having a first
birth in their early 30s.
Those with higher levels of education were more likely to
have their first child in their late 20s or early 30s, while
those without qualifications were more likely to have
their first child during their 20s. Women with a university
qualification had a lower probability of having a first
birth before the age of 35 than other women, but had a
higher probability of having a first birth in the 35–39 age
group (34 percent) than other women (eg nine percent
among those with no qualifications).
4b Non-Marital First Births
One of the most striking features of family formation
trends in the western world in the post-war period is
the increasing proportion of children being born outside
marriage. During the peak of the baby boom, marriages
were frequently precipitated by pregnancy: many
couples entered into marriage to legitimise the birth
of a child conceived pre-maritally. This was particularly
the case among those who had a child in their teens. In
more recent years, however, an ex-nuptial pregnancy has
been much less likely to precipitate a marriage.
The distribution of marital status at the time of first
birth by ethnicity, birth cohort and age at first birth is
given in Table 4.3. Ma-ori women had a higher likelihood
of having their first child outside marriage than their
non-Ma-ori counterparts. Among those who had their
first birth before reaching 20 years of age, about a third
of both Ma-ori and non-Ma-ori women did so outside any
union. However, more Ma-ori women had their first birth
in a cohabitation relationship (35 percent) than non-
Maori women (21 percent). On the other hand, non-Maori
women had a greater tendency to legitimise a first birth
by marrying than Ma-ori.
The data presented in Table 4.3 establish that there is
a strong correlation between early first birth and non-
marital status at the time of the birth. This is strongest
among non-Ma-ori women: 56 percent of non-Ma-ori
women who had their first birth before the age of 20 did
so outside of marriage, compared with only 17 percent
of women who had their first birth after they had turned
20. Among Ma-ori, a similar, although weaker, pattern
was evident: 69 percent of Ma-ori women who had
their first birth before the age of 20 did so outside of
marriage, compared with 53 percent of those who had
their first birth after they had turned 20. The association
between early first birth and non-marital status at the
time of the birth has grown stronger across successive
birth cohorts. For instance, among women who were
born in the 1960s and who had their first birth before the
age of 20, only 14 percent (of both Ma-ori and non-Ma-ori)
had given birth within marriage. This was down from 54
percent of non-Ma-ori women and 37 percent of Ma-ori
women among the cohort who were born in the 1950s.
Although the data for the most recent birth cohort are
incomplete and sparse, it appears that having first births
(and probably subsequent births) in cohabitation is
gaining momentum for older as well as younger women.
For instance, among non-Ma-ori women born in the
period 1960–1969, 15 percent of those who had their
first birth after they turned 20 did so in cohabitation;
this figure was up from nine percent among those born
during the period 1950–1959. The corresponding figures
for Ma-ori women were 45 percent (for the 1960–1969
birth cohort) and 22 percent (for the 1950–1959
birth cohort).

Tim
ing
of
pare
nth
oo
d a
nd
Bir
th In
terv
al
46
Rai
sin
g C
hil
dre
n in
New
Zea
lan
d
Thus, it is evident that women of more recent birth
cohorts have a higher likelihood of having their first
births (and possibly higher-order births) in cohabitation
or outside any union. This likelihood is substantially
higher for Ma-ori than for non-Ma-ori among women aged
20 or more. It is also clear that, if a first birth occurs in
a woman’s teenage years, then it is several times more
likely to take place outside marriage. In fact, for the
youngest birth cohort (1970–1975), around nine out of 10
non-Ma-ori women who gave birth in their teenage years
were either cohabiting or not in any form of union. For
Ma-ori, the pattern was even more striking: around 19 out
of 20 Ma-ori women who gave birth in their teenage years
were either cohabiting or not in any form of union.
It has been argued in the literature that the childbearing
patterns of women are related to the childbearing
patterns observed among their mothers. More
specifically, it is often posited that the likelihood of
teenage childbearing is strongly correlated with whether
or not the teen’s mother had herself given birth in her
teenage years. We could not test this hypothesis using
the 1995 data. Thus, we collected new information in a
related survey to allow an examination of this issue.4
The results given in Table 4.4 show that, if a mother had
had her first birth in her teenage years, her daughter
was more likely also to have her first birth in her teenage
years. For instance, among women who had given birth,
29 percent of those whose mothers had had a teenage
birth had their own first birth in their teenage years,
compared with 13 percent among those whose mothers
who had had their first birth after they had turned 20.
The figures presented in Table 4.4 confirm this pattern
across all birth cohorts: a woman was about twice as
likely to have her first birth in her teenage years if her
mother had also been a teenage mother than if her
mother had had her first child after she had turned 20.
4c Spacing of Births
In most countries in the developed world, relatively
low priority has been accorded to research on spacing
between births. This is especially the case in New
Zealand. It is important to study this aspect of family
formation, however, because it is directly related not only
to the number of children a woman is likely to have in
her lifetime, but also to the health and wellbeing of both
mother and children.
Past analyses of the fragmentary data available on
spacing of births have shown that New Zealand women
have had relatively short intervals between births,
compared with countries like Canada and the United
States. The proportions of New Zealand women having
a second birth within 24, 36 and 60 months of their first
birth, by calendar period, are given in Table 4.5. Those
who had had their first birth in the late 1950s (ie during
the baby boom) had a second birth sooner than women
who had had their first birth 10 years later. Among women
who had had their first birth in 1955–1959, 57 percent had
a second birth within two years; this percentage declined
to 44 percent among women who had had their first birth
10 years later (1965–1969) and declined further to 26
percent among those having their first birth another 10
years on (1975–1979).
Although the average interval between births has
lengthened in more recent years, it is still marginally
shorter for New Zealand women than for, say, American
women. The changes in birth intervals for New Zealand
women over the course of the 1960s and 1970s were
quite dramatic, as the above figures show. These changes
coincided with, and were largely driven by, the modern
contraceptive revolution, during which the introduction
and spread of hormonal contraceptives gave women
greater control over both timing and spacing of births, as
well as the capacity to limit the total number of births.
4 We undertook a small-scale CATI (Computer-Assisted Telephone Interview) survey to update and extend the 1995 NZWFEE survey for some key variables. This survey included 1,814 women aged 20–64, who were interviewed during August–September 2001. The survey had a response rate of 63 percent, but Ma-ori women and women aged under 30 were under-represented among the respondents. To compensate for this, we derived weights using the 1996 census and applied them to the information extracted from the CATI survey. Because there were some discrepancies in estimates of the same statistics between the 1995 and 2001 surveys, we have not used the 2001 survey data in the report, except to investigate this particular issue, on which no data were available from the 1995 survey.

Timin
g o
f parenth
oo
d an
d B
irth In
terval
47
Raisin
g Ch
ildren
in N
ew Zealan
d
4d Childbearing Intentions of Childless Women
The data presented above indicate that, from the
middle to the end of the twentieth century, decreasing
proportions of women had reached parenthood by any
given age. All the evidence presented here points to
a continuation of this trend. More recent cohorts of
women have delayed having their first child, raising the
possibility that many of them may remain childless by
the time they reach the end of their reproductive span.
The preceding results have shown that, among recent
cohorts of women, increasing proportions remained
childless in their 20s. To estimate the proportion of
women who will remain childless at the end of their
childbearing years, we asked women who had not yet
given birth whether they intended to have children in the
future. The results are given in Table 4.6.
Although over 50 percent of women aged 20–29 were
childless in 1995, a vast majority of them (77 percent)
said that they intended to become parents in the future.
A smaller majority (55 percent) of childless women
in their early 30s also said they intended to become
parents in the future. As the last columns in Table 4.6
show, if women’s stated intentions to have children
in the future were to be realised, between five and
13 percent would remain childless by the end of their
reproductive span. The data point to the conclusion that
most of those who postpone childbearing in their 20s
are likely to catch up in their 30s. Overall, it is estimated
that about 11 percent of women will remain childless at
the end of their reproductive lives, a similar figure to
that among the older cohorts in the study.
4e Summary
The experience of those born in the 1950s shows that
the vast majority of New Zealand women are likely to
become parents by the time they reach the end of their
reproductive lives. However, most women, particularly
non-Ma-ori women, now do so in their late 20s and 30s,
compared with their counterparts in the baby-boom
period when childbearing occurred at somewhat younger
ages. In fact, among the most recent birth cohort for
which we have data, although the peak age range for
childbearing remains 25–29, women are now more likely
to have their first child in their early 30s than in their
early 20s.
Although there are only small differentials between
Ma-ori and non-Ma-ori women in the proportion who
eventually reach parenthood by 40 years of age,
Ma-ori women are much more likely to become
mothers in their teenage years and early 20s than their
non-Ma-ori counterparts. There has also been an
increased tendency for early childbearing to occur
outside of marriage. For the most recent birth cohorts
and time periods, where a woman had her first child
before the age of 20, in an overwhelming majority of
cases the child was born in cohabitation or outside
any form of union, rather than within a traditional
conjugal union. It is also evident that, in all age groups,
having a first birth (and probably subsequent births) in
cohabitation has gained momentum since the 1970s.
During the baby boom, the average interval between
births to New Zealand women was one of the shortest
in the developed world. Although it has widened
recently, the average birth interval in New Zealand is
still shorter than in countries like Canada, the United
States and Australia. The widening of birth intervals was
facilitated by the introduction and spread of hormonal
contraception since the 1960s.
The increased proportion of women who remain childless
in their 20s and early 30s among younger birth cohorts
might be interpreted to mean that more among them may
remain childless as they near the end of their reproductive
span. However, data on their future childbearing intentions
show that only about 11 percent of women are likely to
remain childless if these intentions were to be realised.
This is close to current rates of childlessness among older
cohorts of women in the study.
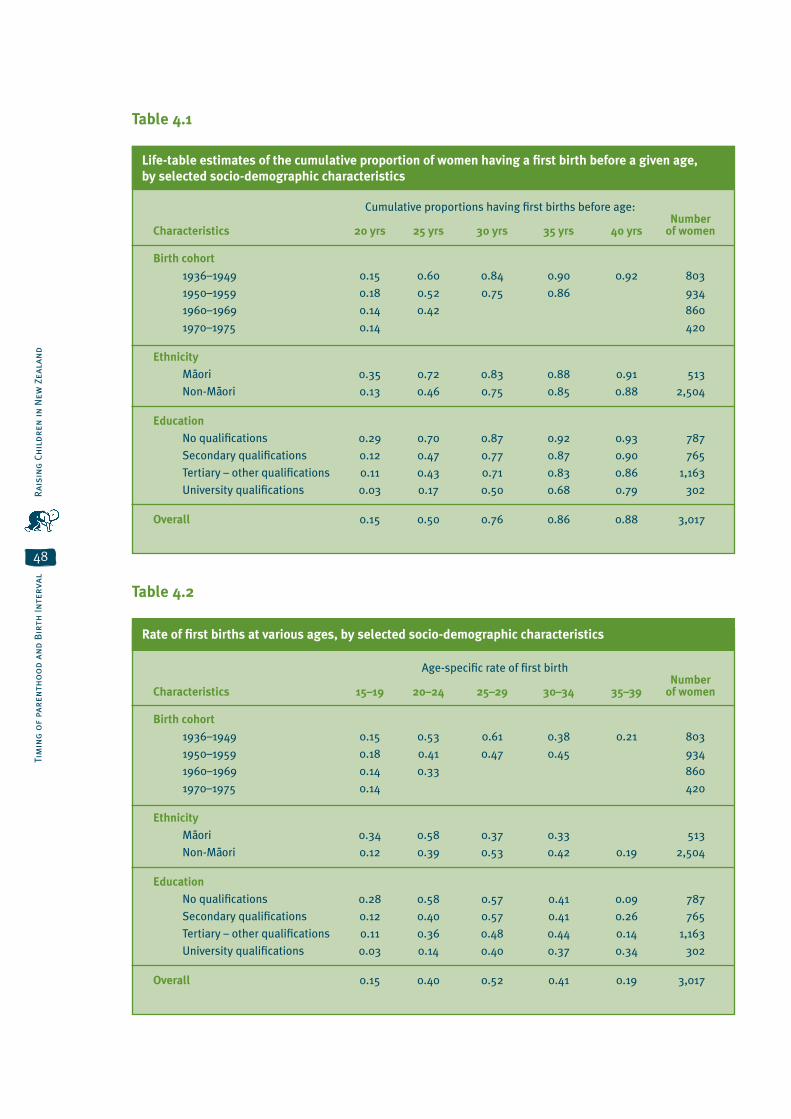
Tim
ing
of
pare
nth
oo
d a
nd
Bir
th In
terv
al
48
Rai
sin
g C
hil
dre
n in
New
Zea
lan
d
Cumulative proportions having fi rst births before age: NumberCharacteristics 20 yrs 25 yrs 30 yrs 35 yrs 40 yrs of women
Birth cohort
1936–1949 0.15 0.60 0.84 0.90 0.92 803
1950–1959 0.18 0.52 0.75 0.86 934
1960–1969 0.14 0.42 860
1970–1975 0.14 420
Ethnicity
Ma-ori 0.35 0.72 0.83 0.88 0.91 513
Non-Ma-ori 0.13 0.46 0.75 0.85 0.88 2,504
Education
No qualifi cations 0.29 0.70 0.87 0.92 0.93 787
Secondary qualifi cations 0.12 0.47 0.77 0.87 0.90 765
Tertiary – other qualifi cations 0.11 0.43 0.71 0.83 0.86 1,163
University qualifi cations 0.03 0.17 0.50 0.68 0.79 302
Overall 0.15 0.50 0.76 0.86 0.88 3,017
Life-table estimates of the cumulative proportion of women having a fi rst birth before a given age,
by selected socio-demographic characteristics
Age-specifi c rate of fi rst birth NumberCharacteristics 15–19 20–24 25–29 30–34 35–39 of women
Birth cohort
1936–1949 0.15 0.53 0.61 0.38 0.21 803
1950–1959 0.18 0.41 0.47 0.45 934
1960–1969 0.14 0.33 860
1970–1975 0.14 420
Ethnicity
Ma-ori 0.34 0.58 0.37 0.33 513
Non-Ma-ori 0.12 0.39 0.53 0.42 0.19 2,504
Education
No qualifi cations 0.28 0.58 0.57 0.41 0.09 787
Secondary qualifi cations 0.12 0.40 0.57 0.41 0.26 765
Tertiary – other qualifi cations 0.11 0.36 0.48 0.44 0.14 1,163
University qualifi cations 0.03 0.14 0.40 0.37 0.34 302
Overall 0.15 0.40 0.52 0.41 0.19 3,017
Rate of fi rst births at various ages, by selected socio-demographic characteristics
Table 4.1
Table 4.2

Timin
g o
f parenth
oo
d an
d B
irth In
terval
49
Raisin
g Ch
ildren
in N
ew Zealan
d
Birth cohort 1936–1949 1950–1959 1960–1969 1970–1975 All
NON-MA-
ORI
Age at fi rst birth < 20 years
Post-maritally conceived 22.5 21.8 3.9 4.5 15.7
Legitimated by marriage 48.0 32.7 10.5 4.5 28.6
Born in cohabitation 5.9 10.0 39.5 50.0 20.8
Born outside any union 23.5 35.5 46.1 40.9 34.9
All (Number of mothers) 100 (100) 100 (112) 100 (70) 100 (40) 100 (322)
Age at fi rst birth ≥ 20years
Post-maritally conceived 83.2 78.0 65.7 74.4
Legitimated by marriage 8.4 7.9 9.8 8.4
Born in cohabitation 1.9 9.0 15.4 9.4
Born outside any union 6.5 5.1 9.1 7.8
All (Number of mothers) 100 (559) 100 (599) 100 (444) – 100 (1657)
MA-
ORI
Age at fi rst birth < 20 years
Post-maritally conceived 22.7 12.5 6.1 4.2 10.4
Legitimated by marriage 63.6 25.0 8.2 0.0 20.7
Born in cohabitation 0.0 27.5 44.9 58.3 34.8
Born outside any union 13.6 35.0 40.8 37.5 34.0
All (Number of mothers) 100 (30) 100 (53) 100 (67) 100 (37) 100 (187)
Age at fi rst birth ≥ 20years
Post-maritally conceived 60.9 51.0 20.0 37.3
Legitimated by marriage 10.9 12.2 9.2 10.2
Born in cohabitation 8.7 22.4 44.6 31.1
Born outside any union 19.6 14.3 26.1 21.5
All (Number of mothers) 100 (53) 100 (67) 100 (89) – 100 (236)
Note: Estimates have not been made for women in the 1970–1975 birth cohort whose fi rst birth was after the age of
20. This is because these women would have been aged only between 20 and 25 at the time of the survey. As the
peak years for childbearing are at older ages than this, the subgroup of women who had already given birth by age
25 constitutes a biased sample of women aged over 20 and thus does not provide a good basis for generating statis-
tics about marital status at fi rst birth among this age group.
Marital status at fi rst birth, by ethnicity, birth cohort and age at fi rst birth (percentages)
Table 4.3

Tim
ing
of
pare
nth
oo
d a
nd
Bir
th In
terv
al
50
Rai
sin
g C
hil
dre
n in
New
Zea
lan
d
Proportion of respondents having their fi rst birth when they were aged: Age group Age at which respondents’ Under 20 years Total Number of respondents mothers had their fi rst birth 20 years and above of women
20–29 years Under 20 years 45.2 54.8 100 73
20 years and above 22.1 77.9 100 104
All 31.6 68.4 100 177
30–39 years Under 20 years 16.5 83.5 100 85
20 years and above 10.7 89.4 100 291
All 12.0 88.0 100 376
40–49 years Under 20 years 33.9 66.1 100 59
20 years and above 13.1 86.9 100 298
All 16.5 83.5 100 357
50–64 years Under 20 years 22.9 77.1 100 48
20 years and above 11.7 88.3 100 317
All 13.2 86.8 100 365
All ages Under 20 years 29.4 70.6 100 265
20 years and above 12.9 87.1 100 1,010
All 16.3 83.9 100 1,275
Note: In contrast to all other tables in the report, this table is not sourced from the NZWFEE survey, but was based
on a subsequent survey carried out in 2001. See footnote 4 for an account of this survey.
Age at fi rst birth of survey respondents by the age at which their mothers had their fi rst child,
classifi ed by age of respondents at the time of the survey
Months since fi rst birth
Period of fi rst birth 24 months 36 months 60 months
1955–1959 57.3 80.2 88.4
1960–1964 47.7 76.5 88.1
1965–1969 44.1 69.9 82.4
1970–1974 32.3 60.7 80.8
1975–1979 26.1 55.4 75.6
1980–1984 27.4 55.6 74.9
1985–1989 24.7 53.9 75.0
1990–1994 27.4
Cumulative percentage of women having a second birth within 24, 36 and 60 months, by period
Table 4.4
Table 4.5

Timin
g o
f parenth
oo
d an
d B
irth In
terval
51
Raisin
g Ch
ildren
in N
ew Zealan
d
Number of Yes No Don’t know childless Total number Expected proportions women of women childlessAge group (1) (2)(N) (3)(N) (4) (5) (6)1 (7)2
20–24 81.4 10.3(30) 8.2(24) 291 403 7.4 13.4
25–29 70.2 21.6(37) 8.2(14) 171 420 8.8 12.1
30–34 54.5 31.3(31) 14.1(14) 99 454 6.8 9.9
35–39 32.0 50.0(25) 18.0(9) 50 440 5.7 7.7
Note: In contrast to practice elsewhere in the report, the Ns given here are weighted numbers, rather than unweight-
ed. This is to ensure that the computations, which were based on weighted fi gures, are fully transparent.
1. Number of women who do not intend to have children (col. 2) =col (6)
Total number of women (col. 5)
2. Number of women who do not intend (col. 2) plus don’t know (col. 3) = col (7)
Total number of women (col. 5)
Proportion of women childless at the time of the survey who intended to have chidren in the future,
by age group
Table 4.6

Tim
ing
of
pare
nth
oo
d a
nd
Bir
th In
terv
al
52
Rai
sin
g C
hil
dre
n in
New
Zea
lan
d

Sole Parenthood
5

So
le p
aren
tho
od
54
Rai
sin
g C
hil
dre
n in
New
Zea
lan
d
n important consequence of changes in union formation and dissolution in New Zealand
since the 1960s is the increased prevalence of sole parenthood. Earlier chapters have shown
that cohabitation, separation from first marriages and ex-marital childbearing have all
increased substantially over the past 30 years or so. In this chapter, we look at the major implication of
these changes for mothers and children: an increased propensity for mothers to be sole parents and for
children to be living in a sole-parent family or household. The links between marriage breakdown and
sole parenthood and between ex-marital childbearing and sole parenthood are clear enough. But the
increased prevalence of cohabitation also makes a contribution to the growth of sole parenthood when
such relationships dissolve. There is also evidence to suggest that such relationships are less stable
than marriage and more likely to lead to sole parenthood. Again, as in the earlier chapters, we use both
life-table measures and multivariate analysis.
A
5a Sole Parenthood: Experience among Mothers
Incidence of sole parenthood
This section examines the incidence of sole parenthood
among New Zealand women who have ever given birth
to a child. It is important to note that the analysis
focuses on women who are mothers rather than the full
sample of women. Thus, estimates of the likelihood of
sole parenthood and the factors that influence this apply
not to women generally but only to women once they
have given birth.
Life-table estimates of the cumulative proportions of
mothers who had ever spent any time as a sole parent
before varying ages are presented in Table 5.1. Before
reaching the age of 25, about one in five mothers
(19 percent) had spent some time as a sole parent.
About two in five mothers (39 percent) had been a sole
parent by the time they reached 40 years of age, and
close to one in two mothers (46 percent) had been a sole
parent by the time they reached 50 years of age.
The life-table estimates given in Table 5.1 show that
there is a strong relationship between birth cohort and
the likelihood of becoming a sole mother. In general, the
younger the birth cohort to which a mother belonged,
the more likely she was to spend some time as a sole
parent before any given age. In fact, among the youngest
cohort of women (those born during the period 1970–
1975), over one in five mothers (21 percent) had spent
some time as a sole parent before the age of 20. This
figure had increased from 10 percent among women born
in the period 1960–1969. These birth cohort differentials
persisted at ages 25 and 30. This association was
confirmed by the multivariate analysis (Table 5.2). For
instance, mothers born during the 1970–1975 period
were about two-and-a-half times more likely to have
spent some time as a sole parent than those born prior
to 1960.
Although the bivariate life-table estimates given in Table
5.1 show that a much higher proportion of Ma-ori mothers
than non-Ma-ori mothers had spent some time as a
sole parent at all ages, the multivariate results given in
Table 5.2 show no ethnicity effect. This indicates that
the apparent differences between Ma-ori and non-Ma-ori
mothers in the likelihood of becoming a sole parent are
explained by other differences between Ma-ori and non-
Ma-ori women. When the effects of all other variables are
statistically controlled for, ethnicity is not a significant
determinant of the propensity for mothers to become
sole parents.
The level of mothers’ educational qualifications is
another important covariate of sole parenthood at the
bivariate level (Table 5.1). Those with no qualifications
were more likely to become sole parents than those
with some form of educational qualification. But the
multivariate analysis showed a more restricted pattern
of associations (Table 5.2). The main difference was
that mothers with a secondary qualification were
less likely to become sole parents than those with no
qualifications. There was also a difference between
those with “other” tertiary qualifications and those with
no qualifications at a more marginal level of significance.
Those with university qualifications, however, were
no less likely to become a sole parent than those with

So
le Parenth
oo
d
55
Raisin
g Ch
ildren
in N
ew Zealan
d
no qualifications. While it is difficult to know how this
pattern of results can be interpreted, it is evident that
the educational qualifications of mothers, like their
ethnicity, were not a strong determinant of the likelihood
of becoming a sole parent.
An important finding is the strong relationship between
the partnership status of a mother at the time of the
birth of her last child and her likelihood of becoming a
sole parent. Women who had had their last child
in a cohabiting relationship were much more likely to
become sole parents than those who had had their last
child in a marriage. For example, only three percent
of those who had had their last child in a marriage
had become sole parents before reaching the age of
25, compared with 38 percent among those who had
had their last child in cohabitation. The corresponding
proportions who had become sole parents before
30 years of age were nine percent and 57 percent
respectively. These results support our earlier
speculation that cohabitational relationships may be
less stable than marriages.
In the multivariate analysis, we included a number of
time-varying variables that could not be used in the
life-table analysis: age; calendar period; occupation;
number of co-residing children; and age of the youngest
co-residing child.
It can be observed from the multivariate results
presented in Table 5.2 that there was no significant
association between calendar period and the likelihood
of becoming a sole mother. But, as pointed out earlier,
there was an association with birth cohort: mothers in
younger birth cohorts were more likely to become sole
parents. There was also a negative relationship between
a mother’s age and her likelihood of becoming a sole
parent: the older a mother was, the less likely it was
that she would become a sole parent. The likelihood
of becoming a sole parent was highest in the teenage
years. Mothers aged under 20 were over four times as
likely to become sole parents as those aged 20–24,
while mothers in their 30s were only about a third as
likely as those aged 20–24 to become sole parents.
The age of the youngest co-residing child was not an
important influence on the likelihood of becoming a
sole parent. But the number of co-residing children did
have a significant influence on this likelihood: mothers
with two or more co-residing children were only about
a third as likely as those with one co-residing child to
become sole parents. The higher likelihood of mothers
with one child becoming sole parents is likely to be
due to the fact that a significant number of sole-parent
families result from births to non-partnered women. It
is important to remain aware that there are different
pathways into sole parenthood, one of which is via the
birth of a child outside a partnership.
The occupation of mothers was also included as a
time-varying covariate in the multivariate model: this
allowed the occupational status of a mother to change
with each year of her age. The results of the analysis
were quite unclear, however. There was some difference
between mothers not in paid work and those with a
semi-professional or non-professional job; however,
these ran in different directions. Compared with mothers
who were not in paid work, mothers in non-professional
jobs were about 25 percent less likely to become sole
parents, while those in semi-professional jobs were
about 25 percent more likely to become sole parents.
On the other hand, there was no discernible difference
between mothers in professional occupations and those
who were not in paid work. Overall, it is difficult to offer
any straightforward interpretation of these results. They
do suggest, however, that occupation was not a strong
determinant of the probability of becoming a sole parent.
Duration of sole parenthood
It is clear from the above evidence that the incidence of
sole parenthood has been increasing since the 1960s.
Another issue of considerable interest is how long
mothers remain sole parents and whether there have
been any changes in the duration of sole parenthood
over time. How long a woman remains a sole mother
depends on her chances of entering another union and
on when the last dependent child leaves home. Life-
table estimates of the cumulative proportions of women
who had ceased to be a sole mother within varying
durations of time are given in Table 5.3. Within a year of
becoming a sole mother, about a quarter had ceased to
be a sole mother, either because they had repartnered or
because they no longer had co-residing children. Within
five years, a majority (60 percent) had ceased being sole
mothers. By the time 10 years had passed, less than a
quarter were still sole mothers.
The multivariate results are given in Table 5.4. The table
models the propensity to cease being a sole mother as

So
le p
aren
tho
od
56
Rai
sin
g C
hil
dre
n in
New
Zea
lan
d
a function of a number of factors. Time-varying factors
included in the analysis are: age; calendar period; age
of the youngest co-residing child; number of co-residing
children; occupation; and duration of sole parenthood. It
is interesting that there were no clear differentials in the
propensity to cease being a sole mother by birth cohort,
calendar period, ethnicity, educational qualifications
or number of co-residing children. The propensity to
exit from sole parenthood was greater if a woman was
younger, held a professional or semi-professional job,
had been a sole parent for a shorter duration or had no
co-residing children aged under 15.
The probability of exiting from sole parenthood was
highest for mothers aged under 20. Sole mothers of
this age were nearly twice as likely to exit from sole
parenthood as those aged 20–24. Conversely, sole
mothers aged over 40 were only 25 percent as likely as
those aged 20–24 to exit from sole parenthood. Sole
mothers with a professional job were about 60 percent
more likely (and semi-professional women about 40
percent more likely) to leave sole parenthood than those
who were not working. Sole mothers were about three-
and-a-half times more likely to exit from sole parenthood
within the first two years than after 10 years of sole
parenthood. And sole mothers with no children aged
younger than 15 were twice as likely to exit from sole
parenthood as those with younger children. This last
result is not unexpected, given that older children are
closer to the age of leaving home.
In summary, a majority of sole mothers either repartner
or no longer have co-residing children within five years
of becoming a sole parent. Younger sole mothers, those
in professional jobs and those with no children aged
under 15 were more likely to exit from sole parenthood.
Interestingly, there were no major differences in the
propensity to exit from sole parenthood between
Ma-ori and non-Ma-ori mothers, between those with
different levels of educational qualifications or between
those born at different times. Nor did calendar period
have any association with the propensity to exit from
sole parenthood. This indicates that there has been no
change in the duration of sole parenthood over time.
Entering employment after becoming a sole parent
The living standards and wellbeing of sole parents and
their dependent children depend to some degree on
whether the sole parent is engaged in paid employment
at the time of, and after, becoming a sole parent. In
Table 5.5, we provide data on the employment status
of women at the time they became a sole parent. A
majority of sole mothers (59 percent) were not in paid
employment at the time they became a sole parent.
Moreover, the proportion of sole mothers who were not
working was higher among those with lower educational
qualifications, among Ma-ori and among those from
younger birth cohorts.
Two-thirds of mothers with no educational qualifications
(67 percent) were not working when they became a
sole parent, a substantially higher proportion than
among those with a university degree (43 percent).
Moreover, a higher proportion of Ma-ori (65 percent)
than non-Ma-ori sole mothers (58 percent) were not in
paid employment at the time they became a sole parent.
Although information on this is not provided in the table,
there was also an interaction between occupation and
ethnicity: among those in paid employment when they
became a sole parent, non-Ma-ori sole mothers were
more likely to hold professional or semi-professional
jobs than Ma-ori sole mothers. In contrast, Ma-ori sole
mothers were more likely to be in non-professional jobs.
Life-table estimates of the cumulative proportion of
sole mothers who had entered employment by different
durations of sole parenthood are given in Table 5.6. The
table includes only those sole mothers who were not
working at the time they became a sole parent. In the
first two years after becoming a sole mother, 21 percent
of those who were not working when they became a
sole mother started working in paid employment. This
proportion increased to 64 percent by the time 10 years
had elapsed.
Two-thirds of non-Ma-ori mothers had entered into
employment within 10 years, compared with just over
half of Ma-ori mothers. However, when the effects of
other variables were statistically controlled for in the
multivariate analysis (Table 5.7), the ethnic differential
disappeared: Ma-ori and non-Ma-ori sole mothers were
equally likely to have entered paid work within 10 years.
The bivariate analysis shows that women who had
a pre-school child when they became a sole parent
were much less likely to work than those with older
children (Table 5.6). This is as would be expected. The
differential diminished over time and had disappeared
after 10 years. Again, this is a pattern that would be
So
le Parenth
oo
d
57
Raisin
g Ch
ildren
in N
ew Zealan
d
expected. The results from the multivariate analysis give
a more ambiguous picture, however. Sole mothers with
a youngest child aged five to nine were significantly
more likely to enter employment than those with a pre-
school child. However, those with older children were
no more likely to enter employment than those with pre-
school children. It is unclear how these findings should
be interpreted, since mothers with older children would
be expected to be more likely to work. Interestingly,
the number of co-residing children had no effect on the
propensity to enter the workforce.
Educational qualifications and prior work experience
were the major socio-demographic correlates of entry to
paid employment after becoming a sole mother (Table
5.7). Of these two factors, educational qualifications
had a stronger effect: the higher the educational
qualification, the greater the likelihood of entering paid
work. In particular, those with a university degree were
over three times more likely to enter paid employment
than those with no educational qualifications. Similarly,
compared with those with no prior work experience,
those with between two and five years of prior work
experience were 75 percent more likely to enter
employment, and those with more than five years of
prior work experience were about twice as likely to enter
employment. Although this effect was statistically weak
(and was significant only at the p ≤ 0.10 level), it is in the
expected direction: women with prior work experience
had an increased propensity to enter employment.
5b Sole Parenthood: Experience among Children
Children who have ever lived with sole mothers
There were a total of 6,276 births to the women
participants in the NZWFEE survey. Twenty percent of
these births were to Ma-ori women and the rest were to
non-Ma-ori women. All the children were born between
1953 and 1995. About one in 10 of these births were
to women who were not in any form of union. The rate
of such births was higher for Ma-ori mothers than for
non-Ma-ori mothers: about 17 percent of the births
to Ma-ori women occurred outside any form of union,
compared with seven percent among non-Ma-ori women.
As was noted in Chapter 4, such births have become
increasingly common among more recent cohorts of
women, especially where the mother was young.
Around one in eight of the children were born in
cohabitation and, again, the rate was higher among
Ma-ori women than among non-Ma-ori women. While 27
percent of the children of Ma-ori women were born in
cohabitation, the corresponding figure for non-Ma-ori
women was eight percent. As a result of the higher
propensity for Ma-ori women to give birth in cohabitation
or outside any form of relationship, only 56 percent of
all children born to Ma-ori women in the sample were to
those in married unions. The corresponding figure for
non-Ma-ori women was 85 percent.
Thus, a significant number of births, particularly those
since the 1960s and those to Ma-ori women, have been
to sole mothers. Life-table estimates of the cumulative
proportion of children who had spent some time living
with a sole mother are given in Table 5.8. A fifth of
children had lived with a sole mother before reaching
their fifth birthday, and more than a third (37 percent)
had lived with a sole mother before they turned 17 years
of age. There was no difference between male and female
children in the likelihood of living with a sole mother.
These life-table estimates show that having
Ma-ori ethnicity substantially increased the propensity for
a child to live with a sole mother, compared with “Other”
children (who had neither Ma-ori nor Pacific ethnicity).
Pacific children had a similarly elevated propensity to
live with a sole mother. Thus, while 36 percent of Ma-ori
children and 39 percent of Pacific children had lived with
a sole mother before reaching five years of age, only 15
percent of “Other” children had done so. Before they
reached their 17th birthday, 56 percent of Ma-ori children,
49 percent of Pacific children and 31 percent of “Other”
children had lived with a sole mother at some point in
their lives. On average, Ma-ori and Pacific children were
more than twice as likely to live with a sole mother
during the early years of childhood than their “Other”
counterparts (see Table 5.8), although the differentials
tended to reduce as the children aged.
In terms of birth cohort, there has been a continuous
increase since the 1960s in the proportion of children
who had ever lived with a sole parent. For instance,
among children born during the 1950s and 1960s, 12
percent had lived with a sole mother before their fifth
birthday; this increased to 23 percent among those born
in the 1980s. Among children born during the period
1990–1995, nearly 20 percent had lived with a sole

So
le p
aren
tho
od
58
Rai
sin
g C
hil
dre
n in
New
Zea
lan
d
mother in their first year of life alone. The multivariate
results presented in Table 5.9 show that children
born during the period 1990–1995 were about seven
times more likely to live with a sole mother than those
born prior to 1970. The likelihood of living with a sole
mother was highest in the first five years of a child’s
life. Children aged under five were about twice as likely
to live with a sole mother as children of older ages.
Children of Ma-ori and Pacific ethnicity were, respectively,
75 and 91 percent more likely to spend some time living
with a sole mother than “Other” children.
The probability that a child would spend some time
living in a sole-mother family was also strongly
influenced by the age of the mother at the birth of the
child. Children born to mothers aged under 20 were
about two-and-a-half times more likely to spend some
time living in a sole-mother family than children born to
mothers aged 20–24. The risk of living in a sole-mother
family continued to fall with increasing age of the
mother. Among children born to a mother aged under 20,
the chances that they would spend some time living in
a sole-mother family were about four times higher than
among children born to a mother aged 25–29, about five
times higher than among children born to a mother aged
30–34 and about six times higher than among children
born to a mother aged 35–39.
Mothers’ education and occupation were also associated
with the probability that children would spend at least
some time living in a sole-mother family, although the
patterns were not straightforward and are somewhat
difficult to interpret. Children whose mothers had a
secondary qualification, or a tertiary qualification other
than a university degree, were less likely to spend time
living in a sole-mother family than those whose mothers
had no qualifications. However, children whose mothers
were university-qualified were not less likely than those
with no qualifications to spend time in a sole-mother
family. And while children whose mothers were working
in non-professional jobs were less likely to spend time in
a sole-mother family than those with mothers in any of
the other occupational groups, there was no difference
between children of mothers in professional or semi-
professional jobs, on the one hand, and those whose
mothers were not working, on the other. As was noted
above, it is difficult to see any clear pattern in these
findings. Like the results presented earlier in section
5a Sole Parenthood: Experience among Mothers, they
suggest that the education and occupation of mothers
did not strongly influence children’s chances of living in
a sole-parent family.
Duration of stay in sole-mother families
The length of time a child spends living with a sole
mother depends on whether and when the mother
repartners and when the child leaves home. Life-table
estimates of the cumulative proportions of children
who were no longer living with a sole mother (either
because they had left the sole mother’s care or
because the sole mother had repartnered) by duration
of stay are given in Table 5.10. Where children had left
the sole mother’s care, it is not known whether they had
left to live with their father, to live with other kin or to
live independently.
Among all the children who had ever lived with a sole
mother, three out of five lived in this situation for less
than five years. About a quarter lived with a sole mother
for a year or less, while another quarter lived with a sole
mother for 10 years or more. Although Ma-ori children
were more likely to have spent some time living with
a sole mother than their non-Ma-ori counterparts (as
earlier results have shown), there were no significant
ethnic differences in the duration of stay with a sole
mother. Nor were there any significant differences by the
gender of the children.
In the bivariate results given in Table 5.10, there were
birth cohort differentials in the duration of stay in
sole-mother families. For example, around a third
(34 percent) of children born between 1990 and 1995
had lived with a sole mother for less than one year,
compared with around a fifth (19 percent) of children
born before 1970. But the multivariate results in Table
5.11 show that there was no relationship between the
birth cohort of a child and propensity for the spell in the
sole-mother family to end. However, there was a strong
association between duration of stay and calendar
period. For children living with sole mothers in the 1980s
and 1990s, the spell in the sole-mother family was only
around half as likely to end as among their counterparts
in the 1960s. This indicates that children are now staying
longer in sole-parent families than in earlier decades.
The multivariate results also confirm the bivariate-level
observations that there were no differences in duration
of stay by gender or ethnicity.

So
le Parenth
oo
d
59
Raisin
g Ch
ildren
in N
ew Zealan
d
While there were no differentials by educational
qualifications of mothers, there were differentials by
age of the child and by occupation of mothers. The
association with age was a complex one. For instance,
among children aged 15 or over, the spell in a sole-
mother family was more likely to end than among
children aged under 15. This result is as would be
expected, both because older children are closer to
the point of leaving home and because mothers of
older children are more likely to repartner. However,
among children aged between 10 and 14, the spell in a
sole-mother family was less likely to end than among
children aged 0–4, which is not so readily interpretable.
The association with mothers’ occupation was more
straightforward. A child’s spell in a sole-mother family
was more likely to end if the child’s mother had a
professional job (by 50 percent) or a semi-professional
job (by 28 percent) than if the mother was not working.
This result is consistent with the earlier finding that
professional women were more likely to repartner than
women not in work (see Table 3.6).
The strongest covariate of the termination of a child’s
spell in a sole-mother family was duration of stay in the
family. As time passed, a child’s spell in a sole-mother
family became progressively less likely to end. The
chances that the spell would end were nearly three
times as high during the first two years than after four
years had passed. This result might be regarded as
contrary to general expectation, since one might expect
children to be more likely to leave home as time passes
and as they move closer to an age at which they can
live independently. However, this maturation effect
is overshadowed by the strong influence of duration
since separation on a woman’s chances of repartnering
(see Table 3.6): as the time since separation increased,
women’s chances of repartnering diminished markedly.
5c Summary
In this chapter, we have explored sole parenthood from
the perspective of both the mothers and the children.
Nearly half of all mothers had spent some time as a sole
parent by the age of 50. Before reaching their
25th birthday, one in five mothers had spent some time
as a sole parent. Birth cohort and current age were
important covariates of the probability of becoming a
sole parent. Teen mothers and mothers from more recent
birth cohorts were more likely to have spent time as a
sole parent than older mothers and mothers from
earlier cohorts.
While the age of the youngest co-residing child was
not a strong covariate of the probability of becoming a
sole mother, the number of live births was. In particular,
those with just one co-residing child were more likely
than those with several co-residing children to have
spent some time as a sole mother. A number of these
single-child sole-parent families would have resulted
from births to non-partnered women. This reinforces the
importance of remaining aware that there are different
pathways into sole parenthood, one of which is via
the birth of a child outside a partnership. Overall, the
pattern of results seems to suggest that, as pathways
into sole parenthood, having children outside any union
and having children in cohabitation may be becoming
as important as separation from marriage. In fact,
having a birth in cohabitation increases the risk of sole
parenthood by several times compared with having a
birth within marriage.
Once a woman had become a sole parent, how long she
stayed in that status did not depend on birth cohort,
ethnicity, education or number of co-residing children.
But younger sole mothers, those who had just become
sole mothers (in particular, those who had been a
sole mother for less than two years) and those with
professional or semi-professional jobs were more likely
to exit from sole parenthood – either by repartnering
or by no longer having a co-residing child living with
them – than their counterparts (older sole mothers, sole
mothers of longer duration, and non-professional or
non-working sole mothers).
Three in five sole mothers were not working at the
time they became a sole parent. How likely they were
to move into the paid workforce, and how quickly this
was likely to happen, depended on their educational
qualifications and prior work experience. In general,
women with higher levels of education, especially those
with university qualifications, were more likely to enter
the paid workforce than those with less education.
Work experience also played a role, although the effect
was weaker. If a woman had more than two years’
work experience prior to becoming a sole mother, this
increased her chances of entering the paid workforce.
About a fifth of all children born to women in the survey
had spent some time living with a sole mother before

So
le p
aren
tho
od
60
Rai
sin
g C
hil
dre
n in
New
Zea
lan
d
their fifth birthday. By the time they reached 17 years
of age, this had increased to just under two-fifths of all
children. Since the 1960s, there has been a continuous
increase in the proportion of children who have spent
some time in a sole-mother family. Children were more
likely to have spent some time living with a sole mother
if the mother had given birth in her teens or if they were
of Ma-ori or Pacific ethnicity. The likelihood of living in a
sole-mother family was highest during the early years
of childhood.
Among children who had ever lived with a sole mother,
60 percent spent less than five years living in that
situation. A child’s spell in a sole-mother family was
most likely to end within the first two years; after that,
the chances that the spell would end progressively
diminished. This is primarily due to the mother’s
declining chances of repartnering as the duration of
sole parenthood lengthened. There were no significant
differentials in duration of stay in a sole-mother family
by the ethnicity or gender of the children. However,
children’s durations of stay in sole-mother families have
lengthened in recent decades.
Cumulative proportions becoming sole parents before age: Number ofCharacteristics 20 yrs 25 yrs 30 yrs 35 yrs 40 yrs 50 yrs mothers
Birth cohort
1936–1949 0.04 0.09 0.15 0.21 0.27 736
1950–1959 0.08 0.15 0.21 0.28 830
1960–1969 0.10 0.25 667
1970–1975 0.21 158
Ethnicity
Ma-ori 0.18 0.39 0.50 0.54 0.57 0.65 420
Non-Ma-ori 0.07 0.16 0.23 0.30 0.36 0.43 1,971
Partnership status when the last child was born
Marriage 0.01 0.03 0.09 0.16 0.23 0.32 1,792
Cohabitation 0.09 0.38 0.57 0.69 0.76 0.82 265
No partnership 0.50 0.88 0.96 0.98 1.00 – 334
Education
No qualifi cations 0.14 0.27 0.34 0.40 0.47 0.55 716
Secondary qualifi cations 0.06 0.15 0.24 0.31 0.35 0.41 589
Tertiary – other qualifi cations 0.06 0.16 0.23 0.30 0.35 0.44 905
University qualifi cations 0.04 0.08 0.14 0.18 0.31 0.34 181
Overall 0.08 0.19 0.26 0.33 0.39 0.46 2,391
Life-table estimates of the cumulative proportion of mothers becoming sole parents before a given
age, by selected socio-demographic characteristics
Table 5.1

So
le Parenth
oo
d
61
Raisin
g Ch
ildren
in N
ew Zealan
d
Covariates Incidence Rate Ratio Z-Statistic
Birth cohort Before 1950R 1.00 –
1950–1959 1.07 0.51
1960–1969 1.66 2.53 **
1970–1975 2.57 3.05 **
Calendar period (tv) Before 1980R 1.00 –
1980–1989 0.90 0.81
1990–1995 1.03 0.17
Age of woman (tv) Under 20 years 4.33 10.17 **
20–24 yearsR 1.00 –
25–29 years 0.44 6.61 **
30–34 years 0.35 6.47 **
35–39 years 0.34 5.20 **
40+ years 0.19 5.38 **
Ethnicity Ma-oriR 1.00 –
Non-Ma-ori 0.94 0.56
Age of youngest co-residing child (tv) 0–4 yearsR 1.00 –
5–9 years 1.07 0.45
10–14 years 1.39 1.62
15+ years 1.01 0.06
Number of co-residing children (tv) 1R 1.00 –
2 0.36 10.87 **
3+ 0.35 9.02 **
Education No qualifi cationsR 1.00 –
Secondary qualifi cations 0.80 2.25 **
Tertiary – other qualifi cations 0.85 1.71 *
University qualifi cations 0.87 0.81
Occupation (tv) Professional 1.14 1.02
Semi-professional 1.26 2.21 **
Non-professional 0.76 1.90 **
Not workingR 1.00 –
Log likelihood = 4370 tv = time-varying covariate ** = p ≤ 0.05
χ2 (df = 22) = 1124 R = reference category * = p ≤ 0.10
Table 5.2
Multivariate hazards model estimates of the effects of socio-demographic covariates on the
propensity of a mother to become a sole parent

So
le p
aren
tho
od
62
Rai
sin
g C
hil
dre
n in
New
Zea
lan
d
Cumulative proportion who had ceased to be a sole mother by duration of sole parenthood Number ofCharacteristics < 1 yr < 2 yrs < 5 yrs < 10 yrs sole mothers
Birth cohort
1936–1949 0.23 0.33 0.60 0.77 268
1950–1959 0.26 0.39 0.61 0.80 299
1960–1969 0.22 0.38 0.59 261
1970–1975 0.31 0.41 91
Ethnicity
Ma-ori 0.27 0.38 0.63 0.78 228
Non-Ma-ori 0.24 0.37 0.60 0.78 691
Education
No qualifi cations 0.26 0.39 0.62 0.77 346
Secondary qualifi cations 0.29 0.42 0.65 0.82 199
Tertiary – other qualifi cations 0.19 0.32 0.56 0.76 325
University qualifi cations 0.11 0.21 0.48 0.74 49
Occupation at becoming sole parent
Professional 0.23 0.38 0.61 0.80 113
Semi-professional 0.29 0.41 0.69 0.86 184
Non-professional 0.19 0.28 0.53 0.77 80
Not working 0.24 0.38 0.59 0.75 534
Age of youngest child when became sole parent
Under 5 years 0.26 0.40 0.62 0.79 701
5–9 years 0.17 0.25 0.60 0.73 104
10–14 years 0.11 0.21 0.50 0.79 77
15+ years 0.28 0.35 0.58 0.74 37
Age at becoming sole parent
Under 20 years 0.48 0.63 0.78 0.90 204
20–24 years 0.23 0.42 0.65 0.83 240
25–29 years 0.18 0.25 0.60 0.78 169
30–34 years 0.19 0.19 0.43 0.63 134
35–39 years 0.18 0.28 0.53 0.69 96
40+ years 0.11 0.21 0.36 0.64 76
Number of co-residing children when became sole parent
1 0.31 0.46 0.65 0.84 534
2 0.16 0.26 0.59 0.72 233
3+ 0.13 0.22 0.45 0.64 152
Overall 0.24 0.37 0.60 0.78 919
Life-table estimates of the cumulative proportion who had ceased to be a sole mother by given
durations of sole parenthood, by selected socio-demographic characteristics
Table 5.3

So
le Parenth
oo
d
63
Raisin
g Ch
ildren
in N
ew Zealan
d
Covariates Incidence Rate Ratio Z-Statistic
Birth cohort Before 1950R 1.00 –
1950–1959 0.89 0.81
1960–1969 0.67 1.89 *
1970–1975 0.61 1.50
Calendar period (tv) Before 1980R 1.00 –
1980–1989 1.04 0.26
1990–1995 0.98 0.11
Age of woman (tv) Under 20 years 1.91 4.38 **
20–24 yearsR 1.00 –
25–29 years 0.71 2.14 **
30–34 years 0.51 3.41 **
35–39 years 0.38 3.78 **
40+ years 0.25 3.86 **
Ethnicity Ma-oriR 1.00 –
Non-Ma-ori 1.11 1.05
Age of youngest co-residing child (tv) 0–4 yearsR 1.00 –
5–9 years 1.04 0.26
10–14 years 1.24 0.99
15+ years 2.19 2.95 **
Number of co-residing children (tv) 1R 1.00 –
2 0.90 0.88
3+ 1.00 0.03
Education No qualifi cationsR 1.00 –
Secondary qualifi cations 1.23 1.86 *
Tertiary – other qualifi cations 0.95 0.55
University qualifi cations 0.71 1.53
Occupation (tv) Professional 1.59 3.22 **
Semi-professional 1.43 3.15 **
Non-professional 0.95 0.31
Not workingR 1.00 –
Duration of sole parenthood Under 2 years 3.50 6.08 **
at exposure (tv) 2–3 years 1.40 1.57
3–5 years 1.43 1.78 *
5–10 years 1.31 1.32
10+ yearsR 1.00 –
Log likelihood = 2273 tv = time-varying covariate ** = p ≤ 0.05
χ2 (df = 26) = 339 R = reference category * = p ≤ 0.10
Table 5.4
Multivariate hazards model estimates of the effects of socio-demographic covariates on the
propensity to cease being a sole mother (due to repartnering or no longer having a co-residing child)

So
le p
aren
tho
od
64
Rai
sin
g C
hil
dre
n in
New
Zea
lan
d
Professional Semi- Non- Not Total Number of professional professional working sole mothers
Education
No qualifi cation 3.1 18.1 12.2 66.7 100.0 346
Secondary qualifi cation 8.3 27.0 7.1 57.5 100.0 199
Tertiary – other qualifi cation 22.3 20.4 6.2 51.2 100.0 324
University qualifi cation 35.7 19.0 2.4 42.9 100.0 49
Total 10.9 21.3 8.8 59.0 100.0 918
Birth Cohort
1936–1949 17.4 27.8 11.6 43.3 100.0 267
1950–1959 14.1 21.4 9.5 55.0 100.0 299
1960–1969 4.7 17.1 6.2 72.0 100.0 261
1970–1975 0.0 13.8 5.7 80.5 100.0 91
Total 10.9 21.3 8.8 59.0 100.0 918
Ethnicity
Ma-ori 2.9 17.5 14.6 64.9 100.0 228
Non-Ma-ori 12.8 22.3 7.2 57.6 100.0 690
Total 10.9 21.4 8.7 59.0 100.0 918
Employment status at the time of becoming a sole parent, by selected socio-demographic
characteristics (percentages)
Table 5.5
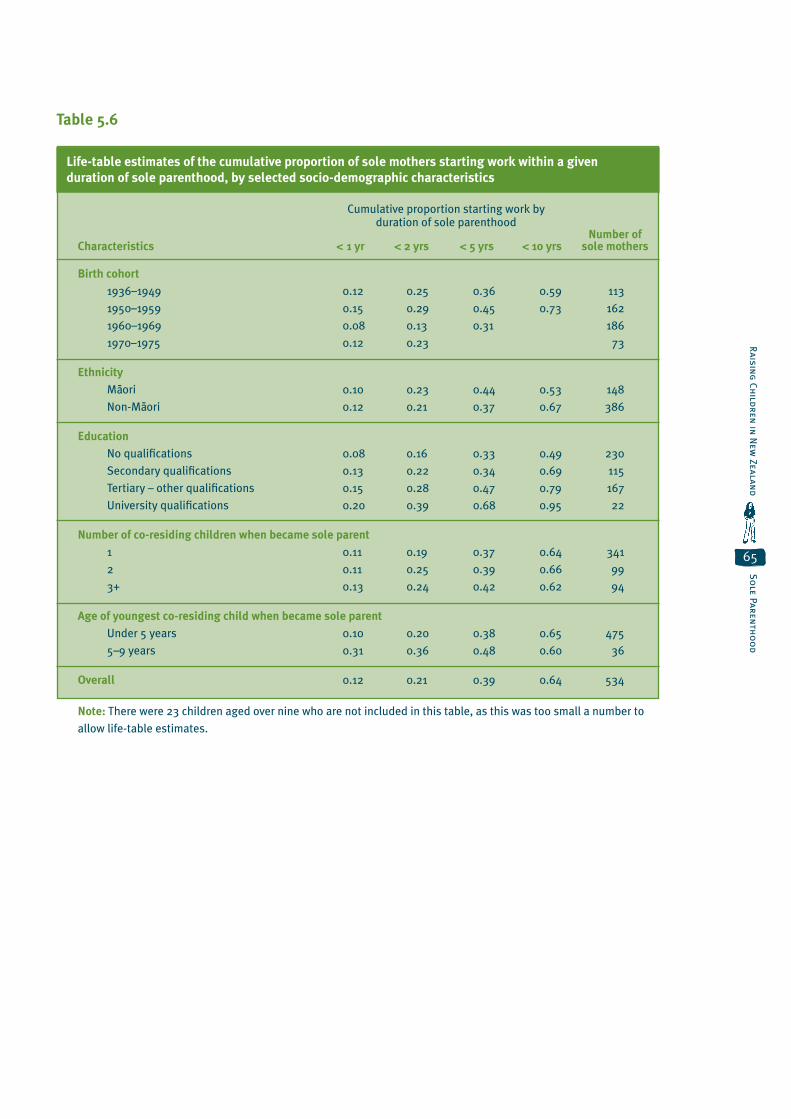
So
le Parenth
oo
d
65
Raisin
g Ch
ildren
in N
ew Zealan
d
Cumulative proportion starting work by duration of sole parenthood Number ofCharacteristics < 1 yr < 2 yrs < 5 yrs < 10 yrs sole mothers
Birth cohort
1936–1949 0.12 0.25 0.36 0.59 113
1950–1959 0.15 0.29 0.45 0.73 162
1960–1969 0.08 0.13 0.31 186
1970–1975 0.12 0.23 73
Ethnicity
Ma-ori 0.10 0.23 0.44 0.53 148
Non-Ma-ori 0.12 0.21 0.37 0.67 386
Education
No qualifi cations 0.08 0.16 0.33 0.49 230
Secondary qualifi cations 0.13 0.22 0.34 0.69 115
Tertiary – other qualifi cations 0.15 0.28 0.47 0.79 167
University qualifi cations 0.20 0.39 0.68 0.95 22
Number of co-residing children when became sole parent
1 0.11 0.19 0.37 0.64 341
2 0.11 0.25 0.39 0.66 99
3+ 0.13 0.24 0.42 0.62 94
Age of youngest co-residing child when became sole parent
Under 5 years 0.10 0.20 0.38 0.65 475
5–9 years 0.31 0.36 0.48 0.60 36
Overall 0.12 0.21 0.39 0.64 534
Note: There were 23 children aged over nine who are not included in this table, as this was too small a number to
allow life-table estimates.
Life-table estimates of the cumulative proportion of sole mothers starting work within a given
duration of sole parenthood, by selected socio-demographic characteristics
Table 5.6
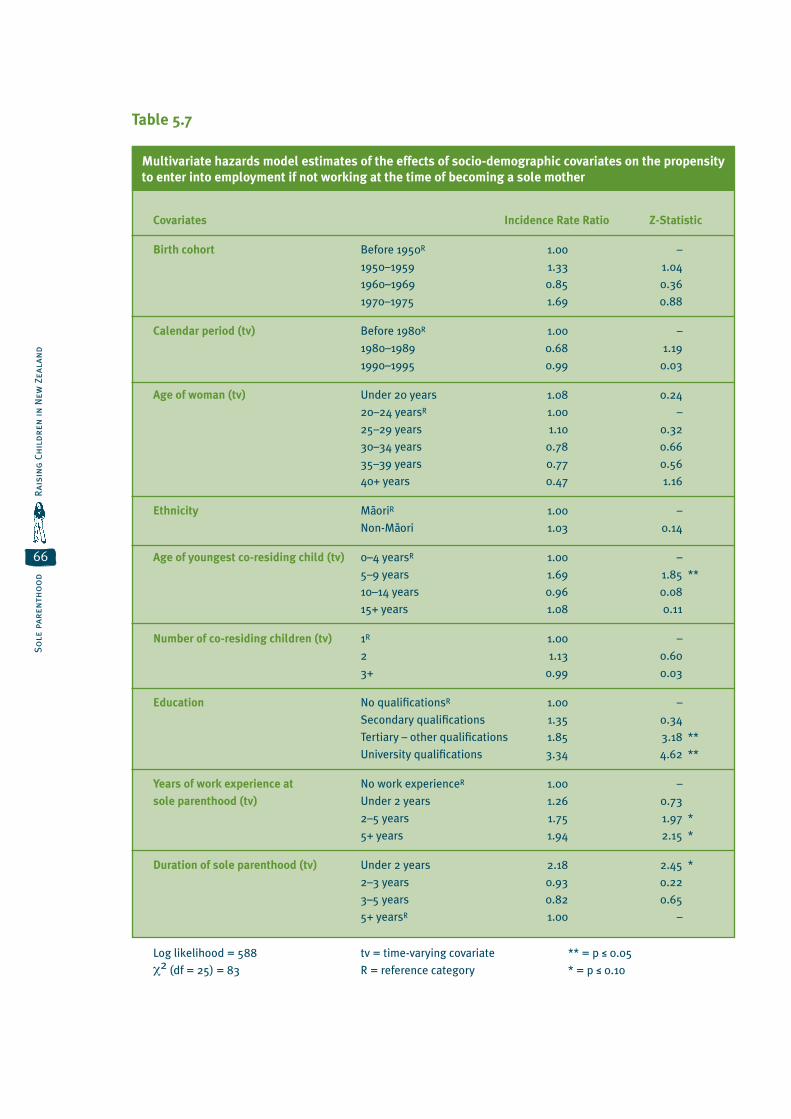
So
le p
aren
tho
od
66
Rai
sin
g C
hil
dre
n in
New
Zea
lan
d
Multivariate hazards model estimates of the effects of socio-demographic covariates on the propensity
to enter into employment if not working at the time of becoming a sole mother
Covariates Incidence Rate Ratio Z-Statistic
Birth cohort Before 1950R 1.00 –
1950–1959 1.33 1.04
1960–1969 0.85 0.36
1970–1975 1.69 0.88
Calendar period (tv) Before 1980R 1.00 –
1980–1989 0.68 1.19
1990–1995 0.99 0.03
Age of woman (tv) Under 20 years 1.08 0.24
20–24 yearsR 1.00 –
25–29 years 1.10 0.32
30–34 years 0.78 0.66
35–39 years 0.77 0.56
40+ years 0.47 1.16
Ethnicity Ma-oriR 1.00 –
Non-Ma-ori 1.03 0.14
Age of youngest co-residing child (tv) 0–4 yearsR 1.00 –
5–9 years 1.69 1.85 **
10–14 years 0.96 0.08
15+ years 1.08 0.11
Number of co-residing children (tv) 1R 1.00 –
2 1.13 0.60
3+ 0.99 0.03
Education No qualifi cationsR 1.00 –
Secondary qualifi cations 1.35 0.34
Tertiary – other qualifi cations 1.85 3.18 **
University qualifi cations 3.34 4.62 **
Years of work experience at No work experienceR 1.00 –
sole parenthood (tv) Under 2 years 1.26 0.73
2–5 years 1.75 1.97 *
5+ years 1.94 2.15 *
Duration of sole parenthood (tv) Under 2 years 2.18 2.45 *
2–3 years 0.93 0.22
3–5 years 0.82 0.65
5+ yearsR 1.00 –
Log likelihood = 588 tv = time-varying covariate ** = p ≤ 0.05
χ2 (df = 25) = 83 R = reference category * = p ≤ 0.10
Table 5.7

So
le Parenth
oo
d
67
Raisin
g Ch
ildren
in N
ew Zealan
d
Cumulative proportion by age of children NumberCharacteristics < 1 yr < 5 yrs < 10 yrs < 17 yrs < 20 yrs of children
Birth cohort of child
Before 1970 0.07 0.12 0.18 0.27 0.30 1,211
1970–1979 0.09 0.17 0.24 1,766
1980–1989 0.12 0.23 2,001
1990–1995 0.19 1,298
Gender of child
Male 0.11 0.20 0.28 0.37 0.39 3,279
Female 0.12 0.21 0.28 0.37 0.41 2,996
Ethnicity of child
Ma-ori 0.23 0.36 0.46 0.56 0.57 1,417
Pacifi c 0.22 0.39 0.46 0.49 0.49 291
Other 0.08 0.15 0.22 0.31 0.35 4,568
Age of mother when child was born
Under 20 years 0.37 0.48 0.57 0.66 0.69 637
20–24 years 0.12 0.22 0.30 0.39 0.41 2,084
25–29 years 0.06 0.14 0.21 0.30 0.34 2,148
30–34 years 0.08 0.14 0.22 0.30 0.32 1,069
35+ years 0.08 0.15 0.20 0.25 0.25 338
Education of mother
No qualifi cations 0.16 0.26 0.34 0.43 0.46 2,093
Secondary qualifi cations 0.09 0.18 0.24 0.30 0.34 1,429
Tertiary – other qualifi cations 0.10 0.17 0.25 0.35 0.38 2,313
University qualifi cations 0.07 0.12 0.22 0.37 0.37 441
Number of live births to mothers
1 0.34 0.51 0.58 0.66 0.69 415
2 0.10 0.19 0.28 0.37 0.42 1,770
3 0.08 0.16 0.23 0.32 0.35 1,878
4+ 0.11 0.20 0.27 0.36 0.38 2,213
Overall 0.12 0.20 0.28 0.37 0.40 6,276
Life-table estimates of the cumulative proportion of children who had ever lived with a sole mother,
by selected socio-demographic characteristics
Table 5.8
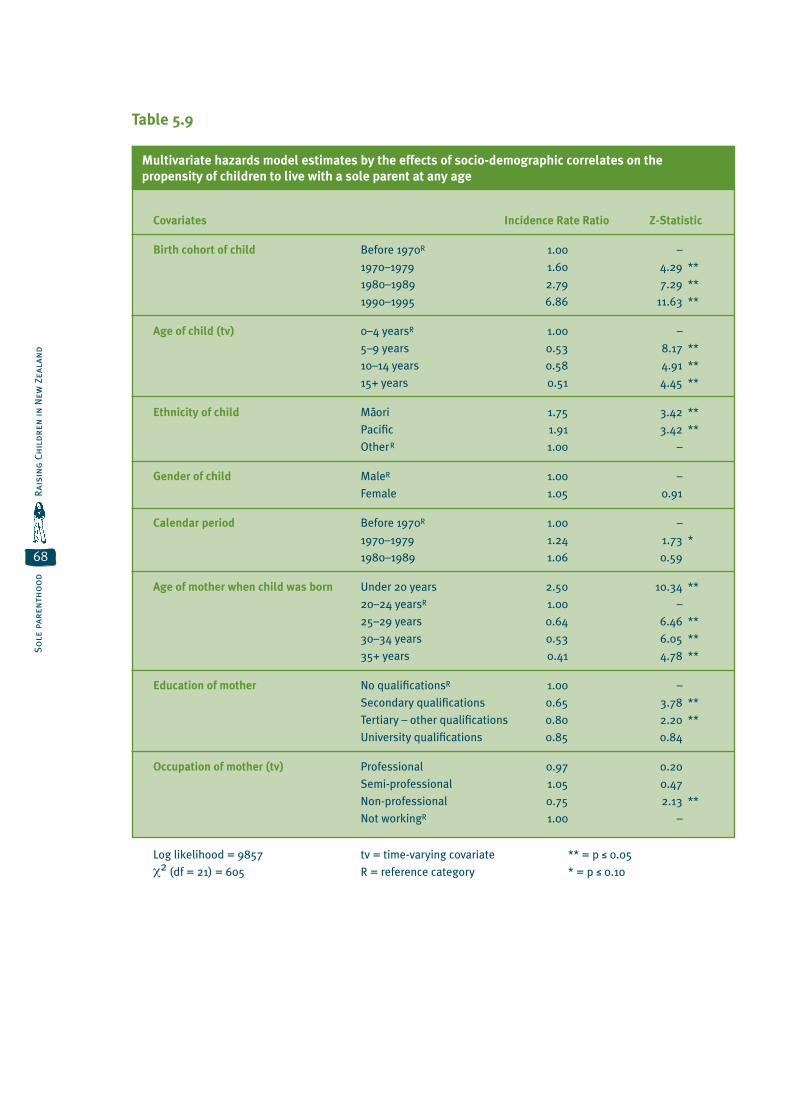
So
le p
aren
tho
od
68
Rai
sin
g C
hil
dre
n in
New
Zea
lan
d
Multivariate hazards model estimates by the effects of socio-demographic correlates on the
propensity of children to live with a sole parent at any age
Covariates Incidence Rate Ratio Z-Statistic
Birth cohort of child Before 1970R 1.00 –
1970–1979 1.60 4.29 **
1980–1989 2.79 7.29 **
1990–1995 6.86 11.63 **
Age of child (tv) 0–4 yearsR 1.00 –
5–9 years 0.53 8.17 **
10–14 years 0.58 4.91 **
15+ years 0.51 4.45 **
Ethnicity of child Ma-ori 1.75 3.42 **
Pacifi c 1.91 3.42 **
OtherR 1.00 –
Gender of child MaleR 1.00 –
Female 1.05 0.91
Calendar period Before 1970R 1.00 –
1970–1979 1.24 1.73 *
1980–1989 1.06 0.59
Age of mother when child was born Under 20 years 2.50 10.34 **
20–24 yearsR 1.00 –
25–29 years 0.64 6.46 **
30–34 years 0.53 6.05 **
35+ years 0.41 4.78 **
Education of mother No qualifi cationsR 1.00 –
Secondary qualifi cations 0.65 3.78 **
Tertiary – other qualifi cations 0.80 2.20 **
University qualifi cations 0.85 0.84
Occupation of mother (tv) Professional 0.97 0.20
Semi-professional 1.05 0.47
Non-professional 0.75 2.13 **
Not workingR 1.00 –
Log likelihood = 9857 tv = time-varying covariate ** = p ≤ 0.05
χ2 (df = 21) = 605 R = reference category * = p ≤ 0.10
Table 5.9

So
le Parenth
oo
d
69
Raisin
g Ch
ildren
in N
ew Zealan
d
Cumulative proportion by duration of stay Number of children withCharacteristics <1 yr < 2 yrs < 5 yrs < 10 yrs sole mothers
Birth cohort of children
Before 1970 0.19 0.30 0.61 0.79 653
1970–1979 0.23 0.37 0.57 0.75 669
1980–1989 0.24 0.37 0.57 516
1990–1995 0.34 127
Gender of child
Male 0.22 0.34 0.60 0.78 1,018
Female 0.24 0.36 0.59 0.77 947
Ethnicity of child
Ma-ori 0.23 0.35 0.55 0.73 553
Non-Ma-ori 0.23 0.35 0.61 0.79 1,412
Overall 0.23 0.35 0.60 0.77 1,965
Life-table estimates of the cumulative proportion of children who were no longer living with
a sole mother (either because the mother had repartnered or because the child had left home),
by selected socio-demographic characteristics
Table 5.10
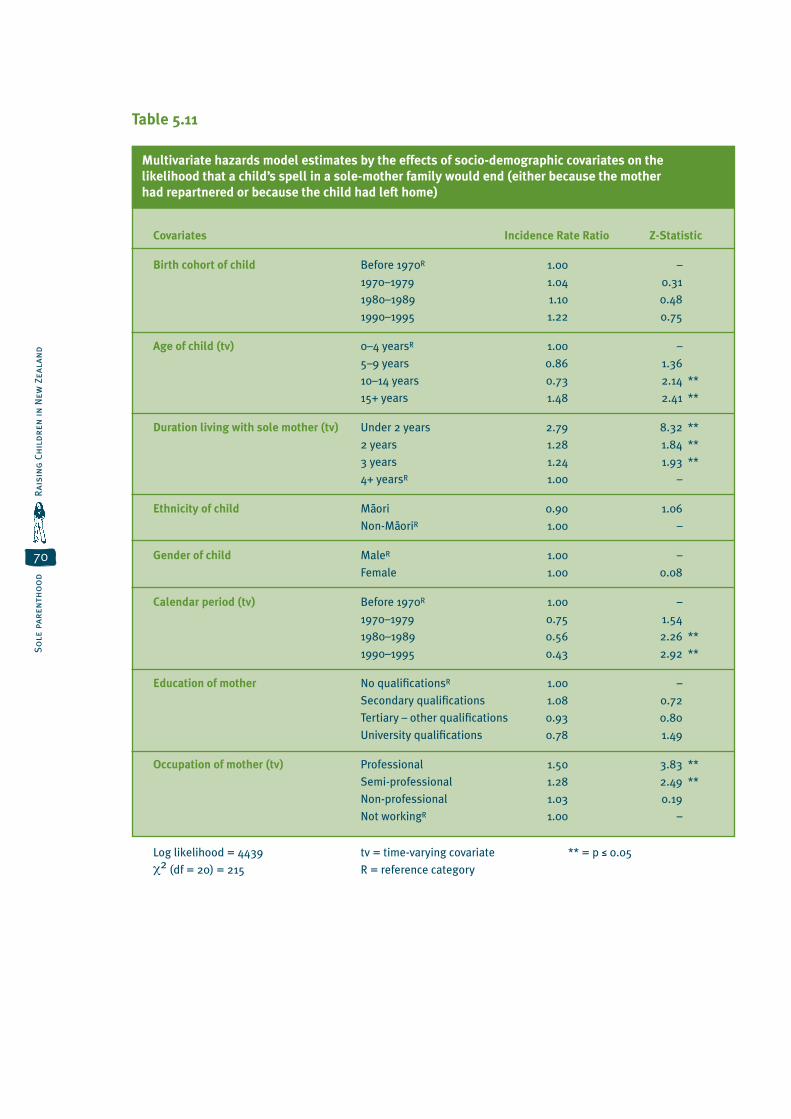
So
le p
aren
tho
od
70
Rai
sin
g C
hil
dre
n in
New
Zea
lan
d
Multivariate hazards model estimates by the effects of socio-demographic covariates on the
likelihood that a child’s spell in a sole-mother family would end (either because the mother
had repartnered or because the child had left home)
Covariates Incidence Rate Ratio Z-Statistic
Birth cohort of child Before 1970R 1.00 –
1970–1979 1.04 0.31
1980–1989 1.10 0.48
1990–1995 1.22 0.75
Age of child (tv) 0–4 yearsR 1.00 –
5–9 years 0.86 1.36
10–14 years 0.73 2.14 **
15+ years 1.48 2.41 **
Duration living with sole mother (tv) Under 2 years 2.79 8.32 **
2 years 1.28 1.84 **
3 years 1.24 1.93 **
4+ yearsR 1.00 –
Ethnicity of child Ma-ori 0.90 1.06
Non-Ma-oriR 1.00 –
Gender of child MaleR 1.00 –
Female 1.00 0.08
Calendar period (tv) Before 1970R 1.00 –
1970–1979 0.75 1.54
1980–1989 0.56 2.26 **
1990–1995 0.43 2.92 **
Education of mother No qualifi cationsR 1.00 –
Secondary qualifi cations 1.08 0.72
Tertiary – other qualifi cations 0.93 0.80
University qualifi cations 0.78 1.49
Occupation of mother (tv) Professional 1.50 3.83 **
Semi-professional 1.28 2.49 **
Non-professional 1.03 0.19
Not workingR 1.00 –
Log likelihood = 4439 tv = time-varying covariate ** = p ≤ 0.05
χ2 (df = 20) = 215 R = reference category
Table 5.11

Blended Families
6

Ble
nd
ed F
amil
ies
72
Rai
sin
g C
hil
dre
n in
New
Zea
lan
d
lended families have become more prevalent since the 1970s due to an increased
propensity for separation from marriages and cohabiting relationships and for formation
of new partnerships. For the purposes of this report, we have defined a blended family as
one comprising a couple, plus one or more children from a previous union (or unions) of one or both
partners. We have made a distinction between blended families that include children from a previous
union (or unions) of one partner only (which we have designated partial-blended families) and
blended families that include children from previous unions of both partners (which we have
designated full-blended families).
B
Although usage of the term “blended families” is not
widespread in the literature, we have preferred it to
“stepfamilies” (partly because it allows us to make a
distinction between partial- and full-blended families).
This definition may be at slight variance with other
literature where the term is used, since blended families
are sometimes defined as families that include children
from previous relationships of both partners. However, it
should be noted that usage of the term is not consistent
in the literature.
The procedure used to derive statistics on blended
families was somewhat complex, because of various
constraints on the available data. This chapter provides
a detailed discussion of these issues and presents
results on the prevalence of blended families, from the
perspective of both the mothers and the children.
6a Identifying Blended Families in the NZWFEE Sample
The NZWFEE survey was not designed for the purpose
of studying blended families and the information it
collected did not lend itself to the identification of
blended families in any simple way. Instead, it was
necessary to use an indirect process of inference to
identify blended families – a process, moreover, that
was only applicable to a subgroup of all unions. The
procedure that was used to identify blended families
and the data limitations that constrained this procedure
are described in detail in a box at the end of this chapter.
A number of particular problems that arose from this
procedure are also discussed and consideration is
given to how these might have affected the results
of the analysis of blended families. The process of
identification of blended families is also displayed
graphically in Figure 6.1. The figure shows that the
procedure served to identify only a subset of the total
pool of blended families.
This discussion shows that the process for identifying
blended families was an imprecise one that did not
encompass all such unions. The results on blended
families should therefore be regarded as indicative
rather than definitive.
6b Definition of Blended FamiliesTaking into consideration all of the issues discussed
in Box 6.1, we define a blended family as one where a
woman has a second or subsequent partner and co-
residing children either of her own from a previous union
(or unions) or of her partner from a previous union (or
unions), or where both partners have children from
previous unions. This definition encompasses families
where a woman has not only entered into a second
or subsequent partnership, but where we also have
evidence of co-resident stepchildren. If the blended
family includes children from previous unions of both
partners, we denote this as a full-blended family; if it
includes children from a previous union (or unions) of
one partner only, then we denote it as a partial-blended
family. This is regardless of whether or not the woman and
her partner together have their own biological children.
6c Blended Families: Experience among Mothers
In this section, we present findings on the prevalence
of blended families (at least as far as this is reflected
in data on the family status of women at the start of
a second or subsequent union). Table 6.1 gives the
number of women who had ever lived in a blended
family expressed as a proportion of all women who had
ever had a child (including adopted and foster children).
About 18 percent of mothers had spent some time living
in a blended family. A vast majority of these blended
families included children of one partner only (partial-

Blen
ded
Families
73
Raisin
g Ch
ildren
in N
ew Zealan
d
blended families); only one in eight blended families
(13 percent) included children from previous unions of
both partners (full-blended families). Overall, only a very
small proportion of mothers (2.5 percent) had lived in
full-blended families.
The data on blended families given in Table 6.1 by birth
cohort require careful interpretation, as we have not
controlled for censoring (ie women of younger birth
cohorts have had shorter periods of exposure to the
possibility of living in a blended family). Nevertheless, the
fact that similar proportions of women born in the 1960s
(who would have been aged between 26 and 35 at the
time of the survey) and the first half of the 1970s (who
would have been aged between 20 and 25 at the time of
the survey) had lived in a blended family as women born
in earlier decades suggests that, by the time the younger
birth cohorts reach the end of their reproductive lives,
more among them are likely to have lived in a blended
family than has been true for the older cohorts.
There was a significant ethnic differential in the
prevalence of full-blended families. Such families were
more than twice as common among Ma-ori (4.8 percent)
as among non-Ma-ori (2.1 percent). Partial-blended
families were also a little more common among Ma-ori
than among non-Ma-ori.
There was also an educational differential in the
prevalence of blended families. Women with a university
degree were less likely to have lived in a blended
family (either full or partial) than those with a lower
qualification. Women with no qualifications were more
likely than others to have lived in a blended family
(specifically, in a partial-blended family).
Life-table estimates of the cumulative proportions of
mothers who had ever lived in a blended family (full or
partial) before varying ages are presented in Table 6.2.
In this case, the analysis includes only women who had
had biological children of their own. Women who had
only had adopted or foster children were excluded, as no
information was available on when these children were
adopted or fostered or on when they had left home.
According to the results in Table 6.2, over a quarter
of mothers (28 percent) had lived in a blended family
before they reached 50 years of age.
There were substantial differentials in the probability
of living in a blended family by birth cohort, ethnicity
and level of educational qualifications. The younger her
birth cohort, the more likely a woman was to have lived
in a blended family. For instance, about 14 percent of
mothers born during the period 1950–1959 had lived in
a blended family before the age of 30, compared with
eight percent of those born during the period 1936–
1949. What is particularly striking is that 13 percent of
mothers born during the period 1970–1975 had lived in a
blended family before they turned 20 years of age. This
compares with just three percent for earlier cohorts.
Ma-ori mothers were more than twice as likely as
non-Ma-ori mothers to have lived in a blended family
before the age of 30. The ethnic differential persisted,
although it had diminished a little, at higher ages. The
differential by educational qualifications was equally clear.
Higher education was associated with a lower likelihood
of having lived in a blended family. For instance, only 15
percent of mothers with a university qualification had lived
in a blended family before the age of 40, compared with
29 percent of those with no educational qualifications.
In other words, mothers with a university qualification
were only around half as likely to have lived in a blended
family before they turned 40 as those with no educational
qualifications. The differential was even higher among
younger women, but had reduced somewhat by the time
the women had reached the age of 50.
6d Blended Families: Experience among Children
Children who had ever lived in blended families
Life-table estimates of the cumulative proportions of
children of women in the survey who had ever lived in
a blended family are given in Table 6.3. One in five of
the children had lived in a blended family before they
reached 17 years of age. There was a clear pattern of
variation by the children’s birth cohort: children born
before 1970 were less likely to have lived in a blended
family than those born after 1970. For instance, around
one in 10 children born after 1970 had lived in a blended
family before they turned five, compared with one in 20
children born before 1970.
There were differences between Ma-ori and non-Ma-ori
children in the likelihood of living in a blended family.
While 29 percent of Ma-ori children had lived in a
blended family before they reached 17 years of age, only
18 percent of non-Ma-ori children had done so.

Ble
nd
ed F
amil
ies
74
Rai
sin
g C
hil
dre
n in
New
Zea
lan
d
There were also differentials among children by the
level of their mothers’ educational qualifications.
Among children whose mothers had university-level
qualifications, only six percent had lived in a blended
family by 10 years of age, compared with 18 percent
of children whose mothers had no educational
qualifications and 13 percent of children whose mothers
had a secondary qualification.
No differences were evident by the gender of the children.
Duration of stay in and propensity to leave
blended families
In this section, we examine children’s length of stay in
blended families. A child’s spell in a blended family may
have come to an end either because the child had left
the family or because the family had broken up. It was
not possible to conduct separate analyses of length
of stay according to these two reasons for the end of
a child’s spell in a blended family, so the following
analysis includes both cases where the child had left
home and cases where the family had broken up.
The analysis reported in this section was based on the
experience of women’s own biological children only.
Stepchildren, foster children and adopted children
were all excluded, as the NZWFEE survey did not collect
information on when these children moved in to live with
the woman or when they left the home to live elsewhere.
In addition, it should be noted that, where a child had
left a blended family, we have no information on where
the child went. It may be that some of these children
went to live with their fathers; however, we are not able
to say anything about this given the data limitations.
In Table 6.4, we provide life-table estimates of the
cumulative proportions of children whose spell in the
blended family had ended (either because they had
left the family or because the family had broken up) by
varying durations of stay. Within their first three years
of stay, the spell in the blended family had ended for
about a third of the children. Within 10 years of stay, the
spell in the blended family had ended for more than two-
thirds of the children.
As expected, the age of the child on entering a blended
family had a strong association with how long the child
stayed in the blended family. Among children who were
aged 15 or more when the blended family was formed,
the spell had ended within the first year for around a
third, within three years for nearly 60 percent and within
five years for nearly 90 percent. Among children who
were aged 10–14 when the blended family was formed,
the spell had ended within five years for around a half.
And among children who were aged under 10 when the
blended family was formed, the spell had ended within
five years for around 40 percent.
The birth cohort of the child was also strongly
associated with duration of stay in a blended family. In
general, the younger the birth cohort, the shorter the
stay in the blended family. While the spell in the blended
family had ended within five years of stay for
54 percent of those born during the period 1980–1989,
the corresponding figure for those born during the
period 1970–1979 was only 39 percent. However, 10
years after the blended family had formed, the spell was
more likely to have ended for children born before 1970
than for those born during the 1970s. It is not clear what
might underlie this turnaround in the pattern.
There was no significant ethnic differential in the
duration of stay in a blended family. Nor was there any
clear pattern of differences by the level of mothers’
educational qualifications. The main exception was that,
among children of university-qualified mothers, the
spell in a blended family had a very low probability of
ending within the first year, compared with other groups
of children. Finally, the gender of the child did not make
any difference to the duration of stay in a blended
family, according to this analysis. However, a subsequent
analysis of rates of leaving home showed that female
children were more likely to leave blended families at an
earlier age than male children (see Chapter 7 Children’s
Patterns of Leaving Home).
6e Summary
The data collected in the NZWFEE survey did not lend
themselves to a definitive analysis of blended families.
The results presented in this chapter are, therefore,
necessarily tentative. The limited evidence presented
here suggests that the blended family is becoming
increasingly widespread. It is estimated that close to a
fifth of all women who had ever had children (18 percent)
had lived at some point in a blended family. The great
majority of these blended families included children from
a previous union of one partner only (partial-blended
families). Only one in eight of these families were full-
blended families. Thus only 2.5 percent of women had
ever lived in a full-blended family.

Blen
ded
Families
75
Raisin
g Ch
ildren
in N
ew Zealan
d
Ma-ori mothers were more than twice as likely as
non-Ma-ori mothers to have spent some time living
in a blended family. Mothers with no educational
qualifications were more likely to have lived in a blended
family than those with some form of qualification, and
mothers with a university degree were least likely to
have lived in a blended family. Being in a younger birth
cohort also meant an increased probability of having
ever lived in a blended family.
A fifth of children had spent some time living in a
blended family before they turned 17. The birth cohort
and ethnicity of the child were important covariates of
the probability of living in a blended family, as was the
level of educational qualifications of the child’s mother.
Ma-ori children and those born since the 1970s were
more likely to have lived in a blended family than were
non-Ma-ori children and those born during the 1950s and
1960s. But the birth cohort and ethnicity differentials
among children were not as large as those found among
their mothers. Children of mothers with university
qualifications were less likely to have lived in a blended
family, at least before the age of 10.
The duration of time children spent living in a blended
family was generally short: for a third of children who had
ever lived in a blended family, the spell had ended within
three years; for nearly half, the spell had ended within five
years; and for two-thirds, the spell had ended within 10
years. It should be noted that these statistics include both
cases where the family broke down and cases where the
child left the home to live elsewhere. For children who left
the home, we do not know whether they went to live with
other kin (perhaps the father) or to set up an independent
household. The analysis thus leaves a number of
unanswered questions about children’s experience of
blended families. Even so, it is clear that, at least for
some children, the spell in a blended family occupied a
relatively small portion of their childhood.
The Procedure used to Identify Blended Families
The process of identifying blended families was a
complex one. Blended families could not be identified
directly because of various constraints on the data
and thus it was necessary to use an indirect process of
inference to identify a family as a blended family.
Stepfather families (ie families that included a child
or children from a previous union of the mother) could
be identified in a relatively straightforward fashion. If
a woman had at least one child living with her when
she repartnered, the family was identified as a blended
family. (There was one difficulty with this process, which
is discussed below under the heading The problem of
excluded first unions.)
The main difficulty was in identifying stepmother
families (ie families that included a child or children
from a previous union of the woman’s partner). No
information was available on whether the woman’s
new partner brought with him children from a previous
union. Nor was there full information available on each
relationship of women in the survey to each child living
in the household for each union they had ever had. This
necessitated the use of an indirect process to infer the
presence in the household of children who were not the
biological children of the woman.
For each woman and for each of her unions, a count
of the number of her biological children who were co-
residing with her at the time of formation of the union
was derived from data on the number of children she
had ever given birth to at that time and the dates on
which each of these children left home. The total number
of children living with the woman and her new partner
at the time of formation of each new union was reported
by women in the survey. These two figures were used
to infer the presence of children of the woman’s new
partner. Specifically, it was inferred that children of
the woman’s partner were present if the number of the
woman’s own biological children who were living with
her at the time of formation of the new union was fewer
than the reported total number of children the woman
and her partner had living with them at that time.
Box 6.1

Ble
nd
ed F
amil
ies
76
Rai
sin
g C
hil
dre
n in
New
Zea
lan
d
This procedure was not a perfect method for identifying
blended families. Four particular problems arose from
the procedure, which will have had varying impacts on
the results of the analysis of blended families. These four
problems, and their potential effects, are discussed below.
The problem of dynamic change in families
It is important to note that the identification of a family
as a blended family was made only at the time a new
union was formed. This is because information was
available on the total number of children living in the
household only at this point. The make-up of households
may have changed subsequently in ways that alter the
picture, even though the union itself may have remained
intact. In particular, it is possible that a woman who was
not living in a blended family at the time of repartnering
could have entered into one subsequently while staying
in the same union. This could have come about because
the woman’s own children from a previous union, or her
new partner’s children from a previous union, arrived to
live with the family after the new union was formed.
We also do not have data on those situations – which are
likely to be relatively common among blended families
– where children of the woman’s new partner spend only
part of their time living with him in the new union. It is
quite probable that many children who spend only part
of their time living with their father were not recorded as
living in the household when the new union was formed.
For these reasons, the aim of the analysis was restricted
to producing estimates of point-in-time prevalence
rates of blended families (ie at the time of formation of
unions). The data do not permit any attempt to address
the goal of deriving period-prevalence rates (ie over a
period of time).
The problem of imprecision in estimates
Because the inference process relied on information
on, among other things, the dates at which children
left the family home, any imprecision in women’s
recall of these dates will have introduced error into the
process for identifying blended families. In addition,
other errors may have arisen if women had had varying
understandings of the questions they were asked. That
the rate of error could be relatively high is illustrated by
the fact that there were 43 women whose information
on the number of children co-residing with them at
the time of repartnering was not consistent with their
information on the dates at which their children left
home. Consequently, these women had to be excluded
from the analysis. It is possible that in a significant
number of other cases errors in recall of dates may have
led to misidentification of blended families.
The problem of excluded first unions
It was not possible to identify blended families where
a woman was in her first union. This is because the
available information did not allow us to determine
whether or not the woman’s first partner was the
biological father of any children she may have had
before entering her first union. Thus, the count of
blended families was restricted to women in second or
subsequent unions (see Figure 6.1).
This is not considered likely to pose a major problem for
the derivation of estimates of the prevalence of blended
families, because the number of women who enter into
blended families as a first union is likely to be small. In
fact, of all the women who had been in just one union
at the time of the survey in 1995, only about 40 (two
percent) reported that they had ever had stepchildren
living with them. Because we do not have information
on when these stepchildren moved in to live with the
women, it is not possible to include these cases in
our point estimates of blended families at the time of
formation of new unions.
The problem of adopted and foster children
The total count of children that the woman and her new
partner had living with them at the time they formed
their new union specifically included adopted children
and foster children. This means that the process
described above will have resulted in an over-estimate
of the number of families with stepchildren. The women
were asked a separate question in the survey about how
many stepchildren, adopted children and foster children
they had ever had living with them, but they were not
asked when these children moved in to live with them or
when they left home. Thus, this information could not be
used to adjust the process for inferring the presence of
stepchildren.
An examination of some relevant information showed
that this effect might not be very large, however. For
instance, of the 694 women who had had at least two
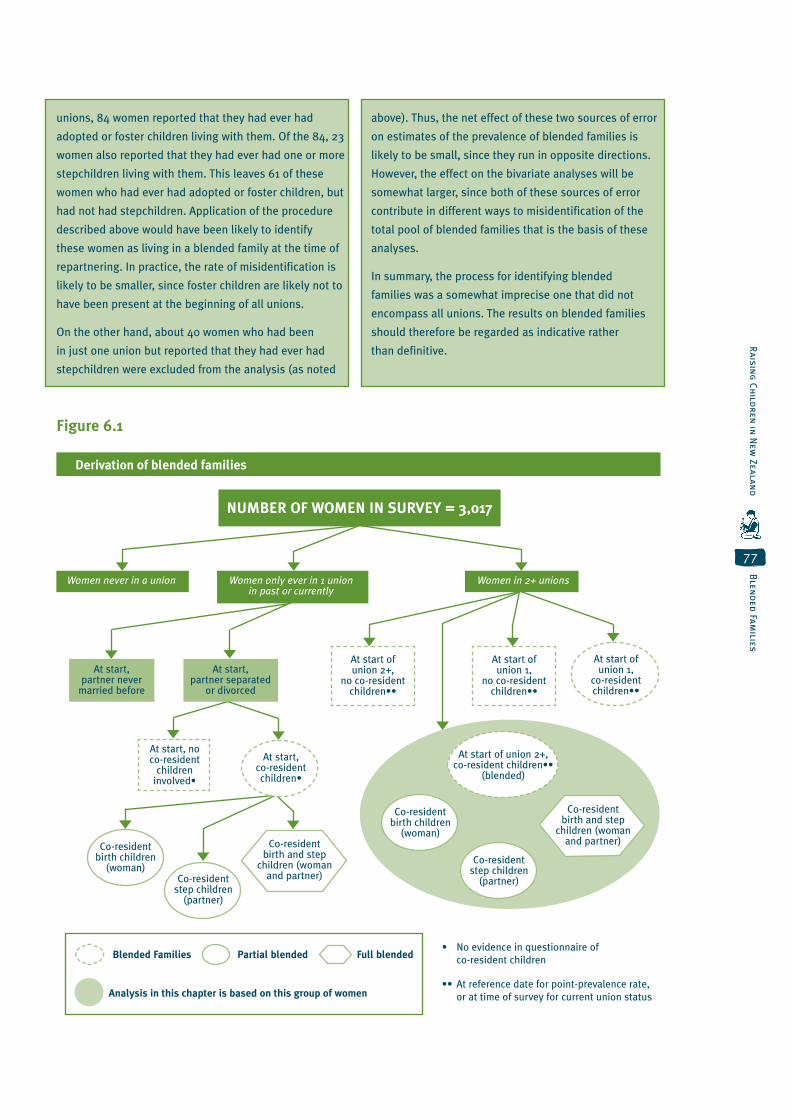
Blen
ded
Families
77
Raisin
g Ch
ildren
in N
ew Zealan
d
unions, 84 women reported that they had ever had
adopted or foster children living with them. Of the 84, 23
women also reported that they had ever had one or more
stepchildren living with them. This leaves 61 of these
women who had ever had adopted or foster children, but
had not had stepchildren. Application of the procedure
described above would have been likely to identify
these women as living in a blended family at the time of
repartnering. In practice, the rate of misidentification is
likely to be smaller, since foster children are likely not to
have been present at the beginning of all unions.
On the other hand, about 40 women who had been
in just one union but reported that they had ever had
stepchildren were excluded from the analysis (as noted
above). Thus, the net effect of these two sources of error
on estimates of the prevalence of blended families is
likely to be small, since they run in opposite directions.
However, the effect on the bivariate analyses will be
somewhat larger, since both of these sources of error
contribute in different ways to misidentification of the
total pool of blended families that is the basis of these
analyses.
In summary, the process for identifying blended
families was a somewhat imprecise one that did not
encompass all unions. The results on blended families
should therefore be regarded as indicative rather
than definitive.
Derivation of blended families
Figure 6.1
NUMBER OF WOMEN IN SURVEY = 3,017
Women never in a union Women only ever in 1 union in past or currently
Women in 2+ unions
At start,partner never
married before
At start ofunion 2+,
no co-resident children••
At start ofunion 1,
no co-resident children••
At start ofunion 1,
co-residentchildren••
At start of union 2+,co-resident children••
(blended)
Co-residentbirth and step
children (womanand partner)
Co-residentstep children
(partner)
Co-residentbirth children
(woman)
Co-residentbirth children
(woman)Co-resident
step children(partner)
Co-residentbirth and step
children (womanand partner)
At start, no co-resident
childreninvolved•
Blended Families Partial blended Full blended
Analysis in this chapter is based on this group of women
• No evidence in questionnaire of
co-resident children
•• At reference date for point-prevalence rate,
or at time of survey for current union status
At start,partner separated
or divorced
At start,co-residentchildren•
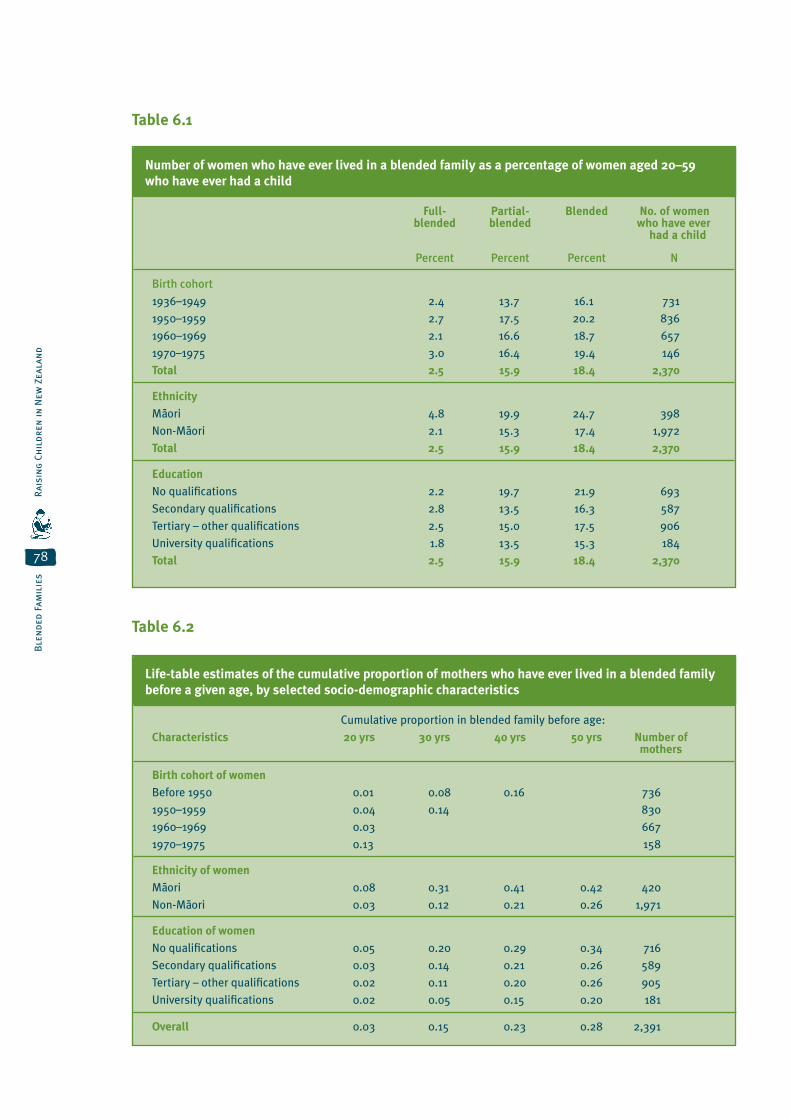
Ble
nd
ed F
amil
ies
78
Rai
sin
g C
hil
dre
n in
New
Zea
lan
d
Number of women who have ever lived in a blended family as a percentage of women aged 20–59
who have ever had a child
Full- Partial- Blended No. of women blended blended who have ever had a child
Percent Percent Percent N
Birth cohort
1936–1949 2.4 13.7 16.1 731
1950–1959 2.7 17.5 20.2 836
1960–1969 2.1 16.6 18.7 657
1970–1975 3.0 16.4 19.4 146
Total 2.5 15.9 18.4 2,370
Ethnicity
Ma-ori 4.8 19.9 24.7 398
Non-Ma-ori 2.1 15.3 17.4 1,972
Total 2.5 15.9 18.4 2,370
Education
No qualifi cations 2.2 19.7 21.9 693
Secondary qualifi cations 2.8 13.5 16.3 587
Tertiary – other qualifi cations 2.5 15.0 17.5 906
University qualifi cations 1.8 13.5 15.3 184
Total 2.5 15.9 18.4 2,370
Life-table estimates of the cumulative proportion of mothers who have ever lived in a blended family
before a given age, by selected socio-demographic characteristics
Cumulative proportion in blended family before age:
Characteristics 20 yrs 30 yrs 40 yrs 50 yrs Number of mothers
Birth cohort of women
Before 1950 0.01 0.08 0.16 736
1950–1959 0.04 0.14 830
1960–1969 0.03 667
1970–1975 0.13 158
Ethnicity of women
Ma-ori 0.08 0.31 0.41 0.42 420
Non-Ma-ori 0.03 0.12 0.21 0.26 1,971
Education of women
No qualifi cations 0.05 0.20 0.29 0.34 716
Secondary qualifi cations 0.03 0.14 0.21 0.26 589
Tertiary – other qualifi cations 0.02 0.11 0.20 0.26 905
University qualifi cations 0.02 0.05 0.15 0.20 181
Overall 0.03 0.15 0.23 0.28 2,391
Table 6.1
Table 6.2

Blen
ded
Families
79
Raisin
g Ch
ildren
in N
ew Zealan
d
Life-table estimates of the cumulative proportion of children who have ever lived in a blended family
before a given age, by selected socio-demographic characteristics
Cumulative proportion in blended family before age:
Characteristics 5 yrs 10 yrs 17 yrs 20 yrs Number of children
Birth cohort of children
Before 1970 0.05 0.09 0.15 1,211
1970–1979 0.08 0.14 1,766
1980–1989 0.09 2,001
1990–1995 1,298
Gender of child
Male 0.08 0.14 0.20 0.21 3,279
Female 0.08 0.14 0.20 0.22 2,996
Ethnicity of child
Ma-ori 0.14 0.22 0.29 0.30 1,417
Non-Ma-ori 0.07 0.12 0.18 0.20 4,859
Education of mother
No qualifi cations 0.10 0.18 0.23 0.25 2,093
Secondary qualifi cations 0.08 0.13 0.17 0.18 1,429
Tertiary – other qualifi cations 0.06 0.11 0.19 0.22 2,313
University qualifi cations 0.03 0.06 0.20 0.23 441
Overall 0.08 0.14 0.20 0.22 6,276
Table 6.3

Ble
nd
ed F
amil
ies
80
Rai
sin
g C
hil
dre
n in
New
Zea
lan
d
Life-table estimates of the cumulative proportion of children whose spell in a blended family had
ended (either because the child had left the family or because the family had broken up) within a
given duration, by selected socio-demographic characteristics
Cumulative proportion whose spell in a blended family had ended
Characteristics <1 yr <2 yrs <5 yrs <10 yrs <20 yrs Number of children
Age of child when entering blended family
Under 5 years 0.16 0.25 0.40 0.56 0.87 452
5–9 years 0.13 0.23 0.39 0.69 0.97 262
10–14 years 0.11 0.21 0.53 0.90 174
15 years and over 0.33 0.57 0.89 63
Birth cohort of child
Before 1970 0.11 0.18 0.36 0.72 0.96 193
1970–1979 0.11 0.20 0.39 0.61 355
1980–1989 0.19 0.31 0.54 314
1990–1995 0.32 89
Gender of child
Male 0.15 0.25 0.46 0.69 0.91 495
Female 0.15 0.26 0.43 0.66 0.95 456
Ethnicity of child
Ma-ori 0.15 0.25 0.47 0.70 0.94 282
Non-Ma-ori 0.15 0.26 0.44 0.67 0.93 669
Education of mother
No qualifi cations 0.14 0.24 0.47 0.72 0.94 391
Secondary qualifi cations 0.19 0.28 0.40 0.59 0.89 185
Tertiary – other qualifi cations 0.16 0.28 0.45 0.66 0.94 325
University qualifi cations 0.04 0.21 0.51 0.75 0.96 50
Overall 0.15 0.26 0.45 0.68 0.93 951
Note: This table includes only the biological children of survey respondents. Stepchildren, foster children and
adopted children were all excluded, as the NZWFEE survey did not collect information on when these children
moved in to live with the respondent or when they left the home to live elsewhere.
Table 6.4
Children’s Patterns
of Leaving Home
7
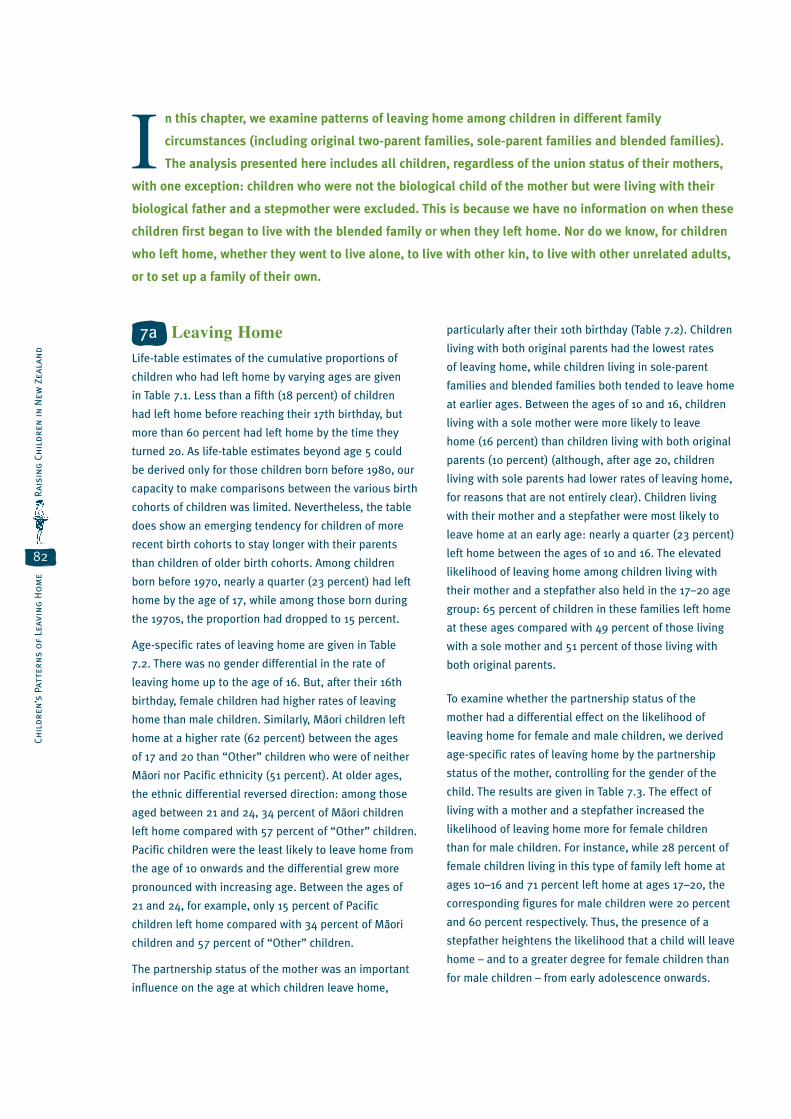
Chil
dre
n’s
Pat
tern
s o
f Le
avin
g H
om
e
82
Rai
sin
g C
hil
dre
n in
New
Zea
lan
d
7a Leaving HomeLife-table estimates of the cumulative proportions of
children who had left home by varying ages are given
in Table 7.1. Less than a fifth (18 percent) of children
had left home before reaching their 17th birthday, but
more than 60 percent had left home by the time they
turned 20. As life-table estimates beyond age 5 could
be derived only for those children born before 1980, our
capacity to make comparisons between the various birth
cohorts of children was limited. Nevertheless, the table
does show an emerging tendency for children of more
recent birth cohorts to stay longer with their parents
than children of older birth cohorts. Among children
born before 1970, nearly a quarter (23 percent) had left
home by the age of 17, while among those born during
the 1970s, the proportion had dropped to 15 percent.
Age-specific rates of leaving home are given in Table
7.2. There was no gender differential in the rate of
leaving home up to the age of 16. But, after their 16th
birthday, female children had higher rates of leaving
home than male children. Similarly, Ma-ori children left
home at a higher rate (62 percent) between the ages
of 17 and 20 than “Other” children who were of neither
Ma-ori nor Pacific ethnicity (51 percent). At older ages,
the ethnic differential reversed direction: among those
aged between 21 and 24, 34 percent of Ma-ori children
left home compared with 57 percent of “Other” children.
Pacific children were the least likely to leave home from
the age of 10 onwards and the differential grew more
pronounced with increasing age. Between the ages of
21 and 24, for example, only 15 percent of Pacific
children left home compared with 34 percent of Ma-ori
children and 57 percent of “Other” children.
The partnership status of the mother was an important
influence on the age at which children leave home,
particularly after their 10th birthday (Table 7.2). Children
living with both original parents had the lowest rates
of leaving home, while children living in sole-parent
families and blended families both tended to leave home
at earlier ages. Between the ages of 10 and 16, children
living with a sole mother were more likely to leave
home (16 percent) than children living with both original
parents (10 percent) (although, after age 20, children
living with sole parents had lower rates of leaving home,
for reasons that are not entirely clear). Children living
with their mother and a stepfather were most likely to
leave home at an early age: nearly a quarter (23 percent)
left home between the ages of 10 and 16. The elevated
likelihood of leaving home among children living with
their mother and a stepfather also held in the 17–20 age
group: 65 percent of children in these families left home
at these ages compared with 49 percent of those living
with a sole mother and 51 percent of those living with
both original parents.
To examine whether the partnership status of the
mother had a differential effect on the likelihood of
leaving home for female and male children, we derived
age-specific rates of leaving home by the partnership
status of the mother, controlling for the gender of the
child. The results are given in Table 7.3. The effect of
living with a mother and a stepfather increased the
likelihood of leaving home more for female children
than for male children. For instance, while 28 percent of
female children living in this type of family left home at
ages 10–16 and 71 percent left home at ages 17–20, the
corresponding figures for male children were 20 percent
and 60 percent respectively. Thus, the presence of a
stepfather heightens the likelihood that a child will leave
home – and to a greater degree for female children than
for male children – from early adolescence onwards.
n this chapter, we examine patterns of leaving home among children in different family
circumstances (including original two-parent families, sole-parent families and blended families).
The analysis presented here includes all children, regardless of the union status of their mothers,
with one exception: children who were not the biological child of the mother but were living with their
biological father and a stepmother were excluded. This is because we have no information on when these
children first began to live with the blended family or when they left home. Nor do we know, for children
who left home, whether they went to live alone, to live with other kin, to live with other unrelated adults,
or to set up a family of their own.
I
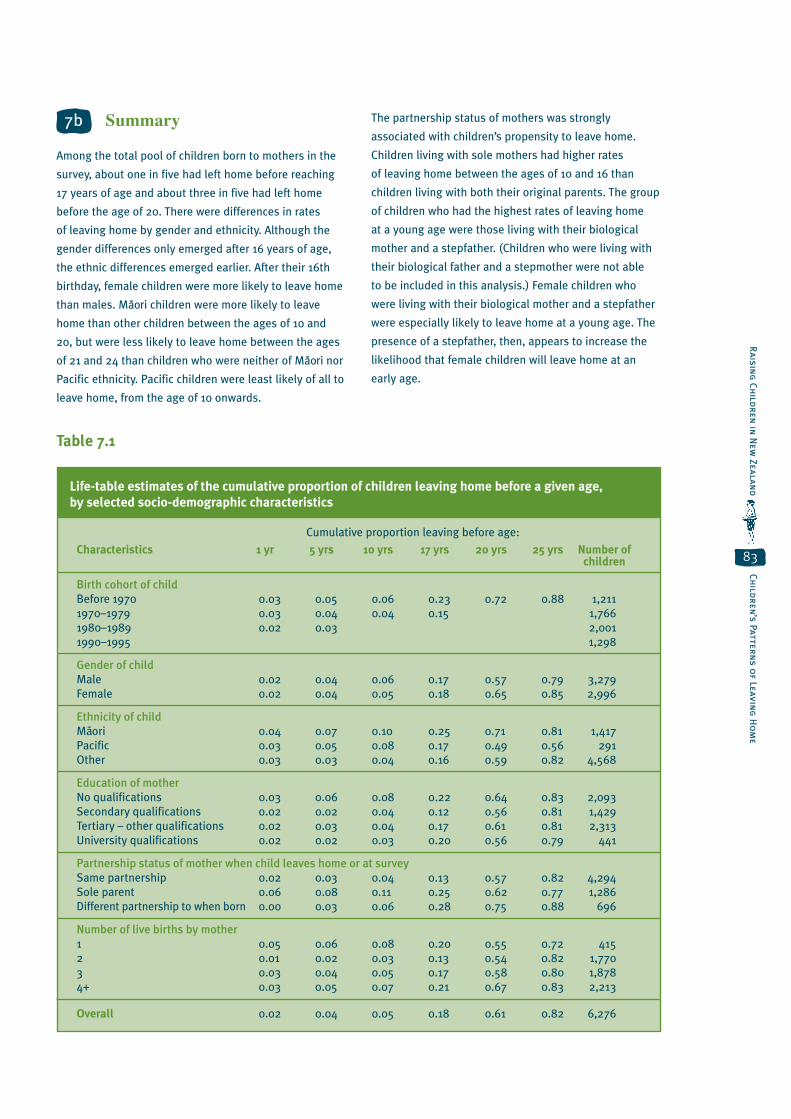
Child
ren’s Pattern
s of Leavin
g H
om
e
83
Raisin
g Ch
ildren
in N
ew Zealan
d
7b Summary
Among the total pool of children born to mothers in the
survey, about one in five had left home before reaching
17 years of age and about three in five had left home
before the age of 20. There were differences in rates
of leaving home by gender and ethnicity. Although the
gender differences only emerged after 16 years of age,
the ethnic differences emerged earlier. After their 16th
birthday, female children were more likely to leave home
than males. Ma-ori children were more likely to leave
home than other children between the ages of 10 and
20, but were less likely to leave home between the ages
of 21 and 24 than children who were neither of Ma-ori nor
Pacific ethnicity. Pacific children were least likely of all to
leave home, from the age of 10 onwards.
The partnership status of mothers was strongly
associated with children’s propensity to leave home.
Children living with sole mothers had higher rates
of leaving home between the ages of 10 and 16 than
children living with both their original parents. The group
of children who had the highest rates of leaving home
at a young age were those living with their biological
mother and a stepfather. (Children who were living with
their biological father and a stepmother were not able
to be included in this analysis.) Female children who
were living with their biological mother and a stepfather
were especially likely to leave home at a young age. The
presence of a stepfather, then, appears to increase the
likelihood that female children will leave home at an
early age.
Life-table estimates of the cumulative proportion of children leaving home before a given age,
by selected socio-demographic characteristics
Cumulative proportion leaving before age:
Characteristics 1 yr 5 yrs 10 yrs 17 yrs 20 yrs 25 yrs Number of children
Birth cohort of child
Before 1970 0.03 0.05 0.06 0.23 0.72 0.88 1,211
1970–1979 0.03 0.04 0.04 0.15 1,766
1980–1989 0.02 0.03 2,001
1990–1995 1,298
Gender of child
Male 0.02 0.04 0.06 0.17 0.57 0.79 3,279
Female 0.02 0.04 0.05 0.18 0.65 0.85 2,996
Ethnicity of child
Ma-ori 0.04 0.07 0.10 0.25 0.71 0.81 1,417
Pacific 0.03 0.05 0.08 0.17 0.49 0.56 291
Other 0.03 0.03 0.04 0.16 0.59 0.82 4,568
Education of mother
No qualifications 0.03 0.06 0.08 0.22 0.64 0.83 2,093
Secondary qualifications 0.02 0.02 0.04 0.12 0.56 0.81 1,429
Tertiary – other qualifications 0.02 0.03 0.04 0.17 0.61 0.81 2,313
University qualifications 0.02 0.02 0.03 0.20 0.56 0.79 441
Partnership status of mother when child leaves home or at survey
Same partnership 0.02 0.03 0.04 0.13 0.57 0.82 4,294
Sole parent 0.06 0.08 0.11 0.25 0.62 0.77 1,286
Different partnership to when born 0.00 0.03 0.06 0.28 0.75 0.88 696
Number of live births by mother
1 0.05 0.06 0.08 0.20 0.55 0.72 415
2 0.01 0.02 0.03 0.13 0.54 0.82 1,770
3 0.03 0.04 0.05 0.17 0.58 0.80 1,878
4+ 0.03 0.05 0.07 0.21 0.67 0.83 2,213
Overall 0.02 0.04 0.05 0.18 0.61 0.82 6,276
Table 7.1

Chil
dre
n’s
Pat
tern
s o
f Le
avin
g H
om
e
84
Rai
sin
g C
hil
dre
n in
New
Zea
lan
d
Rate of leaving home of children in given age groups, by selected socio-demographic characteristics
Rate of leaving home
< 1 yr 1–4 yrs 5–9 yrs 10–16 yrs 17–20 yrs 21–24 yrs Number of children
Birth cohort of child
Before 1970 0.03 0.01 0.02 0.18 0.63 0.57 1,211
1970–1979 0.03 0.01 0.01 0.11 1,766
1980–1989 0.01 0.02 2,001
1990–1995 1,2
Gender of child
Male 0.02 0.01 0.02 0.12 0.48 0.51 3,279
Female 0.02 0.02 0.01 0.13 0.58 0.56 2,996
Ethnicity of child
Ma-ori 0.04 0.03 0.03 0.17 0.62 0.34 1,417
Pacific 0.03 0.03 0.03 0.10 0.38 0.15 291
Other 0.02 0.01 0.01 0.12 0.51 0.57 4,568
Partnership status of mother when child leaves home or survey
Same partnership 0.02 0.01 0.01 0.10 0.51 0.57 4,294
Sole parent 0.06 0.03 0.04 0.16 0.49 0.38 1,286
Different partnership
to when born 0.00 0.03 0.02 0.23 0.65 0.54 696
Number of live births by mother
1 0.05 0.02 0.02 0.13 0.43 0.38 415
2 0.01 0.01 0.01 0.10 0.47 0.60 1,770
3 0.03 0.01 0.02 0.12 0.50 0.52 1,878
F4+ 0.03 0.02 0.02 0.15 0.58 0.50 2,213
Overall 0.02 0.01 0.02 0.13 0.52 0.53 6,276
Rate of leaving home of children in given age groups, by gender of child and partnership status of mothers
Rate of leaving home
Gender Partnership < 1 yr 1–4 yrs 5–9 yrs 10–16 yrs 17–20 yrs 21–24 yrs Number ofof child status children
Male Same partnership 0.02 0.01 0.01 0.10 0.46 0.53 2,254
Sole parent 0.05 0.02 0.05 0.17 0.46 0.45 660
Different partnership
to when born 0.01 0.02 0.02 0.20 0.60 0.50 365
Female Same partnership 0.02 0.01 0.01 0.10 0.57 0.62 2,039
Sole parent 0.06 0.03 0.02 0.15 0.53 0.30 626
Different partnership
to when born 0.00 0.04 0.03 0.28 0.71 0.59 331
Table 7.2
Table 7.3

Summary and Conclusions
8

Su
mm
ary
and
Co
ncl
usi
on
s
86
Rai
sin
g C
hil
dre
n in
New
Zea
lan
d
We examined these topics using data from the first-ever
nationally representative sample survey of women,
carried out in 1995, that had the aim of investigating
family formation dynamics. We used bivariate life-
table methods and multivariate discrete-time hazards
modelling techniques to analyse these various aspects
of dynamic family processes.
Union formation has been undergoing a major
transformation in New Zealand, particularly since the
1960s. Women who had children during the baby-boom
years of the 1950s and 1960s were the last generation
among whom a majority adhered to traditional
expectations surrounding marriage and childbearing.
Since the baby-boom period, marriage has given way to
cohabitation as the preferred first union. Consequently,
age at first marriage for women has progressively been
delayed until the late 20s and 30s. Over 90 percent of
first marriages are now preceded by cohabitation and
this phenomenon is very similar for both Ma-ori and non-
Ma-ori women.
However, there remains a major ethnic difference in
union formation: Ma-ori women are more likely to enter
into a first union in their teens than their non-Ma-ori
counterparts. There is also a historical difference in
cohabitation rates between Ma-ori and non-Ma-ori: for all
birth cohorts, including the older ones, Ma-ori women
have had a greater propensity to cohabit than non-Ma-ori
women. While the preference for early union formation
among Ma-ori means that Ma-ori women are more likely
than non-Ma-ori women to marry during their teenage
years, they are less likely to marry than non-Ma-ori
women once they have turned 20.
The trends in cohabitation and first marriage run
parallel but in opposite directions. Consequently, the
proportion of women who had entered a union of any
form (marriage or cohabitation) by 30 years of age has
remained high and stable. By 30 years of age, there
was very little difference between Ma-ori and non-Ma-ori
women in the proportions who had entered a first union.
The changes in cohabitation and marriage have been
accompanied by two related phenomena. There is an
increased propensity now, compared with the past, for
women to have lived in at least two unions by the time
they reach 30 years of age. There is also an emerging
relationship pattern among younger women: living-
apart-together. In 1995, one out of every three women
aged 20–24 who were in a relationship was living apart
from her partner. Typically, these women were still living
with their parents.
The period since 1970 has also seen substantial
increases in rates of separation from first marriages.
Although the propensity to separate continued to
increase in the 1980s, the major change had occurred
between the 1960s and the 1970s. The increase in the
1980s was more modest and there was little further
increase in the 1990s. This indicates that the likelihood
of separation may now have stabilised.
About one in five women had separated from a first
marriage within 10 years. The risk of separation was
highest during the early years of marriage and declined
as the duration of the marriage lengthened. A woman’s
chances of separation also diminished with increasing
age. Women from the most recent birth cohort were
much more likely to separate than those born earlier.
Getting married at a young age also increased the
probability of separation.
The increased propensity to separate from first
marriages has been accompanied by an increased
propensity to enter new partnerships after separation.
In fact, about three out of four women had repartnered
within 10 years of their separation. Repartnering was
most likely shortly after separation and the longer a
woman had been separated, the less likely it became
that she would repartner. Being younger at the time of
n this chapter, we bring together the major findings of the study and make some general
observations on patterns of family formation and change in New Zealand. The major purpose of the
report was to document the changing patterns of family formation, dissolution and reconstitution
in New Zealand over the period since the Second World War and to show how this has affected the
contexts in which children are raised. More specifically, we have examined patterns of union formation
(including both cohabitation and marriage), separation from marriages, repartnering, timing of
parenthood, sole parenthood, prevalence of blended families and children’s patterns of leaving home.
I

Su
mm
ary and
Con
clusio
ns
87
Raisin
g Ch
ildren
in N
ew Zealan
d
the separation, being childless, having no children aged
younger than 16 and having a professional occupation
all increased the propensity of separated women to
enter into a new union, whether this was a cohabitation
or a marriage. Interestingly, there was no significant
difference between Ma-ori and non-Ma-ori women in the
likelihood of repartnership after separation.
Despite the transformations in union formation and
dissolution, most women can be expected to reach
parenthood by the end of their reproductive lives.
However, the timing of parenthood has also undergone
major changes. Childbearing is now concentrated
between the ages of 20 and 29 for Ma-ori women and
between the ages of 25 and 39 for non-Ma-ori women.
Delayed childbearing is more common among the more
recent birth cohorts, among non-Ma-ori women and
among highly educated women.
A corollary of delayed childbearing is that an increasing
proportion of women in their 20s and early 30s remain
childless. This raises the possibility that many women
may remain childless as they near the end of their
reproductive span. However, data on women’s future
childbearing intentions showed that only about one in
10 women might remain childless if these intentions
were to be realised. This is close to current rates of
childlessness among the older cohorts of women in
the survey.
Changes have also occurred in the family context
in which children are born. Increasing numbers of
births are occurring outside legal marriage, both in
cohabitation and outside any form of union. For the
most recent birth cohorts and time periods, where a
woman had her first birth before the age of 20, in an
overwhelming majority of cases the child was born either
in cohabitation or outside any form of union, rather than
within a traditional conjugal union. Indeed, it is evident
that, in all age groups, having children in cohabitation
has gained momentum in recent years.
Although teenage motherhood is not as common as during
the peak of the baby-boom period, it is still more common
among Ma-ori women than among non-Ma-ori women.
Moreover, there was a strong association between the
childbearing patterns of mothers and their daughters.
The daughter of a teenage mother was more likely to
become a teenage mother herself than the daughter of a
woman who had had her first baby after the age of 20.
A major outcome of all these changes has been the
emergence of sole-parent families as a significant
component of the total population of families. Women
who have children now have roughly a 50 percent
chance that they will spend some time during their
lives as a sole mother. Teenage mothers and mothers
of more recent birth cohorts are several times more
likely to become sole parents than other mothers. The
educational qualifications of mothers, along with their
ethnicity, were not strong determinants of the probability
of becoming a sole parent. Once a woman had become
a sole parent, she was more likely to exit from sole
parenthood if she was younger, held a professional or
semi-professional job or had been a sole parent for a
shorter time.
About three in five sole mothers were not in a paid job
when they became a sole parent. Sole mothers who
were Ma-ori, were younger or had few or no educational
qualifications were less likely to be in paid work. A sole
mother’s chances of moving into the paid workforce were
greater if she had a higher-level educational qualification
or at least three years’ prior work experience.
Interestingly, there was no major difference between
Ma-ori and non-Ma-ori sole mothers in the probability of
entry into the workforce.
Just under 40 percent of children had spent some time
living with a sole mother before they turned 17. Children
of Ma-ori and Pacific ethnicity were about 75 percent
and 90 percent more likely, respectively, to have spent
some time living with a sole mother than other children.
Children of teenage mothers were more likely to have
spent some time living with a sole mother and the
probability of living with a sole mother was highest in
the preschool years.
A majority of children leave home between the ages of
17 and 20: around three out of every five children had
left home before they turned 20. However, there appears
to be an emerging tendency among children of more
recent birth cohorts to stay at home longer than children
of older birth cohorts did. There was also a gender
difference in the age at which children leave home. After
their 16th birthday, female children were more likely
than male children to leave home.
The partnership status of the mother was also an
important determinant of children’s propensity to leave
home. Children who were living with their mother and a
Su
mm
ary
and
Co
ncl
usi
on
s
88
Rai
sin
g C
hil
dre
n in
New
Zea
lan
d
stepfather had the highest likelihood of leaving home at
an early age, followed by those who were living with a
sole mother. Those who were least likely to leave home
early were children living with both original parents. This
tendency was more pronounced for female children than
for male children: indeed, from the age of 10 on, female
children were more likely than male children to leave
home if they lived with their mother and a stepfather.
The presence of a stepfather, then, appears to increase
the probability that children will leave home at an early
age, especially for females.
Another major outcome of the changing dynamics of
union dissolution, repartnering and childbearing is the
increasing prevalence of blended families. Although the
data on blended families available from the NZWFEE
survey did not lend themselves to definitive analysis, it
was possible to draw some indicative conclusions. The
results suggest that close to a fifth of women have, at
some time, been parents in a blended family. In the vast
majority of cases, these were partial-blended families,
which include children from a previous union (or unions)
of one partner only. Only a very small number of mothers
(2.5 percent) had lived in a full-blended family, which
includes children from previous relationships of both
partners. Ma-ori women were about twice as likely
as non-Ma-ori women to have spent some time in a
blended family. Similarly, women with no educational
qualifications were about twice as likely to have lived in
a blended family as those with a university degree. The
experience of living in a blended family was also more
common among more recent birth cohorts.
Among the children of women in the survey, a fifth had
spent some time living in a blended family before 17
years of age. Ma-ori children and those born since the
1970s were more likely to have lived in a blended family
than were non-Ma-ori children and those born during the
1950s and 1960s. The duration of time children stayed
in a blended family was generally short. For a third of
the children who had spent time living in a blended
family, the spell had ended within three years and, for
nearly half, the spell had ended within five years. While
there remain a number of unanswered questions about
children’s experience of blended families, it is clear
that, at least for some children, the spell in a blended
family occupied only a relatively small portion of their
childhood.
In summary, the data presented in this report confirm
that there have been major changes in patterns of family
formation, dissolution and repartnering in New Zealand
over recent decades. These changes mirror those
observed in other developed countries where delayed
marriage and childbearing, cohabitation, separation,
repartnering and multiple unions are all more common
now than in the past. As a result of these changes,
family structures are also changing, which in turn is
altering the contexts in which children are raised. These
changes, and the underlying factors that have given
rise to them, have wide-ranging implications across the
whole domain of social policy. While it is beyond the
scope of this report to discuss these implications, the
information provided here should assist with the task of
planning public policy responses, by providing a sounder
information base about the nature, scope and effect of
changes that have been reshaping New Zealand families
over recent decades.

References

Rai
sin
g C
hil
dre
n in
New
Zea
lan
dR
efer
ence
s
90
ReferencesAitkin, M., Anderson, D., Francis, B. and Hinde, J. (1984). Statistical Modelling in GLIM. Oxford: Clarendon Press.
Allison, P.D. (1984). Event History Analysis. Regression for Longitudinal Event Data. Newbury Park: Sage Publications.
Burch, T. and Belanger, D. (1999). “L’etude des unions en demographie: des categories aux processus”. Cahiers
Quebecois de Demographie 28(1&2): 23–52.
Department of Statistics. (1993). New Zealand Standard Classifications of Ethnicity. Wellington: Department of
Statistics.
Marsault, A., Pool, I., Dharmalingam, A., Hillcoat-Nallétamby, S., Johnstone, K., Smith, C. and George, M. (1997).
Technical and Methodological Report. Hamilton: University of Waikato.
Pool, I. (1998). “The Family Court in 2015: The Socio-Demographic Context”. Paper presented at New Zealand Law
Society Family Law Conference, Christchurch.
StataCorp. (2001). Stata Statistical Software: Release 7.0. College Station, TX: Stata Corporation.
Villeneuve-Gokalp, C. (1990). “Du mariage aux unions sans papiers: histoire recente des transformations conjugales”.
Population 45(2): 265–296.
Villeneuve-Gokalp, C. (1997). “Vivre en couple chacun chez soi”. Population 52(5): 1059–1082.


Patterns of Family Formation
and Change in New Zealand
Arunachalam Dharmalingam,
Ian Pool, Janet Sceats and Ross Mackay
Raising Children in New Zealand
ISBN: 0-478-18311-9
Centre for Social Research and Evaluation