patterns of quaternary uplift of the corinth rift southern ... · peloponnese, greece) revealed by...
TRANSCRIPT

Published in : Geomorphology (2015), vol. 246, pp. 188-204
Status : Postprint (Author’s version)
Patterns of Quaternary uplift of the Corinth rift southern border (N
Peloponnese, Greece) revealed by fluvial landscape morphometry
A. Demoulin a,b , A. Beckers a,c, A. Hubert-Ferraria
a Dept. of Physical Geography and Quaternary, University of Liège, Liège, Belgium b Fund for Scientific Research — FNRS, Brussels, Belgium c Fund for Scientific Research — FRIA, Brussels, Belgium
ABSTRACT
The Rift of Corinth is a world-class example of young active rifting and, as such, is an ideal natural laboratory of
continental extension. However, though much investigated for two decades, several aspects of the mechanisms at
work are still poorly understood. The aim of this paper is a detailed morphometric study of the fluvial landscape
response to the tectonic uplift of the rift southern shoulder in order to reconstruct the rift's Quaternary evolution,
with special attention to timing, location, and intensity of uplift episodes. Based on the use of a large set of
catchment and long profile metrics complemented by the new R/SR integrative approach of the regional drainage
network, we identified three distinct episodes of uplift of the northern Peloponnese coastal tract, of which the
intermediate one, dated around 0.35-0.4 Ma, is only recorded in the topography of the central part of the rift
shoulder, and the youngest one appears to have propagated from east to west over the last 10-20 ka. While net
uplift remained minimum in the eastern part of the study area during the whole Quaternary, it shows a clear
maximum in the central part of the rift shoulder since 0.4 Ma and an eastward shift of this maximum in recent
times. Maximum uplift rates calculated from the morphometric data are of > 1.05 and 2-5 mm year-1 for, the
mid-Middle Pleistocene and Holocene uplift episodes, respectively. The morphometric evidence reveals an
onshore uplift history remarkably consistent with the rift evolution reconstructed from other data sets. In the long
term, it shows a stable pattern of maximum activity in the central part of the rift, confirming previous
conclusions about the absence of rift propagation. In the short term, it sheds light on a possible E-W migration of
the zone of recent uplift, suggesting that in the near future fault activity and seismic hazard might concentrate in
the Heliki–Aegion area, at the western tip of this uplift wave.
KEYWORDS: Aegean domain Corinth rift Geomorphometry Uplift
1. INTRODUCTION
The Rift of Corinth is the most active extensional crustal structure currently observable in Europe and, as such, it
has been used for more than 20 years as a natural laboratory where multiple studies are conducted to understand
the mechanisms at work at various scales from regional geodynamic through rift to individual fault scales.
Despite all efforts, the debate goes on about several important issues, among which is a need for a more detailed
knowledge of the Plio-Quaternary evolution of the basin and its emerged margins, especially regarding
chronology (e.g., Ford et al., 2013), E-W variations in subsidence and uplift along its southern border (e.g.,
McNeill and Collier, 2004; Bell et al., 2009), and the discrepancy between moderate Pleistocene and high
modern extension rates (e.g., Bell et al., 2011).
In this study, we carry out an in-depth morphometric analysis of the 10 largest catchments draining the
Peloponnesian margin of the rift of Corinth in order to unravel and date the uplift history of the area. We
apply a comprehensive set of morphometric tools (catchment, drainage network, and river long profile metrics
and indices) for identifying the landscape response to spatially and temporally variable uplift signals. We find
that the fluvial landscape keeps a detailed record of the last three uplift episodes that affected the northern
Peloponnese. Our results support recent findings both onshore and offshore, and provide an independent and
broader insight in the timing and the spatial variations of uplift along the rift shoulder. This should help in
investigating the factors and mechanisms responsible for the Quaternary S-N migration of the rift.
2. GEOLOGICAL AND GEOMORPHOLOGICAL SETTING
The Rift of Corinth is the main extensional structure currently active in the back-arc region of the Hellenic
subduction zone (Fig. 1) and, as such, is one of the most seismically hazardous areas of the Mediterranean
region, with frequent Mw > 6 earthquakes. Crustal thinning is especially marked in its eastern part, with crustal
thickness in the order of 28-30 km, while the thickened crust (>40 km) of the Hellenides is hardly affected in its
western part (Sachpazi et al., 2007). The rift is ~105 km in length and, with its WNW-ESE strike, cuts obliquely

Published in : Geomorphology (2015), vol. 246, pp. 188-204
Status : Postprint (Author’s version)
through the NNW-trending Mesozoic-Paleogene nappe stack of the Hellenides (Fig. 1), mainly made of
Mesozoic carbonates, plus some Paleocene flyschs (Doutsos et al., 2006). One of several transverse faults that
segmented the Mesozoic Pindos Ocean, the Corinth Gulf Fault Zone, contributed toward deviating the structural
grain of the hinterland Parnassos zone in a WNW-ESE direction, just to the north of the present gulf (Skourlis
and Doutsos, 2003). Beyond being situated approximately at the tip of the SW-propagating North Anatolian
Fault (Armijo et al., 1999) (Fig. 1), the exact location of the Plio-Quaternary Rift of Corinth might thus have
been determined also by these inherited features (Taylor et al., 2011).
Fig. 1. Tectonic setting of the study area. Ps: Psathopyrgos fault Se: Selinitika fault. Ae: Aegion fault La: Lakka
fault WH: West Heliki fault EH: East Heliki fault. Kr: Krathis fault De: Derveni faut Si: Sithas fault. Xy:
Xylokastro fault P-M: Pirgaki-Mamousia fault. Va: Valimi fault Kia: Kiato fault Do: Doumena fault. Ke:
Kerpini fault Ka: Kalavrita fault. Kil: Kilini fault. N/SE: North and South Eratini faults. WC: West Channel
fault. EC: East Channel fault Shaded areas represent Plio-Quaternary deposits. Oblique hatching represents
zones of marine terrace preservation. Inset. HS: Hellenic subduction zone. NAF: North Anatolian Fault
The Corinth gulf is widest (25-30 km) in its east-central part, where it is also deepest (with a maximum water
depth of 900 m) and records the thickest syn-rift sediment pile (up to ~3000 m — Taylor et al., 2011). While it
prolongs eastward into two branches formed by the much shallower (~200-m-deep) Alkyonides and Lechaion
gulfs, it rapidly narrows to 10 km and less west of Heliki and Aegion. Although the basin's deep prolongs to the
west in a longitudinal canyon that dissects the gulfs bottom, water depth diminishes to less than 400 m, down to
a ~60 m sill depth where the Rion-Antirion strait connects the Corinth and Patras gulfs.
The faulted margins of the rift are comprised of roughly E-W normal faults. Many seismic reflection studies
contributed in the last decade toward an improved mapping of active offshore faults (e.g., Stefatos et al., 2002;
Lykousis et al., 2007; Bell et al., 2008; Taylor et al., 2011; Beckers et al., 2015). The mostly north-dipping faults
of the southern margin are grouped in several parallel lines of right-stepping en-échelon faults, both on- and
offshore. The presence of uplifted syn-rift sediments widely exposed in the northern Peloponnese bears witness
to a significant uplift of the southern rift shoulder (Rohais et al., 2007a; Ford et al., 2013). By contrast, most
faults of the northern margin are located in a narrow zone situated within the drowned part of the rift. In
agreement with the more winding northern coastline, the widening of the gulf into the Itea and Antikyra bays,
and the absence of exposed sediments on that side of the basin, this indicates that the northern rift shoulder
undergoes subsidence (Stefatos et al., 2002; Bell et al., 2009).

Published in : Geomorphology (2015), vol. 246, pp. 188-204
Status : Postprint (Author’s version)
The starting time of the Corinth rift formation is still not well constrained. While Doutsos and Piper (1990) make
the oldest rift fill Middle to Late Pliocene in age, Rohais et al. (2007b) and Ford et al. (2013) put the initial
stages of rifting in a time period encompassing the Upper Pliocene and the Lower Pleistocene and date the first
rift deepening event from between 1.8 and 1.5 Ma. Recently, Leeder et al. (2012) dated their so-called "Great
Deepening event" from 3.2 to 3 Ma in the east-central rift sector. In their evolution scheme, it corresponds to
focused extension on the Killini and Mavro faults and might therefore tentatively be correlated with the initial
rifting stage of Rohais et al. (2007b), although the latter authors envisage this phase as one of slow extension and
subsidence. Based notably on detailed studies of the syn-rift fill exposed on the uplifted southern shoulder of the
west-central rift (e.g., Ori, 1989; Rohais et al., 2007b; Ford et al., 2013), and though its chronology is still
debated, the following multiphase rift evolution is now commonly accepted. The initial rifting stages caused
fluvio-lacustrine sediments to accumulate within a fairly large area where all faults more or less participated in
accommodating slow subsidence (extension rates < 1 mm year-1; Ford et al., 2013). To the south, this area
extended as far as the Kalavrita and Killini faults (Fig. 1). These continental environments then progressively
gave way to brackish environments interrupted by brief marine incursions, leading to a second evolution stage
that would have started around 1.5 Ma (Rohais et al., 2007b; Leeder et al., 2012). This second stage was marked
by an abrupt increase in extension (2-2.5 mm year-1) and subsidence rates (individual fault slip rates in the order
of 1-2 mm year-1). Antecedent rivers incising the elevated hinterland started to accumulate, mainly north of a line
joining the Pirgaki, Mamousia, and Kilini faults, huge alluvial fans going northward into giant Gilbert-type
deltas. During their estimated -0.8 Ma lifetime, northward progradation of the deltas, possibly recording the
northward migration of the uplifting area (Rohais et al., 2007a), progressively shifted the central gulfs southern
shoreline by about 15 km (Rohais et al., 2007b). By contrast, in the west, Ford et al. (2013) suggest that
northward migration of fault activity onto the Pirgaki and Mamousia faults occurred more abruptly at the
beginning of this stage. A third phase of the rift evolution is estimated to have begun sometime around or after
0.7 Ma and was again characterized by accelerated extension, reaching rates in the order of 3.4-4.8 mm year-1
(Ford et al., 2013) and by a further 5 km northward migration of the southern rift margin, which came to
coincide with the Heliki (and onshore Xylokastro?) faults. Consequently, the first-generation Gilbert fan deltas
were incised by the drainage network establishing on the uplifting footwall of these faults, thus delivering
material to new deltas prograding on their hangingwall. These deltas are, for the greatest part, still developing at
present, with their front making the steep underwater slopes of the southern border of the basin. Onshore, the
presence of Middle Pleistocene marine terraces south of the Heliki and Xylokastro faults (Keraudren et al., 1995;
Armijo et al., 1996; McNeill and Collier, 2004; De Martini et al., 2004; McNeill et al., 2005) attest the ongoing
footwall uplift of Middle Pleistocene faults.
Finally, observations of uplifted Holocene corrosion notches, lithophaga perforations and corals at the seaside
just south of the Heliki and Xylokastro faults (Pirazzoli et al., 2004) and the recent partial transfer of activity
from the Heliki to the northward located Aegion fault might be interpreted as precursors of a further migration of
fault activity across the southern rift margin. In any case, this recent evolution coincides with an apparent
increase in modern extension rates. Indeed, GPS measurements in the Corinth gulf area indicate current rates
ranging from < 5 mm year-1 at the eastern end of the rift to 11 mm year-1 at the height of Xylokastro and 16 mm
year-1 in the western rift (Avallone et al., 2004; Nyst and Thatcher, 2004; Bernard etal., 2006). However, beyond
the fact that the E-W variation of these rates does not superpose with long-term variations showing maximum
total extension in the central rift (Bell et al., 2011), the question of how, if ever, geologically instantaneous GPS
rates may compare with long-term averaged rates is still debated (e.g., Friedrich et al., 2003; Bell et al., 2011).
On the northern side of the basin, Bell et al. (2008) observe partial northward transfer of fault activity from the
West and East Channel faults to the South and North Eratini faults (Fig. 1) since 0.5 Ma. Though consistent with
evidence of subsidence of the northern rift margin, such migrating fault activity is limited to this small west-
central part of the graben and, even there, did not exceed ~8 km, a much lower figure than in the south. It thus
just tempers locally the progressive focusing of the deformation and the rift narrowing that accompanied the
latter's northward migration (Bell et al., 2009; Taylor et al., 2011).
Offshore, the identification of major seismic reflectors widely distributed throughout the basin leads to
distinguish successive sequences within the basin fill (e.g., Bell et al., 2011; Taylor et al., 2011). However, in the
absence of drill-hole data, a major obstacle in using such sequence boundaries is the difficulty to establish a
reliable chronostratigraphy. The approach adopted by most authors in the Rift of Corinth has thus been to refer
alternating packages of high-amplitude and low-amplitude reflectors to either lacustrine or marine sedimentation
and to correlate the identified marine-lacustrine interfaces with the times when the glacio-eustatic sea-level curve
passed across the eustatic level corresponding to the depth of the Rion-Antirion sill. Although contradictory
models have been used in linking reflector packages to specific environments (Piper and Perissoratis, 1991;
Leeder et al., 1998; Perissoratis et al., 2000; Collier et al., 2000), the recent study of Taylor et al. (2011) provides

Published in : Geomorphology (2015), vol. 246, pp. 188-204
Status : Postprint (Author’s version)
a synthesis of the seismic imaging information across the Rift of Corinth at the 105 year time scale. They
distinguish two first-order packages of reflectors in the basin fill, which they refer to an early-rift and a late-rift
section, putting the transition around 0.68 Ma. Moreover, they recognize two second order boundaries within the
latter section, which they date back to 0.335 and 0.130 Ma. However, Nixon et al. (2013) consensually displace
the main transition from ~0.68 to 0.60 Ma because the late-rift section is made of six marine-lacustrine packages
that they associate to the last six glacial cycles. This 0.6 Ma discontinuity corresponds also to the main boundary
within the seismic profiles that Bell et al. (2008, 2009) put around 0.4 Ma. Keeping in mind the dating
uncertainties, the isopach maps of Taylor et al. (2011) describing sedimentation in the gulf show that, before 0.7
Ma, two separate depocentres existed, a main one situated in the west-central gulf in front of the southern coast
between Akrata and Derveni, and a minor one in the eastern gulf. Then, from 0.7 Ma, they were replaced by a
unique larger zone of focused sedimentation located again in the southern half of the basin, between Derveni and
Kiato. The locus of maximum deposition within this Middle Pleistocene depocentre seems to have migrated
eastward with time, being located in front of Xylokastro on the post-0.130 Ma map. Though less detailed in time,
the reconstructions of Bell et al. (2009) also support this spatio-temporal distribution of sedimentation, with two
depocentres before 0.4 Ma, from which the one in front of Akrata was the most active, then an elongate
depocentre from Derveni to Kiato after 0.4 Ma, with maximum sedimentation in front of Xylokastro.
A major onshore implication of the northward migration of the southern rift margin was the emergence of
successive tracts of land in the footwall of the active faults. There, up to 2800-m-thick synrift sediments have
been uplifted and, subsequently, exposed to erosion (Rohais et al., 2007a). The resulting geomorphological
sequence of the northern Peloponnese displays, from south to north (1) drainage networks strongly incised
within former uplifted footwall blocks, with deep narrow gorges (e.g., the Vouraikos gorge) and valley depths of
500 to 800 m; (2) characteristic braided channels in the middle and lower river reaches, transferring huge
amounts of sediments delivered by the eroding uplifted deltas; (3) coastal areas extending a few kilometres
inland and showing poorly developed drainage systems and limited incision in the uplifting footwall of the
currently active rift margin; and (4) development of large fan deltas along the modern shoreline. Owing to the
proximity of the crestline of the northern Péloponnèse, distant by less than 50 km from the coastline, and to
footwall backtilting, the river catchments are limited in size. With a length of 49 km and a catchment area of 366
km2, the Selinous is the largest Peloponnesian river draining to the Corinth gulf. Backtilting also caused drainage
reversal toward poljes developed in the limestone basement cropping out in the south (Feneos, Stymfalia),
forming endorheic basins at the expense of the north-flowing rivers (Rohais et al., 2007a). Furthermore, karstic
phenomena are also present in the catchments of some of these rivers (e.g., the Asopos), significantly reducing
discharge and stream power in the concerned reaches.
Footwall uplift associated with the current line of active faults had a further consequence that successive Middle
and late Pleistocene shorelines have been raised in marine terraces along the southern gulf coast, offering dating
potential and insight into uplift rates. A flight of up to 10 terraces has been described in various places. They are
in particular fairly continuously preserved between Corinth and Xylokastro (Keraudren and Sorel, 1987; Collier
etal., 1992; Keraudren et al., 1995; Armijo etal., 1996), but also on the footwall of the Aegion and Heliki faults
between Aegion and Akrata (De Martini et al., 2004; McNeill and Collier, 2004; McNeill et al., 2005). Stepped
marine terraces have also been observed at both the eastern and western ends of the rift, respectively in the
Perachora Peninsula (Dia et al., 1997; Morewood and Roberts, 1999; Maroukian et al., 2008) and on the footwall
of the Psathopyrgos fault (Houghton et al., 2003) (Fig. 1). However, in many cases, only few and often
questionable dating results are available and the terrace chronology mostly relies on linear best fits (often
performed visually) between terrace elevation and marine isotope stages associated with high sea level. Based on
such sparse anchor points, the terrace flight is generally said to extend over the last 0.3-0.55 Ma and allows
inferences about uplift rates in the order of 1-2 mm year-1 (Keraudrenetal., 1995; Armijc et al., 1996; De Martini
et al., 2004; McNeill and Collier, 2004). Whereas moderate (Houghton et al., 2003: ~0.7 mm year-1) to high
(Palyvos et al., 2007, 2010: ~1.8 mm year-1) rates have been inferred for the western end of the rift, they rapidly
decrease toward the eastern end of the gulf, down to 0.3 mm year-1 near Corinth (Collier et al., 1992) As for the
marine terraces of the Perachora Peninsula, which suggest uplift rates between 0.3 and 0.7 mm year-1
(Morewood and Roberts 1999), they are indicative of uplift north of the south-dipping Loutraki fault and cannot
thus be used to discuss the evolution of the southern rift margin.
The higher uplift rates inferred in the central sector of the northern Péloponnèse coast are also confirmed by
Rohais et al. (2007a), whose restoration of the syn-rift infill implies that the Krathis region was most uplifted.
Moreover, uplifted Holocene marine deposits and corrosion notches along the coast of the central rift have
recorded recently accelerated uplift, with rates up to 3-3.5 mm year-1 (Pirazzoli et al. 2004; De Martini et al.,
2004).

Published in : Geomorphology (2015), vol. 246, pp. 188-204
Status : Postprint (Author’s version)
3. METHODS
Based on the assumption that the 3D shape of fluvial catchment; preserves a detailed record of the regional
tectonic history, our analysis of the main Peloponnesian catchments draining into the Gulf of Corinth relies on an
extended set of morphometric measurements. The data set refers to 10 catchments (Fig. 2) with size ranging
from 65 (Meganitis) to 366 km2 (Selinous) (Table 1). We do not include the Vouraikos catchment because its
extreme elongation and the resulting limited development of its tributary network significantly bias several
calculated metrics. However, owing to its crucial position in the west-central sector of the rift, the morphological
characteristics of the Vouraikos valley, and those of the nearby Ladopotamos valley as well, will be called upon
to support the discussion. We first examine information delivered by metrics describing catchment hypsometry.
Then, we turn to classical metrics of river long profiles, namely profile concavity and steepness (Flint, 1974;
Wobus et al., 2006), determined with the aid of the integral or 'chi plot' approach of Perron and Royden (2013).
Finally, we use the R metric and the derived SR index proposed by Demoulin (2011) to describe the stage
reached by the whole landscape in its response to the tectonic signals and estimate the age of the latter.
All metrics were satisfactorily estimated from an ISTAR digital elevation model produced from aerial
photographs. Pixel size is 20 x 20 m, and standard deviation of elevation values is ~10 m. Hydrological
correction of the DEM and data extraction were carried out with ArcMap 10.2, with first-order streams of the
drainage network defined to start for catchment area = 0.5 km2.
3.1. Basin hypsometry
The notions of hypsometric curve and integral were popularized by Strahler (1952). Plotting normalized
elevations against normalized areas, the hypsometric curve describes the cumulative distribution of elevations
within a catchment. The associated hypsometric integral Hb corresponds to the surface under the curve (Fig. 3A).
It represents the rock volume of the basin as a percentage of a unit volume whose generatrix is the horizontal
surface delimited by the basin perimeter and whose base is at basin outlet's elevation and top at basin highest
point's elevation. The hypsometric integral is thought to provide a quantitative estimate of basin dissection and
thus of the state of landscape evolution, which may be interpreted in terms of response to tectonics (e.g., Chen et
al., 2003; Perez-Peña et al., 2009a; Gao et al., 2013) or of prevailing erosion processes, for example glacial
versus fluvial erosion (e.g., Brocklehurst and Whipple, 2004; Korup et al., 2005; Sternai et al., 2011). However,
while uncertainty about the initial topography biases to some extent the relative meaning of such quantities,
similar values of the integral may also correspond to quite different shapes of the hypsometric curve and witness
very different stages and/or mechanisms of landscape evolution (Bishop et al., 2002). This underscores the need
for additional analysis of the shape of the curve, which is performed only qualitatively in most cases and
consequently provides hardly instructive information. Beyond Strahler (1952), who showed that a mathematical
function involving three free parameters can be fitted to most natural hypsometric curves (see also Willgoose and
Hancock, 1998), a notable exception to this is the use of the hypsokyrtome, a shape parameter Sternai et al.
(2011) devised to evaluate the degree of glacial erosion of a landscape on the basis of the hypsometric curve.
However, because the hypsokyrtome was of no particular benefit in the northern Peloponnese setting of fluvially
dissected tectonic blocks, we built another shape descriptor (Hd/u) corresponding to the ratio between the
integrals of respectively the lower (right) and the upper (left) half of the curve (Fig. 3A). Hd/u is aimed at
quantitatively describing the degree of imbalance between the upper, hardly dissected regions of the catchment
and the eroded lower regions, which in turn should be indicative of the stage reached by fluvial incision and
lateral erosion.

Published in : Geomorphology (2015), vol. 246, pp. 188-204
Status : Postprint (Author’s version)
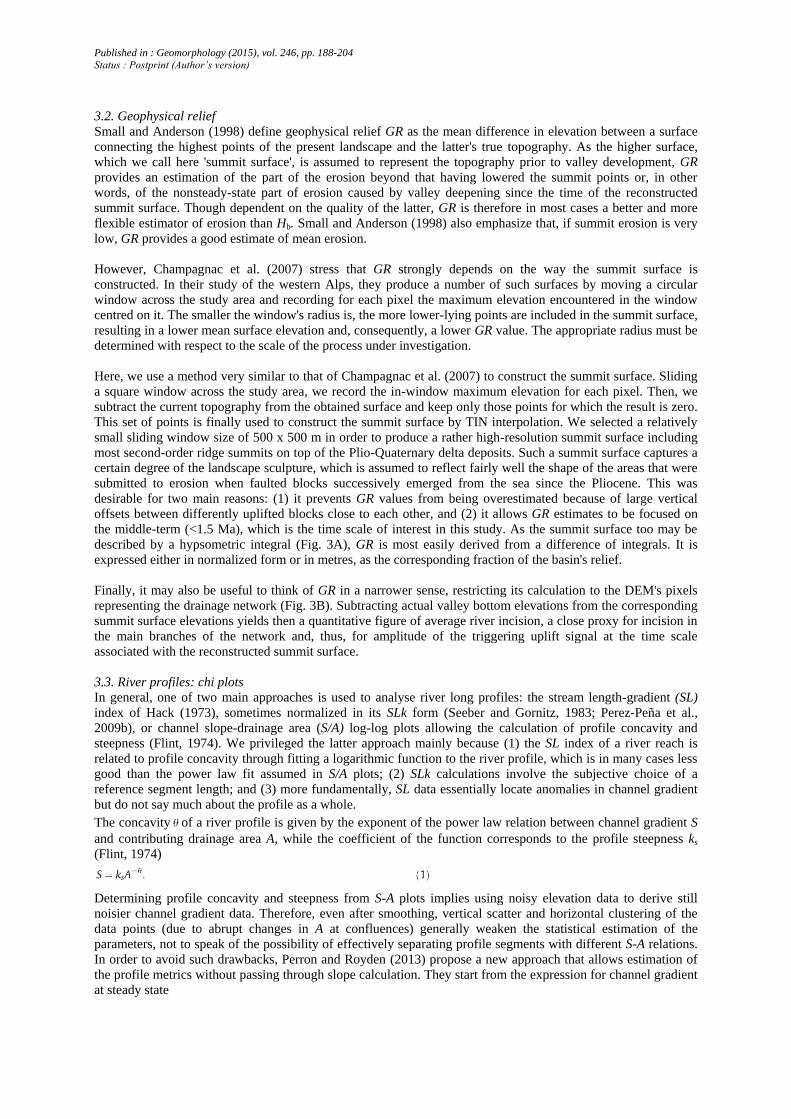
Fig. 2. Location map of the 10 studied catchments: 1: Phoenix. 2: Meganitis. 3: Selinous. 4: Kerynitis. 5:
Krathis. 6: Krios. 7: Trikalitikos. 8: Asopos. 9: Raizanis. 10: Xerias. Referring to distance in km, the white 0-100
line locates the information provided in Figs. 5, 10 and 11.
Fig. 3. Hypsometric analysis.
A) Definition of the basin metrics used in this study, based on the example of the Selinous. Hss: hypsometric
curve (normalized cumulative distribution of elevations) of the reconstructed summit surface of the catchment
(see text for explanation). Hb: basin hypsometric curve. The dark grey surface below Hb, noted ∫Hb, is the basin
hypsometric integral (for the sake of brevity, we simply note the integral Hb in the text). The light grey surface
(GR = ∫Hss—∫Hb) is the geophysical relief. Hu, Hd. upstream and downstream half of the basin integral, from
which Hd/u, a shape descriptor of the hypsometric curve, is calculated. B) Hss (network): hypsometric curve of the
summit surface pixel population corresponding to the drainage network of the catchment Hn: hypsometric curve
of the drainage network The light grey surface (GRnetwork) is that part of the geophysical relief restricted to the
drainage network a proxy for the average fluvial incision below the reference surface. GR and GRnetwork are here
in their normalized form. Their metric equivalent is obtained by multiplication by the catchment relief value.

Published in : Geomorphology (2015), vol. 246, pp. 188-204
Status : Postprint (Author’s version)
Table 1. General statistics and metrics of the 10 studied catchments.
Empty brackets correspond to meaningless values (profile segment too short, insufficient data number) ; (1)profile is convex upward (p2: 2nd-order polynomial) ; (2)locates the
profile inflexion point - value taken from the x axis = 1n( A) ; (3)profile is concave upward; (4)+ means that the low end of the upstream chi plot segment is higher than the high
end of the downstream segment, - means the opposite; (5)irrelevant
Table 1 (continued)
Published in : Geomorphology (2015), vol. 246, pp. 188-204
Status : Postprint (Author’s version)
3.2. Geophysical relief
Small and Anderson (1998) define geophysical relief GR as the mean difference in elevation between a surface
connecting the highest points of the present landscape and the latter's true topography. As the higher surface,
which we call here 'summit surface', is assumed to represent the topography prior to valley development, GR
provides an estimation of the part of the erosion beyond that having lowered the summit points or, in other
words, of the nonsteady-state part of erosion caused by valley deepening since the time of the reconstructed
summit surface. Though dependent on the quality of the latter, GR is therefore in most cases a better and more
flexible estimator of erosion than Hb. Small and Anderson (1998) also emphasize that, if summit erosion is very
low, GR provides a good estimate of mean erosion.
However, Champagnac et al. (2007) stress that GR strongly depends on the way the summit surface is
constructed. In their study of the western Alps, they produce a number of such surfaces by moving a circular
window across the study area and recording for each pixel the maximum elevation encountered in the window
centred on it. The smaller the window's radius is, the more lower-lying points are included in the summit surface,
resulting in a lower mean surface elevation and, consequently, a lower GR value. The appropriate radius must be
determined with respect to the scale of the process under investigation.
Here, we use a method very similar to that of Champagnac et al. (2007) to construct the summit surface. Sliding
a square window across the study area, we record the in-window maximum elevation for each pixel. Then, we
subtract the current topography from the obtained surface and keep only those points for which the result is zero.
This set of points is finally used to construct the summit surface by TIN interpolation. We selected a relatively
small sliding window size of 500 x 500 m in order to produce a rather high-resolution summit surface including
most second-order ridge summits on top of the Plio-Quaternary delta deposits. Such a summit surface captures a
certain degree of the landscape sculpture, which is assumed to reflect fairly well the shape of the areas that were
submitted to erosion when faulted blocks successively emerged from the sea since the Pliocene. This was
desirable for two main reasons: (1) it prevents GR values from being overestimated because of large vertical
offsets between differently uplifted blocks close to each other, and (2) it allows GR estimates to be focused on
the middle-term (<1.5 Ma), which is the time scale of interest in this study. As the summit surface too may be
described by a hypsometric integral (Fig. 3A), GR is most easily derived from a difference of integrals. It is
expressed either in normalized form or in metres, as the corresponding fraction of the basin's relief.
Finally, it may also be useful to think of GR in a narrower sense, restricting its calculation to the DEM's pixels
representing the drainage network (Fig. 3B). Subtracting actual valley bottom elevations from the corresponding
summit surface elevations yields then a quantitative figure of average river incision, a close proxy for incision in
the main branches of the network and, thus, for amplitude of the triggering uplift signal at the time scale
associated with the reconstructed summit surface.
3.3. River profiles: chi plots
In general, one of two main approaches is used to analyse river long profiles: the stream length-gradient (SL)
index of Hack (1973), sometimes normalized in its SLk form (Seeber and Gornitz, 1983; Perez-Peña et al.,
2009b), or channel slope-drainage area (S/A) log-log plots allowing the calculation of profile concavity and
steepness (Flint, 1974). We privileged the latter approach mainly because (1) the SL index of a river reach is
related to profile concavity through fitting a logarithmic function to the river profile, which is in many cases less
good than the power law fit assumed in S/A plots; (2) SLk calculations involve the subjective choice of a
reference segment length; and (3) more fundamentally, SL data essentially locate anomalies in channel gradient
but do not say much about the profile as a whole.
The concavity of a river profile is given by the exponent of the power law relation between channel gradient S
and contributing drainage area A, while the coefficient of the function corresponds to the profile steepness ks
(Flint, 1974)
Determining profile concavity and steepness from S-A plots implies using noisy elevation data to derive still
noisier channel gradient data. Therefore, even after smoothing, vertical scatter and horizontal clustering of the
data points (due to abrupt changes in A at confluences) generally weaken the statistical estimation of the
parameters, not to speak of the possibility of effectively separating profile segments with different S-A relations.
In order to avoid such drawbacks, Perron and Royden (2013) propose a new approach that allows estimation of
the profile metrics without passing through slope calculation. They start from the expression for channel gradient
at steady state

Published in : Geomorphology (2015), vol. 246, pp. 188-204
Status : Postprint (Author’s version)
with U = uplift rate, K = erosion coefficient, and n and m = constants, derived from the generalized stream power
equation (e.g., Whipple and Tucker, 2002)
with zero net erosion rate E. Recalling that S = dz/ dx, they then simply rewrite Eq. (2) as
and integrate it to obtain, under assumption of constant U and K values,
with x0 = downstream endpoint of the profile, Aref = reference drainage area (we putAref = 1 km2), and
Thanks to the transformation of Eq. (6), Eq. (5) makes elevation of the theoretical profile depends linearly on the
new variable χ. Therefore, the concavity of a real river profile, which is represented by the m/n exponent of A in
Eq. (2), will be given by the m/n value in Eq. (6) that yields the best linear fit of the z = f(χ) profile, called the
chi plot. Once concavity has been determined that way, steepness, defined as the coefficient of A in Eq. (2) or,
similarly, of χ in Eq. (5), simply corresponds to the slope of the regression line.
As mentioned above, beyond noise reduction, another advantage of the chi plots is that they facilitate the
recognition of successive profile segments with different parameters. In this respect, Mudd et al. (2014) present a
framework to identify the statistically most meaningful partition of a chi profile in segments of different
steepness. However, we do not follow this approach because it allows only distinction of segments of varying
steepness but the same concavity, whereas varying concavity is expected to be as important an attribute of the
transient profiles we investigate. Our more empirical profile partition is based on visual inspection of the chi
plots, at the benefit of tracking simultaneously steepness and concavity variations. As a result, three data types
are obtained for each segment, namely (1) concavity, (2) steepness, and (3) the z offset between successive
segments.
Finally, while Eq. (2) shows that, at steady state, steepness ks is a direct function of rock uplift rate U and an
inverse function of erosion coefficient K (Snyder et al., 2000), it is also strongly correlated with profile
concavity. Consequently, qualitative inferences on uplift rate are preferably drawn from normalized steepness
values ksn, obtained by recalculating steepness based on a reference concavity fixed in general on the regional
average of the observed concavities (Wobus et al., 2006).
3.4. Age assessment: R/SR analysis
The landscape index SR corresponds to the first derivative of the regression function linking a complex landscape
metric R to the natural logarithm of drainage areaA (Demoulin, 2011). The R metric is calculable for fluvial
catchments of every size and takes the form of a ratio of two-by-two differences between the normalized
hypsometric integrals of the classical basin hypsometric curve Hb, the drainage network hypsometric curve Hn,
and the trunk stream long profile Hr (Fig. 4), thus describing three nested morphological levels respectively
indicative of the long-, middle-, and short-term components of the landscape response,
where l* is the dimensionless expression of length (for Hr and Hn) or area (for Hb). This raw measure of R is then
corrected for the effect of the drainage network's branching level, the correction factor relying on a
measure of catchment elongation E, calculated as with Lb = maximal length of the catchment, measured
from its outlet (Demoulin, 2012; Demoulin et al., 2013).
The composite nature of R is specifically aimed at capturing information about the stage reached by the drainage
system's transient response to any perturbation corresponding to a relative base level lowering. As this response
occurs primarily through the propagation of a wave of erosion travelling from the catchment outlet upstream
through the drainage network, it makes the metric able to extract time information from the landscape shape.
Demoulin (2011) shows that, following a base level lowering, the initial response stage of a preexisting drainage

Published in : Geomorphology (2015), vol. 246, pp. 188-204
Status : Postprint (Author’s version)
system leads to a rapid increase in R. Then, in the middle term (> 104-105 years), the low courses of trunk stream
and major tributaries having reached a new equilibrium, erosion proceeds at a progressively slower pace in the
upper course of the trunk stream while it propagates simultaneously in an increasing number of tributaries and
sub-tributaries, so that R begins to decrease slowly with time. This behaviour allows the metric to be used as a
chronometer for this stage of the evolution, which lasts a few million years until the system's response is
completed in areas of moderate uplift and relief (Whipple, 2001; Whittaker et al., 2007).
Fig. 4. Description of the R metric components for the Selinous river:
l* = l /l0, with l0 = length of the river, cumulative length of its drainage network, and basin area respectively for
Hr, Hn, and Hb : h* = h/ h0, with h0 = basin relief. Hb, Hn and Hr, are the hypsometric curves, i.e., cumulative
distributions of altitudes, of the basin, the drainage network, and the trunk stream (Hr is therefore simply the
trunk stream long profile). E describes the basin's elongation.
However, the size of the contributing drainage area A is another major control on R, which thus cannot be used
as a direct proxy for time. Fortunately, the logarithmic function linking the metric to A is typical of each region
of uniform uplift history, and Demoulin (2011) shows that the slope SRof the linear relation between R and lnA is
theoretically expected to evolve also continuously with time during the transient response to a perturbation.
Therefore, SR may be used as another time indicator, free of basin size effect, and based on data from nine
uplifted regions worldwide, Demoulin (2012) proposes an empirical quantitative relation linking SR to the age of
uplift, reading
t = 0.009SR-4
(8)
with t = time in million years.
However, the R/SR approach suffers from some limitations. In particular, it works best for en-bloc uplifted
regions where a consistent relation may be estimated between R and catchment size. As data of rivers with
catchment larger than 150 km2 are needed to stabilize this relation, the study area should also be large enough to
encompass several such rivers, including a few rivers with drainage area above 1000 km2. Because of the limited
extent of the faulted blocks, such a condition is not met in the northern Peloponnese. However, Demoulin (2011)
shows that, despite a higher sensitivity to the spatial distribution of the tributary network, deriving the R=ƒ(ln A)
relation from R measurements at regular intervals along a single main river instead of using a sample of rivers of
different sizes yields very similar SR values. In the northern Peloponnese, where we suspect that small
contiguous areas experienced different uplift histories from east to west, the available range of river sizes was
insufficient to calculate a reliable R-ln A relation in any of these areas. We thus calculated SR values based on R
profiles established along the main rivers in each area. A further advantage of this approach is its capacity to
enhance potential streamwise changes in SR in relation with the N-S succession of faulted blocks. Demoulin et
al. (2013) show that the impact of other external controls on the relation between SR and time (e.g., direct
controls on incision rate, such as rock resistance and climate, noise in the R measurements caused by strongly
non-dendritic patterns of tributary networks) is minor in most cases.
The practical method to obtain the hypsometric curves and integrals of basin, drainage network and trunk stream,
needed to calculate the R metric, is described in detail by Demoulin (2011). Owing to the good DEM resolution
and quality, the induced uncertainty on R is smaller than a few percents. In any case, its effect on SR remains
within the standard error on the index as calculated from the regression of R on ln A.

Published in : Geomorphology (2015), vol. 246, pp. 188-204
Status : Postprint (Author’s version)
Fig. 5. East-west variation of the basin metrics (10 catchments, see Table 1).
A) Basin hypsometric integral. B) Same metric after removal of the basin size control on it. C) Shape descriptor
of the basin hypsometric curve, best indicator, among basin metrics, of the progress of the landscape response to
perturbation. D) Geophysical relief, expressed in metres. Distance is counted from the eastern end of the Gulf of
Lechaion; see Fig. 2 for location.
4. RESULTS AND DISCUSSION
The wealth and the variety of the collected morphometric data make it difficult to provide directly a
comprehensive overview of the results, let aside their integrated interpretation. We thus first present, analyse,
and discuss separately those results referring to whole catchments, trunk stream long profiles, and R/SR estimates
of uplift timing. The 10 rivers we selected in this study are more or less regularly spaced from one end of the
Gulf of Corinth to the other. They are also approximately of the same size (20 < L < 50 km; 65 <A < 370 km2,
see Table 1). Another requirement was that their watershed be not too elongated, so that their tributary network
is developed sufficiently to allow meaningful R measurements and SR estimates.
4.1. Basin hypsometry
4.1.1. Hypsometric integrals
The hypsometric integral values of the studied catchments range from 0.264 for the Raizanis in the east to 0.548
for the Krios in the central sector of the rift's southern border (Table 1). Although such variations certainly
contain significant information about controls on Hb, it does not make much sense to discuss the absolute values
of the integrals in terms of landscape youth or maturity, because almost all catchments are comprised of several
differently uplifted blocks, whose contrasted elevations and relative areas strongly affect integral value and
shape. The analysis of the E-W changes in Hb is more instructive. In spite of the effect of differential block
uplift, which affects to some degree almost all catchments, Hb shows a weak but significant negative correlation
with drainage area A (p = 0.072). The existence of such a correlation is generally thought to indicate a transient
state of landscape disequilibrium (Chen et al., 2003; Demoulin et al., 2013), which is consistent here with the
characteristics of the river long profiles (see below). Interestingly, using the residuals of the Hb =f(lnA)
regression improves the general shape of their observed E-W changes (Fig. 5A, B), making it highly consistent
with the E-W curve of other metrics (Fig. 5). The analysis of E-W changes in the values and residuals of Hb
points to positive residuals, corresponding to the highest values of the integral, for streams 3 to 6 in the west-
central part of the rift border (from Selinous to Krios, Fig. 5B). This peak in Hb values in the Aegion-Derveni
sector is a first morphometric indication that landscape rejuvenation there results from the most recent and/or
strongest rock uplift, and subsequent drainage network incision. Elsewhere, the distinctly larger negative residual
and anomalously low integral of the Raizanis primarily result from the presence of a small topographic basin in
its upper catchment.

Published in : Geomorphology (2015), vol. 246, pp. 188-204
Status : Postprint (Author’s version)
4.1.2. Hypsometric curve shape
The observed Hd/u values range from 0.294 for the Phoenix to 0.537 for the Selinous, with E-W variations
mimicking those of basin integral Hb (Fig. 5C). Having checked that there is no significant control of drainage
size on Hd/u and that this metric is also largely not redundant with Hb, we analyse the spatial distribution of
catchment Hd/u in the following way. By definition, high Hd/u values are obtained when the average elevation of
the catchment's lower half is not much lower than that of its upper half, indicating that only a limited part of the
valley network has been incised since a recent base level lowering. Conversely, lower Hd/u values, chiefly
resulting from decreased Hd (Fig. 3A), betray the upstream progression of the erosion wave and the subsequent
valley widening witnessing a more advanced stage of the landscape response to the perturbation. In this sense,
the E-W distribution of Hd/u values indicates a most recent uplift in the Aegion-Derveni central sector,
confirming the conclusion drawn from Hb.
Fig. 6. Typical streamwise evolution of basin hypsometric integral Hb (black dots) and hypsometric shape
descriptor Hd/u (grey open squares). The latter curve is displaced down by 0.1 to make the graphs clearer. A)
Trikalitikos. B) Krathis. In each case, the evolution is best fitted by a second-order polynomial. Vertical lines
locate faults; vertical grey bars correspond to knickzones in the river profile.
Fig. 7. Graphs of the streamwise variations in Hb shape (A-C) and of the probability density functions of the
corresponding basin pixel elevations (B-D). Graphs A and B refer to the Selinous; C and D to the Xerias.
Numbered arrows in graphs A and C indicate the successive phases of the downstream evolution of Hb. Position
of the sampling points along the river is given in distance from the source.

Published in : Geomorphology (2015), vol. 246, pp. 188-204
Status : Postprint (Author’s version)
4.1.3. Streamwise changes in hypsometry
Beyond overall description of basin hypsometry, we tentatively explored the potential of Hb and Hd/u long
profiles for morphotectonic purposes. These profiles describe the streamwise changes in fractional Hb and Hd/u
calculated at stepwise increasing distance L of the trunk source.
Two main characteristics of the obtained profiles deserve attention (Table 1, Fig. 6). First, Hb and Hd/u long
profiles are very similar to each other for most basins. This is interpreted as a hint that streamwise changes of Hb
and Hd/u respond to more general factors than only a drainage network response to recent tectonic activity.
Indeed, the drainage network pixels represent only an average 1.7% of the total number of pixels in a basin, and
even taking into account the associated valley bottom pixels, they appear unable to exert the effect we expected
on Hb and Hd/u. The Hb and Hd/u long profiles depend on an intricate mix of overall basin topography, produced
by the inherited and tectonic components of morphogenesis, and river incision features that we can hardly hope
to unravel in most cases. At best, they unveil static data about basin hypsometry, revealed by recurrent patterns
of Hb and Hd/u that make their second important characteristic.
Two main patterns are identified, where the index long profiles are best fitted by second-order polynomials,
either convex or, less often, concave upward (Fig. 6). The basin hypsometric features underlying such patterns
are most easily identified from visualizing changes in the probability density function (pdf) of basin elevations
with increasing L (Fig. 7). However, these streamwise variations of elevation pdf do not tell us anything about
the origin (erosive or tectonic) and age (recent or inherited) of the distribution of elevations. In summary, the
morphotectonic usefulness of Hb and Hd/u profiles appears rather limited.
4.2. Geophysical relief
The values in metres and the normalized figures of GR are highly correlated. We thus base the discussion
hereafter on the metric values of GR (Table 1). They range from 79 m for the Raizanis to 260 m for the Kerynitis
(Table 1, Fig. 2). Similarly to Hb and Hd/u, GR is maximum for basins 3 to 6 in the west-central sector of the
study area and decreases west- and, still more, eastward, with the lowest values for basins draining to the far east
of the Corinth gulf (Fig. 5D).
Based on a more appropriate assessment of the initial basin topography, GR is assumed to be a more meaningful
metric than Hb, to which it is significantly correlated (r2 = 0.51; n = 10; p = 0.010). However, while basin
integral Hb is related to the remaining uneroded rock mass of a basin, GR quantifies the rock mass removed by
erosion. As such, both metrics would be expected to be anti-correlated but, surprisingly, the obtained correlation
is direct (Fig. 5A, D). This sheds doubt on the common belief that Hb values are primarily reflective of the stage
reached by the landscape response to a base level lowering, and suggests that, in the case of spatially variable
uplift, the first control on both GR and Hb is uplift rate, which acts on erosion rate (GR) and total rock volume
above base level (Hb) in the same sense. This is further supported by the strong link observed between GR and
actual basin relief. This link is significantly weaker for Hb and, still more, for Hd/u, from which we conclude that,
beyond uplift rate control, Hd/u is the metric most sensitive to, and therefore indicative of, the progress of
landscape incision in response to uplift. In other words, among catchment metrics, GR and Hd/u are probably the
best indicators of, respectively, uplift rate and progress of erosion (and hence age of the triggering event),
whereas the interpretation of Hb is generally more obscure. These metrics consistently point to the Aegion-
Derveni west-central sector of the Péloponnèse northern border as being most actively and most recently
uplifted.
The E-W variations in GRnetwork values, which quantify the drainage network mean incision with respect to the
reference summit surface and are thus a still better proxy than GR to the amount of triggering uplift, closely
mimic the corresponding variations of GR (Table 1). They suggest a maximum 410-420 m uplift and incision in
the central sector of the study area since the reference time. We recall that, as the reference summit surface
incorporates minor ridges belonging to the top surface of the Plio-Quaternary deltas, the reference time is that of
incision within these deltas, which most probably started in response to the oldest uplift episode identified by the
morphometric analysis.
Noteworthy is also that, while the ratio GR/GRnetwoγk amounts to 60-65% for all basins in the western and central
sectors of the northern Peloponnese, it increases to 70-85% for the Asopos, the Raizanis, and the Xerias. This
indicates that denudation of interfluves is going to catch up with river erosion in the east, providing further
evidence that the landscape response to the tectonic signal is more advanced, i.e., the signal is older there than
elsewhere along the coast.

Published in : Geomorphology (2015), vol. 246, pp. 188-204
Status : Postprint (Author’s version)
Fig. 8. χ plot of the Kerynitis long profile. Whole river plot in black (+ linear fit as thin black line). The best fit χ
plot is unable to straighten the profile, where three successive concave (SI and S2) or convex (S3) segments are
visually easily distinguished. Straightening of the partial χ plots SI, S2 and S3 (left part of the diagram, in
distinct grey tones) is much better and provides individual concavity values (m/n of best fits). The slope of the
individual plots corresponds to the segments' raw steepness (normalized steepness in Table 1 has been
calculated with a reference concavity of 0.5). The insets enlarge the plots' intersection to illustrate how the
vertical offset is obtained from the vertical spacing between the linear fits of the segments at their intersection
point Note also that the χ plot scale is different for the successive segments, and they have been shifted laterally
in order to be connected.
4.3. Chi plots
4.3.1. Profile segmentation
Profile segmentation was carried out by visual inspection of the chi plotof the whole river. Indeed, if several
segments are present, the overall chi plot, theoretically supposed to tend toward a straight profile, displays a
succession of distinct concave or convex reaches (Fig. 8), for which we determined specific parameters from
individual sub-plots. In most instances, we distinguished three segments per river profile (Table 1) but, in seven
out of the 10 profiles, the upstream segment was limited to the initial 2-2.5 km that the river descends rapidly
from peak areas down to elevations > 1000 m. Such short upstream segments determined solely by topographic
conditions and often showing negative concavities have not been included in the analysis.
The principal segment separation, in most cases independent of active fault location, is observed at distances
from the outlet that are linearly dependent on drainage area (r2 = 0.59, n = 9, p = 0.0078). It results from
upstream propagation of erosion in the drainage system and most probably corresponds to one single event of
relative base level lowering or uplift acceleration throughout the study area. This is especially clear for the rivers
of the western and central sectors, where it occurs systematically at 51-57% of the total river length (measured
from the outlet), while it proceeded slightly more upstream in the rivers of the eastern sector (Fig. 9).

Published in : Geomorphology (2015), vol. 246, pp. 188-204
Status : Postprint (Author’s version)
Fig. 9. Limits between χ plot segments, i.e., knickpoints or knickzones in the river profiles (black bold bars ) and
between R/SR segments (white bold bars ). Faults mentioned in Section 4.5 -Sf: Selinitika fault Aef: Aegion fault
Akf: Akrata fault Df: Derveni fault Sif: Sithas fault Xf: Xylokastro fault (on- and offshore). WHf: West Heliki
fault EHf: East Heliki fault P-Mf: Pirgaki-Mamousia fault
Fig. 10. East-west variation of the uplift rate (ksn: A and C) and time (SR: B and D, with error bars) indicators
for the downstream (A and B) and upstream (C and D) segments of the river profiles (10 catchments, see Table 1
). E-W trends are shown in grey. Stars in (B) denote two outliers: (Pho.) the Phoenix catchment, not yet reached
by the uplift wave; (Sel.) the Selinous catchment much larger than all others, imposing faster initial evolution of
SR. Distance is counted from the eastern end of the gulf of Lechaion; see Fig. 2 for location.
Published in : Geomorphology (2015), vol. 246, pp. 188-204
Status : Postprint (Author’s version)
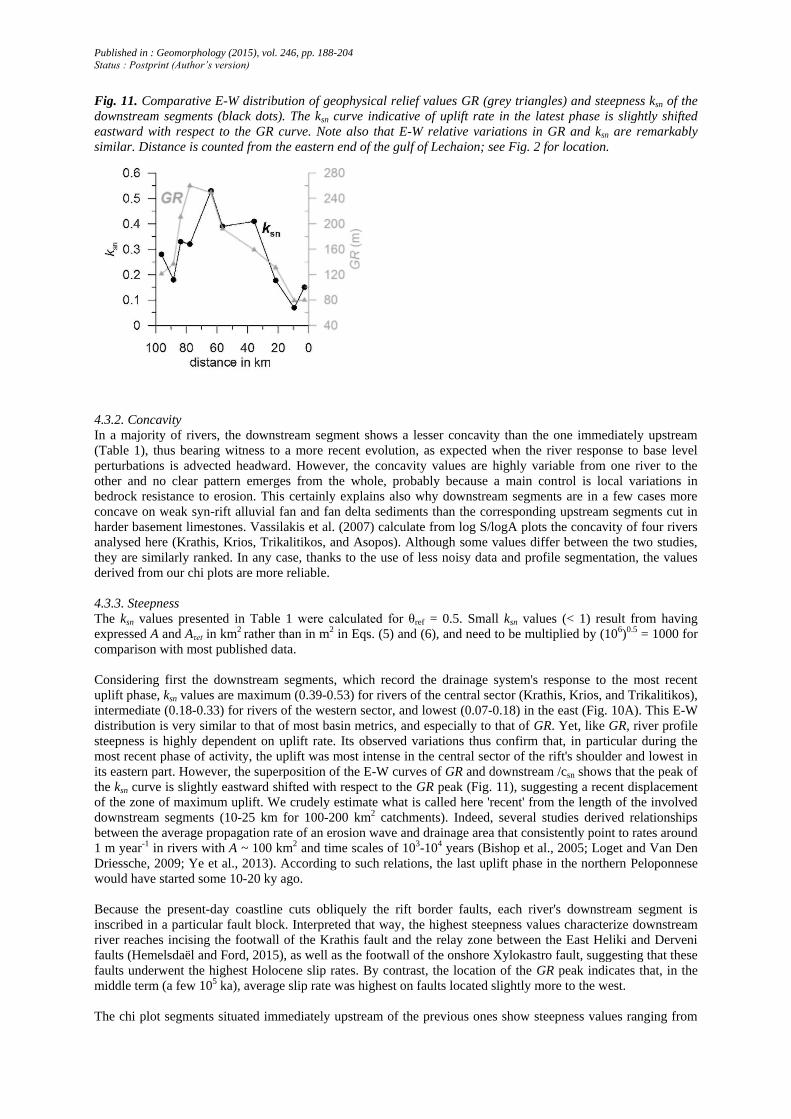
Fig. 11. Comparative E-W distribution of geophysical relief values GR (grey triangles) and steepness ksn of the
downstream segments (black dots). The ksn curve indicative of uplift rate in the latest phase is slightly shifted
eastward with respect to the GR curve. Note also that E-W relative variations in GR and ksn are remarkably
similar. Distance is counted from the eastern end of the gulf of Lechaion; see Fig. 2 for location.
4.3.2. Concavity
In a majority of rivers, the downstream segment shows a lesser concavity than the one immediately upstream
(Table 1), thus bearing witness to a more recent evolution, as expected when the river response to base level
perturbations is advected headward. However, the concavity values are highly variable from one river to the
other and no clear pattern emerges from the whole, probably because a main control is local variations in
bedrock resistance to erosion. This certainly explains also why downstream segments are in a few cases more
concave on weak syn-rift alluvial fan and fan delta sediments than the corresponding upstream segments cut in
harder basement limestones. Vassilakis et al. (2007) calculate from log S/logA plots the concavity of four rivers
analysed here (Krathis, Krios, Trikalitikos, and Asopos). Although some values differ between the two studies,
they are similarly ranked. In any case, thanks to the use of less noisy data and profile segmentation, the values
derived from our chi plots are more reliable.
4.3.3. Steepness
The ksn values presented in Table 1 were calculated for θref = 0.5. Small ksn values (< 1) result from having
expressed A and Aτet in km2 rather than in m2 in Eqs. (5) and (6), and need to be multiplied by (106)0.5 = 1000 for
comparison with most published data.
Considering first the downstream segments, which record the drainage system's response to the most recent
uplift phase, ksn values are maximum (0.39-0.53) for rivers of the central sector (Krathis, Krios, and Trikalitikos),
intermediate (0.18-0.33) for rivers of the western sector, and lowest (0.07-0.18) in the east (Fig. 10A). This E-W
distribution is very similar to that of most basin metrics, and especially to that of GR. Yet, like GR, river profile
steepness is highly dependent on uplift rate. Its observed variations thus confirm that, in particular during the
most recent phase of activity, the uplift was most intense in the central sector of the rift's shoulder and lowest in
its eastern part. However, the superposition of the E-W curves of GR and downstream /csn shows that the peak of
the ksn curve is slightly eastward shifted with respect to the GR peak (Fig. 11), suggesting a recent displacement
of the zone of maximum uplift. We crudely estimate what is called here 'recent' from the length of the involved
downstream segments (10-25 km for 100-200 km2 catchments). Indeed, several studies derived relationships
between the average propagation rate of an erosion wave and drainage area that consistently point to rates around
1 m year-1 in rivers with A ~ 100 km2 and time scales of 103-104 years (Bishop et al., 2005; Loget and Van Den
Driessche, 2009; Ye et al., 2013). According to such relations, the last uplift phase in the northern Peloponnese
would have started some 10-20 ky ago.
Because the present-day coastline cuts obliquely the rift border faults, each river's downstream segment is
inscribed in a particular fault block. Interpreted that way, the highest steepness values characterize downstream
river reaches incising the footwall of the Krathis fault and the relay zone between the East Heliki and Derveni
faults (Hemelsdaël and Ford, 2015), as well as the footwall of the onshore Xylokastro fault, suggesting that these
faults underwent the highest Holocene slip rates. By contrast, the location of the GR peak indicates that, in the
middle term (a few 105 ka), average slip rate was highest on faults located slightly more to the west.
The chi plot segments situated immediately upstream of the previous ones show steepness values ranging from

Published in : Geomorphology (2015), vol. 246, pp. 188-204
Status : Postprint (Author’s version)
0.06 to 0.43 that tend to increase from east to west (Fig. 10C). This trend points to maximum uplift in the
western part of the rift (ksn > 0.30) during this phase of regional evolution. Intermediate steepness values (0.16 <
ksn < 0.27) suggest more moderate uplift for the largest part of the northern Peloponnese, except in the
easternmost area where low steepness (0.06 < /csn < 0.09) points to minor uplift.
Finally, a comparison between steepness values of the downstream river segments and those upstream should
give clues about the temporal evolution of uplift rates. However, profile steepness not only depends directly on
U, but also is an inverse function of K, and in particular of substrate erodibility (Eq. (2)). Three different
lithological types crop out in the study area (Fig. 1): relatively resistant limestones of the Mesozoic basement in
the upstream part of most catchments; poorly to mildly cemented coarse conglomerates of the Early and Middle
Quaternary alluvial fans and proximal Gilbert deltas (essentially made of limestone cobbles) prevailing in the
middle and downstream reaches of the western rivers; poorly cemented sand- and siltstones in the more distal
parts of the deltas, predominating in the downstream part of the central and eastern catchments. However,
different materials do not necessarily induce significant change in erosion rate because it involves two opposite
controls on erosion of the river bed that more or less cancel each other. Channel bed erodibility is the first of
these controls and may be estimated through the tensile strength σt of the rock. Limestone rock and the limestone
cobbles making the bulk of the conglomerates show higher σt values than poorly cemented sand-and siltstones,
Sklar and Dietrich (2001) showing that erosion rate E scales with σt2. The second lithological control on erosion
rate is erosivity of the bedload, which increases non-linearly with grain size D, E scaling here with ~D2 (Sklar
and Dietrich, 2001). Therefore, the coarse bedload eroding resistant limestone rock or conglomerates in the
western catchments has more or less the same erosional efficiency as the finer bedload eroding less resistant
sand- and siltstones in the eastern catchments, resulting in insignificant net change in vertical erosion rate
between the two settings. However, the net lithological control on erosion rate may become higher in the case
when bedload and channel bedrock are different, and coarse bedload delivered by the Mesozoic basement in the
upstream catchment of rivers should be more efficient in eroding downstream reaches in weaker sand- and
siltstones. This occurs mainly in the downstream segments of the eastern rivers (Asopos, Raizanis, and Xerias),
where low steepness values might result from low U, high K, or from their combined effect. However, possibly
because the control of K on steepness is damped by sorting and attrition effects on bedload grain size with
distance, the lower segments of the I<rios and Trikalitikos do not show the low steepness expected from their
lithological conditions. This not only confirms the minor role of bedrock resistance to erosion in the long-term
process of river incision (Roberts and White, 2010; Whittaker and Boulton, 2012; Beckers et al., 2014), but also
shows that, except in the far west of the study area, the current episode of uplift is more intense than the previous
one.
4.3.4. Offset between segments
A last parameter that may be considered in the chi plot analysis is the vertical offset between the best fit lines of
successive profile segments. Profile discontinuities described as vertical step knickpoints by Lague (2014)
display positive segment offsets (observed in the upstream direction), whereas negative offsets correspond to
slope-break knickpoints and knickzones (Fig. 8). While the amounts of negative offsets have no explicit
meaning, positive ones provide a good estimate of the relative height of steep knickpoints. The maximum values
of 189 and 113 m are obtained for the Krathis and Krios rivers in the central sector of the Péloponnèse border,
between Akrata and Derveni. The Krathis knickpoint corresponds to a deep gorge reach cut through Mesozoic
limestones and showing an average channel gradient of -15%. Similar spectacular gorges are also present to the
west in an adjacent small stream (the Ladopotamos) and in the Vouraikos, where these streams cross the
proximal part of the Mamousia fault's footwall. As the penultimate episode of uplift occurred significantly later
in this sector than elsewhere (see Section 4.4.2), we suggest that gorges and high knickpoints might result from
the current erosion wave having caught up and superposing there with the previous one, which migrates less
rapidly in harder rocks.
4.4. R/SR analysis
4.4.1. Regional analysis
From the theory of the R/SR approach (Demoulin, 2011), a strong correlation is expected between R and basin
size for the catchment/subcatchment population of a region of homogeneous uplift history. Testing for the
existence of such a correlation is therefore one way to determine whether uplift timing was uniform across a
particular area. Although the range of catchment size analysed here is rather limited, it extends toward
sufficiently large basins to allow evaluation of this hypothesis. Based on the R value at the outlet of the sampled
rivers (n = 10), we observe no correlation with basin size, demonstrating that the successive uplift episodes
occurred at different times in different sectors of the southern shoulder of the Corinth rift.

Published in : Geomorphology (2015), vol. 246, pp. 188-204
Status : Postprint (Author’s version)
Fig. 12. Streamwise evolution of the R metric (and SR index) along the 10 studied rivers, showing the typical
two-SR-segment pattern. Labels give the position (in km) of the sample points along the river course. Vertical
lines locate faults. Wide grey bar locate knickzones in the river long profiles. 1: Phoenix. 2: Meganitis. 3:
Selinous. 4: Kerynitis. 5: Krathis. 6: Krios. 7: Trikalitikos. 8: Asopos. 9: Raizanis. 10: Xerias.
4.4.2. Streamwise analysis
Analysis of the rivers' R profiles is much more conclusive, most of them showing a typical succession of two
segments with distinct R-ln A relations (i.e., distinct SR) (Fig. 12). The resulting picture of two identifiable uplift
episodes in each catchment is remarkably consistent with that provided by the independent analysis of chi plots
and brings new insight into the temporal characteristics of these episodes.
As for chi segments, the R segment separation is observed at distances from the outlet that are linearly dependent
on drainage area (r2 = 0.91, n = 9, p = 0.0000), confirming that this separation corresponds to the same event
throughout the study area. However, although basin size controls the distance at which changes in R have
propagated, the absence of correlation with the corresponding SR values indicates that it does not affect this
index and its temporal meaning. The distance travelled by the upstream propagating changes in R is

Published in : Geomorphology (2015), vol. 246, pp. 188-204
Status : Postprint (Author’s version)
systematically smaller by a few kilometres than the corresponding distance run by the knickpoint migrating in
the main stem (Fig. 9), underlining that the whole drainage network and the basin topography need more time
than the main stem to respond to a perturbation.
The dominant characteristic of downstream SR values (Table 1), indicative of the most recent uplift episode, is
that they are all very large (between 1.8 and 10.3), much larger than the values recorded elsewhere, which never
exceed 1 (Demoulin, 2012; Demoulin et al., 2013). The only circumstance in which comparably high SR values
were observed was when the R/SR analysis was applied to synthetic landscapes (Croissant, 2012). In that study, a
topography defined by low-amplitude cosine functions was uplifted in order to analyse the behaviour of the SR
index with time. The results show that SR values larger than 1 always characterize the first stage of the landscape
response, when a drainage network has first to be created, and that they lower to real-world values once the
network is fully established. The topographic setting in which river incision developed when Late Pleistocene
uplift caused emergence of the northern Peloponnese shore is very similar (though not exactly because the
stream network in the emerged land was partly determined by the downstream prolongation of the preexisting
rivers), showing that downstream SR values in the Peloponnese conform with their modelled equivalent.
However, beyond the observation that SR shows a power law decrease with time, no quantitative relation SR =
f(t) is available so far for such a case, and we only discuss the relative timing of this episode of uplift from east
to west. With the exception of the slightly outlying Selinous value, the analysed basins display a consistent
picture of downstream SR regularly increasing from east to west (Fig. 10B), suggesting that the last phase of
accelerated uplift started earlier in the east and propagated westward. The comparatively small value of the
westernmost Phoenix basin indicates that the uplift phase reached it only very recently, already allowing
distinction of a particular segment in its R profile but having not yet fully completed the accompanying increase
in SR.
The lower, more classical upstream SR values (Table 1) attest the response of the landscape to an older uplift
phase. However, even there is data interpretation not that straightforward because response to uplift involved
land emergence also in that time and the t = f(SR) relation of Demoulin (2012) consequently might not hold.
Whereas the absence of tributary network in a small tract of virgin land added to a catchment has a strong initial
impact on the catchment's R and SR values, its progressive buildup makes this effect dwindle away in parallel
with the time evolution of the catchment metrics, so that the effect vanishes after some time. However, because
the percentage of emerged areas and their impact on the metrics are variable from catchment to catchment, ages
derived from upstream segment SR may still be variably underestimated and the E-W variations of the index
have themselves to be interpreted with caution.
Nevertheless, the E-W distribution of upstream SR values (Fig. 10D, Table 1) displays a marked peak in the
central sector that cannot be ignored. Narrow use of Eq. (8) suggests that the corresponding older uplift event
began around 200-270 ka in this central sector whereas it dates back to more than 1 Ma in the east and the west.
In other words, the western and eastern sectors did not record the 270 ka uplift phase, in the sense that they did
not undergo any increase in uplift rate at that time. As the percentage of uplift-dependent emerged land was
particularly large in the Krathis and Krios catchments, its long-lasting impact on their SR value is however
certainly still non-zero, making the calculated 200-270 ka a default estimate. Based on the comparison between
the SR values after -20 ka when partial land emergence and creation of new downstream drainage branches are
involved (downstream SR in Table 1) and the results of Croissant (2012) when a complete drainage system has to
be created from scratch, we estimate to 100-150 ka the initial period needed before the SR values under
consideration started to evolve with time following Eq. (8). This yields a more realistic morphometric age
around 350-400 ka for this penultimate uplift phase. A conservative interpretation of the upstream SR data is thus
that an Early Pleistocene uplift phase affected the entire northern Peloponnese border and that it was traceably
overprinted by a middle Middle Pleistocene phase of increased uplift rate only in the central sector. This
coincides with the peak in Hd/u observed in the same sector (Fig. 5D), which also suggests that the landscape is
younger there than elsewhere along the rift.
4.5. Synthesis of the results
Synthesizing the morphometric results presented above, we identify the following characteristics of the recent
uplift history of the northern Peloponnese:
• As segment limits in the chi plots and R profiles are most generally not coincident with the location of faults
and associated lithological contrasts; they may safely be interpreted as marking the upstream points reached by
an erosion wave propagating in the drainage system.
• The topography of each studied catchment records two successive uplift episodes. Moreover, the older
observed episode is distinctly younger in the central Akrata-Derveni area than to the east and the west, so that a
total of three separate uplift phases are identified. The older topography on which these three uplift phases

Published in : Geomorphology (2015), vol. 246, pp. 188-204
Status : Postprint (Author’s version)
successively imposed their mark is barely preserved in the form of small headwater chi-plot segments.
• Quantitative age estimates of the latest uplift episode cannot be provided by downstream SR values because
they incorporate the creation of downstream extensions of the drainage network when uplift caused a strip of
coastal land to emerge. However, E-W variations in downstream SR show that this uplift started in the east and
propagated westward (Fig. 10B). Crude absolute timing may be inferred from the length of the downstream chi
plot segments, i.e., from the distance travelled by the knickpoints created by this uplift phase, and suggests an
age of 10-20 ka. Metrics related to basin scale do not yet contain information about this recent perturbation.
• Age estimates of the older uplift episodes may be inferred from various morphometric sources. Basin-scale
metrics show that the older observed phase of uplift is of oldest age in the east of the study area, of intermediate
age in the west, and of youngest age in the central Akrata-Derveni sector. We calculate from upstream segments'
SR that, with a corrected age of 350-400 ka, this uplift phase in the latter sector is temporally distinct from the >
1 -Ma-old one in the two other sectors. This is consistent with the maximum chi segment offsets observed in the
valleys of the Akrata-Derveni area, where the age estimate is further supported by comparing the GRnetwork-
based estimate of uplift (up to 414 m) with independent uplift rate estimates (1.0-1.3 mm year-1; De Martini et
al., 2004; McNeill et al., 2005; Vassilakis et al., 2007). This yields an approximate age of 320-415 ka.
• The morphometric data show uplift rates were highest in the west during the Early Pleistocene uplift phase
(Table 1, upstream ksn and Hb). Then, after the Middle Pleistocene phase affected only the Akrata-Derveni area
(Table 1, upstream SR), the Holocene phase continues to impose maximum uplift on an east-central sector of the
rift shoulder (Table 1, downstream ksn, GR, and Hb). In this zone, GRnetwork values suggest that the Middle
Pleistocene and Holocene phases were combined to produce total uplift of 400-500 m. Vertical offsets between
chi plots' segments indicate uplift rates in the order of 2-5 mm year-1 for the youngest uplift episode. In a similar
way, from a corrected SR age estimate of 350-400 ka and GRnetwork values of 410-420 m in the central sector,
we derive a minimum uplift rate of 1.05-1.2 mm year-1 for the penultimate uplift phase.
Fig. 13. Comparison of the main temporal discontinuities identified in the Quaternary evolution of the Corinth
rift from various on- and offshore observation sources. Grey areas account for the age uncertainty of some
discontinuities. Groups of data sources attesting the same discontinuity are framed by rounded rectangles.
Vertical arrows locate phases of acceleration (of uplift or extension). U: uplift (Backert et al., 2010; Briole et al,
2000).

Published in : Geomorphology (2015), vol. 246, pp. 188-204
Status : Postprint (Author’s version)
Interestingly, the identified E-W variations in uplift rate and timing may also be related to the activity of
individual faults. Relying on the widely accepted scheme of the northern migration of fault activity with time
(e.g., Leeder et al., 2008; Ford et al., 2013), these relationships show that (1) either the West Heliki and Lakka
faults or the Pirgaki fault was especially active during the Early Pleistocene phase of uplift, (2) the Valimi fault
seems to be the only one for which a Middle Pleistocene phase of activity is clearly recorded in the upstream R
profiles of the Krathis and the Krios (although the Vouraikos gorge might similarly attest significant activity of
the Mamousia fault in the same period), and (3) intense Holocene activity of the East Heliki and/or Akrata faults
caused the fastest recent uplift and river incision in this sector, while significant incision also occurred in the
footwall of the onshore Xylokastro fault. This yields an overall picture where progressive concentration of
maximum uplift in the central sector superposed since the early Pleistocene upon the northern migration of the
active southern margin of the rift.
4.6. Integrating morphometric and geological data
Having shown the remarkable internal consistency of the morphometric results, we now discuss their integration
with other on- and offshore data sets based on the synthesis of Fig. 13.
4.6.1. Episodic character of shoulder uplift
A main result of the morphometric analysis is that the fluvial landscape of the northern Péloponnèse preserves
records of three distinct uplift phases featuring stepwise increasing uplift rates. This sequencing of the rift
evolution is similar to that recognized in the syn-rift fill exposed in this area (Rohais et al., 2007b), with episodic
strain migration and increase in extension rates (Ford et al., 2013). It is also to some extent in line with the
number of main discontinuities revealed by the seismic imaging of the basin fill (Bell et al., 2009; Taylor et al.,
2011; Nixon et al., 2013), although age and nature of these discontinuities are still debated and do not fully
correlate with those provided here. Importantly, the intermediate episode of uplift imprinted in the fluvial
morphology has been formally identified only in the catchments of the central part of the rift shoulder. However,
the presence of deep gorges and huge knickzones in the Vouraikos and Ladopotamos valleys suggests that they
too responded to this uplift phase, which thus affected a zone extending from Derveni in the east to Diakopto in
the west (Fig. 1). This corresponds to the part of the Peloponnese coastline that faces the central part of the rift
where Bell et al. (2011) identified a maximum in summed fault displacement since 0.4 Ma.
4.6.2. Timing of the uplift phases
With a latest phase of uplift increase (-2-5 mm year-1) identified around 10-20 ka, the morphometric evidence
fully confirms the Holocene acceleration of uplift deduced from the 14C ages obtained by Soter (1998) and
Pirazzoli et al. (2004) for raised shorelines, which indicate recent uplift rates in the range 2.5-3.5 mm year-1 in
the central sector of the coast and -1.35 mm year-1 for the Perachora Peninsula, in both cases significantly higher
than the corresponding Middle and Late Pleistocene rates of, respectively, 1.1-1.5 and <0.7 mm year-1 (De
Martini et al., 2004; McNeill and Collier, 2004; Morewood and Roberts, 1999). This accelerated Holocene uplift
is also consistent with the observed discrepancy between hiceeding 10 mm year-1 in the central rift according to
geodetic measurements (Clarke et al., 1998; Avallone et al., 2004), and much lower long-term rates, smaller than
5 mm year-1 during the last 0.7 Ma in the same area (Ford et al., 2013). Furthermore, the intriguing westward
increase in GPS-derived extension rates (e.g., Bell et al., 2011) parallels the SR-inferred westward decrease in
age of the recent uplift acceleration. Therefore, we suggest that, rather than betraying a long-term feature (Clarke
et al., 1998), the E-W gradient in GPS rate might be a short-term feature resulting from high impulse rates
located at the tip of an E-W propagating extension/uplift signal and rapidly decaying to lower rates once the
signal is passed. This reconciles the GPS data with the main body of evidence by decoupling it from the long-
term data. By contrast, the 10-20 ka event seems not to be observed yet in the offshore record.
As for the penultimate uplift episode, its corrected SR-inferred age estimate of 350-400 ka, consistent with the
GRnetwork-derived estimate of 320-415 ka, corresponds to a time inferred from several other data sets. Onshore,
the oldest ages obtained for marine terraces on the foot-wall of the Aegion, Heliki, and Xylokastro faults suggest
that the beginning of the corresponding uplift phase date back to 350-450 ka (Armijo et al., 1996; McNeill and
Collier, 2004; Ford et al., 2013, and references therein), and a radiometric U-series dating by Vita-Finzi (1993)
of perched delta deposits of the Upper Group of Rohais et al. (2007b) provide an age of 386 ka. The
morphometric age estimates may also be paralleled with the basin-scale prominent unconformity observed by
Taylor et al. (2011) in the gulfs seismic profiles and tentatively dated to 335 ka. However, this date relies on the
assumption of a discontinuity pattern based on the beat of the sea level highstand-lowstand alternation and has
apparently little to do with uplift events, except maybe that the 335 ka discontinuity might appear sharper than
others just because of co-occurrence of the climatic and tectonic triggers at this time. Furthermore, the
morphometric results bring a new important piece in the jigsaw by delimiting the area affected by this major
event between the Vouraikos and Krios valleys. A possible cause to higher uplift rates in this area around 0.35-

Published in : Geomorphology (2015), vol. 246, pp. 188-204
Status : Postprint (Author’s version)
0.4 Ma has been identified by Hemelsdaël and Ford (2015), who show that the Middle Pleistocene linkage
history between the eastward propagating East Heliki fault and the Derveni fault, where the Krathis river flows
into the Gulf of Corinth, included a phase of relay zone uplift and valley incision in this same time span.
Strikingly, the morphometric data do not evidence any discontinuity in the onshore evolution of the southern rift
shoulder around 0.7 Ma, which however appears in the onshore syn-rift stratigraphy as the starting time of Upper
Group deposition (Rohais et al., 2007b) and might also be correlated with the 0.7-0.6 Ma age assigned to the
first-order discontinuity in the seismic profiles (Taylor et al., 2011 ; Nixon et al., 2013). A possible reason for the
absence of morphometric record of this 0.7 Ma discontinuity might be that the time span between 0.7 Ma and the
0.35-0.4 Ma event was needed for the uplifting footwall of the Heliki and Xylokastro faults to emerge
definitively, raising terraces and causing changes in onshore SR and a transient signal in offshore sedimentation
(the 0.335 Ma unconformity of Taylor et al., 2011) only from the latter time onwards.
Finally, the oldest morphometrically identified uplift phase, older than 1 Ma in the western part of the rift
shoulder, probably correlates with the uplift episode that triggered the major erosional event separating around
1.5 Ma the Lower and Middle Groups of the syn-rift fill (Ford et al., 2013). In the east, local upstream SR values
assign the uplift of the Péloponnèse coast facing the gulf of Lechaion to the Pliocene, after which no
morphometrically discernible change is recorded in the vertical behaviour of the area until the Holocene. The
absence of morphometric hiatus in the fluvial landscape of this region from the Pliocene to the Holocene might
result from uplift rates varying little with time in the 0.0-0.3 mm year-1 range, thus unable to induce measurable
changes in the erosional landscape evolution.
4.6.3. Spatial variability of uplift
All basin-scale metrics attest similar E-W variations pointing to highest uplift rates in the central part of the rift
shoulder (Fig. 5) between Heliki and Derveni (from the Selinous to the Krios catchments) during the older
phases of uplift (Middle and Late Pleistocene). This is fully consistent with the offshore isopach maps of Bell et
al. (2009) and Taylor et al. (2011), which show major depocentres located in front of Akrata during these times,
and with the long-term data compiled by Bell et al. (2011), namely whole-crust extension and post-0.4 Ma
summed fault displacements, which also culminate in the central sector. Onshore, the uplift rate information
delivered by marine terrace studies requires more careful examination. Following Armijo et al. (1996), many
authors consider that, beyond a background regional rate of-0.2 mm year-1, the E-W gradient in terrace uplift,
observed in particular between Xylokastro and Corinth, is correlated with their location more or less remote from
the fault trace, indicating backtilting of the Xylokastro fault footwall. However, based on observations of
uplifted terraces in other places, Leeder et al. (2003) conclude that uniform uplift from Perachora through the
Corinth Isthmus to the terraces south of Corinth reveals a regional trend rather than footwall backtilting of active
E-W faults. Independent of proximity to fault, the morphometric evidence of a regional E-W gradient in uplift
rate clearly supports the conclusion of Leeder et al. (2003) and firmly establishes the interpretation of maximum
Middle and Late Pleistocene uplift in the central part of the southern rift shoulder.
Downstream ksn values are another indicator of uplift rate that points to maximum uplift in the central part of the
Peloponnese coast also during the latest, Holocene, episode of uplift. However, the area of maximum uplift is
now displaced slightly eastward (Figs. 10 and 11), including the Trikalitikos valley, which joins the gulf at
Xylokastro. This is again consistent with offshore observations that describe an eastward shift of the most recent
depocentre, now located in front of Xylokastro (Bell et al., 2009; Taylor et al., 2011). Finally, our morphometric
results also converge with all existing data sets in showing that uplift was minimum in the far eastern part of the
Péloponnèse coast during the whole Quaternary.
5. CONCLUSIONS
Numerous studies have dealt with seismic analysis of the sedimentation in the Gulf of Corinth, with the tectono-
sedimentary history revealed by the uplifted syn-rift basin fill exposed in the northern Péloponnèse, and with
raised marine terraces preserved along the coast. However, little, mostly superficial research was devoted to the
analysis of the fluvial landscape produced by the response of the drainage system to the successive tectonic
signals imposed to the region. Based on the use of a large set of classical and new basin and long profile metrics
complemented by the new R/SR integrative approach of the regional drainage network, we have carried out a
detailed morphometric analysis of the northern Péloponnèse landscape. The combined interpretation of
independent metrics showing a remarkable internal consistency has provided a lot of quantitative information on
the time, location, and intensity of the Plio-Quaternary tectonic episodes of uplift that caused regional relative
base level lowering large enough to trigger waves of regressive erosion with measurable morphological effects.
Our main result is the uncovering of three distinct episodes of uplift, of which the intermediate, dated around

Published in : Geomorphology (2015), vol. 246, pp. 188-204
Status : Postprint (Author’s version)
0.35-0.4 Ma, is only recorded in the topography of the central part of the rift shoulder, and the youngest seems to
have propagated from east to west over the last 10-20 ka, possibly explaining the observed E-W variation in
GPS-derived extension rates. While net uplift remained minimum in the eastern part of the study area during the
whole Quaternary, it shows a clear maximum in the central part of the rift shoulder since 0.4 Ma and an eastward
shift of this maximum in recent times. Maximum uplift rates calculated from the morphometric data are of >
1.05 and 2-5 mm year-1 for the mid-Middle Pleistocene and Holocene uplift episodes, respectively.
Overall, the morphometric evidence reveals an onshore uplift history that parallels, in every essential point, the
history of rift activity deduced from offshore studies and that is also consistent with other onshore data sets. In
the long term, it underlines a stable pattern of maximum activity in the central part of the rift and of its southern
shoulder, confirming previous conclusions of absence of rift propagation during the Quaternary (Leeder et al.,
2008). This is not necessarily contradictory with the eastward rift propagation more recently suggested by Leeder
et al. (2012) for an earlier, Late Pliocene stage of rift evolution, which cannot be inferred using our
morphometric data. In the short term, it sheds new light on the possible E-W migration of the recently begun
uplift phase, suggesting that fault activity and seismic hazard might concentrate in the immediate future in the
Heliki-Aegion area at the western tip of this uplift wave. This is only one of the research perspectives opened by
the morphometric approach to the Corinth rift evolution.
ACKNOWLEDGMENTS
We thank P. Briole, who provided us with the ISTAR DEM of the study area. A. Beckers participated to this
research in the frame of a FR1A grant of the Fonds de la Recherche Scientifique of the Wallonia-Brussels
Federation. M. Ford and an anonymous reviewer are warmly thanked for their fair and constructive remarks. The
paper was also edited by T. Oguchi.
REFERENCES
Armijo, R, Meyer, B, King, G., Rigo, A, Papanastassiou, D, 1996. Quaternary evolution of the Corinth Rift and its implications for the Late
Cenozoic evolution of the Aegean. Geophys.J.Int. 126,11-53.
Armijo, R, Meyer, B., Hubert, A., Barka, A., 1999. Westward propagation of the north Anatolian into the northern Aegean: timing and
kinematics. Geology 27, 267-270.
Avallone, A., Briole, P., Agatza-Balodimou, A.M., Billiris, H., Charade, 0., Mitsakaki, C, Nercessian, A., Papazissi, K, Paradissis, D, Veis,
G., 2004. Analysis of eleven years of deformation measured by GPS in the Corinth Rift Laboratory area. Compt. Rendus Geosci. 336, 301-
311.
Backert, N, Ford, M, Malartre, F, 2010. Architecture and sedimentology of the Kerinitis Gilbert-type fan delta, Corinth Rift, Greece.
Sedimentology 57, 543-586.
Beckers, A, Bovy, B, Hallot, E., Demoulin, A, 2014. Controls on knickpoint migration in a drainage network of the moderately uplifted
Ardennes Plateau, Western Europe. Earth Surf. Proc. Land, http://dx.doi.org/10.1002/esp.3638.
Beckers, A, Hubert-Ferrari, A, Beck, C, Bodeux, S, Tripsanas, E, Sakellariou, D., De Batist, M., 2015. Active faulting at the western tip of
the Gulf of Corinth, Greece, from high-resolution seismic data. Mar. Geol. 360, 55-69. http://dx.doi.Org/10.1016/j.margeo. 2014.12.003.
Bell, R., McNeill, L, Bull, J., Henstock, T., 2008. Evolution of the offshore western Gulf of Corinth. Geol. Soc. Am. Bull. 120,156-178.
Bell, R, McNeill, L, Bull, J., Henstock, T., Collier, R, Leeder, M., 2009. Fault architecture, basin structure and evolution of the Gulf of
Corinth Rift, central Greece. Basin Res. 21,824-855.
Bell, R, McNeill, L, Henstock, T, Bull, J., 2011. Comparing extension on multiple time and depth scales in the Corinth Rift, Central Greece.
Geophys. J. Int 186,463-470.
Bernard, P., Lyon-Caen, H., Briole, P., Deschamps, A., Boudin, F., Makropoulos, K., Papadimitriou, P., Lemeille, F., Patau, G., Billiris, H.,
Paradissis, D., Papazissi, K., Castarède, H., Charade, O., Nercessian, A., Avallone, A., Pacchiani, F., Zahradnik, J., Sacks, S, Linde, A, 2006.
Seismicity, deformation and seismic hazard in the western rift of Corinth: new insights from the Corinth Rift Laboratory (CRL).
Tectonophysics 426, 7-30.
Bishop, M., Shroder, J, Bonk, R, Olsenholler, J, 2002. Geomorphic change in high mountains: a western Himalayan perspective. Glob.
Planet. Chang. 32,311-329.
Bishop, P., Hoey, T., Jansen, J., Artza, I., 2005. knickpoint recession rate and catchment area: the case of uplifted rivers in Eastern Scotland.
Earth Surf. Proc. Land. 30, 767-778.
Briole, P., Rigo, A., Lyon-Caen, H., Ruegg, J.C., Papazissi, K., Mitsakaki, C, Balodimou, A., Veis, G., Hatzfeld, D., Deschamps, A., 2000.
Active deformation of the Corinth rift, Greece: results from repeated Global Positioning System surveys between 1990 and 1995. J. Geophys.
Res. B105, 25,605-25,625.
Brocklehurst, S, Whipple, K, 2004. Hypsometry of glaciated landscapes. Earth Surf. Proc. Land. 29, 907-926.
Champagnac, J., Molnar, P, Anderson, R, Sue, C, Delacou, B, 2007. Quaternary erosion-induced isostatic rebound in the western Alps.
Geology 35,195-198.
Chen, Y., Sung, Q, Cheng, K, 2003. Along-strike variations of morphotectonic features in the Western Foothills of Taiwan: tectonic

Published in : Geomorphology (2015), vol. 246, pp. 188-204
Status : Postprint (Author’s version)
implications based on stream-gradient and hypsometric analysis. Geomorphology 56,109-137.
Clarke, P., Davies, R, England, P., Parsons, B., Billiris, H., Paradissis, D., Veis, G., Cross, P., Denys, P., Ashkenazi, V., Bingley, R., Kahle,
H., Muller, M., Briole, P., 1998. Crustal strain in central Greece from repeated GPS measurements in the interval 1989-1997. Geophys. J. Int
135,195-214.
Collier, R, Leeder, M, Rowe, P., Atkinson, T, 1992. Rates of tectonic uplift in the Corinth and Megara basins, central Greece. Tectonics
11,1159-1167.
Collier, R, Leeder, M., Trout, M, Ferentinos, G., Lyberis, E., Papatheodorou, G., 2000. High sediment yields and cool, wet winters : test of
last glacial paleodimates in the northern Mediterranean. Geology 28, 999-1002.
Croissant T, 2012. Application à des paysages synthétiques d'une nouvelle mesure morphométrique permettant de determiner l'âge d'un
soulèvement tectonique. Unpublished Mémoire de Recherche, Univ.J. Fourier, Grenoble, 24 pp.
De Martini, P, Pantosti, D, Palyvos, N, Lemeille, F., McNeill, L, Collier, R, 2004. Slip rates of the Aigion and Eliki Faults from uplifted
marine terraces, Corinth Gulf, Greece. Compt Rendus Geosci. 336, 325-334.
Demoulin, A, 2011. Basin and river profile morphometry: a new index with a high potential for relative dating of tectonic uplift
Geomorphology 126, 97-107.
Demoulin, A., 2012. Morphometric dating of the fluvial landscape response to a tectonic perturbation. Geophys. Res. Lett. 39, L15402.
http://dx.doi.org/10.1029/ 2012GL052201.
Demoulin, A., Altin, T.B., Beckers, A, 2013. Morphometric age estimate of the last phase of accelerated uplift in the Kazdag area (Biga
Peninsula, NW Turkey). Tectonophysics 608,1380-1393.
Dia, A, Cohen, A., O'Nions, R, Jackson, J, 1997. Rates of uplift investigated through 230Th dating in the Gulf of Corinth (Greece). Chem Geol.
138,171-184.
Doutsos, T., Piper, D, 1990. Listric faulting, sedimentation, and morphological evolution of the Quaternary eastern Corinth rift, Greece: first
stages of continental rifting. Geol. Soc. Am Bull. 102, 812-829.
Doutsos, T., Koukouvelas, K., Xypolias, P., 2006. A new orogenic model for the External Hellenides. In: Robertson, A., Mountrakis, D.
(Eds.), Tectonic Development of the Eastern Mediterranean Region. Geol. Soc, London, Spec. Publ. 260, pp. 507-520.
Flint, J., 1974. Stream gradient as a function of order, magnitude, and discharge. Water Resour. Res. 10, 969-973. Ford, M, Rohais, S.,
Williams, E., Bourlange, S., Jousselin, D., Backert, N., Malartre, F., 2013. Tectono-sedimentary evolution of the western Corinth rift (Central
Greece). Basin Res. 25, 3-25.
Friedrich, A., Wernicke, B, Niemi, N., Bennett, R, Davis, J., 2003. Comparison of geodetic and geologic data from the Wasatch region, Utah,
and implications for the spectral character of Earth deformation at periods of 10 to 10 million years. J. Geophys. Res. 108, 2199.
http://dx.doi.org/10.1029/2001JB000682.
Gao, M., Zeilinger, G, Xu, X, Wang, Q, Hao, M., 2013. DEM and GIS analysis of geomorphic indices for evaluating recent uplift of the
northeastern margin of the Tibetan Plateau, China. Geomorphology 190,61-72. Hack, J-, 1973. Stream profile analysis and stream-gradient
index. J. Res. US Geol. Surv. 1, 421-429. Hemelsdaël, R, Ford, M., 2015. Relay zone evolution: a history of repeated fault propagation and
linkage, central Corinth rift, Greece. Basin Res. 1-23 http://dx.doi.org/10.llll/bre.12101.
Houghton, S., Roberts, G., Papanikolaou, I., McArthur, J., Gilmour, M., 2003. New 234U-230 Th coral dates from the western Gulf of Corinth:
implications for extensional tectonics. Geophys. Res. Lett. 30. http://dx.doi.org/10.1029/2003GL018112.
Keraudren, B., Sorel, D., 1987. The terraces of Corinth (Greece). A detailed record of eustatic sea-level variations during the last 500,000
years. Mar. Geol. 77, 99-107.
Keraudren, B., Falguères, C, Bahain, J.J, Sorel, D, Yokoyama, Y, 1995. Nouvelles datations radiométriques des terrasses marines de
Corinthie (Péloponnèse septentrional, Grèce). CR Acad. Sci. Paris 320,483-489.
Korup, O, Schmidt, J, McSaveney, M, 2005. Regional relief characteristics and denudation pattern of the western Southern Alps, New
Zealand. Geomorphology 71, Λ02-Λ23.
Lague, D, 2014. The stream power river incision model: evidence, theory and beyond. Earth Surf. Proc. Land. 39,38-61. Leeder, M, Harris,
T, Kirkby, M, 1998. Sediment supply and climate change: implications for basin stratigraphy. Basin Res. 10, 7-18.
Leeder, M, McNeill, L, Collier, R, Portman, C, Rowe, P, Andrews, J, Gawthorpe, R, 2003. Corinth rift margin uplift: new evidence from
Late Quaternary marine shorelines. Geophys. Res. Lett 30,1611. http://dxdoi.org/10.1029/2003GL017382.
Leeder, M, Mack, G, Brasier, A, Parrish, R, Mcintosh, W, Andrews, J, Duermeijer, C, 2008. Late-Pliocene timing of Corinth (Greece) rift-
margin fault migration. Earth Planet Sci. Lett. 274,132-141.
Leeder, M, Mark, D, Gawthorpe, R, Kranis, H, Loveless, S, Pedentchouk, N, Skourtsos, E.,Turner, J, Andrews, J, Stamatakis, M, 2012. A
"Great Deepening": chronology of rift climax, Corinth rift, Greece. Geology 40, 999-1002.
Loget, N., Van Den Driessche, J, 2009. Wave train model for knickpoint migration. Geomorphology 106,376-382.
Lykousis, V, Sakellariou, D, Moretti, I, Kaberi, H, 2007. Late Quaternary basin evolution of the Gulf of Corinth: sequence stratigraphy,
sedimentation, fault-slip and subsidence rates. Tectonophysics 440,29-51.
Maroukian, H, Gaki-Papanastassiou, K, Karymbalis, E, Vouvalidis, K, Pavlopoulos, K., Papanastassiou, D, Albanakis, K, 2008.
Morphotectonic control on drainage network evolution in the Perachora Peninsula, Greece. Geomorphology 102, 81-92.
McNeill, L, Collier, R, 2004. Uplift and slip rates of the eastern Eliki fault segment, Gulf of Corinth, Greece, inferred from Holocene and
Pleistocene terraces. J. Geol. Soc. 161, 81-92.
McNeill, L, Collier, R, De Martini, P, Pantosti, D, D'Addezio, G, 2005. Recent history of the Eastern Eliki Fault, Gulf of Corinth:

Published in : Geomorphology (2015), vol. 246, pp. 188-204
Status : Postprint (Author’s version)
geomorphology, palaeoseismology and impact on palaeoenvironments. Geophys. J. Int 161,154-166.
Morewood, N, Roberts, G, 1999. Lateral propagation of the surface trace of the South Alkyonides normal fault segment, central Greece: its
impact on models of fault growth and displacement length relationships. J. Struct Geol. 21, 635-652.
Mudd, S, Attal, M., Milodowski, D, Grieve, S, Valters, D, 2014. A statistical framework to quantify spatial variation in channel gradients
using the integral method of channel profile analysis. J. Geophys. Res. Earth Surf. 119, 138-152. http://dx.doi.org/10. 1002/2013JF002981.
Nixon, C, McNeill, L, Henstock, T., Bull, J, Bell, R., Christodoulou, D., Papatheodorou, G, Taylor, B., Ferentinos, G., Sakellariou, D.,
Lykousis, V., Sachpazi, M., Ford, M., Goodliffe, A, Leeder, M., Gawthorpe, R, Collier, R, Clements, B, 2013. Basin evolution, organization
of faulting and the distribution of displacement within the Gulf of Corinth rift Am Geophys. Union Fall Meeting
2013,2013AGUFM.T21B2556N.
Nyst, M., Thatcher, W., 2004. New constraints on the active tectonic deformation of the Aegean. J. Geophys. Res. 109, B11406.
http://dx.doi.org/10.1029/2003JB002830.
Ori, G., 1989. Geological history of the extensional basin of the Gulf of Corinth (Miocene-Pleistocene), Greece. Geology 17, 918-921.
Palyvos, N., Sorel, D, Lemeille, F, Mancini, M., Pantosti, D., Julia, R, Triantaphyllou, M, De Martini, P., 2007. Review and new data on
uplift rates at the W termination of the Corinth Rift and the NE Rion graben area (Achaia, NW Peloponnesos). Bull. Soc. Geol. Greece
40,412-424.
Palyvos, N., Mancini, M., Sorel, D., Lemeille, F., Pantosti, D., Julia, R, Triantaphyllou, M, De Martini, P., 2010. Geomorphological,
stratigraphie, and geochronological evidence of fast Pleistocene coastal uplift in the westernmost part of the Corinth Gulf Rift (Greece).
Geol. J. 45, 78-104.
Perez-Pena, J., Azanôn, J., Booth-Rea, G., Azor, A., Delgado, J., 2009a. Differentiating geology and tectonics using a spatial autocorrelation
technique for the hypsometric integral. J. Geophys. Res. 114F, F02018. http://dx.doi.org/10.1029/2008JF001092.
Perez-Pena, J, Azanôn, J, Azor, A, Delgado, J., Gonzâlez-Lodeiro, F., 2009b. Spatial analysis of stream power using GIS: SLk anomaly
maps. Earth Surf. Proc. Land. 34,16-25.
Perissoratis, C, Piper, D, Lykousis, V, 2000. Alternating marine and lacustrine sedimentation during late Quaternary in the Gulf of Corinth
rift basin, central Greece. Mar. Geol. 167,391-411.
Perron, J.T., Royden, L, 2013. An integral approach to bedrock river profile analysis. Earth Surf. Proc. Land. 38, 570-576.
Piper, D., Perissoratis, C, 1991. Late Quaternary sedimentation on the continental margin of Northern Greece. Am. Assoc Petrol. Geol. Bull.
75,46-61.
Pirazzoli, P., Stiros, S, Fontugne, M, Arnold, M, 2004. Holocene and Quaternary uplift in the central part of the southern coast of the Corinth
Gulf (Greece). Mar. Geol. 212,35-44.
Roberts, G, White, R, 2010. Estimating uplift rate histories from river profiles using African examples. J. Geophys. Res. 115, B02406.
http://dx.doi.org/10.1029/2009JB006692.
Rohais, S., Eschard, R, Ford, M, Guillocheau, F., Moretti, I., 2007a. Stratigraphie architecture of the Plio-Pleistocene infill of the Corinth
Rift: implications for its structural evolution. Tectonophysics 440, 5-28.
Rohais, S, Joannin, S., Colin, J.P., Suc.J.P., Guillocheau, F., 2007b. Age and environmental evolution of the syn-rift fill of the southern coast
of the Gulf of Corinth (Akrata-Derveni region, Greece). Bull. Soc. Geol. Fr. 178, 231-243.
Sachpazi, M., Galvé, A, Laigle, M, Hirn, A, Sokos, E., Serpetsidaki, A, Marthelot, H.J.M., Pi Alperin, J., Zelt, B., Taylor, B., 2007. Moho
topography under central Greece and its compensation by Pn time-terms for the accurate location of hypocenters: the example of the Gulf of
Corinth 1995 Aigion earthquake. Tectonophysics 440, 53-65.
Seeber, L, Gornitz, V, 1983. River profiles along the Himalayan arc as indicators of active tectonics. Tectonophysics 92, 335-367.
Sklar, L, Dietrich, W., 2001. Sediment and rock strength controls on river incision into bedrock Geology 29,1087-1090.
Skourlis, K, Doutsos, T, 2003. The Pinos fold-and-thrust belt (Greece) : inversion kinematics of a passive continental margin. Int J. Earth
Sci. 92, 891-903.
Small, E., Anderson, R, 1998. Pleistocene relief production in Laramide mountain ranges, western United States. Geology 26,123-126.
Snyder, N., Whipple, K., Tucker, G., Merritts, D., 2000. Landscape response to tectonic forcing: DEM analysis of stream profiles in the
Mendocino triple junction region, northern California. Geol. Soc. Am. Bull. 112,1250-1263.
Soter, S., 1998. Holocene uplift and subsidence of the Helike Delta, Gulf of Corinth, Greece. In: Stewart, I., Vita-Finzi, C. (Eds.), Coastal
Tectonics. Geol. Soc, London, Spec. Publ. 146, pp. 41-56.
Stefatos, A., Papatheodorou, G., Ferentinos, G., Leeder, M., Collier, R, 2002. Seismic reflection imaging of active offshore faults in the Gulf
of Corinth: their seismotectonic significance. Basin Res. 14,487-502.
Sternai, P., Herman, F., Fox, M., Castelltort, S., 2011. Hypsometric analysis to identify spatially variable glacial erosion. J. Geophys. Res.
116F, F03001. http://dx.doi.org/10.1029/201 OJFOOl 823.
Strahler, A, 1952. Hypsometric (area-altitude) analysis of erosional topography. Bull. Geol. Soc. Am. 63,1117-1142.
Taylor, B., Weiss, J., Goodliffe, A., Sachpazi, M., Laigle, M., Hirn, A., 2011. The structures, stratigraphy and evolution of the Gulf of
Corinth rift, Greece. Geophys. J. Int. 185, 1189-1219.
Vassilakis, E., Skourtsos, E., Kranis, H., 2007. Estimation of tectonic uplift rate using quantified morphometric indices. Proc. 8th Pan-
Hellenic Geogr. Conf. National and Kapodistrian Univ., Athens, pp. 17-26.
Vita-Finzi, C, 1993. Evaluating late Quaternary uplift in Greece and Cyprus. In: Prichard, H., Alabaster, T, Harris, N, Neary, C. (Eds.),

Published in : Geomorphology (2015), vol. 246, pp. 188-204
Status : Postprint (Author’s version)
Magmatic Processes and Plate Tectonics. Geol. Soc, London, Spec. Publ. 76, pp. 417-424.
Whipple, K., 2001. Fluvial landscape response time: how plausible is steady-state denudation? Am. J. Sci. 301,313-325.
Whipple, K., Tucker, G., 2002. Implications of sediment-flux-dependent river incision models for landscape evolution. J. Geophys. Res.
107B, 2039. http://dx.doi.org/10.1029/2 000JB000 044.
Whittaker, A, Boulton, S, 2012. Tectonic and climatic controls on knickpoint retreat rates and landscape response times. J. Geophys. Res.
117, F02024. http://dx.doi.org/10.1029/2011JF002157.
Whittaker, A, Cowie, P, Attal, M., Tucker, G., Roberts, G., 2007. Contrasting transient and steady-state rivers crossing active normal faults:
new field observations from the central Apennines, Italy. Basin Res. 19, 529-556.
Willgoose, G., Hancock G, 1998. Revisiting the hypsometric curve as an indicator of form and process in transport-limited catchment Earth
Surf. Proc. Land. 23, 611-623.
Wobus, C, Whipple, K., Kirby, E., Snyder, N., Johnson, J., Spyropolou, K., Crosby, B., Sheehan, D, 2006. Tectonics from topography:
procedures, promise, and pitfalls. In: Willett, S, Hovius, N., Brandon, M., Fisher, D. (Eds.), Tectonics, Climate, and Landscape Evolution.
Geol. Soc. Am. Spec Pap. 398, pp. 55-74. http://dx.doi.org/10.1130/2006.2398(04).
Ye, F., Barriot, J.P., Carretier, S, 2013. Initiation and recession of the fluvial knickpoints of the Island of Tahiti (French Polynesia).
Geomorphology 186,162-173.