paul t m. jaeger; julie a. hayes, and christopher allen · paul t soderman, stephen m. jaeger;...
TRANSCRIPT
NASA/TP-2002-211851
Acoustic Quality of the 40- by 80-Foot Wind 'lhnnel Test Section After Installation of a Deep Acoustic Lining Paul T Soderman, Stephen M. Jaeger; Julie A. Hayes, and Christopher S. Allen
November 2002
https://ntrs.nasa.gov/search.jsp?R=20040045260 2018-09-05T03:54:56+00:00Z

The NASA STI Program Office . . . in Profile
Since its founding, NASA has been dedicated to the advancement of aeronautics and space science. The NASA Scientific and Technical Information (STI) Program Office plays a key part in helping NASA maintain this important role.
The NASA STI Program Office is operated by Langley Research Center, the Lead Center for NASA's scientific and technical information. The NASA STI Program Office provides access to the NASA STI Database, the largest collection of aeronautical and space science STI in the world. The Program Office is also NASA's institutional mechanism for disseminating the results of its research and development activities. These results are published by NASA in the NASA STI Report Series, which includes the following report types:
TECHNICAL PUBLICATION. Reports of completed research or a major significant phase of research that present the results of NASA programs and include extensive data or theoreti- cal analysis. Includes compilations of significant scientific and technical data and information deemed to be of continuing reference value. NASA's countei-part of peer-reviewed formal professional papers but has less stringent limitations on manuscript length and extent of graphic presentations.
TECHNICAL MEMORANDUM. Scientific and technical findings that are preliminary or of specialized interest, e.g., quick release reports, working papers, and bibliographies that contain minimal annotation. Does not contain extensive analysis.
CONTRACTOR REPORT. Scientific and technical findings by NASA-sponsored contractors and grantees.
CONFERENCE PUBLICATION. Collected papers from scientific and technical confer- ences, symposia, seminars, or other meetings sponsored or cosponsored by NASA.
SPECIAL PUBLICATION. Scientific, technical, or historical information from NASA programs, projects, and missions, often concerned with subjects having substantial public interest.
TECHNICAL TRANSLATION. English- language translations of foreign scientific and technical material pertinent to NASA's mission.
Specialized services that complement the STI Program Office's diverse offerings include creating custom thesauri, building customized databases, organizing and publishing research results . . . even providing videos.
For more information about the NASA STI Program Office, see the following:
Access the NASA STI Program Home Page at Izttp://wrvrv.sti. izasa.gov
E-mail your question via the Internet to help@ sti.nasa.gov
Fax your question to the NASA Access Help Desk at (301) 621-0134
Telephone the NASA Access Help Desk at (30 1 ) 62 1 -0390
Write to: NASA Access Help Desk NASA Center for Aerospace Information 7 12 1 Standard Drive Hanover, MD 21 076- 1320

NASA/TP-2002-211851
Acoustic Quality of the 40- by 80-Foot Wind Tbnnel Test Section After Installation of a Deep Acoustic Lining Paul T Soderman Ames Research Center; Mofett Field, California
Stephen M. Jaeger AerospaceComputing, Iizc., Ames Research Centel; Moflett Field, California
Julie A. Hayes Signalscape, Inc., Raleigh, North California
Christopher S. Allen Ames Research Centel; Mofett Field, Califonzia
National Aeronautics and Space Administration
Ames Research Center Moffett Field, California 94035- 1000
November 2002

Available from:
NASA Center for Aerospace Information 7 12 1 Standard Drive Hanover, MD 2 1076-1 320 (301) 621-0390
National Technical Information Service 5285 Port Royal Road Springfield, VA 22 16 1
(703) 487-4650
TABLE OF CONTENTS
Symbols ................................................................................................................................................... v Summary ................................................................................................................................................. 1 Introduction ............................................... ..... .......................................................................................... 2 Wind Tunnel Environment ..................................................................................................................... 2 Lining Design Goals ............................................................................................................................... 3 Lining Design ......................................................................................................................................... 3 Module Sound Absorption ..................................................................................................................... 5
Low-Frequency Pulse Reflection Method ........................................................................................ 5
Low-Frequency Summary ................................................................................................................. 9 High-Frequency Pulse Reflection Method ....................................................................................... 9
Low-Frequency Sound Absorption-Cannon .................................................................................. 7
High-Frequenc y Sound Absorption-Tweeter ............................................................................... 10 High-Frequency Summary ............................................................................................................... 12
Global Response ................................................................................................................................... 14 Noise Sources ................................................................................................................................... 15 Noise Source Calibration ................................................................................................................. 15 Traverse Locations and Method ...................................................................................................... 15 Broadband Sound Decay .................................................................................................................. 15 Tonal Sound Decay .......................................................................................................................... 18 Comparison with Previous 40x80 Lining ....................................................................................... 19 Sound Absorption with Wind .......................................................................................................... 20
Concluding Remarks ............................................................................................................................ 20 Appendix: Ideal wall interference and sound decay ........................................................................... 23
Tonal Sound Interference ................................................................................................................. 23 Random Sound Interference ............................................................................................................ 27
References ............................................................................................................................................. 57 Figures ................................................................................................................................................... 59
iii
iv
SYMBOLS
C
d,
a
e
sound speed, ft/sec
distance from impulsive noise source to lining target selected for sound absorption measurement
distance from lining target to microphone that captured reflected sound
distance from impulsive noise source to microphone
frequency, Hz
wave number, 2nfk
sound level referenced to 20 micropascals, decibels
rms sound pressure absorbed by lining, Pa
rms sound pressure incident on lining, Pa
rms sound pressure reflected by lining, Pa
autopower spectrum of incident sound at target, Pa’
autopower spectrum of reflected sound at target, Pa’
autopower spectrum of incident sound as measured at microphone, Pa’
autopower spectrum of reflected sound as measured at microphone, Pa’
absorbed acoustic energy incident acoustic energy
lining sound absorption coefficient =
acoustic incidence angle relative to surface normal, deg
V

SUMMARY
A recessed, 42-inch deep acoustic lining has been designed and installed in the 40- by 80-Foot Wind Tunnel (40 x 80) test section to greatly improve the acoustic quality of the facility. The lining is composed of fiberglass wedges in 4- by 4-ft modules protected by a support grating and porous cover. This report describes the test-section acoustic performance as determined by a detailed static calibration-all data were acquired without wind. We measured individual module sound absorption using acoustic pulse-reflection techniques. Global acoustic quality was determined from sound decay with distance by use of steady noise sources of various types. The results were related to ideal free-field conditions and compared with the acoustic environment existing before installation of the deep lining.
Despite variability in the lining absorption, global measurements of sound decay from steady noise sources showed that the facility is suitable for acoustic studies of jet noise or similar randomly generated sound. The wall sound absorption, size of the facility, and averaging effects of wideband random noise all tend to minimize interference effects from wall reflections. The decay of white noise with distance was close to free-field above 250 Hz. However, tonal sound data from propellers and fans, for example, will have an error band (to be described) that is caused by the sensitivity of tones to even weak interference. That error band could be minimized by using directional instruments such as phased microphone arrays.
The measured acoustic performance can be summarized as follows. Low- to mid-frequency acous- tic energy absorption of the lining (100-2,500 Hz) was very good: 94% to 97% over most of the surface. The fiberglass wedges below the porous interface gave much better performance than the fiberglass blanket previously installed in the test section. However, the floor turntable absorbed only 78% of the acoustic energy below 3 15 Hz because of its shallow depth and the numerous structural elements required for model support. In many situations, it may be possible to avoid turntable reflections by microphone placement or by use of ad hoc acoustic treatment in that area.
The high-frequency performance of the lining between 4 kHz and 20 kHz ranged from 78% to 97% absorption, which fell below the minimum design goal of 90% absorption. The data indicate that the surface panels were the cause of the lower than expected sound absorption. There was a variation in absorption over individual modules and from module to module that suggested a variation in impedance at the lining surface. The source of the impedance problem was the flow- control screen bonded to the perforated face sheet, which contained particles trapped during the manufacturing process. Attempts to clean the screens in the wind tunnel were unsuccessful. As mentioned above, only tonal sound is strongly affected by the lower absorption values.
Above 10 kHz, air absorption began to dominate the sound field in the large test section, reflections became weaker, and the test section tended toward an anechoic environment as frequency increased.
This paper describes the test techniques, in situ lining performance, comparisons with the previous ad hoc lining, and acoustic quality of the test section-both theoretical and experimental. Reference will be made to the lining design and development reported previously.
1
INTRODUCTION
In recent years, the National Full-scale Aerodynamics Complex (NFAC) 40- by 80-Foot Wind Tunnel (40 x 80) has operated with a 6-inch-deep bulk-fiberglass acoustic lining in the test section to create an environment suitable for aeroacoustic studies of aircraft models in simulated flight (see figs. 1 and 2). The cross section of the 40 x 80 test section was actually 39 by 79 ft because of the acoustic lining. The acoustic performance of the lining was limited because of its shallow depth and design (ref. 1). In particular, the floor grating reduced the fiberglass depth to 4.5 inches, and the 40%-open perforated face sheet over the lining reflected some acoustic energy.
To achieve higher quality acoustic performance over a wide frequency range, Ames Research Center initiated an ambitious design and development program to deepen and improve the acoustic lining without compromising the aerodynamic performance of the facility (ref. 2). The original test-section pressure shell was supported by four external 36-inch-deep ring girders. With removal of the original pressure shell and installation of a new pressure shell on the outside surface of the ring girders, a deep space was created for installation of a new acoustic lining. That 36-inch-deep space was filled with fiberglass wedges that are protected from the airstream by a porous interface and support grating. The floor and lower wall linings were designed to support personnel and equipment, whereas the upper wall and ceiling were designed to support aerodynamic loads. By locating the flow surface 6 inches above the ring-girder inner surfaces, reflections from the girder flanges were minimized by the top 6 inches of lining. Thus, the test section cross section remains at 39 by 79 ft. We also installed a shallow lining in the diffuser inlet to extend the acoustic measurement region. References 3 to 5 describe the design and development of the new acoustic lining along with results of the laboratory tests of materials and components evaluated during the development project.
The purpose of this paper is to describe the acoustic performance of the new lining shortly after its installation in the wind tunnel. We measured the performance during a brief facility calibration and integrated system test before wind-on operations were commenced. The static sound absorption of the lining at key locations and room acoustic quality relative to free-field were measured. Results are related to the design goals and to the anticipated use of the facility. An example of wind effects on lining absorption is shown from a related, unpublished study. Wind-on background noise will be reported separately. (A somewhat abbreviated version of this report was published as ref. 6.)
WIND TUNNEL ENVIRONMENT
The 40- by 80-Foot Wind Tunnel is a closed circuit, closed test-section facility (fig. 3). The 80- by 120-foot test section shown in figure 3 shares the same drive system, but is not part of the work described here. Top airspeed in the 40 x 80 is 300 knots, or Mach 0.45. The wind tunnel is often used for aircraft landing and takeoff simulations and studies of propulsion/airframe integration. Aerodynamic and acoustic investigations are commonly made of unpowered or powered models using jet engines, propellers, rotors, fans, or high-pressure propulsion simulators. Fixed and
2
moving in-flow microphones and phased microphone arrays are used to identify and record the model noise (refs. 7 and 8).
Six 40-ft-diameter, electrically powered fans constitute the drive section. In parallel with the acoustic lining modification, the fan-drive system was improved for low-speed operation. New digital electronics in the motor control system expanded the low end of the operating envelope. Since the fan blades are variable pitch and variable speed, minimizing blade rotational speed and maximizing blade angle (refs. 1,9, 10) can optimize thrust, noise, and power consumption.
Eight large vortex generators at the diffuser entrance just downstream of the test section (fig. 8) energize flow along the diffuser walls. Because of their potential acoustic reflections, the vortex generators were moved 22 ft downstream to minimize reflections into the test section. Support columns along the diffuser centerline shown in figure 4 might also reflect sound locally, but that effect was not found in this study. We determined experimentally that the wind-tunnel comer walls and turning vanes are too far from the test section to be significant acoustic reflectors.
LINING DESIGN GOALS
The primary project design goal was to create a sound absorbent test-section lining operational from 80 Hz to 20 kHz with a minimum of 90% energy absorption at those limits and as close to 100% absorption as practical between those limits (refs. 3-5). Furthermore, good absorption is desirable out to 80 kHz. Thus, the lining below the surface layer was designed to have 99% acoustic energy absorption between 80 Hz and 20 kHz. To achieve such high absorption required considerable effort on the transmission of sound through the surface layer into the lower lining. In the turntable region, which has areas less than 42 inches deep, the low-frequency limit for 90% absorption was set at 200 Hz. For the shallow diffuser inlet lining, the low-frequency limit was arbitrarily set at 500 Hz.
For good flow quality over the speed range from 0 to 300 knots, a low-drag surface material with small boundary-layer growth was required. Pressure gradients or cross-flows caused by large models must not create unusual flows through the lining or other flow anomalies in the test section.
Structurally, the floor lining was designed to be robust and capable of supporting work crews and heavy equipment in the test section. This requirement led to a floor designed to carry (1) a point load of 1,800 lb on an 8- by 8-inch area spaced no closer than 4 ft on center, and (2) a uniform load of 200 Ib/ft’.
LINING DESIGN
Throughout most of the test section, the acoustic lining (refs. 3-5) is composed of 4-ft-square modular compartments 42 inches deep that contain 36-inch-tall wedges over a nominal 4-inch air gap that are protected from the airstream by a porous interface. The module geometry and assembly are illustrated in figures 5(a)-5(b). The eight wedges within each module were
3

alternately oriented streamwise and cross-streamwise to block acoustic waves traveling parallel to a wedge valley. Each 4- by 4-ft module was surrounded by 0.19-inch-thick steel panels, or air dams, that carry loads and prevent airflow between modules. The air dams and other exposed surfaces were shielded by cloth-wrapped fiberglass to minimize acoustic reflections (OCF 70 1 fiberglass and J.P. Stevens 1675 fiberglass cloth).
The fiberglass wedges were also protected by fiberglass cloth and, over the cloth, a light wire mesh with 0.5-inch wire spacing as shown in figures 6(a) and 6(b). The wedge specifications are noted on figure 6(b). As reported in reference 3, acoustic absorption of individual wedges was equal to or greater than 99% at frequencies between 100 Hz and 1 kHz.
The model support turntable has mechanical components that could not be recessed to the full 42-inch depth. Figure 7(a) illustrates the turntable and the variation of lining module shape and depth in that area. The lining depth varied from 5.5 to 36 inches including the grating. In areas less than 14 inches deep, bulk fiberglass wrapped in cloth was used as the sound absorber. In deeper areas, wedges were installed. Over the ring girders outside the turntable area, the lining depth was 6 inches. The lining layout outside the turntable area is illustrated in figure 7(b). The wall and ceiling modules also had 42-inch depths. The overhead-door lining modules contained structural bracing running diagonally through the modules. Panels chosen for sound absorption measure- ments are noted on figures 10(a) and lO(b).
The top surface of the lining or interface panel had different structural requirements that resulted in the three interface panel designs illustrated in figure 8. There was a heavy-duty floor section, a medium-duty lower wall section, and a light-duty upper wall and ceiling section. Panel details are given in figures 9(a)-9(d). The heavy-duty floor surface was a 68%-open, perforated 12-gauge (0.105-inch thick) steel sheet with a fine-mesh stainless-steel screen diffusion bonded to the underside for flow control. The sheet was supported by a steel grating with 2-inch-deep, 12-gauge, 5 1 %-open porous slats spaced 1.38 inches apart. Porous slats reduce reflections (ref. 3). The floor grating slats ran cross-stream. The light-duty lower wall panels (fig. 9(b)) utilized the same interface sheet supported by similar porous steel grating slats spaced 3 inches apart. The wall and ceiling grating slats ran streamwise. All floor slats, and only floor slats, are supported by a single bar at mid-span that runs perpendicular to the slats. The ceiling panels (fig. 9(c)), which actually extend down the sides of the test section (see fig. S), were made from lighter 16-gauge (0.060- inch) 68%-open perforated steel sheet with the same fine-mesh screen attached to the flow side (not the underside). These panels were supported by 16-gauge, 51%-open porous slats that are 1.25 inches deep on 6-inch centers. The screen on the flow side of the perforated plate creates less drag, but provides slightly poorer sound absorption compared with screen under the perforated plate (ref. 3). A light fiberglass material (Fibair) was stuffed between the slats on all panels to minimize internal reflections.
Figure 9(d) shows the fine-mesh stainless screen, which was designed to inhibit airflow from pumping into the lining. Sound transmission into the lining is very sensitive to screen flow resistance (refs. 3,4). The screen specification was Dutch twill: 200 warp by 600 shute wiredinch, 0.06 1 and 0.046-mm diameter, 8- 1 0-cgs rayls at 1 m/sec airspeed, 26-micron particle capture. A 10-cgs rayls screen bonded to a 68%-open perforated plate ideally would have a flow resistance of approximately 10 / 0.68 = 14.7-cgs rayls. The screen attachment to the perforated plate was
4

accomplished by a diffusion-bonding process whereby two metals in contact in an inert atmosphere are subjected to high temperature just below their melting points, which causes them to weld together. However, because of contamination during the diffusion-bonding process, the flow-resistances of the screedplate test samples varied from 16 to 26-cgs rayls or sometimes more. As a result, interface panels with various flow resistance values were incorporated in the lining construction. The effect of the screen on sound transmission into the lining will be discussed below.
A 6-inch-deep fiberglass lining was installed in the diffuser inlet downstream of the test section for a distance of 20 ft as an extension to the deep lining. Figure 10(a) shows the lining plan view. The total length of test section acoustic treatment was 103 ft, not including the metal ramps that fair the lining into the wind-tunnel surface at the upstream and downstream edges. Figure 10(b) shows an elevation view of the diffuser lining.
MODULE SOUND ABSORPTION
Low-Frequency Pulse Reflection Method
We measured the low-frequency sound absorption of individual 4- by 4-ft lining modules in situ by using pulse-reflection measurements in a manner analogous to the Wilby et al. (ref. 11) two- microphone method (see also refs. 3 and 4). That is, impulse-noise sources created an acoustic burst with sufficiently short time duration that the direct and reflected signals near a panel could be measured. One microphone measured the direct and one the reflected signal. As will be shown, one microphone can serve for both purposes. From that information, absorption coefficients were calculated. For low frequencies, a yachting cannon (fig. 11) firing 10-gauge blank charges created acoustic pulses with energy ranging from 50 Hz to 5 kHz.
The instrumentation and data-acquisition system are illustrated in figure 12. Typically, a pulse time trace was captured digitally on a signal analyzer so that the operator could choose the time windows of interest. The time data were then transferred to a computer for computations and generation of data files for sound absorption analysis.
Because the cannon pulse train was fairly long, it was necessary to position the microphones some distance from the panel reflection point to prevent overlap of the direct and reflected pulses. Figure 13 shows the cannon and two microphone locations for setup 1, which was designed for reflection measurements at the deep module floor and wall area downstream of the turntable. The cannon was mounted on a ladder and aimed cross-stream. Microphone 1 recorded the direct pulse, and microphone 2 recorded the reflected pulse from the floor. Both microphones were on the propagation path. Later we found that the microphones did not have to be directly on the propa- gation path, as will be discussed. The floor target, F4, is noted on figure 7(b).
5

Since the absorption coefficient is defined as the ratio of absorbed to incident acoustic energy, the absorption coefficient, a, can be computed from the square of the absorbed, incident, and reflected acoustic pressures as follows:
The spectrum of absorption coefficients can be written in terms of the autopower spectra:
(Is, r) ( P i I?) a ( f ) = 1 - - (3)
where the ratio represents a ratio of ensemble averages. In an analogous manner, a third-octave absorption spectrum can be computed from the ratio of third-octave pressure-squared energy in each band.
By correcting the data at microphones 1 and 2 to a common distance, the sound absorption can be calculated. In many cases, a single microphone can be used to measure the direct and reflected sound. Consider the geometry illustrated in figure 14, which represents a typical measurement of incident and reflected sound from an impulsive source using one microphone. Assuming that the source is sufficiently omnidirectional, the direct signal along path d, can be corrected for distance to represent the incident autopower spectrum at the target distance d, as follows (ref. 11):
d Si(f,e) = 'Si,(f,8)exp(-ik(d, -dl))
dl (4)
Thus, the incident sound at the target, Si, is calculated from the direct signal at the microphone, Si,. The last term represents the phase shift created by the longer propagation path. Similarly, the reflected signal at the microphone can be corrected to the target distance:
s,(f,e> = - d l + d 2 S,,(f,B)exp(-ikd,) d,
From equation (3), we get for the energy absorption coefficient,
6
where the last term represents a ratio of approximately 10 ensemble averages of autospectra of the reflected and incident waves. Equation (6) can be used for single- or dual-microphone analyses as long as the distance term is consistent with the geometry of the setup and the microphone sensitivities are equalized. The absorption coefficient varies from zero to 1, zero being perfect reflection and 1 being perfect absorption of acoustic energy. An absorption coefficient of 0.9 is equivalent to 90% sound absorption. Results of the reflection measurements will be discussed in the next section.
The above analysis is based on the assumption of equal sound radiation along the two paths. By measuring the cannon emission at various angles, it was found that the low-frequency sound directionality was sufficiently uniform that after correcting for distance, the direct and reflected signals at a microphone differed only by the energy absorbed by the panel. To illustrate that fact, figure 15(a) shows windowed cannon pulses at the two microphones in setup 1. Microphone 1 gain was set low. Figure 15(b) shows the autospectra of the two pulses after correcting the data to a common distance and gain. The spectra were considered sufficiently similar for analyzing floor reflections, especially with the rejection of data above 2,500 Hz because of poor coherence between the two signals as discussed below.
Figure 16 shows time traces from the two microphones in setup 1 (fig. 13) downstream of the turntable. The direct and reflected floor pulses used in the analysis are labeled. As discussed above, the data were corrected to a common distance. The 42-inch-deep floor module F4 was three panels upstream from the diffuser, as shown in figure 7(b). We windowed the individual time traces in the time domain, taking care to set the window limits at points of zero signal amplitude as well as tapering the beginning and end of the window with 0.04-msec-long cosine-squared function to prevent leakage. We then Fourier transformed the pulses with one average to find the autospec- trum. Multiple autospectra from multiple cannon shots were then averaged to compute absorption coefficients as defined above. In the process, we acquired the normalized acoustic impedance, as well as the coherence between the direct and reflected sound. Finally, we integrated the narrow- band autospectra using a computer-simulated third-octave analysis to give third-octave spectra. These spectra were averaged and used to compute third-octave absorption coefficients. The third- octave data result in smoother absorption spectra that are easier to compare than narrowband spectra. The third-octave results were used to evaluate the acoustic lining absorption relative to the design goals.
To investigate the turntable area, we installed setup 2 as shown in figures 17 and 18. The cannon and microphones were approximately 11 ft and 8 ft above the floor, respectively. The three microphones captured the direct sound and reflections from the various test-section surfaces. The cannon was fired in upstream (+x direction) and downstream directions.
Low-Frequency Sound Absorption-Cannon
Deep floor - low frequency: Figure 19(a) shows typical autospectra of the direct and reflected pulses at module F4 using setup 1. The acoustic incidence angle relative to the surface normal was 52". The difference between the two curves represents the acoustic energy absorbed at the floor. The narrowband absorption and coherence between the direct and reflected signals are plotted in figure 19(b). The absorption is high, but the low coherence above 2,500 Hz makes the higher-
7

frequency cannon data so uncertain that they must be rejected. Apparently the lining removed coherence from the direct and reflected signals at higher frequencies. This would happen if the reflection were very weak or distorted by the deep lining.
From the acceptable narrowband autospectra data, third-octave acoustic spectra and absorption spectra were computed from eight shots as shown in figure 19(c). The low-frequency absorption of this deep module from 100 to 2.5 kHz was over 9596, which we consider very good for most research studies in this type of facility.
Turntable - low frequency: With the cannon over the turntable center as illustrated in figure 18 (setup 2), direct and reflected sound bursts from nine shots were recorded on the three microphones located upstream, cross-stream, and downstream (microphones 1, 2, and 3). The actual source and receiver coordinates are listed in figure 18 relative to the coordinate origin over the turntable center at test-section mid-height.
Figures 20(a)-(c) show typical signal time traces for the three microphones and cannon aimed upstream. Noted on the figure are the direct pulse and the reflections from the floor, ceiling, left and right walls (facing upstream). The 6-inch-deep turntable floor target T4 was located as shown in figure 7(a). The reflections correspond to calculated propagation times using the geometry of figure 18 and estimated sound speed. The direct signal shows the sharp pulse from the initial wave front (negative because of instrumentation phase response) and the following wave train. In some cases, especially at microphone 3, the first floor reflection overlapped the direct pulse and could not be used (see floor reflection in fig. 20(c)).
Figure 21 compares third-octave absorption spectra from the deep floor module F4 (fig. 19(c)) and the 6-inch-deep turntable module T4. The deep module absorbed over 95% of the acoustic energy from 100 to 2.5 kHz, the range of the cannon data. The shallow turntable panel, however, absorbed about 80% of the energy below 3 15 Hz and 90% to 95% above that frequency. Extrapolation of these data suggest that the deep-lining modules meet the low-frequency design goal of 90% absorption or better at 80 Hz, and the shallow turntable lining modules perform close to the design goal of 90% absorption above 200 Hz. No low-frequency impulsive data were acquired in the diffuser area.
Ceiling - low frequency: Figure 22 shows sound-absorption coefficients generally greater than 0.95 at the ceiling as measured by microphones 1 and 3 of figure 18 during two different series of shots (setup 2). For the upstream data (microphone l), the cannon was near the turntable center and pointed upstream. For the downstream data (microphone 3), the cannon was pointed downstream at the same location. The ceiling modules are deep, but contain various structural members running diagonally in each module. Despite the internal structure, the ceiling sound absorption was very good.
Wall - low frequency: Data at microphone 2 (setup 2) were used to evaluate wall reflections. Figure 23 shows that the left (east) wall absorption was generally 0.95 or greater in the range of good cannon data. All other cannon wall data appear to be corrupted by reflections from the support stand and are not presented.
8
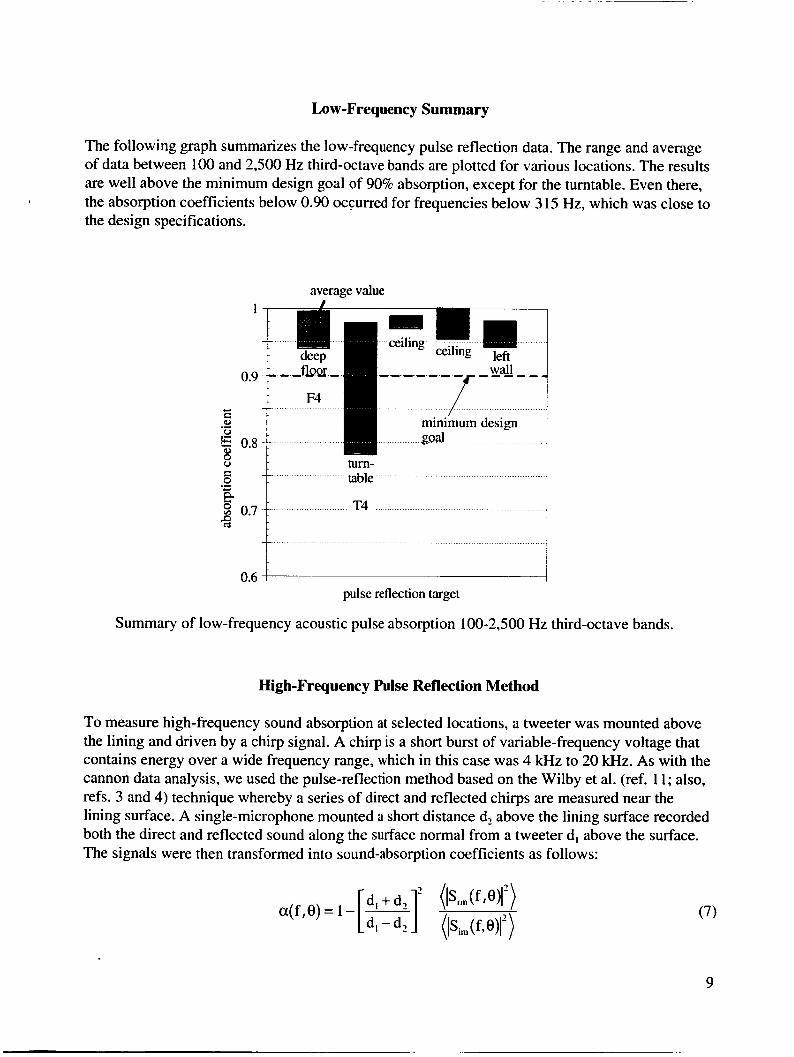
Low-Frequency Summary
The following graph summarizes the low-frequency pulse reflection data. The range and average of data between 100 and 2,500 Hz third-octave bands are plotted for various locations. The results are well above the minimum design goal of 90% absorption, except for the turntable. Even there, the absorption coefficients below 0.90 occurred for frequencies below 3 15 Hz, which was close to the design specifications.
average value 1
c) 0.9 1 5 0.8
E W V .e
t
left wall -------
design
pulse reflection target
Summary of low-frequency acoustic pulse absorption 1 Oo-2,500 Hz third-octave bands.
High-Frequency Pulse Reflection Method
To measure high-frequency sound absorption at selected locations, a tweeter was mounted above the lining and driven by a chirp signal. A chirp is a short burst of variable-frequency voltage that contains energy over a wide frequency range, which in this case was 4 kHz to 20 kHz. As with the cannon data analysis, we used the pulse-reflection method based on the Wilby et al. (ref. 11; also, refs. 3 and 4) technique whereby a series of direct and reflected chirps are measured near the lining surface. A single-microphone mounted a short distance d2 above the lining surface recorded both the direct and reflected sound along the surface normal from a tweeter d, above the surface. The signals were then transformed into sound-absorption coefficients as follows:

Figures 24(a)-(c) illustrate the apparatus used to position the speaker 10.88 ft above the floor. (Only normal incidence sound was measured.) An 0.25-inch condenser microphone attached to a small rod 23.5 inches above the floor target captured the direct and reflected sound bursts. The arc and microphone support rod were wrapped with fiberglass as shown. The sound passed the microphone with grazing incidence. Ten chirps were generated for each condition and the autospectra averaged as discussed before. Increasing the number of chirps to 25 had no discernable effect on the results. As with the cannon data, the time signature was tapered and windowed where the signal crossed the zero-amplitude axis to minimize leakage.
We devised a hand-held strut to position the tweeter and microphone for the wall and ceiling pulse-reflection measurements (Fig. 25). Personnel positioned the man-lift and aimed the apparatus at the surface target such that spurious reflections could not enter the desired time windows of the direct and reflected sound. A laser-beam-aiming device ensured that the source and microphone were along a line normal to the surface target. Multiple chirps were captured at each position using the same instrumentation as used for the arc measurements.
Figures 26(a) and 26(b) are two views of the left wall and the ceiling showing the leading edge of the lining, the overhead model access door, and the various panels tested with the handheld pulse generator. The heavy-duty wall panels appear darker than the light-duty wall panels just above. The overhead doors open at the centerline and pivot about the hinge line noted on the figures.
High-Frequency Sound A bsorption-Tweeter
Deep floor - high frequency: Figure 27 illustrates a typical chirp generated by the tweeter with reflection. The direct and reflected signals were windowed in time as shown, and then processed as described above.
The first floor module investigated was designated F1-the third module upstream from the diffuser, adjacent left of the centerline (see fig. 7(b)). The target was 12.5 inches from the left side of the panel on the cross-stream centerline. Figure 28(a) shows the normal-incidence third-octave sound-absorption spectra, which oscillated around 90% absorption, but varied from 85% to 94% between the data limits of 4 kHz to 20 kHz. One curve corresponds to the bare panel and one to the panel with loose fiberglass covering the corner tie-down bolts. Although no consistent bolt reflections were found with this setup, in some cases we found spurious signals if the target was close to a panel corner. Therefore, most of the data were taken with the corner bolts covered by fiberglass. Note that we were not trying to duplicate a wind-tunnel test environment, but rather to measure point sound absorption at various locations. The relatively poor high-frequency absorption of this panel is indicative of a problem with the surface treatment (i.e., screen/ perforated-plate assembly). With a 2-inch-thick fiberglass blanket laid over the panel, the high- frequency sound absorption was generally 98% to 100% between 4 kHz and 20 kHz. The screen below the perforated plate was suspected to be the cause of the poor sound absorption, because of previous laboratory studies that related screen-flow resistance to sound absorption (ref. 3). Those studies indicated that the diffusion bonding procedure used to attach the screen to the perforated plate tended to contaminate the screen and increase the flow resistance.
10
Unlike the cannon data, the coherence of the direct and reflected chirp signals was quite high across the frequency range of interest, as shown in figure 28(b). High coherence is necessary for accurate results with this method. The narrowband absorption data for one pulse is also illustrated.
Data repeatability was good as evidenced by figure 29. These data, taken directly over small, panel spot welds that tie the surface perforated sheet to a slat underneath running streamwise, show very consistent absorption data for three different runs. The variation in corner treatment had no effect. The spot welds caused a slight degradation of absorption compared with open circle data in figure 28(a).
Panel F2 corresponds to the fourth module upstream of the diffuser and the second module left of the test section centerline. Figure 30 shows that the data captured over two locations on F2 were not greatly different from the data from module F1.
The ring girder aft of the turntable passes through module F3, which is the fifth panel upstream of the diffuser and the second panel left of the test section centerline. The ring-girder flange is 24 inches wide and 6 inches below the panel surface. Figure 3 1 shows that the sound absorption of this panel was better at some frequencies than that of the deeper modules F1 and F2 (fig. 30). Curves are presented for targets over and to the side of the ring girder. Clearly, the lining depth is not as important at these high frequencies as is the surface treatment. And this particular panel seems to be slightly more open to sound transmission than panels F1 and F2.
Turntable - high frequency: The model-support turntable is composed of lining modules of various shapes and depths ranging from 5.5 inches to 36 inches. Pulse-reflection data were acquired over panels TI, T2, and T3 (fig. 7(a)). Figure 32 shows absorption data from panels T i and T2, which are i0-inches and 6-inches deep, respectively. Each panel was tested twice. The absorption coefficients ranged from 0.85 to 0.95 for those three locations. The data do not show a clear trend with depth, but rather indicate a variation with frequency that looks like scatter. However, each curve on figure 32 is repeatable. Apparently, variations in surface impedance from panel to panel cause the variation in sound absorption.
Measurements were also made over a 30-inch-deep turntable module T3, second deepest in the turntable. Figure 33 shows a variation in absorption related to target location on the panel. Generally, the turntable high-frequency acoustic performance was equal to the deep panel performance at some locations, inferior at others. The lowest absorption curve (square symbols) was acquired 1 inch from the center support bar that runs perpendicular to and intersects the support slats. The reflections in that area appear greater than measured directly over the center bar in figure 29, which is a counterintuitive result.
Diffuser - high frequency: Unlike the rest of the test section, the diffuser lining consists of a 6-inch-deep lining with 3-inch-deep bulk fiberglass wrapped in cloth beneath the standard support grating and perforated-platehcreen used throughout the test section. Pulse-reflection data were taken at two different floor panels: D4 was the fourth panel left of the test section centerline and the first aft of the diffuser leading edge; D5 was the third panel left of the centerline and the third aft of the diffuser leading edge. The corresponding data in figure 34 show the lowest absorption coefficients so far, ranging from 0.8 to 0.95. The two curves for panel D4 were recorded before
11

and after the panel was vacuumed with a shop vacuum; the cleaning had no effect. Note that these lining modules did not perform as well as the 6-inch modules on the turntable (fig. 32) despite the similarity in depth. This may be because the surface panels with the highest flow resistance were placed in the diffuser where they would have the least effect on the test-section central region.
Wall - high frequency: Point-sound absorption measurements on the test-section wall and ceiling required the use of the handheld pulse generator described previously and shown in figure 25. To confirm that the portable device was as accurate as the arc used for floor measurements, we acquired absorption data at floor module T3 using both instruments. Figure 35 shows good agreement between the two pulse-generation apparatuses.
On the lower left wall, panels W I and W2 represent typical medium-duty and light-duty panels, respectively, as defined in figures 8 and 9 and noted on figure 26(a). The panels differ by the size and number of support slats, as well as by the position of the screen. The medium duty panels have deeper, thicker, and more numerous slats than the light-duty panels. Also, the medium-duty panels have the screens below the perforated plate, and the light-duty panels have the screens on the flow side. Contrary to intuition, however, figure 36 shows that the medium-duty panel W 1 had significantly better sound absorption than the light-duty panel W2. The trend of better panel performance with screen below relative to screen above is consistent with laboratory measure- ments (ref. 3), but the difference in absorption measured here is unusually great. Because screen contamination was suspected to be responsible for the poor absorption of panel W2, the panel was cleaned with acetone, wiped with rags, and blown with shop air. However, this cleaning process was ineffective (fig. 37). It seems that fibers deposited in the screen during the fabrication process cannot be removed this easily.
Moving up the wall, we investigated panels W3 and W4 below and on the model access door on the test-section left side. Figure 38 shows somewhat better absorption from the wall panel at some frequencies and somewhat better absorption from the door panel at other frequencies. Other nearby panels (W4 and W7) are compared in figure 39; the wall panel ahead of the door was somewhat better than the panel on the door. Surprisingly, two adjacent panels on the left door, panels W5 and W6, had significantly different sound absorption values, as shown in figure 40. Both are similarly constructed. These results lend credence to the idea that there was significant variation in the porosity of the screens as a result of the fabrication process. The performance of the wall and door panels generally fell below the goal of 90% sound absorption above 7 kHz.
Ceiling - high frequency: The ceiling modules seem to have the best sound absorption as measured from two adjacent panels, C 1 and C2-n and off the door. Figure 41 shows absorption coefficients of about 0.95 below 10 kHz and somewhat lower values above that frequency. Only two ceiling panels were tested.
High-Frequency Summary
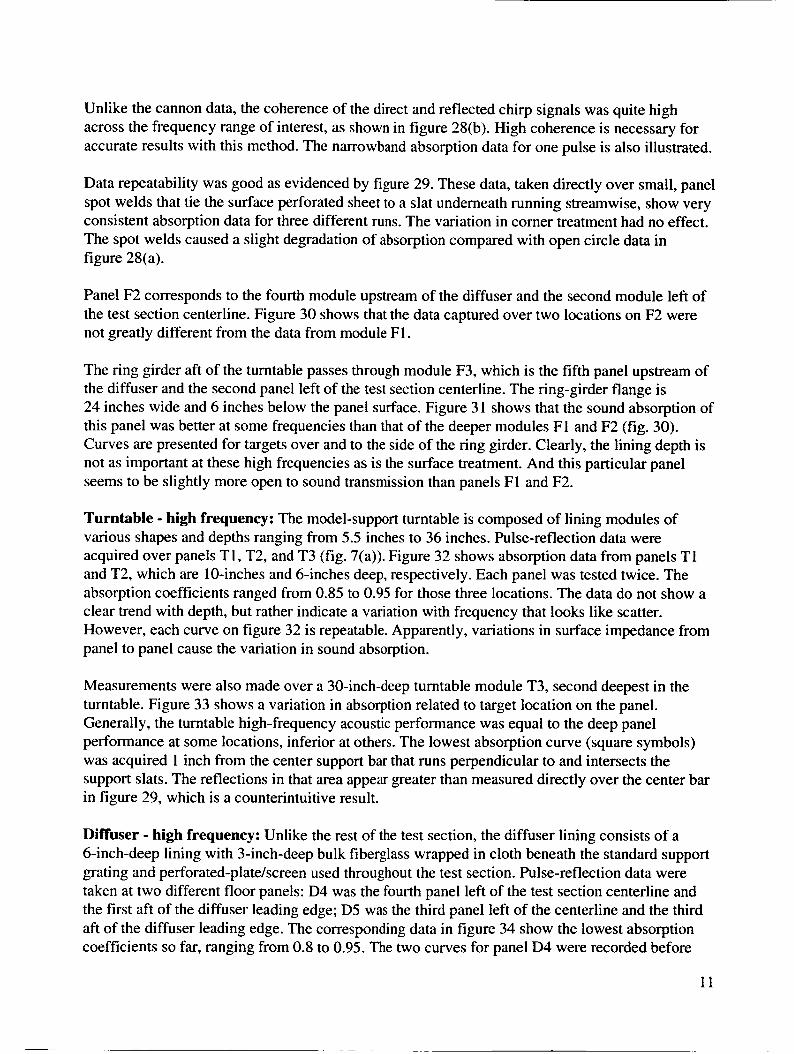
The following graph summarizes the high-frequency pulse-reflection measurements at the floor, wall, and ceiling. The range of data between 4 kHz and 20 lcHz third-octave bands is plotted along with the average of the data. The floor sound absorption was below the minimum design goal of 90% absorption over a significant frequency range. The diffuser had the lowest average sound
12
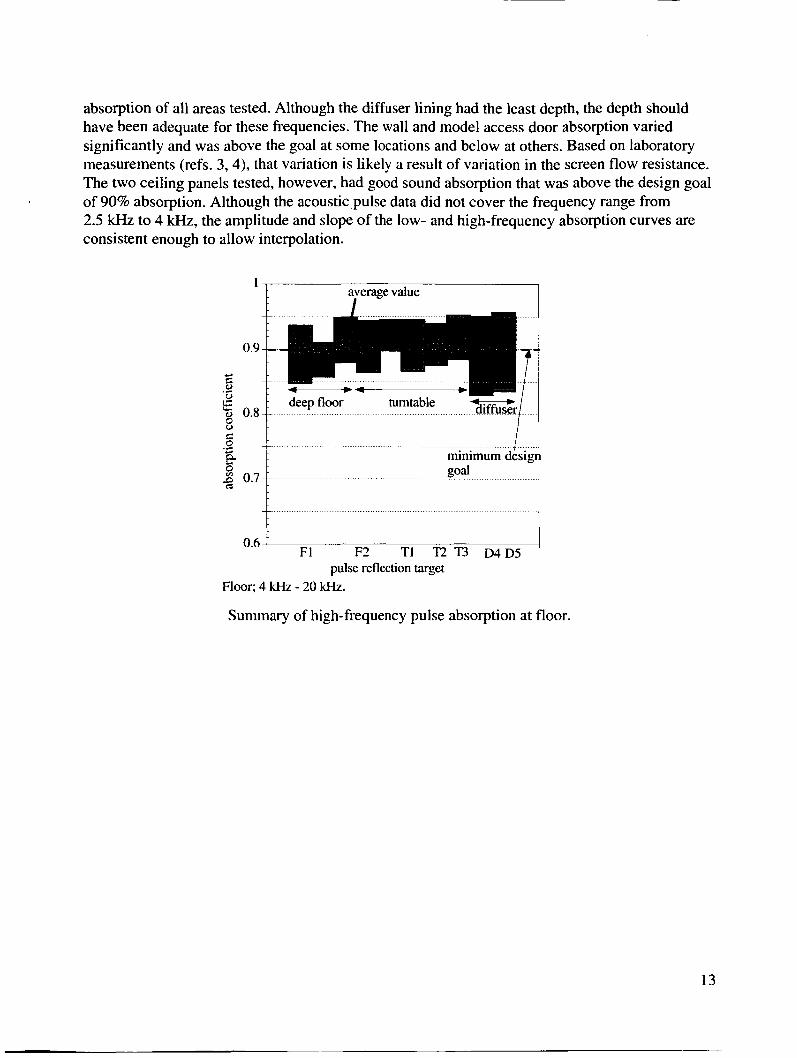
absorption of all areas tested. Although the diffuser lining had the least depth, the depth should have been adequate for these frequencies. The wall and model access door absorption varied significantly and was above the goal at some locations and below at others. Based on laboratory measurements (refs. 3,4), that variation is likely a result of variation in the screen flow resistance. The two ceiling panels tested, however, had good sound absorption that was above the design goal of 90% absorption. Although the acoustic.pulse data did not cover the frequency range from 2.5 kHz to 4 kHz, the amplitude and slope of the low- and high-frequency absorption curves are consistent enough to allow interpolation.
_ _
average value I
1
Y
.- E I,
deep floor turntable
Summary of high-frequency pulse absorption at floor.
13
I average value 1
.f: minimum desigi goal __ ......................................................................................
Wall and ceiling; 4 kHz - 20 kHz
Summary of high-frequency pulse absorption at wallheiling.
GLOBAL RESPONSE
Perhaps the best measure of the acoustic quality of the test section is sound decay versus distance from a steady noise source compared with that expected in an anechoic environment. The global acoustic response of the space can be determined in a manner akin to the way in which the space will be used. That is, in most cases acoustic measurements during research tests will be made at some distance and direction from a steadily operating aircraft model. The acoustic data will deviate from free-field by the integrated effects of all acoustic-lining reflections. The integrated effects are difficult to determine from the limited point measurements described above, but can be readily measured by traversing a microphone along a line emanating from a continuous noise source.
The following sections describe the results of acoustic traverses made relative to various loudspeakers and a pneumatic source positioned at key locations in the test section. Both broadband white noise and tonal sound fields were analyzed because the spatial response of the facility depends on the nature of the acoustic field. Generally speaking, the randomness of white noise tends to average out minor interference effects from wall reflections, particularly if wide filters such as third-octaves are used (and they are still used widely). That type of noise and analysis is consistent with many acoustic investigations of jets, shear layers, and boundary layers and is, therefore, important. Tonal sound fields, on the other hand, are very sensitive to wall
14

reflections and clearly show deviations from anechoic space. Such sounds are representative of propeller noise, fan noise, or vortex-shedding tones, for example.
Noise Sources
We used two loudspeaker systems and one pneumatic noise source for the global measurements. A 12-inch-diameter woofer mounted in an acoustically treated enclosure (figs. 42(a) and 42(b)) generated low-frequency sound. For mid-frequencies, we used a 12-sided enclosure (dodecahedron) with 7.25-inch-diameter speakers in each face (fig. 43). The dodecahedron was designed to create a pseudo-omnidirectional sound field over the mid-frequency range. A crossing-jet pneumatic source (refs. 12, 13) shown in figures 44(a) and 44(b) generated high- frequency sound. The pneumatic source had four 1/8-inch-diameter tubes that directed air jets into an intersection point, thereby creating a high-frequency, broadband, omnidirectional sound field.
Noise Source Calibration
Typical acoustic directivity patterns from the three sources as measured in an anechoic chamber are shown in figures 45-47. Both random and tonal sound could be generated by the loudspeakers, but only random noise could be generated by the pneumatic source. The noise sources were sufficiently omnidirectional to energize the entire test section. In addition, the dodecahedron was rotated during the broadband recordings, and the data at each microphone position were averaged for one revolution, which took 80 sec. The third-octave frequency ranges chosen for each source were as follows:
Woofer: 80 - 2.5 ~ H Z Dodecahedron: Crossing jet:
2.5 ~ H Z - 10 ~ H Z 10 ~ H Z - 40 ~ H Z
Ultrasonic frequencies are important for model scale simulations of large aircraft.
Traverse Locations and Method
Figure 48 shows the woofer in position 1, 13.25 ft above the turntable center. The speaker was pointed upstream at the microphone, which was traversed approximately 40 ft as shown in figure 42(b). The microphone hung from a cable driven by a stepper motor with position determined from a potentiometer signal. The microphone was moved and stopped for the broadband measurements. Atmospheric conditions were recorded. Two other traverse lines off and across the turntable were evaluated as discussed below.
Broadband Sound Decay
Position 1 - turntable center, streamwise: Figures 49(a)-49(d) show the measured sound decay in third-octave frequencies between 100 Hz and 40 kHz versus distance from the noise source. The sources generated broadband noise. Also plotted in each figure is a family of theoretical sound- decay curves expected for various wall-absorption values. At a given distance, the computed sound levels depend on reflected energy related to wall absorption. Assumptions and details of the
15
theoretical computations are given in the appendix. (Measured atmospheric conditions are included in the theoretical curves.) As wall-absorption values are hypothetically increased from 0 (hard walls) to 1 .O (free-field), the acoustic interference from wall reflections would be expected to diminish. With perfect wall absorption (a = 1 .O), the sound should decay as 6 dB per double distance plus atmospheric absorption (which is small at low- to mid-frequencies for these distances). By comparing data with the theoretical curves, one gets another estimate of wall absorption, as well as an indication of the,room acoustic quality. The atmospheric absorption is only visible in the curves at 10 kHz and higher, as indicated by a gradual roll off from a 6 dB per double distance straight line.
The data oscillations of figure 49(a) indicate a significant interference between direct and reflected sound at 100 Hz, which weakens as frequency increases. At 250 Hz, the data deviate from free- field by an amount corresponding to wall-absorption values of around 80% to 85%, which agree with the point measurements on the turntable (fig. 21). Thus, the turntable reflections appear to be dominating the acoustic field over the turntable as one would expect from the point-measurement results. By 400-Hz third-octave band and higher, the interference is small. Above 20 kHz, the atmospheric absorption becomes relatively strong and, by 40 kHz tends to dominate the wall absorption as indicated by the theoretical curves that bunch together; that is, the decay rate is virtually independent of wall absorption for f 2 40 kHz. It is also clear that the theoretical curves for 20 kHz and 40 kHz are underpredicting air absorption, because the data are below the theoretical curves, probably because of inaccuracies in measurement of humidity and temperature or changes thereof during the traverse.
It appears that the poor point-absorption data above 5 kHz discussed in previous sections, which varied from 0.8 to 0.9, were not manifest in these global response curves. Either air absorption or, more likely, the averaging effect of third-octave white noise benefited the global response. If so, moving the microphone closer to the lining or, as will be seen, tonal sound will appear to degrade the room quality. Generally speaking, however, these global results agree with the wall-absorption measurements and give a better definition of room quality in a manner analogous to the way in which the test section will be used for jet-like noise studies.
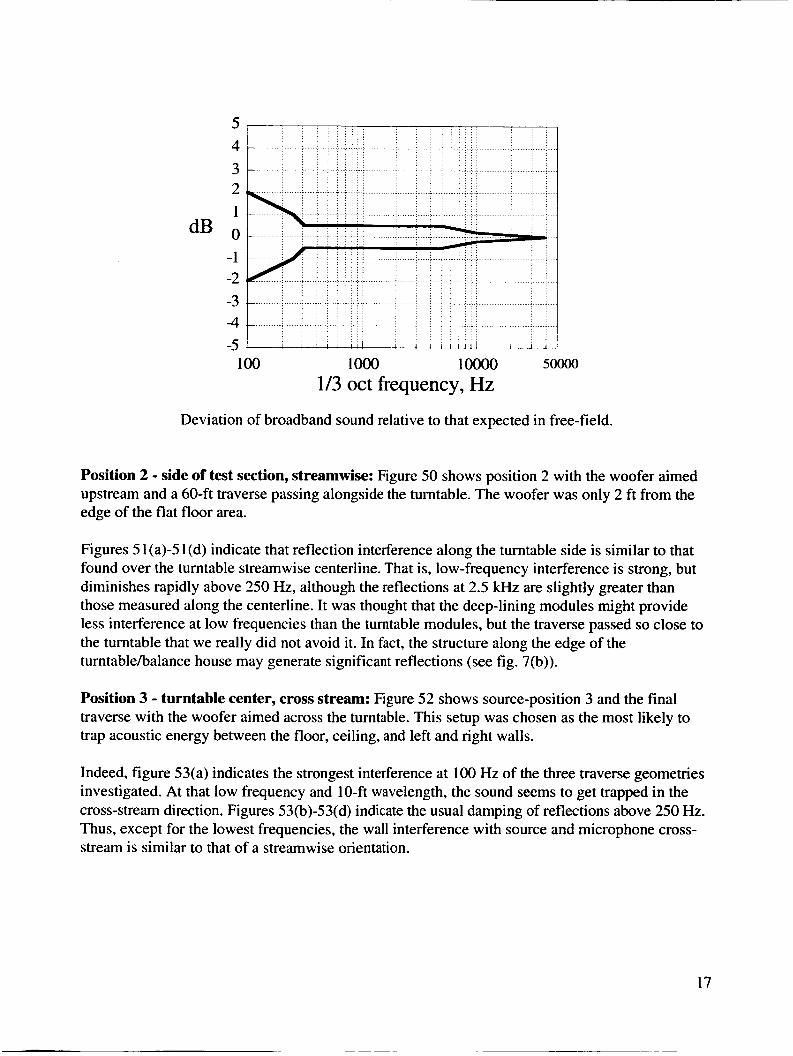
A summary of broadband deviation from free-field as measured in a streamwise direction over the turntable is shown in the following graph. Accurate jet noise data can be acquired above 250 Hz; below that frequency the data will deviate from free-field (&2 dB at 100 Hz third-octave band).
___
16
5 4 3 2 1
dB 0 -1 -2 -3 4 -5
100 lo00 loo00 1/3 oct frequency, Hz
Deviation of broadband sound relative to that expected in free-field.
Position 2 - side of test section, streamwise: Figure 50 shows position 2 with the woofer aimed upstream and a 60-ft traverse passing alongside the turntable. The woofer was only 2 ft from the edge of the flat floor area.
Figures 5 1 (a)-5 1 (d) indicate that reflection interference along the turntable side is similar to that found over the turntable streamwise centerline. That is, low-frequency interference is strong, but diminishes rapidly above 250 Hz, although the reflections at 2.5 kHz are slightly greater than those measured along the centerline. It was thought that the deep-lining modules might provide less interference at low frequencies than the turntable modules, but the traverse passed so close to the turntable that we really did not avoid it. In fact, the structure along the edge of the turntablehalance house may generate significant reflections (see fig. 7(b)).
Position 3 - turntable center, cross stream: Figure 52 shows source-position 3 and the final traverse with the woofer aimed across the turntable. This setup was chosen as the most likely to trap acoustic energy between the floor, ceiling, and left and right walls.
Indeed, figure 53(a) indicates the strongest interference at 100 Hz of the three traverse geometries investigated. At that low frequency and 10-ft wavelength, the sound seems to get trapped in the cross-stream direction. Figures 53(b)-53(d) indicate the usual damping of reflections above 250 Hz. Thus, except for the lowest frequencies, the wall interference with source and microphone cross- stream is similar to that of a streamwise orientation.
17
Tonal Sound Decay
We measured tonal decay along the same traverse lines, but, unlike the broadband noise measurements, we acquired the data as the microphone moved steadily away from the noise source at approximately 1 ft/sec. Figures 54(a)-54(g) show measured sound decay with distance from the woofer at selected tonal frequencies between 100 Hz and 2.5 kHz. Interference between the direct and reflected waves caused oscillations in the decay curve that appear stronger than those found when using third-octave white noise, because of the effective averaging of the latter, as previously discussed. Nonetheless, a careful examination of figure 54(a) indicates that deviations from the free-field curve (a = 1 .O) generally fall within the envelope predicted for wall- absorption coefficients greater than or equal to 0.8-the turntable absorption coefficient values found by point measurements. The decay curve varies k4 dB around the free-field curve, but would have deviated by +8 to -20 dB or more in a hard-walled test section (a = 0). Nevertheless, measurements of an aircraft model tone at 100 Hz would be difficult to interpret. From 250 Hz to 1 kHz, the data oscillate k 3 dB, more or less, which corresponds to interference from walls having absorption coefficients of about 0.95. At 2.5 kHz, the oscillations grow to k4 dB, corresponding to absorption coefficients of approximately 0.80 to 0.85. The turntable reflections control the tonal response in the test section center just as it did during the broadband decay surveys.
At distances less than 20 ft from the source, the oscillations are significantly less, because the ratio of direct to reflected sound becomes progressively stronger as the microphone approaches the source. Thus, within 20 ft of the source, tonal data above 250 Hz would have an accuracy of k1 to 2 dB, but would become progressively less accurate as distance increased. One should expect that at high frequencies, the air absorption and wall absorption would combine to minimize interference, as was found with white noise. Unfortunately, in the time available we could not acquire reliable tonal data above 4 kHz because of the non-compactness of the dodecahedron, its orientation, and the directionality of individual speakers in the enclosure (fig. 46(b)). Rotating the dodecahedron as was done with random noise would not work with tones because the interference patterns changed with source motion. In the future, higher-frequency tonal data could be acquired if a sufficiently compact and omnidirectional source were available.
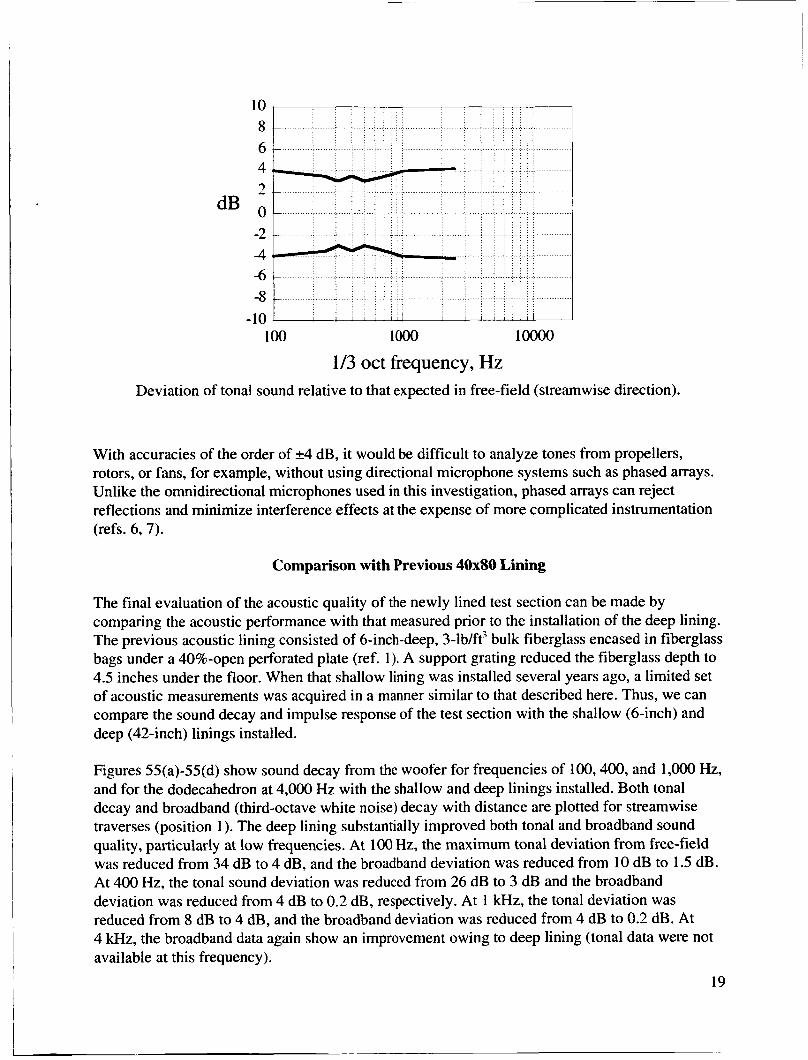
The following graph represents a summary of tonal deviation from free-field measured streamwise over the turntable.
18
10 8 6 4 2
dB 0 -2 4 -6 -8
-10 100 lo00 loo00
1/3 oct frequency, Hz Deviation of tonal sound relative to that expected in free-field (streamwise direction).
With accuracies of the order of k4 dB, it would be difficult to analyze tones from propellers, rotors, or fans, for example, without using directional microphone systems such as phased arrays. Unlike the omnidirectional microphones used in this investigation, phased arrays can reject reflections and minimize interference effects at the expense of more complicated instrumentation (refs. 6,7).
Comparison with Previous 40x80 Lining
The final evaluation of the acoustic quality of the newly lined test section can be made by comparing the acoustic performance with that measured prior to the installation of the deep lining. The previous acoustic lining consisted of 6-inch-deep, 3-lb/ft3 bulk fiberglass encased in fiberglass bags under a 40%-open perforated plate (ref. 1). A support grating reduced the fiberglass depth to 4.5 inches under the floor. When that shallow lining was installed several years ago, a limited set of acoustic measurements was acquired in a manner similar to that described here. Thus, we can compare the sound decay and impulse response of the test section with the shallow (6-inch) and deep (42-inch) linings installed.
Figures 55(a)-55(d) show sound decay from the woofer for frequencies of 100,400, and 1,OOO Hz, and for the dodecahedron at 4,000 Hz with the shallow and deep linings installed. Both tonal decay and broadband (third-octave white noise) decay with distance are plotted for streamwise traverses (position 1 ). The deep lining substantially improved both tonal and broadband sound quality, particularly at low frequencies. At 100 Hz, the maximum tonal deviation from free-field was reduced from 34 dB to 4 dB, and the broadband deviation was reduced from 10 dB to 1.5 dB. At 400 Hz, the tonal sound deviation was reduced from 26 dB to 3 dB and the broadband deviation was reduced from 4 dB to 0.2 dB, respectively. At 1 kHz, the tonal deviation was reduced from 8 dB to 4 dB, and the broadband deviation was reduced from 4 dB to 0.2 dB. At 4 kHz, the broadband data again show an improvement owing to deep lining (tonal data were not available at this frequency).
19

Reflections of sound pulses are also weaker with the deep lining installed in the test section. Figures 56(a) and 56(b) show reflections from low-frequency cannon shots. The deep lining data in figure 56(a) are actually a duplicate of those in figure 20(a), which shows a cannon time trace from microphone I upstream of the cannon on the turntable (setup 2). The shallow lining data in figure 56(b) were recorded with the cannon 37 ft from the microphone; the data were adjusted so that the direct pulse amplitudes in each figure are equal. The data show a substantial reduction in reflection strength by the deep lining. The shallow lining reflection amplitudes were about 20% of the direct pulse. The deep-lining reflection amplitudes were about 6% of the direct pulse. Thus, for this source and distances, the shallow-lining reflections were about 14 dB below the direct pulse, and the deep-lining reflections were about 24 dB down.
Sound Absorption with Wind
Airflow over a sound-absorbent lining can affect the impedance and sound absorption, particularly if the lining is reactive (ref. 14). Although we were unable to study wind effects on the deep lining, an unpublished study by the authors of the prior 6-inch 40 x 80 lining is summarized in figure 57. Reflections of sound from a starter pistol in the test section are shown for airspeeds of 0 and 100 knots. The pistol and microphone were 15 ft above the floor and separated 25 ft cross- stream. Wind over the microphone caused some signal unsteadiness, but very little change in the reflection amplitudes can be seen. There was a slight time shift of the reflections with wind because of the change in propagation speed by wave convection. But, wind at 100 knots had no effect on the sound absorption of the 6-inch lining. Presumably, the same is true of the deep lining.
We also recorded starter pistol shots in the same direction with the deep lining installed, wind-off as shown in figure 58. The reflections were much weaker than those acquired with the 6-inch lining.
CONCLUDING REMARKS
Installation of a recessed 42-inch-deep acoustic lining in the 40 x 80 test section has greatly improved the acoustic quality of the facility as determined by a detailed acoustic calibration at zero airspeed. We measured individual lining module sound absorption using acoustic-pulse- reflection techniques. Global acoustic quality was determined from sound decay with distance measured from steady noise sources of various types. The results were evaluated by comparisons with ideal free-field conditions and with the acoustic environment existing before installation of the deep lining (i.e., the 6-inch-lining environment).
The low- to mid-frequency sound absorption of the lining (100-2,500 Hz) was very good; 94% or more of the incident sound from acoustic pulse and steady noise sources was absorbed by the walls and deep floor, despite the necessity of sound transmission through the porous surface panel. The ceiling lining was even better, with absorption values of 97% or greater in that frequency range. The use of fiberglass wedges below the porous flow interface gave much better acoustic performance than the fiberglass blanket previously installed on the test-section surfaces. Likewise,
20
improved acoustic performance can be attributed to the increase in face-sheet porosity from the previous 40% to 68% open area, though this was offset to some extent by the attachment of the fine-mesh screen for flow control.
The turntable, because of its shallow depth and numerous structural elements, absorbed only 78% of the acoustic energy below 315 Hz and 95% above 400 Hz. This was anticipated by the design goals, which allowed for lower performance at low frequencies. However, because the turntable occupies the heart of the test section, the most likely areas for acoustic measurements would be affected by turntable reflections at low frequency. Presumably, the turntable would have to be lowered to achieve the acoustic performance found in the rest of the test section. (Model support struts could also pose a problem in that area unless acoustically treated.)
The high-frequency performance of the lining between 4 kHz and 20 kHz was disappointing because it fell below the minimum design goal of 90% absorption. The floor absorbed 85% to 95% of acoustic energy in that frequency range, and the walls absorbed about 80% to 95%. The ceiling was better, at 90% to 95%, though only two ceiling panels were tested. The data indicated that the surface panels were the cause of the lower than expected sound absorption. There was a variation in absorption over individual modules and from module to module that suggested a variation in impedance at the lining surface. In one case, two supposedly identical wall modules, side by side gave substantially different results-ne absorbed well, one poorly. Previous laboratory tests (refs. 3,4) indicated that high-frequency absorption of the lining was controlled by the fine-mesh screen bonded to the perforated face sheet. The screen, which had fine wires packed 200 by 600 wires per inch was chosen for flow control. Without a screen at the panel surface, the flow pumps in and out of the perforated panels and creates a thick boundary layer, high drag, and excess noise. Without the screens, or with clean screens, laboratory panels performed well acoustically. But screens contaminated by fiber particles during the production process had increased flow resistance and decreased sound absorption. We tried superficial cleaning of some of the installed panels during the calibration, but without success. Improvement in the high- frequency absorption of the lining may require more elaborate cleaning or replacement of the fine- mesh screens.
Despite the variability in the lining absorption, global measurements of sound decay from steady noise sources showed that the facility would be very suitable for acoustic studies of jet noise or similar randomly generated sound. The size of the facility, wall absorption, and averaging effects of wideband random noise all tend to minimize interference effects from wall reflections. The decay of white noise with distance was close to free-field above 250 Hz. Hence, jet noise could be acquired accurately above that frequency. At 250 Hz and below, the data would deviate from free- field levels by up to +2 dB at the 100-Hz third-octave band.
However, as a consequence of good and poor surface panels mixed throughout the test section, the measurement of tones in the test section will be much less accurate because of the sensitivity of tones to interference from even weak wall reflections. Tonal sound decay with distance showed oscillations that were related to wall sound absorption. The sound decay curves were overlaid on a family of curves representing the theoretical deviation predicted for various wall-absorption values. Atmospheric absorption was included. The data tended to match expected limits for the wall-absorption values measured by the pulse-reflection techniques. Within 10 to 15 ft from the
21
noise source the data were generally within +1 dB of free-field levels, because the ratio of direct- to-reflected sound level was high for a noise source 12 to 13 ft above the floor. Beyond that distance from the source, wall effects control the decay rates and the measured tones deviated from free-field by +3 dB to +5 dB between 100 and 4,000 Hz. The above values are approximate and can be slightly higher or lower depending on distance and location of the acoustic survey. We were unable to obtain tonal data above 4 kHz.
The high-frequency broadband data indicated that above 10 kHz, air absorption begins to
anechoic environment. , dominate the sound field, reflected sound becomes weaker, and the test section approaches an
Directional microphone systems could improve the apparent acoustic quality of the test section. The data reported here were obtained with omnidirectional microphones. Phased microphone arrays, for example, can reject wall reflections to a great extent and minimize interference effects at the expense of instrumentation complexity.
22
APPENDIX
IDEAL WALL INTERFERENCE AND SOUND DECAY
Interference between direct and reflected waves in a room will cause the decay of sound with distance from a noise source to deviate from the free-field decay curve. That is, the waves will add constructively and destructively, depending on relative phase. We assume that weakly correlated (broadband, random) waves add on an energy basis, and strongly correlated waves (tones) add on an amplitude basis. The maximum envelope of the deviation can be predicted using theoretical and empirical models for the source, reflection paths, wall absorption and air absorption. In a room, the numerous reflection paths can make this computation tedious. However, the size of the 40 x 80 test section and the semi-anechoic environment allow the simplifying assumption that only single reflection paths need be considered; multiple reflections are neglected. To further simplify the task, we assumed that, to first order, all walls have the same sound absorption, and that the absorption is independent of acoustic incident angle. Computations are made for zero wind. We assumed that white-noise reflections from floor, ceiling, and sidewalls would interfere constructively with the direct sound on an energy basis. But for tones, it seemed likely that only the floor and ceiling reflections could combine perfectly in- or out-of-phase simultaneously with direct sound to define the interference envelope. It seemed unlikely that tonal wall reflections, which are weak compared with ceiling and floor reflections because of distance, would contribute significantly to the interference envelope, and could therefore be ignored.
Tonal Sound Interference
Consider floor and ceiling tonal interference with direct sound:
23
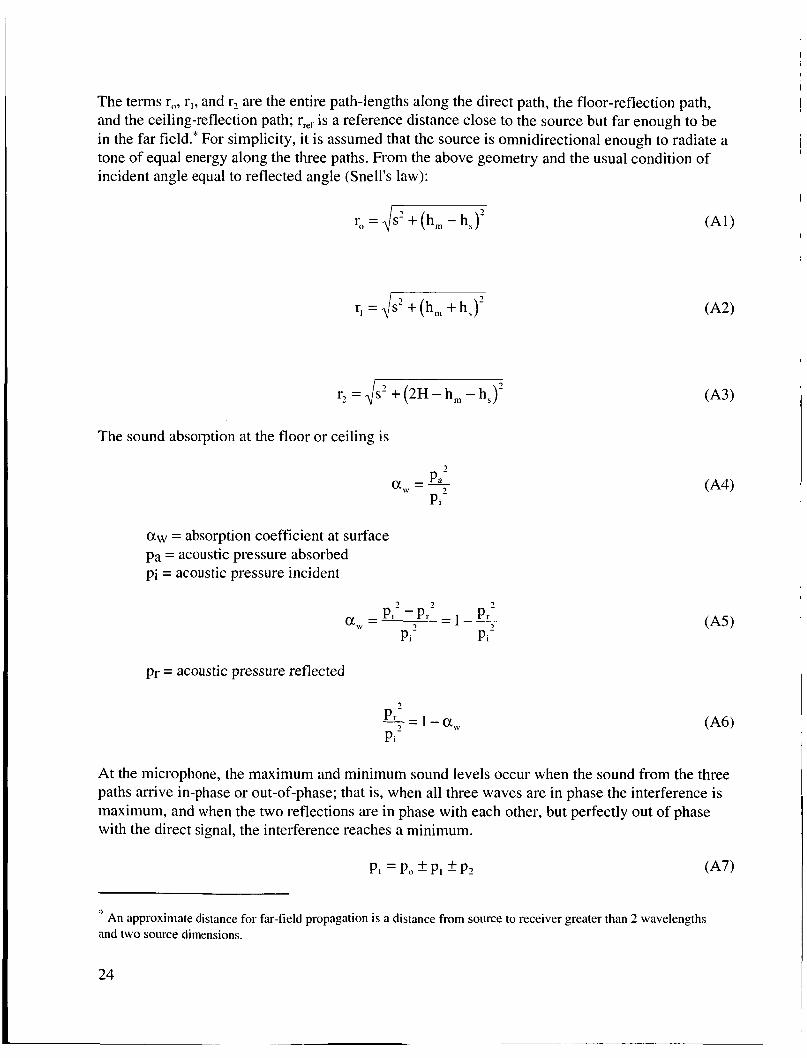
The terms ro, r,, and r2 are the entire path-lengths along the direct path, the floor-reflection path, and the ceiling-reflection path; rref is a reference distance close to the source but far enough to be in the far field.“ For simplicity, it is assumed that the source is omnidirectional enough to radiate a tone of equal energy along the three paths. From the above geometry and the usual condition of incident angle equal to reflected angle (Snell’s law):
r, = ,/- (AI)
r, = 4s’ + (h, + hS)’
r2 = ,/s2 + (2H - h,, - hS)?
The sound absorption at the floor or ceiling is
a w = absorption coefficient at surface Pa = acoustic pressure absorbed pi = acoustic pressure incident
pr = acoustic pressure reflected
-“;=l-a, P 2 Pi-
At the microphone, the maximum and minimum sound levels occur when the sound from the three paths arrive in-phase or out-of-phase; that is, when all three waves are in phase the interference is maximum, and when the two reflections are in phase with each other, but perfectly out of phase with the direct signal, the interference reaches a minimum.
p, = Po f PI f P2 (A7)
’’. An approximate distance for far-field propagation is a distance from source to receiver greater than 2 wavelengths and two source dimensions.
24

p, = total acoustic pressure, peak po = direct acoustic pressure from sound arriving along path r,, peak p, = reflected acoustic pressure from sound arriving along path rr, peak p, = reflected acoustic pressure from sound arriving along path r2, peak
The attenuation from air absorption along the direct path is
AdB, = -airro
= 20 l o g 7 Po Po
aair = air absorption, dB/(unit distance) p; = direct acoustic pressure at microphone in a lossless atmosphere, peak
From equations (A8) and (A9)
a,,r, 120 Po = p:, 10-
Similarly
Consider acoustic pressure decrease owing to wave spreading in the far-field and air absorption:
where pLf and pwf are the lossless and measured acoustic pressures at the arbitrary distance rwr from the source.
The acoustic pressure arriving along the reflection paths is further reduced by the wall absorption (eq. (A6)).
25
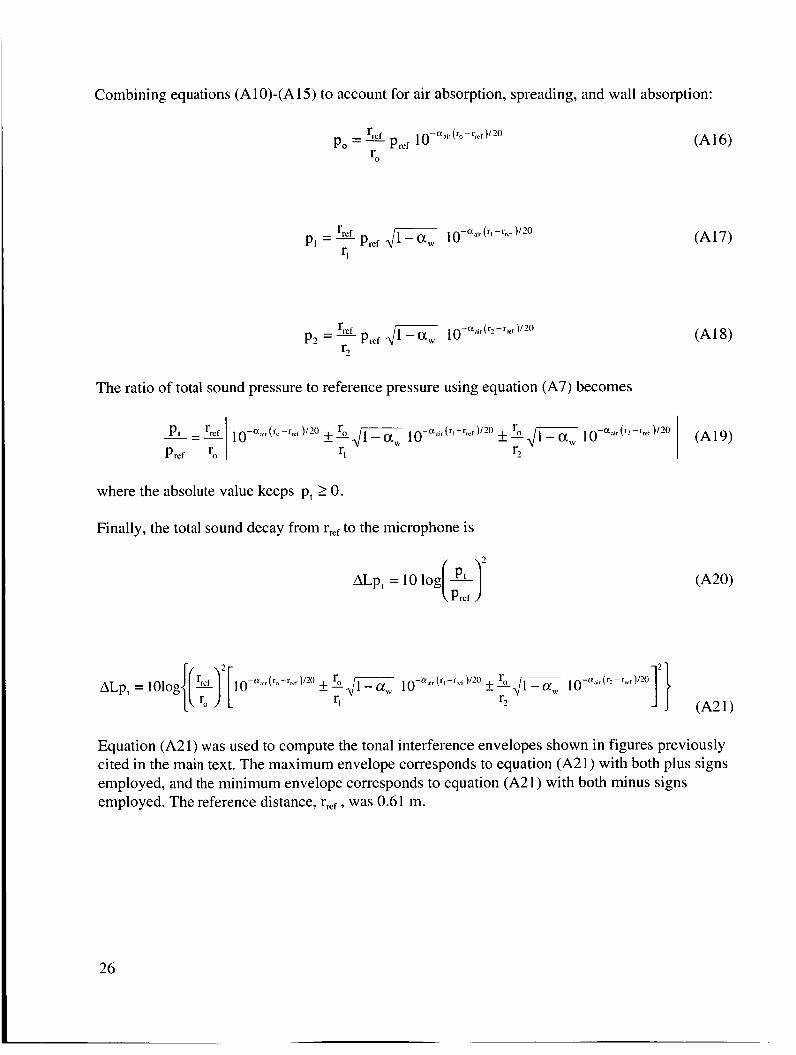
Combining equations (Al0)-(A 15) to account for air absorption, spreading, and wall absorption:
(A 16) air (ro -rref r .
r0 Po = prer 10-
where the absolute value keeps p, 2 0.
Finally, the total sound decay from rref to the microphone is
Equation (A21) was used to compute the tonal interference envelopes shown in figures previously cited in the main text. The maximum envelope corresponds to equation (A21) with both plus signs employed, and the minimum envelope corresponds to equation (A21) with both minus signs employed. The reference distance, rrer, was 0.61 m.
26
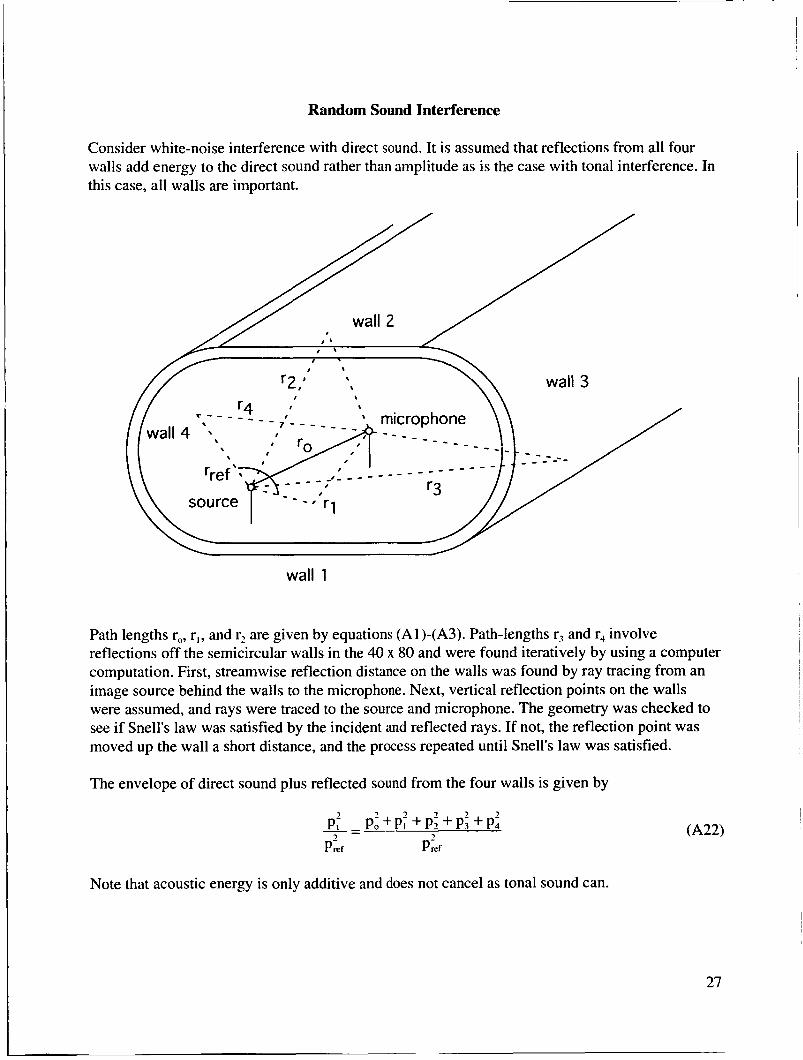
Random Sound Interference
Consider white-noise interference with direct sound. It is assumed that reflections from all four walls add energy to the direct sound rather than amplitude as is the case with tonal interference. In this case, all walls are important.
wall 1
Path lengths r,, r,, and rz are given by equations (Al)-(A3). Path-lengths r, and r, involve reflections off the semicircular walls in the 40 x 80 and were found iteratively by using a computer computation. First, streamwise reflection distance on the walls was found by ray tracing from an image source behind the walls to the microphone. Next, vertical reflection points on the walls were assumed, and rays were traced to the source and microphone. The geometry was checked to see if Snell's law was satisfied by the incident and reflected rays. If not, the reflection point was moved up the wall a short distance, and the process repeated until Snell's law was satisfied.
The envelope of direct sound plus reflected sound from the four walls is given by
Note that acoustic energy is only additive and does not cancel as tonal sound can.
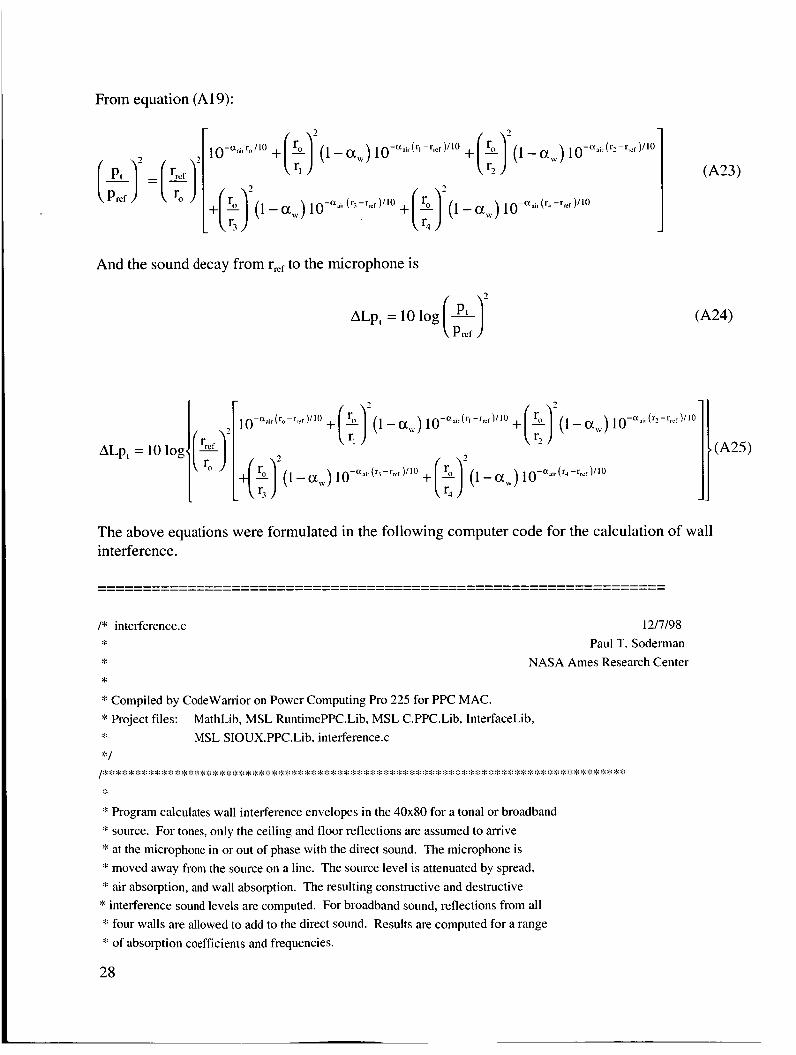
From equation (A 19):
And the sound decay from rref to the microphone is
z
The above equations were formulated in the following computer code for the calculation of wall interference.
P interference.c i:
i:
12/7/98
Paul T. Soderman NASA Ames Research Center
'p Compiled by CodeWamor on Power Computing Pro 225 for PPC MAC. '% Project files: I: MSL SIOUX.PPC.Lib, interference.c :i: /
MathLib, MSL RuntimePPC.Lib, MSL C.PPC.Lib, InterfaceLib,
'i: Program calculates wall interference envelopes in the 40x80 for a tonal or broadband :!: source. For tones, only the ceiling and floor reflections are assumed to arrive ':' at the microphone in or out of phase with the direct sound. The microphone is '% moved away from the source on a line. The source level is attenuated by spread, :% air absorption, and wall absorption. The resulting constructive and destructive
'* interference sound levels are computed. For broadband sound, reflections from all 'i: four walls are allowed to add to the direct sound. Results are computed for a range :i: of absorption coefficients and frequencies.
28
* This code is commented to be IS0 9OOO compliant. The author does not guarantee * accuracy of results nor that the code will operate under all conditions.
** * *** *** *** *:g** ** * * * * ** *Q * * * * *:I:* * * * * *** **:ic * *:gt:g * * ***:I:** * 81: * * * * * ** ** * *:g * * * ** * * ** */ *
#define Sioux 1 #define Debug 0 #include cstdi0.b #include a t d 1 i b . b #include <math.b #include cstring.b #include ctime.h> #if Sioux
#endif #include csioux.h>
#define NFREQ #define NALPHA #define NAMEMAX #define PI #define START #define NSTEPS #define EAST #define WEST #define RADIAN #define WTHT #define ADJUST
struct geom ( double xsource; double ysource; double zsource; double xmic; double ymic; double zmic; double theta; double phi;
33 8 30 3.14159 1 .o 61 -20 20 57.296 39 10
double directpath; double floorpath; double ceilingpath; double portpath; double starpath;
1;
/* enable Code Warrior /* enable printf statements
/* number of frequencies /* number of wall absorpt coeffs. /* longest file name /* pi /* start of decay distance from source /* number of feet (pts) along traverse /:$ distance from center to east focus /" distance from center to west focus /" degrees per radian - conversion l" wind tunnel height l" sound level offset for better plots
/* source coordinates (origin is test sec. center) /* x is upstream, y is up, z to starboard
/* mic coordinates, they change along traverse
/* propagation direction angles from source to mic /* relative to local x', and z' axes
propagation assumed to occur in horiz. plane I s path: source to mic /* path: source to floor to mic /* path: source to ceiling to mic l" path: source to port wall to mic l" path: source to starboard wall to mic
*/
*/
:I:/
:g/
double alpha-calc( double, double , double , double );
29

, double[], double, double, double, stnict geom, double[] ); int Tone( double3::!::%, double:!~:k:I:
int int makeFile( double[], double:^"^^:, int subFiles( char[], double[], double*:I::':,
double[] ); double read-pressure( double ); stnict geom geometry( stnict geom ); double calcFloor( struct geom ); double calcCeiling( struct geom ); double calcWall( struct geom, int ); struct geom micCoordinates( stnict geom, double ); void void skip-line( void );
White( doiible'I':F:I', double[], double, double, double, stnict geom, double[] ); double:B:F:F, double, double, double, stnict geom, double[] );
'.++, double::"+':, double, double, double, stnict geom,
freeMemory( double :X :I: :I:, double :I: :I: :I:, double:Iz 1: :I: );
main()
( char menu( char ),
double temp, /::' air temperature i = '1'. /'I' menu number
re1 hum, 1::: relative humidity p a = 14.7, '31:dbTonePlus, *::dbToneMinus, *:::dbWhite, alpha[NFREQ] = (01, wallAbsorb[NALPHA] = (0,0.5,0.75,0.8,0.85,0.9,0.95,1 . O ] ;
/ static pressure, psi /::: tonal sound with interference 1::: tonal sound with interference /::: white noise with interference /* array of test day absorption coeffs
/ wall absorption coeffs. stnict geom setup; static double freq[] = (25,31,40,50,63,80,100,125,160,200,250,315,400,500,630,800,
1ooO,1250,1600,2ooO,2500,3150,4ooO,5ooO,6300,8ooO,1oooO,12500, 16000,2oooO,25000,3 1500,4oooO);
Pi: 113 oct freqs :::I #if Sioux
SIOUXSettings.autocloseonquit = 1 ; SIOUXSettings.asktosaveonclose = 0;
/ Code Warrior - exit program after it runs I::: don't ask to save console window on quit
#endif
30
while ( 1 )
( i = menu( i );
switch ( i )
{ case '1':
piintf("\t%s\n\n","Input air temperature, OF");

scanf("%lf', &temp);
printf("\t%ss\nh","Input relative humidity, % ");
scanf("%lf', &relhum);
skip-line();
pa = read-pressure( pa );
setup = geometry( setup );
if( !Tone( &dbTonePlus, &dbToneMinus, freq, temp, relhum, pa, setup, wallAbsorb ))
printf( "error in Tone moduleh" );
if( !White( &dbWhite, freq, temp, relhum, pa, setup, wallAbsorb )) printf( "error in White moduleh" );
break;
case '2':
makeFile( freq, &dbTonePlus, &dbToneMinus, &dbWhite, temp, relhum, pa, setup, wallAbsorb );
freeMemory( &dbTonePlus, &dbToneMinus, &dbWhite );
break;
case '3':
exit ( I ) ;
break;
char menu ( char ch )
{ printf("\nh%sh","NASA Ames Research Center Paul Soderman");
31
printf("%s \n","40x80 Acoustic Interference");
printf("%s \n \n","Enter One Selection 1 - 3");
printf("\t %s \n"," 1 - Input conditions and compute interference");
printf("\t %s \n","2 - Create output file");
printf("\t %s \n","3 - Exit program");
ch = getchar();
fflush(stdin);
return ch; 1
'k void alpha-calc() computes air absorption in dB/m based on ANSI S 1.26- 1995: 'I: Method for Calculation of the Absorption of Sound by the Atmosphere.
double alpha-calc( double freak, double tair, double rh, double pa )
I #define E 2.7 I828 18 / base of natural log #define TO1 273.16 1::: triple point isotherm temperature #define Tref 293.15 /::: reference temp., O K (20" C) #define Pref 101.325 /+ reference pressure, kPa double alfa, absorption coefficient dB/m factorl, / temp parameter factor2, P temp parameter factor3, 1::: temp parameter fro, fm, ha, I::' absolute humidity ifreq, I* frequency parameter param 1, /::: temp parameter param?, 1::: temp parameter param3, /:; temp parameter pratio 1, pratio2, paskal, /::: air pressure, N/mA2 pratio, p a t , tkel, /::: air temperature, O K
/::: vibrational relaxation frequency of oxygen / vibrational relaxation frequency of nitrogen
/::: ratio of partial psat to Pref I::: ratio of air pressure to Pref
/::: Shields and Bass parameter /" partial pressure of saturated water vapor
32
t l , tratio, vexponent; tkel = (tair - 32)/1.8 + TO1; paskal = pa * 6.894757;
/* temporary parameter /* ratio of ref to air temperature P parameter for psat calc P absolute atmo temperature, OK /* atmo pressure in kPa
tratio = Tref/tkel:
paraml = 10.79586 * (1 - TOlItkel) - 5.02808 * loglo( tkellTOl );
param2 = 1 SO474 * pow( 10.,-4. ) * ( 1 - pow( 10.,-8.29692*(tkellTOI )- 1 ));
param3 = 0.42873 * pow( lo.,-3. ) * (-1 + pow( 10.,4.76955*( l-(TOl/tkel))))-2.2195983;
vexponent = param 1 + param2 + param3;
psat = Pref * pow( lO.,vexponent );
pratiol = psat/Pref;
pratio2 = paskaYhef;
ha = rh * pratio 1/ pratio2;
fro = pratio2 * (24. + 4.404 * pow( 10.,4.) * ha * ((.02 + ha)/(.391 + ha)));
tl = pow( tratio,1./3. ) - 1.;
fm = pratio2 * pow( tratio,O.5 ) ::: ( 9. + 280. * ha pow( E,( -4.17 '% t 1 )));
factorl = 1.84 * pow( IO.,-1 1. ) * pow( tratio,-0.5 ) / pratio2;
factor2 = 0.01275 :% pow( E,-2239.l/tkel )';fro/(pow( fr0,2. )+ pow( freak2 ));
factor3 = 0.1068 * pow( E,-3352/tkel )*fm/(pow( fm,2. ) + pow( freak.2. ));
alfa = 8.686 * pow( freak,2. )*( factorl + pow( tratio5.R. )*( factor2 + factor3 ));
return alfa; I
* ** * *:g * * * * Tone() computes sound decay and interference of a point source tone along rx a radial line from a source. Free field spread, atmospheric absorption, and
interference from ceiling and wall reflections are inch I ::c **: * * ***:I: ::: *:g * *** *** * :i: *:c:g * :g** * * *:% :x* * * * 2: * * * * * :g * . ***:%:%*****:***********:%*
int Tone( double '"*"''dbTonePlus, double "::":':dbToneMiniis, double freq[], double tair, double rh, double press, stnict geom g l , double wallAlpha[] )
int i,j,k; long int m = -1;
double dirPath, distance, ratio0, ratio 1, ratio2, absorp0, absorp 1, absorp2, hz, floorBounce, ceilingBounce, pressplus, pressMinus, traverse;
char paws[5];
printf( "compute tonal decay\n" );
if( ('%dbTonePlus = malloc( NFREQ'i:NSTEPS'::sizeof(double:k))) == NULL )
( printf( "out of '"dbTonePlus memory\n" ); return 0;
1
if( ("'dbToneMinus = (double$:"") malloc( NFREQ'i'NSTEPS'''sizeof(double'::))) == NULL )
{ printf( "out of 'kdbToneMinus memory\n" ); return 0;
1
for( i = 0; i < NSTEPS; i++ ) (
for( J = 0; J < NFREQ; j++ ) (
m++;
if( ((:~:dbTonePlus)[m] = (double"') malloc(NALPHA*sizeof(double))) == NULL )
printf( "m = %Id, out of ('~dbTonePlus)[m] memory\n",m ); return 0;
34

if( ((:zdbToneMinus)[ni] = (double#:) malloc(NALPHA*sizeof(double))) == NULL )
( printf( "m = %Id, out of (*dbToneMinus)[m] memory\n",m ); return 0; .
I 1
I
distance = START: /* start here and move out in 1 foot steps */
for( i = 0 i < NSTEPS; i++ )
[ traverse = ++distance;
g 1 = micCoordinates( g 1 ,traverse );
dirPath = g 1 .directpath;
floorBounce = calcFloor( gl );
ceilingBounce = calcCeiling( g 1 );
r a t id = START / dirPath:
ratio 1 = dirPath / floorBounce;
ratio2 = dirPath / ceilingBounce;
fo r ( j=OjcNFREQ; j++)
( m++:
absorp0 = -alpha-calc( hz,tair,rh,press ) (dirPath-START) * 0.3048 / 20.;
absorpl = absorpO :k (floorBounce-START) / (dirPath-START);
absorp2 = absorpO * (ceilingBounce-START) / (dirPath-START);
#if Debug if( i == NSTEPS-I && j == 26 )
35
{ printf( "hz,tair,rh,press,dirPath,floorBounce = %f %f %f %f %f %fin",
hz,tair,rh,press,dirPath,floorBounce );
printf( "absorp 1 ,ratio 1 ,wallAlpha[O],absorp2,ratio2 = %f%f%f%f%fin", absorp 1 ,ratio 1 ,wallAlpha[O],absorp2,ratio2 );
/ gets( paws ); :b/
1 #endif
for( k = 0; k < NALPHA; k++ )
pressPlus = pow( IO.,absorp0 ) + pow( lO.,absorpl) :I: ratio1 :K sqrt( 1 - wallAlpha[k]); {
pressPlus += pow( lO.,absorp' ) :$ ratio2 :i: sqrt( 1 - wallAlpha[k]);
pressPlus :I:= ratio0;
pressMinus = pow( IO.,absorpO ) - pow( lO.,absorpl) :i: ratio1 :j: sqrt( 1 - wallAlpha[k]);
pressMinus -= pow( IO.,absorp2 ) ratio7 - sqrt( 1 - wallAlpha[k] );
pressMinus :I:= ratio0;
pressMinus = pressMinus < 0 ? le-6:pressMinus; / keep pressMinus slightly pos. 'I:/
(*dbTonePlus)[m][k] = IO. :$ log 10( pressplus 'I' pressPlus ) + ADJUST;
('"dbToneMinus)[m][k] = IO. :I: log IO( pressMinus ':: pressMinus ) + ADJUST;
#if Debug if( j == 16 && k = = O )
{ printf( "i = %d\n",i ); printf( "hz = %fin", hz ); printf( "dirPath = %fin",dirPath ); printf( "i,j,k,m,pressPlus,pressMinus = %d %d %d %d %f %fin",
i,j,k,m,pressPlus,pressMinus ); printf( "(:~'dbTonePlus)[m][k],(:~~dbToneMinus)[m][k] = %f %fin",
( :i:dbTonePlus)[m] [k],( :':dbToneMinus)[m][k] );
/* gets( paws ); "/
I #endif
I 1
36
#if Debug if( i == NSTEPS-1 )
( printf( "m = %Id\n",m ); printf( "dbTonePlus start = %f\n",( *dbTonePlus)[O][O] ); printf( "dbTonePlus end = %f\n",(:~dbTonePlus)[m][NALPHA- I ] ); printf( "dbToneMinus start = %b",( *dbToneMinus)[O] [O] ); printf( "dbToneMinus end = %f\n",(*dbToneMinus)[m][NALPHA-I] ); gets( paws );
1 #endif
I return 1;
1
**::E* * * ::E ** * * * : 1 * White() computes sound de :: source along a radial line from a source. Free field spread, atmospheric absorption, :% and interference from ceiling, floor, and wall reflections are included.
:g *** * **** * ** **** *::E * * **:I: * * ** * * * * * 8 * * * * * * * * 8 8 4: **I ****::g 4:
int White( double ***dbWhite, double freq[], double tair, double rh, double pa, struct geom g l , double wallAlpha[])
{ int i,j,k; long int m = -1;
double dirPath, distance, absorp0, absorp 1, absorp2, absorp3, absorp4, dbpsd, ceilingBounce, floorBounce, east WallBounce, westWallBounce, hz, presssq, ratid), ratio1 , ratio2, ratio3, ra t id , traverse;
37

char paws[5];
printf( "compute white noise decay\n" );
if( ("'dbWhite = (doiible'"''')rnalloc( NFREQ"'NSTEPS:':sizeof(double:::))) == NULL )
{ printf( "out of "dbWhite memoiy\n" ); return 0;
I
for( i = 0; i < NSTEPS; i++ )
for( j = 0; j < NFREQ; j++ ) (
m++:
if( ((:':dbWhite)[m] = (double''')malloc(NALPHA'i%izeof(double))) == NULL )
{ printf( "m = %Id, out of ('"dbWhite)[m] memory\n",m ); return 0;
I 1
1
m = -1;
distance = START;
for( i = 0; i < NSTEPS; i++ )
( traverse = ++distance;
g 1 = micCoordinates( g 1 ,traverse );
dirPath = g 1 .directpath;
floorBounce = calcFloor( g I );
ceilingBounce = calcCeiling( g l );
eastWallBounce = calcWall( g1,EAST );
westWallBounce = calcWall( g1,WEST );
ratio0 = START / dirPath;
38
/ :z start here and move out in 1 foot steps "'/
ratio1 = dirPath / floorBounce;
ratio2 = dirPath I ceilingBounce;
ratio3 = dirPath / eastWallBounce:
ratio4 = dirPath / westWallBounce;
for( j = 0 j < NFXEQ; j++ )
m++;
hz = freqti];
absorpO = -alpha-calc( hz,tair,rh,pa ) * (dirPath-START) * 0.3048 / 10.;
absorpl = absorpO * (floorBounce-START) / (dirPath-START);
absorp2 = absorpO * (ceilingBounce-START) I (dirPath-START);
absorp3 = absorpO * (eastWallBounce-START) / (dirPath-START);
absorp4 = absorpO * (westWallBounce-START) / (dirPath-START);
#if Debug if( i == NSTEPS-1 && j == 26 )
( printf( "hz,tair,rh,pa,dirPath,floorBounce = %f %f %f %f %f %h",
hz,tair,rh,pa,dirPath,floorBounce ); printf( "ceilingBounce,westWallBounce,eastWallBounce = %f %f %h",
ceilingBounce,westWallBounce,eastWallBounce ); printf( "absorpO,absorp1 ,absorp2,absorp3,absorp4 = %f %f %f %f %fin",
absorp0,absorp 1 ,absorp2,absorp3,absorp4 ); printf( "ratioO,ratiol ,ratio2,ratio3,rati04,wallAlpha[ I ] = %f %f %f %f %f %h",
ratio0,ratio 1 ,ratio2,ratio3,ratid4,wallAlpha[ 11 );
gets( paws );
1 #endif
for( k = 0; k < NALPHA; k++ )
( presssq = pow( IO.,absorp0) +pow( IO.,absorpl) ':' ratio1 '% ratio1 '% ( 1 - wallAlpha[k]);
pressSq += pow( IO.,absorp2) * ratio2 * ratio2 * ( 1 - wallAlpha[k]);
39
presssq += pow( IO.,absorp4) ::: ratio4 'x ratio4 :i: ( 1 - wallAlpha[k]);
#if Debug if( i == 0 && j == 26 && k == NALPHA-I ) printf( "i,j,k,m,hz,pressSq = %d %d %d %Id %f %f\n",i,j,k,m,hz,pressSq ); if( i == NSTEPS-I && j == 26 && k == NALPHA-1) printf( "i,j,k,m,hz,pressSq = %d %d %d %Id %f %f\n",i,j,k,m,hz,pressSq ); #endif ('i'dbWhite)[m][k] = IO. * loglO( presssq ) + ADJUST;
#if Debug if( i == 0 )
( printf( "m = 26,i,k,("'dbWhite)[m][NALPHA-I] = %d %d %fin",
gets( paws );
if( i == NSTEPS-1 )
printf( "m=2006,i,k,('i'dbWhite)[m][NALPHA-I] = %d %d %!In",
gets( paws );
i,k,("dbWhite)[26][NALPHA- I] 1;
I
{
i,k,( ';:dbWhi te)[ 20061 [ N ALPH A- 1 ] );
I #endif
I return I ;
1
double read-pressure( double pa ) {
char dummy[5];
piintf("\t%s%f%s\n", "Test day pressure is assumed to be ",pa," psi");
printf("\t%s\n", "Do you want to change this ? y/n ");
40

gets( dummy );
if( !stmcmp( dummy,"Y",l ) 11 !stmcmp( dummy,"y",l ))
printf("\t %s h"," Input pressure, psi "); (
scanf( "%If", &pa );
skip-line(); 1 return pa;
1
. . . . . . . . . . . . . . . . . . . . . . . . . . . . . . . . . . . * Function geometry0 accepts source and microphone locations from keyboard.
** * * * * * * * ** ** *** * *
*
struct geom geometry( struct geom g 1 )
( char dummy[20],
"ptr = dummy;
pnntf( "test section center (above turntable center) is origin:\n" );
printf( "x is upstream, y is up, z is starboard\nh" );
pnntf( "mic is at same height as sourceh" );
printf( "input source location x, f th" );
printf( "RETURN defaults to zem valueh" );
gets( dummy );
gl .xsource = atof( ptr );
printf( "input source location y, fth" );
gets( dummy );
g 1 .ysource = atof( ptr );
g 1 .ymic = g 1 .ysource;
printf( "input source location z, fth" );
41
gets( dummy );
g 1 .zsource = atof( ptr );
printf( "propagation direction angles\n" );
printf( "input theta relative to x' axis at source, deg.\n" );
printf( "positive theta is to left looking upstream\n" );
printf ( "it is assumed that the mic. moves in the horizontal y plane\n" );
gets( dummy );
g 1 .theta = atof( ptr 1;
gl.phi = 90. + gl.theta;
ski p-1 i ne();
return g 1 ;
I
I Function micCoordinates() calculates coordinates of microphone based on source location, ation direction, and distance to mic - all passed.
I struct geom rnicCoordinates( stnict geom 82, double move )
( double dist;
dist = sqrt( move:::move + (g3.ymic-g2.ysource):~~(g2.ymic-g2.ysource));
g3.xmic = dist :i: cos( g2thetalRADIAN ) + g2.xsource;
g2.zmic = dist * cos( g2.phiIRADIAN ) + g3.zsource;
g2.directPath = dist;
return g3; 1
I :j: Function calcFloor() calculates distances and times from source to receiver by
I
42

double calcFloorf struct geom s3 )
double Xm = s3.xmic, Ym = s3.ymic, Zm = s3.zmic;
double Xs = s3.xsource, Ys = s3.ysource, Zs = s3.zsource;
double yIf;
yIf = -WTHT - Ys; /* image source */
s3.floorPath = q r t ( (Xm-Xs)';( Xrn-Xs) + (Yrn-yIf)*( Ym-yIf) + (Zm-Zs)*(Zm-Zs) );
return s3.floorPath; I
***:e **** / * Function calcCciling() calculatcs distancc and timc from source to receiver by
I .*** **I* * * *:g* * * *** * * * *:x** * ** * * * * * * * * double calcCeiling( struct georn s4 )
double Xm = s4.xrnic. Yrn = s4.ymic, Zm = s4.zmic;
double Xs = s4.xsource, Ys = s4.ysource, Zs = s4.zsource;
double yIc;
YIC = WTHT - Ys; /" image source */
s4.ceilingPath = qrt( (Xm-Xs)*(Xrn-Xs) + (Ym-yIc)*(Ym-yIc) + (Zm-Zs)*(Zrn-Zs) );
return s4.ceilingPath; 1
*** * * ** * **** * :z* * 1 :z Function calcWall() calculates distance from source to receiver by iterating up or :% down 40 x 80 port or starboard wall and making incident and reflected rays nearly equal. :i: Code calculates and compares angles TI (angle between source and wall normal) and ' 8 T2 (angle between mic. and wall normal). Iteration drives difference toward zero. '1: Distance from source to wall to mic. is returned. * wall = 20 is starboard, wall = -20 is port wall.
. * * * *::: * * * * * * * ** *:z *. ****.:
43
/ p loop counter /I: wall radius
double calcWall( struct geom s5, int wall )
( #define MLOOP 130 #define Radius 19.5 double Xm, Ym, Zm; double Xs, Ys, Zs; double Yw[MLOOP+l] = (0); double Yi[MLOOP+l] = (0); /+ for last i+l element double Zw[MLOOP+l] = (0); / subscript w: wall target double Zi[MLOOP+l] = (0); double sourceMicSlope; /": line slope: source to mic. double intercept; I* line intercept: source to mic. double Ywall; / Y value of above line at wall double Yisource; Yi value of source double Yimic; /:% Yi value of mic. double TI, T2; /:< source or mic. double angdif[MLOOP+l] = (0); double dx 1, dx2; double beta, aa, bb, cc, dd, ab, cee, cd, dad; double step; / iteration step size char paws[5];
/ one extra array element as buffer
/I: subscript i: wall tangent normal to
/ diff. between incid. and ref. angles
int i, movedir = 1 ; / move direction: 1: down, -1: up
static int count = 0;
:z/ */
q:/
Yw[O] = 19; Xm = s5.xmic; Ym = s5.ymic; Zm = s5.zmic; Xs = s5.xsource; Ys = s5.ysource; Zs = s5.zsource;
/ starting wall coordinate mic. coordinates
:I:/ source coordinates
for( i = 0; i < MLOOP; i++ ) {
if( fabs(Ym - Ys) < 0.05 && fabs(Zm - Zs) < 0.05 )
(
if( wall == 20 )
(
source and mic. on :I:/
:I:/ Pi: streamline ...
/I: ray to and from refl.pt 1::: must pass through focus
:!:I
"/
:I:/ beta = atan( Ys / (Zs - wall )); / starboard wall
if( fabs(Ys) < 0.05 ) /I: source at mid height "I
bb = Radius + wall - Zs:
44
1 else
(
1 bb = Radius - Ys / sin( beta ); / source not at mid height
1
(
else /* port wall
beta = PI + atan( Ys/( Zs - wall ));
/* source at mid height if( fabs( Y s) c 0.05 )
(
1 else
(
1
bb = Radius - wall + Zs;
bb = Radius - Ys / sin( beta ); P source not at mid height
1
*/
4:/
"/
4:/
Yw[i] = bb * sin(beta) + Ys;
Zw[i] = bb * cos(beta) + Zs;
dd = bb;
goto Impend; 1
"/
/* starboard wall :v /" source and mic. not on streamline
Zw[i] = sqrt( Radius*'Radius - Yw[i]*Yw[i]) + wall;
if( wall == -20 ) Zw[i] = -sqrt( Radius*Radius - Yw[i]*Yw[i]) + wall; / port wall */
Zi[ i] = (Y s-Y w [ i] )*Y w [i] *( wall-Zw [ i]) + Zw [i] *pow( (wall-Zw [ i]),2) + Zs *Yw [i] *Yw [i] ;
Zi[i] = Zi[i]/( pow( wall-Zw[i],2) + Yw[i]*Y w[i] ); 1 from eqtn. for tang. line*/
if( (wall-Zw[i]) == 0 ) Zw[i] =wall + .001;
Yi[il = YS - Y~[i]~:(Zi[i]-Zs)/(walLZw[i]);
Yisource = Yi[i];
"/ aa = sqrt((Yi [il -Y s)*( Yi[ i] -Ys)+( Zi[ il-Zs)*( Zi[ i] -Zs)); /" source to tan. line
45
:::/ bb = sqrt((Yw[ i]-Y s)"( Yw [i]-Y s)+(Zw[i]-Z~)'~(Zw[i] -Zs));
ab = aalbb;
I:% source to refl. pt.
cee = sqrt( bb*bb - aa:::aa );
T1 = atan( cee/aa );
Zi [ i] = (Y m- Yw [ i ] ) T w [ i] :::( wall-Zw [ i] ) + Zw [i] ::'pow( (w all-Zw [ i]),2) +Zm'$Y w [ i] :i:Y w [ i] ;
Zi[i] = Zi[i]/(pow(wall-Zw[i],2) + Yw[i]"Yw[i]);
Yi[i] = Y m - Yw[ i] :i:(Zi[i]-Zm)/( wall-Zw [i]);
Yimic = Yi[i];
cc = sqrt( (Yi[i] -Ym):::( Yi [ i]-Ym)+( Zi[ i] -Zm):::(Zi[ i]-Zm));
dd = sqi-t( (Yw [i]-Y m):;( Y w [i]-Y m)+(Zw [i] -Zm):::(Zw [i]-Zm)); /:" mic. to refl. pt. :::I
cd = ccldd;
tan. pt. to refl. pt.
/" angle between incident ray and wall normal
:::I
:% /
2:/ /" from eqtn. for tang. Line
:::/ /:I: mic. to tan. line
cee = sqrt( dd':'dd - cc%c ); /* tan. pt. to refl. pt. j : /
T2 = atan( ceelcc ); I angle between target normal and ray to mic 'I:/
angdifli] = fabs( TI-T2 );
step = angdif[i] 'I' ( MLOOP - i ) / 4;
step = step > 1 ? 1 : step;
soiirceMicSlope = (Ym-Ys) / (Zm-Zs);
intercept = Ys - sourceMicSlope 'I: Zs;
Ywall = sourceMicSlope
if( fabs(Yw[i]-Ywall) < .03 ) {
Yw[i] = Yw[i] - IO;
angdif[i] = IO.;
Zw[i] + intercept;
PI' sourcelmic on same path to wall target P: must move even though angle diff. is 0
I
:I:/
46

if( i > 0 )
{ if( Yisource > Yw[i] && Yimic > Yw[i] )
*/ */
movedir = I ; P if Yi source and mic are both /* above target, move down
else if( Yisource < Yw[i] && Yimic < Yw[i] ) movedir = - 1 ; I* or if Yi source and mic are both *I
/* above target,move up *I
movedir = -movedir; /" if not, change direction "I else if( angdifli] > angdifli-I] ) /* if not, see if angles are converging *I
1 if( movedir > 0 ) (
if( i < 6 ) YH i+l] = 'w[i] - 2.;
else if( i >= 6 && i < 10 )
(
I else
{
I
Yw[i+l] = Yw[i] - 1.;
Yw[i+l] = Yw[i] - step;
1 else
{ if( i < 6 )
Yw[i+l] = Yw[i] + 2.;
else if( i >= 6 && i < IO ) (
1 else {
I
Yw[i+l] = Yw[i] + 1.;
Yw[i+l] = Yw[i] + step;
1
if( Yw[i+l] > (Radius - .005) ) (
Yw[i+l] = Radius - .005; movedir = -movedir;
I
/* move down *I
P move target 2 ft down wall :%I
/* move 1 ft down wall
/* small move down wall
/" move up
1% move target 2 ft up wall
P move 1 ft up wall
I* small move up wall
I at ceilingstop, reverse
*/
:I:/
47

if( Yw[i+l] < -(Radius - .005) )
Yw[i+l] =-Radius + .005; movedir = -movedir;
I
if( Yw[i+l] == 0 ) Yw[i+l] = 0.005;
I at floor:stop, reverse
Pi' at midheight
/ # i f Debug if( count == 40 )
( if( i == 0 11 i % 1 == 0 11 i == MLOOP-1 )
( printf( "i: %d, wall: %d, function call: %d\n",i,wall,count );
printf( "angdifli]: %f, movedir: %d, step: %f\n",angdif[i],movedir,step );
printf( "ax %f, cc: %f\n",aa,cc ); printf( "T1 and T2 = %f,%f, Yw[i] = %4.2f, Zw[i] = %4.2An",
gets( paws ); TI ,T2,Yw [i] ,Zw [i] );
#if Debug
#endif I--;
loopend:
/I: #if Debug
( printf( "loopend\n" ); printf( "i: %d, wall: %d, function call: %d\n",i,wall,count );
printf( "Xs,Ys,Zs: %f %f %f, Xm,Ym,Zm: %f %f %An",Xs,Ys,Zs,Xm,Ym,Zm );
piintf( "angdif[i]: %f, movedir: %d\n",angdif[i],movedir ); printf( "T1 and T2 = %f,%f, Yw[i] = %4.2f, Zw[i] = %4.2An",
T 1 ,T2,Y w[i],Zw [i] ); plintf( "bb: %f, dd: %An",bb,dd ); gets( paws );
I #endif :!:I
:::/
count++:
48

dx 1 = fabs( Xs-Xm ) bb / (bb + dd );
dx2 = fabs( Xs-Xm ) - dxl;
dad = sqrt( bb*bb + dx 1 *dxl );
dad += sqrt( dd*dd + dx2*dx2 );
I* #if Debug
#endif *I printf( "dad = %f\n",dad );
if( wall == 20 )
( s5.starPath = dad:
return s5.starPath; 1 else
( s5.portPath = dad;
return s5.portPath;
1 1
I* x distance: source to target
/ x distance: target to mic.
*/
*/
/* total reflection path "I
: * :g* ** **::c * * * 4: * q:
q: *:g 8: * * ** ** ** * *******a a ... .. '.+I
double tair, double hum, double patm, struct geom 86, double alphaWallE] )
( time-t now; struct tm *hour; char s[40],
fileName[ NAMEMAX ] = (01, masterName[ NAMEMAX ] = ( 0 ) ;
int i, j, k; long int m; double distance:
1 string array of output file name */
FILE *fp;
now = time( NULL );
49
hour = localtime( &now );
strftime( s,4O,"%x",hour );
printf( "input file name ('Masterfile' will be appended)\n" );
gets( fileName );
strcpy( masterName,fileName );
strcat( masterName,"Masterfile" );
if ( (fp = fopen( masterName, "w" )) != 0 )
{ fprintf( fp,"%s \n",masterName );
fprintf( fp,"%s \n\n",s );
fprintf( fp,"%s \n", "Reflection interference in the 40 x 80 P. Soderman");
fprintf( fp,"%s %3.lf %s \n", "Air temperature = ", tair, "OF" );
fprintf( fp,"%s %3. If %s \n", "Air pressure = ' I , patm, "psi" );
fprintf( fp,"%s %3.1 f %s \n", "Relative humidity = ", rhum, "%" );
fprintf( fp,"test section center is origin: x is upstream, y is up, z is starboard\n" );
fprintf( fp,"%s %3. If %3. If %3. If %s \n", "Source coordinates = ", g6.xsource, g6.ysource,g6.zsource, "ft" );
fprintf( fp,"propagation angles rel. to x' and z' axes:\n" );
fprintf( fp,"%3. If %3. I f %s \n", g6.theta,g6.phi,"deg1' );
fprintf( fp, "columns: alphawall, d, tonal plus, tonal minus, white\n" );
fprintf( fp,"d, ft\t" );
for ( j = 0; j e NFREQ; j++ )
if( j < 16 ) (
fprintf( fp,"%3.1 f\t%3.lf\t%3. IAt ",frequ],frequl,freqljl 1;
else if( j > 15 && j e 26 ) fprintf( fp,"%4.0f\t%4.0f\t%4.Of\t ",frequ],frequ],freqQ] );
50
else fprintf( fp,"%6.Of\t%b.Ofh%6.Of\t ",freqQ],freqQ],freqQ] );
fprintf( fp,"h" );
distance = START;
for( k = 0 k < NALPHA; k++ )
( fprintf( fp,"alpha wall: %3.1 f\n",alphaWall[k] );
m = -1;
for( i = 0; i < NSTEPS; i++ )
( distance++;
fprintf( fp,"%3.1 f\t",distance );
for( j = 0 j < NFREQ; j++ ) (
m++;
fprintf( fp,"%6.2f\t%6.2f\t%6.2f\t", ('gdbTplus)[m][k],( "dbTminus)[m][k],("dbW)[m][k] );
I fprintf( fp,"h" );
1 I fclose( fp );
if( !subFiles( fileName, freq, dbTplus, dbTminus, dbW, tair, rhum, patm, 86, alphawall )) printf( "problem in subFiles moduleh" );
I else
return 0;
return 1;
I
* Function subFiles() creates a series of data text files, each containing the data for a * certain frequency.
51

I
{ time-t now; struct tm '"hour; char paws[5],
S W I 3 fbuff[NAMEM AX], :i:specialFreq[] = { " 1 ~ " , " ~ ~ " , " ~ ~ 0 " , " 3 15","400","500"," 1000","2500","40",
"5000","8000"," 1 ~ " , " 2 ~ " , " 4 0 0 0 0 " ) , "1 subName[ NAMEMAX];
i, j, jj, k, 1, jfreq, numSpecialFreq = 14;
Pic string array of output file name int
long int m; double distance; FILE "'fp2;
now = time( NULL );
hour = localtime( &now );
strftime( s,40,"%x",hour );
for( jj = 0; jj < numSpecialFreq; jj++ )
{ for( 1 = 0; 1 < NFREQ; 1++ )
{ sprintf( fbuff,"%ld",(long int)freq[l] );
if( !strcmp( fbuff,specialFreqlij] )) {
jfreq = 1; break;
1
strcpy( subName,fileName );
strcat( siibName,specialFreq~j] );
if ( (fp2 = fopen( subName, "w" )) != 0 )
fprintf( fp2,"%s \n",subName ); (
fprintf( fp2,"%s \n\n",s );
52
fprintf( fp2,"%s h", "Reflection interference in the 40 x 80 P. Soderman");
fprintf( fp2,"frequency = %s Hz\n",specialFreq~] );
fprintf( fp2,"%s %3.1 f %s h", "Air temperature = 'I , tair, " O F " );
fpnntf( fp2,"%s %3. If %S h", "Air pressure = ", patm, "psi" );
fprintf( fp2,"%~ %3. If %S h", "Relative humidity = ", hum, "%" );
fprintf( fp2,"test section center is origin: x is upstream, y is up, z is starboardh" );
fprintf( fp2,"%s %3.If %3.If 83. l f %s \n","Source coordinates = ", g7.xsource, g7.ysource, g7.zsource, "ft" );
fprintf( fp2,"propagation angles rel. to x' and z' axes:h" );
fprintf( fp2,"%3. If %3. If %s h", g7.theta,g7.phi,"degt' );
fprintf( fp2,"column groups of three for each alphawall: " );
for( k = 0; k < NALPHA; k++ ) fprintf( fp2,"%4.2f\t",alphaWall[k] );
fprintf( fp2,"h" );
fprintf( fp2, "columns: d, tonal plus, tonal minus, whiteh" );
fprintf( fp2,"d\t" );
for( k = 0; k < NALPHA; k++ ) fprintf( fp2,"%4.2f-+\t%4.2f--\t%4.2f_W\t",alphaWall[k],alphaWall[k], alphaWall[k] );
fprintf( fp2,"h" );
distance = START;
m = -1:
for( i = 0; i < NSTEPS; i++ )
distance++;
fprintf( fp2,"%3.lf\t1',distance );
53
for( j = 0; j <= jfreq; j++ ) m++;
for( k = 0; k < NALPHA; k++ ) fprintf( fp2,"%6.2f\t%6.2f\t%6.2f\t", ('~'dbTplus)[m][k],( '!:dbTminus)[m] [k],( :':dbW)[m] [k]);
fprintf( fp2,"\n" );
for( j = jfreq+l; j < NFREQ; j++ ) m++:
I I else
return 0;
fclose( fp2 );
I return 1 ;
I
I freeMemory() frees memory created for pointers including arrays of pointers.
I
{ int i, j, m = - I ;
for( i = 0; i < NSTEPS; i++ )
{ for( j = 0; j < NFREQ; j++ )
m++;
free( ( 'i:dbTplus)[m]);
free( ( "'dbTminus) [ m]);
free(( :xdbW)[m]);
1 I free( '"dbTplus);
free( ':'dbTminus);
free( '"dbW);
54
* %** * * ** * : E ** *% *. ** * Function skip-line reads and ignores all characters up to and including the first new-line * character. Use to clear in
E***
void skip-Iine( void )
( while( getchar() != 'h' )
REFERENCES
1. Soderman, P. T.: Sources and Levels of Background Noise in the NASA Ames 40- by 80-Foot Wind Tunnel: A Status Report. NASA TM-100077, May 1988.
2. Schmitz, F. H.; Allmen, J. R.; and Soderman, P. T.: Modification of the Ames 40- by 80-Foot Wind Tunnel for Component Acoustic Testing for the Second Generation Supersonic Transport. 7th European Aerospace Conference, Toulouse-Labege, France, Oct. 1994.
3. Soderman, P. T.; Schmitz, F. H.; Allen, C. S.; Jaeger, S. M.; Sacco, J. N.; Mosher, M.; and Hayes, J. A.: Design and Development of a Deep Acoustic Lining for the 40- by 80- Foot Wind Tunnel Test Section. NASA/TP-2002-2 1 1850, November 2002.
4. Soderman, P. T.; Schmitz, F. H.; Allen, C. S.; Jaeger, S. M.; Sacco, J. N.; and Hayes, J. A.: Design of a Deep Acoustic Lining for the 40- by 80- Foot Wind Tunnel Test Section. AIAA Paper 99- 1938,5th AIAA/CEAS Aeroacoustics Conference, Seattle, Wash., May 10- 12, 1999.
5. Hunt, R.; and Sacco, J.: Activation and Operation of the National Full-scale Aerodynamic Complex. AIAA Paper 2000- 1076,38th Aerospace Sciences Meeting and Exhibit, Reno, Nev., Jan. 2000.
6. Soderman, P. T.; Jaeger, S. M.; Hayes, J. A.; and Allen, C. S.: Acoustic Performance of the 40- by 80- Foot Wind Tunnel Test Section Deep Acoustic Lining. AIAA Paper 2000- 1939,6th AIAAKEAS Aeroacoustics Conference, Lahaina, Hawaii, June 2000.
7. Hayes, J. A.; Horne, W. C.; Soderman, P. T.; Bent, P. H.: Airframe Noise Characteristics of a 4.7% DC- 10 Model. AIAAKEAS-97- 1594,3rd AIAAKEAS Aeroacoustics Conference, Atlanta, Ga., May 1997.
8. Soderman, P. T.: Aeroacoustic Research Techniques -Jets to Autos. FEDSM99-7240, Proceedings of 3rd ASME/JSME: Joint Fluids Engineering Conference, San Francisco, Calif., July 1999.
9. Soderman, P. T.; and Mort, K. W.: Aeroacoustic Characteristics of a Large, Variable-Pitch Fan System. Proceedings for Inter-Noise 83, vol. 1, Edinburgh, Scotland, July, 1983, pp. 123- 125.
10. Jaeger, S. M.; Allen, C. S.; and Soderman, P. T.: Reduction of Background Noise in the NASA Ames 40- by 80-Foot Wind Tunnel. CEAS/AIAA Paper 95-152, 1st Joint CEAS/AIAA Aeroacoustics Conference, Munich, Germany, June 1995.
11. Wilby, J. F.; White, P. H.; and Wilby, E. G.: Pulse Reflection Study of Acoustic Lining Coverings. AARC Report 137 (NAS2- 1 3459), Atlantic Applied Research, May 1992 (unpublished).
57

12. Soderman, P. T.; and Phillips, J. D.: Noise Radiation Directivity from a Wind-Tunnel Inlet with Inlet Vanes and Duct Wall Linings. AIAA Paper 86-1896, 10th Aeroacoustics Conference, Seattle, Wash., July 1986.
13. Ver, I. L.: Acoustical Characteristics of a Crossing Jet Noise. JASA, vol. 57, no. 5, May 1975, pp. 1205-1206.
14. Soderman, P. T.: A Study of Resonant-Cavity and Fiberglass-Filled Parallel Baffles as Duct Silencers. NASA TP 1970, April 1982. (Also Soderman, P. T.: Design and Performance of Resonant-Cavity Parallel Baffles for Duct Silencing. Noise Control Engineering, vol. 17, no. 1, July-August 198 1, pp. 12-2 1).

Figure 1. National Full-scale Aerodynamics Complex (WAC).
Figure 2.40 x 80 test section showing the 6-inch-deep absorbent wall lining prior to demolition and installation of the deep lining (view looking downstream).
59
40x8 0
0 0 0 0 0 0 0 0 0
fan drive u +
North
Figure 3. NFAC plan view.
+ 8 0 x 1 2 0 exhaust
Figure 4. The 40 x 80 test section viewed from the diffuser prior to the acoustic modification. Note the vortex generators and diffuser column at the diffuser inlet.
60
lining installation overhead /
/ area ring girder \ wedge I (1 of41 modules
(a) 4-ft square compartments.
68% open perforated face sheet 12 ga.
.. . surface metal
0.188 inch thick
pressure shell (bottom)
(b) Wedge and surface interface panel installation at floor.
Figure 5. Lining modules.
61
(a) Wedges.
Figure 6. Fiberglass wedges.
62
lining c&ptt-i, in w d g e peak base air gap, surface toshell tieiutit. in height. in jr~
42 3.3 - ., . L.,' r.c 7 i 5:. 7!!
(b) Specifications.
Figure 6. Concluded.
63

wind t 40.0 f t
house 'Y
turntable: 35.2 f t diameter rotated 90" from normal setup
(a) Turntable plan-view detail showing module shape and depth (inches).
Figure 7. Floor module layout; panels T1 - T4 tested for sound absorption are noted.
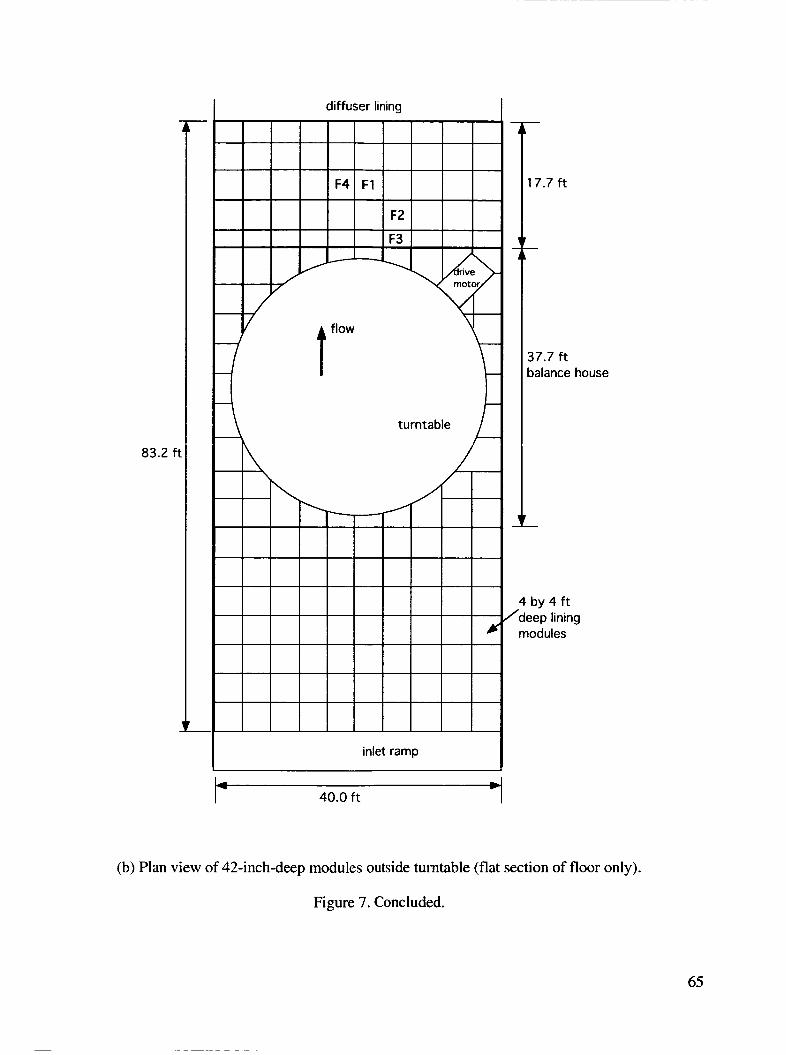
diffuser lining I
83.2 fi
t flow
\ turntable / I
37.7 ft balance house
4 by 4 f t deep lining modules
I inlet ramp
40.0 f t
(b) Plan view of 42-inch-deep modules outside turntable (flat section of floor only).
Figure 7. Concluded.
65

/
medium panels A-48 ft - heavy panels 4 medium pan'ek
Figure 8. Location of floor, wall, and ceiling flowhnterface panels. The floor panels are designed to support personnel and equipment. The lower-wall panels support personnel only.
3.75 in
(a) Floor panel.
Figure 9. Surface panel: porous face sheet, screen, and support grating.
66
-
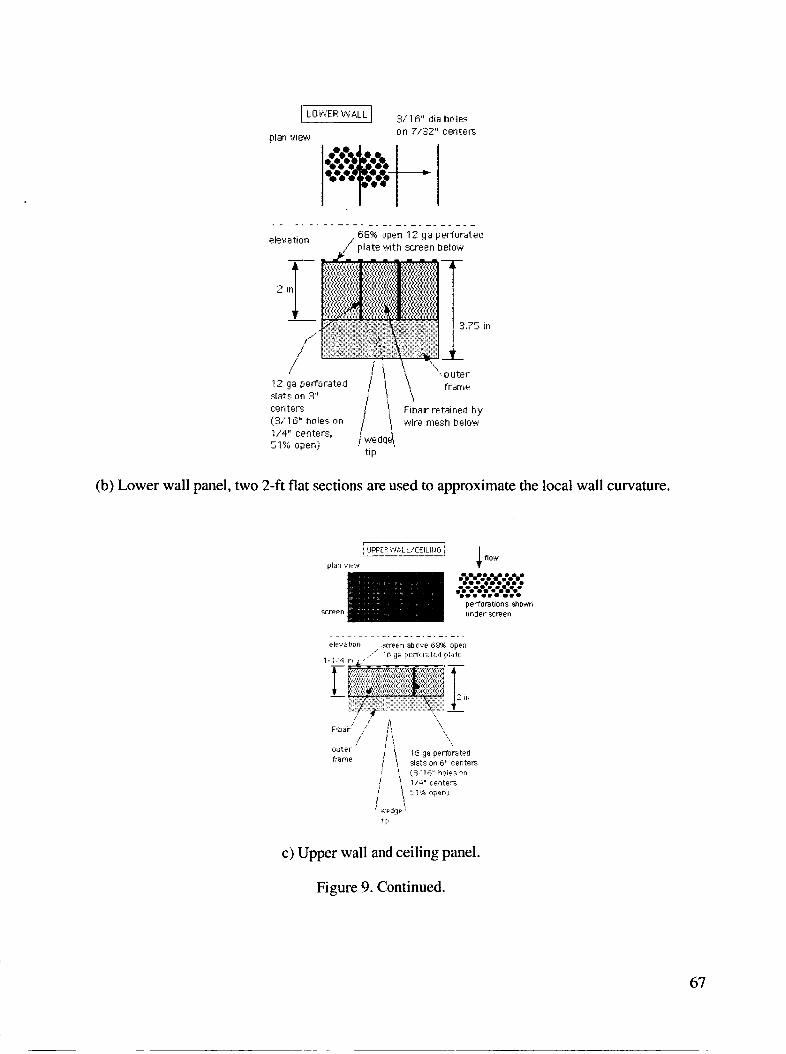
.outer i 12 3a perforated I
slats on 3" cent eis [3/1tj" holes on 1/4" centers, /,, \
i Fibair retained by 'wire mesh belmni
1 v@dqel, 5 i3s open; ti P
(b) Lower wall panel, two 2-ft flat sections are used to approximate the local wall curvature.
!JPF.EF W A L L/CEILItIG
atart view
perforations shown under scleen
c) Upper wall and ceiling panel.
Figure 9. Continued.
67
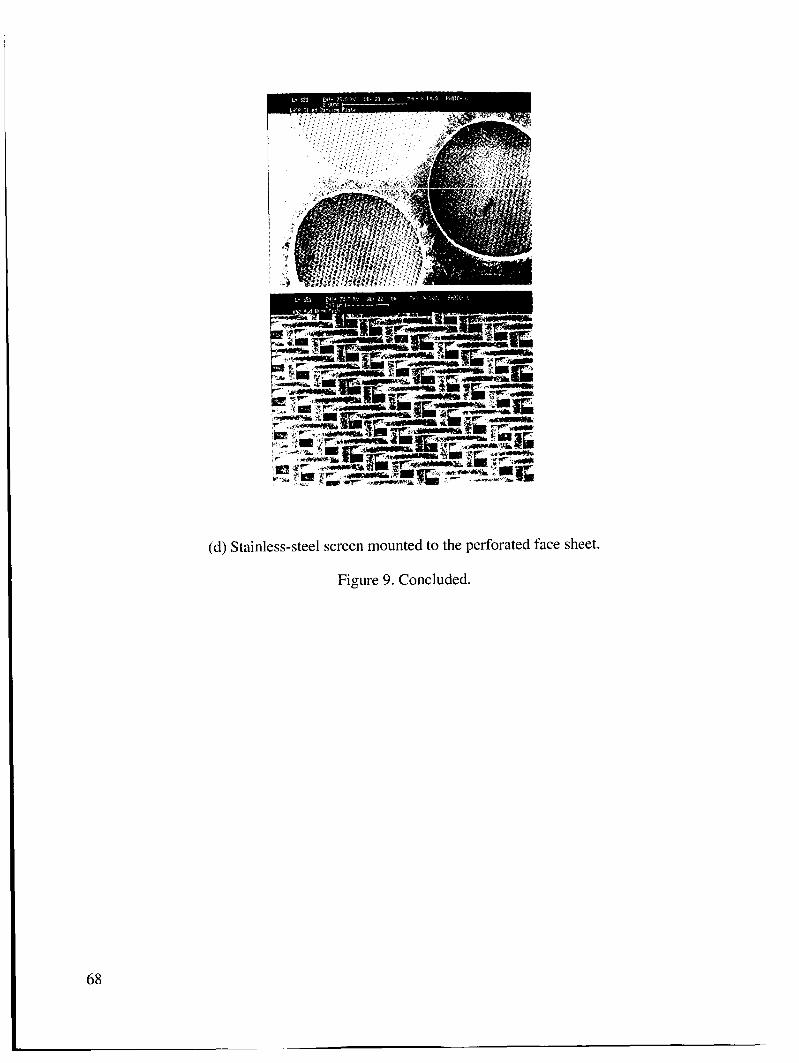
(d) Stainless-steel screen mounted to the perforated face sheet.
Figure 9. Concluded.
68
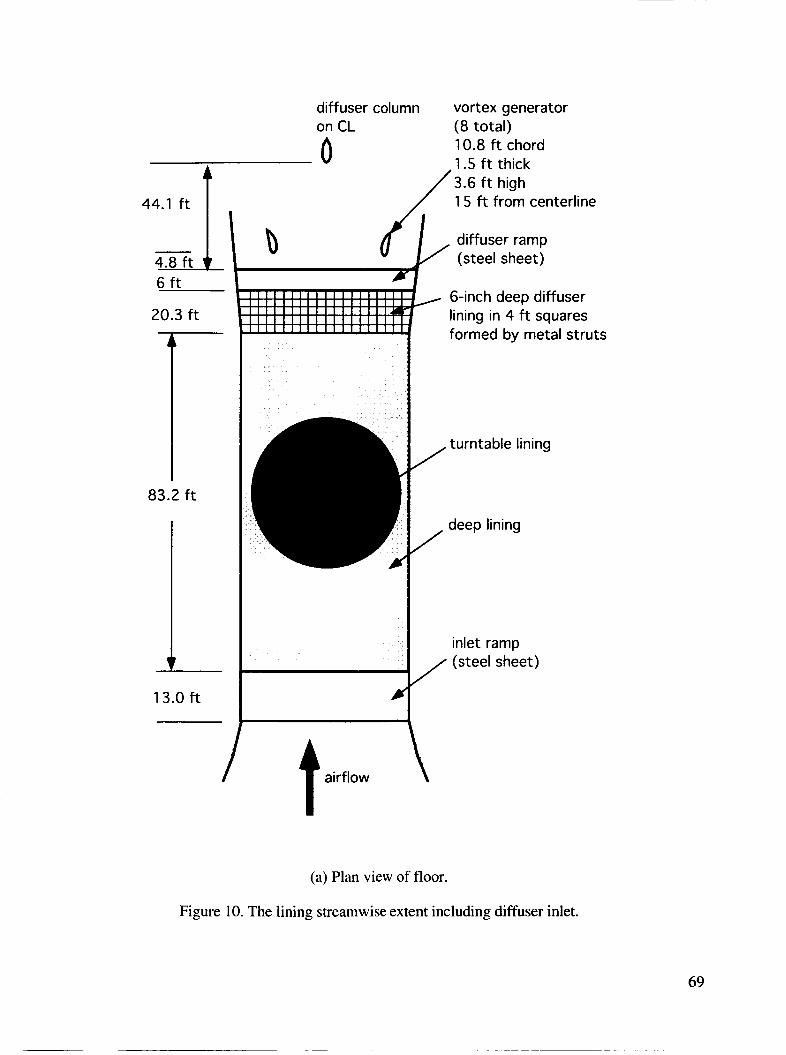
4 4 I 1 4.8 f t
diffuser column vortex generator on CL (8 total)
10.8 f t chord 1.5 f t thick 3.6 f t high / 15 f t from centerline
0
6 f t
20.3 f t
83.2 f t
13.0 f t
d' L
airflow t
diffuser ramp (steel sheet)
6-inch deep diffuser lining in 4 ft squares formed by metal struts
,turntable lining
/ deep lining
inlet ramp
/ sheet)
\
(a) Plan view of floor.
Figure 10. The lining streamwise extent including diffuser inlet.
69

airflow - elevation view not to scale
deep lining in test section
t 6 inch
floor or wall grating Fibair between slats (see fig. 9)
bulk fiberglass 1 Ib/ft3 OCF 701 in cloth bag (J.P. Stevens 1675)
wind tunnel wall '
* 12 ga. steel perforated plate on floor, screen below 16 ga. steel perforated plate on walls and ceiling, screen on flow side
(b) Elevation.
Figure 10. Concluded.
Figure 1 1 . Yachting cannon: acoustic noise source.
70

I Mac G3
Theoretical predictions
Figure 12. Instrumentation and data processing flow.
Figure 13. Setup 1 between turntable and diffuser; cannon aimed cross-stream.
71
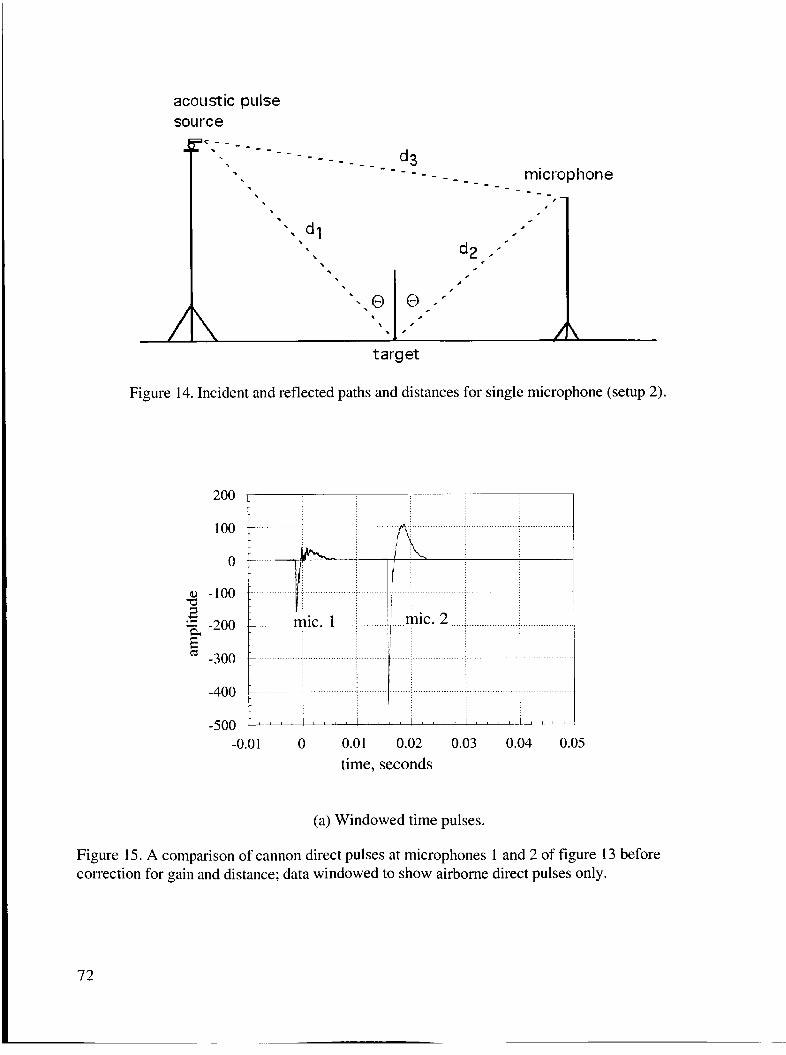
acoustic pulse source
- mi crop t i on e - _ - - - _ - - - -
d3 - - _ _ - - - _ - - _ - - - - _ _ . - - - a c - -
8
8 '. d l , . .a
,
, , . c
0
c ,
target
Figure 14. Incident and reflected paths and distances for single microphone (setup 2) .
2oo i 100
0
Q) -100 2
-200
-300
m
E CJ
-400
-0.0 1 0 0.01 0.02 0.03 0.04 0.05 time, seconds
(a) Windowed time pulses.
Figure 15. A comparison of cannon direct pulses at microphones I and 2 of figure 13 before correction for gain and distance; data windowed to show airborne direct pulses only.
72
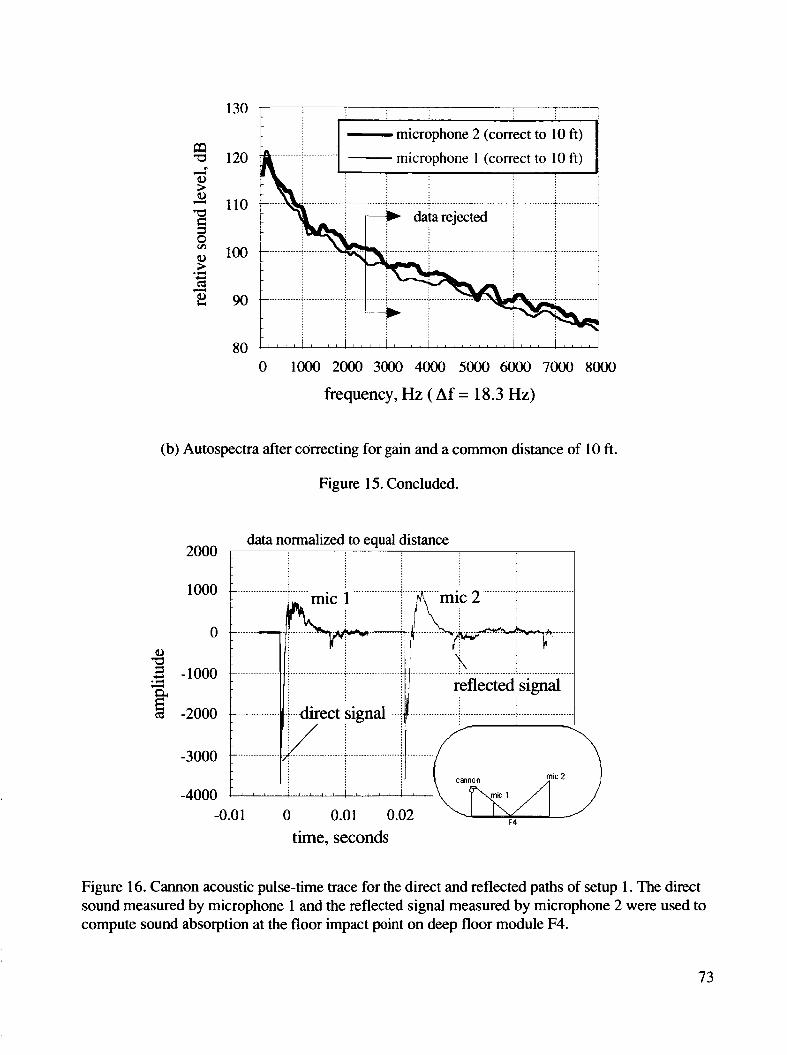
130
120
110
100
90
- microphone 2 (correct to 10 ft) i
0 loo0 2000 3000 4000 5000 6000 7000 8000
frequency, Hz ( Af = 18.3 Hz)
(b) Autospectra after correcting for gain and a common distance of 10 ft.
Figure 15. Concluded.
data normalized to equal distance 2000
1000
0
4 .rl a -1000 H
8 -2000
-3000
t
L it I ................
................ .................. ................. ..................
F4 -0.0 1 0 0.01 0.02 time, seconds
Figure 16. Cannon acoustic pulse-time trace for the direct and reflected paths of setup 1. The direct sound measured by microphone 1 and the reflected signal measured by microphone 2 were used to compute sound absorption at the floor impact point on deep floor module F4.
73
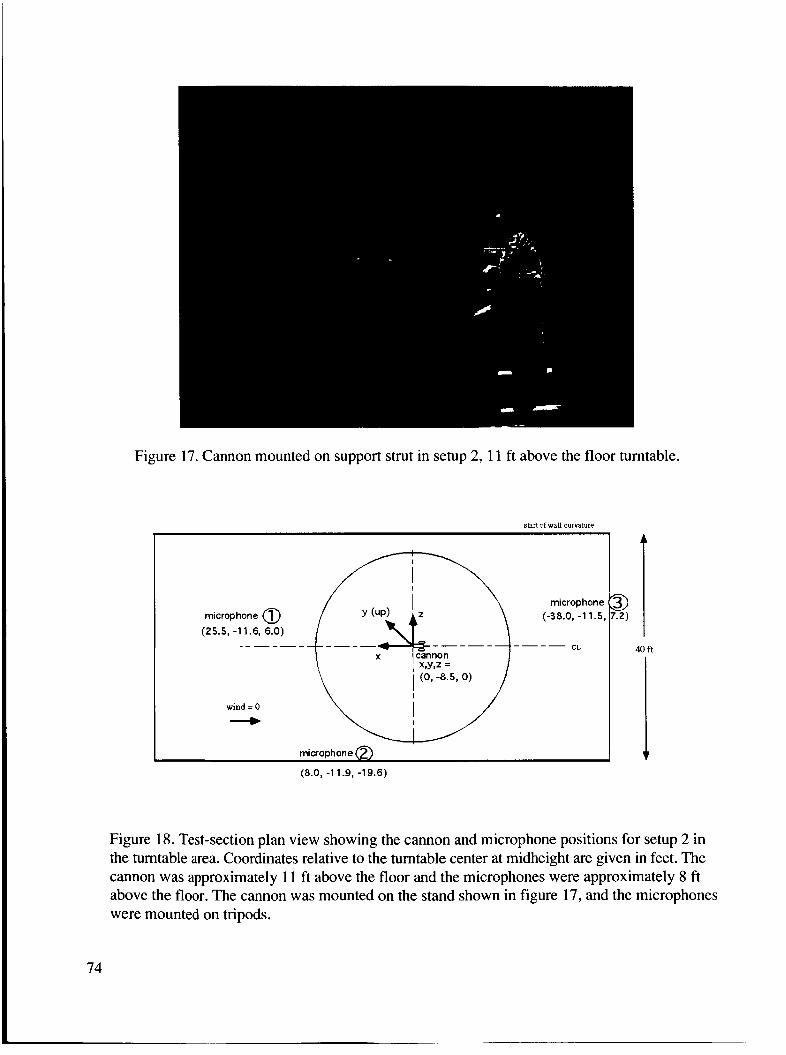
Figure 17. Cannon mounted on support strut in setup 2, 11 ft above the floor turntable.
stari of wall curvature
I I x Ifinnon
wind = 0
+ microphone @ (8.0, -1 1.9, -1 9.6)
Figure 18. Test-section plan view showing the cannon and microphone positions for setup 2 in the turntable area. Coordinates relative to the turntable center at midheight are given in feet. The cannon was approximately 11 ft above the floor and the microphones were approximately 8 ft above the floor. The cannon was mounted on the stand shown in figure 17, and the microphones were mounted on tripods.
40 ft
1 74

30
20 .......... i ................ / .......... h i 10 ............ i... ; ............... ............................... i ............... i ............... i ............... 1 i \ , ~
0 . . .......... ...............
-10 .......................
-20
1 yyv ............ ; .............. ; ........
frequency, Hz ( Af = 18.3 Hz)
(a) Power spectra of the direct and reflected signals.
1
0.8
0.6
0.4
0.2
0
coherence
"Lrz"
..................
0 lo00 2000 3000 4000 5000 6000
frequency, Hz
(b) Narrowband absorption and coherence between direct and reflected signals.
Figure 19. Fourier transformed data of figure 16, setup 1 .
75
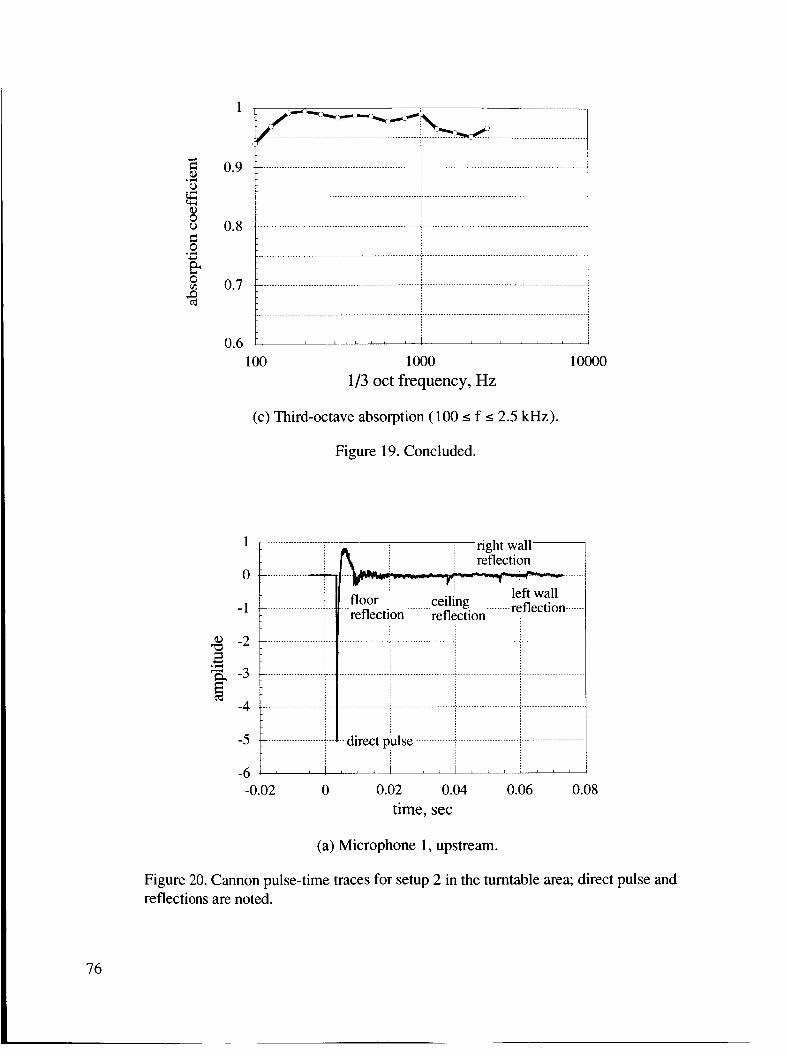
1
0.9
0.8
0.7
0.6
........................................................... < ...................... t-
100 1000 1/3 oct frequency, Hz
1 0000
(c) Third-octave absorption (100 s f s 2.5 kHz).
Figure 19. Concluded.
right wall- reflection
............... .... .....
left wall ..................... ... ......... ceiling ........ reflection.. ... 1 floor
j -1
-2
-3 .l i 1 i ;
-4 .L ...................... ~ .................................................. ~ ................................................
-5 ._ ..................... :...,.. ..............................................................
- 6 . ' 1 ' ' " I
.- :... x - reflection reflection :
.- .......................................... .; .................. .j ....................................
..................... ....................... ....................... ....................... ......................
direct pulse
-0.02 0 0.02 0.04 0.06 0.08 time, sec
(a) Microphone I , upstream.
Figure 20. Cannon pulse-time traces for setup 2 in the turntable area; direct pulse and reflections are noted.
76
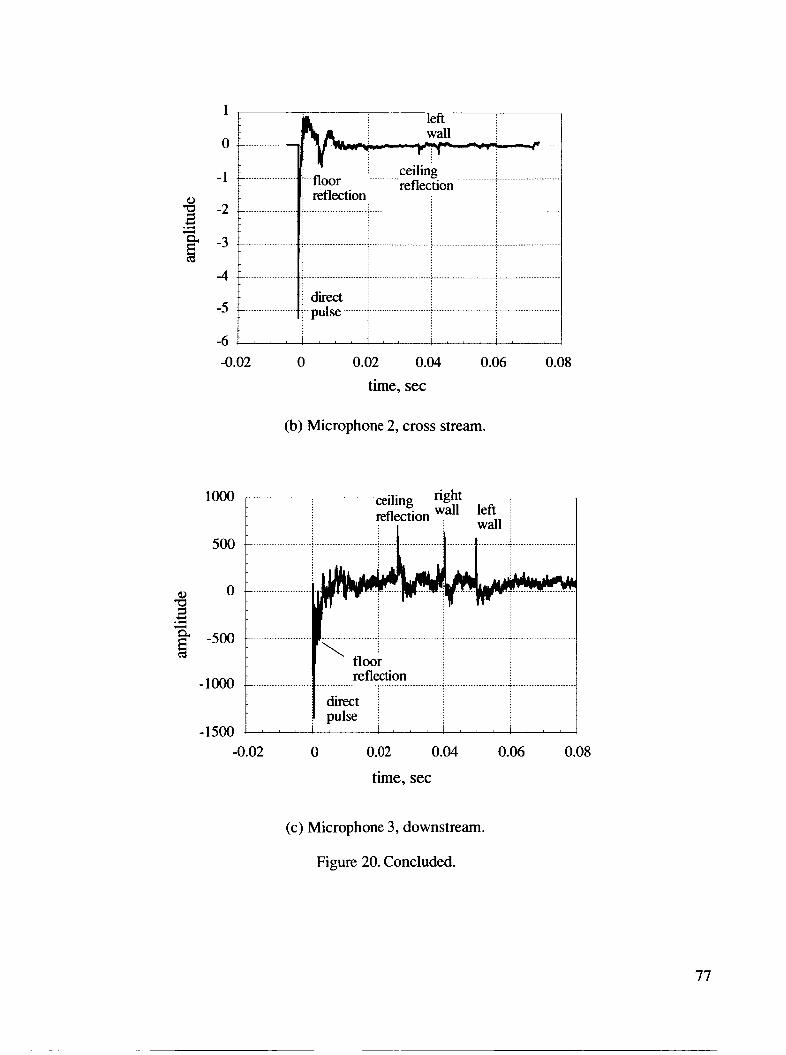
1
0
-1
-2
-3
-4
-5
-6
................... ........... .............. 1 ....................... reflection
.- .................... ................................................... ...............................................
[ reflection
._ .................... 1 ......................................................................... ~ .......................
.................................................................... __,__ .................... ...... ...................
.- ....................
-0.02 0 0.02 0.04 0.06 0.08
time, sec
i d k t j ;..pulse ........ j ....................... : ........................ ; .......................
(b) Microphone 2, cross stream.
ceiling -right
.................................... j ....... ................ .......... 1 ............
0
-500 ....................... ........................ i .................... \ i
floor
4 1 U .&
.... ....
-1500 -0.02 0 0.02 0.04 0.06 0.08
time, sec
(c) Microphone 3, downstream.
Figure 20. Concluded.
77

1
0.9
0.8
0.7
0.6
y - m ................................ ..................................
............................................................................. 1 1
............. 1 ..... ... ......
t ........................................................
I I -- deep panel - turntable t I I
100 1000 10000
1/3 oct frequency, Hz
Figure 2 1. Absorption coefficient spectra from cannon floor reflections over deep module F4 and turntable module T4 (microphone 1).
1
0.9
0.8
0.7
0.6
- - mic 1 - cannon aimed upstream
............................................................ , ............................................................. 1 , , , , , , , , I , , , , , , , , ............................................................ ~ .............................................................
100 1000
1/3 oct frequency, Hz 10000
Figure 22. Absorption coefficient spectra from ceiling reflections. Cannon over turntable, setup 2.
78
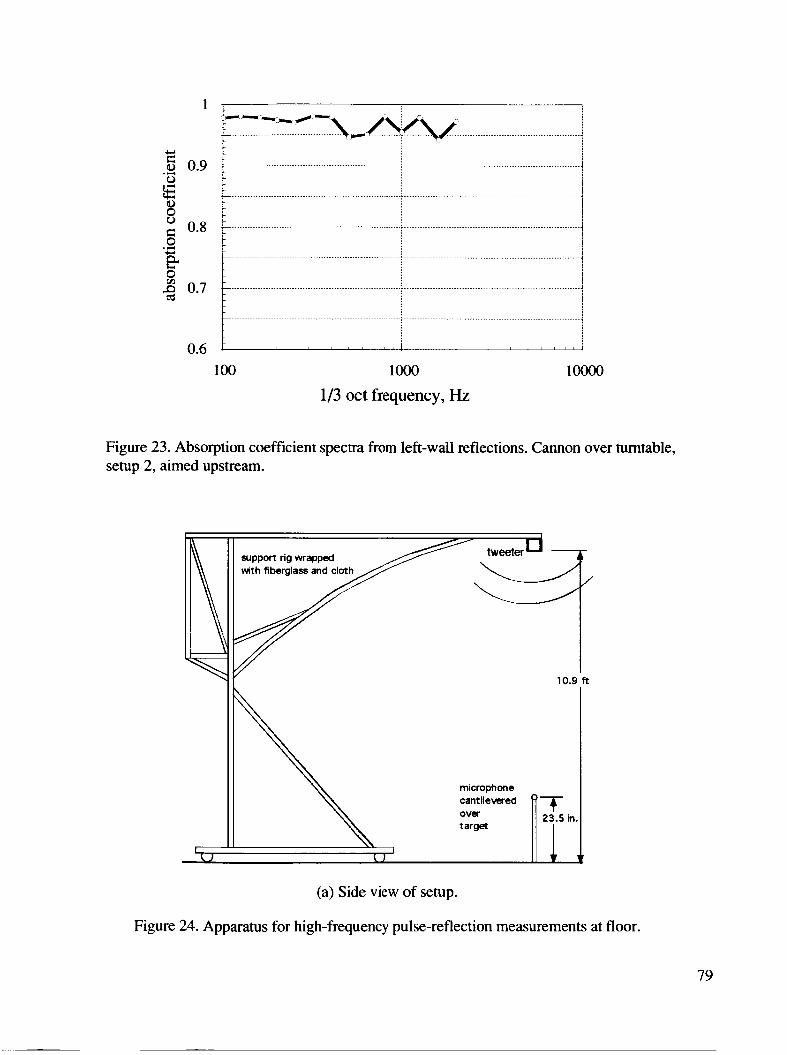
1
0.9
0.8
0.7
0.6
*-,+-\-. .. ... . . . . . .-. . .. . . . .. . . . . . . . . . . . . . . . . . . . . . . . . . . . . . . . . . . . . . . . . . . . . . . . . . . . . . . . . . . . . . . . . . . . . . . . . . .. . . . . . . . . . . . . . . . . . . 1 I
t
100 lo00
1/3 oct frequency, Hz loo00
Figure 23. Absorption coefficient spectra from left-wall reflections. Cannon over turntable, setup 2, aimed upstream.
[I support rig wrapped with fiberglass and cloth
tweeter" -
1O.E
microphone cant 1 e w e d
target over
I I ( 1
(a) Side view of setup.
Figure 24. Apparatus for high-frequency pulse-reflection measurements at floor.
79
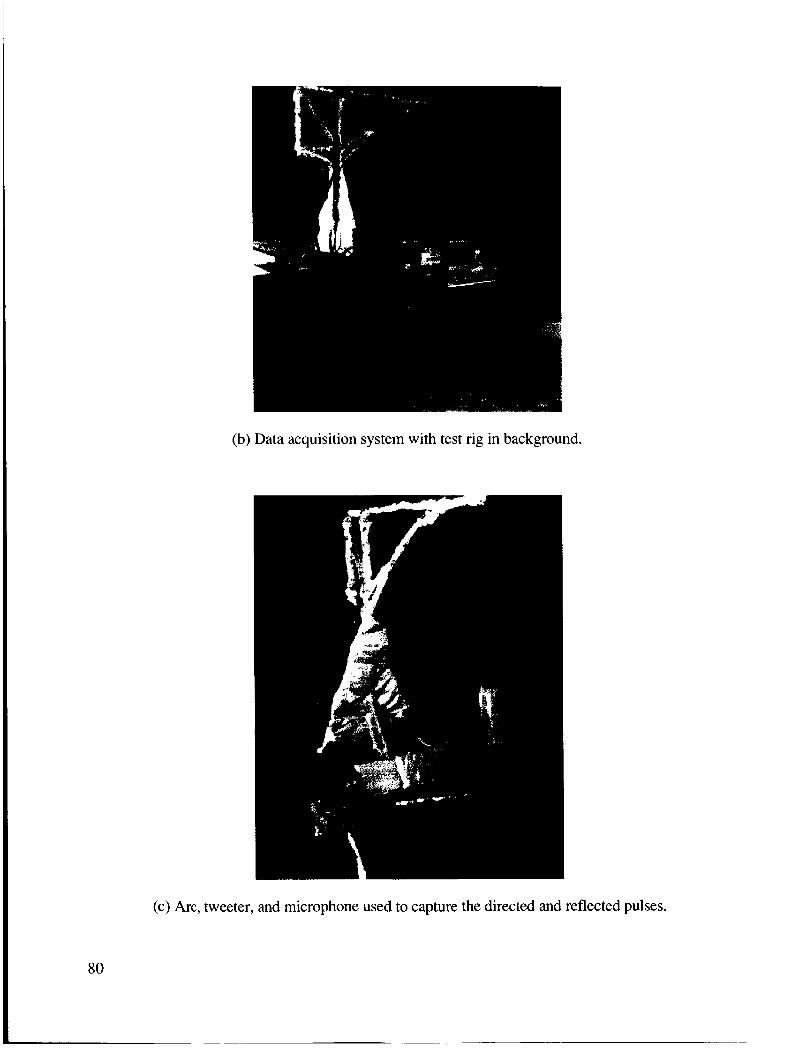
(b) Data acquisition system with test rig in background.
(c) Arc, tweeter, and microphone used to capture the directed and reflected pulses.
80

Figure 24. Concluded.
Figure 25. Portable pulse-reflection apparatus used to measure high-frequency reflections from walls and ceiling. The same tweeter and microphone were used as shown in figure 24.
81

(a) Looking at left wall and lining leading edge.
Figure 26. Wall and ceiling panels evaluated with the portable pulse-reflection apparatus; test panels are outlined in red.
82
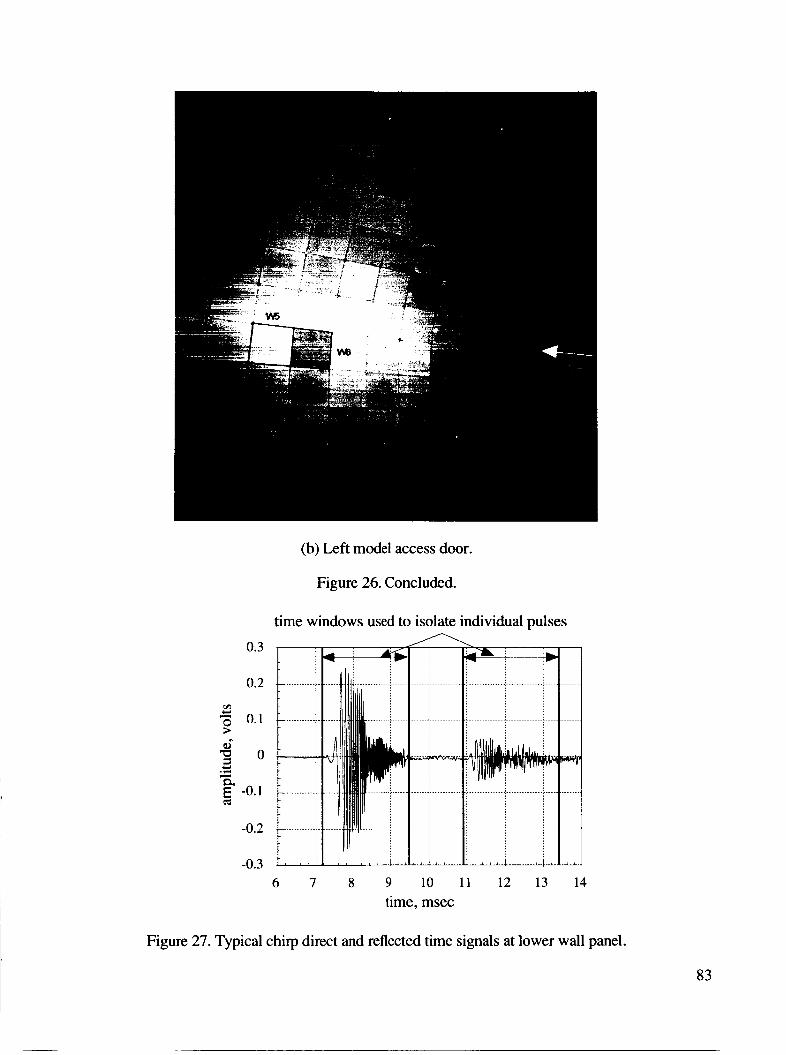
(b) Left model access door.
Figure 26. Concluded.
time windows used to isolate individual pulses
rA U
U .- a (d
E -0.1 ............
-0.2 ...........
-0.3 6 7
*L
............. ~ ...................
............. ...............
............................ ~...
...............................
a 8 9 10 11 12 13
time, msec
.....
.....
.....
~ .....
14
Figure 27. Typical chirp direct and reflected time signals at lower wall panel.
83
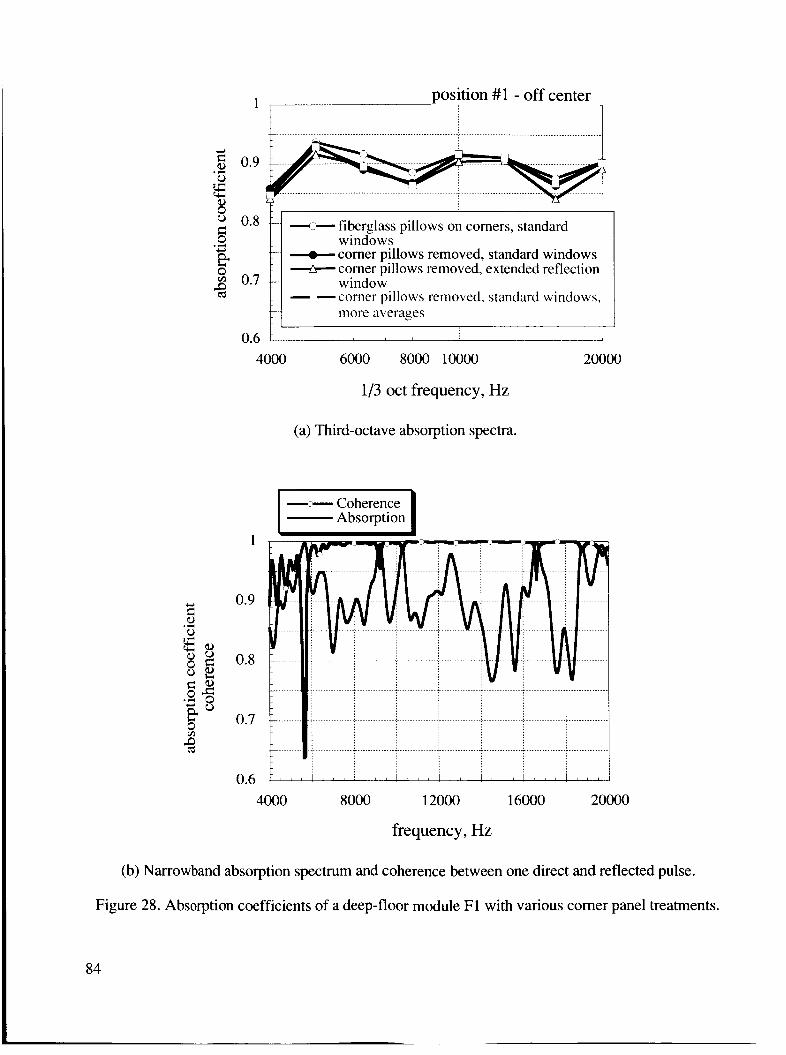
position #1 - off center
U ' 0.8 .L.
T-
- 1 7 fiberglass pillows on corners, standard .+ 0 windows
corner pillows removed, standard windows comer pillows removed, extended reflection
2 0.7 k-. window % 1 - -corner pillows removed, standard windows,
G
more averages
0.6 : I
4000 6000 8000 10000 20000
1/3 oct frequency, Hz
(a) Third-octave absorption spectra.
-- Coherence Absorption
4000 8000 12000 16000 20000
frequency, Hz
(b) Narrowband absorption spectrum and coherence between one direct and reflected pulse.
Figure 28. Absorption coefficients of a deep-floor module F1 with various comer panel treatments.
84

4000 6000 8000 10000
1/3 oct frequency, Hz 20000
Figure 29. Measurement target over panel center spot-welds on support bar (F1 position 2). Note data repeatability.
1
0.9
0.8
0.7
0.6
distance from east edge, inch ............................................
12.5 ..........
..... ..........
E * F2 pos. 2 34.5 ................................................................. .......... t - - - -
4000 6000 8000 loo00
1/3 oct frequency, Hz 2 m
Figure 30. Comparison of floor panels F1 and F2.
85
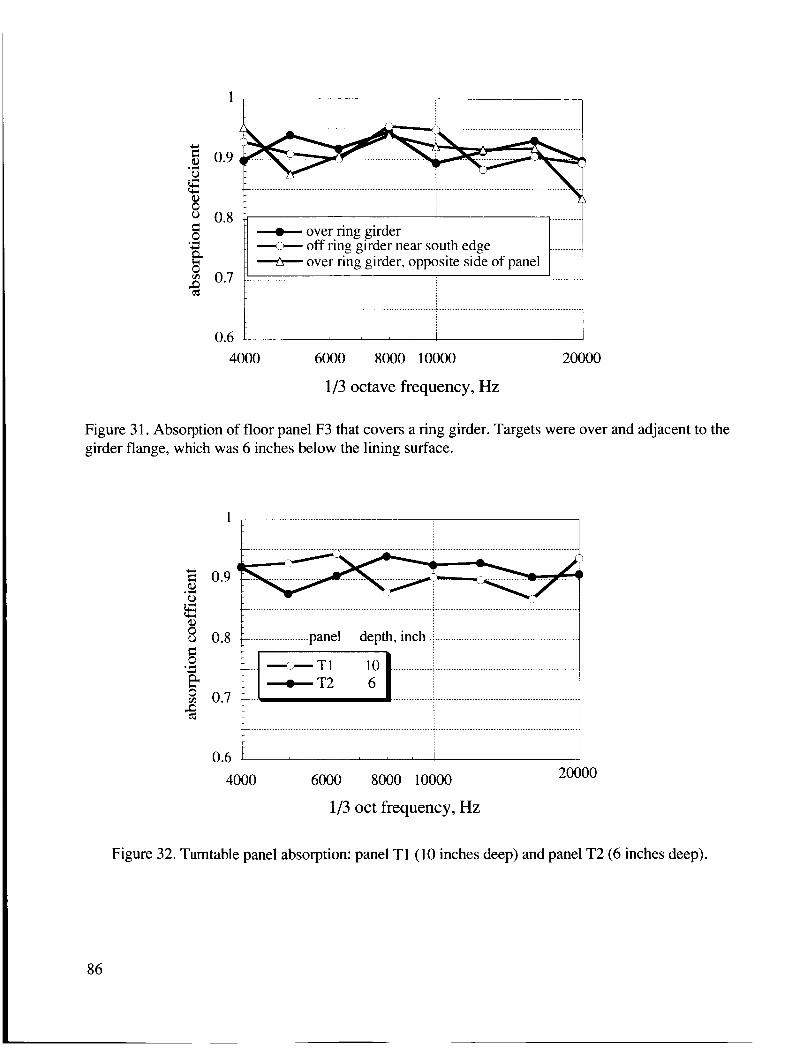
1
............ 0.8 -I over ring girder
=\ off ring girder near south edge ............
+ over ring girder, opposite side of panel 0.7 1 ...................................................................... ......................................... ! ............ 1
-
0.6 1 ! J 4000 6000 8000 10000 20000
1/3 octave frequency, Hz
Figure 3 1. Absorption of floor panel F3 that covers a ring girder. Targets were over and adjacent to the girder flange, which was 6 inches below the lining surface.
1 ,
0.8 ......... ... ...panel depth, inch
-:-Tl 10 ............... ......................................................
0.7
0.6 1 20000 4000 6000 8000 10000
1/3 oct frequency, Hz
Figure 32. Turntable panel absorption: panel T1 (10 inches deep) and panel T2 (6 inches deep).
86

1 ,
! I T .................................................................... inches from &Khe.s..from ...........................
upstream edge kft edge ..... ..................................
; 1;=2:.1 0.7 .:
.... ..................................
0.6 I
0.9
0.8
Diffuser: panel D4 -:- D4 after panel was vacuumed -[I- Diffuser: panel D5
..................... ....................................................
...............................
...............................
1/3 oct frequency, Hz
Figure 33. Turntable panel absorption: panel T3 (30 inches deep).
1
.........................
.............................................................................................................................. 1, U .r(
P I
I t ’ I 0.6 1 I I
4000 6000 8000 loo00 2 m
1/3 oct frequency, Hz
Figure 34. Sound absorption of diffuser floor panels D4 and D5.
87
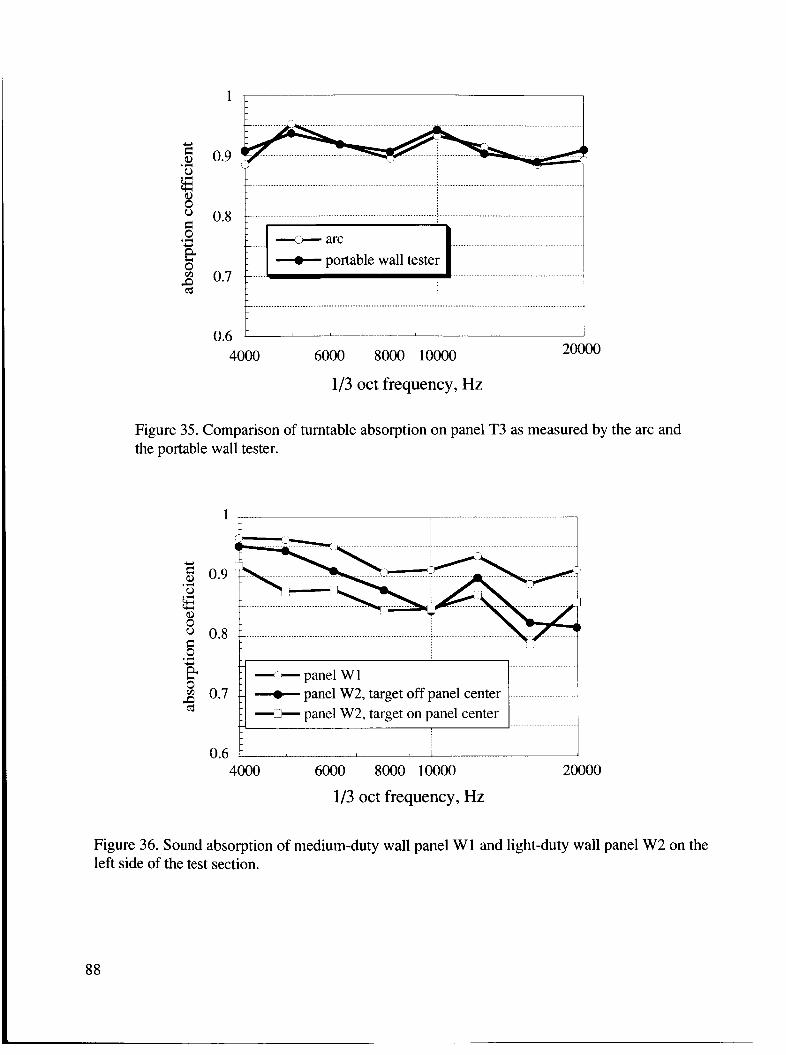
....
0.7 - - - - I ............................................................................................................................
0.8 ...................................................................... L ..................................................... L
-.(> arc
................................................
.............................................................................................................................
0.6 I
20000 4000 6000 8000 10000
1/3 oct frequency, Hz
Figure 35. Comparison of turntable absorption on panel T3 as measured by the arc and the portable wall tester.
1
c 0.9
.r(
0
E 8
E 3
0.8 0 .3
2 0.7
0.6
E
-.-panel W1 panel ~ 2 , target off panel center .....................
+-+ panel W2, target on panel center i 4000 6000 8000 10000 20000
1/3 oct frequency, Hz
Figure 36. Sound absorption of medium-duty wall panel W 1 and light-duty wall panel W2 on the left side of the test section.
88
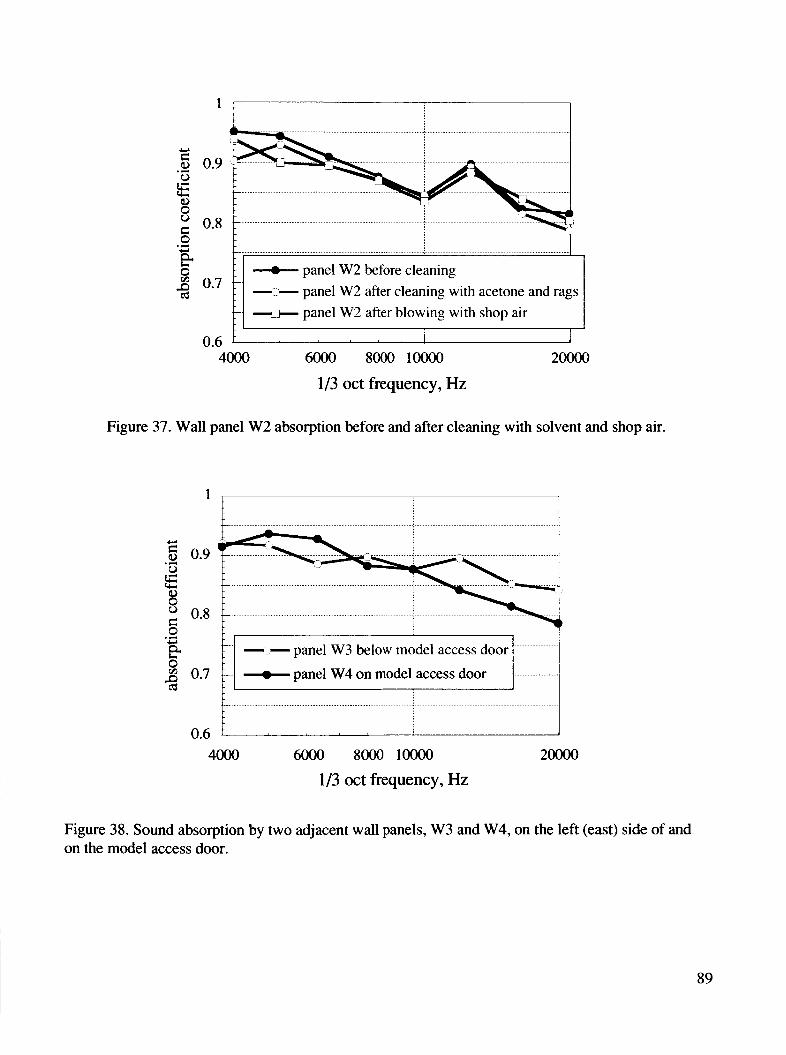
L 1
0.9
0.8
0.7
0.6
..- ......................................................
panel W2 before cleaning 3:- panel W2 after cleaning with acetone and rags --F panel W2 after blowing with shop air
I
4000 6000 8000 loo00
1/3 oct frequency, Hz 2 m
Figure 37. Wall panel W2 absorption before and after cleaning with solvent and shop air.
1
0.9
0.8
0.7
0.6
.................
4000 6000 8000 loo00 2 m
1/3 oct frequency, Hz
Figure 38. Sound absorption by two adjacent wall panels, W3 and W4, on the left (east) side of and on the model access door.
89
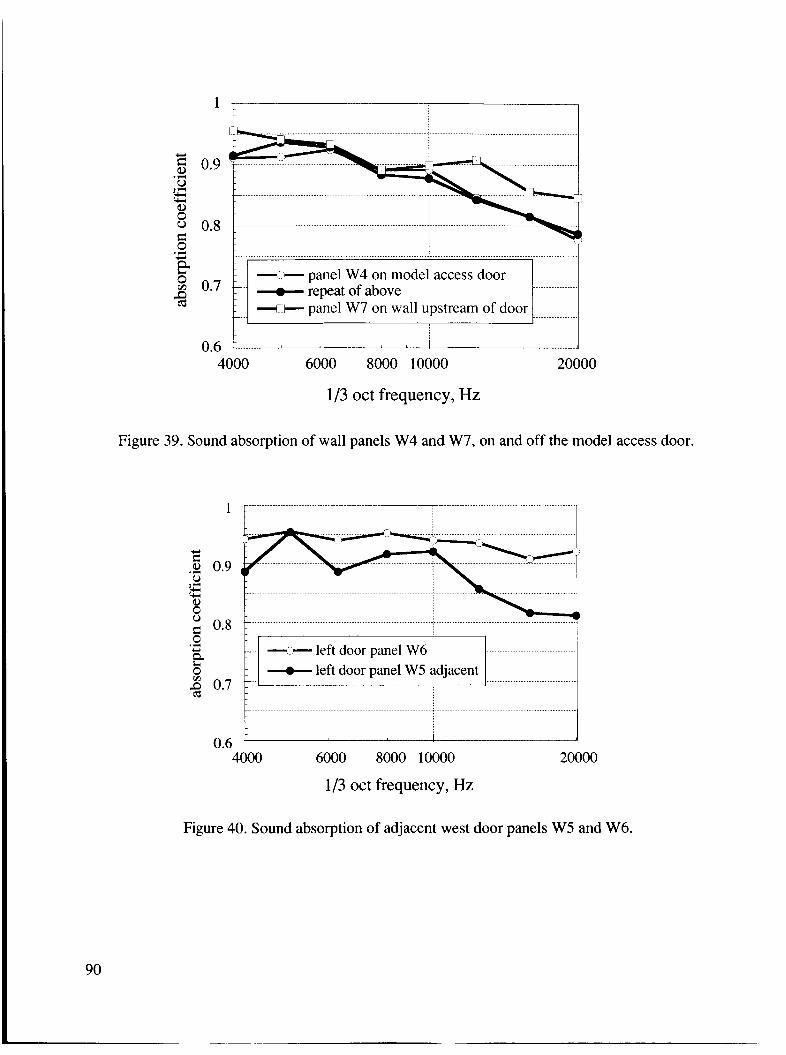
1
0.9
0.8
................
................
20000 0.6
4000 6000 8000 10000
1/3 oct frequency, Hz
Figure 39. Sound absorption of wall panels W4 and W7, on and off the model access door.
lr - - left door panel W6 + left door panel W5 adjacent
..................................
...........................................................................................................................
I i 4000 6000 8000 10000 20000
1/3 oct frequency, Hz
Figure 40. Sound absorption of adjacent west door panels W5 and W6.
90

1
c)
0.9 .r(
0
f 0.8 G
0 .+ & 2 0.7 cd
0.6
t
..... -.:- ceiling panel C2 upstream of door ceiling panel C1 on door, adjacent
............
.I
4000 6000 8000 loo00 2 m
1/3 oct frequency, Hz
Figure 41. Sound absorption of ceiling panels C1 and C2, on and off the model access door.
(a) Close view of woofer and traverse potentiometer.
Figure 42. Woofer and enclosure used for low-frequency sound decay with distance.
91
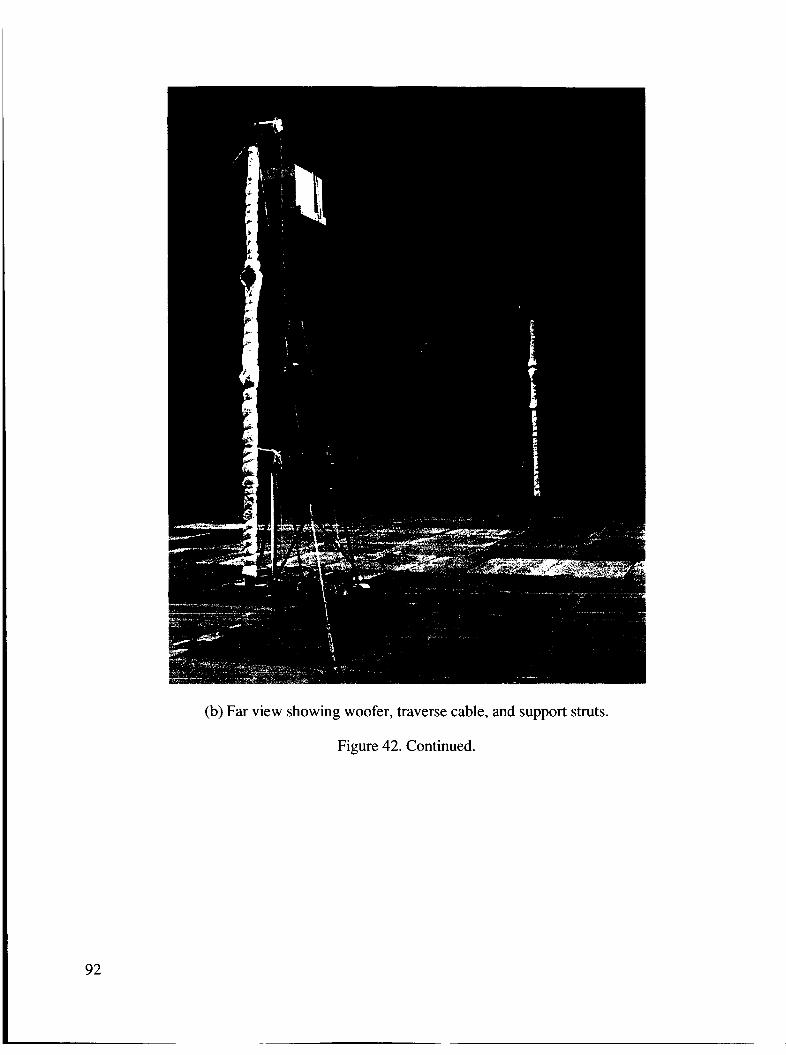
(b) Far view showing woofer, traverse cable, and support struts.
Figure 42. Continued.
92
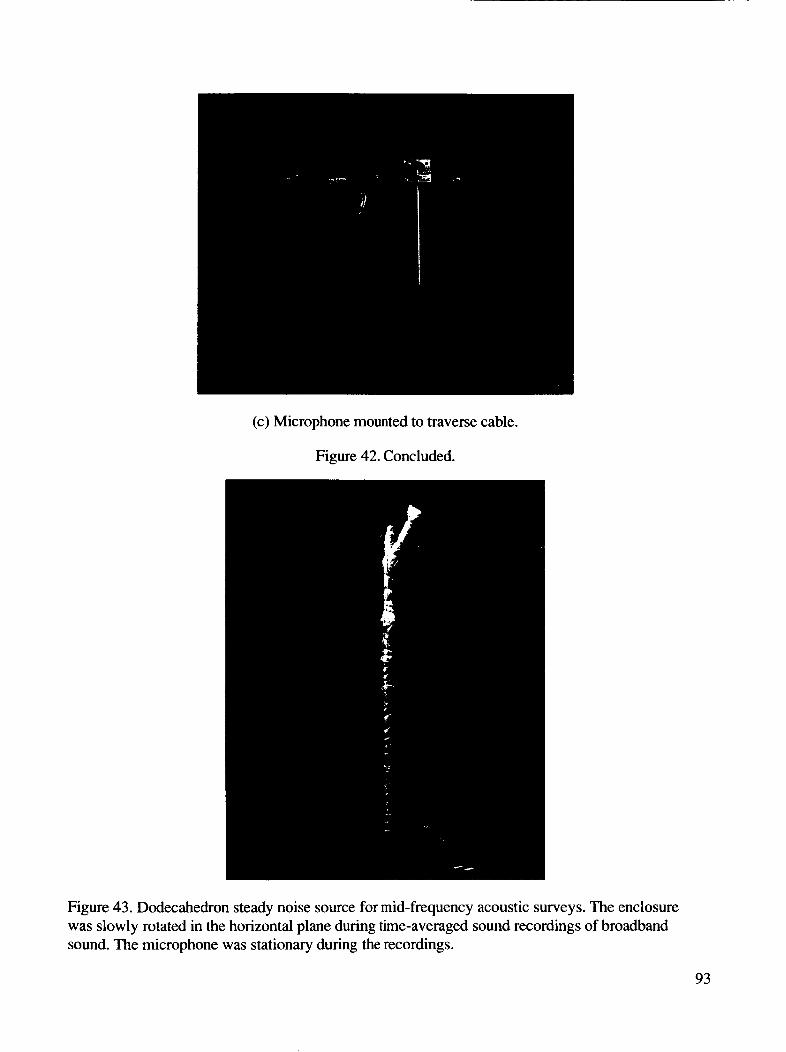
(c) Microphone mounted to traverse cable.
Figure 42. Concluded.
Figure 43. Dodecahedron steady noise source for mid-frequency acoustic surveys. The enclosure was slowly rotated in the horizontal plane during time-averaged sound recordings of broadband sound. The microphone was stationary during the recordings.
93

(a) Close-up of source.
(b) Crossing-jet noise source and microphone on traverse cable.
Figure 44. Crossing-jet pneumatic source. Each nozzle is 1/8 inch in diameter. The gap between facing nozzles is 3/16 inch. The device was driven with 80 psia shop air.
94

90 60
0
240 300
270
(a) White noise in third octave bands.
frequency, Hz
90 120 60
--- 1000
d B
240 ' &' 300 270
(b) Tones: 187.5,375, and 1,OOO Hz.
Figure 45. Woofer radiation pattern for broadband and tonal sound 0" is normal to speaker face.
95

f, Hz 113 oct
-+ 1000 - 4000 - 10000 90 u 35 € 120 60
d 0
\
21 0
30
I
330
240 300
270
(a) White noise: 1,4, and 10 kHz third-octave bands.
frequency, Hz 1-5000 I
10000 15000
-20000 90
20 c 60
240 300
270
(b) Tones: 5 , 10, 15, and 20 kHz.
Figure 46. Dodecahedron radiation pattern for broadband and tonal sound; 0" was along a horizontal line radiating from the dodecahedron center.
96
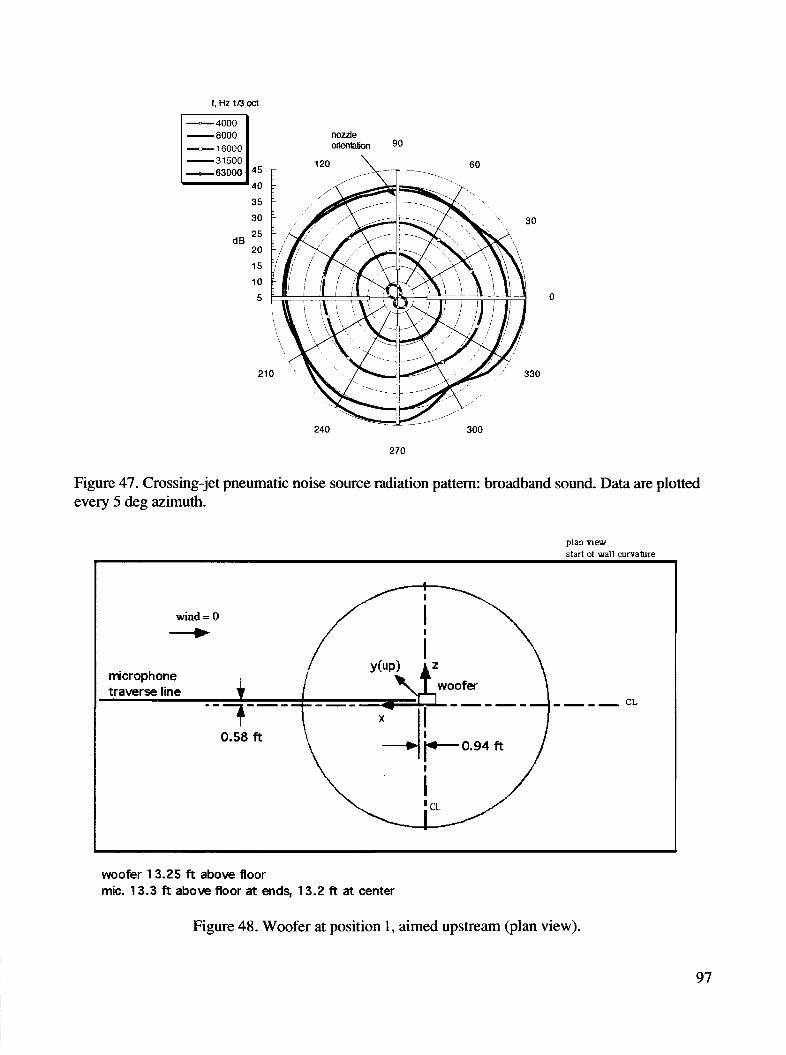
1,HzlBoct - 4000 - 8000 -- 16000 31500 ' -63000 45 40
35 30 25 20 15 10 5
dB
2
nozzle O r i e n t a h 90
120 \ 60
0
240 300
270
Figure 47. Crossing-jet pneumatic noise source radiation pattern: broadband sound. Data are plotted every 5 deg azimuth.
plan view start of wall curvature
1
wind = 0 + microphone traverse line
woofer 13.25 ft above floor mic. 13.3 ft above floor at ends, 13.2 ft at center
Figure 48. Woofer at position 1, aimed upstream (plan view).
97
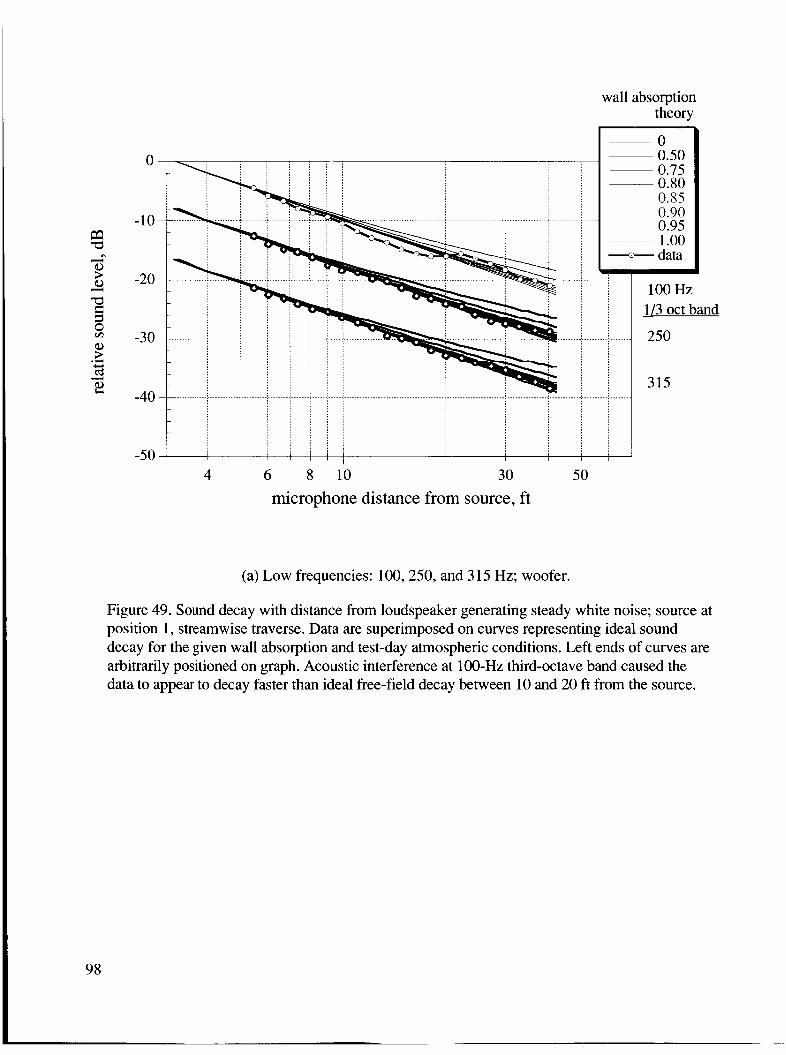
wall absorption theory
I\ -20 -_ ....................
- - -
-30 ...................
-40 ...... i ...........
-
-50 I
4 6
-
b ....
a ....
%
.....
.....
8 10 30 50
-
...
.......
.......
.......
-
I .....
.....
.....
-
100 Hz 1/3 oct band
250
315
microphone distance from source, ft
(a) Low frequencies: 100,250, and 3 15 Hz; woofer.
Figure 49. Sound decay with distance from loudspeaker generating steady white noise; source at position 1, streamwise traverse. Data are superimposed on curves representing ideal sound decay for the given wall absorption and test-day atmospheric conditions. Left ends of curves are arbitrarily positioned on graph. Acoustic interference at 1 00-Hz third-octave band caused the data to appear to decay faster than ideal free-field decay between 10 and 20 ft from the source.
98
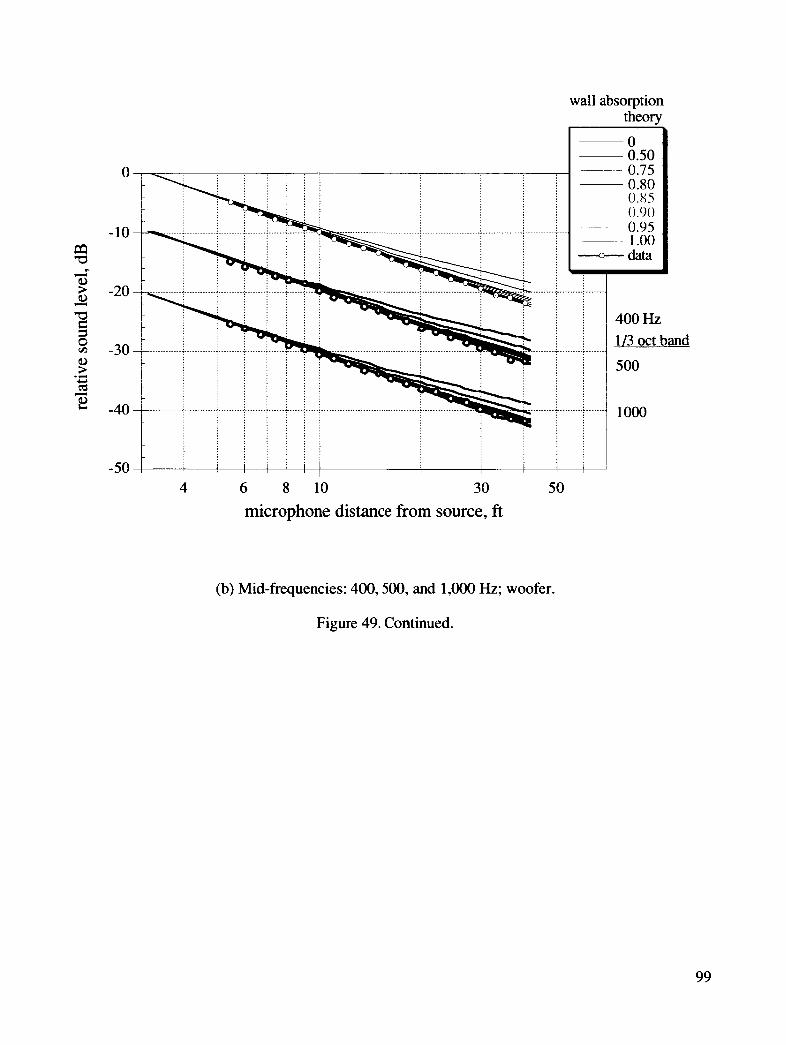
wall absorption theory
0
-10
-20
-30
-40
-50
......................... - ..
0 0.50
~ 0.75 0.80 0.85 0.90
- 0.95 ~ 1.00 - data
........ .. ................
A i * ......... i ......... i ......
......... ................
' 4 6 8 10 30 50
microphone distance from source, ft
400 Hz 1/3 oct band 500
1 000
(b) Mid-frequencies: 400,500, and 1,0oO Hz; woofer.
Figure 49. Continued.
99

wall absorption theorv
0
-10
-20
-30
-40
-50
...................................... -\ -
-- ....................... ~ .................
- -
-- ............ , ...........,. ....... ~ < . .
- - -
I I I
, . . , . . , . . , . .
, , . , . . I . . , . I , . . , . . , . . , . . ........ ~I .............................. , . . , . . , . . , . . , . . , . . , . . . . . , . . , . . , . . , . .
. . . , . . , . , , . . , . . . . .
-
....
- ...............
...............
....... ,. ......
_i_
1/3 oct band
2.5 kHz
5kHz
1 OkHz
4 6 8 10 30 50
microphone distance from source, ft
(c) Mid- to high-frequencies: 2.5, 5, and 10 kHz; dodecahedron near position 1 - (x, y, z: -0.60, -7.5, and 0.38 ft).
Figure 49. Continued.
1 00

wall absorption theory 0 0.50 0.75 0.80 0.85 0.90 0.95 1 .oo - data
-~~ ~~
- ~~~
0
-10
-20
-30
-40
-50
-
......... -. .................. -
-
- -- ..................................
-
-
.......... -. .................. -
-
I I I
4 6
-
b
y1
b
.....
.....
.....
.....
-
I . . . . I
.... - .......................................... \ ...............
8 10 30 50
-
.......
.......
.......
.......
I ...
...
...
- 1okHz 1/3 oct band
2 0 m
40kHz
microphone distance from source. ft
(d) High frequencies: 10,20, and 40 kHz; air jet near position 1 (x, y, z: -0.6, -7.5, and 0.4 ft).
Figure 49. Concluded.
101
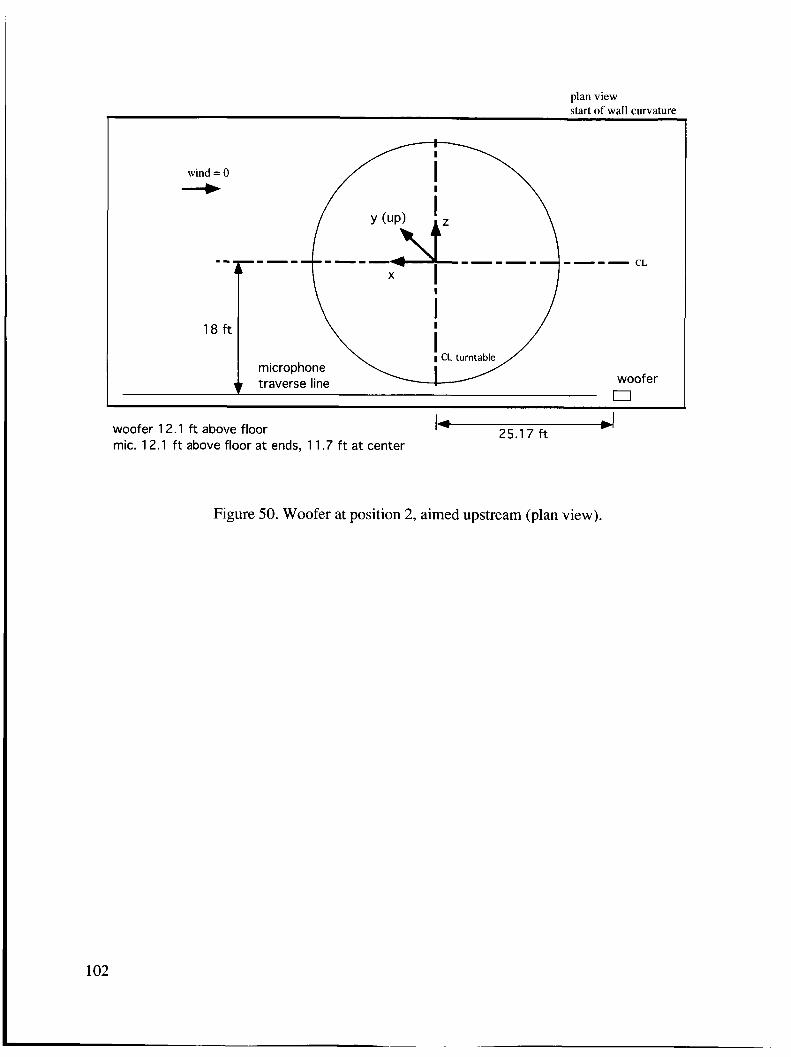
plan view start of wall curvature
wind = 0 4
I-.
18 f t / I CL turntable
woofer n
microphone traverse line
I U
25.1 7 f t woofer 12.1 f t above floor mic. 12.1 f t above floor a t ends, 1 1.7 f t a t center
I-
Figure 50. Woofer at position 2, aimed upstream (plan view).
102
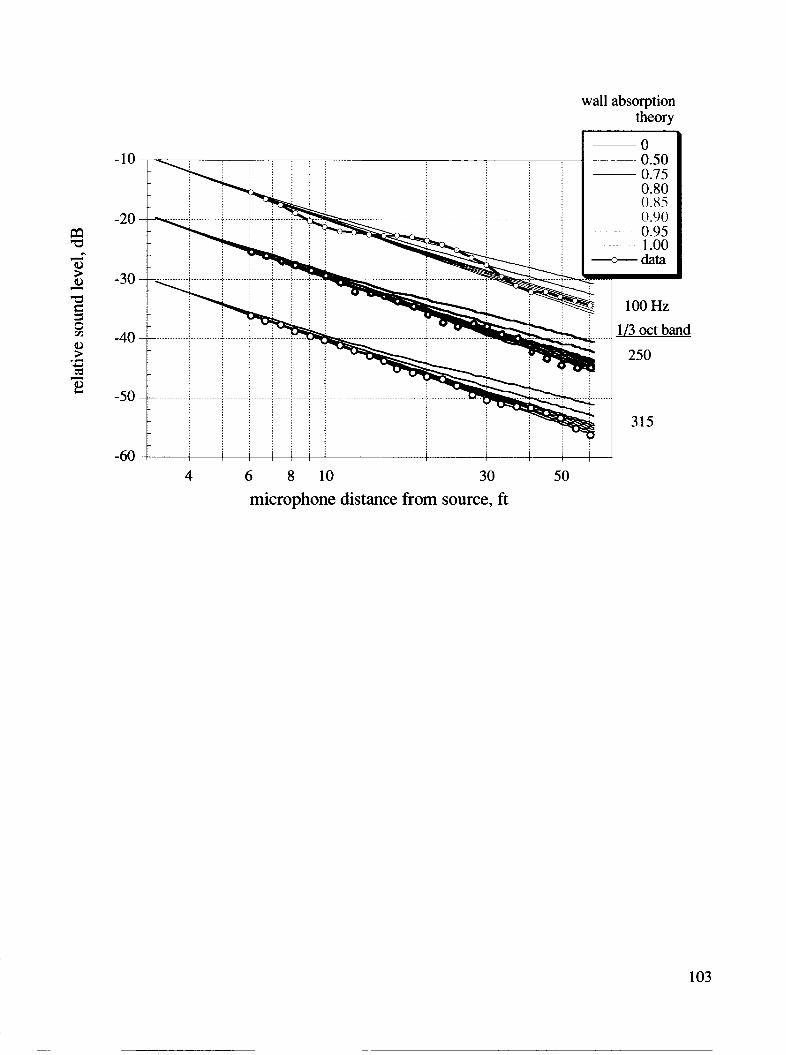
wall absorption theory
-lo i\- L
t
-40 f
4
-
\
......
\
......
\
......
......
-
% ....
br ....
h ....
....
6 8 10 30 microphone distance from source, ft
50
0 0.50 0.75 0.80 0.85 0.90 0.95 1 .oo - data
100 Hz 1/3 oct band
250
315
103

wall absorption theory
4 6
, , . , . , . I I I I I I
8 10 30 50
microphone distance from source, ft
400
113 oct band
500
1000
104

wall absorption theory
0 0.50 0.75 0.80 0.85 0.90 0.95 1 .oo - data
-~
-60 4
-
\
.......
\
.......
\
.......
.......
6
-
b .....
% .....
% .....
.....
_.
......
, I
30 microphone distance from source, ft
, 50
I ....
....
....
2500 Hz
1/3 oct band
5000
10000
(c) Mid- to high-frequencies: 2.5,5, and 10 kHz; dodecahedron 1 1.9 ft above floor (fig. 43).
Figure 5 1. Continued.
105

-10
-20
-30
-40
-50 4 6 8
--
--
--
--
-
Q
4
%
...
...
...
...
-
wall absorption theory
0.80 0.85 0.90
~ 0.95
Y ..;....... I 1/3 oct band
20kHz
1 40kHz I I I I I
10 30 50 microphone distance from source, ft
(d) High frequencies: 10, 20, and 40 kHz; air jet 11.9 ft above floor (fig. 44(b)).
Figure 5 I . Concluded.
plan view start of wall curvature
n woofer
microphone traverse line
CL turntable / woofer 12.1 ft above floor mic. 12.2 ft above floor a t ends, 12.1 ft at center
Figure 52. Woofer at position 3, aimed cross-stream (plan view).
- l ° F
c
............
......................... i -50 4 ............. j 1 1 -60
4
-
%
.......
* .......
ps .......
.......
-
6 8 10 30 microphone distance from source, ft
(a) Low frequencies: 100,250, and 315 Hz; woofer.
~
.........
..........
..........
......... - c
b
__
wall absorption theory
50
0 0.50 0.75 0.80 0.85 0.90
~ 0.95 1 .oo - data
~ _ _ _
~ ~ ~~
.......
.......
-
1 0 0 Hz 1/3 oct band 250
315
Figure 53. Sound decay with distance from loudspeaker generating steady-state white noise; source at position 3, cross-stream traverse. Data are superimposed on curves representing ideal sound decay for the given wall absorption and test-day atmospheric conditions. Left ends of curves are arbitrarily positioned on graph.
107

wall absorption theory
-30 ...........
-40 ...........
-50 ...........
-60
-+ ........
“q
“4
-
4
.......
.......
.......
__
~
........
........
........
........ - 4 6 8 10 30
microphone distance from source, ft 50
0.85 0.90 0.95 1 .oo - data
400 Hz
1/3 oct band
500
1000
(b) Mid-frequencies: 400, 500, and 1,000 Hz; woofer.
Figure 53. Continued.
108
0
-10 m a 2 a, 6 -20 m
a 5 ' -30 a, > cd .d c)
d ' -40
-50
-\ ...........................
__ ........................ -. .......
_ _ ............ ,_ .......... > ........
I I I I
4 6
-
% ....
9
%
....
....
...
-
............... .-
-
......
vall absorption theory
0 0.50 0.75 0.80 0.85 0.90
~ ~ ~~ 0.95 1 .oo - data
-~
I .....
.....
.....
-
2.5 kHz
113 oct band
5k&
1 om
microphone distance from source, ft
(c) Mid- to high-frequencies: 2.5,5, and 10 kHz; dodecahedron near position 3 (x, y, z: 0, -7.4, and 21.8 ft).
Figure 53. Continued.
109
wall absorption theory
0 0.50 0.75 0.80 0.85 0.90
~ 0.95 1 .oo
_it_ data ~~~
-10 --
-20 --
-30 --
-40 --
-50 4
-
4 % Y .......
.......
.......
.......
6
-
b * Y)
.....
.....
....
, . . , I . . , I , . . , . . , I .
, , . . , . , , . , , . , , . , , . , , . , . . , . I , . . , , . , , . . . , . I , . . , . . , . . , . . , . . , .
.......................................................
I l l
8 10
I I I
30 50
- .......
. . $
b
.......
5
5
.......
r
1/3 oct band
1 OkHZ
20kHz
40kHz
microphone distance from source, ft
(d) High frequencies: 10, 20, and 40 kHz; air-jet near position 3 (x, y, z: 0, -7.2, and 21.8 ft).
Figure 53. Concluded.
110
wall absorption theory
a c
d Q)
2 d
0
-10
-20
-30 4 6 8 10 30 50
microphone distance from source, ft
(a) 100-Hz tone; woofer.
Figure 54. Sound decay with distance from loudspeakers generating steady-state tones; source at position 1, streamwise traverse. Data are superimposed on curves representing ideal sound decay for the given wall absorption and test-day atmospheric conditions. The two curves at each absorption coefficient represent limits of ideal in-phase (+) and out-of-phase (-) interference of direct and reflected sound. Left ends of data curves are arbitrarily positioned on graph.
1 1 1
0-
-10 -
-20 ~
-30 -
............ ,. ..........
..........................
L 4
&$ $!$ ........,.. ...
................
i I
6 8
wall absorption theory
10 30 50
microphone distance from source, ft
(b) 250-Hz tone; woofer.
Figure 54. Continued.
112
0.00-+ 0.00-- O.SO-+ o.so--
~ 0.80-+ ~ ~ 0.80--
( 1.9 0-+ 0.90-- 0.95-+ 0.95-- 1 .oo-+ data
~~~
11
0
.. -10 b)
e 2
-30 4
-
% Q $ . . . . .. .
. . . . . . .
-
Q \ .. ... . . . .
. . . . . . . . . . . . .
6 8
-
. . . : 4 \ \
\
\
\
\ I \
wall absorption theory
10 30 50 microphone distance from source, ft
(c) 3 15-Hz tone; woofer.
Figure 54. Continued.
113
wall absorption theory
0 -
h
& -10 - d)
5 &
d) .H -20-
i2 c
-30 ~
...............
__t_
4
-
+ $ .......
.......
6 8 10 30 50 microphone distance from source, ft
0.00-+ 0.00-- o.so-+ o.so-- 0.80-+ 0.80-- 0.90-+ 0.90-- 0.9.5-+ 0.95--
~. .~ 1 .oo-+
~~~~~
data
(d) 400-Hz tone; woofer.
Figure 54. Continued.
114

wall absorption theory
-10 ;" ............
-30 L- 4
8 .........
6 8 10 30
microphone distance from source, ft
(e) 500-H~ tone; woofer.
Figure 54. Continued.
0.00-+ 0.00-- o.so-+
~ 0.50-- 0.80-+ 0.80-- 0.90-+ 0.90-- 0.95-+ 0.95-- 1 .oo-+ data
~ ~-
~-
__-
~~~
50
115
wall absorption theory
0.00-+ 0.00-- 0.50-+ 0.50-- 0.80-+ 0.80-- 0.90-+ 0.90-- 0.95-+ 0.95-- 1 .oo-+
c a a > a, a M
-30 I 4
-
$ $ .......
.......
6 8
-
. -. . \
r: \
\
\
\
10 30 50 microphone distance from source, ft
(0 1-kHz tone; woofer.
Figure 54. Continued.
data
116
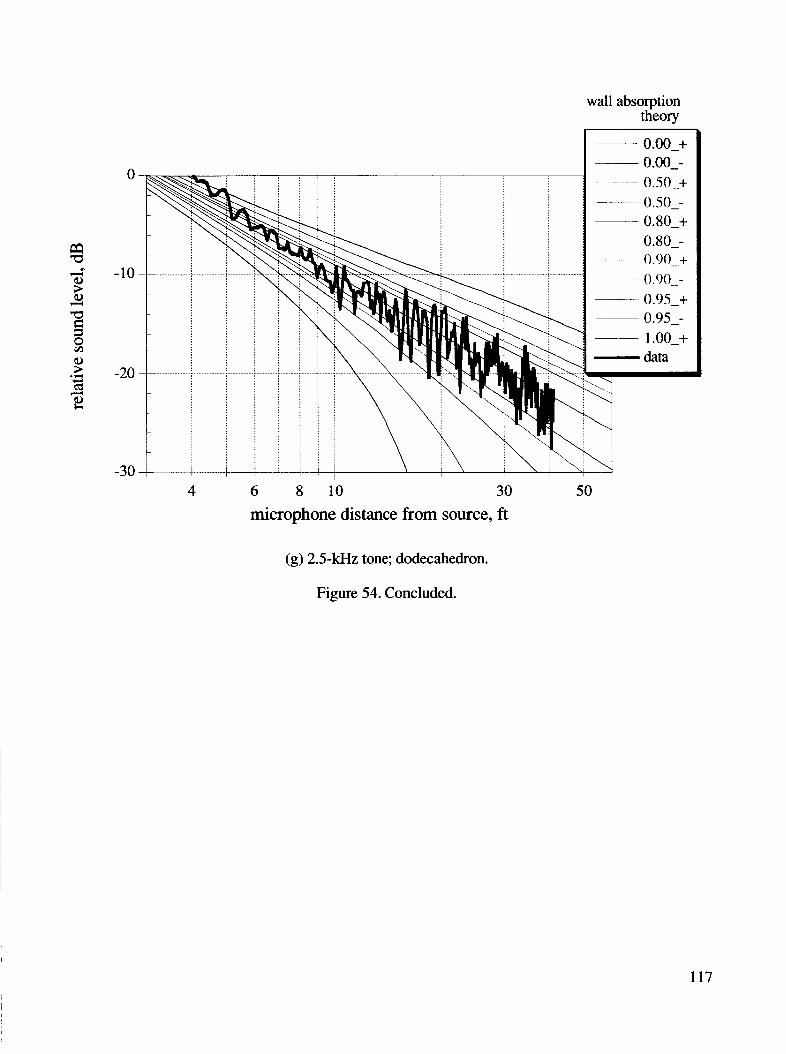
0
4- -10 6) > 6) 4
6)
rd .- > -20 4 4
-30
I ...........
........................
L 4
__
$ $ .......
.......
-
\
!i$g \ .........
............
+
wall absorption theory
6 8 10 30 50
microphone distance from source, ft
0.00-+ 0.00--
._ o.so-+ - -~~ o.so--
0.80-+ 0.80-- 0.90-+ 0.90-- 0.95-+ 0.9S-- 1 .oo-+ data
~-
~~ -~
(g) 2.5-kHz tone; dodecahedron.
Figure 54. Concluded.
117
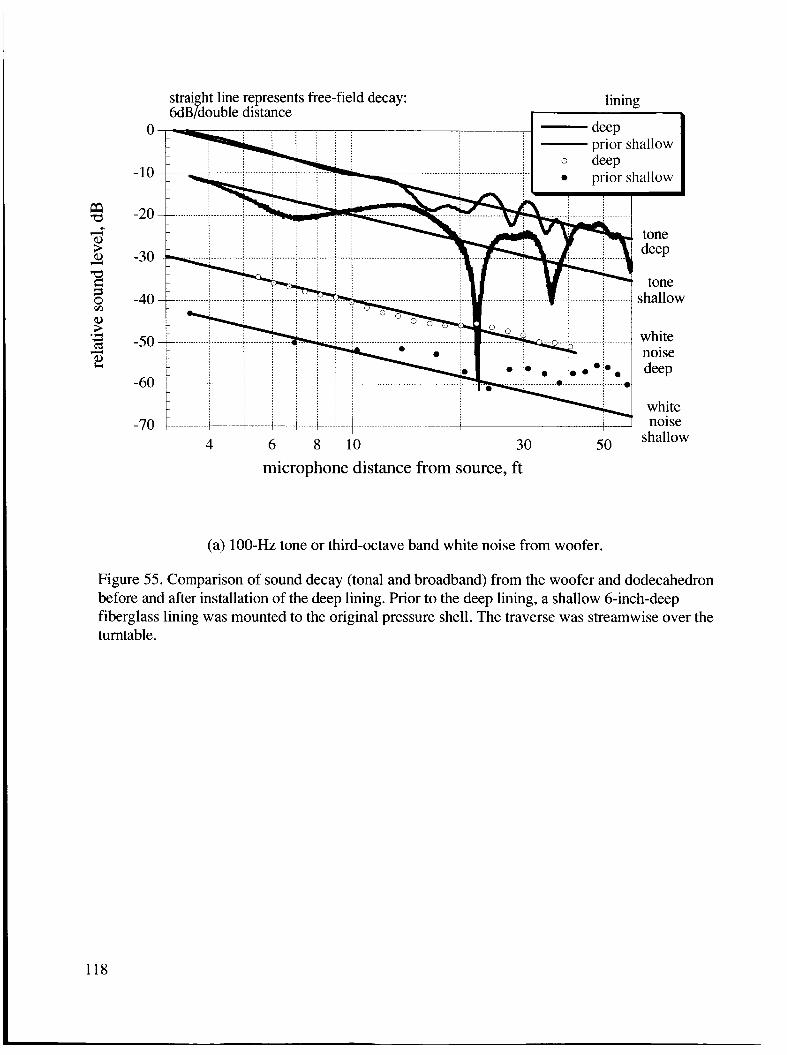
microphone distance from source, ft
(a) 100-Hz tone or third-octave band white noise from woofer.
Figure 55. Comparison of sound decay (tonal and broadband) from the woofer and dodecahedron before and after installation of the deep lining. Prior to the deep lining, a shallow 6-inch-deep fiberglass lining was mounted to the original pressure shell. The traverse was streamwise over the turntable.
118

0
-10
-20
-30
-40
-50
-60
-70
microphone distance from source, ft
(b) 4c@-Hz tone or third-octave band from woofer.
Figure 55. Continued.
119

lining
4 6 8 10 30 50 microphone distance from source, ft
c) I-ldIz tone or third-octave band from woofer.
Figure 55. Continued.

6 dB/double distance O dFP , . . . , . prior shallow , . . , , . . I . , , . , , . I , . L
0
. . .
- 3 0 1 ................................................... . . . .
. . I I . I I .
-40
-50
-60
-70
............................................. : ......................................................
4 6 8 10 30 50
microphone distance from source, ft
(d) 4-kHz third-octave band from dodecahedron (no tonal data available).
Figure 55. Concluded.
white noise
white noise
shallow
d=P
121
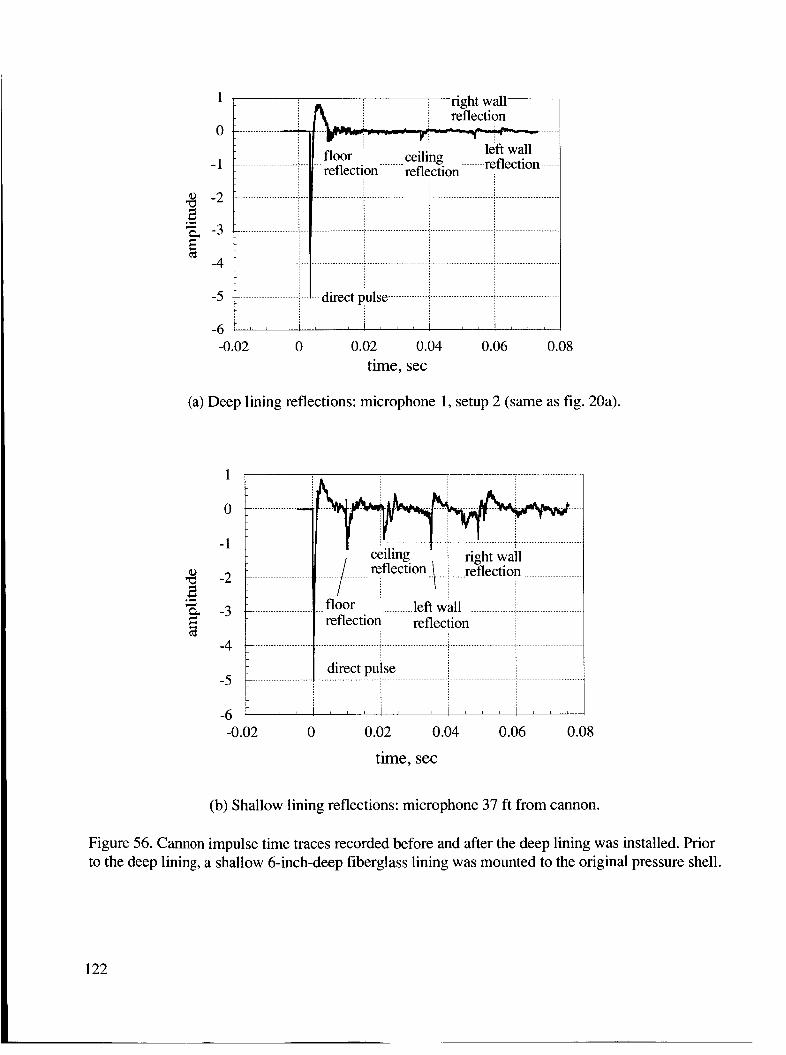
- -3 2
-4
.r(
-5
- 6 ;
(a) Deep lining reflections: microphone 1 , setup 2 (same as fig. 20a).
.L ...................... i... .................... i ........................ ; ........................ ; ......................
.: ...................... i... .................... I ................................................ i ......................
.- .............................. direct pulse ................................................................
1 ' ' I ' I ' ' ' " '
1 ,
-3
-4
-5
.................
......................... .......................
ceiling reflection ............. reflection ...................
~
right wail
.- ......................... floor ........... left wall reflection reflection
- ......................................................................... j ................................................
._ ....................... ~ ........................ + ......................... i ......................... i ....................... direct pulse
! , , ! ! 8 1 1 ! 1 1 1 ! 8 l I
(b) Shallow lining reflections: microphone 37 ft from cannon.
Figure 56. Cannon impulse time traces recorded before and after the deep lining was installed. Prior to the deep lining, a shallow 6-inch-deep fiberglass lining was mounted to the original pressure shell.
122
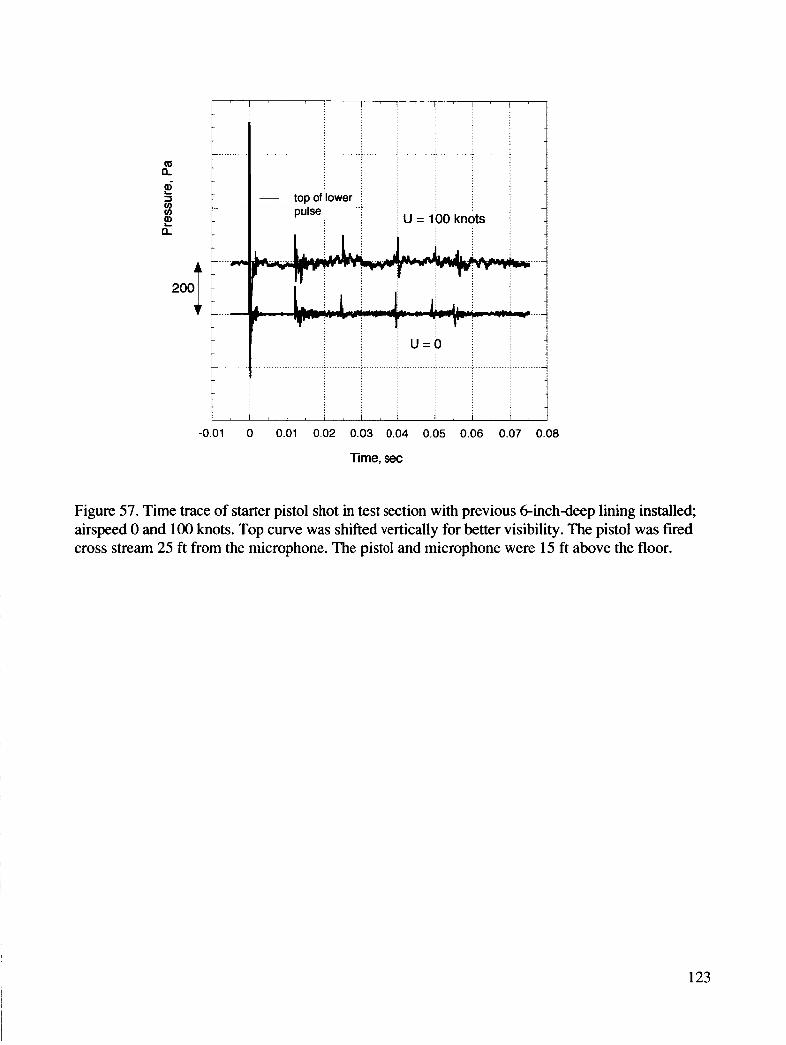
m a !c 3 u) u)
2? a U = 100 knots
-
I I I I I I I I I , 1 / 1 , 1 ,
-0.01 0 0.01 0.02 0.03 0.04 0.05 0.06 0.07 0.08
Time, sec
Figure 57. Time trace of starter pistol shot in test section with previous 6-inch-deep lining installed airspeed 0 and 1 0 0 knots. Top curve was shifted vertically for better visibility. The pistol was fired cross stream 25 ft from the microphone. The pistol and microphone were 15 ft above the floor.
123

..................................................................................................................
........................................ : ..................
..................................... ..~. ................
.............
i ceiling i reflection - - - - -
.- ................. i ..... refledion .......... i ................... 1 ........
-0.01 0 0.01 0.02 0.03 0.04 0.05 time, sec
Figure 58. Time trace of starter pistol shot in the test section with the new deep lining installed; airspeed 0 knots. The pistol was fired near the cannon muzzle indicated in setup 2, figure 17. The data were captured cross-stream at microphone 2. The amplitude was normalized to give the same direct-pulse amplitude at zero time as shown in figure 57, wind off.
124
125

I I
17. SECURITY CLASSIFICATION 18. SECURITY CLASSIFICATION 19. SECURITY CLASSIFICATION OF REPORT OF THIS PAGE OF ABSTRACT
Unclassified Unclassified Unclassified
REPORT DOCUMENTATION PAGE
20. LIMITATION OF ABSTRAC'
Form Approved OM6 NO. 0704-0788
I 'ublic reporting burden for this COlleCtiOn of information is estimated to average 1 hour Per response. including the time for reviewing instructions, searching existing data sources, lathering and maintaining the data needed. and completing and reviewing the COlleCtiOn Of InfOrmatiOn. Send comments regarding this burden estimate or any other aspect of this :ollection of information. including suggestions for reducing this burden, to Washington Headquarters Services. Directorate for information Operations and Reports, 1215 Jefferson )avis Hlghway, Suite 1204, Arlington, VA 22202-4302, and to the Office of Management and Budget. Paperwork Reduction Project (0;.04-0188), Washington, DC 20503.
. AGENCY USE ONLY (Leave blank) 12. REPORT DATE I 3. REPORT TYPE AND DATES COVERED I November 2002 I Technical Publication I .
. TITLE AND SUBTITLE
Acoustic Quality of the 40- by 80- Foot Wind Tunnel Test Section After Installation of a Deep Acoustic Lining
8 . AUTHOR(S)
Paul T. Soderman, Stephen M. Jaeger':', Julie A. Hayes?, and Christopher S. Allen
I. PERFORMING ORGANIZATION NAME(S) AND ADDRESS(ES)
Ames Research Center, Moffett Field, CA 94035-1000 ; '::AerospaceCoinputing, Inc., Ames Research Center, Moffett Field, CA 94035; TSignalscape, Raleigh, NC 27606
I. SPONSORlNG/MONlTORlNG AGENCY NAME(S) AND ADDRESS(ES)
National Aeronautics and Space Administration Washington, DC 20546-000 1
5. FUNDING NUMBERS
5 19-20-32
8. PERFORMING ORGANIZATION REPORT NUMBER
A-0208 162
10. SPONSORlNG/MONlTORlNG AGENCY REPORT NUMBER
NASA/TP-2002-2 1 185 1
1. SUPPLEMENTARY NOTES Point of Contact: Paul T. Soderman, Ames Research Center, MS 247-2, Moffett Field, CA 94035-1000
(650) 604-6675
2a. DlSTRlBUTlON/AVAlLABILITY STATEMENT 12b. DISTRIBUTION CODE
Unclassified - Unlimited Subject Category 09 Distribution: Standard Availability: NASA CAS1 (301) 621-0390
13. ABSTRACT (Maximum 200 words)
A recessed, 42-inch deep acoustic lining has been designed and installed in the 40- by 80- Foot Wind Tunnel (40x80) test section to greatly improve the acoustic quality of the facility. This report describes the test section acoustic performance as determined by a detailed static calibration-a11 data were acquired without wind. Global measurements of sound decay from steady noise sources showed that the facility is suitable for acoustic studies of jet noise or similar randomly generated sound. The wall sound absorption, size of the facility, and averaging effects of wide band random noise all tend to minimize interference effects from wall reflections. The decay of white noise with distance was close to free field above 250 Hz. However, tonal sound data from propellers and fans, for example, will have an ei-ror band to be described that is caused by the sensitivity of tones to even weak interference. That error band could be minimized by use of directional instruments such as phased microphone aimys. Above 10 kHz, air absorption began to dominate the sound field in the large test section, reflections became weaker, and the test section tended toward an anechoic environment as frequency increased.
14. SUBJECT TERMS 115. NUMBER OF PAGES
Aeroacoustics, Wind tunnel acoustics, Duct lining F 16. PRICE CODE