paul zuckerman fletcher building - steel division · paul zuckerman fletcher building - steel...
TRANSCRIPT

FBL Steel Division – September 20081
CREATING OPPORTUNITIES IN CHALLENGING TIMES- A New Zealand Perspective
Paul ZuckermanFletcher Building - Steel Division

FBL Steel Division – September 2008
Disclaimer
This presentation contains not only a review of operations, butalso some forward looking statements about Fletcher Building andthe environment in which the company operates. Because thesestatements are forward looking, Fletcher Building’s actual resultscould differ materially. Media releases, management commentaryand analysts presentations, including those relating to theJune 2008 full year results, are all available on thecompany’s website and contain additional information aboutmatters which could cause Fletcher Building’s performance todiffer from any forward looking statements in this presentation.Please read this presentation in the wider context of materialpreviously published by Fletcher Building.

FBL Steel Division – September 2008
Can we apply learnings from NZ across into Australia?

FBL Steel Division – September 20083
Key Topics to be Discussed
• New Zealand is already in a recession and facing a downturn in traditional steel consuming markets. Where is Australia heading?
• Opportunities exist for building suppliers to shift their focus to segments where investment remains strong.
• A number of market factors are in flux, creating challenges and opportunities.

FBL Steel Division – September 20084
NZ steel consumption has risen steadily
MAIN SEGMENTS
• Residential Construction
• Commercial/Industrial
• Manufacturing Sector
• Heavy Buildings
• Infrastructure and Engineering
• Rural and Specialty
0
200,000
400,000
600,000
800,000
1,000,000
1,200,000
1993 1994 1995 1996 1997 1998 1999 2000 2001 2002 2003 2004 2005 2006 2007
Cons
umpt
ion
(tonn
es)
4,000
6,000
8,000
10,000
12,000
14,000
16,000
18,000
20,000
(GFC
F $m
)
NZ Consumption (tonnes) Total Real Gross Fixed Capital Formation (annual running total $m)

FBL Steel Division – September 20085
A brief history of steelmaking in New Zealand
Pacific Steel Group, Auckland - EAF
• Ingot casting started in 1962. 3 strand ROKOP concaster installed 1979
• Wire mill operations also commenced in 1962 as GKN
• 2nd hand Lamberton cross-country rolling mill installed 1962
• New Krupp 50 tonne EAF installed 1972
• Price control removed 1985, but briefly continued for NZS
• 42% owned by NZ Steel in 1986, who then supplied some billet
• Sims scrap JV commenced December 1992 on adjacent site with the existing Fletcher shredder
• New Danieli rod & bar mill installed 1997
New Zealand Steel, Glenbrook – Integrated Steelworks
• Commenced in 1968 processing imported coil on a galvanising line
• Pioneering ironsand based steel making facilities added in the 1970’s
• Owned by the NZ government in 1980’s
• 110MW cogeneration capacity added in 1998
• In the 1990’s, BHP takes control of the facility
• Now positioned to realise its competitive advantage based on its unique process under BSL ownership.
Fletcher Steel Engineering Company , Wellington, 1965. View looking west toward airport and city. Quarantine facility is on Somes Island in centre

FBL Steel Division – September 20086
The NZ residential market is roughly the size of WA
• Housing activity is currently depressed (around 20,000 starts) with modest price declines
• Pressed and stone coated steel tiles service 1/4 of the roofing market
• Sector revenue is estimated at ~NZ$180m
• Estimated 30,000 steel tonnes
• Many rollformers, 3 with national presence
• Concrete tiles are a less significant roofing product in New Zealand than in Australia.
Longrun Steel39%
Tile Steel25%
Concrete24%
Other12%

FBL Steel Division – September 20087
A forecast drop in residential activity is becoming reality
0
5,000
10,000
15,000
20,000
25,000
30,000
35,000
F83 F84 F85 F86 F87 F88 F89 F90 F91 F92 F93 F94 F95 F96 F97 F98 F99 F00 F01 F02 F03 F04 F05 F06 F07 F08 F09 F10 F11 F12 F13-10
-5
0
5
10
15
20
25
30
Consents (LH scale)
Nominal House Price % Change (RH scale)
Forecast
Source: Infometrics
New Zealand’s first State House at Miramar in Wellington. Built by the Fletcher Construction Company in 1937.
New house built by Fletcher Residential in Auckland, 2007

FBL Steel Division – September 20088
• Very strong steel share
• Membranes are more significant than in the residential sector
• Sector revenue is estimated at ~NZ$220m
• Estimated 75,000 steel tonnes
Delegat's winery, Blenheim
Tile Steel4%
Concrete4%
Other12%
Longrun Steel Roofing
80%
The NZ commercial & industrial building market

FBL Steel Division – September 20089
Commercial building activity is forecast to soften as well
Source: Infometrics
Non-residential activity at 1995 - 96 prices. Gross fixed capital formation ($m)
2,000
2,500
3,000
3,500
4,000
4,500
5,000
Mar
Jun
Sep
Dec
Mar
Jun
Sep
Dec
Mar
Jun
Sep
Dec
Mar
Jun
Sep
Dec
Mar
Jun
Sep
Dec
Mar
Jun
Sep
Dec
Mar
Jun
Sep
Dec
Mar
Jun
Sep
Dec
Mar
Jun
Sep
Dec
Mar
Jun
Sep
Dec
Mar
Jun
Sep
Dec
Mar
Jun
Sep
Dec
Mar
Jun
Sep
Dec
Mar
00 01 02 03 04 05 06 07 08 09 10 11 12 13
Forecast
Installing steel plant cladding at Pacific Steelin 1962. This building housed ingot castinguntil 1979.
88 metre long Dimond sheets, Palmerston North 2008.

FBL Steel Division – September 200810
Manufacturing has moved off shore and spending is down
-2%
-1%
0%
1%
2%
3%
4%
5%
6%
7%
88 89 90 91 92 93 94 95 96 97 98 99 00 01 02 03 04 05 06 07 08 09 10 11 12
Perc
ent
0.00
0.10
0.20
0.30
0.40
0.50
0.60
0.70
0.80
0.90
US$
FX
Real GDP Change March Year (precent) US$:NZ$ Exchange Rate
Forecast
Source: Infometrics
• GDP and FX rate are fundamental drivers.
• Circa 300,000 tonnes are consumed: flat, merchant, special steels, etc
• There has been some migration of manufacturing to non-OECD countries. An example is Fisher and Paykel to Thailand
• A slump in profitability heralds a potential sharp pull-back in capex

FBL Steel Division – September 200811
Heavy construction projects continue to hold up the market
• GDP growth went into negative territory in Q1 2008, but genuine recession likely began in Q2
• Circa 300,000 tonnes consumption p.a., principally reinforcing, merchant bar, structural sections, and beams
• Stadia: Rugby World Cup in 2011: Eden Park, AMI Christchurch, Carisbrook Dunedin
• Solid backlog of private and Government work - hospitals, education, prisons, etc.
Activity at 1995-1996 prices. Gross fixed capital formation ($m)
2,000
2,500
3,000
3,500
4,000
4,500
5,000
Mar
Jun
Sep
Dec Mar
Jun
Sep
Dec Mar
Jun
Sep
Dec Mar
Jun
Sep
Dec Mar
Jun
Sep
Dec Mar
Jun
Sep
Dec Mar
Jun
Sep
Dec Mar
Jun
Sep
Dec Mar
Jun
Sep
Dec Mar
Jun
Sep
Dec Mar
Jun
Sep
Dec Mar
Jun
Sep
Dec Mar
Jun
Sep
Dec Mar
00 01 02 03 04 05 06 07 08 09 10 11 12 13
Non Residential
All Other Non Residential
Forecast
Wellington HospitalAuckland Hospital extension

FBL Steel Division – September 2008
Large scale infrastructure and engineering projects continue
• Fueled by government spending
• Significant participants are Downer, Fletchers, Mainzeal, and Multiplex
• Serviced by large regional fabricators
• Steel usage of 150,000+ tonnes per annum
• Upgrades to Transportation -Manukau harbour crossing, New Lynn railway, Waterview trench, Tauranga Harbour link, Victoria Park
• Development of Power Generation –Windfarms and geothermal
• Resource Movement – Water, Oil and Natural Gas infrastructure
FBL Steel Division – September 200813
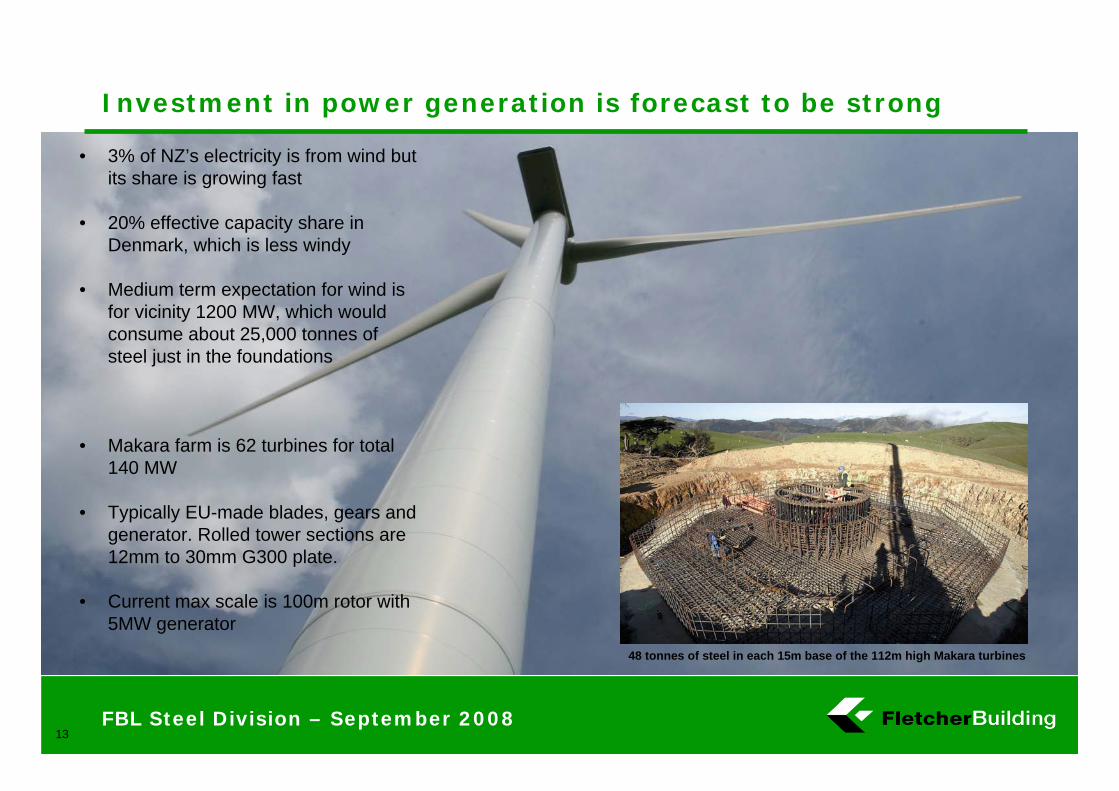
Investment in power generation is forecast to be strong
48 tonnes of steel in each 15m base of the 112m high Makara turbines
• 3% of NZ’s electricity is from wind but its share is growing fast
• 20% effective capacity share in Denmark, which is less windy
• Medium term expectation for wind is for vicinity 1200 MW, which would consume about 25,000 tonnes of steel just in the foundations
• Makara farm is 62 turbines for total 140 MW
• Typically EU-made blades, gears and generator. Rolled tower sections are 12mm to 30mm G300 plate.
• Current max scale is 100m rotor with 5MW generator

FBL Steel Division – September 200814
Commodity prices have risen sharply, generating wealth
80
100
120
140
160
180
200
220
240
Jan-8
6Ja
n-87
Jan-8
8Ja
n-89
Jan-9
0Ja
n-91
Jan-9
2Ja
n-93
Jan-9
4Ja
n-95
Jan-9
6Ja
n-97
Jan-9
8Ja
n-99
Jan-0
0Ja
n-01
Jan-0
2Ja
n-03
Jan-0
4Ja
n-05
Jan-0
6Ja
n-07
Jan-0
8
Average NZ commodity price converted to NZD
Average world price of NZ commodities
World prices Last 12 mths, Total +11.6% yoy(Aluminium 11%, Meat/Skins +19%, Dairy +2%, Horticulture 4%, Forestry -12%, Seafood +25%)

FBL Steel Division – September 200815
Dairy farming and exports have “milked” large profits
Source: Infometrics
0
100
200
300
400
500
600
700
800
1984
1985
1986
1987
1988
1989
1990
1991
1992
1993
1994
1995
1996
1997
1998
1999
2000
2001
2002
2003
2004
2005
2006
2007
2008
2009
2010
2011
2012
Milk Solid Price (c/kg) - May years (MAF forecast) Manufactured Cow Price (c/kg) - June years (MAF forecast)
• Sound fundamentals in rural commodities over the last few years with a strong outlook. NZ has comparative advantage in rural, and declining NZD is an added boost
• Significant investment in dairy production. It contributes NZ$10b in export receipts.
• In Southland, dairy farm profit before tax increased six-fold in 2007/08.
• Average farm has $1.5m gross income and $460k surplus from 195k kg of solids.

FBL Steel Division – September 200816
New Zealand’s ETS is likely to become reality
• NZ ratified the Kyoto Protocol in Dec 2002. Its emissions in 2008 to 2012 to be no more than five times its 1990 emission level
• NZ is 73 mt of CO2 equivalents for 0.2% of world. (Australia is 491 mt for 1.5%). New Zealand will need to purchase between 20 and 40 mt to meet its Protocol commitments.
• A disproportionately large share of emissions relate to agriculture (50% compared to 7% on average internationally)
• Corollary is a disproportionately small amount of emissions coming from energy (23% relative to 63% internationally)
• Target for Pacific Steel to match 2005 baseline emissions by 2011
• Measures may change with government, helping or hurting NZ based suppliers

FBL Steel Division – September 200817
Green Star New Zealand
• Star ratings similar to those in Australia are gaining a foot-hold, but are not formally part of the new Building Code.
• While only 8 of the 130 credits relate to steel, there needs to be focus on steel if one seeks 5 or 6 star ratings.
• Rather than telling people exactly how to build or construct, the New Zealand Building Code is performance-based, and sets out objectives to be achieved.
• Ratings will impact rental rates and building value to current and future owners.
• Emerging awareness in central government of the good sense in making steel locally for local consumption – carbon footprint, transport inefficiencies, standards, back-up
• But we may expect an impact on the way we package and label steel to identify mill origin (i.e. distance travelled) and production route (i.e. the embodied energy level).
Club Tower - 5 Star Green Star Rated Building currently being built in Christchurch by Hawkins Construction on the site adjoining the Canterbury Club on Worcester Boulevard.

FBL Steel Division – September 200818
Beyond our control but must be monitored…
• Kiwi/USD and AUD/USD exchange rates
• Banking/credit crisis
• Change in government policy toward spending
• Global steel demand as US and EU consume less
• Iron ore/scrap costs and output pricing
• Ocean freight rates0.3
0.4
0.5
0.6
0.7
0.8
0.9
Jan-
91
Jul-9
1
Jan-
92
Jul-9
2
Jan-
93
Jul-9
3
Jan-
94
Jul-9
4
Jan-
95
Jul-9
5
Jan-
96
Jul-9
6
Jan-
97
Jul-9
7
Jan-
98
Jul-9
8
Jan-
99
Jul-9
9
Jan-
00
Jul-0
0
Jan-
01
Jul-0
1
Jan-
02
Jul-0
2
Jan-
03
Jul-0
3
Jan-
04
Jul-0
4
Jan-
05
Jul-0
5
Jan-
06
Jul-0
6
Jan-
07
Jul-0
7
Jan-
08
Jul-0
8
NZ$
:US$
NZD USD Exchange Rate 1991-2008

FBL Steel Division – September 2008
There will always be challenges and change
• While steel consumption has generally risen, the mix changes over time
• Tight global supply has proven the value of local service
• Traditional residential and commercial markets are at risk
• Economic conditions and policy change will shift the market
• Scan the horizon to locate pockets of liquidity and spending