pavement & geotechnical design guide july 2014 · pavement & geotechnical design guide ....
TRANSCRIPT

Pavement & Geotechnical Design Guide July 2014
Prepared by the Pavement and Geotechnical Division.

Updated 11/23/2011
Forward
There are many different approaches that are used in the pavement industry to perform pavement and pavement-related geotechnical engineering functions for new roadways and the preservation/rehabilitation of existing roadways. The majority of these existing approaches are based on experience of the individuals performing those duties. There are very limited documented sources of information for performing production-level pavement engineering functions. In the few documented sources, the information is typically not presented in a procedural manner and there is an expectation from the author that the reader is an experienced and knowledgeable pavement engineer. This Pavement & Geotechnical Design Guide was written for Maryland State Highway Administration (MDSHA) pavement and geotechnical engineers in order to address these challenges. This guide provides MDSHA pavement engineers with a process to evaluate the condition of the pavement system to fulfill pavement and geotechnical design requirements. The policies and procedures included in the guide are written to achieve MDSHA Business Plan goals. This guide can also be used by private industry engineers as a reference in performing pavement engineering functions and it is a standard that shall be used when performing work for any MDSHA project. This guide is the standard that Design-Builders shall be held to in the development of new pavement design sections and preservation/ rehabilitation of existing pavement sections on Design–Build projects. All of the position titles described throughout this guide are referenced to MDSHA positions and roles. Private industry engineers may have different position titles. For that reason, a current organizational chart for the engineering functions of MDSHA is in the Introduction and Background of this guide to assist private engineers with understanding the MDSHA structure. MDSHA pavement and geotechnical engineering functions are performed by engineers in the Pavement and Geotechnical Division of the Office of Materials Technology (OMT). The senior and design engineers in that Division perform the majority of the production pavement and routine pavement-related geotechnical design work for MDSHA. The design Team Leader and Assistant Division Chief positions are responsible for the quality and timeliness of all of the pavement engineering functions for the Division. Other field data collection divisions in OMT support the design efforts of the Pavement and Geotechnical Division. Any questions or comments concerning this guide should be directed to: Paulo DeSousa, P.E. Pavement and Geotechnical Assistant Division Chief Maryland State Highway Administration Office of Materials Technology 7450 Traffic Drive Hanover, MD 21076 Phone: 443-572-5061 Fax: 410-787-0486 E-mail: [email protected]

Updated 07/11/2014
Table of Contents
1 Overview ........................................................................................................... 1-2 1.01 Introduction and Background ....................................................................................................... 1-2 1.02 MDSHA Pavement Design Overview ........................................................................................... 1-8
2 Preliminary Procedures ................................................................................... 2-1 2.01 Initial Communication with Requesting Office .............................................................................. 2-1 2.02 Files ............................................................................................................................................. 2-3 2.03 Records Review ........................................................................................................................... 2-5 2.04 OMT Internal Meetings (OMT PI) ................................................................................................. 2-7 2.05 Site Reconnaissance ................................................................................................................. 2-10 2.06 Preliminary Engineering Cost Estimate ...................................................................................... 2-12 2.07 Meeting Attendance– Project Team Meetings ........................................................................... 2-15 2.08 Initial Treatment Identification – Pavement Preservation Guide ................................................ 2-17 2.09 Supplemental Treatment Information ......................................................................................... 2-34 2.10 Discussion/Selection Alternative with Project Owner ................................................................. 2-59
3 Testing & Data Collection ................................................................................ 3-1 3.01 Required Pavement Testing Guidelines ....................................................................................... 3-1 3.02 Visual Pavement Condition Assessment ..................................................................................... 3-4 3.03 Patching Survey ........................................................................................................................... 3-6 3.04 Falling Weight Deflectometer (FWD) Testing ............................................................................... 3-7 3.05 Requests for Pavement Field Work ........................................................................................... 3-19 3.06 Requests For Geotechnical Field work ...................................................................................... 3-22 3.07 Requests for Lab Work .............................................................................................................. 3-37
4 Materials and Typical Design Properties ........................................................ 4-1 4.01 Material Description ..................................................................................................................... 4-1 4.02 Material Properties – General/Definitions .................................................................................... 4-3 4.03 Material Properties – Asphalt ....................................................................................................... 4-6 4.04 Material Properties – Concrete .................................................................................................... 4-9 4.05 Material Properties – Unbound Layers ....................................................................................... 4-12 4.06 Geotechnical Design Properties ................................................................................................ 4-19 4.07 Design Properties for Pavement Materials – AASHTO 1993 ..................................................... 4-20
5 Analysis Procedures ........................................................................................ 5-1 5.01 Traffic Analysis............................................................................................................................. 5-1 5.02 FWD Data Analysis Procedure .................................................................................................... 5-6 5.03 Processing Boring/Laboratory Data ........................................................................................... 5-14 5.04 Geotechnical Data Analysis ....................................................................................................... 5-18 5.05 Pavement Mechanistic-Empirical Analysis ................................................................................. 5-24
6 Pavement Preservation, Rehabilitation & Design .......................................... 6-1 6.01 Design Input Policies ................................................................................................................... 6-1 6.02 Material Selection Policies ......................................................................................................... 6-11 6.03 New Pavement Design .............................................................................................................. 6-28 6.04 Pavement Drainage ................................................................................................................... 6-32 6.05 Pre-Overlay Repair Guidelines .................................................................................................. 6-39 6.06 Pavement Preservation & Rehabilitation Design ....................................................................... 6-46 6.07 Quantity & Cost Development .................................................................................................... 6-52 6.08 Remaining Service Life Analysis ................................................................................................ 6-53 6.09 Pavement Type Selection .......................................................................................................... 6-55 6.10 Standard Pavement Designs ..................................................................................................... 6-56
7 Geotechnical Design ........................................................................................ 7-1 7.01 Earthwork (Excavation) ................................................................................................................ 7-1 7.02 Slopes ........................................................................................................................................ 7-10 7.03 Embankments ............................................................................................................................ 7-11 7.04 Subgrades ................................................................................................................................. 7-14 7.05 Retaining Walls .......................................................................................................................... 7-25 7.06 Stormwater Management ........................................................................................................... 7-26 7.07 Miscellaneous (UST, Karst, Geotextiles, etc.) ............................................................................ 7-27 7.08 Subsurface Drainage ................................................................................................................. 7-32

Updated 07/11/2014
8 Deliverables and Report .................................................................................. 8-1 8.01 Preliminary Pavement Recommendation ..................................................................................... 8-1 8.02 Advanced Geotechnical Report ................................................................................................... 8-3 8.03 Final Pavement & Geotechnical Report ....................................................................................... 8-5 8.04 Topsoil Memo .............................................................................................................................. 8-6 8.05 Plans, IFB, and Estimate Comments ........................................................................................... 8-7 8.06 Other Reports ............................................................................................................................ 8-12 8.07 Construction and Material Specifications ................................................................................... 8-14 8.08 Management Review & QA ........................................................................................................ 8-22
9 Appendices ....................................................................................................... 9-1 9.01 Glossary ....................................................................................................................................... 9-1 9.02 Geotechnical Investigation Equipment ....................................................................................... 9-15 9.03 Laboratory Testing Procedures .................................................................................................. 9-16 9.04 Geotechnical Instrumentation .................................................................................................... 9-17 9.05 Forms, Spreadsheets & Reference Guidelines .......................................................................... 9-18 9.06 Example Memos ........................................................................................................................ 9-20 9.07 Electronic File Storage ............................................................................................................... 9-21 9.08 Paper Files and Plan Storage .................................................................................................... 9-22 9.09 Contractor Requests .................................................................................................................. 9-24 9.10 Unit Costs .................................................................................................................................. 9-25 9.11 FWD Data Analysis Background ................................................................................................ 9-26 9.12 New Pavement Design Using AASHTO 1993 ............................................................................ 9-44 9.13 Pavement Preservation and Rehabilitation Design Using AASHTO 1993 ................................. 9-48 9.14 References ................................................................................................................................ 9-57
Overview
Section 01: Introduction and Background
Updated 12/05/2012 Return to Table of Contents
1-2
1 OVERVIEW
1.01 INTRODUCTION AND BACKGROUND This Maryland State Highway Administration (MDSHA) Pavement & Geotechnical Design Guide provides a comprehensive set of procedures and policies to assist the pavement and geotechnical engineer (also referred to in this document as “pavement engineer”) in developing recommendations for new construction and pavement preservation/ rehabilitation projects. The audience this pavement and geotechnical design guide was written for should have a basic background and general understanding of pavement engineering. The purpose of this document is to provide Maryland State Highway pavement engineers a guideline to developing pavement recommendations that are consistent and accurate. The goal of this document is to supply pavement engineers the guidance to have the ability to provide pavement recommendations that are based on the most effective engineering design considering cost to MDSHA, practicality of construction, and benefit in terms of service life provided to the MDSHA pavement network. Materials contained in the Guide are meant to be useful for both the training of new employees and as a reference to be utilized as needed throughout the course of work. This is a resource document. It is not intended to override or replace the necessary use of good judgment, common sense and research of current best practices. The MDSHA Pavement & Geotechnical Design Guide has several particular sections of interest. Briefly:
The section on Preliminary Procedures contains information on what to do when an initial project request is received.
The section on Testing & Data Collection provides guidance on testing requirements and pavement/geotechnical data collection.
Analysis Procedures provides the steps to analyze pavement/geotechnical data.
The largest section, Pavement Preservation, Rehabilitation & Design, contains all of the design procedures, including, new and rehabilitation pavement designs.
The section on Geotechnical Design provides relevant routine geotechnical design information.
The Deliverables and Report section ties all of the analysis and design together to ensure design recommendations are properly transferred to construction contracts; and
Several Appendices are provided as reference. All of these sections are needed for developing pavement preservation/rehabilitation recommendations and new pavement design sections for any MDSHA pavement construction project. MDSHA is currently responsible for approximately 17,000 lane-miles of roadway. Approximately 62% of the pavement network is comprised of flexible pavements, 36% are composite pavements, and less than 2% are rigid pavements. A large portion of the pavement roadway network of MDSHA has a significant traffic volume. The

Overview
Section 01: Introduction and Background
Updated 12/05/2012 Return to Table of Contents
1-3
environmental and geological regions of Maryland lend themselves to a wide range of agricultural and industrial commerce. Maryland has three distinct regions that have different traffic and geology/soil conditions. The eastern shore of Maryland is dominated with agricultural-based commerce and traffic. The soil conditions on the eastern shore are dominated by sandy soils. The central portion of Maryland is strongly metropolitan in business with a high percentage of industrial type traffic motivated by the water ports. This central portion of Maryland is a piedmont area dominated by silty clays, clays, and micaceous silts. The western portion of Maryland is dominated by logging, extractive industries (coal, stone, etc.), and agriculture based commerce as well as several major trucking routes that highly influence the traffic mix. The western portion of Maryland is characterized by rocky and silty soils. Although Maryland is a small state, there is a wide range of existing soil and geological conditions, as well as unique traffic volume and weight trends that the MDSHA pavement design engineer needs to possess knowledge of in order to make accurate pavement recommendations. MDSHA is currently structured into two separate functions for the purpose of completing and maintaining construction projects, (1) Planning/Design and (2) Operations. The MDSHA Administrator is responsible for overseeing and directing both functions to ensure that MDSHA goals are achieved. Each function is completed by the efforts of several offices. There are separate divisions under each office that complete more specific tasks related to the completion of construction projects. The Pavement and Geotechnical Division of MDSHA falls under the Office of Materials Technology (OMT). OMT is responsible for the design and quality of all materials placed in MDSHA projects. The Pavement and Geotechnical Division is responsible for the design of all pavement structures in MDSHA projects. In addition, the Pavement and Geotechnical Division is responsible for the data processing and analysis of all the network level data collection for MDSHA roadways and its pavement management system (PMS). Below is a general schematic of the MDSHA structure.
OMT has a diverse group of technical disciplines and operating functions. While other offices are focused on their core mission as it relates to MDSHA, OMT is focused on the

Overview
Section 01: Introduction and Background
Updated 12/05/2012 Return to Table of Contents
1-4
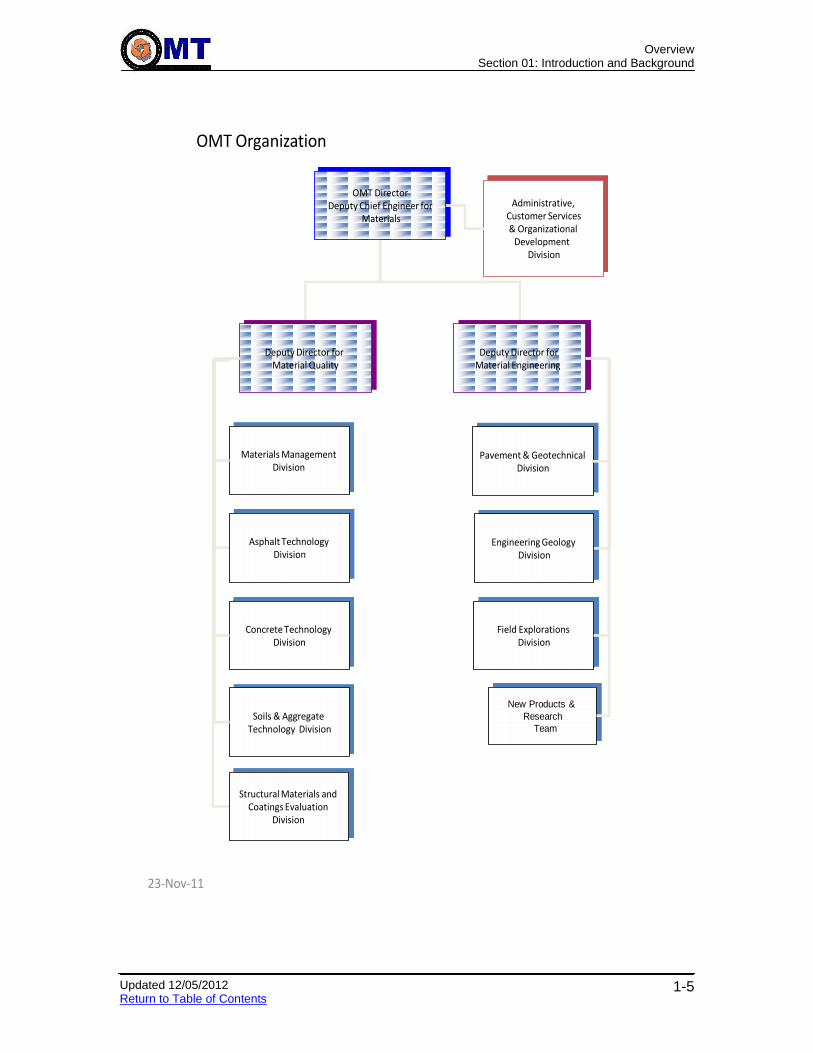
long term durability and performance of all materials, especially roadway pavements and bridge structures. OMT is divided into 3 material engineering divisions and 5 material quality divisions. The material quality divisions are responsible for material testing, design, quality, and acceptance. Part of the material engineering side, the Pavement and Geotechnical Division is responsible for the design of all pavement and geotechnical features on construction projects. The Division has two sections: a Pavement Management section and a Design section. Pavement Management (PM) handles all many pavement data collection activities, all pavement data processing and analysis responsibilities, and several reporting functions which support several MDSHA business plan goals and performance measures. PM runs optimization routines several times per year in the Fund 77 program to determine (among other things) predicted pavement performance based on given budgets, and recommended projects and treatments to needed to meet that performance. Design is responsible for all routine pavement and geotechnical engineering necessary to advertise construction contracts. Design also works closely with District Operation Engineers to support the design services required to treat pavements under areawide maintenance contracts. Design has five Team Leader engineers that serve as "District Contacts" that serve as points of contact for OMT to the Districts and all Project Development offices within MDSHA for all preliminary engineering and planning services. The following two charts are the organizational structure of OMT and the Pavement and Geotechnical Division as of November 2012.
Overview
Section 01: Introduction and Background
Updated 12/05/2012 Return to Table of Contents
1-5
OMT Organization
OMT DirectorDeputy Chief Engineer for
Materials
Deputy Director for Material Engineering
Deputy Director for Material Quality
Materials Management Division
Concrete Technology Division
Soils & Aggregate Technology Division
Structural Materials and Coatings Evaluation
Division
Pavement & Geotechnical Division
Engineering Geology Division
Field Explorations Division
Asphalt Technology Division
Administrative, Customer Services& Organizational
Development Division
New Products &
Research
Team
23-Nov-11

Overview
Section 01: Introduction and Background
Updated 12/05/2012 Return to Table of Contents
1-6
Pavement and Geotechnical Division
PAVEMENT AND GEOTECHNICAL DIVISION
Division Chief: Geoff Hall PE
PAVEMENT MGT SECTION
Assistant Division Chief
Data Processing Team Leader
Project Engineer
Consultant Engineers
Data Analysis Team Leader
Project Engineer
Consultant Engineers
DESIGN SECTION
Assistant Division Chief
D1& D5 Team Leader
Design Engineer
Design Engineer
Design Engineer
D2 & D6 Team Leader
Design Engineer
Consultant Engineers
D3 Team Leader
Design Engineer
Consultant Engineers
D4 Team Leader
Design Engineer
Design Engineer
D7 Team Leader
Design Engineer
Design Engineer
Consultant Engineers
Engineering Data Warehouse

Overview
Section 01: Introduction and Background
Updated 12/05/2012 Return to Table of Contents
1-7
Other State agencies, the Federal government, Counties, Cities, and other local municipalities are responsible for the remaining roadways in Maryland. Frequently in these cases, these other agencies seek the assistance of the Pavement and Geotechnical Division with regard to pavement recommendations. Therefore, in addition to the workload of MDSHA construction projects, the engineers in the Pavement and Geotechnical Division are often asked to assist and review other agencies’ construction projects. Based on the work completed over the last several years and the existing transportation budget, the Pavement and Geotechnical Division is responsible for approximately 1,000 design deliverables a year for MDSHA projects alone.

Overview
Section 02: MDSHA Pavement & Geotechnical Design Overview
Updated 12/05/2012 Return to Table of Contents
1-8
1.02 MDSHA PAVEMENT DESIGN OVERVIEW The Pavement and Geotechnical Division is in transition between utilizing the 1993 “AASHTO Guide for Design of Pavement Structures” (and its subsequent revisions), Remaining Service Life, and the “Mechanistic-Empirical Pavement Design Guide (MEPDG)” July 2008 Interim Edition as the framework for its pavement design procedure. The 1993 AASHTO guide documents an empirical procedure based on testing and data collection from the AASHO road test in the late 1950’s and from subsequent refinements and revisions. Remaining Service Life (RSL) characterizes pavement condition and life in terms of distress types that are collected for the network (i.e. ride quality, cracking, rutting and skid). This is used to determine design targets for the pavement engineer, described further in Design Input Policies. It is also used to account for the benefits of pavement preservation treatments. The 2008 AASHTO MEPDG guide documents a mechanistic-empirical procedure based on several decades of research, and provides a much more complex, but more relevant, approach to pavement design. The output of MEPDG is also put in measurable terms, such as ride quality and cracking quantities. The MDSHA Pavement Design Guide utilizes a majority of the AASHTO Guides for design analysis and has made modifications to that procedure based on local knowledge, available pavement data, material knowledge, past experiences, and knowledge and resource base of pavement engineers. In the simplest of terms, the goal of the MDSHA pavement engineer is to assess the structural and functional needs of a roadway and develop pavement recommendations that will provide an optimum benefit- to-cost ratio. The individual design tasks required to achieve this goal are quite involved. In order to determine the structural and functional needs of a roadway, specific pavement engineering design tasks need to be accomplished as presented in the following diagram:
Data Collection Data Collection
Data Analysis Data Analysis
Rehabilitation Technique
Selection
Develop Treatment
Options
Selection of
Treatment Strategy

Overview
Section 02: MDSHA Pavement & Geotechnical Design Overview
Updated 12/05/2012 Return to Table of Contents
1-9
The data collection effort involves the gathering of historical information of the roadway as well as existing pavement and subgrade conditions. The data collection efforts include the following tasks: records review, site inspections, visual condition survey, functional condition data collection, and structural condition data collection. The data analysis efforts involve assessing the functional and structural condition of the existing roadway and subgrade in terms of useful life for design and material selection tasks. Data analysis efforts include identifying uniform sections, material strengths, existing distress types, and the existing pavement performance. Developing treatment options involves identifying preservation and rehabilitation techniques to correct existing distress types and meet the structural and functional demands of the roadway. The selection of a preservation or rehabilitation strategy for construction is based on the most effective engineering design considering cost to MDSHA, practicality of construction, and benefit in terms of life extension provided to the MDSHA pavement network. The material selection portion of this pavement design overview requires knowledge of the existing pavement materials available in specific regions of Maryland. A significant amount of effort has been completed to develop policies in this guide for material selection. These policies are intended to keep recommendations and material selection consistent across different pavement design engineers and maintain consistency with current construction issues and concerns. These policies are intended to take into account the different environmental conditions across the state, material availability, material costs, predicted material performance, existing material performance, traffic conditions, and functional use of the roadway in the future.
Preliminary Procedures
Section 01: Initial Communication with Requesting Office
Updated 09/04/2013 Return to Table of Contents
2-1
2 PRELIMINARY PROCEDURES
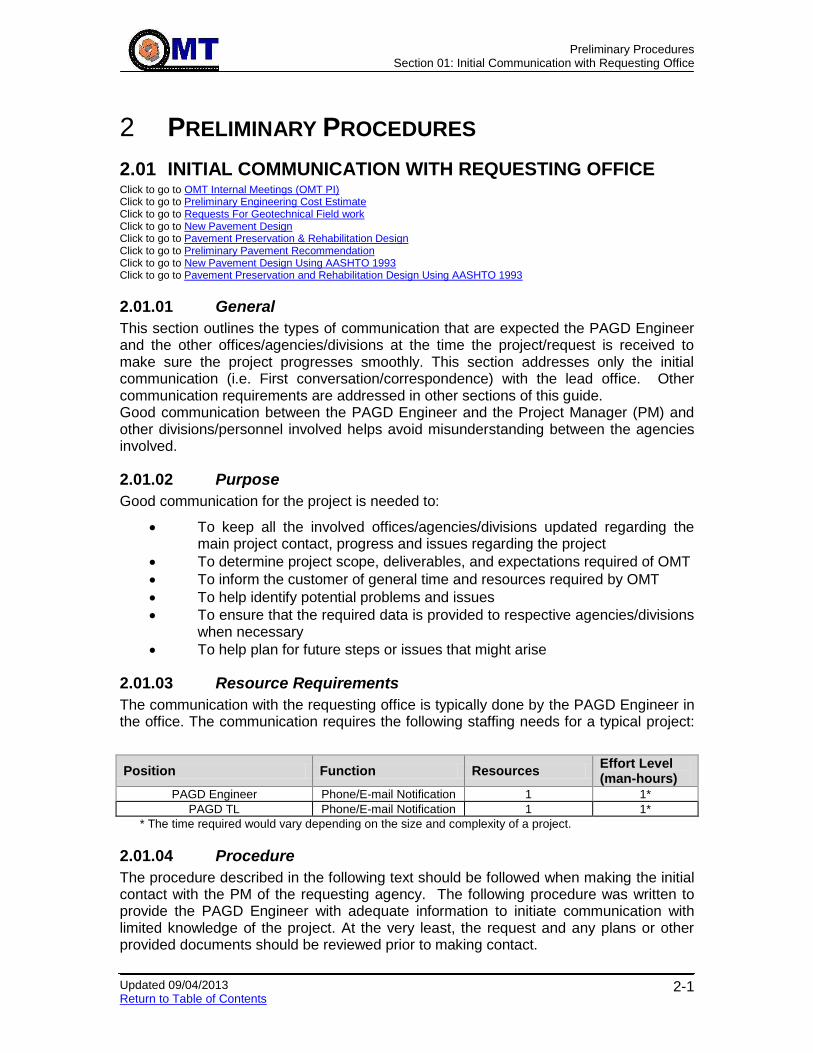
2.01 INITIAL COMMUNICATION WITH REQUESTING OFFICE Click to go to OMT Internal Meetings (OMT PI) Click to go to Preliminary Engineering Cost Estimate Click to go to Requests For Geotechnical Field work Click to go to New Pavement Design Click to go to Pavement Preservation & Rehabilitation Design Click to go to Preliminary Pavement Recommendation Click to go to New Pavement Design Using AASHTO 1993 Click to go to Pavement Preservation and Rehabilitation Design Using AASHTO 1993
2.01.01 General
This section outlines the types of communication that are expected the PAGD Engineer and the other offices/agencies/divisions at the time the project/request is received to make sure the project progresses smoothly. This section addresses only the initial communication (i.e. First conversation/correspondence) with the lead office. Other communication requirements are addressed in other sections of this guide. Good communication between the PAGD Engineer and the Project Manager (PM) and other divisions/personnel involved helps avoid misunderstanding between the agencies involved.
2.01.02 Purpose
Good communication for the project is needed to:
To keep all the involved offices/agencies/divisions updated regarding the main project contact, progress and issues regarding the project
To determine project scope, deliverables, and expectations required of OMT
To inform the customer of general time and resources required by OMT
To help identify potential problems and issues
To ensure that the required data is provided to respective agencies/divisions when necessary
To help plan for future steps or issues that might arise
2.01.03 Resource Requirements
The communication with the requesting office is typically done by the PAGD Engineer in the office. The communication requires the following staffing needs for a typical project:
Position Function Resources Effort Level (man-hours)
PAGD Engineer Phone/E-mail Notification 1 1*
PAGD TL Phone/E-mail Notification 1 1*
* The time required would vary depending on the size and complexity of a project.
2.01.04 Procedure
The procedure described in the following text should be followed when making the initial contact with the PM of the requesting agency. The following procedure was written to provide the PAGD Engineer with adequate information to initiate communication with limited knowledge of the project. At the very least, the request and any plans or other provided documents should be reviewed prior to making contact.

Preliminary Procedures
Section 01: Initial Communication with Requesting Office
Updated 09/04/2013 Return to Table of Contents
2-2
Certain steps in the communication process and other processes might overlap. It is important to keep in mind that although these processes are broken out and written in separate sections, they are a part of an overall process to deliver technically and practically sound projects. The procedure described below is followed after receiving a request/memo from a customer. The communication can be completed via a memo request, e-mail request, or verbal request although a memo request and e-mail request is preferred.
2.01.05 Preliminary Information Requested and/or Needed
The following section contains information that the PAGD Engineer needs to provide, questions to be asked of the PM and items required. This following list is not comprehensive and all items and may not apply for all projects. The initial contact may be completed via phone or e-mail correspondence.
Provide the PM with the names of the immediate project contact (PAGD Engineer) and of the PAGD TL. Request the PM to include these names in the distribution list for all future correspondence and documents/plans to be sent.
Obtain the charge number and the Contract number if it is not provided with the memo/request. Ask the PM regarding federal participation and if the project is funded for construction or for Preliminary Engineering only.
Inquire if the project is a Design-Build project. If it is decided that the project will be a Design-Build project, inform the PAGD TL since the project may have to be reassigned (This applies to PAGD Engineer Consultants only).
Verify the limits and the scope of work.
Request plans (including profiles, typical sections), cross-sections and any other relevant information if not provided.
Request the project schedule and dates of major milestones (PI Meeting, Semi-Final Review, Final Review, PS&E, and Advertisement Date).
Inform the PM of the estimated time needed to perform field work, lab work, design, and generate report/recommendations.
Verify the deliverables (Boring Data, Advanced and Final Reports) that the PM expects to receive from OMT and the anticipated due dates. If there is a conflict with timeframes, the PAGD Engineer should discuss with the PAGD TL.
Inquire if other offices/divisions will require field work (SWM borings, SPT borings for structures) and/or lab work from OMT. If so, request that a formal submittal be provided to OMT. Inquire of any known issues with property access/owners. Advise that environmental permits will be required if borings needed in wetlands and waterways.
Request a copy of the Environmental Impact Statement (EIS) if one was performed for the project. Ask the PM if they are aware of any contamination issues (gas stations, junk yards, dry cleaners, etc.). This information should be passed along to the EGD.
Preliminary Procedures
Section 02: Files
Updated 09/04/2013 Return to Table of Contents
2-3
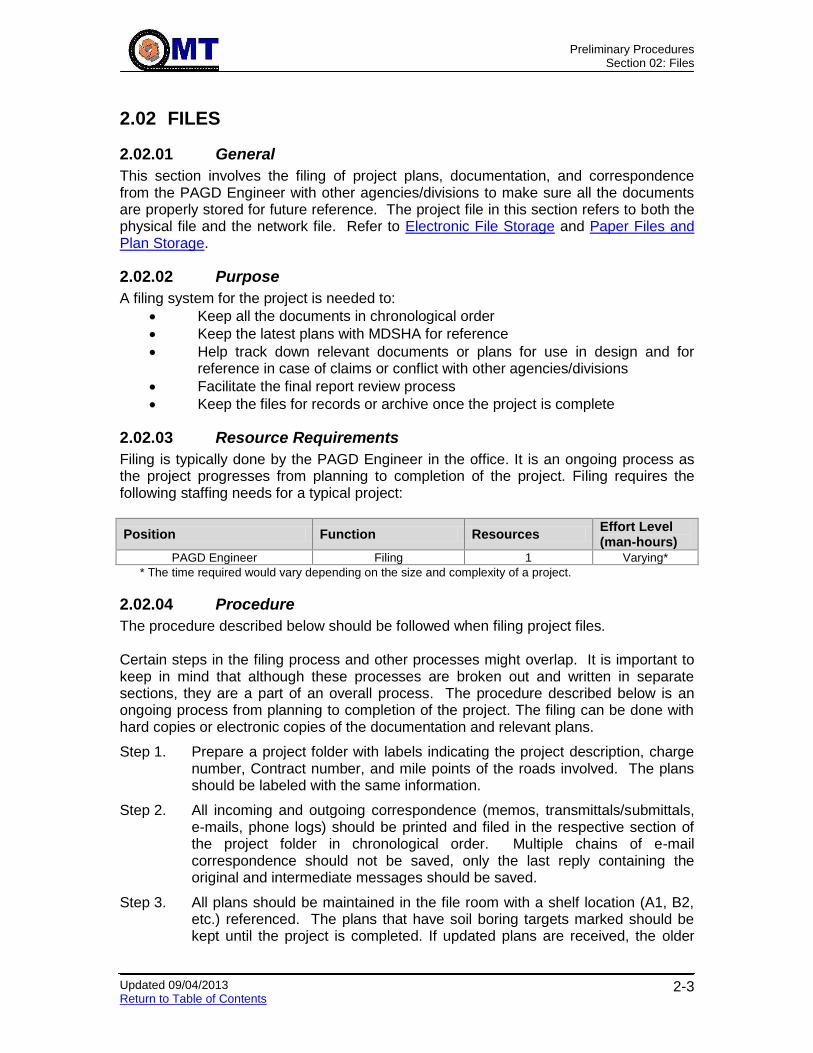
2.02 FILES
2.02.01 General
This section involves the filing of project plans, documentation, and correspondence from the PAGD Engineer with other agencies/divisions to make sure all the documents are properly stored for future reference. The project file in this section refers to both the physical file and the network file. Refer to Electronic File Storage and Paper Files and Plan Storage.
2.02.02 Purpose
A filing system for the project is needed to:
Keep all the documents in chronological order
Keep the latest plans with MDSHA for reference
Help track down relevant documents or plans for use in design and for reference in case of claims or conflict with other agencies/divisions
Facilitate the final report review process
Keep the files for records or archive once the project is complete
2.02.03 Resource Requirements
Filing is typically done by the PAGD Engineer in the office. It is an ongoing process as the project progresses from planning to completion of the project. Filing requires the following staffing needs for a typical project:
Position Function Resources Effort Level (man-hours)
PAGD Engineer Filing 1 Varying*
* The time required would vary depending on the size and complexity of a project.
2.02.04 Procedure
The procedure described below should be followed when filing project files. Certain steps in the filing process and other processes might overlap. It is important to keep in mind that although these processes are broken out and written in separate sections, they are a part of an overall process. The procedure described below is an ongoing process from planning to completion of the project. The filing can be done with hard copies or electronic copies of the documentation and relevant plans.
Step 1. Prepare a project folder with labels indicating the project description, charge number, Contract number, and mile points of the roads involved. The plans should be labeled with the same information.
Step 2. All incoming and outgoing correspondence (memos, transmittals/submittals, e-mails, phone logs) should be printed and filed in the respective section of the project folder in chronological order. Multiple chains of e-mail correspondence should not be saved, only the last reply containing the original and intermediate messages should be saved.
Step 3. All plans should be maintained in the file room with a shelf location (A1, B2, etc.) referenced. The plans that have soil boring targets marked should be kept until the project is completed. If updated plans are received, the older

Preliminary Procedures
Section 02: Files
Updated 09/04/2013 Return to Table of Contents
2-4
plans should be discarded and replaced with latest plans to avoid any confusion.
Step 4. The results from regular testing and any special testing should be kept in hard copy and also in electronic format.
Step 5. The input parameters used for design should be filed in the project folder for future reference.
Step 6. The project folder and plans should be stored so that they are readily accessible for review.
Step 7. All the reports originating from MDSHA as well as the reports received from other divisions should be filed in the report section.

Preliminary Procedures
Section 03: Records Review
Updated 09/04/2013 Return to Table of Contents
2-5
2.03 RECORDS REVIEW Click to go to OMT Internal Meetings (OMT PI) Click to go to Site Reconnaissance Click to go to Discussion/Selection Alternative with Project Owner Click to go to Requests For Geotechnical Field work
2.03.01 General
This section contains information regarding readily available records that should be reviewed before submitting a request for field work.
2.03.02 Purpose
A record review for the roadway project is needed to:
To obtain a general knowledge of the soil and geological information
To anticipate problems that may arise based on the knowledge of adjacent or previous projects in the area
To obtain preliminary information prior to requesting the field work
To obtain general knowledge regarding what can be expected once the actual field work begins
To identify particular areas that need special attention
2.03.03 Resource Requirements
The records review is typically performed by the PAGD Engineer in the office. The review process requires the following staffing needs for a typical project:
Position Function Resources Effort Level (man-hours)
PAGD Engineer Review 1 4*
* The time required would vary depending on the size and complexity of a project.
2.03.04 Procedure
The procedure described in the following text should be followed when performing records review for a project. The following procedure was written to provide the PAGD Engineer with adequate information to assist in reviewing records for a project. Certain steps in the records review process and other processes might overlap. It is important to keep in mind that although these processes are broken out and written in separate sections, they are a part of an overall process.
Step 1. Review of Construction History and Performance Data – Construction History can provide information regarding the Contract numbers of previous, adjoining or recently completed projects. It can also provide general information regarding the soil type, drainage type, or type of subgrade improvement (Capping Borrow, lime/cement treated aggregates bases or subgrades) used during construction of previous projects in the area. Also retrieve performance data (ride quality, friction, rutting, cracking), and other network-level data for the project site and place in file.
Step 2. Review of VisiData – View VisiData for the entire project for general features

Preliminary Procedures
Section 03: Records Review
Updated 09/04/2013 Return to Table of Contents
2-6
(cuts, fills, structures, surface drainage, utilities, etc.)
Step 3. Review of As-Built – As-built plans are available through the OHD website or may be requested from the PM. Refer to How to Access AsBuilts 1-2-3. The plans should be reviewed for soils information and groundwater information, materials used in embankment and subgrade construction, subsurface drainage structures and other pertinent information.
Step 4. Review of Previous and Adjoining Contracts - Review should be made of the files of previous and adjoining or nearby projects. The nature of problems encountered on these projects and their recommended solutions should be noted since similar problems may be encountered on the current project. If the reviewed project or projects are under construction or completed, they should be inspected in the field. Problems originating during construction or developing after completion of a project may influence the coverage, type of special samples, or the final recommendations for the proposed project.
In addition, files of previous projects may contain pertinent correspondence that was directed to the various departments of the State Highway Administration and/or various Consulting Engineering Firms. Such correspondence may include requests for specific information or may contain information which will be of value in planning the subsurface investigation. For example, problems with unmarked underground utilities, potential problems with a specific property owner, ROW problems requiring either special slopes or construction of a costly retaining wall, etc.
Look for previous cores to determine pavement structures and condition at various points in time. This can be done by looking through the core log table of contents, and finding core logs in similar project limits.
Step 5. Review of Soil Information for Existing Structures – Review the Small Structure and Bridge Inventories on the OOS website for structures adjacent or within the proposed project limits. Using the structure number, search the OOS As-builts on the S Drive. The As-builts generally contain boring and tests sheets of previous subsurface investigations.
Step 6. Review of Geological Maps - These maps provide general information about geological formations. The EGD should be consulted regarding the interpretation of the information obtained from geological maps.
Step 7. Review of USDA Soil Mapping – USDA Soil Maps indicate general information on soil types, depth to bedrock, depth of groundwater table, and engineering properties of soils which may be helpful in planning the subsurface investigation. However, they are of limited value because the information is limited to shallow depths. EGD should be consulted on the information obtained from USDA Soil Maps.
Step 8. Review Environmental Impact Statement (EIS) - An EIS may be obtained from the PM if one was conducted for the project. The EIS should be reviewed by the PAGD Engineer and a copy should be provided to the EGD for review.

Preliminary Procedures
Section 04: OMT Internal Meetings
Updated 09/04/2013 Return to Table of Contents
2-7
2.04 OMT INTERNAL MEETINGS (OMT PI)
2.04.01 General
This section discusses the importance of having an internal meeting of OMT representatives at the project initiation and how it is beneficial to the project. Internal meetings should be held for all projects involving coordination or participation between PAGD and other OMT Divisions. This meeting may involve participation from one or more OMT Divisions. The duration of the meeting may vary from a half-hour to several hours depending on the scope and complexity of the project. It is intended that this meeting will held at the project initiation; however, OMT internal meetings may be required at various times throughout the project duration.
2.04.02 Purpose
An internal meeting for the project is needed to:
Review and discuss project scope and schedule
Determine the level of responsibility and assign tasks for each OMT Division
For PAGD and EGD, identify routine and non-routine geotechnical features and elements of the project
Identify and discuss solutions to existing and potential problems
Prioritize tasks which are critical to project schedule
Avoid miscommunication or misunderstanding between OMT Divisions
2.04.03 Resource Requirements
The internal meetings are typically coordinated by the PAGD Engineer and take place in the office. The internal meeting process requires the following staffing needs for a typical project:
Position Function Resources Effort Level (man-hours)
PAGD Engineer Conduct Meeting 1 4*
PAGD TL/ADC Attend Meeting 1 4*
EGD – Geotechnics and Specifications Review
Representative
Attend Meeting 1 4*
EGD – Geology and Groundwater Representative
Attend Meeting 1 4*
FED Representative Attend Meeting 1 2*
SATD Representative Attend Meeting 1 2*
* The time required would vary depending on the size and complexity of a project. Note that this is an ongoing task, when needed, during the design and construction phase of the project.
2.04.04 Procedure
The procedure described below should be followed when conducting internal meetings for a project. This procedure was written to provide the PAGD Engineer with adequate information to assist in conducting an internal meeting for a project. The following procedures are intended to occur after the project has been assigned to a PAGD Engineer.

Preliminary Procedures
Section 04: OMT Internal Meetings
Updated 09/04/2013 Return to Table of Contents
2-8
Certain steps with the internal meetings and other processes may overlap. It is important to keep in mind that although these processes are broken out and written in separate sections, they are a part of an overall process.
Step 1. Complete Steps in Initial Communication with Requesting Office.
Step 2. Prior to scheduling internal meeting, send out notices to OMT Division Chiefs (EGD, FED and SATD) requesting project contacts and provide project plans and other pertinent information. It is recommended to get two contacts from EGD, one from Geotechnics and Specifications Review and from Geology and Groundwater. Also notify PAGD TL and PAGD ADC-Design.
Step 3. Complete Steps in Records Review.
Step 4. If necessary, the PAGD Engineer should visit the site prior to conducting the OMT Internal Meeting. The site visit does not need to be as thorough as that discussed in Site Reconnaissance.
Step 5. Prepare an agenda for the meeting outlining the project schedule, scope, responsibilities for each OMT Division.
Step 6. Schedule the meeting and send out an Outlook Appointment to the OMT Division contacts along with the meeting agenda.
Step 7. At the meeting, document attendance and describe the project scope and schedule (milestones and upcoming project/team/partnering meetings).
Step 8. Review project plans, cross-sections and other items obtained from Steps in Records Review with meeting attendees.
Step 9. Review and modify/update the “Summary of Geotechnical Design Elements and Delegation_DRAFT” worksheet (See Forms, Spreadsheets & Guidelines) for the project. This worksheet is filled out for a typical project but should be modified/ updated for the project being discussed. Updating this worksheet will assist in identifying and delegating responsibilities relating to routine and non-routine geotechnical features and elements of the project between PAGD and EGD. Items to be addressed by OOS should also be discussed at the meeting. In addition to modifying/updating the worksheet, take notes and identify potential problems or issues with items on the worksheet.
Step 10. Discuss subsurface exploration program needs and scheduling with FED Representative. Refer to Requests For Geotechnical Field work.
Step 11. Discuss the routine and special lab testing needs and scheduling with SATD Representative. Refer to Requests for Lab Work. Compile list of data requirements of each OMT Division to complete their portion of the work.
Step 12. Establish action items and tasks for each OMT Division and time frames for completion.
Step 13. Discuss Site Reconnaissance (See Section on Site Reconnaissance) with meeting attendees and determine which OMT Divisions should attend.
Step 14. After the meeting, prepare and send meeting minutes along with action items based on notes taken during the meeting.
Step 15. Confirm design elements to be addressed by OOS from the modified/updated “Summary of Geotechnical Design Elements and Delegation” worksheet.

Preliminary Procedures
Section 04: OMT Internal Meetings
Updated 09/04/2013 Return to Table of Contents
2-9
Contact PM requesting data requirements of each OMT Division. It may be necessary to revisit Steps in Initial Communication with Requesting Office.
Step 16. Setup Site Reconnaissance (See Site Reconnaissance).

Preliminary Procedures
Section 05: Site Reconnaissance
Updated 09/04/2013 Return to Table of Contents
2-10
2.05 SITE RECONNAISSANCE Click to go to OMT Internal Meetings (OMT PI) Click to go to Requests For Geotechnical Field work
2.05.01 General
This section involves the type of information and items to be considered and observed during site reconnaissance, which can help during testing and design of the project. Site reconnaissance will help in getting familiar with the general soil, drainage conditions, and special project considerations, if any, that should be given for testing and/or design of the project.
2.05.02 Purpose
Site reconnaissance for the project is needed to:
To better visualize the project and get familiar with the project area
To obtain a general knowledge of soil, moisture, rock, and drainage conditions
To obtain general knowledge of the topography and special project considerations, if any, should be given during testing due to site conditions
To check the general effect of excavation/removal on adjacent pavement or other structures
To get general knowledge of readily available materials
To check the general condition of the mainline and the shoulder
To identify potential problem areas, such as swamp, fills, dumps etc.
2.05.03 Resource Requirements
The site reconnaissance is performed by the PAGD Engineer. The PAGD Engineer may be accompanied by representatives from the EGD and the FED as necessary. At least two individuals are needed for safety reasons. The site reconnaissance process requires the following staffing needs for a typical project:
Position Function Resources Effort Level (man-hours)
PAGD Engineer Reconnaissance 1 8*
EGD Representative Reconnaissance 1 8*
FED Representative Reconnaissance 1 8*
* The time required would vary depending on the size and complexity of a project.
2.05.04 Procedure
The procedure described in the following text should be followed when performing site reconnaissance for a project. The following procedure was written to provide the PAGD Engineer with adequate information to assist in site reconnaissance for a project. Certain steps in the site reconnaissance process and other processes might overlap. It is important to keep in mind that although these processes are broken out and written in separate sections, they are a part of an overall process. Protective clothing must be worn (safety vest, hard hat, hard-soled shoes) at all times when conducting the reconnaissance.
Preliminary Procedures
Section 05: Site Reconnaissance
Updated 09/04/2013 Return to Table of Contents
2-11
Step 1. Complete Steps in Records Review.
Step 2. Print copy and review Checklist Items for Site Reconnaissance (See Forms, Spreadsheets & Guidelines.
Step 3. During site reconnaissance, fill in the Checklist as completely as possible. In addition, notes (type, locations and extent of features) should be taken for items on the Checklist applicable to the project. If unable to make a determination on items on the Checklist, this should be noted also.
Step 4. Review of adjacent properties: Survey the adjacent properties which will be affected due to the construction of the roadway, ramps, or other structures. Survey the properties which will not be removed but will be very close to the proposed project to study the effect of lowering or increasing grade or water table on those properties.
Step 5. Verify availability of material or disposal sites: Check if there are any landfill or quarry sites close to the proposed project site which can be used for dumping or construction material to reduce the project cost.
Step 6. Check condition of existing pavement and slopes: The existing pavement should be checked for tension cracks. The existing slopes should be checked for stability or erosion and existing distresses.
Step 7. Discuss items/issues from the site reconnaissance with the PAGD TL and OMT Division contacts (if they did not attend). It may be necessary to type notes taken during the site reconnaissance for placement in the project file.
Preliminary Procedures
Section 06: Preliminary Engineering Cost Estimate
Updated 12/05/2012 Return to Table of Contents
2-12
2.06 PRELIMINARY ENGINEERING COST ESTIMATE
2.06.01 Purpose
A Preliminary Engineering (PE) Cost Estimate is completed to:
Provide the Project Owner an estimate of the cost required by OMT to complete the review, testing, design, and analysis of the project, used for SHA budget and Consolidated Transportation Program (CTP) costs.
Estimate the amount of testing required on the project, for the Pavement and Geotechnical Division, Engineering Geology Division, Field Explorations Division and the Soils & Aggregate Technology Division.
Estimate the total dollar costs required to complete testing and design of the project
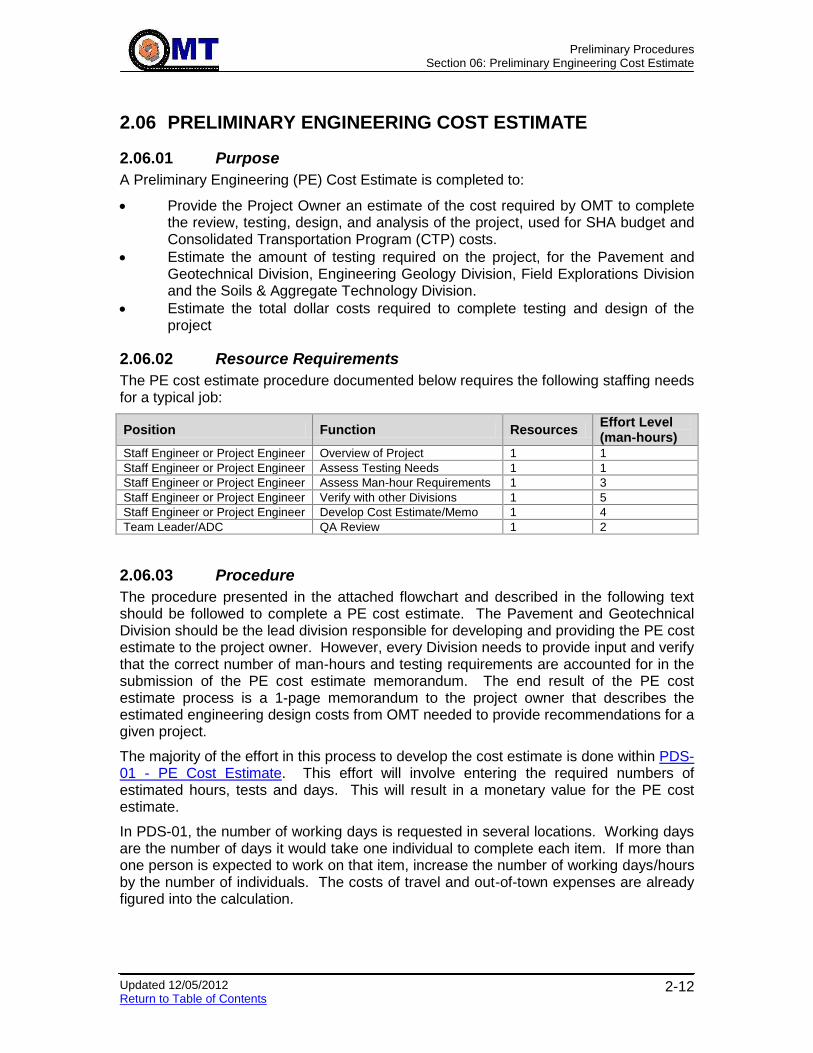
2.06.02 Resource Requirements
The PE cost estimate procedure documented below requires the following staffing needs for a typical job:
Position Function Resources Effort Level (man-hours)
Staff Engineer or Project Engineer Overview of Project 1 1
Staff Engineer or Project Engineer Assess Testing Needs 1 1
Staff Engineer or Project Engineer Assess Man-hour Requirements 1 3
Staff Engineer or Project Engineer Verify with other Divisions 1 5
Staff Engineer or Project Engineer Develop Cost Estimate/Memo 1 4
Team Leader/ADC QA Review 1 2
2.06.03 Procedure
The procedure presented in the attached flowchart and described in the following text should be followed to complete a PE cost estimate. The Pavement and Geotechnical Division should be the lead division responsible for developing and providing the PE cost estimate to the project owner. However, every Division needs to provide input and verify that the correct number of man-hours and testing requirements are accounted for in the submission of the PE cost estimate memorandum. The end result of the PE cost estimate process is a 1-page memorandum to the project owner that describes the estimated engineering design costs from OMT needed to provide recommendations for a given project.
The majority of the effort in this process to develop the cost estimate is done within PDS-01 - PE Cost Estimate. This effort will involve entering the required numbers of estimated hours, tests and days. This will result in a monetary value for the PE cost estimate.
In PDS-01, the number of working days is requested in several locations. Working days are the number of days it would take one individual to complete each item. If more than one person is expected to work on that item, increase the number of working days/hours by the number of individuals. The costs of travel and out-of-town expenses are already figured into the calculation.

Preliminary Procedures
Section 06: Preliminary Engineering Cost Estimate
Updated 12/05/2012 Return to Table of Contents
2-13
NOTE: PDS-01 doubles the costs from the Pavement and Geotechnical engineering tabs to account for consultants. The costs from the Drillers and Lab tabs use actual costs.
Step 1. Receive a request for a PE cost estimate from project owner. If this project is a project that is new to OMT then follow the steps in Initial Communication with Requesting Office. Completing these steps will provide adequate information to complete the PE cost estimate process. In some cases, certain assumptions and a more conservative PE cost estimate needs to be completed.
Step 2. Start the cost estimating process after collecting the data from the records review, open PDS-01 - PE Cost Estimate.
Step 3. Open the Summary sheet in the PE Cost Estimate Form and enter the project description information.
Step 4. Open the Pavement sheet in PDS-01 and enter the number of working hours for each of the items under the Meetings Design/Analysis, and Report headings. The values entered in the Pavement sheet are the expected working hours required for the pavement engineering aspects to complete the project accurately and thoroughly. A summary of the total working hours and cost will result from the data entry for each heading. Print out the Pavement sheet when all the required fields are populated.
Step 5. Open the Geotechnical sheet in PDS-01 and enter the number of working hours for each of the items under the Meetings Design/Analysis, and Report headings. The values entered in the Geotechnical sheet are the expected working hours required for the geotechnical engineering aspects to complete the project accurately and thoroughly. A summary of the total working hours and cost will result from the data entry for each heading. Print out the Geotechnical sheet when all the required fields are populated.
Step 6. Open the Geology EGD sheet in PDS-01 and enter the number of working hours or other information for each of the items under the Meetings, Geology and Geotechnical headings. The values entered in the EGD sheet are the expected working days and other information required for the Engineering Geology Division to complete the project accurately and thoroughly. However, if EGD provides a cost estimate, then just enter that amount. A summary of the total working hours and cost will result from the data entry for each heading. Print out the EGD sheet when all the required fields are populated.
Step 7. Open the Pavement Testing sheet in PDS-01 and enter the number of working days for each of the items under the Testing heading. The values entered in the Pavement Testing sheet are the expected working days required for the pavement testing team to complete the project accurately and thoroughly. A summary of the total working days and cost will result from the data entry for the team. Print out the Pavement Testing sheet when all the required fields are populated.
Step 8. Open the Drillers sheet in PDS-01 and enter the quantity for each of the items. The values entered in the Drillers sheet are the expected information required for the Drillers to complete the project accurately and thoroughly. Foundation borings are necessary in cases that a structure (bridge) is

Preliminary Procedures
Section 06: Preliminary Engineering Cost Estimate
Updated 12/05/2012 Return to Table of Contents
2-14
involved in the project or exceptionally deep utilities need to be placed. It is typical to have 5 foundation borings per normal structure. A summary of the cost will result from the data entry for each heading. Print out the Drillers sheet when all the required fields are populated.
Step 9. Open the Lab sheet in PDS-01 and enter the quantity for each of the items under the Testing heading. The values entered in the Lab sheet are the expected information required for the Soils and Aggregate Lab to complete the project accurately and thoroughly. A summary of the total cost will result from the data entry for the Division. Print out the Lab sheet when all the required fields are populated.
Step 10. Open the Summary sheet in PDS-01 and view the estimated PE cost of the project. Note that the summary sheet is set up to carry over the consultant costs from the Pavement and Geotechnical tabs. Adjustment is necessary if it is known that a State engineer will perform the work. Print out the Summary sheet.
Step 11. Provide a copy of the PE cost estimate to each OMT Division and function to allow them an opportunity to review their respective areas of responsibility for verification of information and costs.
Step 12. After the respective Divisions have provided verification, make any correction, if necessary. Print out all sections of PDS-01 and place in project file.
Step 13. Prepare a PE cost estimate memorandum on MDSHA letterhead following the typical format provided in Example Memos. Provide an opportunity for Design Team Leader and Assistant Division Chief – Design to perform a quick review.
Step 14. Submit PE cost estimate memorandum to the PAGD Assistant Division Chief for approval and signature.

Preliminary Procedures Section 07: Meeting Attendance – Project Team Meetings
Updated 12/05/2012 Return to Table of Contents
2-15
2.07 MEETING ATTENDANCE– PROJECT TEAM MEETINGS
2.07.01 General
This section discusses the importance of attending project or team meetings with the PM. If necessary, send an invitation to other divisions involved in the testing or design of the project to attend the meetings. OMT/PAGD generally receives notices of meetings via memorandums, e-mails or Outlook appointments. Meetings may be Preliminary Investigation (PI) Meetings, Semi-Final Review Meetings, Final Review Meetings, Partnering Meetings, etc. Project meetings help inform the project team of project progress and existing or anticipated problems.
2.07.02 Purpose
Meeting attendance for the roadway project is needed to:
To inform the PM progress from the OMT/PAGD and discuss the project schedule.
To identify and discuss existing or anticipated problems
To avoid miscommunication or misunderstanding between the project team
2.07.03 Resource Requirements
The project team meetings are typically attended by the PAGD Engineer either at SHA Headquarters or District Office. At times meetings may be held at the project site. In certain cases, a PAGD TL and representatives from other OMT divisions will be invited to attend the project team meetings. This task requires the following staffing needs for a typical project:
Position Function Resources Effort Level (man-hours)
PAGD Engineer Attend/Participate at Meetings
1 16*
EGD Representative Attend/Participate at Meetings
1 16*
PAGD TL Attend/Participate at Meetings
1 8*
* The time required would vary depending on the size and complexity of a project. Note that this is an ongoing task, when needed, during the design and construction phase of the project.
2.07.04 Procedure
The procedure described in the following text should be followed when attending project team meetings. Certain steps associated with attending project team meetings and other processes may overlap. It is important to keep in mind that although these processes are broken out and written in separate sections, they are a part of an overall process.
Step 1. Confirm date, time and location of meeting provided in the memorandum, e-mail or Outlook Appointment with the PM. If the assigned PAGD Engineer is unable to attend, provisions should be made to have another PAGD representative attend. This representative should be a PAGD Engineer from the same PAGD Team. Ensure to brief the PAGD Engineer attending and provide a list of questions that needs to be asked and a list of items/comments that need to be

Preliminary Procedures Section 07: Meeting Attendance – Project Team Meetings
Updated 12/05/2012 Return to Table of Contents
2-16
discussed at the meeting.
Step 2. Inform other OMT Division contacts involved regarding the meeting.
Step 3. Prepare for meeting. Refer to III.C Records Review. This involves reviewing the project plans and folder for any geotechnical concerns with the PAGD TL and other OMT Division contacts. Any questions, concerns and/or comments should be documented for discussion at the Project Team Meeting. The level of preparation will vary depending on the project scope and the type of meeting. Written comments may be required to be submitted at the meeting or within several days after the meeting. This time frame should be discussed with the PM.
Step 4. Attend the meeting and discuss questions, concerns and/or comments with the PM and other members of the project team. Take notes at the meeting of items/issues discussed. Ensure to document any action items required to be completed by OMT/PAGD.
Step 5. Discuss items/issues from the meeting with the PAGD TL and OMT Division contacts (if they did not attend). It may be necessary to type notes taken during the meeting for placement in the project file.
Step 6. Provide written comments to PM within time frame discussed with the PM.
Step 7. Review meetings minutes, if received, and correct and notify PM if there are discrepancies/inaccuracies.
Preliminary Procedures
Section 08: Initial Treatment Identification
Updated 08/29/2013 Return to Table of Contents
2-17
2.08 INITIAL TREATMENT IDENTIFICATION – PAVEMENT PRESERVATION GUIDE Click to go to Discussion/Selection Alternative with Project Owner Click to go to Required Pavement Testing Guidelines
2.08.01 Purpose
When PAGD first receives a project involving preservation or rehabilitation of existing pavement, the pavement engineer should identify the list of viable treatment options that could be appropriate fixes. This involves utilizing the decision trees of the Pavement Preservation Guide, contained in this section.
2.08.02 Resource Requirements
The Initial Treatment Identification procedure documented below requires approximately one man-hour of effort by the project engineer. This effort does not include the time needed to collect the information to be used in this procedure, as that effort is accounted for elsewhere.
2.08.03 Procedure
2.08.03.01 Conduct Site Visit Perform a site visit and document findings as per the section on Visual Pavement Condition Assessment.
2.08.03.02 Determine Pavement Type and Condition: There are different types of pavement within the MDSHA roadway network. Pavement deterioration, and therefore, treatment options for those pavements are directly influenced by the composition of the pavement. Refer to Pavement Types for descriptions.
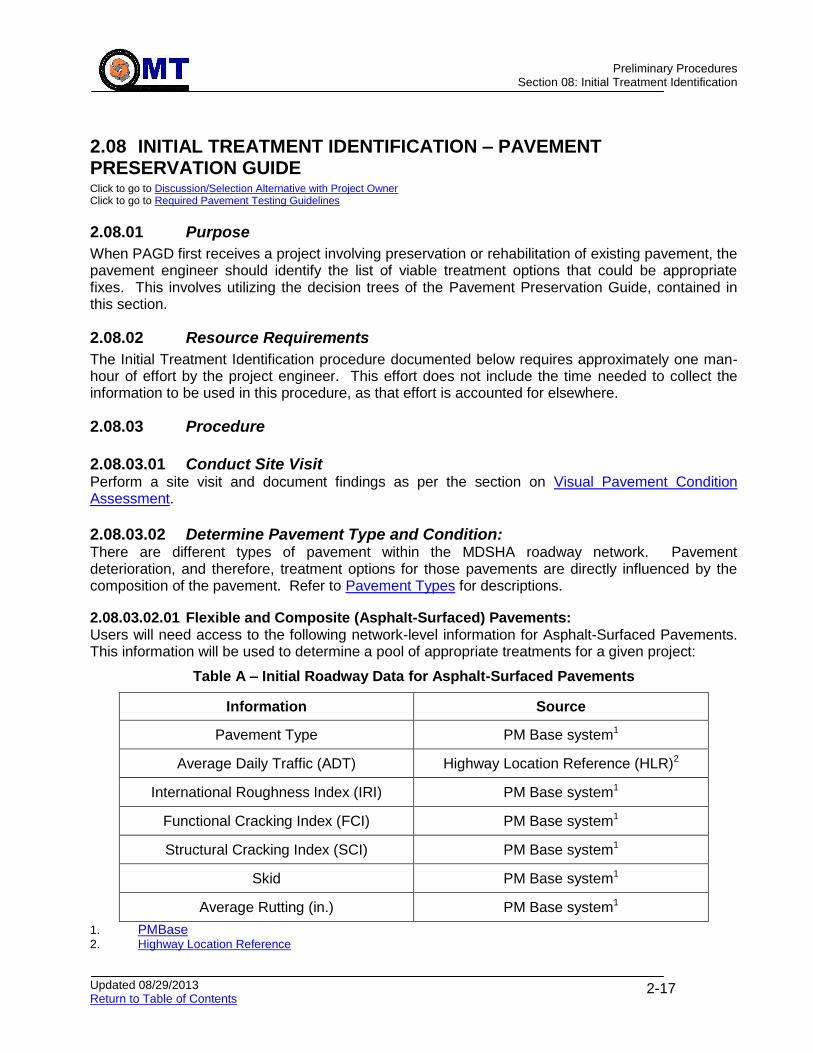
2.08.03.02.01 Flexible and Composite (Asphalt-Surfaced) Pavements: Users will need access to the following network-level information for Asphalt-Surfaced Pavements. This information will be used to determine a pool of appropriate treatments for a given project:
Table A – Initial Roadway Data for Asphalt-Surfaced Pavements
Information Source
Pavement Type PM Base system1
Average Daily Traffic (ADT) Highway Location Reference (HLR)2
International Roughness Index (IRI) PM Base system1
Functional Cracking Index (FCI) PM Base system1
Structural Cracking Index (SCI) PM Base system1
Skid PM Base system1
Average Rutting (in.) PM Base system1
1. PMBase 2. Highway Location Reference

Preliminary Procedures
Section 08: Initial Treatment Identification
Updated 08/29/2013 Return to Table of Contents
2-18
2.08.03.02.01.1 Obtain IRI, CI, Skid and Rutting (in.) Data: Obtain the most recent year IRI, CI, Skid and Rutting data available from the PM Base system, and verify each value with the data collected during the Visual Assessment. Also, it is a good idea to review multiple years’ worth of data to determine the trend of the roadway’s performance and to ensure the most recent years’ data is reasonable. After obtaining the Pavement Type, ADT, and IRI, use Figure 1 to find the appropriate Treatment Table. If the pavement condition information is not available from the Pavement Management System (PMS), a field visit will be necessary to visually identify the presence of cracking/distress. Distresses should be categorized into Structural and/or Functional as listed in Table B below. Even if FCI and SCI is available in the PMS, A field visit should be performed to validate the information.
Table B. Cracking/Distress Categories
Structural Functional
Alligator (Fatigue) Cracking Bleeding Lane/Shoulder Drop-off
Depression Block Cracking Polished Aggregate
Edge Cracking Bumps and Sags Slippage Cracking
Longitudinal Cracking Corrugation Transverse Cracking
Patching/Potholes Joint Reflective Cracking Weathering and Raveling
Note: Refer to the Asphalt Distress Paver Manual of the U.S. Army Corps of Engineers for definitions of distresses.
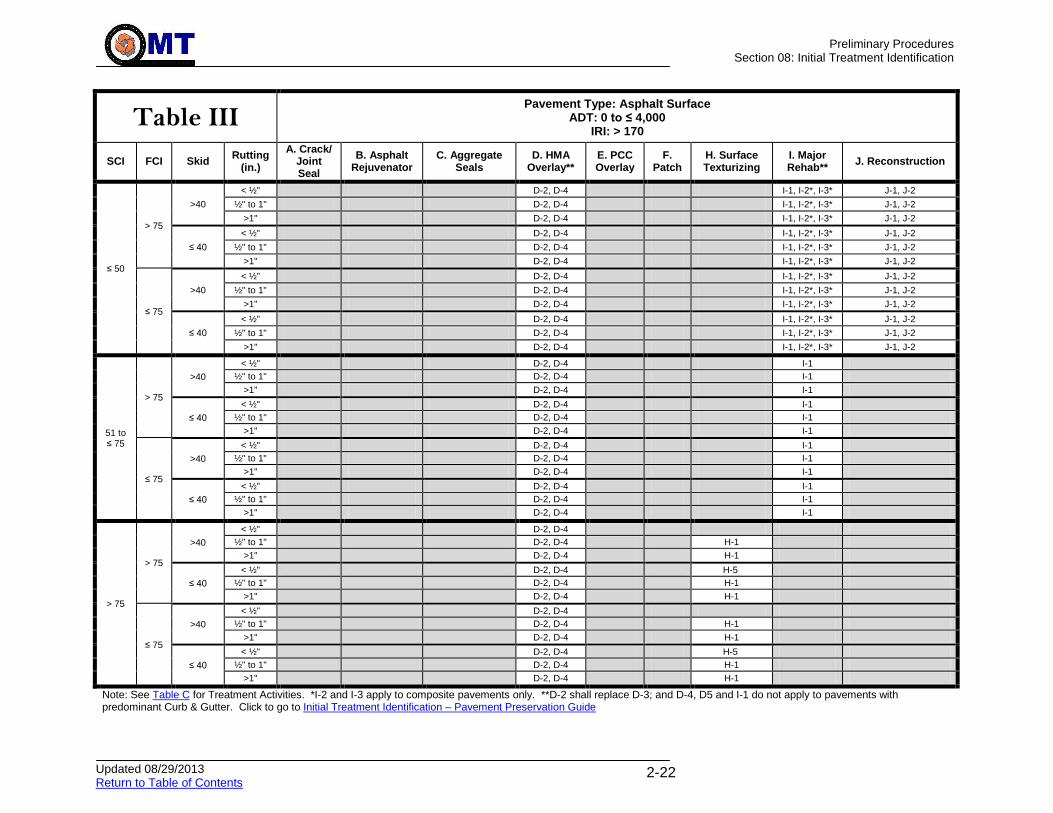
Use CI, Skid, Rutting (in.), in conjunction with cracking/distress category to determine viable Treatment Options as per Treatment Matrices – Asphalt Surface. Each Treatment Table contains the Treatment Group and the Treatment number shown in parentheses. The Treatment Groups, Treatment numbers and the Treatments are listed in Table C. Refer to the Glossary for a definition of each Treatment.
Preliminary Procedures
Section 08: Initial Treatment Identification
Updated 08/29/2013 Return to Table of Contents
2-19
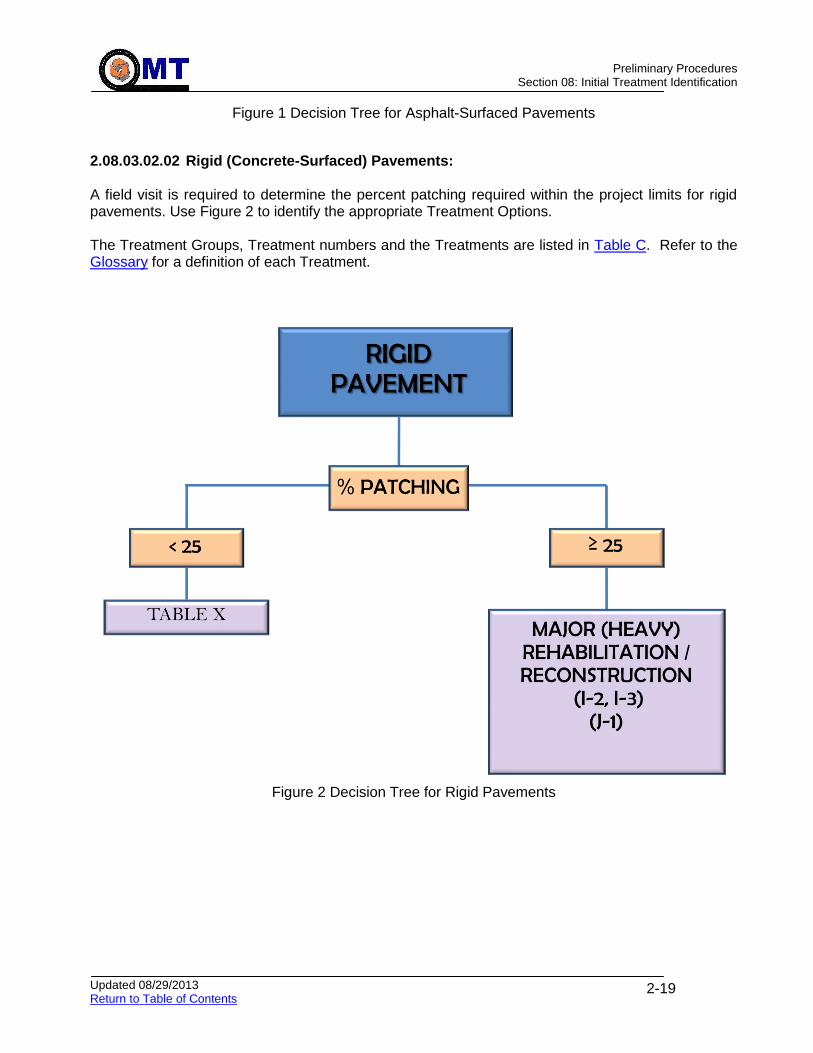
Figure 1 Decision Tree for Asphalt-Surfaced Pavements
2.08.03.02.02 Rigid (Concrete-Surfaced) Pavements: A field visit is required to determine the percent patching required within the project limits for rigid pavements. Use Figure 2 to identify the appropriate Treatment Options. The Treatment Groups, Treatment numbers and the Treatments are listed in Table C. Refer to the Glossary for a definition of each Treatment.
Figure 2 Decision Tree for Rigid Pavements

Preliminary Procedures
Section 08: Initial Treatment Identification
Updated 08/29/2013 Return to Table of Contents
2-20
2.08.03.03 Treatment Matrices – Asphalt Surface
Table I Pavement Type: Asphalt Surface ADT: 0 to ≤ 4,000, IRI: 0 to ≤ 100
SCI FCI Skid Rutting
(in.) A. Crack/ Joint Seal
B. Asphalt Rejuvenator
C. Aggregate Seals
D. HMA Overlay**
E. PCC Overlay
F. Patch
H. Surface Texturizing
I. Major Rehab**
J. Reconstruction
≤ 50
> 75
>40
< ½" D-3 I-1, I-2*, I-3* J-1, J-2
½" to 1" D-3, D-4 I-1, I-2*, I-3* J-1, J-2
>1" D-2, D-3, D-4 I-1, I-2*, I-3* J-1, J-2
≤ 40
< ½" D-3 I-1, I-2*, I-3* J-1, J-2
½" to 1" D-3, D-4 I-1, I-2*, I-3* J-1, J-2
>1" D-2, D-3, D-4 I-1, I-2*, I-3* J-1, J-2
≤ 75
>40
< ½" D-3 I-1, I-2*, I-3* J-1, J-2
½" to 1" D-3, D-4 I-1, I-2*, I-3* J-1, J-2
>1" D-2, D-3, D-4 I-1, I-2*, I-3* J-1, J-2
≤ 40
< ½" D-3 I-1, I-2*, I-3* J-1, J-2
½" to 1" D-3, D-4 I-1, I-2*, I-3* J-1, J-2
>1" D-2, D-3, D-4 I-1, I-2*, I-3* J-1, J-2
51 to ≤ 75
> 75
>40
< ½" D-3, D-5 I-1
½" to 1" D-3, D-4, D-5 I-1
>1" D-2 thru D-5 I-1
≤ 40
< ½" D-3, D-5 I-1
½" to 1" D-3, D-4, D-5 I-1
>1" D-2 thru D-5 I-1
≤ 75
>40
< ½" D-3, D-5 I-1
½" to 1" D-3, D-4, D-5 I-1
>1" D-2 thru D-5 I-1
≤ 40
< ½" D-3, D-5 I-1
½" to 1" D-3, D-4, D-5 I-1
>1" D-2 thru D-5 I-1
> 75
> 75
>40
< ½" A-1 B-1, B-2 All but C-3 D1, D-3 F-1
½" to 1" A-1 B-1, B-2 C-8 D-3, D-4 F-1 H-1
>1" A-1 B-1, B-2 D-2, D-3, D-4 F-1 H-1
≤ 40
< ½" A-1 C-1 thru C-8 D1, D-3 F-1 H-5
½" to 1" A-1 C-8 D-3, D-4 F-1 H-1
>1" A-1 D-2, D-3, D-4 F-1 H-1
≤ 75
>40
< ½" A-1 B-1, B-2 All but C-3 D1, D-3
½" to 1" A-1 B-1, B-2 C-8 D-3, D-4 H-1
>1" A-1 B-1, B-2 D-2, D-3, D-4 H-1
≤ 40
< ½" A-1 C-1 thru C-8 D1, D-3 H-5
½" to 1" A-1 C-8 D-3, D-4 H-1
>1" A-1 D-2, D-3, D-4 H-1
Note: See Table C for Treatment Activities. *I-2 and I-3 apply to composite pavements only. **D-2 shall replace D-3; and D-4, D5 and I-1 do not apply to pavements with predominant Curb & Gutter. Click to go to Initial Treatment Identification – Pavement Preservation Guide

Preliminary Procedures
Section 08: Initial Treatment Identification
Updated 08/29/2013 Return to Table of Contents
2-21
Table II Pavement Type: Asphalt Surface
ADT: 0 to ≤ 4,000 IRI: 101 to ≤ 170
SCI FCI Skid Rutting
(in.)
A. Crack/ Joint Seal
B. Asphalt Rejuvenator
C. Aggregate Seals
D. HMA Overlay**
E. PCC Overlay
F. Patch
H. Surface Texturizing
I. Major Rehab**
J. Reconstruction
≤ 50
> 75
>40
< ½" D-3 I-1, I-2*, I-3* J-1, J-2
½" to 1" D-3, D-4 I-1, I-2*, I-3* J-1, J-2
>1" D-2, D-3, D-4 I-1, I-2*, I-3* J-1, J-2
≤ 40
< ½" D-3 I-1, I-2*, I-3* J-1, J-2
½" to 1" D-3, D-4 I-1, I-2*, I-3* J-1, J-2
>1" D-2, D-3, D-4 I-1, I-2*, I-3* J-1, J-2
≤ 75
>40
< ½" D-3 I-1, I-2*, I-3* J-1, J-2
½" to 1" D-3, D-4 I-1, I-2*, I-3* J-1, J-2
>1" D-2, D-3, D-4 I-1, I-2*, I-3* J-1, J-2
≤ 40
< ½" D-3 I-1, I-2*, I-3* J-1, J-2
½" to 1" D-3, D-4 I-1, I-2*, I-3* J-1, J-2
>1" D-2, D-3, D-4 I-1, I-2*, I-3* J-1, J-2
51 to ≤ 75
> 75
>40
< ½" D-3, D-5 I-1
½" to 1" D-3, D-4, D-5 I-1
>1" D-2 thru D-5 I-1
≤ 40
< ½" D-3, D-5 I-1
½" to 1" D-3, D-4, D-5 I-1
>1" D-2 thru D-5 I-1
≤ 75
>40
< ½" D-3, D-5 I-1
½" to 1" D-3, D-4, D-5 I-1
>1" D-2 thru D-5 I-1
≤ 40
< ½" D-3, D-5 I-1
½" to 1" D-3, D-4, D-5 I-1
>1" D-2 thru D-5 I-1
> 75
> 75
>40
< ½"
C-8 D1, D-3 F-1
½" to 1"
C-8 D-3, D-4 F-1 H-1
>1"
D-2, D-3, D-4 F-1 H-1
≤ 40
< ½"
C-3, C-8 D1, D-3 F-1 H-5
½" to 1"
C-8 D-3, D-4 F-1 H-1
>1"
D-2, D-3, D-4 F-1 H-1
≤ 75
>40
< ½"
C-8 D1, D-3
½" to 1"
C-8 D-3, D-4 H-1
>1"
D-2, D-3, D-4 H-1
≤ 40
< ½"
C-3, C-8 D1, D-3 H-5
½" to 1"
C-8 D-3, D-4 H-1
>1"
D-2, D-3, D-4 H-1
Note: See Table C for Treatment Activities. *I-2 and I-3 apply to composite pavements only. **D-2 shall replace D-3; and D-4, D5 and I-1 do not apply to pavements with predominant Curb & Gutter. Click to go to Initial Treatment Identification – Pavement Preservation Guide
Preliminary Procedures
Section 08: Initial Treatment Identification
Updated 08/29/2013 Return to Table of Contents
2-22
Table III Pavement Type: Asphalt Surface
ADT: 0 to ≤ 4,000 IRI: > 170
SCI FCI Skid Rutting
(in.)
A. Crack/ Joint Seal
B. Asphalt Rejuvenator
C. Aggregate Seals
D. HMA Overlay**
E. PCC Overlay
F. Patch
H. Surface Texturizing
I. Major Rehab**
J. Reconstruction
≤ 50
> 75
>40
< ½" D-2, D-4 I-1, I-2*, I-3* J-1, J-2
½" to 1" D-2, D-4 I-1, I-2*, I-3* J-1, J-2
>1" D-2, D-4 I-1, I-2*, I-3* J-1, J-2
≤ 40
< ½" D-2, D-4 I-1, I-2*, I-3* J-1, J-2
½" to 1" D-2, D-4 I-1, I-2*, I-3* J-1, J-2
>1" D-2, D-4 I-1, I-2*, I-3* J-1, J-2
≤ 75
>40
< ½" D-2, D-4 I-1, I-2*, I-3* J-1, J-2
½" to 1" D-2, D-4 I-1, I-2*, I-3* J-1, J-2
>1" D-2, D-4 I-1, I-2*, I-3* J-1, J-2
≤ 40
< ½" D-2, D-4 I-1, I-2*, I-3* J-1, J-2
½" to 1" D-2, D-4 I-1, I-2*, I-3* J-1, J-2
>1" D-2, D-4 I-1, I-2*, I-3* J-1, J-2
51 to ≤ 75
> 75
>40
< ½" D-2, D-4 I-1
½" to 1" D-2, D-4 I-1
>1" D-2, D-4 I-1
≤ 40
< ½" D-2, D-4 I-1
½" to 1" D-2, D-4 I-1
>1" D-2, D-4 I-1
≤ 75
>40
< ½" D-2, D-4 I-1
½" to 1" D-2, D-4 I-1
>1" D-2, D-4 I-1
≤ 40
< ½" D-2, D-4 I-1
½" to 1" D-2, D-4 I-1
>1" D-2, D-4 I-1
> 75
> 75
>40
< ½"
D-2, D-4
½" to 1"
D-2, D-4
H-1
>1"
D-2, D-4
H-1
≤ 40
< ½"
D-2, D-4
H-5
½" to 1"
D-2, D-4
H-1
>1"
D-2, D-4
H-1
≤ 75
>40
< ½"
D-2, D-4
½" to 1"
D-2, D-4 H-1
>1"
D-2, D-4 H-1
≤ 40
< ½"
D-2, D-4 H-5
½" to 1"
D-2, D-4 H-1
>1"
D-2, D-4 H-1
Note: See Table C for Treatment Activities. *I-2 and I-3 apply to composite pavements only. **D-2 shall replace D-3; and D-4, D5 and I-1 do not apply to pavements with predominant Curb & Gutter. Click to go to Initial Treatment Identification – Pavement Preservation Guide

Preliminary Procedures
Section 08: Initial Treatment Identification
Updated 08/29/2013 Return to Table of Contents
2-23
Table IV Pavement Type: Asphalt Surface
ADT: 4,000 to ≤ 25,000 IRI: 0 to ≤ 100
SCI FCI Skid Rutting
(in.)
A. Crack/ Joint Seal
B. Asphalt Rejuvenator
C. Aggregate Seals
D. HMA Overlay**
E. PCC Overlay
F. Patch
H. Surface Texturizing
I. Major Rehab**
J. Reconstruction
≤ 50
> 75
>40
< ½" D-3 I-1, I-2*, I-3* J-1, J-2
½" to 1" D-3, D-4 I-1, I-2*, I-3* J-1, J-2
>1" D-2, D-3, D-4 I-1, I-2*, I-3* J-1, J-2
≤ 40
< ½" D-3 I-1, I-2*, I-3* J-1, J-2
½" to 1" D-3, D-4 I-1, I-2*, I-3* J-1, J-2
>1" D-2, D-3, D-4 I-1, I-2*, I-3* J-1, J-2
≤ 75
>40
< ½" D-3 I-1, I-2*, I-3* J-1, J-2
½" to 1" D-3, D-4 I-1, I-2*, I-3* J-1, J-2
>1" D-2, D-3, D-4 I-1, I-2*, I-3* J-1, J-2
≤ 40
< ½" D-3 I-1, I-2*, I-3* J-1, J-2
½" to 1" D-3, D-4 I-1, I-2*, I-3* J-1, J-2
>1" D-2, D-3, D-4 I-1, I-2*, I-3* J-1, J-2
51 to ≤ 75
> 75
>40
< ½" D-3, D-5 I-1
½" to 1" D-3, D-4, D-5 I-1
>1" D-2 thru D-5 I-1
≤ 40
< ½" D-3, D-5 I-1
½" to 1" D-3, D-4, D-5 I-1
>1" D-2 thru D-5 I-1
≤ 75
>40
< ½" D-3, D-5 I-1
½" to 1" D-3, D-4, D-5 I-1
>1" D-2 thru D-5 I-1
≤ 40
< ½" D-3, D-5 I-1
½" to 1" D-3, D-4, D-5 I-1
>1" D-2 thru D-5 I-1
> 75
> 75
>40
< ½" A-1 B-1, B-2 C-1, C-8 D1, D-3 F-1
½" to 1" A-1 B-1, B-2 C-8 D-3, D-4 F-1 H-1
>1" A-1 B-1, B-2 D-2, D-3, D-4 F-1 H-1
≤ 40
< ½" A-1 C-1, C-3, C-8 D1, D-3 F-1 H-5
½" to 1" A-1 C-8 D-3, D-4 F-1 H-1
>1" A-1 D-2, D-3, D-4 F-1 H-1
≤ 75
>40
< ½" A-1 B-1, B-2 C-1, C-8 D1, D-3
½" to 1" A-1 B-1, B-2 C-8 D-3, D-4 H-1
>1" A-1 B-1, B-2 D-2, D-3, D-4 H-1
≤ 40
< ½" A-1 C-1, C-3, C-8 D1, D-3 H-5
½" to 1" A-1 C-8 D-3, D-4 H-1
>1" A-1 D-2, D-3, D-4 H-1
Note: See Table C for Treatment Activities. *I-2 and I-3 apply to composite pavements only. **D-2 shall replace D-3; and D-4, D5 and I-1 do not apply to pavements with predominant Curb & Gutter. Click to go to Initial Treatment Identification – Pavement Preservation Guide
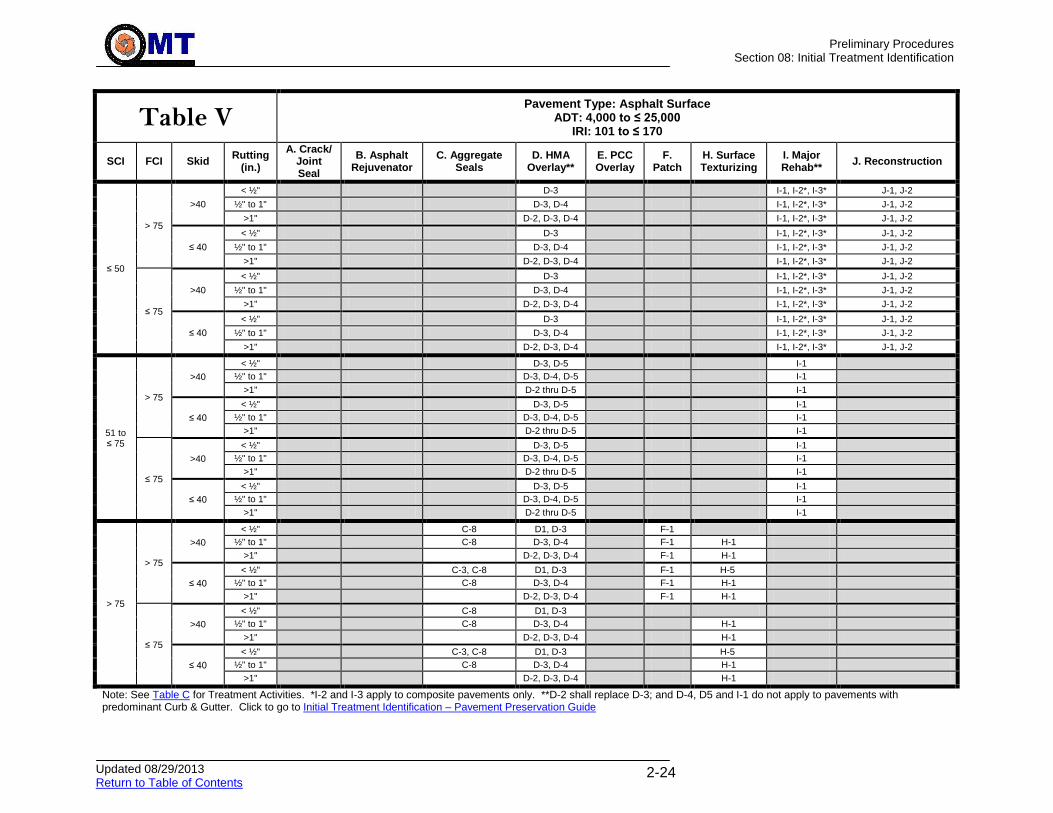
Preliminary Procedures
Section 08: Initial Treatment Identification
Updated 08/29/2013 Return to Table of Contents
2-24
Table V Pavement Type: Asphalt Surface
ADT: 4,000 to ≤ 25,000 IRI: 101 to ≤ 170
SCI FCI Skid Rutting
(in.)
A. Crack/ Joint Seal
B. Asphalt Rejuvenator
C. Aggregate Seals
D. HMA Overlay**
E. PCC Overlay
F. Patch
H. Surface Texturizing
I. Major Rehab**
J. Reconstruction
≤ 50
> 75
>40
< ½" D-3 I-1, I-2*, I-3* J-1, J-2
½" to 1" D-3, D-4 I-1, I-2*, I-3* J-1, J-2
>1" D-2, D-3, D-4 I-1, I-2*, I-3* J-1, J-2
≤ 40
< ½" D-3 I-1, I-2*, I-3* J-1, J-2
½" to 1" D-3, D-4 I-1, I-2*, I-3* J-1, J-2
>1" D-2, D-3, D-4 I-1, I-2*, I-3* J-1, J-2
≤ 75
>40
< ½" D-3 I-1, I-2*, I-3* J-1, J-2
½" to 1" D-3, D-4 I-1, I-2*, I-3* J-1, J-2
>1" D-2, D-3, D-4 I-1, I-2*, I-3* J-1, J-2
≤ 40
< ½" D-3 I-1, I-2*, I-3* J-1, J-2
½" to 1" D-3, D-4 I-1, I-2*, I-3* J-1, J-2
>1" D-2, D-3, D-4 I-1, I-2*, I-3* J-1, J-2
51 to ≤ 75
> 75
>40
< ½" D-3, D-5 I-1
½" to 1" D-3, D-4, D-5 I-1
>1" D-2 thru D-5 I-1
≤ 40
< ½" D-3, D-5 I-1
½" to 1" D-3, D-4, D-5 I-1
>1" D-2 thru D-5 I-1
≤ 75
>40
< ½" D-3, D-5 I-1
½" to 1" D-3, D-4, D-5 I-1
>1" D-2 thru D-5 I-1
≤ 40
< ½" D-3, D-5 I-1
½" to 1" D-3, D-4, D-5 I-1
>1" D-2 thru D-5 I-1
> 75
> 75
>40
< ½"
C-8 D1, D-3 F-1
½" to 1"
C-8 D-3, D-4 F-1 H-1
>1"
D-2, D-3, D-4 F-1 H-1
≤ 40
< ½"
C-3, C-8 D1, D-3 F-1 H-5
½" to 1"
C-8 D-3, D-4 F-1 H-1
>1"
D-2, D-3, D-4 F-1 H-1
≤ 75
>40
< ½"
C-8 D1, D-3
½" to 1"
C-8 D-3, D-4 H-1
>1"
D-2, D-3, D-4 H-1
≤ 40
< ½"
C-3, C-8 D1, D-3 H-5
½" to 1"
C-8 D-3, D-4 H-1
>1"
D-2, D-3, D-4 H-1
Note: See Table C for Treatment Activities. *I-2 and I-3 apply to composite pavements only. **D-2 shall replace D-3; and D-4, D5 and I-1 do not apply to pavements with predominant Curb & Gutter. Click to go to Initial Treatment Identification – Pavement Preservation Guide
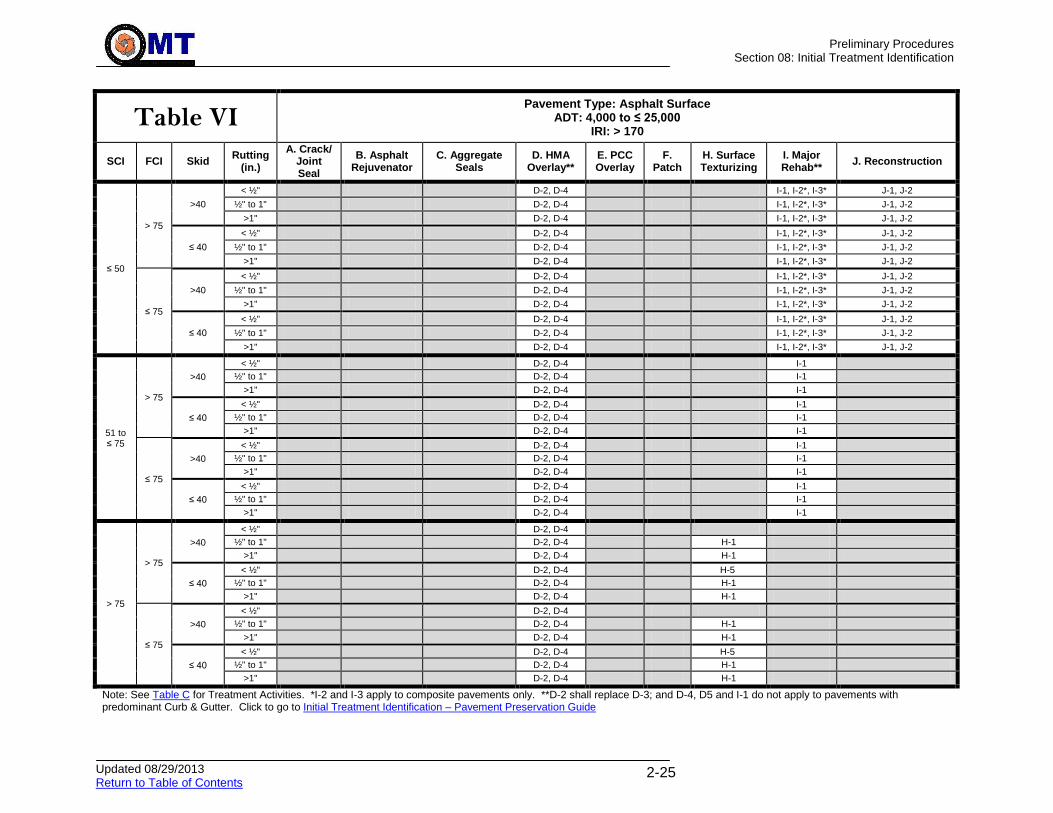
Preliminary Procedures
Section 08: Initial Treatment Identification
Updated 08/29/2013 Return to Table of Contents
2-25
Table VI Pavement Type: Asphalt Surface
ADT: 4,000 to ≤ 25,000 IRI: > 170
SCI FCI Skid Rutting
(in.)
A. Crack/ Joint Seal
B. Asphalt Rejuvenator
C. Aggregate Seals
D. HMA Overlay**
E. PCC Overlay
F. Patch
H. Surface Texturizing
I. Major Rehab**
J. Reconstruction
≤ 50
> 75
>40
< ½" D-2, D-4 I-1, I-2*, I-3* J-1, J-2
½" to 1" D-2, D-4 I-1, I-2*, I-3* J-1, J-2
>1" D-2, D-4 I-1, I-2*, I-3* J-1, J-2
≤ 40
< ½" D-2, D-4 I-1, I-2*, I-3* J-1, J-2
½" to 1" D-2, D-4 I-1, I-2*, I-3* J-1, J-2
>1" D-2, D-4 I-1, I-2*, I-3* J-1, J-2
≤ 75
>40
< ½" D-2, D-4 I-1, I-2*, I-3* J-1, J-2
½" to 1" D-2, D-4 I-1, I-2*, I-3* J-1, J-2
>1" D-2, D-4 I-1, I-2*, I-3* J-1, J-2
≤ 40
< ½" D-2, D-4 I-1, I-2*, I-3* J-1, J-2
½" to 1" D-2, D-4 I-1, I-2*, I-3* J-1, J-2
>1" D-2, D-4 I-1, I-2*, I-3* J-1, J-2
51 to ≤ 75
> 75
>40
< ½" D-2, D-4 I-1
½" to 1" D-2, D-4 I-1
>1" D-2, D-4 I-1
≤ 40
< ½" D-2, D-4 I-1
½" to 1" D-2, D-4 I-1
>1" D-2, D-4 I-1
≤ 75
>40
< ½" D-2, D-4 I-1
½" to 1" D-2, D-4 I-1
>1" D-2, D-4 I-1
≤ 40
< ½" D-2, D-4 I-1
½" to 1" D-2, D-4 I-1
>1" D-2, D-4 I-1
> 75
> 75
>40
< ½"
D-2, D-4
½" to 1"
D-2, D-4
H-1
>1"
D-2, D-4
H-1
≤ 40
< ½"
D-2, D-4
H-5
½" to 1"
D-2, D-4
H-1
>1"
D-2, D-4
H-1
≤ 75
>40
< ½"
D-2, D-4
½" to 1"
D-2, D-4 H-1
>1"
D-2, D-4 H-1
≤ 40
< ½"
D-2, D-4 H-5
½" to 1"
D-2, D-4 H-1
>1"
D-2, D-4 H-1
Note: See Table C for Treatment Activities. *I-2 and I-3 apply to composite pavements only. **D-2 shall replace D-3; and D-4, D5 and I-1 do not apply to pavements with predominant Curb & Gutter. Click to go to Initial Treatment Identification – Pavement Preservation Guide
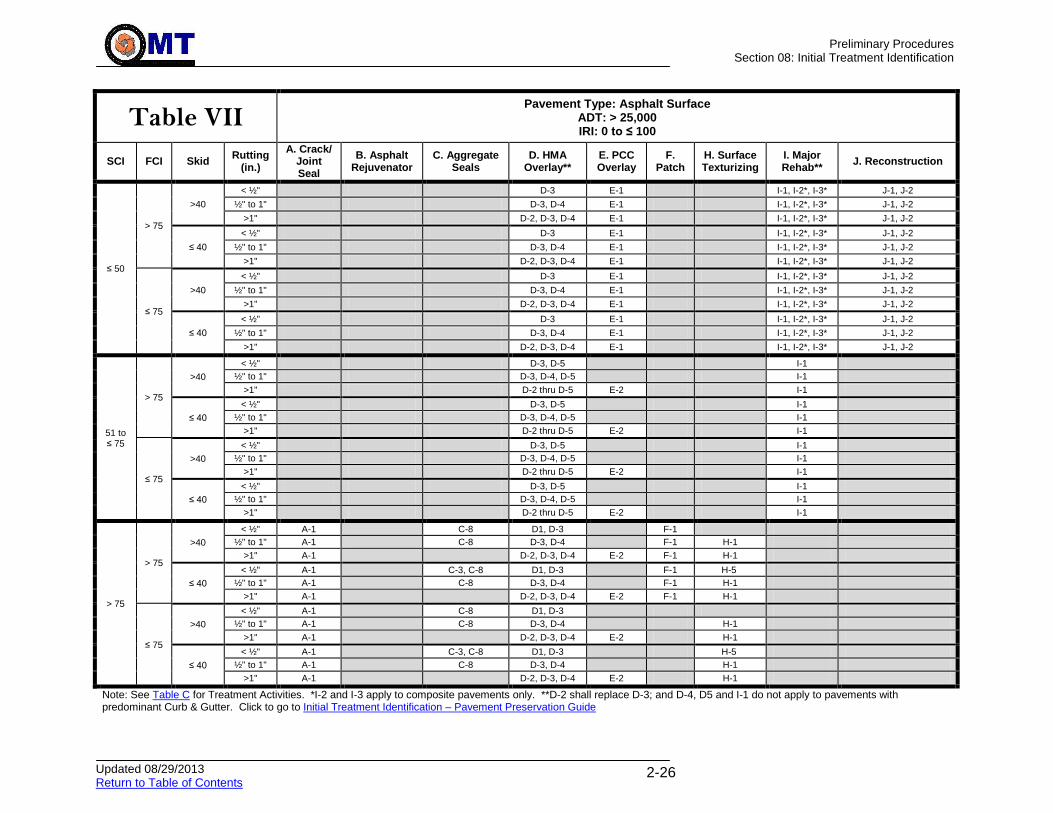
Preliminary Procedures
Section 08: Initial Treatment Identification
Updated 08/29/2013 Return to Table of Contents
2-26
Table VII Pavement Type: Asphalt Surface
ADT: > 25,000 IRI: 0 to ≤ 100
SCI FCI Skid Rutting
(in.)
A. Crack/ Joint Seal
B. Asphalt Rejuvenator
C. Aggregate Seals
D. HMA Overlay**
E. PCC Overlay
F. Patch
H. Surface Texturizing
I. Major Rehab**
J. Reconstruction
≤ 50
> 75
>40
< ½" D-3 E-1 I-1, I-2*, I-3* J-1, J-2
½" to 1" D-3, D-4 E-1 I-1, I-2*, I-3* J-1, J-2
>1" D-2, D-3, D-4 E-1 I-1, I-2*, I-3* J-1, J-2
≤ 40
< ½" D-3 E-1 I-1, I-2*, I-3* J-1, J-2
½" to 1" D-3, D-4 E-1 I-1, I-2*, I-3* J-1, J-2
>1" D-2, D-3, D-4 E-1 I-1, I-2*, I-3* J-1, J-2
≤ 75
>40
< ½" D-3 E-1 I-1, I-2*, I-3* J-1, J-2
½" to 1" D-3, D-4 E-1 I-1, I-2*, I-3* J-1, J-2
>1" D-2, D-3, D-4 E-1 I-1, I-2*, I-3* J-1, J-2
≤ 40
< ½" D-3 E-1 I-1, I-2*, I-3* J-1, J-2
½" to 1" D-3, D-4 E-1 I-1, I-2*, I-3* J-1, J-2
>1" D-2, D-3, D-4 E-1 I-1, I-2*, I-3* J-1, J-2
51 to ≤ 75
> 75
>40
< ½" D-3, D-5
I-1
½" to 1" D-3, D-4, D-5
I-1
>1" D-2 thru D-5 E-2 I-1
≤ 40
< ½" D-3, D-5
I-1
½" to 1" D-3, D-4, D-5
I-1
>1" D-2 thru D-5 E-2 I-1
≤ 75
>40
< ½" D-3, D-5
I-1
½" to 1" D-3, D-4, D-5
I-1
>1" D-2 thru D-5 E-2 I-1
≤ 40
< ½" D-3, D-5
I-1
½" to 1" D-3, D-4, D-5
I-1
>1" D-2 thru D-5 E-2 I-1
> 75
> 75
>40
< ½" A-1
C-8 D1, D-3
F-1
½" to 1" A-1
C-8 D-3, D-4
F-1 H-1
>1" A-1
D-2, D-3, D-4 E-2 F-1 H-1
≤ 40
< ½" A-1
C-3, C-8 D1, D-3
F-1 H-5
½" to 1" A-1
C-8 D-3, D-4
F-1 H-1
>1" A-1
D-2, D-3, D-4 E-2 F-1 H-1
≤ 75
>40
< ½" A-1
C-8 D1, D-3
½" to 1" A-1
C-8 D-3, D-4
H-1
>1" A-1
D-2, D-3, D-4 E-2 H-1
≤ 40
< ½" A-1
C-3, C-8 D1, D-3
H-5
½" to 1" A-1
C-8 D-3, D-4
H-1
>1" A-1
D-2, D-3, D-4 E-2 H-1
Note: See Table C for Treatment Activities. *I-2 and I-3 apply to composite pavements only. **D-2 shall replace D-3; and D-4, D5 and I-1 do not apply to pavements with predominant Curb & Gutter. Click to go to Initial Treatment Identification – Pavement Preservation Guide
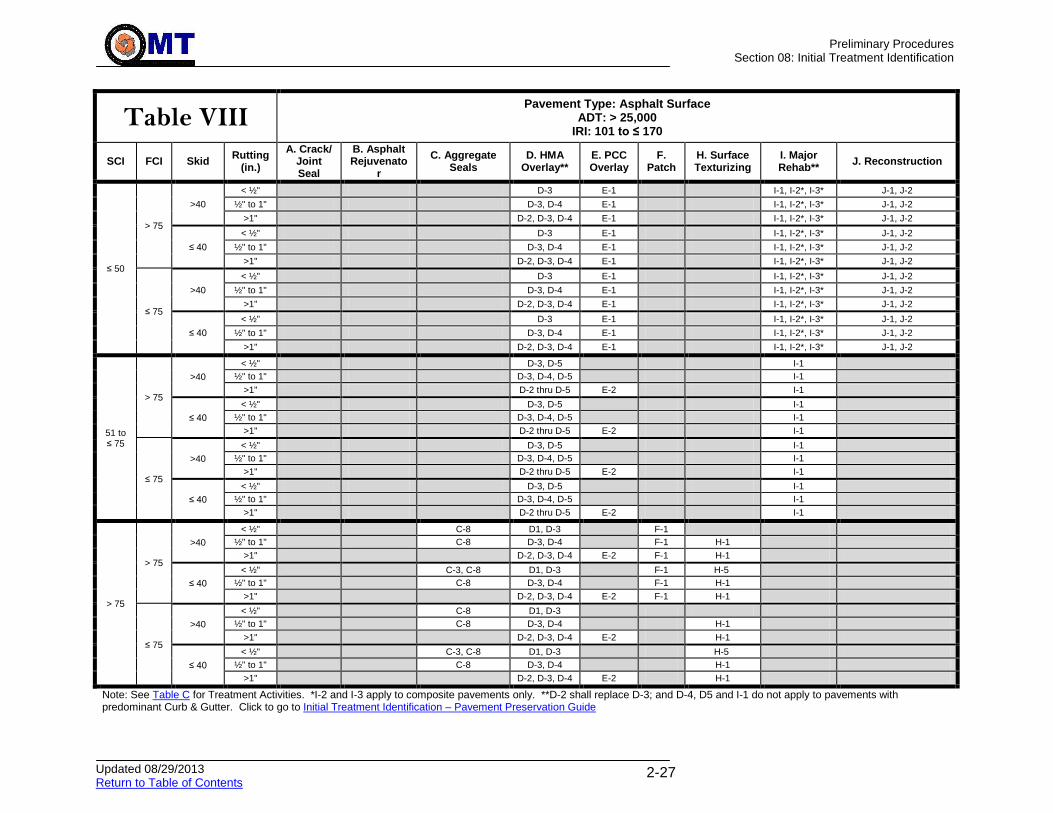
Preliminary Procedures
Section 08: Initial Treatment Identification
Updated 08/29/2013 Return to Table of Contents
2-27
Table VIII Pavement Type: Asphalt Surface
ADT: > 25,000 IRI: 101 to ≤ 170
SCI FCI Skid Rutting
(in.)
A. Crack/ Joint Seal
B. Asphalt Rejuvenato
r
C. Aggregate Seals
D. HMA Overlay**
E. PCC Overlay
F. Patch
H. Surface Texturizing
I. Major Rehab**
J. Reconstruction
≤ 50
> 75
>40
< ½" D-3 E-1 I-1, I-2*, I-3* J-1, J-2
½" to 1" D-3, D-4 E-1 I-1, I-2*, I-3* J-1, J-2
>1" D-2, D-3, D-4 E-1 I-1, I-2*, I-3* J-1, J-2
≤ 40
< ½" D-3 E-1 I-1, I-2*, I-3* J-1, J-2
½" to 1" D-3, D-4 E-1 I-1, I-2*, I-3* J-1, J-2
>1" D-2, D-3, D-4 E-1 I-1, I-2*, I-3* J-1, J-2
≤ 75
>40
< ½" D-3 E-1 I-1, I-2*, I-3* J-1, J-2
½" to 1" D-3, D-4 E-1 I-1, I-2*, I-3* J-1, J-2
>1" D-2, D-3, D-4 E-1 I-1, I-2*, I-3* J-1, J-2
≤ 40
< ½" D-3 E-1 I-1, I-2*, I-3* J-1, J-2
½" to 1" D-3, D-4 E-1 I-1, I-2*, I-3* J-1, J-2
>1" D-2, D-3, D-4 E-1 I-1, I-2*, I-3* J-1, J-2
51 to ≤ 75
> 75
>40
< ½" D-3, D-5
I-1
½" to 1" D-3, D-4, D-5
I-1
>1" D-2 thru D-5 E-2 I-1
≤ 40
< ½" D-3, D-5
I-1
½" to 1" D-3, D-4, D-5
I-1
>1" D-2 thru D-5 E-2 I-1
≤ 75
>40
< ½" D-3, D-5
I-1
½" to 1" D-3, D-4, D-5
I-1
>1" D-2 thru D-5 E-2 I-1
≤ 40
< ½" D-3, D-5
I-1
½" to 1" D-3, D-4, D-5
I-1
>1" D-2 thru D-5 E-2 I-1
> 75
> 75
>40
< ½"
C-8 D1, D-3
F-1
½" to 1"
C-8 D-3, D-4
F-1 H-1
>1"
D-2, D-3, D-4 E-2 F-1 H-1
≤ 40
< ½"
C-3, C-8 D1, D-3
F-1 H-5
½" to 1"
C-8 D-3, D-4
F-1 H-1
>1"
D-2, D-3, D-4 E-2 F-1 H-1
≤ 75
>40
< ½"
C-8 D1, D-3
½" to 1"
C-8 D-3, D-4
H-1
>1"
D-2, D-3, D-4 E-2 H-1
≤ 40
< ½"
C-3, C-8 D1, D-3
H-5
½" to 1"
C-8 D-3, D-4
H-1
>1"
D-2, D-3, D-4 E-2 H-1
Note: See Table C for Treatment Activities. *I-2 and I-3 apply to composite pavements only. **D-2 shall replace D-3; and D-4, D5 and I-1 do not apply to pavements with predominant Curb & Gutter. Click to go to Initial Treatment Identification – Pavement Preservation Guide

Preliminary Procedures
Section 08: Initial Treatment Identification
Updated 08/29/2013 Return to Table of Contents
2-28
Table IX Pavement Type: Asphalt Surface
ADT: > 25,000 IRI: > 170
SCI FCI Skid Rutting
(in.)
A. Crack/ Joint Seal
B. Asphalt Rejuvenator
C. Aggregate Seals
D. HMA Overlay**
E. PCC Overlay
F. Patch
H. Surface Texturizing
I. Major Rehab**
J. Reconstruction
≤ 50
> 75
>40
< ½" D-2, D-4 E-1 I-1, I-2*, I-3* J-1, J-2
½" to 1" D-2, D-4 E-1 I-1, I-2*, I-3* J-1, J-2
>1" D-2, D-4 E-1 I-1, I-2*, I-3* J-1, J-2
≤ 40
< ½" D-2, D-4 E-1 I-1, I-2*, I-3* J-1, J-2
½" to 1" D-2, D-4 E-1 I-1, I-2*, I-3* J-1, J-2
>1" D-2, D-4 E-1 I-1, I-2*, I-3* J-1, J-2
≤ 75
>40
< ½" D-2, D-4 E-1 I-1, I-2*, I-3* J-1, J-2
½" to 1" D-2, D-4 E-1 I-1, I-2*, I-3* J-1, J-2
>1" D-2, D-4 E-1 I-1, I-2*, I-3* J-1, J-2
≤ 40
< ½" D-2, D-4 E-1 I-1, I-2*, I-3* J-1, J-2
½" to 1" D-2, D-4 E-1 I-1, I-2*, I-3* J-1, J-2
>1" D-2, D-4 E-1 I-1, I-2*, I-3* J-1, J-2
51 to ≤ 75
> 75
>40
< ½" D-2, D-4
I-1
½" to 1" D-2, D-4
I-1
>1" D-2, D-4 E-2 I-1
≤ 40
< ½" D-2, D-4
I-1
½" to 1" D-2, D-4
I-1
>1" D-2, D-4 E-2 I-1
≤ 75
>40
< ½" D-2, D-4
I-1
½" to 1" D-2, D-4
I-1
>1" D-2, D-4 E-2 I-1
≤ 40
< ½" D-2, D-4
I-1
½" to 1" D-2, D-4
I-1
>1" D-2, D-4 E-2 I-1
> 75
> 75
>40
< ½"
D-2, D-4
½" to 1"
D-2, D-4
H-1
>1"
D-2, D-4 E-2
H-1
≤ 40
< ½"
D-2, D-4
H-5
½" to 1"
D-2, D-4
H-1
>1"
D-2, D-4 E-2
H-1
≤ 75
>40
< ½"
D-2, D-4
½" to 1"
D-2, D-4
H-1
>1"
D-2, D-4 E-2 H-1
≤ 40
< ½"
D-2, D-4
H-5
½" to 1"
D-2, D-4
H-1
>1"
D-2, D-4 E-2 H-1
Note: See Table C for Treatment Activities. *I-2 and I-3 apply to composite pavements only. **D-2 shall replace D-3; and D-4, D5 and I-1 do not apply to pavements with predominant Curb & Gutter. Click to go to Initial Treatment Identification – Pavement Preservation Guide

Preliminary Procedures
Section 08: Initial Treatment Identification
Updated 08/29/2013 Return to Table of Contents
2-29
2.08.03.04 Treatment Matrix – Concrete Surface Click to go to Initial Treatment Identification – Pavement Preservation Guide
Table X Pavement Surface: Concrete
Patching < 25%
Structural Distress
Cracking (≥ 5% of slabs)
Pumping (≥ 5% of slabs)
Joint/Crack Deterioration (including Faulting)
(≥ 8% of slabs)
Punchouts (≥ 5/mile)
Punchouts (≥ 5/mile)
Crack/Joint Seal (A-2, A-3) Patch (F-3)
Joint Treatments (G-1, G-2)
Patch (F-3) Joint Treatments (G-2, G-3)
Drainage Improvements
Crack/Joint Seal (A-2, A-3, A-4) HMA Overlay (D-3)
PCC Overlay (E-1, E-2) Patch (F-2, F-3)
Patch (F-3)
Joint/Crack Deterioration
(including Faulting)
(≥ 8% of slabs)
Crack/Joint Seal (A-2, A-3, A-4) HMA Overlay (D-3)
PCC Overlay (E-1, E-2) Patch (F-2, F-3)
Joint Treatments (G-1, G-2, G-3)
Crack/Joint Seal ( A-3, A-4) HMA Overlay (D-3)
PCC Overlay (E-1, E-2) Patch (F-2, F-3)
Joint Treatments (G-2, G-3) Drainage Improvements
Crack/Joint Seal (A-2, A-3, A-4) HMA Overlay (D-3)
PCC Overlay (E-1, E-2) Patch (F-2, F-3)
Joint Treatments (G-1, G-2, G-3)
Pumping (≥ 5% of slabs)
Crack/Joint Seal (A-2, A-3) Patch (F-3)
Joint Treatments (G-1, G-2, G-3) Drainage Improvements
Patch (F-3) Joint Treatments (G-2, G-3)
Drainage Improvements
Cracking (≥ 5% of slabs)
Crack/Joint Seal (A-2) Patch (F-2, F-3)
Joint Treatments (G-1, G-2)
Notes: 1. Note: See Table C for Treatment Activities. 2. Refer to the Concrete Distress Paver Manual of the U.S. Army Corps of Engineers for definitions of distresses.
3. If functional distresses (scaling, popouts, shrinkage cracks, etc.) are present, consider Grind (H-2) or Surface
Abrasion (H-5).
4. If shallow durability problems such as "D" cracking, and Alkali Silica Reactivity (ASR) are present, consider Grind (H-2) and Overlay (D-3, E-2). It should be noted that this strategy does not address the systemic problems associated with "D" cracking and ASR, and are only temporary solutions to the durability problems. Coordinate with PAGD to determine a permanent solution.

Preliminary Procedures
Section 08: Initial Treatment Identification
Updated 08/29/2013 Return to Table of Contents
2-30
2.08.03.04.01 Routine Maintenance for PCC Pavement with Sealed Joints, regardless of condition: Drainage outlets should be inspected every 2 years and maintained as needed. Years 10-12: Reseal joints. Year 20: Reseal joints. Year 25: If no treatments (aside from joint resealing) have yet been scheduled as a result of network-level condition assessments, this should be the time to make a project-level assessment as per Table X to determine treatment needs. Year 25 and beyond: For the years of 25 and beyond, it is suggested that a project-level assessment be made as per Table X to determine treatment needs every 5 years. 2.08.03.04.02 Routine Maintenance for PCC Pavement with Unsealed Joints, regardless of condition: The current design for concrete pavements in the State of Maryland specifies the following: Joints shall be single 1/8” saw-cut to a depth of 2” as per Section 520 of the Specifications and shall not be sealed. Unsealed joints require increased frequency of drainage outlet inspection and maintenance. Unsealed joints allow for the possibility of more water to enter the system; therefore, proper drainage must be maintained or base materials may become soft and erode, creating structural issues. A yearly inspection should be conducted without fail. Plugged drains should be cleared. If joint spalling develops due to the unsealed condition, provisions to seal the joints should be made as per Table X. The following maintenance schedule is recommended for all pavements with no joint seal. Drainage outlets should be inspected every year and maintained as needed. Year 25: If no treatments have yet been scheduled as a result of network-level condition assessments, this should be the time to make a project-level assessment as per Table X to determine treatment needs. Year 25 and beyond: For the years of 25 and beyond, it is suggested that a project-level assessment be made as per Table X to determine treatment needs every 5 years.

Preliminary Procedures
Section 08: Initial Treatment Identification
Updated 08/29/2013 Return to Table of Contents
2-31
2.08.03.05 Table C. List of Treatment Options Click to go to Initial Treatment Identification – Pavement Preservation Guide. Click to go to Supplemental Treatment Information Click to go to Discussion/Selection Alternative with Project Owner
Group Number Treatment Spec Status Contract Type
A. Crack/Joint Seals
A-1
Crack Fill & Crack Seal (Asphalt)
Needs Work
Crack and Joint Seals
A-2 Crack Seal (PCC Surface) Needs Work
A-3 Joint Sealing (and Resealing) Needs Work
A-4 Saw and Seal Needs Work
B. Asphalt Sealers /
Rejuvenators
B-1 Fog Seal Needs Work Asphalt Emulsion Seals
B-2 Rejuvenators None
C. Aggregate Seals
C-1 Cape Seal None Asphalt Emulsion Seals C-2 Chip Seal (Modified) None
C-3 High Friction Surface Up to Date High Friction Surf
C-4 Sand Seal None
Asphalt Emulsion Seals
C-5 Sandwich Seal None
C-6 Scrub Seal None
C-7 Slurry Seal Up to Date
C-8 Micro-surfacing Up to Date
D. HMA Overlay
D-1
Ultra-Thin Bonded Wearing Course Needs Work
Grind, Patch and Resurface
D-2
Grind & Overlay Up to Date
D-3
Overlay Up to Date
D-4
Wedge/Level & Overlay Up to Date
D-5
Hot-In-Place HMA Recycling (HIR)
None Hot In-Place
Recycling
E. PCC Overlay
E-1 PCC Overlay - Unbonded Needs Work PCC Resurfacing
E-2 PCC Overlay - Bonded Needs Work
F. Patch
F-1 HMA Patch Needs Work
Grind, Patch and Resurface
F-2
Partial-Depth Patch (Spall Repair) (Rigid Pavements)
Needs Work Concrete Pavement
Restoration F-3
Full-Depth Patch (Rigid Pavements)
Needs Work
G. Joint Treatments
G-1 Cross-Stitching None Concrete Pavement
Restoration G-2 Dowel Bar Retrofit Up to Date
G-3 Undersealing/Slab Stabilization None
H. Surface Texturizing
H-1 HMA Diamond Grinding Up to Date
Grind, Patch and Resurface
H-2 PCC Diamond Grinding Up to Date
H-3 Surface Carbide Grinding Needs Work
H-4 Diamond Grooving None
H-5 Surface Abrasion Up to Date
I. Major (Heavy)
Rehabilitation
I-1
Cold-In-Place HMA Recycling (CIR)
Up to Date Cold-In-Place
Recycling
I-2
Break/Crack & Seat and HMA Overlay
None Single Advertised
I-3 Rubbilization and HMA Overlay Needs Work
J. Reconstruction
J-1 Reconstruction Up to Date Single Advertised
J-2 Full-Depth Reclamation (FDR) Up to Date
Note: See the Glossary for definitions.
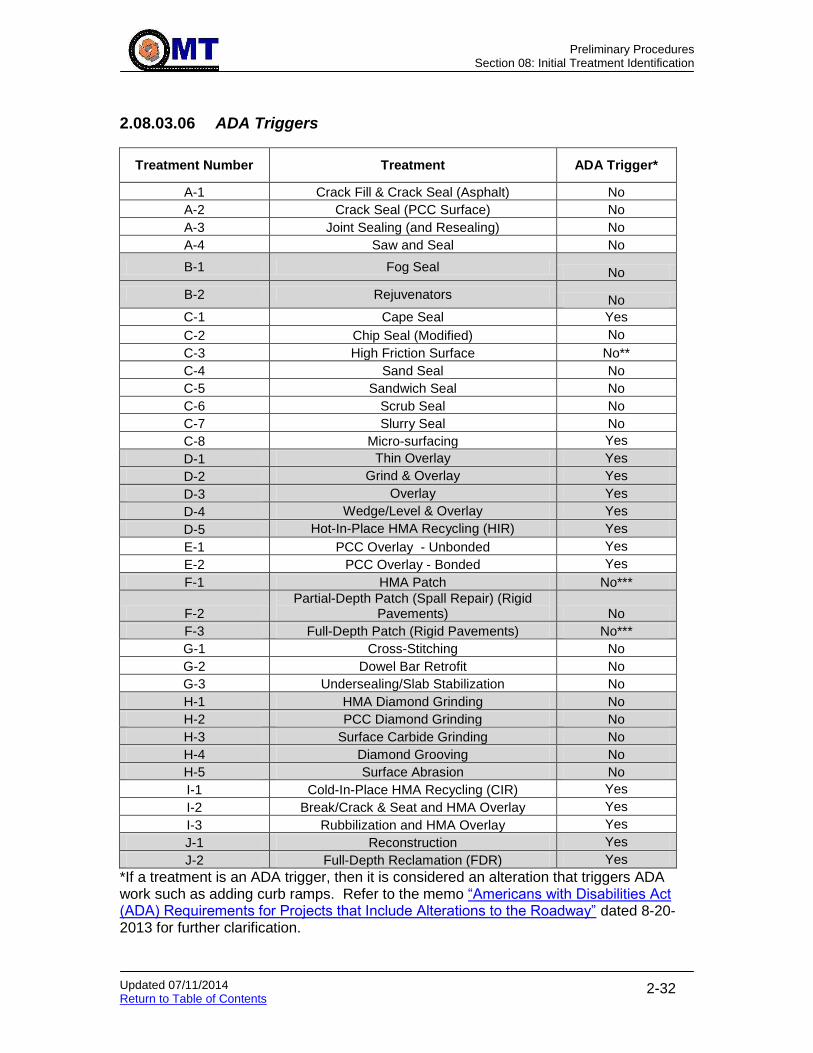
Preliminary Procedures
Section 08: Initial Treatment Identification
Updated 07/11/2014 Return to Table of Contents
2-32
2.08.03.06 ADA Triggers
Treatment Number Treatment ADA Trigger*
A-1 Crack Fill & Crack Seal (Asphalt) No
A-2 Crack Seal (PCC Surface) No
A-3 Joint Sealing (and Resealing) No
A-4 Saw and Seal No
B-1 Fog Seal No
B-2 Rejuvenators No
C-1 Cape Seal Yes
C-2 Chip Seal (Modified) No
C-3 High Friction Surface No**
C-4 Sand Seal No
C-5 Sandwich Seal No
C-6 Scrub Seal No
C-7 Slurry Seal No
C-8 Micro-surfacing Yes
D-1 Thin Overlay Yes
D-2 Grind & Overlay Yes
D-3 Overlay Yes
D-4 Wedge/Level & Overlay Yes
D-5 Hot-In-Place HMA Recycling (HIR) Yes
E-1 PCC Overlay - Unbonded Yes
E-2 PCC Overlay - Bonded Yes
F-1 HMA Patch No***
F-2 Partial-Depth Patch (Spall Repair) (Rigid
Pavements) No
F-3 Full-Depth Patch (Rigid Pavements) No***
G-1 Cross-Stitching No
G-2 Dowel Bar Retrofit No
G-3 Undersealing/Slab Stabilization No
H-1 HMA Diamond Grinding No
H-2 PCC Diamond Grinding No
H-3 Surface Carbide Grinding No
H-4 Diamond Grooving No
H-5 Surface Abrasion No
I-1 Cold-In-Place HMA Recycling (CIR) Yes
I-2 Break/Crack & Seat and HMA Overlay Yes
I-3 Rubbilization and HMA Overlay Yes
J-1 Reconstruction Yes
J-2 Full-Depth Reclamation (FDR) Yes
*If a treatment is an ADA trigger, then it is considered an alteration that triggers ADA work such as adding curb ramps. Refer to the memo “Americans with Disabilities Act (ADA) Requirements for Projects that Include Alterations to the Roadway” dated 8-20-2013 for further clarification.

Preliminary Procedures
Section 08: Initial Treatment Identification
Updated 07/11/2014 Return to Table of Contents
2-33
**High Friction Surface treatments are for spot locations. ADA alterations may be triggered if HFS is placed for longer stretches.
***Full-Depth patches should be an alteration if they span curb to curb.
2.08.03.07 Discussion with Customers Multiple Treatment Options may be selected from the matrices, depending on project-specific conditions. The final Treatment Option(s) to be considered for full analysis should be determined through discussion between the pavement engineer and the project manager.
The pavement engineer should present the list of possible treatments, and find out which, if any, of the treatments should not be considered further.
Those that are considered further will undergo design as per Pavement Preservation, Rehabilitation & Design.
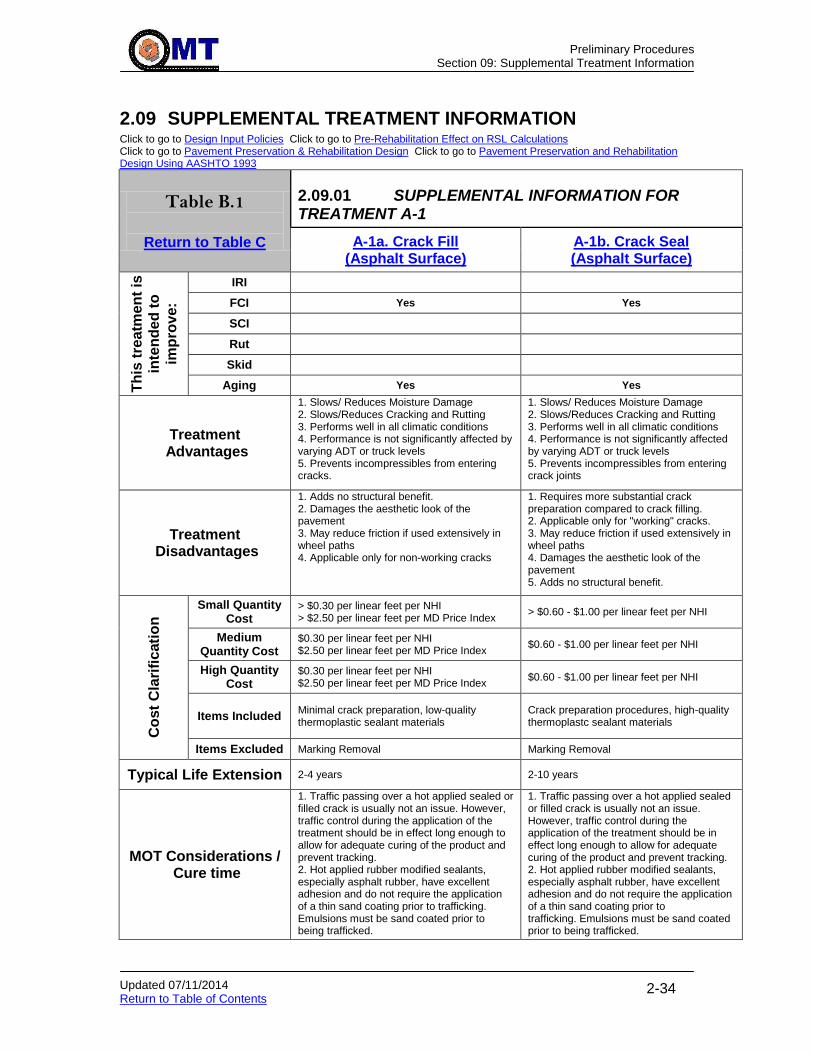
Preliminary Procedures
Section 09: Supplemental Treatment Information
Updated 07/11/2014 Return to Table of Contents
2-34
2.09 SUPPLEMENTAL TREATMENT INFORMATION Click to go to Design Input Policies Click to go to Pre-Rehabilitation Effect on RSL Calculations Click to go to Pavement Preservation & Rehabilitation Design Click to go to Pavement Preservation and Rehabilitation Design Using AASHTO 1993
Table B.1
Return to Table C
2.09.01 SUPPLEMENTAL INFORMATION FOR TREATMENT A-1
A-1a. Crack Fill (Asphalt Surface)
A-1b. Crack Seal (Asphalt Surface)
Th
is t
rea
tme
nt
is
inte
nd
ed
to
imp
rov
e:
IRI
FCI Yes Yes
SCI
Rut
Skid
Aging Yes Yes
Treatment Advantages
1. Slows/ Reduces Moisture Damage 2. Slows/Reduces Cracking and Rutting 3. Performs well in all climatic conditions 4. Performance is not significantly affected by varying ADT or truck levels 5. Prevents incompressibles from entering cracks.
1. Slows/ Reduces Moisture Damage 2. Slows/Reduces Cracking and Rutting 3. Performs well in all climatic conditions 4. Performance is not significantly affected by varying ADT or truck levels 5. Prevents incompressibles from entering crack joints
Treatment Disadvantages
1. Adds no structural benefit. 2. Damages the aesthetic look of the pavement 3. May reduce friction if used extensively in wheel paths 4. Applicable only for non-working cracks
1. Requires more substantial crack preparation compared to crack filling. 2. Applicable only for "working" cracks. 3. May reduce friction if used extensively in wheel paths 4. Damages the aesthetic look of the pavement 5. Adds no structural benefit.
Co
st
Cla
rifi
cati
on
Small Quantity Cost
> $0.30 per linear feet per NHI > $2.50 per linear feet per MD Price Index
> $0.60 - $1.00 per linear feet per NHI
Medium Quantity Cost
$0.30 per linear feet per NHI $2.50 per linear feet per MD Price Index
$0.60 - $1.00 per linear feet per NHI
High Quantity Cost
$0.30 per linear feet per NHI $2.50 per linear feet per MD Price Index
$0.60 - $1.00 per linear feet per NHI
Items Included Minimal crack preparation, low-quality thermoplastic sealant materials
Crack preparation procedures, high-quality thermoplastc sealant materials
Items Excluded Marking Removal Marking Removal
Typical Life Extension 2-4 years 2-10 years
MOT Considerations / Cure time
1. Traffic passing over a hot applied sealed or filled crack is usually not an issue. However, traffic control during the application of the treatment should be in effect long enough to allow for adequate curing of the product and prevent tracking. 2. Hot applied rubber modified sealants, especially asphalt rubber, have excellent adhesion and do not require the application of a thin sand coating prior to trafficking. Emulsions must be sand coated prior to being trafficked.
1. Traffic passing over a hot applied sealed or filled crack is usually not an issue. However, traffic control during the application of the treatment should be in effect long enough to allow for adequate curing of the product and prevent tracking. 2. Hot applied rubber modified sealants, especially asphalt rubber, have excellent adhesion and do not require the application of a thin sand coating prior to trafficking. Emulsions must be sand coated prior to being trafficked.

Preliminary Procedures
Section 09: Supplemental Treatment Information
Updated 07/11/2014 Return to Table of Contents
2-35
Table B.2
Return to Table C
2.09.02 SUPPLEMENTAL INFORMATION FOR TREATMENTS A-2, A-3
A-2. Crack Seal (Concrete Surface)
A-3. Joint Sealing (and Resealing)
Th
is t
rea
tme
nt
is
inte
nd
ed
to
imp
rov
e:
IRI
FCI Yes Yes
SCI
Rut
Skid
Aging Yes Yes
Treatment Advantages
1. Reduces or delays moisture damage, further crack deterioration and roughness. 2. Performance is not significantly affected by varying ADT or truck levels
1. Helps keep moisture and incompressibles out of the joints resulting in less cracking, pumping, spalling and faulting.
Treatment Disadvantages
1. Roughness may increase as a result of the sealing process. 2. Transverse cracking should not be sealed in CRCP.
1. Before joints can be sealed, joints must be cleaned to remove incompressible materials such as saw-cut swarf, soil, sand, or gravel. Cleaning can be accomplished by water or air blasting. 2. Performance is mostly dependent on preparation. 3. Poured joint sealants do not adhere to the pavement when the joint face is not clean, the shape is not correct, or the face is too moist when the sealant is placed. 4. Hot-poured liquid sealant does not adhere
because of overheating or under heating.
5. Backer rod may trap moisture if installed improperly or not maintained.
Co
st
Cla
rifi
cati
on
Small Quantity Cost
$1.50 - $2.00 / LF for hot-pour rubberized materials.
$1.00 - $1.50 / LF for poured asphalt sealant, $2.00 - $2.50 / LF for silicone sealant.
Medium Quantity Cost
$0.75 - $1.25 / LF for hot-pour rubberized materials.
$0.75 - $1.25 / LF for poured asphalt sealant, $2.00 - $2.25 / LF for silicone sealant.
High Quantity Cost
$0.75 - $1.25 / LF for hot-pour rubberized materials.
$0.75 - $1.25 / LF for poured asphalt sealant, $1 - $2 / LF for silicone sealant.
Items Included Crack refacing, cleaning, backer rod installation and application of sealant.
Routing, sealant removal, joint refacing, reservoir cleaning, backer rod installation and sealant installation.
Items Excluded
Marking Removal
Typical Life Extension 2-10 years 6-8 years for hot-poured asphalt sealant, approximately 8 years for silicone sealant, 3-5 years for asphalt rubber sealant.
MOT Considerations / Cure time
1.Traffic control during the application of the treatment should be in effect long enough to allow for adequate curing of the product and prevent tracking. 2. Hot applied rubber modified sealants, especially asphalt rubber, have excellent adhesion and do not require the application of a thin sand coating prior to trafficking. Emulsions must be sand coated prior to being trafficked.
1. Traffic passing over a hot applied sealed or filled joint is usually not an issue. However, traffic control during the application of the treatment should be in effect long enough to allow for adequate curing of the product and prevent tracking. 2. Hot applied rubber modified sealants, especially asphalt rubber, have excellent adhesion and do not require the application of a thin sand coating prior to trafficking. Emulsions must be sand coated prior to being trafficked.
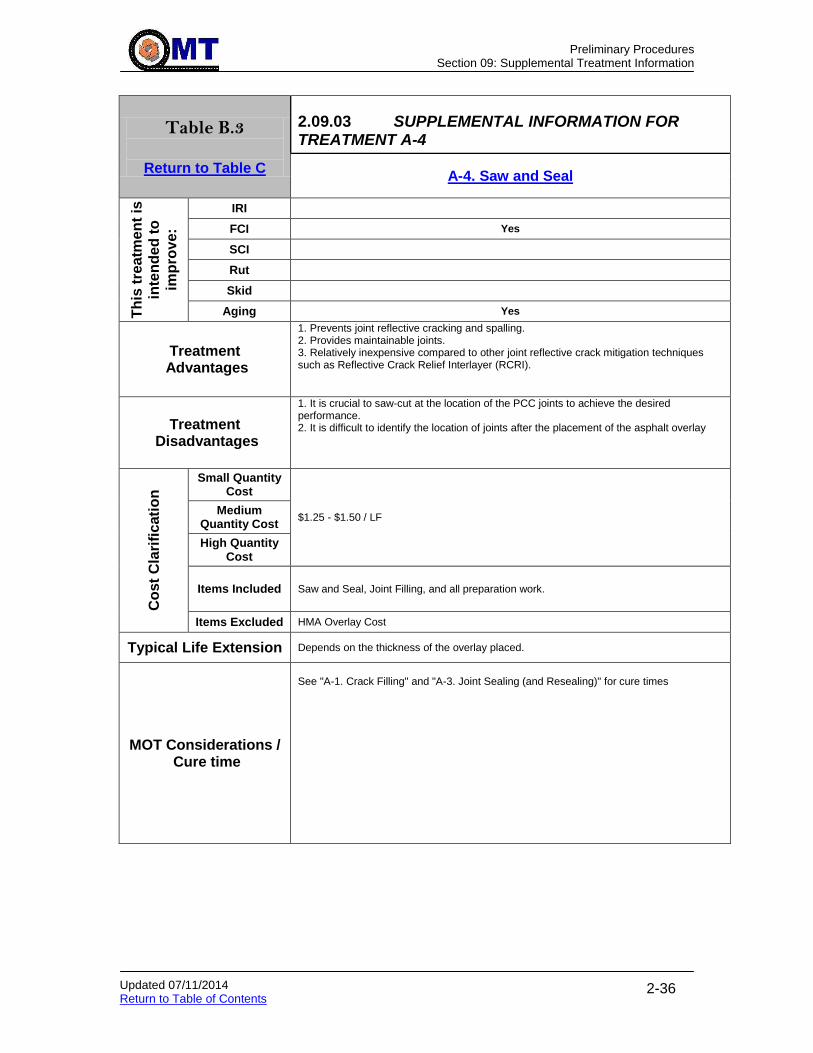
Preliminary Procedures
Section 09: Supplemental Treatment Information
Updated 07/11/2014 Return to Table of Contents
2-36
Table B.3
Return to Table C
2.09.03 SUPPLEMENTAL INFORMATION FOR TREATMENT A-4
A-4. Saw and Seal
Th
is t
rea
tme
nt
is
inte
nd
ed
to
imp
rov
e:
IRI
FCI Yes
SCI
Rut
Skid
Aging Yes
Treatment Advantages
1. Prevents joint reflective cracking and spalling. 2. Provides maintainable joints. 3. Relatively inexpensive compared to other joint reflective crack mitigation techniques such as Reflective Crack Relief Interlayer (RCRI).
Treatment Disadvantages
1. It is crucial to saw-cut at the location of the PCC joints to achieve the desired performance. 2. It is difficult to identify the location of joints after the placement of the asphalt overlay
Co
st
Cla
rifi
cati
on
Small Quantity Cost
$1.25 - $1.50 / LF Medium
Quantity Cost
High Quantity Cost
Items Included Saw and Seal, Joint Filling, and all preparation work.
Items Excluded HMA Overlay Cost
Typical Life Extension Depends on the thickness of the overlay placed.
MOT Considerations / Cure time
See "A-1. Crack Filling" and "A-3. Joint Sealing (and Resealing)" for cure times

Preliminary Procedures
Section 09: Supplemental Treatment Information
Updated 07/11/2014 Return to Table of Contents
2-37
Table B.4
Return to Table C
2.09.04 SUPPLEMENTAL INFORMATION FOR TREATMENTS B-1, B-2
B-1. Fog Seal B-2. Rejuvenators
Th
is t
rea
tme
nt
is
inte
nd
ed
to
imp
rov
e:
IRI
FCI Yes Yes
SCI
Rut
Skid
Aging Yes Yes
Treatment Advantages
1. Performs well in all climatic conditions 2. Inexpensive treatment 3. Improves sealing or waterproofing 4. Facilitates aggregate retention in chip seal applications or weathered/raveled pavements
1. Slows/reduces raveling and roughness and may slow rate of thermal cracking 2. Used in some surface recycling process. 3. Improves flexibility of asphalt binder. 4. Good for treating existing rumble strips
Treatment Disadvantages
1. Increased ADT or truck levels can increase surface wear, particulary when studded tires are used. 2. Typically, a slow setting emulsion is used which requires time to "break". Hence, the pavement is sometimes closed for several hours for curing before being re-opened to traffic. 3. Can have a negative impact on friction and stripping
1. Allow time for adequate surface friction to be restored. 2. May not be appropriate for rubberized asphalt concrete or polymer modified mixes. 3. Not appropriate for pavements with inadequate friction
Co
st
Cla
rifi
cati
on
Small Quantity Cost
$0.06 - $0.36 / SY $0.15 - $0.65 / SY
Medium Quantity Cost
$0.06 - $0.36 / SY $0.15 - $0.65 / SY
High Quantity Cost
$0.06 - $0.36 / SY $0.15 - $0.65 / SY
Items Included See Defintion See Definition
Items Excluded Marking Removal Marking Removal
Typical Life Extension 1-4 years 3-5 years
MOT Considerations / Cure time
At least two hours and until acceptable skid test values are achieved.
At least two hours and until acceptable skid test values are achieved.
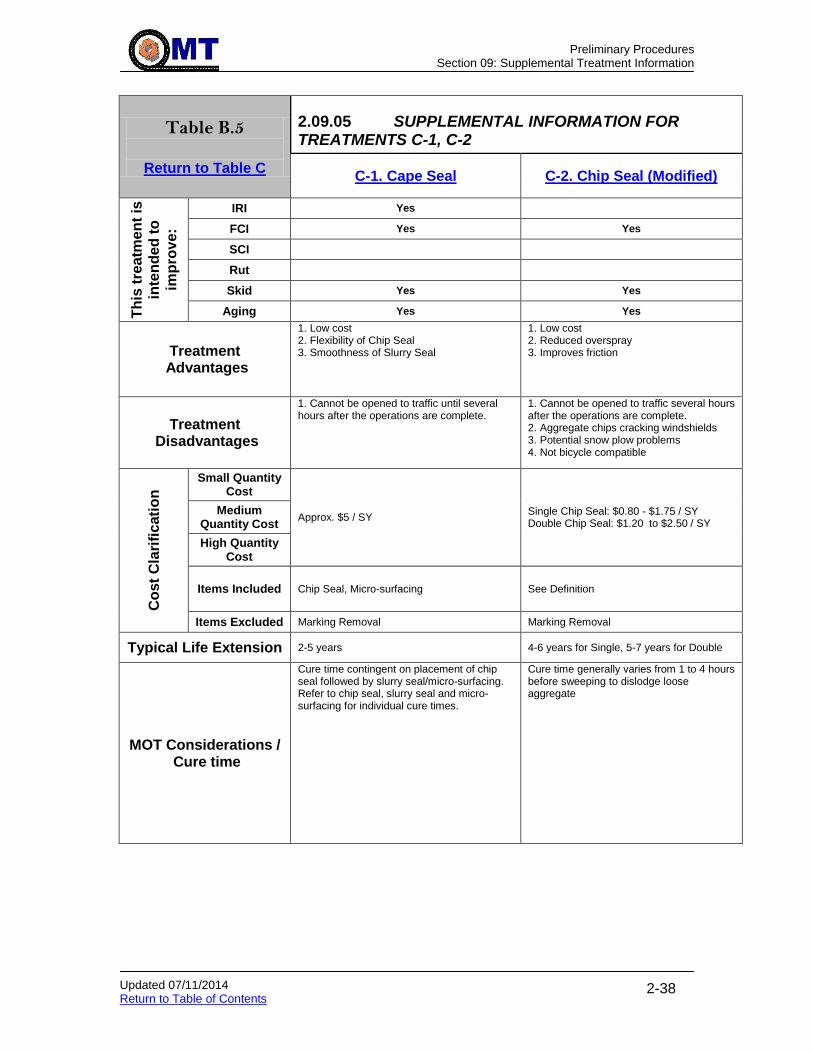
Preliminary Procedures
Section 09: Supplemental Treatment Information
Updated 07/11/2014 Return to Table of Contents
2-38
Table B.5
Return to Table C
2.09.05 SUPPLEMENTAL INFORMATION FOR TREATMENTS C-1, C-2
C-1. Cape Seal C-2. Chip Seal (Modified)
Th
is t
rea
tme
nt
is
inte
nd
ed
to
imp
rov
e:
IRI Yes
FCI Yes Yes
SCI
Rut
Skid Yes Yes
Aging Yes Yes
Treatment Advantages
1. Low cost 2. Flexibility of Chip Seal 3. Smoothness of Slurry Seal
1. Low cost 2. Reduced overspray 3. Improves friction
Treatment Disadvantages
1. Cannot be opened to traffic until several hours after the operations are complete.
1. Cannot be opened to traffic several hours after the operations are complete. 2. Aggregate chips cracking windshields 3. Potential snow plow problems 4. Not bicycle compatible
Co
st
Cla
rifi
cati
on
Small Quantity Cost
Approx. $5 / SY Single Chip Seal: $0.80 - $1.75 / SY Double Chip Seal: $1.20 to $2.50 / SY
Medium Quantity Cost
High Quantity Cost
Items Included Chip Seal, Micro-surfacing See Definition
Items Excluded Marking Removal Marking Removal
Typical Life Extension 2-5 years 4-6 years for Single, 5-7 years for Double
MOT Considerations / Cure time
Cure time contingent on placement of chip seal followed by slurry seal/micro-surfacing. Refer to chip seal, slurry seal and micro-surfacing for individual cure times.
Cure time generally varies from 1 to 4 hours before sweeping to dislodge loose aggregate

Preliminary Procedures
Section 09: Supplemental Treatment Information
Updated 07/11/2014 Return to Table of Contents
2-39
Table B.6
Return to Table C
2.09.06 SUPPLEMENTAL INFORMATION FOR TREATMENTS C-3, C-4
C-3. High Friction Surface C-4.Sand Seal
Th
is t
rea
tme
nt
is
inte
nd
ed
to
imp
rov
e:
IRI
FCI
Yes
SCI
Rut
Skid Yes Yes
Aging
Yes
Treatment Advantages
1. Results in extremely high skid numbers. 2. Compatible with closed sections because it is extremely thin (about 1/4") 3. Available in several colors for traffic calming purposes. 4. Can be applied to asphalt or concrete surfaces.
1. Prevents/delays oxidation of the pavement surface. 2. Seals the pavement surface (including temporary sealing low severity fatigue cracking) 3. Successful on both low- and high- volume roadways. 4. Corrects poor friction. 5. Slows/reduces severity of moisture damage, cracking, raveling and possibly roughness and rutting.
Treatment Disadvantages
1. Cures about an hour after epoxy is poured, so aggregate needs to be placed immediately, to facilitate appropriate bond. 2. Expensive, because it is an emerging technology. Costs may come down with increased usage. 3. Some colors will wear in the wheel paths.
1. Negatively affects stripping. 2. Limited to lower volume traffic conditions with a low percentage of trucks, and roadway grades flatter than 8%. 3. Should be constructed when surface is dry and the temperature is at least 50 deg F 4. To ensure good bond, existing pavement must be clean and dry.
Co
st
Cla
rifi
cati
on
Small Quantity Cost
$25 - $40 / SY
$0.33 to $0.66/SY
Medium Quantity Cost
$0.33 to $0.66/SY
High Quantity Cost
$0.33 to $0.66/SY
Items Included Epoxy, aggregate and placement See Description
Items Excluded MOT, Marking Removal Marking Removal
Typical Life Extension Anticipated to be 10-15 years 3-4 years
MOT Considerations / Cure time
Cure time is generally 1 hour after placement. Controlled traffic may be permitted as soon as the final layer is applied and rolled, and sufficiently cooled to withstand traffic without damage. A recommended maximum speed of 30 km/h, (20 mph), should be maintained for a period of two (2) hours.

Preliminary Procedures
Section 09: Supplemental Treatment Information
Updated 07/11/2014 Return to Table of Contents
2-40
Table B.7
Return to Table C
2.09.07 SUPPLEMENTAL INFORMATION FOR TREATMENTS C-5, C-6
C-5.Sandwich Seal C-6.Scrub Seal
Th
is t
rea
tme
nt
is
inte
nd
ed
to
imp
rov
e:
IRI
FCI Yes Yes
SCI
Rut
Skid Yes Yes
Aging Yes Yes
Treatment Advantages
1. Unlike the double chip seal, only one application of emulsion is required. 2. Same service life as the double chip seal 3. Provides a smoother surface than chip seal
1. Prevents/delays moisture damage. 2. Rejuvenates hardened/oxidized asphalt. 3. Improves poor friction. 4. Reduces the severity of cracking, raveling and possibly roughness and rutting.
Treatment Disadvantages
1. Clean aggregate required. 2. Aggregate chips may crack windshields. 3. Must be placed on structurally sound pavements.
1. Can accelerate the development of stripping. 2. Limited to lower volume traffic conditions (AADT < 1,500) with a low percentage of trucks, and roadway grades flatter than 8%. 3. May be susceptible to snow plow damage. 4. Must be placed on a clean dry surface at a temperature of at least 50 deg F. 5. Must be placed on structurally sound pavements.
Co
st
Cla
rifi
cati
on
Small Quantity Cost
$1 - $2 / SY
$0.50 - $2.15 /SY
Medium Quantity Cost
$0.50 - $2.15 /SY
High Quantity Cost
$0.50 - $2.15 /SY
Items Included See Definition Unknown
Items Excluded Marking Removal Unknown
Typical Life Extension 5-7 years 2-6 years
MOT Considerations / Cure time
Cure time generally varies from 1 to 4 hours before sweeping to dislodge loose aggregate
Controlled traffic may be permitted as soon as the final layer is applied and rolled, and sufficiently cooled to withstand traffic without damage.
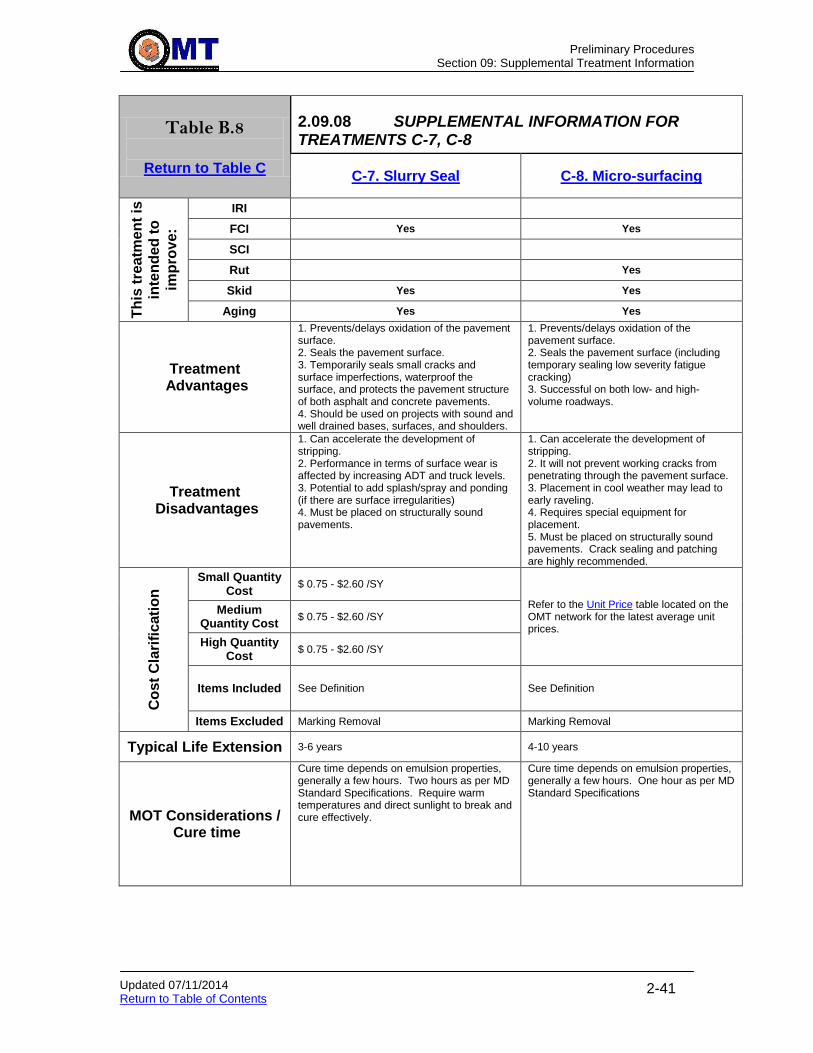
Preliminary Procedures
Section 09: Supplemental Treatment Information
Updated 07/11/2014 Return to Table of Contents
2-41
Table B.8
Return to Table C
2.09.08 SUPPLEMENTAL INFORMATION FOR TREATMENTS C-7, C-8
C-7. Slurry Seal C-8. Micro-surfacing
Th
is t
rea
tme
nt
is
inte
nd
ed
to
imp
rov
e:
IRI
FCI Yes Yes
SCI
Rut
Yes
Skid Yes Yes
Aging Yes Yes
Treatment Advantages
1. Prevents/delays oxidation of the pavement surface. 2. Seals the pavement surface. 3. Temporarily seals small cracks and surface imperfections, waterproof the surface, and protects the pavement structure of both asphalt and concrete pavements. 4. Should be used on projects with sound and well drained bases, surfaces, and shoulders.
1. Prevents/delays oxidation of the pavement surface. 2. Seals the pavement surface (including temporary sealing low severity fatigue cracking) 3. Successful on both low- and high- volume roadways.
Treatment Disadvantages
1. Can accelerate the development of stripping. 2. Performance in terms of surface wear is affected by increasing ADT and truck levels. 3. Potential to add splash/spray and ponding (if there are surface irregularities) 4. Must be placed on structurally sound pavements.
1. Can accelerate the development of stripping. 2. It will not prevent working cracks from penetrating through the pavement surface. 3. Placement in cool weather may lead to early raveling. 4. Requires special equipment for placement. 5. Must be placed on structurally sound pavements. Crack sealing and patching are highly recommended.
Co
st
Cla
rifi
cati
on
Small Quantity Cost
$ 0.75 - $2.60 /SY
Refer to the Unit Price table located on the OMT network for the latest average unit prices.
Medium Quantity Cost
$ 0.75 - $2.60 /SY
High Quantity Cost
$ 0.75 - $2.60 /SY
Items Included See Definition See Definition
Items Excluded Marking Removal Marking Removal
Typical Life Extension 3-6 years 4-10 years
MOT Considerations / Cure time
Cure time depends on emulsion properties, generally a few hours. Two hours as per MD Standard Specifications. Require warm temperatures and direct sunlight to break and cure effectively.
Cure time depends on emulsion properties, generally a few hours. One hour as per MD Standard Specifications

Preliminary Procedures
Section 09: Supplemental Treatment Information
Updated 07/11/2014 Return to Table of Contents
2-42
Table B.9
Return to Table C
2.09.09 SUPPLEMENTAL INFORMATION FOR TREATMENTS D-1a, D-1b
D-1a. Ultra-Thin Bonded Wearing Course
D-1b. Open Graded Friction Course (OGFC)
Th
is t
rea
tme
nt
is
inte
nd
ed
to
imp
rov
e:
IRI Yes Yes
FCI Yes Yes
SCI
Rut
Skid Yes Yes
Aging
Treatment Advantages
1. A very good bond due to the heavy tack coat. 2. Can be used on projects where there are grade restrictions 3. Eliminates the need for utility adjustment. 4. Minimal traffic disruption, requires a single lane closure. 5. Noise Reduction. 6. Increases driver visibility due to reduction in splash/spray. 7. Less Fumes
1. Reduces splash and spray 2. Increases skid resistance 3. Reduce tire noise
Treatment Disadvantages
1. Handwork is necessary sometimes. 2. Must be placed at temperatures above 50 deg F
1. Need a wedge/level or grade adjustments before placement of OGFC. 2. Cannot be used on unstable pavements, which includes pavements with substantial cracking, bleeding, rutting and depressions. 3. Do not use in snow or icy areas where tire chains, studded tires or snow plows will affect the aggregate and binder which will result in stripping of the aggregate, contribute to raveling and pavement deterioration. 4. Fails Rapidly once failure is eminent. 5. Should not be used in areas where there are severe turning movements. 6. Should not be placed adjacent to curb and gutter because of the bath tub effect 7. Do not use in muddy areas 8. Should NOT be used in fuel or oil spill areas. 9. Resulting surface drainage impacts must be considered 10. To maintain permeability, regular cleaning should be done.
Co
st
Cla
rifi
cati
on
Small Quantity Cost
$9 - $14 / SY $20 / SY Medium
Quantity Cost
High Quantity Cost
Items Included Cost is for one-pass only. See Definition
Items Excluded Multiple Passes Marking Removal
Typical Life Extension 6-12 years
4-6 years

Preliminary Procedures
Section 09: Supplemental Treatment Information
Updated 07/11/2014 Return to Table of Contents
2-43
Table B.10
Return to Table C
2.09.10 SUPPLEMENTAL INFORMATION FOR TREATMENTS D-1c, D-1d
D-1c. HMA Overlay - Ultrathin (<1.5")
D-1d. HMA Overlay - Ultrathin (<1.5") (High Performance
Thin Overlay)
Th
is t
rea
tme
nt
is
inte
nd
ed
to
imp
rov
e:
IRI Yes Yes
FCI Yes Yes
SCI
Rut Yes Yes
Skid
Aging
Treatment Advantages
1. Improves skid, ride, minor rutting, minor surface defects, bleeding and reduces raveling. 2. Slows / reduces cracking and moisture damage. 3. Performs well in all climatic conditions. 4. No traffic restrictions.
1. Longer lasting than typical ultrathin asphalt mixes. 2. Higher asphalt content results in better crack resistance. 3. More appropriate for projects with joint reflective cracking.
Treatment Disadvantages
1. Negatively affects stripping 2. Does not correct structural distresses. 3. Needs to be compacted more rapidly than a conventional HMA mix.
1. Higher Asphalt Content results in higher costs.
Co
st
Cla
rifi
cati
on
Small Quantity Cost
$1.25 to $2.90 per square yard Anticipated to be similar to Gap-Graded SMA prices.
Medium Quantity Cost
High Quantity Cost
Items Included See Definition Unknown
Items Excluded Marking Removal Marking Removal
Typical Life Extension 5-10 years 8-15 years
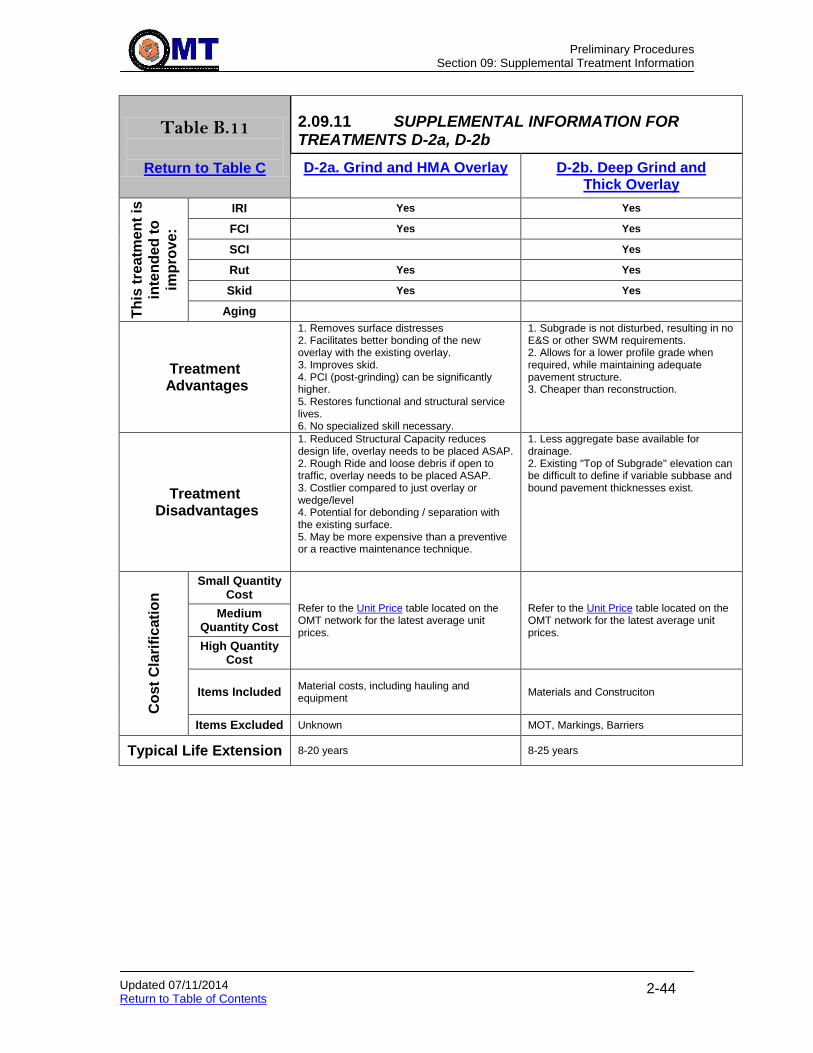
Preliminary Procedures
Section 09: Supplemental Treatment Information
Updated 07/11/2014 Return to Table of Contents
2-44
Table B.11
Return to Table C
2.09.11 SUPPLEMENTAL INFORMATION FOR TREATMENTS D-2a, D-2b
D-2a. Grind and HMA Overlay
D-2b. Deep Grind and Thick Overlay
Th
is t
rea
tme
nt
is
inte
nd
ed
to
imp
rov
e:
IRI Yes Yes
FCI Yes Yes
SCI
Yes
Rut Yes Yes
Skid Yes Yes
Aging
Treatment Advantages
1. Removes surface distresses 2. Facilitates better bonding of the new overlay with the existing overlay. 3. Improves skid. 4. PCI (post-grinding) can be significantly higher. 5. Restores functional and structural service lives. 6. No specialized skill necessary.
1. Subgrade is not disturbed, resulting in no E&S or other SWM requirements. 2. Allows for a lower profile grade when required, while maintaining adequate pavement structure. 3. Cheaper than reconstruction.
Treatment Disadvantages
1. Reduced Structural Capacity reduces design life, overlay needs to be placed ASAP. 2. Rough Ride and loose debris if open to traffic, overlay needs to be placed ASAP. 3. Costlier compared to just overlay or wedge/level 4. Potential for debonding / separation with the existing surface. 5. May be more expensive than a preventive or a reactive maintenance technique.
1. Less aggregate base available for drainage. 2. Existing "Top of Subgrade" elevation can be difficult to define if variable subbase and bound pavement thicknesses exist.
Co
st
Cla
rifi
cati
on
Small Quantity Cost
Refer to the Unit Price table located on the OMT network for the latest average unit prices.
Refer to the Unit Price table located on the OMT network for the latest average unit prices.
Medium Quantity Cost
High Quantity Cost
Items Included Material costs, including hauling and equipment
Materials and Construciton
Items Excluded Unknown MOT, Markings, Barriers
Typical Life Extension 8-20 years 8-25 years

Preliminary Procedures
Section 09: Supplemental Treatment Information
Updated 07/11/2014 Return to Table of Contents
2-45
Table B.12
Return to Table C
2.09.12 SUPPLEMENTAL INFORMATION FOR TREATMENTS D-3, D-4
D-3. HMA Overlay
D-4. Wedge/Level and HMA Overlay
Th
is t
rea
tme
nt
is
inte
nd
ed
to
imp
rov
e:
IRI Yes Yes
FCI Yes Yes
SCI Yes Yes
Rut
Yes
Skid Yes Yes
Aging
Treatment Advantages
1. Restores functional and structural service lives. 2. No specialized skill necessary. 3. Restores skid 4. Adds structure to pavement.
1. Alternative to grinding, while providing minor structural improvements. 2. Provides a smooth pre-overlay surface. 3. Restores functional and structural service lives. 4. No specialized skill necessary.
Treatment Disadvantages
1. Potential for de-bonding / separation with the existing surface. 2. May be more expensive than a preventive or a reactive maintenance technique.
1. May increase profile grade. 2. Potential for de-bonding / separation with the existing surface. 3. May be more expensive than a preventive or a reactive maintenance technique.
Co
st
Cla
rifi
cati
on
Small Quantity Cost
Refer to the Unit Price table located on the OMT network for the latest average unit prices.
Refer to the Unit Price table located on the OMT network for the latest average unit prices.
Medium Quantity Cost
High Quantity Cost
Items Included Material costs, including hauling and equipment
Material costs, including hauling and equipment
Items Excluded Unknown Unknown
Typical Life Extension 8-25 years 8-25 years

Preliminary Procedures
Section 09: Supplemental Treatment Information
Updated 07/11/2014 Return to Table of Contents
2-46
Table B.13
Return to Table C
2.09.13 SUPPLEMENTAL INFORMATION FOR TREATMENT D-5
D-5. Hot In-Place Recycling (HIR)
Th
is t
rea
tme
nt
is
inte
nd
ed
to
imp
rov
e:
IRI Yes
FCI Yes
SCI
Rut Yes
Skid
Aging
Treatment Advantages
1. Can be done on-site 2. Reduced Material Costs 3. Less Waste
Treatment Disadvantages
1. Not recommended for heavily oxidized material 2. Requires good surface materials 3. Limited to 3" in depth 4. Requires Specialized Equipment 5. Crack sealant should be removed to reduce risk of fires or blue smoke
Co
st
Cla
rifi
cati
on
Small Quantity Cost
$.75/SY - $3.25/SY. Cost depends on whether the material is re-mixed, re-paved, or heater scarified.
Medium Quantity Cost
High Quantity Cost
Items Included See Definition
Items Excluded Unknown
Typical Life Extension 4-15 years
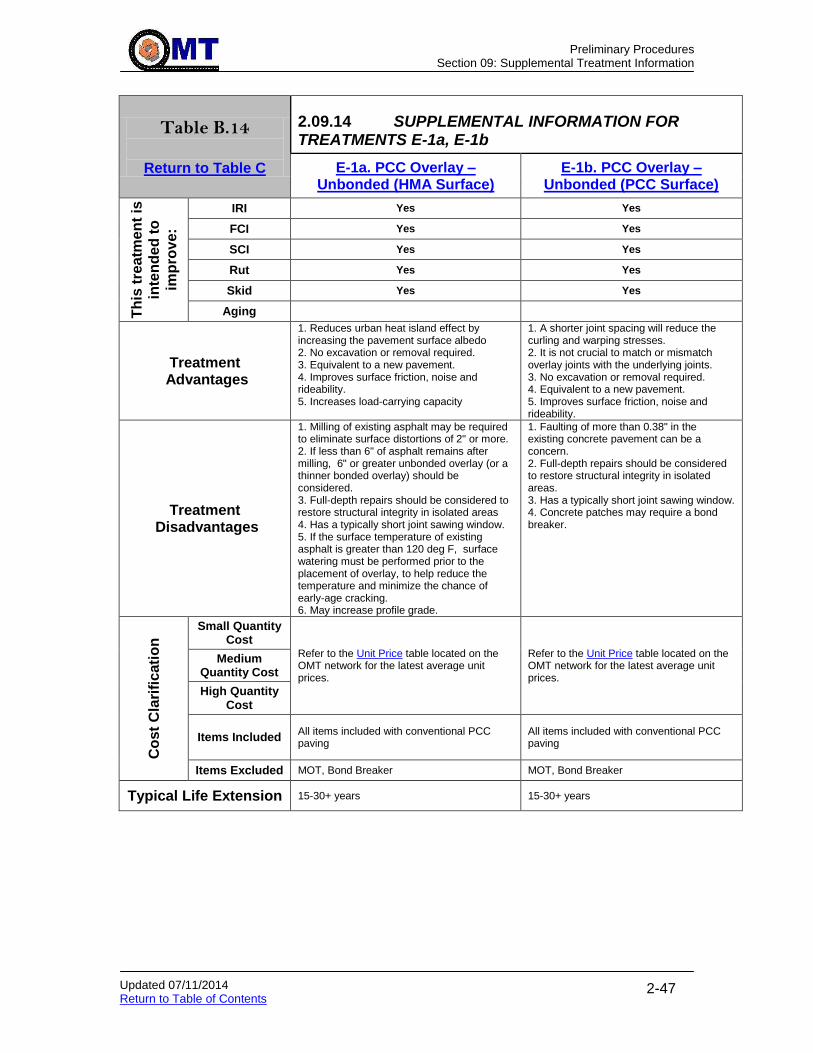
Preliminary Procedures
Section 09: Supplemental Treatment Information
Updated 07/11/2014 Return to Table of Contents
2-47
Table B.14
Return to Table C
2.09.14 SUPPLEMENTAL INFORMATION FOR TREATMENTS E-1a, E-1b
E-1a. PCC Overlay – Unbonded (HMA Surface)
E-1b. PCC Overlay – Unbonded (PCC Surface)
Th
is t
rea
tme
nt
is
inte
nd
ed
to
imp
rov
e:
IRI Yes Yes
FCI Yes Yes
SCI Yes Yes
Rut Yes Yes
Skid Yes Yes
Aging
Treatment Advantages
1. Reduces urban heat island effect by increasing the pavement surface albedo 2. No excavation or removal required. 3. Equivalent to a new pavement. 4. Improves surface friction, noise and rideability. 5. Increases load-carrying capacity
1. A shorter joint spacing will reduce the curling and warping stresses. 2. It is not crucial to match or mismatch overlay joints with the underlying joints. 3. No excavation or removal required. 4. Equivalent to a new pavement. 5. Improves surface friction, noise and rideability.
Treatment Disadvantages
1. Milling of existing asphalt may be required to eliminate surface distortions of 2" or more. 2. If less than 6" of asphalt remains after milling, 6" or greater unbonded overlay (or a thinner bonded overlay) should be considered. 3. Full-depth repairs should be considered to restore structural integrity in isolated areas 4. Has a typically short joint sawing window. 5. If the surface temperature of existing asphalt is greater than 120 deg F, surface watering must be performed prior to the placement of overlay, to help reduce the temperature and minimize the chance of early-age cracking. 6. May increase profile grade.
1. Faulting of more than 0.38" in the existing concrete pavement can be a concern. 2. Full-depth repairs should be considered to restore structural integrity in isolated areas. 3. Has a typically short joint sawing window. 4. Concrete patches may require a bond breaker.
Co
st
Cla
rifi
cati
on
Small Quantity Cost
Refer to the Unit Price table located on the OMT network for the latest average unit prices.
Refer to the Unit Price table located on the OMT network for the latest average unit prices.
Medium Quantity Cost
High Quantity Cost
Items Included All items included with conventional PCC paving
All items included with conventional PCC paving
Items Excluded MOT, Bond Breaker MOT, Bond Breaker
Typical Life Extension 15-30+ years 15-30+ years

Preliminary Procedures
Section 09: Supplemental Treatment Information
Updated 07/11/2014 Return to Table of Contents
2-48
Table B.15
Return to Table C
2.09.15 SUPPLEMENTAL INFORMATION FOR TREATMENT E-2
E-2. PCC Overlay – Bonded
Th
is t
rea
tme
nt
is
inte
nd
ed
to
imp
rov
e:
IRI Yes
FCI Yes
SCI Yes
Rut Yes
Skid Yes
Aging
Treatment Advantages
1. Addresses surface-related distresses. 2. Effective in areas where there are restrictions on vertical clearance, flood zones and grades. 3. Increases load-carrying capacity.
Treatment Disadvantages
1. Application of curing compound or other curing methods must be timely and thorough, especially at the edges. 2. Caution should be used with conventional AASHTO design procedures. 3. Working cracks should be repaired prior to performing this activity, or matched in the overlay. 4. Must be applied to pavements in good structural condition. 5. Transverse joints must be cut full depth plus ½”.
Co
st
Cla
rifi
cati
on
Small Quantity Cost
$20-$40/SY depending on volume and thickness Medium
Quantity Cost
High Quantity Cost
Items Included Surface preparation, concrete placement, jointing, texturing and curing
Items Excluded MOT
Typical Life Extension 15-30+ years
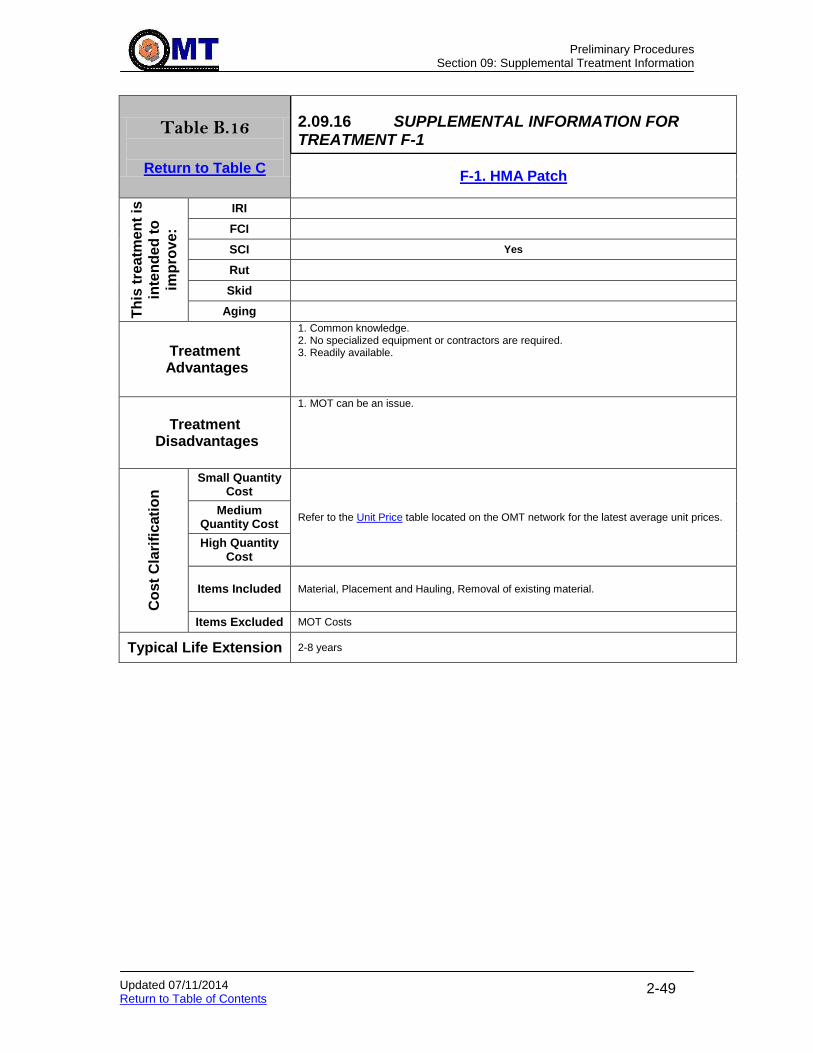
Preliminary Procedures
Section 09: Supplemental Treatment Information
Updated 07/11/2014 Return to Table of Contents
2-49
Table B.16
Return to Table C
2.09.16 SUPPLEMENTAL INFORMATION FOR TREATMENT F-1
F-1. HMA Patch
Th
is t
rea
tme
nt
is
inte
nd
ed
to
imp
rov
e:
IRI
FCI
SCI Yes
Rut
Skid
Aging
Treatment Advantages
1. Common knowledge. 2. No specialized equipment or contractors are required. 3. Readily available.
Treatment Disadvantages
1. MOT can be an issue.
Co
st
Cla
rifi
cati
on
Small Quantity Cost
Refer to the Unit Price table located on the OMT network for the latest average unit prices. Medium
Quantity Cost
High Quantity Cost
Items Included Material, Placement and Hauling, Removal of existing material.
Items Excluded MOT Costs
Typical Life Extension 2-8 years
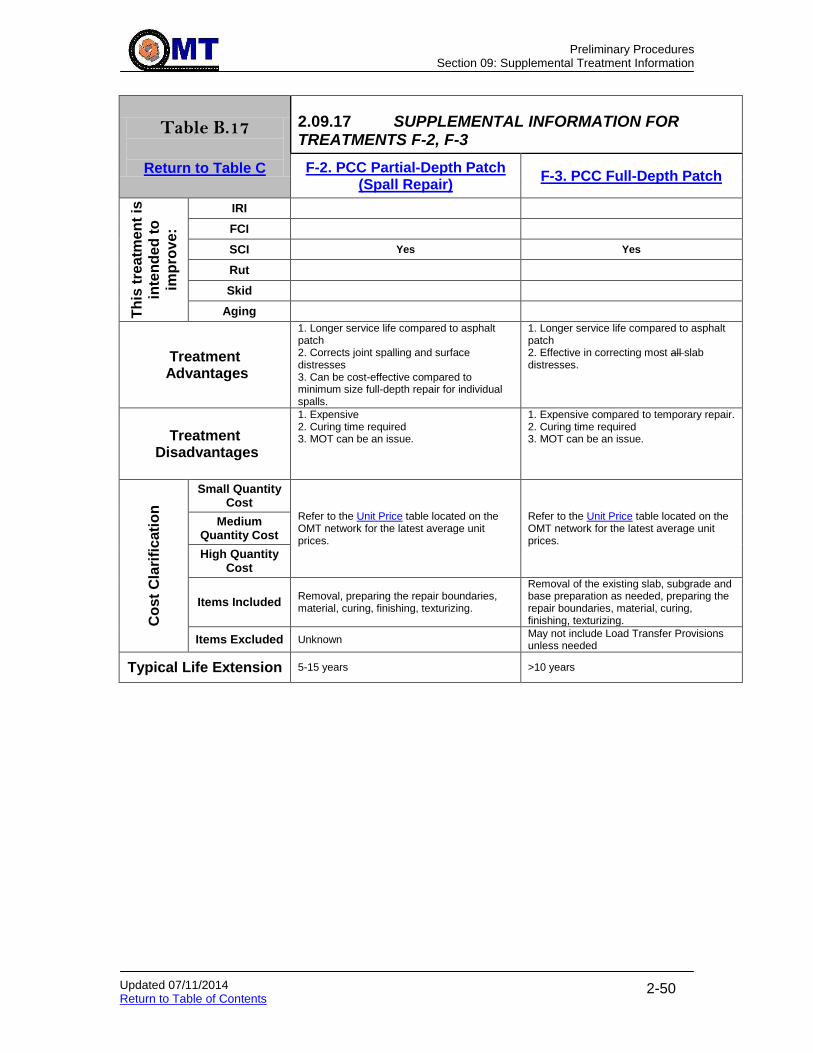
Preliminary Procedures
Section 09: Supplemental Treatment Information
Updated 07/11/2014 Return to Table of Contents
2-50
Table B.17
Return to Table C
2.09.17 SUPPLEMENTAL INFORMATION FOR TREATMENTS F-2, F-3
F-2. PCC Partial-Depth Patch (Spall Repair)
F-3. PCC Full-Depth Patch
Th
is t
rea
tme
nt
is
inte
nd
ed
to
imp
rov
e:
IRI
FCI
SCI Yes Yes
Rut
Skid
Aging
Treatment Advantages
1. Longer service life compared to asphalt patch 2. Corrects joint spalling and surface distresses 3. Can be cost-effective compared to minimum size full-depth repair for individual spalls.
1. Longer service life compared to asphalt patch 2. Effective in correcting most all slab distresses.
Treatment Disadvantages
1. Expensive 2. Curing time required 3. MOT can be an issue.
1. Expensive compared to temporary repair. 2. Curing time required 3. MOT can be an issue.
Co
st
Cla
rifi
cati
on
Small Quantity Cost
Refer to the Unit Price table located on the OMT network for the latest average unit prices.
Refer to the Unit Price table located on the OMT network for the latest average unit prices.
Medium Quantity Cost
High Quantity Cost
Items Included Removal, preparing the repair boundaries, material, curing, finishing, texturizing.
Removal of the existing slab, subgrade and base preparation as needed, preparing the repair boundaries, material, curing, finishing, texturizing.
Items Excluded Unknown May not include Load Transfer Provisions unless needed
Typical Life Extension 5-15 years >10 years

Preliminary Procedures
Section 09: Supplemental Treatment Information
Updated 07/11/2014 Return to Table of Contents
2-51
Table B.18
Return to Table C
2.09.18 SUPPLEMENTAL INFORMATION FOR TREATMENTS G-1, G-2
G-1. Cross-Stitching G-2. Dowel Bar Retrofit
Th
is t
rea
tme
nt
is
inte
nd
ed
to
imp
rov
e:
IRI
Yes
FCI Yes
SCI Yes
Rut
Skid
Aging
Treatment Advantages
1. Strengthening and tying longitudinal cracks in slabs to prevent slab migration and to maintain aggregate interlock. 2. Mitigating the issue of tie-bars being omitted from longitudinal contraction joints (due to construction error) 3. Tying roadway lanes or shoulders that are separating or causing maintenance problems. 4. Tying centerline longitudinal joints that are starting to fault.
1. Can be used in all climatic regions 2. Relatively low life-cycle cost.
Treatment Disadvantages
1. Potential damage to concrete during drilling. Care must be taken.
1. Labor Intensive 2. Usually requires Diamond Grinding for smooth surface. If not grinding continuously, grind from mid-slab to mid-slab.
Co
st
Cla
rifi
cati
on
Small Quantity Cost
$11 - $17 / bar
$50 per dowel.
Medium Quantity Cost
$35 per dowel.
High Quantity Cost
$25 per dowel.
Items Included Drilling of holes, epoxy grout insertion, bar insertion, final grouting and crack sealing if called for.
Slot creation and material removal, sand blasting and cleaning, caulking the joint crack, dowel bar placement, repair material placement, and may include diamond grinding and joint sealing.
Items Excluded MOT MOT
Typical Life Extension 10-15 years
9-10 years (depending on the type of bar being used). However, 7-33 years of pavement life extension have been observed.
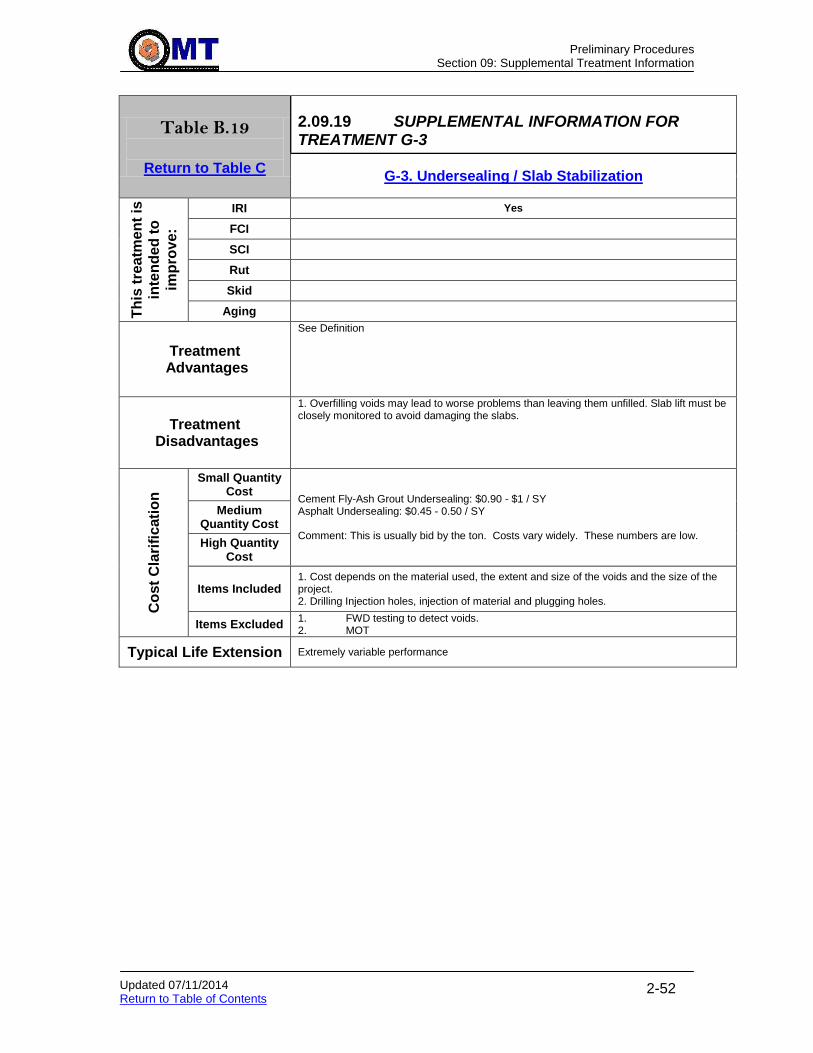
Preliminary Procedures
Section 09: Supplemental Treatment Information
Updated 07/11/2014 Return to Table of Contents
2-52
Table B.19
Return to Table C
2.09.19 SUPPLEMENTAL INFORMATION FOR TREATMENT G-3
G-3. Undersealing / Slab Stabilization
Th
is t
rea
tme
nt
is
inte
nd
ed
to
imp
rov
e:
IRI Yes
FCI
SCI
Rut
Skid
Aging
Treatment Advantages
See Definition
Treatment Disadvantages
1. Overfilling voids may lead to worse problems than leaving them unfilled. Slab lift must be closely monitored to avoid damaging the slabs.
Co
st
Cla
rifi
cati
on
Small Quantity Cost
Cement Fly-Ash Grout Undersealing: $0.90 - $1 / SY Asphalt Undersealing: $0.45 - 0.50 / SY Comment: This is usually bid by the ton. Costs vary widely. These numbers are low.
Medium Quantity Cost
High Quantity Cost
Items Included 1. Cost depends on the material used, the extent and size of the voids and the size of the project. 2. Drilling Injection holes, injection of material and plugging holes.
Items Excluded 1. FWD testing to detect voids. 2. MOT
Typical Life Extension Extremely variable performance
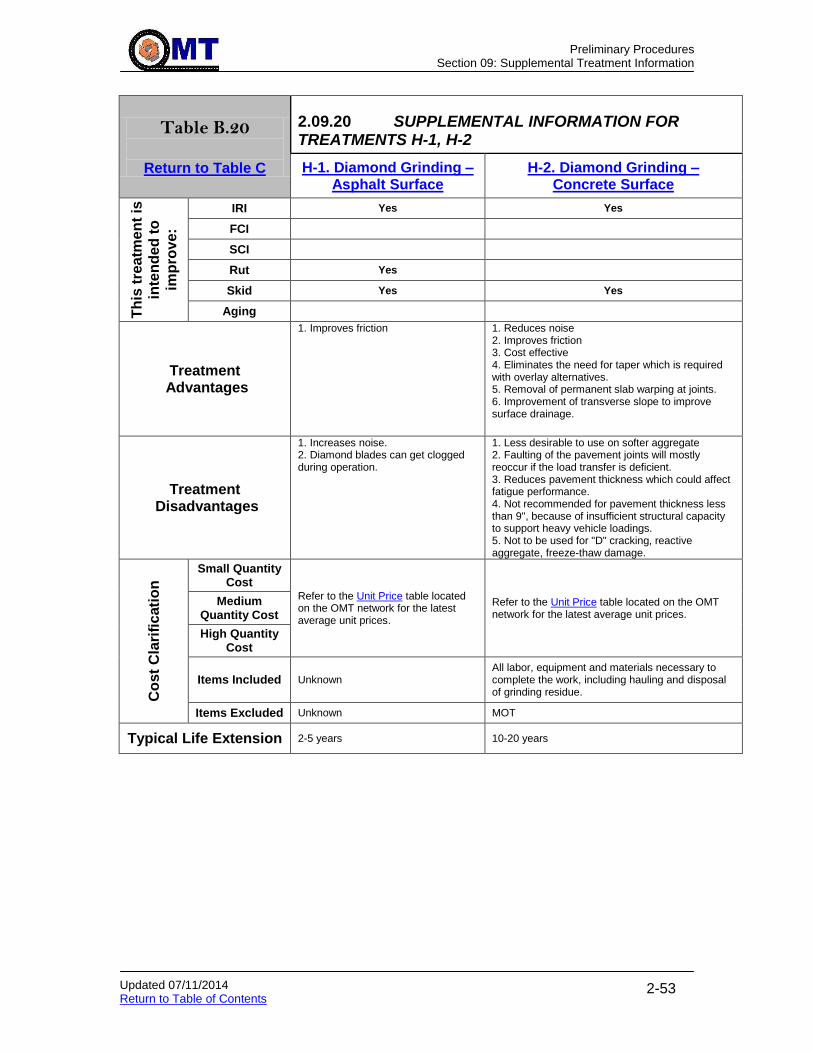
Preliminary Procedures
Section 09: Supplemental Treatment Information
Updated 07/11/2014 Return to Table of Contents
2-53
Table B.20
Return to Table C
2.09.20 SUPPLEMENTAL INFORMATION FOR TREATMENTS H-1, H-2
H-1. Diamond Grinding – Asphalt Surface
H-2. Diamond Grinding – Concrete Surface
Th
is t
rea
tme
nt
is
inte
nd
ed
to
imp
rov
e:
IRI Yes Yes
FCI
SCI
Rut Yes
Skid Yes Yes
Aging
Treatment Advantages
1. Improves friction 1. Reduces noise 2. Improves friction 3. Cost effective 4. Eliminates the need for taper which is required with overlay alternatives. 5. Removal of permanent slab warping at joints. 6. Improvement of transverse slope to improve surface drainage.
Treatment Disadvantages
1. Increases noise. 2. Diamond blades can get clogged during operation.
1. Less desirable to use on softer aggregate 2. Faulting of the pavement joints will mostly reoccur if the load transfer is deficient. 3. Reduces pavement thickness which could affect fatigue performance. 4. Not recommended for pavement thickness less than 9", because of insufficient structural capacity to support heavy vehicle loadings. 5. Not to be used for "D" cracking, reactive aggregate, freeze-thaw damage.
Co
st
Cla
rifi
cati
on
Small Quantity Cost
Refer to the Unit Price table located on the OMT network for the latest average unit prices.
Refer to the Unit Price table located on the OMT network for the latest average unit prices.
Medium Quantity Cost
High Quantity Cost
Items Included Unknown All labor, equipment and materials necessary to complete the work, including hauling and disposal of grinding residue.
Items Excluded Unknown MOT
Typical Life Extension 2-5 years 10-20 years

Preliminary Procedures
Section 09: Supplemental Treatment Information
Updated 07/11/2014 Return to Table of Contents
2-54
Table B.21
Return to Table C
2.09.21 SUPPLEMENTAL INFORMATION FOR TREATMENTS H-3, H-4
H-3. Surface Carbide Grinding H-4. Diamond Grooving
Th
is t
rea
tme
nt
is
inte
nd
ed
to
imp
rov
e:
IRI
FCI
SCI
Rut
Skid Yes Yes
Aging
Treatment Advantages
1. Remove surface distresses 2. Facilitates better bonding of the new overlay with the existing overlay. 3. This technique can be used independently to improve friction. 4. PCI (post-grinding) can be significantly higher.
1. Provides surface with excellent braking traction, therefore reducing wet weather accidents.
Treatment Disadvantages
1. Reduced structural capacity reduces design life, overlay needs to be placed ASAP. 2. Rough ride and loose debris if open to traffic, overlay needs to be placed ASAP. 3. Costlier compared to just overlay or wedge/level
1. Limitation of Longitudinal grooving is the "wiggle" (small lateral movement) that small vehicles and motorcycles may encounter. This may be mitigated by limiting the groove spacing to 3/4" and using 0.125" wide grooves.
Co
st
Cla
rifi
cati
on
Small Quantity Cost
$5.7 / SY
$1.25 - $3 / SY in 1998 Medium
Quantity Cost $2.4 / SY
High Quantity Cost
$1.5 / SY
Items Included See Definition Unknown
Items Excluded See Definition Unknown
Typical Life Extension N/A
Information on performance is not readily available; however, treatment lives are expected to be greater than the 10-20 years noted for diamond grinding.

Preliminary Procedures
Section 09: Supplemental Treatment Information
Updated 07/11/2014 Return to Table of Contents
2-55
Table B.22
Return to Table C
2.09.22 SUPPLEMENTAL INFORMATION FOR TREATMENT H-5
H-5. Surface Abrasion
Th
is t
rea
tme
nt
is
inte
nd
ed
to
imp
rov
e:
IRI
FCI
SCI
Rut
Skid Yes
Aging
Treatment Advantages
1. Significantly improves skid resistance 2. Can open to traffic immediately after treatment 3. No new materials required 4. “Green" - less energy
Treatment Disadvantages
1. Requires specialized equipment
Co
st
Cla
rifi
cati
on
Small Quantity Cost
$1 / SY
Medium Quantity Cost
High Quantity Cost
Items Included Unknown
Items Excluded Unknown
Typical Life Extension 8-15 years
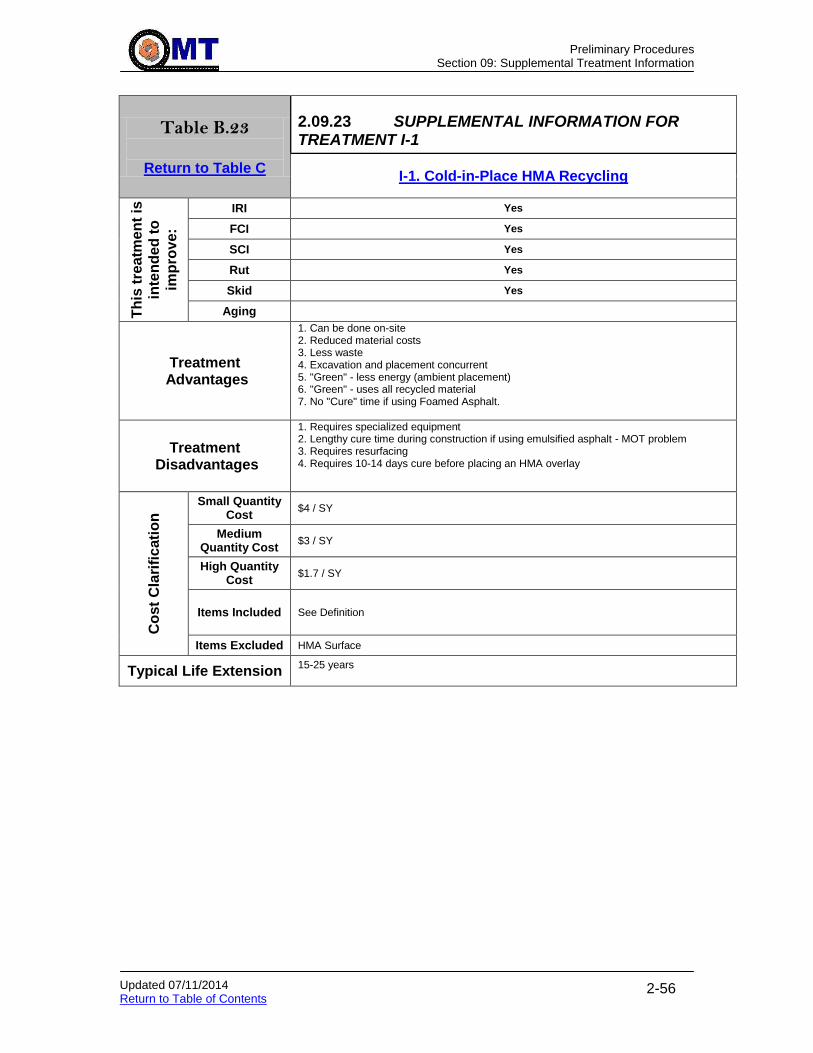
Preliminary Procedures
Section 09: Supplemental Treatment Information
Updated 07/11/2014 Return to Table of Contents
2-56
Table B.23
Return to Table C
2.09.23 SUPPLEMENTAL INFORMATION FOR TREATMENT I-1
I-1. Cold-in-Place HMA Recycling
Th
is t
rea
tme
nt
is
inte
nd
ed
to
imp
rov
e:
IRI Yes
FCI Yes
SCI Yes
Rut Yes
Skid Yes
Aging
Treatment Advantages
1. Can be done on-site 2. Reduced material costs 3. Less waste 4. Excavation and placement concurrent 5. "Green" - less energy (ambient placement) 6. "Green" - uses all recycled material 7. No "Cure" time if using Foamed Asphalt.
Treatment Disadvantages
1. Requires specialized equipment 2. Lengthy cure time during construction if using emulsified asphalt - MOT problem 3. Requires resurfacing 4. Requires 10-14 days cure before placing an HMA overlay
Co
st
Cla
rifi
cati
on
Small Quantity Cost
$4 / SY
Medium Quantity Cost
$3 / SY
High Quantity Cost
$1.7 / SY
Items Included See Definition
Items Excluded HMA Surface
Typical Life Extension 15-25 years

Preliminary Procedures
Section 09: Supplemental Treatment Information
Updated 07/11/2014 Return to Table of Contents
2-57
Table B.24
Return to Table C
2.09.24 SUPPLEMENTAL INFORMATION FOR TREATMENTS I-2, I-3
I-2. Break/Crack & Seat and HMA Overlay
I-3. Rubbilization and HMA Overlay
Th
is t
rea
tme
nt
is
inte
nd
ed
to
imp
rov
e:
IRI Yes Yes
FCI Yes Yes
SCI Yes Yes
Rut
Skid
Aging
Treatment Advantages
1. Significant (12-15 years) achieved. 2. Limits the potential for reflective cracking while maintaining the majority of the structural capacity of the rigid pavement.
1. No excavation Cost 2. Recycling the existing PCC. 3. Cost-effective alternative. 4. Reduces potential for Joint Reflective Cracking.
Treatment Disadvantages
1. Removal of any pre-existing AC overlay is required. 2. May result in grade increase.
1. Results in grade increase 2. Environmental Issues (Dust and Noise) 3. A minimum subgrade strength of 7,500 psi is required. 4. Need to perform subgrade strength tests like GPR.
Co
st
Cla
rifi
cati
on
Small Quantity Cost
No information $ 4.50 per SY (2001) (See MD 404 CO323) Medium
Quantity Cost
High Quantity Cost
Items Included Break and Seat PCC Rubbilization including HMA removal prior to rubbilization
Items Excluded HMA Overlay See Definition
Typical Life Extension 15-25 years 15-25 years
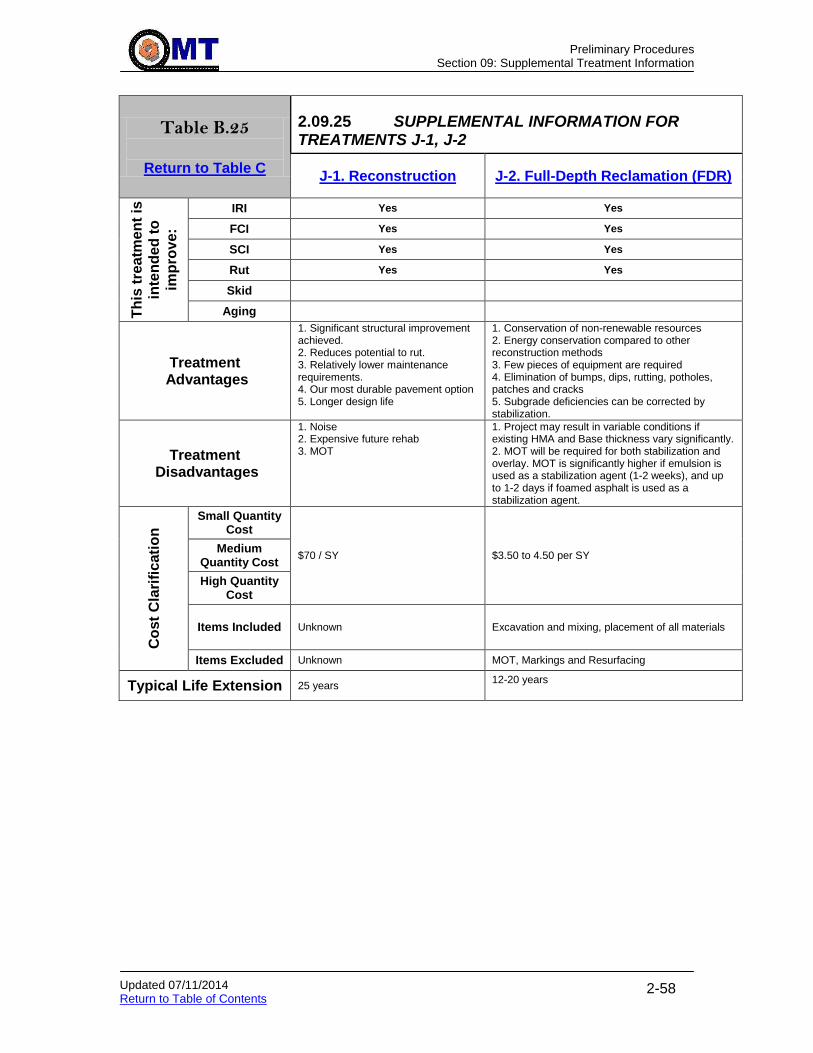
Preliminary Procedures
Section 09: Supplemental Treatment Information
Updated 07/11/2014 Return to Table of Contents
2-58
Table B.25
Return to Table C
2.09.25 SUPPLEMENTAL INFORMATION FOR TREATMENTS J-1, J-2
J-1. Reconstruction J-2. Full-Depth Reclamation (FDR)
Th
is t
rea
tme
nt
is
inte
nd
ed
to
imp
rov
e:
IRI Yes Yes
FCI Yes Yes
SCI Yes Yes
Rut Yes Yes
Skid
Aging
Treatment Advantages
1. Significant structural improvement achieved. 2. Reduces potential to rut. 3. Relatively lower maintenance requirements. 4. Our most durable pavement option 5. Longer design life
1. Conservation of non-renewable resources 2. Energy conservation compared to other reconstruction methods 3. Few pieces of equipment are required 4. Elimination of bumps, dips, rutting, potholes, patches and cracks 5. Subgrade deficiencies can be corrected by stabilization.
Treatment Disadvantages
1. Noise 2. Expensive future rehab 3. MOT
1. Project may result in variable conditions if existing HMA and Base thickness vary significantly. 2. MOT will be required for both stabilization and overlay. MOT is significantly higher if emulsion is used as a stabilization agent (1-2 weeks), and up to 1-2 days if foamed asphalt is used as a stabilization agent.
Co
st
Cla
rifi
cati
on
Small Quantity Cost
$70 / SY $3.50 to 4.50 per SY Medium
Quantity Cost
High Quantity Cost
Items Included Unknown Excavation and mixing, placement of all materials
Items Excluded Unknown MOT, Markings and Resurfacing
Typical Life Extension 25 years 12-20 years

Preliminary Procedures
Section 10: Discussion/Selection Alternative with Project Owner
Updated 06/12/2013 Return to Table of Contents
2-59
2.10 DISCUSSION/SELECTION ALTERNATIVE WITH PROJECT OWNER Click to go to Remaining Service Life Analysis
2.10.01 Purpose
With the introduction of the Pavement Preservation Guide, the number of potential repair strategies expanded significantly. However, for these repair strategies to be used, it is important that the PAGD Engineer communicates early and often with the project manager. This is necessary to:
Ensure there are no constructability issues for any given repair strategy
Ensure that all appropriate items and specifications are provided in the contract documents
Ensure that the PAGD engineer requests/collects the appropriate testing data
Ensure that the customer/project manager accepts the repair strategy
2.10.02 Resource Requirements
The communication with the requesting office is typically done by the PAGD Engineer in the office. The communication requires the following staffing needs for a typical project:
Position Function Resources Effort Level (man-hours)
PAGD Engineer Identify alternatives 1 1*
PAGD Engineer/TL Phone/E-mail Notification 1 1*
* The time required would vary depending on the size and complexity of a project.
2.10.03 Procedure
The PAGD Engineer should fill out PD-02 to identify the various alternatives that could be viable for the project. This should be done using the following steps:
Step 1. Input the project’s ADT, IRI, SCI, FCI, SN and rut data collected from pavement management data, as per the Records Review section.
Step 2. Using the information acquired in Step 1, identify the specific treatments that can be investigated further, as per the Initial Treatment Identification – Pavement Preservation Guide section, and input into the form.
Step 3. Discuss each identified treatment with the PM, and note whether each one should be pursued further for investigation.
Step 4. Include the Form in the project folder.
Step 5. For each treatment alternative that is identified for further investigation, request the appropriate testing as per Testing & Data Collection and perform the necessary analysis and design as per Remaining Service Life Analysis.
Step 6. Discuss the remaining alternatives with the PM, including the benefit/cost ratios for each, and determine which alternative shall be the final choice.
Step 7. Develop the pavement recommendation report(s) as per Deliverables and Report to ensure that the proper specifications and items are included in the contract documents. If the contract has already been advertised, work with

Preliminary Procedures
Section 10: Discussion/Selection Alternative with Project Owner
Updated 06/12/2013 Return to Table of Contents
2-60
the PM to either add the appropriate specs and items, or defer the project to a different contract.
Once the final Treatment Options are established, it will be necessary to develop contracts or use existing contracts for project implementation. Since it is not practical or desirable to have a contract for each treatment, Table C offers suggested grouping of treatments into various compatible Areawide contracts. There are some treatments, due to their more extensive scope of work, such as Heavy (Major) Rehabilitation and Reconstruction that are not compatible with Areawide contracts and would likely require Single Advertised contracts.
Testing & Data Collection
Section 01: Required Testing Guidelines
Updated 05/22/2014 Return to Table of Contents
3-1
3 TESTING & DATA COLLECTION Click to go to Discussion/Selection Alternative with Project Owner Click to go to New Pavement Design Click to go to Pavement Preservation & Rehabilitation Design Click to go to Management Review & QA Click to go to New Pavement Design Using AASHTO 1993 Click to go to Pavement Preservation and Rehabilitation Design Using AASHTO 1993
3.01 REQUIRED PAVEMENT TESTING GUIDELINES
3.01.01 Purpose
As a general rule, all projects require some level of pavement testing (Site Visit, Core Testing, FWD Testing, Visual Pavement Condition Assessment, Patching Survey and Traffic Survey) in order to determine existing pavement conditions for use in analysis and design. The level or extent of testing required will depend on many factors including project scope and project features, roadway functional class, level of existing testing information available and risk if testing is not performed. Under no circumstances should testing be eliminated without approval of a PAGD Team Leader. If there is sufficient existing testing available and approval has been obtained from the PAGD Team Leader to eliminate testing, the project will be considered as having met the requirements for required testing. There are various valid reasons other than the previously noted conditions when testing may have to be eliminated or reduced, such as the following:
safety/logistic reasons such as elimination of testing on beltways, ramps,
etc..
short testing lead time due to project schedule
large volume of testing requests
weather – time of year
unavailability of field testing personnel and/or equipment
If testing is eliminated strictly due to these reasons, the project will be considered as not having met the requirements of field testing. The reason for eliminating testing should be noted in the comments of the Field Info section of the DesignProjects.mdb along with a Status of Cancelled.
3.01.02 Procedure
The following outlines when testing may be limited/reduced or even eliminated: Step 1. If the purpose of the project is not specifically to improve the pavement (i.e.
when pavement scope is for tie-ins only, raising grade for flood plain, profile or site distance issues, etc.) consideration may be given to reduce/eliminate some testing (Core Testing, FWD Testing, Visual Pavement Condition Assessment and Traffic Survey).
Step 2. If the scope of the project is a preventive maintenance treatment (asphalt or
aggregate seal as defined in Initial Treatment Identification – Pavement

Testing & Data Collection
Section 01: Required Testing Guidelines
Updated 05/22/2014 Return to Table of Contents
3-2
Preservation Guide) consideration may be given to reduce/eliminate some testing (Core Testing, FWD Testing, Visual Pavement Condition Assessment, and Traffic Survey).
Step 3. A Site Visit should be performed for all projects at a minimum regardless of project purpose or scope if we are providing any recommendations/comments. A Form PD-04 should be completed during the visit to document the site conditions.
Step 4. Core Testing may be considered for elimination or reduction if one or all of
the following conditions are met:
a. If existing coring (or roadway boring) information is available within the current project limits; or if existing coring (or roadway boring) information is available directly adjacent to the current project limits when construction history or as-built plans indicate pavement structure is consistent for both the adjacent and current project
AND
If no rehabilitation was done AFTER the cores were taken. If rehabilitation was performed after the cores were taken, then coring will be required as the pavement cross-section has changed and it will be necessary to discover potential separation between the last rehab layer and the layers underneath.
b. If estimated pavement condition (from PD-01 Condition Summary) is good or better, limited/reduced core testing may be considered.
c. If GPR and RADAN Analysis is performed.
Step 5. GPR testing is required for concrete overlay projects where grinding will be performed.
Step 6. FWD Testing may be considered for elimination or reduction if one or all of the following conditions are met:
a. If structural distresses are non-existent or minor; i.e. the fix will be for
functional reasons. b. If FWD testing information is available within the current project limits; or if
existing FWD testing information is available directly adjacent to the current project limits when construction history or as-built plans indicate pavement structure is consistent for both the adjacent and current project.
If no rehabilitation was performed AFTER the FWD was performed, the pavement cross-section has not changed, and therefore available FWD information is still valid. If rehabilitation was performed AFTER the FWD was performed, the design engineer shall use the pavement cross-section AT THE TIME OF FWD

Testing & Data Collection
Section 01: Required Testing Guidelines
Updated 05/22/2014 Return to Table of Contents
3-3
TESTING when performing analysis only if the existing pavement does not exhibit any structural distresses caused by poor subgrade condition (depression, subgrade rutting).
c. If estimated pavement condition (from PD-01 Condition Summary) is good or better, FWD testing may be considered for elimination.
d. If the considered treatments are Preventive Maintenance.
Step 7. A Patching Survey may be considered for modification if the estimated pavement condition (from PD-01 Condition Summary) is good or better. A modified patch survey consists of obtaining the estimated patch quantities through use of a DMI. A Patching Survey may still be needed in areas where PCI is not performed (i.e. shoulders). If the scope of the project is strictly to reconstruct pavement, a patching survey will not be required.
Step 8. A Traffic Survey, in general, should be requested from OPPE – Travel
Forecasting and Analysis Division. In addition, traffic for turning movements and ramps should be requested specifically, in addition to mainline traffic, depending on the scope of the project. A traffic survey may be considered for elimination if all the following conditions are met:
a. If existing traffic data (from OPPE – Travel Forecasting and Analysis Division)
is available within the current project limits; or if existing traffic data (from OPPE – Travel Forecasting and Analysis Division) is available directly adjacent to the current project limits when the Highway Location Reference (HLR) indicates traffic data is consistent for both the adjacent and current project.
b. If existing traffic data (from OPPE – Travel Forecasting and Analysis Division) is no older than 5 years.
c. If no major development (may require verification with Access Management
Division) has occurred since existing traffic data (from OPPE – Travel Forecasting and Analysis Division) was collected.
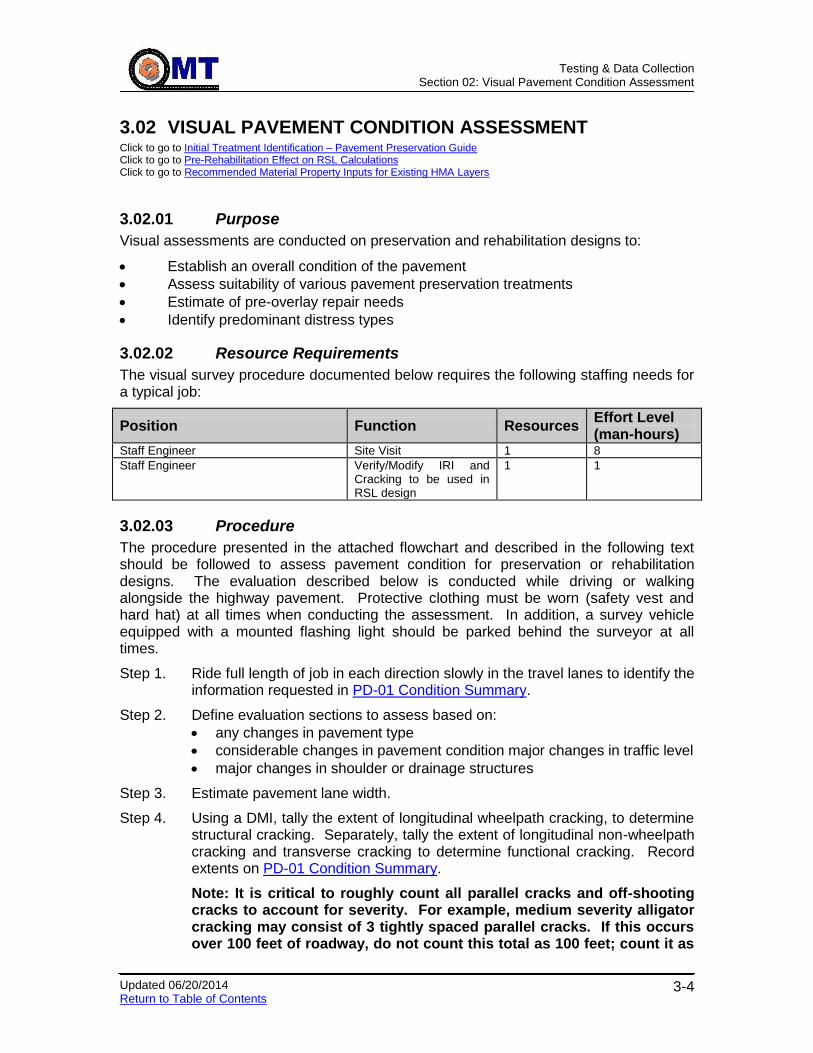
Testing & Data Collection
Section 02: Visual Pavement Condition Assessment
Updated 06/20/2014 Return to Table of Contents
3-4
3.02 VISUAL PAVEMENT CONDITION ASSESSMENT Click to go to Initial Treatment Identification – Pavement Preservation Guide Click to go to Pre-Rehabilitation Effect on RSL Calculations Click to go to Recommended Material Property Inputs for Existing HMA Layers
3.02.01 Purpose
Visual assessments are conducted on preservation and rehabilitation designs to:
Establish an overall condition of the pavement
Assess suitability of various pavement preservation treatments
Estimate of pre-overlay repair needs
Identify predominant distress types
3.02.02 Resource Requirements
The visual survey procedure documented below requires the following staffing needs for a typical job:
Position Function Resources Effort Level (man-hours)
Staff Engineer Site Visit 1 8
Staff Engineer Verify/Modify IRI and Cracking to be used in RSL design
1 1
3.02.03 Procedure
The procedure presented in the attached flowchart and described in the following text should be followed to assess pavement condition for preservation or rehabilitation designs. The evaluation described below is conducted while driving or walking alongside the highway pavement. Protective clothing must be worn (safety vest and hard hat) at all times when conducting the assessment. In addition, a survey vehicle equipped with a mounted flashing light should be parked behind the surveyor at all times.
Step 1. Ride full length of job in each direction slowly in the travel lanes to identify the information requested in PD-01 Condition Summary.
Step 2. Define evaluation sections to assess based on:
any changes in pavement type
considerable changes in pavement condition major changes in traffic level
major changes in shoulder or drainage structures
Step 3. Estimate pavement lane width.
Step 4. Using a DMI, tally the extent of longitudinal wheelpath cracking, to determine structural cracking. Separately, tally the extent of longitudinal non-wheelpath cracking and transverse cracking to determine functional cracking. Record extents on PD-01 Condition Summary.
Note: It is critical to roughly count all parallel cracks and off-shooting cracks to account for severity. For example, medium severity alligator cracking may consist of 3 tightly spaced parallel cracks. If this occurs over 100 feet of roadway, do not count this total as 100 feet; count it as

Testing & Data Collection
Section 02: Visual Pavement Condition Assessment
Updated 06/20/2014 Return to Table of Contents
3-5
300 feet. If there are interconnecting cracks, adjust the 300-foot total upwards to account for those interconnecting cracks.
Step 5. Determine the SCI and FCI values for each section using the following equations. Refer to PD-01 Condition Summary:
Structural: SCI = If SCD >= 0 and <1 If SCD >=1 and < 14
If SCD >= 14 and <=100
Functional: FCI = If FCD >=0 and < 1
If FCD >=1 and < 18
If FCD >= 18 and <=100
Where CI: Cracking Index (100 scale value),
SCI: Structural Cracking Index (100 scale value),
FCI: Functional Cracking Index (100 scale value),
SCD: Structural cracking density = structural cracking length / structural
sample area *100 (unit: feet / square feet), and
FCD: Functional cracking density = functional cracking length / functional
sample area *100 (unit: feet / square feet).
Functional Lane Width = Lane Width – 6.67 feet if lane width > 9.33 feet
Functional Lane Width = 2.67 feet if lane width < 9.33 feet
Structural Lane Width = 6.67 feet if lane width > 9.33 feet
Structural Lane Width = Lane Width – 2.67 feet if lane width < 9.33 feet
Note: When performing designs for rehabilitation of existing AC pavements, Darwin M-E requires the user to identify the condition of the existing pavement as “Excellent”, “Good”, “Fair”, “Poor”, “Very Poor”. The designer should “label” the pavement condition when completing the PD-01 form.
Step 6. Review all inputs on PD-01, and subsequent calculations to ensure correctness.
Step 7. Place all completed forms in project file.
Testing & Data Collection
Section 03: Patching Survey
Updated 12/06/2012 Return to Table of Contents
3-6
3.03 PATCHING SURVEY
3.03.01 Purpose
Patching surveys are conducted on preservation and rehabilitation designs to:
Identify types of patches
Establish detailed quantity of patching
3.03.02 Resource Requirements
The patching survey procedure documented below requires the following staffing needs for a typical job:
Position Function Resources Effort Level (man-hours)
Staff Engineer Data Collection 1 8
Staff Engineer Data Entry/Processing 1 2
Staff Engineer QC Field Work 1 2
3.03.03 Procedure
The procedure presented in the attached flowchart and described in the following text should be followed to identify patching locations. Locations should be identified after the designer has selected the preferred design alternate. The evaluation described below is conducted while walking slowly alongside the highway pavement. Protective clothing must be worn (safety vest and hard hat) at all times when conducting the survey. In addition, a survey vehicle equipped with a mounted flashing light should be parked behind the surveyor at all times.
Step 1. Review the Patching Guidelines forms and review the rehabilitation strategy for the particular project to understand the specific criteria for patching.
Step 2. The entire length of the job should be evaluated by walking slowly along the pavement. Survey the entire pavement width, including the shoulders, ramps, and intersections to identify:
patching lane
location of patch within lane (All, IWP, OWP)
begin and end locations of patch
distress type and severity patched
patch, depth length and width or size
Whether the patch should be full- or partial-depth
Step 3. Document the information recorded in Step 2 on the PD-12 Pavement Patching Survey, enter the patching locations and extents and print out the patching report to be included into the project files. Sum total of patching areas for partial-depth and full-depth patching for entire project.
Step 4. Perform QA of patch quantities to ensure correctness of patch quantities, either through a windshield review or through use of Visidata. If quantities appear to be erroneous, discuss with Design Engineer and correct as appropriate.
Step 5. Place all completed forms in project file.

Testing & Data Collection
Section 04: Falling Weight Deflectometer (FWD) Testing
Updated 12/06/2012 Return to Table of Contents
3-7
3.04 FALLING WEIGHT DEFLECTOMETER (FWD) TESTING Click to go to FWD Data Analysis Background
3.04.01 Purpose
FWD Testing is conducted to:
Collect data to determine the soil and subgrade strength
Collect data to estimate the structural capacity of the pavement structure and the material properties of the individual pavement layers
Collect data to estimate the load transfer ability of joints and void detection (corners) in jointed rigid and composite pavements
Determine statistically different performing pavement sections and sub-sections
3.04.02 Resource Requirements
The FWD testing procedure documented below requires the following staffing needs for a typical job:
Position Function Resources Effort Level (man-hours)
Staff Engineer or Project Engineer Establish Project Features 1 1
Staff Engineer or Project Engineer FWD Testing Set-Up 1 2
Project Engineer/ FED Testing Communication w/ FED 2 1
Field Explorations Division (FED) FWD Testing 1 12*
Staff Engineer or Project Engineer QC FWD Data 1 2 * This value is dependent upon project size. This is based on 1-day of testing or 150 points/day.
3.04.03 Procedure
The procedure presented in the attached flowchart and described in the following text should be followed to complete FWD Testing. FWD testing shall be required on all projects requiring pavement rehabilitation unless specified otherwise in this Pavement Design Guide or as directed by the Assistant Pavement and Geotechnical Division Chief or Division Chief.
There are several assumptions that are made in the development of this process and the values used to establish FWD testing set-ups. The most important item that pavement designers need to be aware of is that is was assumed that the FWD equipment and operator could collect approximately 150 test points a day. This is based on limited travel time, no constricting MOT demands, and no equipment failures. This is the testing schedule that should be used when estimating the testing time demands needed for a particular project. Depending on the size and geometry of some projects, 150 points may be an excessive amount of data; i.e. a short turn lane project.
In addition, the testing demands of the FWD occasionally become heavy and the amount of testing for a particular project may need to be reduced in order to provide FWD data to all the projects in the state within a reasonable time. In this case, communication between Field Explorations Division (FED) and the design engineer need to take place to ensure adequate data and time constraints are addressed for all interested parties.

Testing & Data Collection
Section 04: Falling Weight Deflectometer (FWD) Testing
Updated 12/06/2012 Return to Table of Contents
3-8
Step 1. Determine the pavement type variations within the project limits. A separate test set-up needs to be established for each pavement type within the project. At this point, the records review and site visit should have provided sufficient information to determine the pavement type variation within a project. Information collected in PD-01 Condition Summary, for each project section, will also provide additional refresher information about the pavement types.
Step 2. Determine the project layout and attributes. The project layout will influence the FWD test set-up and pattern of testing. All state routes, intersections, turn lanes, ramps, service roads, and shoulders within the project limits should be identified and a decision made if FWD testing is required. A well-defined scope is required to make decisions about testing requirements for various project attributes. Discussion with the Assistant Pavement and Geotechnical Division Chief for Design maybe needed, if necessary.
Step 3. Determine the size (length and lanes) of each project attribute (mainline, shoulders, ramps, etc.) to receive FWD testing. This will provide the time demands on the FWD for this particular project. These demands are based on the assumptions stated above about the FWD test pace being approximately 150 test points per day.
Step 4. Determine the project geometry. The project geometry will influence the FWD pattern of testing. For example, numerous intersections, closely spaced intersections, and single lane ramps may limit the amount of testing that can be feasibly done because on the demands of the travelling public and MOT. These MOT concerns should be noted and discussed with FED after the request is provided.
Step 5. Determine FWD test sections. Use the information gathered in Steps 1 through 4 above to determine FWD test sections. Separate FWD test sections should be established for different pavement types and project attributes for a project. Section lengths and project geometry will dictate FWD test set-up in a FWD test section.
Step 6. Determine FWD test type for each section. There are three basic types of FWD tests: basin, joint, corner. Basin testing is used to evaluate the structural strength of the pavement structure and subgrade in flexible and rigid pavements. The primary use of basin testing in composite pavements is to establish a HMA compression or bending factor. Basin testing can also be used to produce a general estimate of the structural strength of the pavement structure and subgrade in composite pavements. Specific structural characteristics of composite pavement are difficult to obtain with a great deal of confidence with the current back-calculation analysis methods available today.
Basin testing can also be done on subgrade and base materials. Basin testing on subgrade or unbound base materials should be completed with the larger load plate (radius of 9”, 230 mm) to prevent damage to the underlying layers. All other testing should be done with the smaller load plate (radius of 6”, 150 mm).
Joint testing is used to assess the performance of existing joints to transfer loads across slabs in rigid and composite pavements. In addition, joint testing can be used to determine the presence of voids under the slabs at the
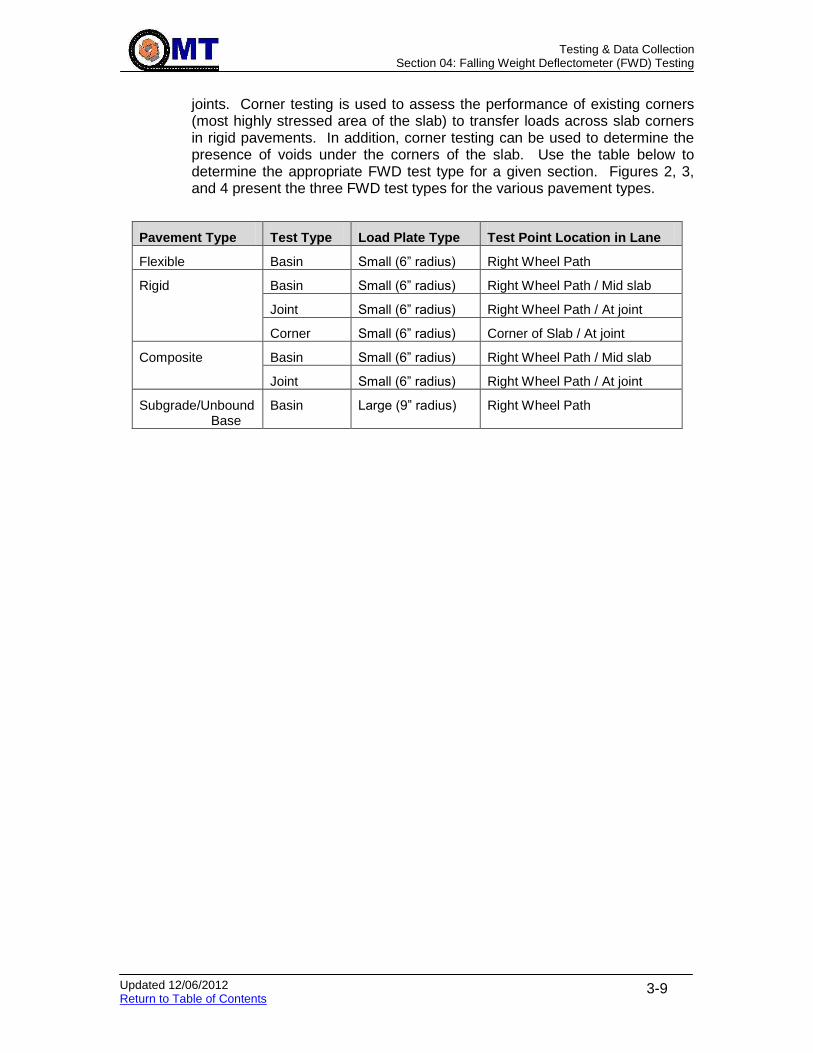
Testing & Data Collection
Section 04: Falling Weight Deflectometer (FWD) Testing
Updated 12/06/2012 Return to Table of Contents
3-9
joints. Corner testing is used to assess the performance of existing corners (most highly stressed area of the slab) to transfer loads across slab corners in rigid pavements. In addition, corner testing can be used to determine the presence of voids under the corners of the slab. Use the table below to determine the appropriate FWD test type for a given section. Figures 2, 3, and 4 present the three FWD test types for the various pavement types.
Pavement Type Test Type Load Plate Type Test Point Location in Lane
Flexible Basin Small (6” radius) Right Wheel Path
Rigid Basin Small (6” radius) Right Wheel Path / Mid slab
Joint Small (6” radius) Right Wheel Path / At joint
Corner Small (6” radius) Corner of Slab / At joint
Composite
Basin Small (6” radius) Right Wheel Path / Mid slab
Joint Small (6” radius) Right Wheel Path / At joint
Subgrade/Unbound Base
Basin Large (9” radius) Right Wheel Path

Testing & Data Collection
Section 04: Falling Weight Deflectometer (FWD) Testing
Updated 12/06/2012 Return to Table of Contents
3-10
Flexible Rigid Composite - FWD load plate
Figure 2 – FWD Basin Testing

Testing & Data Collection
Section 04: Falling Weight Deflectometer (FWD) Testing
Updated 12/06/2012 Return to Table of Contents
3-11
Flexible Rigid Composite
No Joint Testing Applicable - FWD load plate
Figure 3 – Joint Testing
No Joint Testing Applicable

Testing & Data Collection
Section 04: Falling Weight Deflectometer (FWD) Testing
Updated 12/06/2012 Return to Table of Contents
3-12
Flexible Rigid Composite
- FWD load plate
Figure 4 – Corner Testing
No Corner Testing Applicable
No Corner Testing Applicable
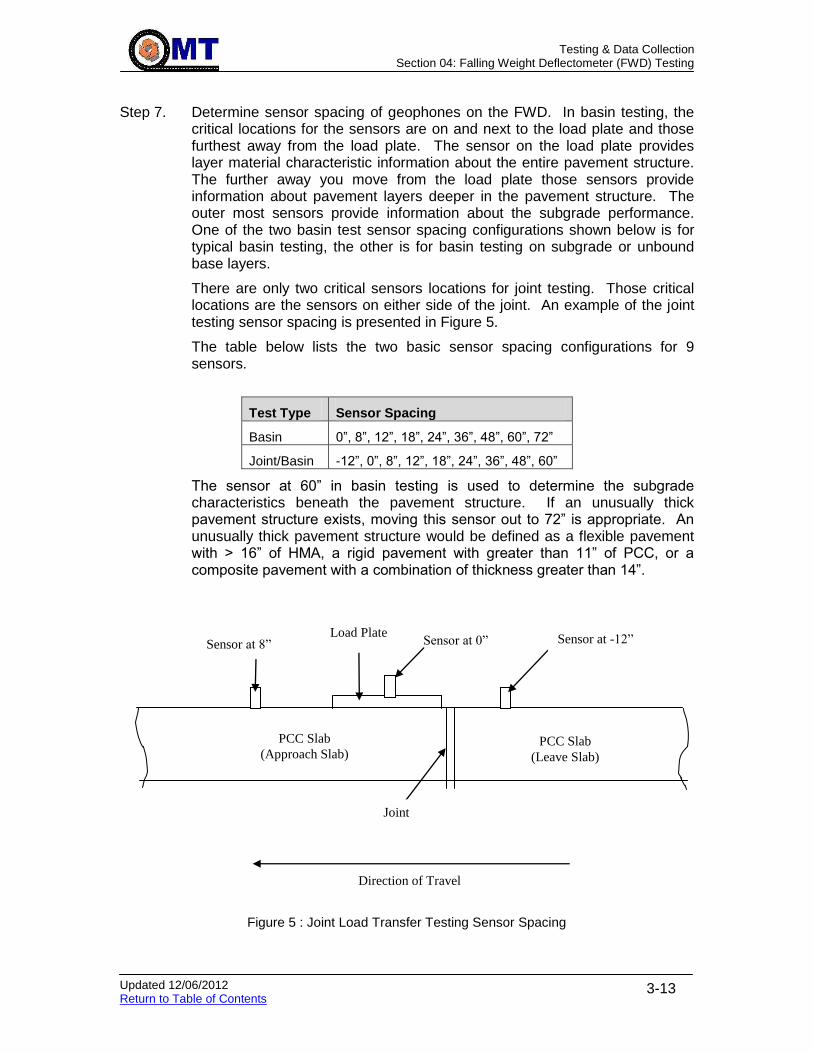
Testing & Data Collection
Section 04: Falling Weight Deflectometer (FWD) Testing
Updated 12/06/2012 Return to Table of Contents
3-13
Step 7. Determine sensor spacing of geophones on the FWD. In basin testing, the critical locations for the sensors are on and next to the load plate and those furthest away from the load plate. The sensor on the load plate provides layer material characteristic information about the entire pavement structure. The further away you move from the load plate those sensors provide information about pavement layers deeper in the pavement structure. The outer most sensors provide information about the subgrade performance. One of the two basin test sensor spacing configurations shown below is for typical basin testing, the other is for basin testing on subgrade or unbound base layers.
There are only two critical sensors locations for joint testing. Those critical locations are the sensors on either side of the joint. An example of the joint testing sensor spacing is presented in Figure 5.
The table below lists the two basic sensor spacing configurations for 9 sensors.
Test Type Sensor Spacing
Basin 0”, 8”, 12”, 18”, 24”, 36”, 48”, 60”, 72”
Joint/Basin -12”, 0”, 8”, 12”, 18”, 24”, 36”, 48”, 60”
The sensor at 60” in basin testing is used to determine the subgrade characteristics beneath the pavement structure. If an unusually thick pavement structure exists, moving this sensor out to 72” is appropriate. An unusually thick pavement structure would be defined as a flexible pavement with > 16” of HMA, a rigid pavement with greater than 11” of PCC, or a composite pavement with a combination of thickness greater than 14”.
Figure 5 : Joint Load Transfer Testing Sensor Spacing
PCC Slab
(Approach Slab) PCC Slab
(Leave Slab)
Joint
Sensor at 0” Sensor at -12” Sensor at 8” Load Plate
Direction of Travel
Testing & Data Collection
Section 04: Falling Weight Deflectometer (FWD) Testing
Updated 12/06/2012 Return to Table of Contents
3-14
Step 8. Determine the FWD Test Set-Up Identification number. This selection is based on the results from Step 6 and 7. The ID number will be used in the Test Request Database. This FWD Test Set-Up ID number will provide information concerning the test type and sensor spacing. Use the table below to select the proper FWD Test Set-Up ID number.
Test Set-Up ID Pavement Type Test Type Sensor Spacing
1 Any Pavement Joint/Basin -12”, 0”, 8” 12”, 18”, 24”, 36”, 48”, 60”
2 Any Pavement (Thick) Joint/Basin 0”, 8” 12”, 18”, 24”, 36”, 48”, 60”, 72”
Step 9. Determine the FWD load package and drop sequence identification number. This decision will dictate the force of the load applied to the pavement, the number of drops, the number of seating drops, and the sequence of the drops. A seating drop is a load applied to the pavement to seat the load plate, perform a quality check on the sensors and load cell, and to warm the buffers beneath the weights on the FWD properly. No deflection or load data is recorded during a seating drop. It is typical to have at least one seating drop prior to any testing at a new test point and one seating drop prior to each drop height change. The height the weights of the FWD are raised dictate the amount of load applied to the pavement. There are four basic drop heights, known as 1, 2, 3, and 4. These heights typically result in a load applied to the pavement of 6000 lbs., 9000 lbs., 12000 lbs., or 18000 lbs. The seating drops are done at the same drop heights, but are known as A, B, C, and D. Therefore a load package and drop sequence written as “BC3D4” would result in the following:
- a seating drop at 9000 lbs. for a new test point,
- a seating drop at 12000 lbs. for a new drop height,
- a recorded drop at 12000 lbs.,
- a seating drop at 18000 lbs. for a new drop height, and
- a recorded drop at 18000 lbs.
The pavement type and thickness and FWD test type dictate the load package. Use the table below to select the proper load package and drop sequence for your particular section within a project. Additional drops and sequences can be selected; the list in the following table is only a typical range of acceptable load packages and sequences.
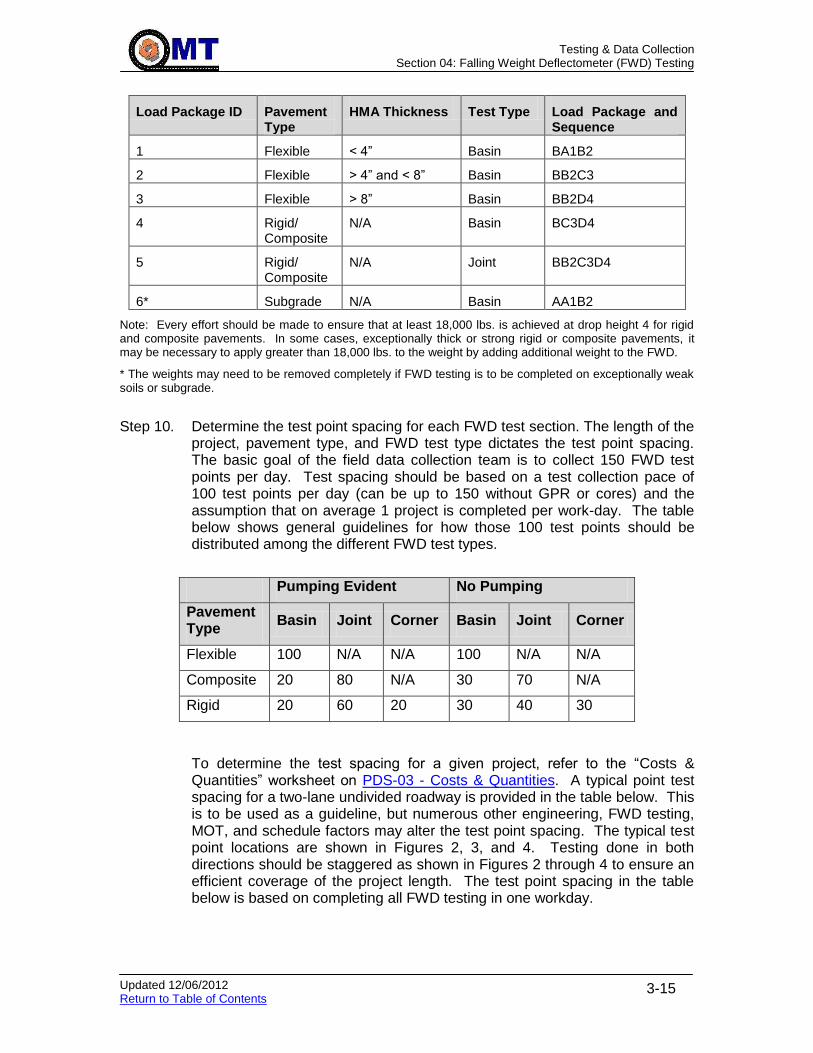
Testing & Data Collection
Section 04: Falling Weight Deflectometer (FWD) Testing
Updated 12/06/2012 Return to Table of Contents
3-15
Load Package ID Pavement Type
HMA Thickness Test Type Load Package and Sequence
1 Flexible < 4” Basin BA1B2
2 Flexible > 4” and < 8” Basin BB2C3
3 Flexible > 8” Basin BB2D4
4 Rigid/ Composite
N/A Basin BC3D4
5 Rigid/ Composite
N/A Joint BB2C3D4
6* Subgrade N/A Basin AA1B2
Note: Every effort should be made to ensure that at least 18,000 lbs. is achieved at drop height 4 for rigid and composite pavements. In some cases, exceptionally thick or strong rigid or composite pavements, it may be necessary to apply greater than 18,000 lbs. to the weight by adding additional weight to the FWD.
* The weights may need to be removed completely if FWD testing is to be completed on exceptionally weak soils or subgrade.
Step 10. Determine the test point spacing for each FWD test section. The length of the project, pavement type, and FWD test type dictates the test point spacing. The basic goal of the field data collection team is to collect 150 FWD test points per day. Test spacing should be based on a test collection pace of 100 test points per day (can be up to 150 without GPR or cores) and the assumption that on average 1 project is completed per work-day. The table below shows general guidelines for how those 100 test points should be distributed among the different FWD test types.
Pumping Evident No Pumping
Pavement Type
Basin Joint Corner Basin Joint Corner
Flexible 100 N/A N/A 100 N/A N/A
Composite 20 80 N/A 30 70 N/A
Rigid 20 60 20 30 40 30
To determine the test spacing for a given project, refer to the “Costs & Quantities” worksheet on PDS-03 - Costs & Quantities. A typical point test spacing for a two-lane undivided roadway is provided in the table below. This is to be used as a guideline, but numerous other engineering, FWD testing, MOT, and schedule factors may alter the test point spacing. The typical test point locations are shown in Figures 2, 3, and 4. Testing done in both directions should be staggered as shown in Figures 2 through 4 to ensure an efficient coverage of the project length. The test point spacing in the table below is based on completing all FWD testing in one workday.

Testing & Data Collection
Section 04: Falling Weight Deflectometer (FWD) Testing
Updated 12/06/2012 Return to Table of Contents
3-16
Test Point Spacing
Flexible Composite Rigid
Project Length (Centerline)
Test Type
No
Pu
mp
ing
Ev
ide
nt
Pu
mp
ing
Ev
ide
nt
No
Pu
mp
ing
Ev
ide
nt
Pu
mp
ing
Ev
ide
nt
3 miles Basin 250’ 640’ / 16
th
slab 1280’ / 32
nd slab
640’ / 16th
slab 1280’ / 32
nd slab
2 miles Basin 175’ 400’ / 10
th
slab 840’ / 21
st slab
400’ / 10th
slab 840’ / 21
st slab
1 mile Basin 100’ 200’ / 5
th
slab 400’ / 10
th slab
200’ / 5th
slab 400’ / 10
th slab
< 1 mile Basin 50’ 160’ / 4
th
slab 200’ / 5
th
slab 160’ / 4
th
slab 200’ / 5
th
slab
3 miles Joint N/A 280’ / 7
th
slab 240’ / 6
th
slab 640’ / 16
th
slab 400’ / 10
th slab
2 miles Joint N/A 200’ / 5
th
slab 160’ / 4
th
slab 400’ / 10
th
slab 280’ / 7
th
slab
1 mile Joint N/A 120’ / 3
rd
slab 80’ / 2
nd
slab 200’ / 5
th
slab 120’ / 3
rd
slab
< 1 mile Joint N/A 80’ / 2
nd
slab
40’ / every slab
160’ / 4th
slab 80’ / 2
nd
slab
3 miles Corner N/A N/A N/A 640’ / 16
th
slab 640’ / 16
th slab
2 miles Corner N/A N/A N/A 400’ / 10
th
slab 400’ / 10
th slab
1 mile Corner N/A N/A N/A 200’ / 5
th
slab 200’ / 5
th
slab
< 1 mile Corner N/A N/A N/A 160’ / 4
th
slab 160’ / 4
th
slab
At minimum, at least 30 test points should be collected per direction for any project of reasonable length. Thirty test points in one direction provide the minimal amount of information about the stretch of roadway to identify weak/strong areas and adequately characterize the structural capacity of the pavement. Projects longer than 3 centerline miles should be considered more than a more day operation for FWD testing.
Projects containing several different sections because of different pavement types should have testing broken down according to the percentage of each pavement type. Therefore, if half the project is composite and half is flexible, a one-day test point spacing setup should be 50% of the test point spacing typically done for each pavement type.
Step 11. Complete the FWD Testing section of the Test Request Database using the information gathered in Steps 1 through 10 of this section. The work completed Step 8 provided the information for FWD test set-up, Step 9 provided information for the load package, and Step 10 provided information about the test point spacing. Complete the date of the request and the
Testing & Data Collection
Section 04: Falling Weight Deflectometer (FWD) Testing
Updated 12/06/2012 Return to Table of Contents
3-17
requested completion date for the FWD testing. Once the form is filled out, give the request form to the Design Team Leader for review, then provide to the field data collection team.
Step 12. Schedule FWD testing and MOT for testing for the submitted request. Every attempt should be made to schedule the testing in order to have it completed by the requested completion date.
Responsible Party – Field Data Collection Team
Step 13. The pavement design engineer and FED should meet and discuss the testing to ensure that all facets of the FWD testing are understood. Specific details about the project, testing, and other concerns can be addressed at this time.
Responsible Party – FED and Engineer
Step 14. Set-up the Dynatest FWD software for the FWD testing of the specific section in the project. Use the following criteria when establishing the software test set-up:
Always store the length measurement in the FWD software in feet/stations, not miles, unless requested otherwise.
Store FWD test type in the Lane field in the software, in addition to the lane number; i.e. using “B” for basin, “J” for joint testing, and “C” for corner testing. For instance, joint testing in lane 1 would have “J1” in the lane field and basin testing in lane 2 would have “B2” in the lane field. Testing in the shoulder will not have a number, but rather a “S” in place of the number. Therefore, basin testing in the shoulder will be “BS”.
For load transfer testing, the sensor spacing will dictate the population of the test type field in the Dynatest software. When joint testing with a sensor at (–12) inches, it shall be entered as “Approach” joint testing. When joint testing with a sensor at (+12) inches, it shall be entered as “Leave” joint testing.
Create a separate electronic file for each direction for each section in the project, unless requested otherwise.
Name the electronic file with the FWD data by the route, route number, route suffix, and direction. For instance testing on MD 32 would have a filename of “MD32WB.F25” and “MD32EB.F25”
Responsible Party - FED
Step 15. Complete the FWD testing following the guidelines established in the operations manual of Dynatest. Specific test set-up is provided in the field work request form, Pavement Guide, and discussions with the pavement design engineer.
Responsible Party - FED
Step 16. Measure the surface and air temperature regularly during FWD testing and record it in the Dynatest FWD software. Make sure to indicate in the software that the temperature recorded is either surface or air. Only classify the temperature as mid-depth temperature when the pavement surface is drilled, filled with mineral oil, and measured with a temperature probe.

Testing & Data Collection
Section 04: Falling Weight Deflectometer (FWD) Testing
Updated 12/06/2012 Return to Table of Contents
3-18
Responsible Party – FED
Step 17. Proper Quality Control shall be followed during the testing to ensure that sensors and load cells stay within tolerable limits. Comments and field notes about a particular point should be placed in the comments field in the Dynatest software. A separate hand written sheet is only needed if requested by the pavement design engineer when the temperature and field notes are added into the Dynatest software program.
Responsible Party – FED
Step 18. Provide the FWD file to the responsible pavement design engineer after FWD testing is completed.
Responsible Party - FED
Step 19. Quality Assurance shall be completed on the FWD data to ensure the data is a good quality and free of data collection errors prior performing data analysis. Complete FWD data PD-06 QCQA Form after reviewing the FWD data for QA. The QA will involve, but not limited to the following:
Eliminate test points with non-decreasing deflections
Eliminate test points with sensors with “Out of Range” errors.
Review recorded loads to ensure that erroneous measurements are not recorded.

Testing & Data Collection
Section 05: Requests for Pavement Field Work
Updated 02/06/13 Return to Table of Contents
3-19
3.05 REQUESTS FOR PAVEMENT FIELD WORK
3.05.01 Purpose
Pavement structure determination is completed to:
Identify the pavement structure of the roadway,
Identify condition of pavement layers beneath the surface, and
Identify weak and thin areas in the pavement structure.
For soil determination, including determining soil characteristics and existing conditions, and identifying depth to water table and bedrock, refer to Requests For Geotechnical Field work. This section is for pavement structure above the subgrade only.
3.05.02 Resource Requirements
The actual operation of obtaining the pavement structure and soil properties is completed by OMT field crews from the Field Explorations Division. The pavement engineer is responsible for determining the location and number of areas to collect this information. Determining the number and location of areas to collect pavement and soil data requires the following staffing needs for a typical job:
Position Function Resources Effort Level (man-hours)
Staff Engineer or Project Engineer Testing Request 1 2
Staff Engineer or Project Engineer Field Crew Communication 1 1
Staff Engineer or Project Engineer Reviewing Data 1 1
* The time required would vary depending on the size, complexity and location of the project.
3.05.03 Procedure
The procedure presented in the attached flowchart and described in the following text should be followed in determining pavement structure. The primary focus of this section is to provide guidance to the pavement engineer to request the proper number and location of cores/borings/ground-penetrating radar (GPR). Assistance from the Field Explorations Division contact may be required for determining locations of specific soil borings and pavement cores. The steps identified in this section are to be completed in conjunction with new or rehabilitation pavement design procedures.
Follow the steps below to determine pavement structure test locations.
Step 1. Determine general areas or sections of roadways where GPR, pavement cores and/or pavement borings will be needed to develop pavement recommendations. Pavement cores are needed to identify the existing pavement structure and condition in areas to be rehabilitated or reconstructed. Pavement borings and GPR should be obtained to identify the amount of pavement to be removed in cases where the roadway is to be reconstructed; i.e. bridge approaches. Pavement borings and GPR should be obtained in proposed MOT pavement areas.
Step 2. Determine the number of mainline cores for the resurfacing portion of a project. Pavement cores should be taken in each lane for each pavement structure that exists in the project. The existing conditions of the roadway will
Testing & Data Collection
Section 05: Requests for Pavement Field Work
Updated 02/06/13 Return to Table of Contents
3-20
assist in determining the frequency of test locations. A consistent pavement type and conditions will typically require a pavement core every 2000 to 4000 feet per lane. If pavement conditions or pavement type change, then a section could be identified for a core location. Use the same criteria used to determine analysis sections to identify sections for core locations.
Note (1): If the project involves concrete overlay over asphalt, or if it involves MOT of the shoulders at bridge approaches, GPR and several more cores than usually taken are recommended.
Note (2): Request that a sample of cores be returned. The asphalt cores should be viewed to assess the bond between layers, and to determine if any problematic layers (for example, plant mix seal) are present. The concrete cores should be examined to determine the aggregate type, as that has an impact on the coefficient of thermal expansion. Refer to Coefficient of Thermal Expansion. EGD can assist with aggregate identification.
Step 3. Determine the number of shoulder cores for the resurfacing portion of a project. A pavement core should be taken in the shoulder (inside and outside) at about half the frequency as that of the mainline, when traffic is not expected to use the shoulder. When traffic is expected to use the shoulder, either for MOT and permanently after construction is complete, a pavement core should be taken in the shoulder (inside and outside) at least the same frequency as that of the mainline.
Step 4. Identify any unusual pavement areas and have the pavement structure and materials identified with cores. Examples of unusual pavement areas include the following:
Obvious widening areas of the older narrower mainline pavement
Areas of poor performing patches
Areas of poor condition pavement
Over poor performing joints in composite pavement
Areas exhibiting wet conditions on the surface beyond the typical time for drying after rain/snow
Parking areas / turn lanes / shoulders in projects identified for cross slope adjustment that require the reduction in elevation of the edge of the roadway
Areas of pavement that appear to have material related problems
Step 5. A pavement boring shall be taken in every location in the roadway that currently does not support mainline traffic. These locations include shoulders, gore areas, turn lanes, ramps, and parking lanes. The frequency of the pavement borings will vary depending on the conditions of the pavement, existing site conditions, and project scope. However, for a rule of thumb, a pavement boring should be taken every 1000 to 2000 feet for a consistent appearing pavement structure for a project.
Step 6. Determine the number and location of pavement borings and GPR for Bridge Design projects. Bridge projects typically involve some mainline pavement structure identification, but more important, MOT pavement structure identification. This typically requires numerous test locations in the four shoulders near bridges. The frequency of the pavement borings will vary depending on the conditions of the pavement, existing site conditions, and

Testing & Data Collection
Section 05: Requests for Pavement Field Work
Updated 02/06/13 Return to Table of Contents
3-21
project scope. Obviously, existing conditions will dictate, but as a guideline, the following locations should have soil borings:
Every shoulder (inside and outside) and both side of the bridge approach shoulders shall have a test location within 50 to 75 feet from the bridge.
In the mainline on both the approach and leave side of the bridge within 50 feet of the bridge, each lane may not be necessary
All areas proposed for MOT pavement that currently do not support mainline traffic, every 250 to 500 feet
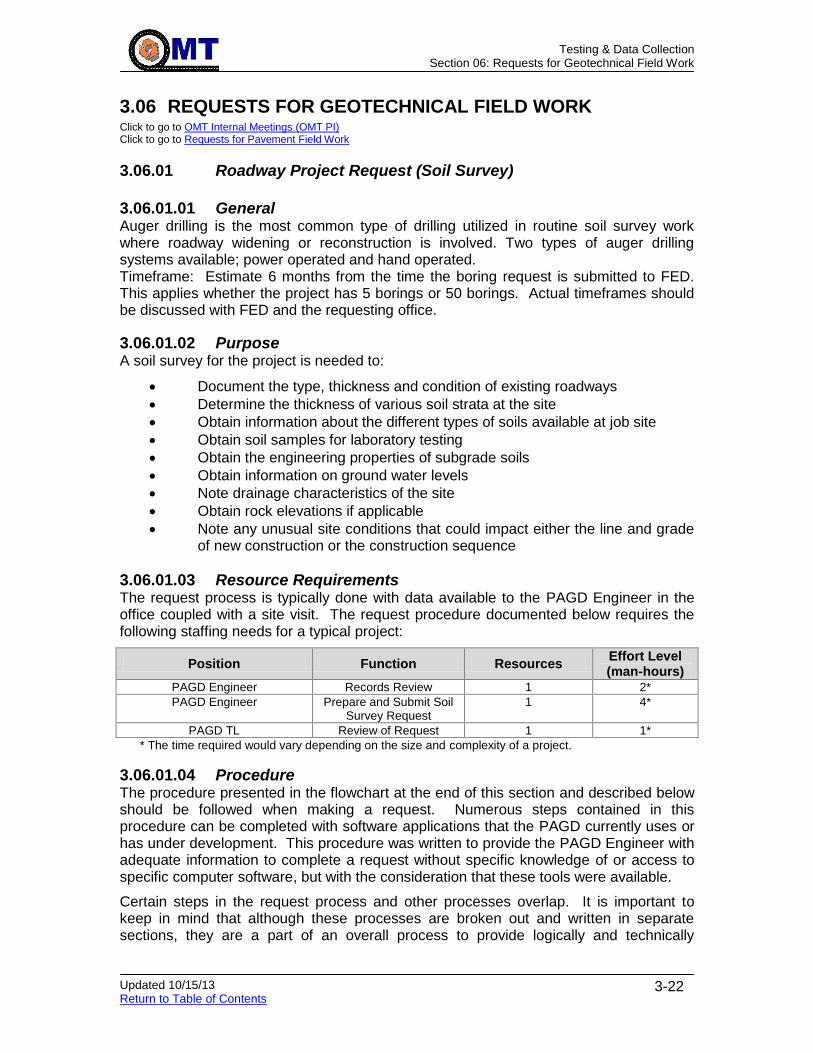
Testing & Data Collection
Section 06: Requests for Geotechnical Field Work
Updated 10/15/13 Return to Table of Contents
3-22
3.06 REQUESTS FOR GEOTECHNICAL FIELD WORK Click to go to OMT Internal Meetings (OMT PI) Click to go to Requests for Pavement Field Work
3.06.01 Roadway Project Request (Soil Survey)
3.06.01.01 General Auger drilling is the most common type of drilling utilized in routine soil survey work where roadway widening or reconstruction is involved. Two types of auger drilling systems available; power operated and hand operated. Timeframe: Estimate 6 months from the time the boring request is submitted to FED. This applies whether the project has 5 borings or 50 borings. Actual timeframes should be discussed with FED and the requesting office.
3.06.01.02 Purpose A soil survey for the project is needed to:
Document the type, thickness and condition of existing roadways
Determine the thickness of various soil strata at the site
Obtain information about the different types of soils available at job site
Obtain soil samples for laboratory testing
Obtain the engineering properties of subgrade soils
Obtain information on ground water levels
Note drainage characteristics of the site
Obtain rock elevations if applicable
Note any unusual site conditions that could impact either the line and grade of new construction or the construction sequence
3.06.01.03 Resource Requirements The request process is typically done with data available to the PAGD Engineer in the office coupled with a site visit. The request procedure documented below requires the following staffing needs for a typical project:
Position Function Resources Effort Level (man-hours)
PAGD Engineer Records Review 1 2*
PAGD Engineer Prepare and Submit Soil Survey Request
1 4*
PAGD TL Review of Request 1 1*
* The time required would vary depending on the size and complexity of a project.
3.06.01.04 Procedure The procedure presented in the flowchart at the end of this section and described below should be followed when making a request. Numerous steps contained in this procedure can be completed with software applications that the PAGD currently uses or has under development. This procedure was written to provide the PAGD Engineer with adequate information to complete a request without specific knowledge of or access to specific computer software, but with the consideration that these tools were available.
Certain steps in the request process and other processes overlap. It is important to keep in mind that although these processes are broken out and written in separate sections, they are a part of an overall process to provide logically and technically

Testing & Data Collection
Section 06: Requests for Geotechnical Field Work
Updated 10/15/13 Return to Table of Contents
3-23
requests. The procedure described below is conducted after receiving a request (memo or e-mail request) from a customer. The following procedures are general guidelines to be followed by the PAGD Engineer. They may be adjusted, based on engineering judgment and discussion with the PAGD TL and the PAGD ADC-Design.
Follow the steps below to complete a roadway project request (soil survey):
3.06.01.04.01 Preliminary Questions and Information Needed
Step 1. Review Preliminary Procedures.
Step 2. Review proposed plans thoroughly and take notes. Identify likely locations where borings will be needed (Refer to Step 14).
Step 3. Review as-built plans to check for unique features. Identify any features that could interfere with the borings.
Step 4. Review the geologic maps and USDA Maps of the area. Identify soil types in area, with corresponding engineering properties.
Step 5. Request cross-sections, typical sections, and profiles for the project.
Step 6. Ask the Project Manager (PM) if SWM facilities are proposed or if SWM borings are needed. If so, follow steps laid out in Stormwater Management Boring Request.
Step 7. Ask the PM if there are any contamination issues (gas stations, junk yards, dry cleaners, etc.). Find out where and what the contamination is. Contact EGD and ask for a contact.
Step 8. Inform the PM that if drilling outside of SHA ROW is necessary, permission to enter the property will be required. The contact names and phone numbers for residential/private business owners affected by drilling should be obtained. If work is being done on or near a Federal Government installation a contact name and number is needed. Inquire if the PM has populated property owner information into the Property Notification System and if the General Notification letters have been sent. If borings are proposed outside SHA ROW, Invasive letters need to be sent by OMT via registered mail to affected property owners only. A 30 day period to allow property owners to respond must be observed.
Step 9. Obtain a copy of the utilities plan located within the project limits if is the location of utilities is not shown on the plans.
Step 10. Perform Site Reconnaissance (Refer to Site Reconnaissance).
Step 11. If the project involves new construction/re-alignment and the proposed traverses wooded areas significantly off of the existing roadway, coordinate with the PM to have the base line staked so that the drillers can accurately locate the borings in the field.
3.06.01.04.02 Prepare Request for Work
Step 12. Print out Construction History for pavement boring/core requests. See Records Review for additional information.
Step 13. Request cores when information is desired concerning existing bound pavement. Cores can provide information about individual layer thickness

Testing & Data Collection
Section 06: Requests for Geotechnical Field Work
Updated 10/15/13 Return to Table of Contents
3-24
and condition, bond between layers, and provide the designer an “undisturbed” sample.
Step 14. Request soil borings (auger borings) when information is desired concerning unbound pavement layers and subgrade below. Borings are not needed for bridge approach projects. Refer to Bridge Approaches.
Step 15. Request a boring stake-out through the PM. Provide the PM with a tabulated list of borings including boring numbers, locations (station, offset, and coordinates). A request for stake-out may also be made directly to the Plats & Survey Division with a cc to the PM and FED. Request that the survey book be sent to PAGD and FED upon completion of the stake-out.
Step 16. If using SWM borings to collect roadway information, request AASHTO classification and moisture content determination by the laboratory.
Step 17. Note whether utilities are in the area, as boring locations may have to be relocated.
Step 18. Locate and draw boring targets on the plans in cut and fill sections. The maximum boring spacing is 500 ft along the centre line for fill areas. Borings in cut areas, as a general rule, should not be placed farther than 300 ft apart along the center line. Borings in no cut no fill areas, as a general rule, should not be placed farther than 500 ft apart along the center line.
Step 19. For projects with slopes (~>5 ft), request at least one auger boring (for slope length of 500 ft) at the toe of the fill slope and one at the top of cut slope. This information can be used in planning the more detailed subsurface explorations (usually SPT). Additional auger borings are commonly requested at approach embankment locations to explore the depth of any suspected unsuitable surface soils or to determine topsoil thickness. For approximate depths refer to Step 19. Consult with EGD.
Step 22. The FED auger drill rigs are set up to drill in 5 ft increments after the first 3 ft (3 ft-8 ft-13 ft-18 ft...depths). This should be considered when assigning boring depths.
Step 23. In shallow fill areas (~<5 ft) the boring should extend to a minimum depth of 10 ft below bottom of fill (Figure 1).
Top of proposed roadway
3 ft of fill
10 ft below bottom of fill
Figure 1: Boring Depth in Fill Areas
13 ft Profile ground line

Testing & Data Collection
Section 06: Requests for Geotechnical Field Work
Updated 10/15/13 Return to Table of Contents
3-25
Step 24. In shallow cut areas (~<5 ft) the boring should extend 10 ft below the depth of the finished roadway (Figure 2). A SPT boring may be required if structures or buildings are present or will be located at the top of the proposed cut slope. Consult EGD if this is the case.
Step 25. In no cut no fill areas the boring should extend 8 ft below the depth of the proposed roadway.
Step 26. Contact the EGD if it is anticipated that borings will be drilled through rock.
Step 27. Request bulk (bag) samples representative of each soil type and stratum, to be collected for soil classification testing and moisture can samples for water content determination.
Step 28. Request topography tabulation and top soil samples for the project. MSMT Frequency Guide-Small Quantity Exceptions states that when 30 cubic yards or less of topsoil will be used, it can be approved without testing unless it will be used for turf grass establishment and/or turf grass sod establishment in residential or commercial areas or at SHA facilities. If this is the case, topography tabulation and topsoil sampling may not be necessary.
Step 29. Request water samples for any streams or ponds within the project limits if necessary.
Step 30. Request additional bulk (bag) samples to be collected for Resilient Modulus and Proctor testing representing all soil types regardless of cut or fill.
Step 31. Request environmental soil samples to be collected in areas without vegetation.
3.06.01.04.03 Prepare and Submit Request Forms
Step 32. Prepare form PAGD – Soil Survey Request and form PAGD - Soil Survey Notes. See Forms, Spreadsheets & Guidelines for examples of soil survey request and soil survey notes. The Soil Survey Notes form is for reference only and should be revised to the project in consideration.
Proposed roadway
10 ft below proposed roadway
5 ft cut
Figure 2: Borings Depth in Cut Areas

Testing & Data Collection
Section 06: Requests for Geotechnical Field Work
Updated 10/15/13 Return to Table of Contents
3-26
Step 33. Attempt to include requests for soil survey, SWM borings and foundation borings in the same request package, if possible.
Step 34. Submit completed form PAGD – Soil Survey Request and form PAGD - Soil Survey Notes to PAGD TL for review.
Step 35. If approved by PAGD TL, submit two copies of form PAGD – Soil Survey Request and form PAGD - Soil Survey Notes to PAGD TL for review. Provide two copies of the request letter (From OHD, OOS, District, etc.) and two copies of the plan sheets (with cross-sections, if available) to FED.
3.06.02 Stormwater Management Boring Request Click to go to Requests For Geotechnical Field work Click to go to Stormwater Management
3.06.02.01 General Stormwater Management (SWM) borings are requested by the Project Manager (PM). Requests may originate from OHD, District, and/or Consultant. A copy of the request with boring locations marked on the plan sheets is generally supplied by the PM to OMT. Auger boring/drilling is the most common type of drilling utilized in normal soil survey request for SWM facilities. In some cases Standard Penetration Tests (SPT) may be requested by the Project Manager for Headwalls, Dams, Risers, and Pipes. Timeframe: Estimate 6 months from the time the boring request is submitted to FED. This applies whether the project has 5 borings or 50 borings. Actual timeframes should be discussed with FED and the requesting office.
3.06.02.02 Purpose Information on SWM facilities is needed to:
Determine thickness of soil stratum
Obtain information about different types of soils available at job site
Obtain information on ground water levels
Obtain rock elevations if present
Obtain soil samples for laboratory testing.
Note any unusual observations that could impact the type and placement of SWM facilities
Determine infiltration rates for in-situ soils
Note drainage characteristics
3.06.02.03 Resource Requirements The request procedure is typically completed based on the data available to the PAGD Engineer in the office coupled with a site visit. The request procedure documented below requires the following staffing needs for a typical project:
Position Function Resources Effort Level (man-hours)
PAGD Engineer Records Review 1 2*
PAGD Engineer Prepare and Submit SWM Request
1 4*
PAGD TL Review of Request 1 1*
* The time required would vary depending on the size and complexity of a project.

Testing & Data Collection
Section 06: Requests for Geotechnical Field Work
Updated 10/15/13 Return to Table of Contents
3-27
3.06.02.04 Procedure The procedure presented in the attached flowchart and described below should be followed when making a request. Numerous steps contained in this procedure can also be completed with several software applications that the PAGD currently uses or has under development. The following procedure was written to provide the design engineer with adequate information to complete a SWM boring request without specific knowledge or access to computer software applications, but with the consideration that these tools were available.
Certain steps in the request process and other processes overlap. It is important to consider that although these processes are broken out and written in separate sections, they are a part of an overall process to provide logically and technically requests. The procedure described below is conducted after receiving a request (memo or e-mail request) from a customer. The following procedures are general guidelines to be followed by the PAGD Engineer. They may be adjusted, based on engineering judgment and discussion with the PAGD TL and the PAGD ADC-Design.
Follow the steps below to complete a SWM boring Request:
Preliminary Questions and Information Needed
Step 1. Review Preliminary Procedures.
Step 2. SWM boring locations are generally determined by the OHD, District and/or Consultant. Review the proposed SWM boring locations. In general, the SWM sites should be at least twelve ft away from the roadway and a hundred ft away from the proximity to wells/septic systems. For additional information on location and permitting factors refer to the following site: http://www.mde.maryland.gov/programs/Water/StormwaterManagementProgram/MarylandStormwaterDesignManual/Documents/www.mde.state.md.us/assets/document/chapter4.pdf. If proposed borings and the SWM facility are with the distances described above, the borings and the SWM facility may have to be relocated. Discuss potential relocations with the PAGD TL, PAGD ADC-Design and the customer.
Step 3. Review as-built plans to check for unique features. Identify any features that could interfere with drilling the borings at proposed locations.
Step 4. Review the Geologic Maps and USDA Maps of the area. Identify soil types in area, with corresponding engineering properties.
Step 5. Request cross-sections and a PI set of plans including typical sections and profiles for the project.
Step 6. Ask the PM if there is any other field work in addition to SWM borings. Depending on the type of request, follow procedures in Roadway Project Request (Soil Survey) or Standard Penetration Test (SPT) Boring Request.
Step 7. Ask the PM if there are any contamination issues (gas stations, junk yards, dry cleaners, etc.). Find out where and what the contamination is. Contact the EGD and ask for a contact.
Step 8. Inform the PM that if drilling outside of SHA ROW is necessary, property entry permission will be required. The contact names and phone numbers for residential/private business owners should be obtained. If work is being done on or near a Federal Government installation a contact name and number is
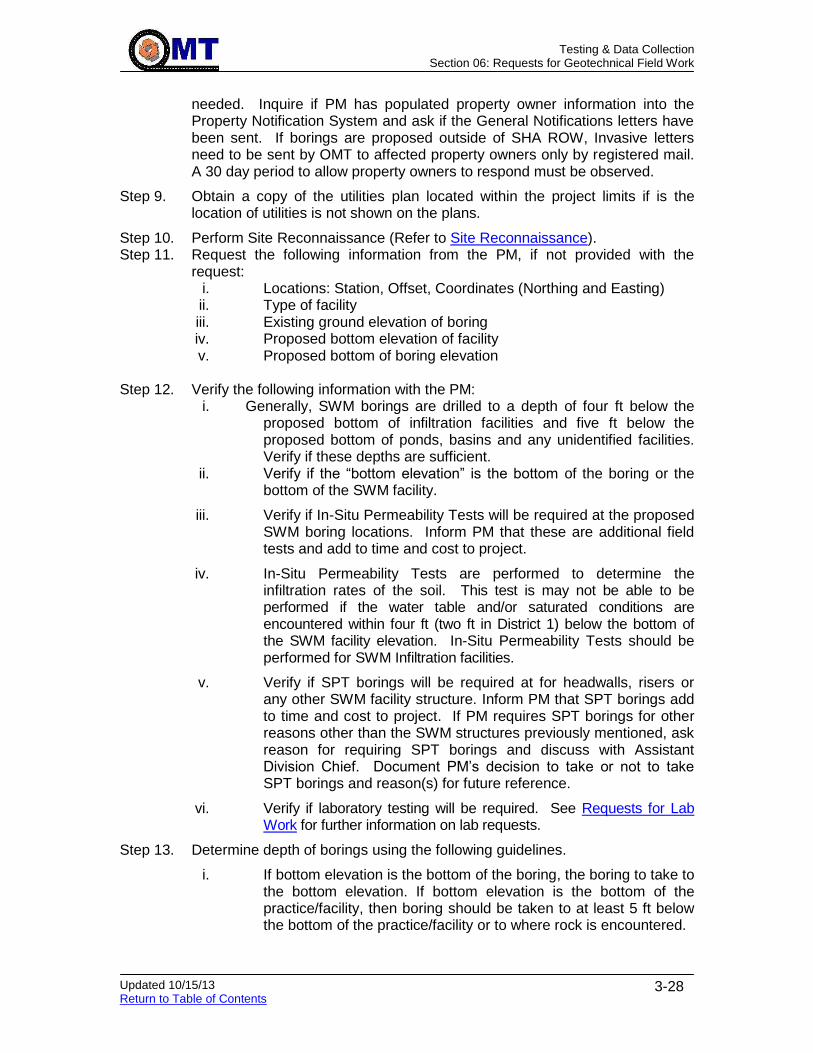
Testing & Data Collection
Section 06: Requests for Geotechnical Field Work
Updated 10/15/13 Return to Table of Contents
3-28
needed. Inquire if PM has populated property owner information into the Property Notification System and ask if the General Notifications letters have been sent. If borings are proposed outside of SHA ROW, Invasive letters need to be sent by OMT to affected property owners only by registered mail. A 30 day period to allow property owners to respond must be observed.
Step 9. Obtain a copy of the utilities plan located within the project limits if is the location of utilities is not shown on the plans.
Step 10. Perform Site Reconnaissance (Refer to Site Reconnaissance). Step 11. Request the following information from the PM, if not provided with the
request: i. Locations: Station, Offset, Coordinates (Northing and Easting) ii. Type of facility iii. Existing ground elevation of boring iv. Proposed bottom elevation of facility v. Proposed bottom of boring elevation
Step 12. Verify the following information with the PM:
i. Generally, SWM borings are drilled to a depth of four ft below the proposed bottom of infiltration facilities and five ft below the proposed bottom of ponds, basins and any unidentified facilities. Verify if these depths are sufficient.
ii. Verify if the “bottom elevation” is the bottom of the boring or the bottom of the SWM facility.
iii. Verify if In-Situ Permeability Tests will be required at the proposed SWM boring locations. Inform PM that these are additional field tests and add to time and cost to project.
iv. In-Situ Permeability Tests are performed to determine the infiltration rates of the soil. This test is may not be able to be performed if the water table and/or saturated conditions are encountered within four ft (two ft in District 1) below the bottom of the SWM facility elevation. In-Situ Permeability Tests should be performed for SWM Infiltration facilities.
v. Verify if SPT borings will be required at for headwalls, risers or any other SWM facility structure. Inform PM that SPT borings add to time and cost to project. If PM requires SPT borings for other reasons other than the SWM structures previously mentioned, ask reason for requiring SPT borings and discuss with Assistant Division Chief. Document PM’s decision to take or not to take SPT borings and reason(s) for future reference.
vi. Verify if laboratory testing will be required. See Requests for Lab Work for further information on lab requests.
Step 13. Determine depth of borings using the following guidelines.
i. If bottom elevation is the bottom of the boring, the boring to take to the bottom elevation. If bottom elevation is the bottom of the practice/facility, then boring should be taken to at least 5 ft below the bottom of the practice/facility or to where rock is encountered.
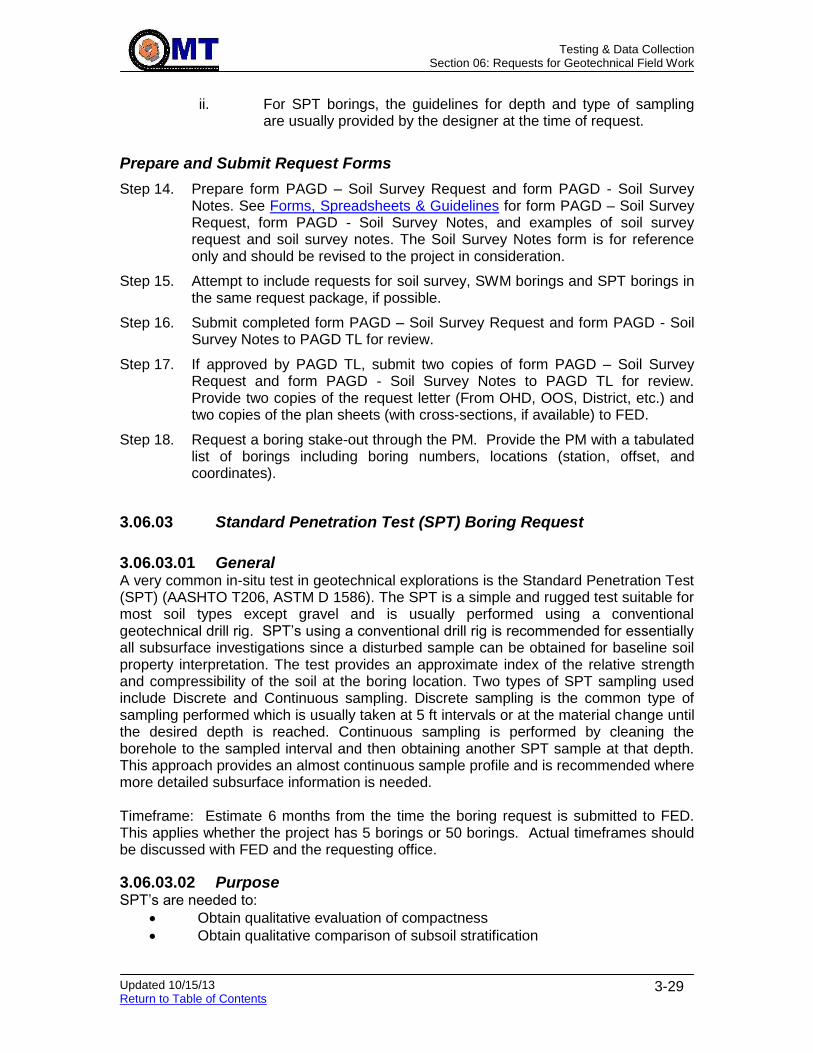
Testing & Data Collection
Section 06: Requests for Geotechnical Field Work
Updated 10/15/13 Return to Table of Contents
3-29
ii. For SPT borings, the guidelines for depth and type of sampling are usually provided by the designer at the time of request.
Prepare and Submit Request Forms
Step 14. Prepare form PAGD – Soil Survey Request and form PAGD - Soil Survey Notes. See Forms, Spreadsheets & Guidelines for form PAGD – Soil Survey Request, form PAGD - Soil Survey Notes, and examples of soil survey request and soil survey notes. The Soil Survey Notes form is for reference only and should be revised to the project in consideration.
Step 15. Attempt to include requests for soil survey, SWM borings and SPT borings in the same request package, if possible.
Step 16. Submit completed form PAGD – Soil Survey Request and form PAGD - Soil Survey Notes to PAGD TL for review.
Step 17. If approved by PAGD TL, submit two copies of form PAGD – Soil Survey Request and form PAGD - Soil Survey Notes to PAGD TL for review. Provide two copies of the request letter (From OHD, OOS, District, etc.) and two copies of the plan sheets (with cross-sections, if available) to FED.
Step 18. Request a boring stake-out through the PM. Provide the PM with a tabulated list of borings including boring numbers, locations (station, offset, and coordinates).
3.06.03 Standard Penetration Test (SPT) Boring Request
3.06.03.01 General A very common in-situ test in geotechnical explorations is the Standard Penetration Test (SPT) (AASHTO T206, ASTM D 1586). The SPT is a simple and rugged test suitable for most soil types except gravel and is usually performed using a conventional geotechnical drill rig. SPT’s using a conventional drill rig is recommended for essentially all subsurface investigations since a disturbed sample can be obtained for baseline soil property interpretation. The test provides an approximate index of the relative strength and compressibility of the soil at the boring location. Two types of SPT sampling used include Discrete and Continuous sampling. Discrete sampling is the common type of sampling performed which is usually taken at 5 ft intervals or at the material change until the desired depth is reached. Continuous sampling is performed by cleaning the borehole to the sampled interval and then obtaining another SPT sample at that depth. This approach provides an almost continuous sample profile and is recommended where more detailed subsurface information is needed. Timeframe: Estimate 6 months from the time the boring request is submitted to FED. This applies whether the project has 5 borings or 50 borings. Actual timeframes should be discussed with FED and the requesting office.
3.06.03.02 Purpose SPT’s are needed to:
Obtain qualitative evaluation of compactness
Obtain qualitative comparison of subsoil stratification

Testing & Data Collection
Section 06: Requests for Geotechnical Field Work
Updated 10/15/13 Return to Table of Contents
3-30
Obtain the mechanical properties of sub soils
Determine the soil strength and resistance to settlement
Estimate the friction angle for cohesionless soils
Obtain relative densities of sand and gravel
Obtain compressive and shear strengths of silts and clays (from undisturbed sampling and lab testing)
Obtain disturbed (jar) samples for lab testing
Figure 3. below depicts the general process of traditional SPT drilling, sampling and laboratory testing of collected samples.
3.06.03.03 Resource Requirements The request process is typically done with data available to the PAGD Engineer in the office coupled with a site visit. It is anticipated, that a PAGD Engineer and an EGD Representative will work closely in preparing SPT requests. The request procedure documented below requires the following staffing needs for a typical project:
Position Function Resources Effort Level (man-hours)
PAGD Engineer and EGD Representative
Records Review 2 2*
PAGD Engineer and EGD Representative
Prepare and Submit SPT Request
2 4*
PAGD TL Review of Request 1 1*
* The time required would vary depending on the size and complexity of a project.

Testing & Data Collection
Section 06: Requests for Geotechnical Field Work
Updated 10/15/13 Return to Table of Contents
3-31
Figure 3. Traditional drilling, sampling, and laboratory testing of collected samples
(Courtesy- FHWA-IF-02-034, Geotechnical Engineering Circular No. 5, Evaluation of Soil and Rock Properties)
3.06.03.04 Procedure The procedure presented in the attached flowchart and described below should be followed when making a request for SPT borings.
Certain steps in the request process and other processes overlap. It is important to keep in mind that although these processes are broken out and written in separate sections, they are a part of an overall process to provide logically and technically requests. The procedure described below is conducted after receiving a request (memo or e-mail request) from a customer. The following procedures are general guidelines to be followed by the PAGD Engineer in collaboration with an EGD representative. They may be adjusted, based on engineering judgment and discussion with the PAGD TL, the PAGD ADC-Design and/or EGD Contact.
Follow the steps below to complete a SPT Request.

Testing & Data Collection
Section 06: Requests for Geotechnical Field Work
Updated 10/15/13 Return to Table of Contents
3-32
3.06.03.04.01 Preliminary Questions and Information Needed
Step 1. Review Preliminary Procedures.
Step 2. Review proposed plans thoroughly and take notes. Identify likely locations (bridges, culverts, pipes, high embankments, high cut slopes, retaining walls, approach embankments etc.,) where borings will be needed. SPT borings for bridge structure elements, retaining walls, culverts, headwalls and noise walls are requested by OOS designer or by the Project Manager (PM). Verify if SPT borings are required for embankments, cut slopes, pipes, etc.
Step 3. Review as-built plans to check for unique features. Identify any features that could interfere with the borings.
Step 4. Review the geologic maps and USDA Maps of the area. Identify soil types in area, with corresponding engineering properties.
Step 5. Request cross-sections, typical sections, and profiles for the project.
Step 6. Ask the PM if there is any other field work in addition to SPT borings. Depending on the type of request, follow procedures in Roadway Project Request (Soil Survey) or Stormwater Management Boring Request.
Step 7. Ask the PM if there are any contamination issues (gas stations, junk yards, dry cleaners, etc.). Find out where and what the contamination is. Discuss with EGD and ask for a contact.
Step 8. Inform the PM that if drilling outside of SHA ROW is necessary, property entry permission will be required. The contact names and phone numbers for residential/private business owners affected by drilling should be obtained. If work is being done on or near a Federal Government installation a contact name and number is needed. Inquire if PM has populated property owner information into the Property Notification System and ask if the General Notifications letters have been sent. If borings are proposed outside of SHA ROW, Invasive letters need to be sent by OMT to affected property owners only by registered mail. A 30 day period to allow property owners to respond must be observed.
Step 9. Obtain a copy of the utilities plan located within the project limits if is the location of utilities is not shown on the plans.
Step 10. Perform Site Reconnaissance (Refer to Site Reconnaissance).
3.06.03.04.02 Prepare Request for Work
Step 11. Boring Depth criteria: The SPT boring depth is generally based on the stress induced in the underlying soils from embankments or structure foundations. These stresses are dependent on type of foundation, dimensions and weight of the embankment/slope and the foundation, weight of structure, loading type (earth pressure, dead weight, transient loads etc), mode of failure example shear failure, pullout etc. Depth criteria for SPT borings for structures should be provided by the OOS designer. Under no circumstances should the following typical minimum depths or terminal N values be specified for structures without approval from the OOS designer. Depth criteria for SPT borings for embankments/fill slopes and for cut slopes should be determined by the PAGD Engineer and the EGD Representative
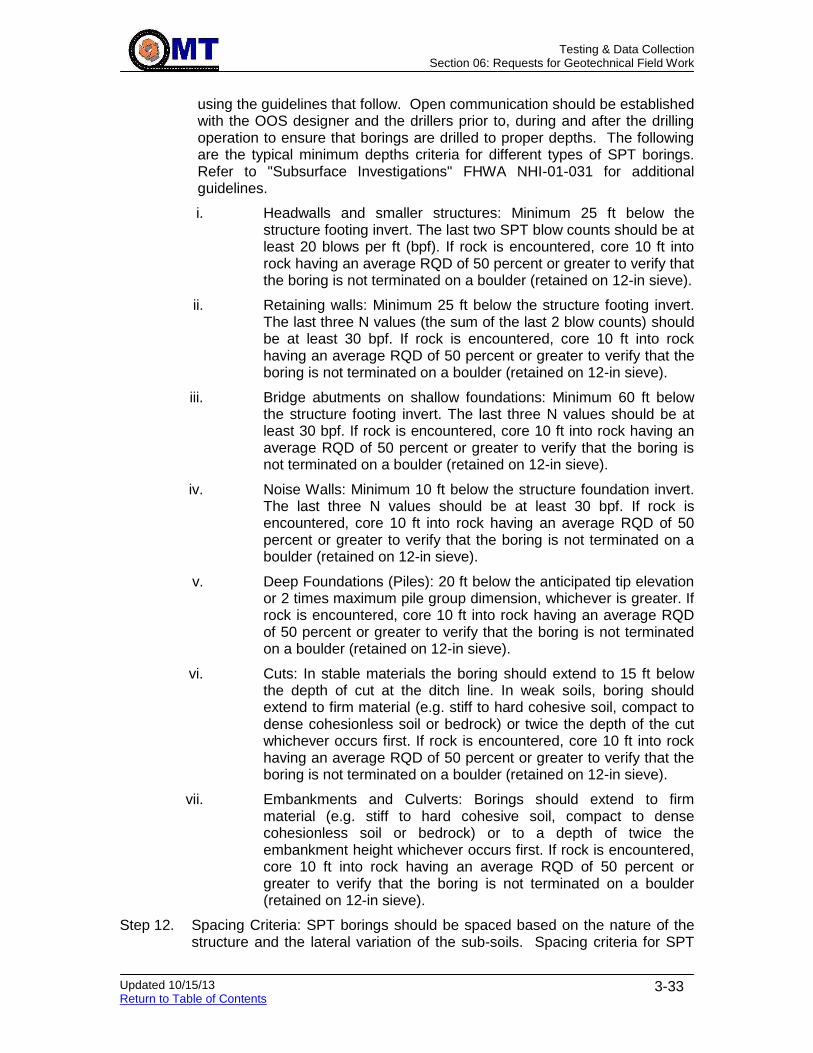
Testing & Data Collection
Section 06: Requests for Geotechnical Field Work
Updated 10/15/13 Return to Table of Contents
3-33
using the guidelines that follow. Open communication should be established with the OOS designer and the drillers prior to, during and after the drilling operation to ensure that borings are drilled to proper depths. The following are the typical minimum depths criteria for different types of SPT borings. Refer to "Subsurface Investigations" FHWA NHI-01-031 for additional guidelines.
i. Headwalls and smaller structures: Minimum 25 ft below the structure footing invert. The last two SPT blow counts should be at least 20 blows per ft (bpf). If rock is encountered, core 10 ft into rock having an average RQD of 50 percent or greater to verify that the boring is not terminated on a boulder (retained on 12-in sieve).
ii. Retaining walls: Minimum 25 ft below the structure footing invert. The last three N values (the sum of the last 2 blow counts) should be at least 30 bpf. If rock is encountered, core 10 ft into rock having an average RQD of 50 percent or greater to verify that the boring is not terminated on a boulder (retained on 12-in sieve).
iii. Bridge abutments on shallow foundations: Minimum 60 ft below the structure footing invert. The last three N values should be at least 30 bpf. If rock is encountered, core 10 ft into rock having an average RQD of 50 percent or greater to verify that the boring is not terminated on a boulder (retained on 12-in sieve).
iv. Noise Walls: Minimum 10 ft below the structure foundation invert. The last three N values should be at least 30 bpf. If rock is encountered, core 10 ft into rock having an average RQD of 50 percent or greater to verify that the boring is not terminated on a boulder (retained on 12-in sieve).
v. Deep Foundations (Piles): 20 ft below the anticipated tip elevation or 2 times maximum pile group dimension, whichever is greater. If rock is encountered, core 10 ft into rock having an average RQD of 50 percent or greater to verify that the boring is not terminated on a boulder (retained on 12-in sieve).
vi. Cuts: In stable materials the boring should extend to 15 ft below the depth of cut at the ditch line. In weak soils, boring should extend to firm material (e.g. stiff to hard cohesive soil, compact to dense cohesionless soil or bedrock) or twice the depth of the cut whichever occurs first. If rock is encountered, core 10 ft into rock having an average RQD of 50 percent or greater to verify that the boring is not terminated on a boulder (retained on 12-in sieve).
vii. Embankments and Culverts: Borings should extend to firm material (e.g. stiff to hard cohesive soil, compact to dense cohesionless soil or bedrock) or to a depth of twice the embankment height whichever occurs first. If rock is encountered, core 10 ft into rock having an average RQD of 50 percent or greater to verify that the boring is not terminated on a boulder (retained on 12-in sieve).
Step 12. Spacing Criteria: SPT borings should be spaced based on the nature of the structure and the lateral variation of the sub-soils. Spacing criteria for SPT

Testing & Data Collection
Section 06: Requests for Geotechnical Field Work
Updated 10/15/13 Return to Table of Contents
3-34
borings for structures should be provided by the OOS designer. Under no circumstances should the following typical boring spacing be specified for structures without approval from the OOS designer. Spacing criteria for SPT borings for embankments/fill slopes and for cut slopes should be determined by the PAGD Engineer and the EGD Representative using the guidelines that follow. Open communication should be established with the OOS designer and drillers prior to, during and after the drilling operation to ensure that the number and spacing of borings is sufficient. The following are the typical spacing criteria based on OMT experience and past OOS requests. Refer to "Subsurface Investigations" FHWA NHI-01-031 for additional guidelines.
Step 13. Retaining walls: Minimum 75 ft spacing between the borings. Borings should be located in front and behind the wall face.
Step 14. Noise walls: Minimum 150 ft spacing between the borings. If two adjacent borings does not show consistency in the material and blow counts, a boring should be taken in between the 150 ft spaced out borings.
Step 15. Bridges: Borings are typically taken at either side of the piers and abutments. For piers or abutments over 100 ft wide, provide a minimum of two borings. For piers or abutments less than 100 ft wide, provide a minimum of one boring. Additional borings may be required in areas of erratic subsurface conditions.
Step 16. Bridge Approach Embankments over Soft Ground: When approach embankments are to be placed over soft ground, at least one boring should be made at each embankment to determine the problems associated with stability and settlement of the embankment.
Step 17. Embankments/Fill Slopes and Cut Slopes: Borings are typically spaced every 200 ft (erratic conditions) to 400 ft (uniform conditions) with at least one boring taken in each separate landform. For high cuts and fills, a minimum of 3 borings should be performed along a line perpendicular to centerline or planned slope face to establish the subsurface profile for analysis.
Step 18. Headwalls and Culverts: A minimum of one boring at each headwall of major culverts is required. Additional borings should be provided for long culverts or in areas of erratic subsurface conditions.
Step 19. Undisturbed Samples should be requested for testing in laboratory to obtain soil properties (shear strength, cohesion, compressibility index, etc.,) of soils. Soil properties are required for slope stability analysis, computing bearing capacities and magnitude and time rate of settlements.
Step 20. Type of Sampling: Discrete Sampling (5 ft intervals) and Continuous Sampling. For bridge piers, abutments, headwalls, and culverts, continuous sampling (typically performed 15 to 20 ft below bottom of proposed structure foundation) is preferred for where detailed soil information is required followed by discrete sampling thereafter. As necessary, undisturbed samples should be requested at select locations and in cohesive material. Note that undisturbed samples are relatively costly to obtain and should only be requested when and if necessary.
Step 21. SPT boring request for Structures require: Station, Offset, and Northing and Easting and Elevation.

Testing & Data Collection
Section 06: Requests for Geotechnical Field Work
Updated 10/15/13 Return to Table of Contents
3-35
3.06.03.04.03 Prepare and Submit Request Forms
Step 22. Prepare form PAGD – SPT Boring Request and PAGD - SPT Boring Criteria. See Forms, Spreadsheets & Guidelines for examples of the SPT Boring Request, and SPT Boring Criteria. The SPT Boring Criteria is for reference only and should be revised to the project in consideration.
Step 23. Attempt to include requests for soil survey, SWM borings and SPT borings in the same request package, if possible.
Step 24. Submit completed form PAGD – SPT Boring Request and PAGD - SPT Boring Criteria to PAGD TL and EGD for review.
Step 25. If approved by PAGD TL, submit two copies of form PAGD – SPT Boring Request and PAGD - SPT Boring Criteria to FED. In addition, provide two copies of the request letter (From OHD, OOS, District, etc.) and two copies of the plan sheets (with cross-sections, if available) to FED.
Step 26. Request a boring stake-out through the PM. Provide the PM with a table of borings including boring numbers, locations (station and offset, coordinates). A request for stake-out may also be made directly to the Plats & Survey Division with a cc to the PM and FED. Request that the survey book be sent to PAGD and FED upon completion of the stake-out. Note that SPT borings requested by OOS generally already have a stake-out requested by cc on OOS’s boring request. Therefore, an additional request for a stake-out of SPT borings for embankments/fill or cut slopes may be required.
3.06.04 In-Situ Testing
3.06.04.01 General For certain projects, in-situ testing may be required to determine in-situ engineering properties of sub-soils at the site. The EGD should always be contacted for in-situ testing. The EGD would be responsible for developing an in-situ testing program and corresponding request, if necessary. The following paragraphs contain general definitions and information on in-situ testing. There are various in-situ testing methods that may used to measure soil properties and/or behaviors in addition to the Standard Penetration Test (SPT). The most commonly performed in-situ methods on MDSHA design projects are:
Cone Penetration Test (CPT)
Flat Dilatometer Test (DMT)
Pressuremeter Test (PMT)
Monitoring Wells (groundwater monitoring instrumentation)
Plate Load Tests
Geophysical Investigation: Ground Penetrating Radar, Electrical Resistivity, Seismic Survey, etc.
Cone Penetration Test (CPT): A CPT device consists of a cylindrical probe with a cone-shaped tip with different sensors that allow a real time continuous measurement of soil strength and characteristics by pushing it into the ground at a speed of 2 cm/s. The typical CPT probe measures the stress on the tip, the sleeve friction and the pore water pressure. Some of them are equipped with a geophone in order to be able to

Testing & Data Collection
Section 06: Requests for Geotechnical Field Work
Updated 10/15/13 Return to Table of Contents
3-36
perform shear wave velocity measurements. Relationships exist which correlate subsurface resistance data collected with this instrument to: soil description; relative density for granular soils; and undrained shear strength (SU) for fine grained soils. Because this probe is advanced slowly, under so called quasi-static loading, estimation of SU made to using CPT data is preferable to estimation of qu from the Standard Penetration Test where the sampler is advanced under dynamic loading and unknown damping forces may influence the data in soils with low permeability. Flat Dilatometer Test (DMT): The dilatometer test consists of inserting a hardened steel blade into the ground. A circular steel membrane is located on one side of the blade. A cone penetration truck or drill rig is used to advance the blade at a constant rate of 2 cm/sec. The shape and dimension of the dilatometer blade have been designed to minimize the induced strain (and hence disturbance) to the soil during insertion. At selected intervals (typically 8 inches) the steel membrane is expanded laterally into the soil. The pressures required to expand the membrane provide a direct measurement of the soil modulus (stiffness). In addition to the modulus, other geotechnical engineering parameters that may be evaluated from dilatometer testing include undrained shear strength, friction angle, over consolidation ratio, and permeability. Shallow and deep foundation design can then be performed using the derived geotechnical data. A main benefit of the dilatometer is that it directly measures the soil modulus (stiffness). This parameter controls foundation design since almost all foundations are designed based on their potential for settlement and not bearing capacity (i.e. failure). Predicting settlements of shallow foundations is perhaps the primary application of the dilatometer test, especially in sandy soils and soft clay soils. An advantage of the dilatometer is that it can be used to obtain in-place data at short, equally spaced depth intervals, thereby providing a profile of the subsurface. Moreover, since pre-drilling is not required, profile data can be obtained relatively quickly. Pressuremeter Test (PMT): Pressuremeter Tests are used to measure the in-situ deformation (compressibility) and strength properties of a wide variety of soil types, weathered rock and low to moderate strength intact rock. Monitoring Wells: Monitoring wells are installed to monitor groundwater elevations and conditions over an established period of time. This is necessary to evaluate potential groundwater impacts on design, during construction and also for evaluating the performance of dewatering systems. Plate Load Tests: A traditional in-situ method for estimating the bearing capacity of foundations on soil, and for obtaining the soil modulus for the purpose of estimating the settlement of foundations on soil or rock. Courtesy: http://www.dot.ca.gov/hq/esc/construction/manuals/TrenchingandShoring/appendix_B.pdf
3.06.05 Geophysical Testing:
Geophysical Testing may be used to establish ground stratigraphy; identifying any voids or void-forming conditions in the underlying fine-grained soils, detecting sudden changes in subsurface formations, locating underground cavities in karst formations, identifying underground utilities and/or obstructions. Geophysical Testing is generally used in conjunction with SPT borings to supplement the conventional subsurface exploration program.

Testing & Data Collection
Section 07: Requests for Lab Work
Updated 10/15/2013 Return to Table of Contents
3-37
3.07 REQUESTS FOR LAB WORK Click to go to OMT Internal Meetings (OMT PI) Click to go to Requests For Geotechnical Field work
3.07.01 LABORATORY TESTING
3.07.01.01 General Laboratory testing of soils is a fundamental step in the process of providing geotechnical engineering recommendations. Laboratory testing is generally performed on soil samples collected during the subsurface investigation to evaluate the engineering properties of the soils for use in the design and analysis of the foundations, slopes, embankments, pavements, and other structures, and to aid in providing recommendations for construction considerations. Planning for laboratory testing begins during the planning of the subsurface investigation, so that adequate samples are collected for testing. The complexity of testing required for a particular project may range from simple moisture content determinations to specialized testing such as evaluating the strength and stiffness characteristics of soil. Since some testing can be expensive and time consuming, the design needs of the project should be reviewed prior to planning the laboratory-testing program. Specifying unnecessary laboratory tests will add time and cost to the project and use samples which could be used for needed tests. Chapters 7 through 10 of the “Subsurface Investigations" FHWA NHI-01-031 provide an overview of testing. Timeframe: Estimate 6 weeks from the time the borings are completed and the samples are submitted to the lab to the time lab results are obtained. This applies whether the project has 5 tests or 50 tests. SATD or their consultant conducts routine lab testing (classification, proctors, moisture content, grain size, pH and organic content). Generally, samples are delivered to SATD within a week after drilling is completed.
3.07.01.02 Purpose The purpose of laboratory testing is to evaluate the engineering properties of the soils for use in the design and analysis of the foundations, slopes, embankments, pavements, and other structures, and to aid in providing recommendations for construction considerations. Depending on the complexity of the project, the following types of laboratory tests are generally performed:
Routine Laboratory Tests:
Classification (AASHTO, USCS, USDA, etc.), compaction, and index tests 1) Natural Moisture Content 2) Natural Density 3) Atterberg Limits 4) Moisture-Density Relationship (Proctor Tests) 5) Grain Size Distribution (Sieve and Hydrometer Analyses) 6) Organic Content
Resilient Modulus
Special Laboratory Tests:
Strength tests 1) Unconfined Compression Test

Testing & Data Collection
Section 07: Requests for Lab Work
Updated 10/15/2013 Return to Table of Contents
3-38
2) Direct Shear 3) Triaxial Test
Consolidation Tests
Corrosivity Tests
Permeability Tests
CBR Tests
3.07.01.03 Resource Requirements The testing request is typically processed with data available to the PAGD Engineer in the office coupled with soil boring information obtained from the drilling program. It is anticipated, that a PAGD Engineer and an EGD Representative will work closely in preparing lab testing requests, particularly if specialized lab testing is required. The request procedure documented below requires the following staffing needs for a typical project:
Position Function Resources Effort Level (man-hours)
PAGD Engineer and EGD Representative
Review soils from bags or jars
2 2*
PAGD Engineer and EGD Representative
Prepare and Submit Lab Request and follow up
2 4*
PAGD TL Review of Request 1 1*
* The time required would vary depending on the size and complexity of a project.
3.07.01.04 Procedure The procedures presented in the attached flowchart and described in the following text should be followed when requesting laboratory tests. Certain steps in the request process and other processes overlap. The procedure described below is followed after receiving a request from a customer. This request can be completed via a memo request, e-mail request. The following procedures are general guidelines to be followed by the PAGD Engineer. They may be adjusted, based on engineering judgment and discussion with the PAGD TL and the PAGD ADC-Design. Step 1. Plan the locations, depths, and type (bulk or bag samples, jar samples,
undisturbed samples) of samples needed for testing during the subsurface investigation planning stage. Bulk or bag samples representative of each soil type and stratum should have been obtained during the drilling operation. Undisturbed samples should have been obtained at select locations and in cohesive material.
Step 2. Review the draft boring logs and verify where (depths) the samples were
obtained for further lab testing. Select representative samples for testing. Step 3. Undisturbed samples retrieved from borings are submitted to the lab by the
drillers. The undisturbed samples must be stored in a moisture controlled room until they are extruded for testing. Undisturbed samples should be tested as soon as possible, but no later than 1 month from the time of sampling.
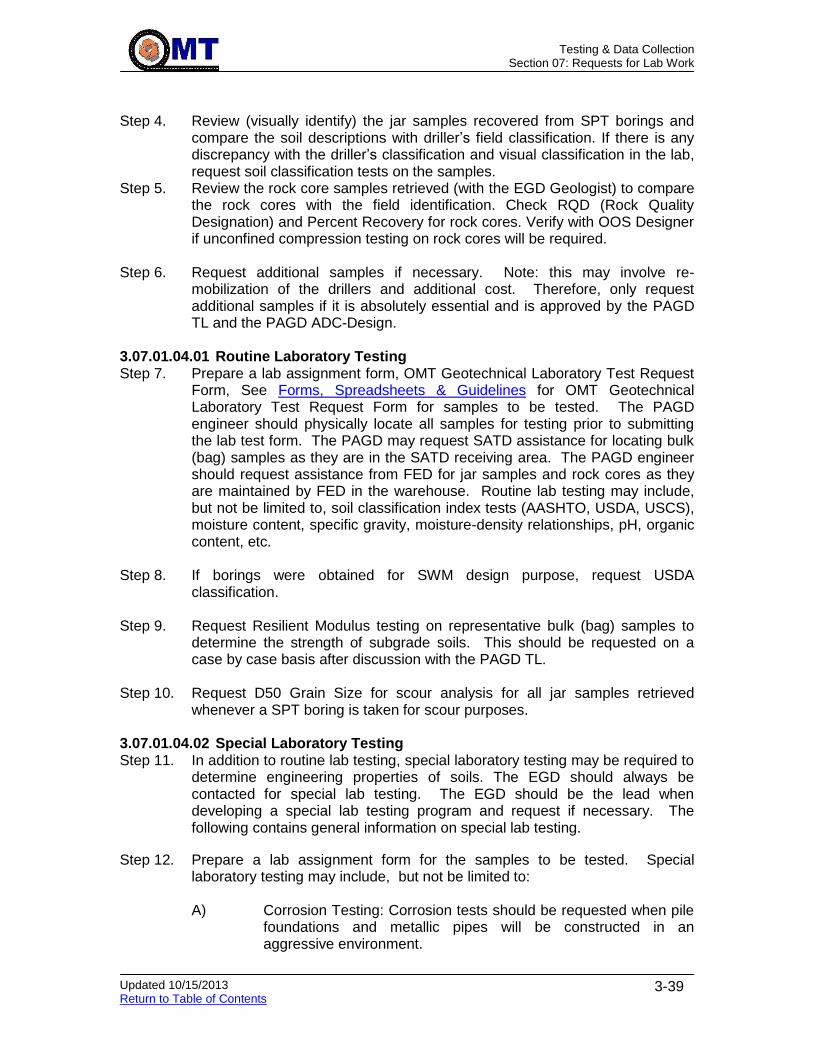
Testing & Data Collection
Section 07: Requests for Lab Work
Updated 10/15/2013 Return to Table of Contents
3-39
Step 4. Review (visually identify) the jar samples recovered from SPT borings and
compare the soil descriptions with driller’s field classification. If there is any discrepancy with the driller’s classification and visual classification in the lab, request soil classification tests on the samples.
Step 5. Review the rock core samples retrieved (with the EGD Geologist) to compare the rock cores with the field identification. Check RQD (Rock Quality Designation) and Percent Recovery for rock cores. Verify with OOS Designer if unconfined compression testing on rock cores will be required.
Step 6. Request additional samples if necessary. Note: this may involve re-
mobilization of the drillers and additional cost. Therefore, only request additional samples if it is absolutely essential and is approved by the PAGD TL and the PAGD ADC-Design.
3.07.01.04.01 Routine Laboratory Testing Step 7. Prepare a lab assignment form, OMT Geotechnical Laboratory Test Request
Form, See Forms, Spreadsheets & Guidelines for OMT Geotechnical Laboratory Test Request Form for samples to be tested. The PAGD engineer should physically locate all samples for testing prior to submitting the lab test form. The PAGD may request SATD assistance for locating bulk (bag) samples as they are in the SATD receiving area. The PAGD engineer should request assistance from FED for jar samples and rock cores as they are maintained by FED in the warehouse. Routine lab testing may include, but not be limited to, soil classification index tests (AASHTO, USDA, USCS), moisture content, specific gravity, moisture-density relationships, pH, organic content, etc.
Step 8. If borings were obtained for SWM design purpose, request USDA
classification. Step 9. Request Resilient Modulus testing on representative bulk (bag) samples to
determine the strength of subgrade soils. This should be requested on a case by case basis after discussion with the PAGD TL.
Step 10. Request D50 Grain Size for scour analysis for all jar samples retrieved
whenever a SPT boring is taken for scour purposes. 3.07.01.04.02 Special Laboratory Testing Step 11. In addition to routine lab testing, special laboratory testing may be required to
determine engineering properties of soils. The EGD should always be contacted for special lab testing. The EGD should be the lead when developing a special lab testing program and request if necessary. The following contains general information on special lab testing.
Step 12. Prepare a lab assignment form for the samples to be tested. Special laboratory testing may include, but not be limited to:
A) Corrosion Testing: Corrosion tests should be requested when pile
foundations and metallic pipes will be constructed in an aggressive environment.

Testing & Data Collection
Section 07: Requests for Lab Work
Updated 10/15/2013 Return to Table of Contents
3-40
B) Direct Shear Testing: Direct Shear tests are requested to obtain effective strength parameters of soils for use in geotechnical engineering analysis (slope stability, bearing capacity, retaining walls, pile end bearing and skin friction). This test is mostly useful for cohesionless soils. Samples for testing may be re-molded from bulk (bag) samples. The normal pressures to be used for testing should be computed based upon actual and proposed site conditions.
C) Consolidation Testing: Consolidation tests are required to obtain soil parameters (Cv, Cc, Pc, etc.) in order to perform time-dependent settlement analyses of cohesive soils for embankments, structural foundations, and retaining structures. These tests are usually performed on cohesive soils from an undisturbed sample.
D) Unconfined Compression Testing: Unconfined compression tests are a quick and inexpensive method to measure the shear strength (undrained cohesion values) of cohesive soils. The reliability of this test is particularly poor with increasing sample depth (below 30 ft) because the sample tends to swell after removal from the tube. Conservative values are obtained from testing since the sample is not confined. Sample may be obtained from undisturbed sampling or be lab reconstituted. The undrained cohesion is half the ultimate stress applied.
E) Tri-axial Testing: Tri-axial tests are performed to determine strength characteristics of soils to be used in geotechnical engineering analysis. Triaxial tests provide a reliable means to determine the friction angle of natural clays and silts, as well as reconstituted sands. Three types of tri-axial tests are available.
a. Unconsolidated Undrained Test b. Consolidated Undrained Test c. Consolidated Drained Test
F) Unconsolidated Undrained (UU) Testing: The UU test is generally
used to obtain soil strength parameters for analysis of quick loading situations such as rapid construction of a highway embankment where all load is applied before the deposit can consolidate and gain strength. Used for short-term analysis conditions.
G) Consolidated Undrained (CU) Testing: The CU test is also used to obtain soil strength parameters. The principal application of results of CU tests on cohesive soils is to the situation where additional load is rapidly applied to soil that has been consolidated under a previous loading (shear stresses). The principal application of the CU test to cohesionless soils is to evaluate the stress-strain properties as a function of effective confining stress.
Testing & Data Collection
Section 07: Requests for Lab Work
Updated 10/15/2013 Return to Table of Contents
3-41
CU test data is used for short-term and long-term analysis conditions.
H) Consolidated Drained (CD) Testing: The CD test is also used to
obtain soil strength parameters. The principal application of the results of CD tests on cohesive soils is for the case where either construction will occur at a sufficiently slow rate that no excess pore pressures will develop or sufficient time will have elapsed that all excess pore pressures will have dissipated (i.e. long term conditions). The principal application to cohesionless soils is to determine the effective friction angle. Used for long-term analysis conditions.
NOTE: If there is no change in pore water pressure, calculations for internal friction angle and cohesion are done based on total stress. If change in pore water pressure is observed during the tri-axial testing, cohesion and internal friction angle determined would be based on effective stress.
I) Permeability Testing: Laboratory permeability testing is performed to determine the hydraulic conductivity (k) of a soil specimen. For natural soils, tests are conducted on samples obtained from undisturbed sampling and for fill or borrow soils, tests are performed on samples reconstituted in the lab.
J) California Bearing Ratio (CBR) Testing: CBR testing is performed
to determine the strength parameters of subgrade soils. CBR has been correlated empirically with Resilient Modulus and a variety of other engineering soil properties.
3.07.01.04.03 Prepare and Submit Request Forms Step 13. Prepare a lab assignment form, OMT Geotechnical Laboratory Test Request
Form (see Forms, Spreadsheets & Guidelines for OMT Geotechnical Laboratory Test Request Form), for samples to be tested with all routine and special lab testing needs. Routine lab testing may include, but not be limited to, soil classification index tests (AASHTO, MSMT, USDA, USCS), moisture content, specific gravity, moisture-density relationships, pH, organic content, etc.
Step 14. Submit completed form, OMT Geotechnical Laboratory Test Request Form,
to PAGD TL for review. Step 15. If approved by PAGD TL, submit two copies of form OMT Geotechnical
Laboratory Test Request Form to SATD.

Materials and Typical Design Properties
Updated 11/07/2013 Return to Table of Contents
4-1
4 MATERIALS AND TYPICAL DESIGN PROPERTIES Click to go to Pavement Mechanistic-Empirical Analysis Click to go to New Pavement Design Using AASHTO 1993
The Material Library provides the pavement design engineer with information about the construction materials used by MDSHA. The Material Library provides both the lab material properties and the AASHTO Pavement design properties of the materials. Refer to Glossary for additional details on material definitions. There are three primary material sections: Material Properties – Asphalt Material Properties – Concrete Material Properties – Unbound Layers
4.01 MATERIAL DESCRIPTION
4.01.01 Specific Materials
The following table provides a list and description of the material types used to construct pavements by MDSHA:
Material Description
PCC Surface material comprised of aggregate, portland cement, water, and potential admixtures.
HMA Superpave 4.75 mm Surface or base materials comprised of aggregate, asphalt cement, and potential admixtures. Gap graded mix do not have a dense graded gradation curve because a band of aggregate sizes are excluded from the HMA mix to prevent rutting. (Return to Gap Graded Stone Matrix Asphalt (SMA) Mixtures: for reflective cracking discussion)
HMA Superpave 9.5 mm Gap Graded
HMA Superpave 9.5 mm
HMA Superpave 12.5 mm Gap Graded
HMA Superpave 12.5 mm
HMA Superpave 19.0 mm Gap Graded
HMA Superpave 19.0 mm
HMA Superpave 25.0 mm
HMA Superpave 37.5 mm
Aggregate Seals Surface sealer comprised of sequential applications of asphalt (usually emulsion) and stone chips or sand in either single or repetitive layers.
Asphalt Treated Aggregate Base
Base material comprised of aggregate mixed with asphalt cement, typically 3.25% to 5% by weight.
Penetration Macadam Commonly used prior to the 1950’s. A stone matrix of large stones at the bottom of the lift choked with increasingly larger aggregate sizes. A crude form of asphalt cement, tar, was then poured over the stone matrix after compaction.
Macadam Commonly used prior to the 1950’s. A stone matrix of large stones at the bottom of the lift choked with
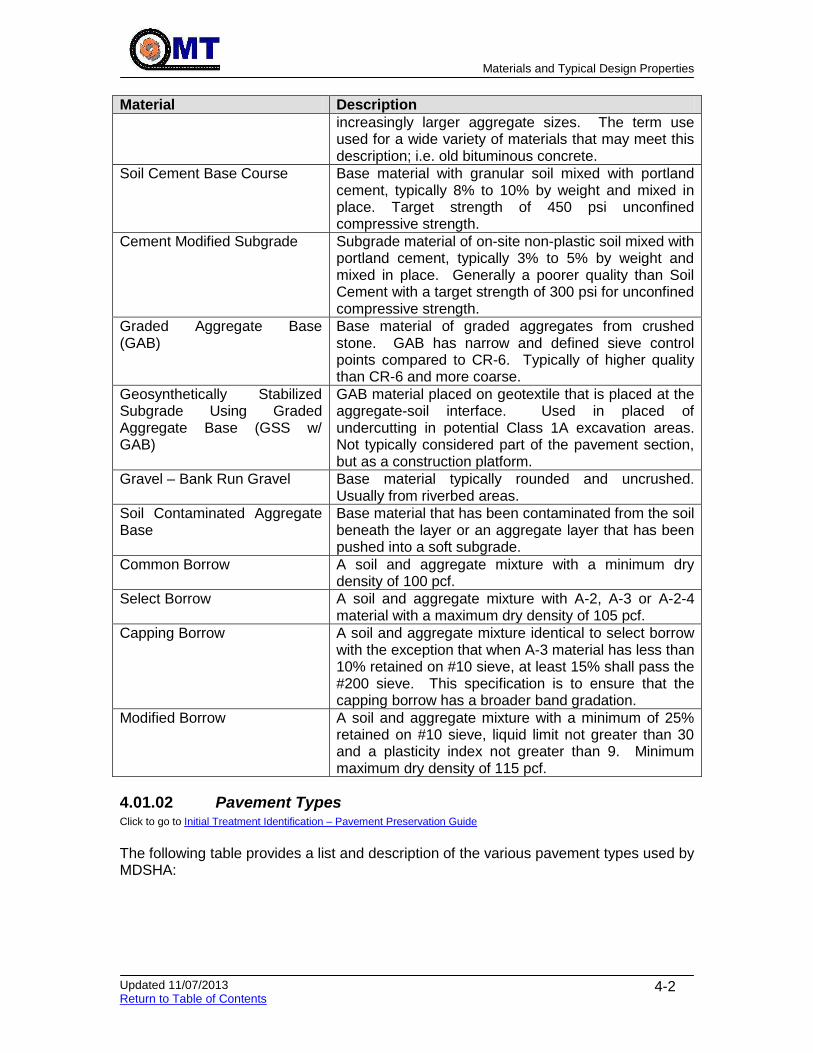
Materials and Typical Design Properties
Updated 11/07/2013 Return to Table of Contents
4-2
Material Description
increasingly larger aggregate sizes. The term use used for a wide variety of materials that may meet this description; i.e. old bituminous concrete.
Soil Cement Base Course Base material with granular soil mixed with portland cement, typically 8% to 10% by weight and mixed in place. Target strength of 450 psi unconfined compressive strength.
Cement Modified Subgrade Subgrade material of on-site non-plastic soil mixed with portland cement, typically 3% to 5% by weight and mixed in place. Generally a poorer quality than Soil Cement with a target strength of 300 psi for unconfined compressive strength.
Graded Aggregate Base (GAB)
Base material of graded aggregates from crushed stone. GAB has narrow and defined sieve control points compared to CR-6. Typically of higher quality than CR-6 and more coarse.
Geosynthetically Stabilized Subgrade Using Graded Aggregate Base (GSS w/ GAB)
GAB material placed on geotextile that is placed at the aggregate-soil interface. Used in placed of undercutting in potential Class 1A excavation areas. Not typically considered part of the pavement section, but as a construction platform.
Gravel – Bank Run Gravel Base material typically rounded and uncrushed. Usually from riverbed areas.
Soil Contaminated Aggregate Base
Base material that has been contaminated from the soil beneath the layer or an aggregate layer that has been pushed into a soft subgrade.
Common Borrow A soil and aggregate mixture with a minimum dry density of 100 pcf.
Select Borrow A soil and aggregate mixture with A-2, A-3 or A-2-4 material with a maximum dry density of 105 pcf.
Capping Borrow A soil and aggregate mixture identical to select borrow with the exception that when A-3 material has less than 10% retained on #10 sieve, at least 15% shall pass the #200 sieve. This specification is to ensure that the capping borrow has a broader band gradation.
Modified Borrow A soil and aggregate mixture with a minimum of 25% retained on #10 sieve, liquid limit not greater than 30 and a plasticity index not greater than 9. Minimum maximum dry density of 115 pcf.
4.01.02 Pavement Types Click to go to Initial Treatment Identification – Pavement Preservation Guide
The following table provides a list and description of the various pavement types used by MDSHA:
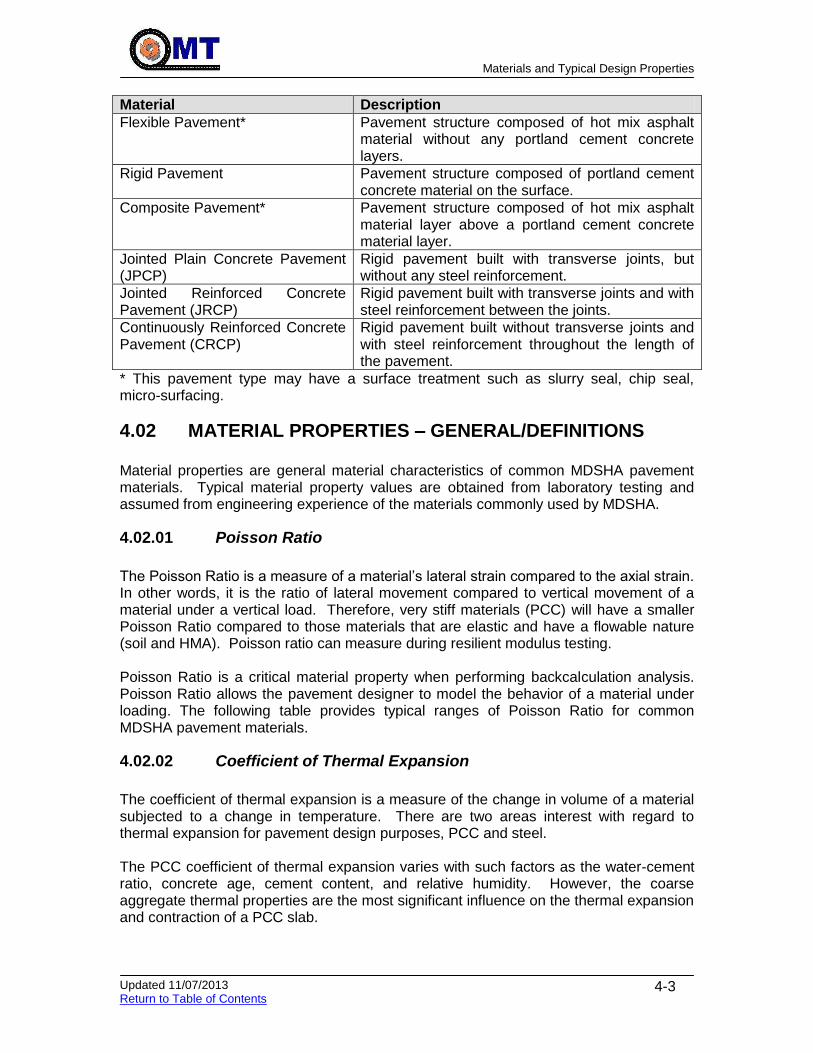
Materials and Typical Design Properties
Updated 11/07/2013 Return to Table of Contents
4-3
Material Description
Flexible Pavement* Pavement structure composed of hot mix asphalt material without any portland cement concrete layers.
Rigid Pavement Pavement structure composed of portland cement concrete material on the surface.
Composite Pavement* Pavement structure composed of hot mix asphalt material layer above a portland cement concrete material layer.
Jointed Plain Concrete Pavement (JPCP)
Rigid pavement built with transverse joints, but without any steel reinforcement.
Jointed Reinforced Concrete Pavement (JRCP)
Rigid pavement built with transverse joints and with steel reinforcement between the joints.
Continuously Reinforced Concrete Pavement (CRCP)
Rigid pavement built without transverse joints and with steel reinforcement throughout the length of the pavement.
* This pavement type may have a surface treatment such as slurry seal, chip seal, micro-surfacing.
4.02 MATERIAL PROPERTIES – GENERAL/DEFINITIONS Material properties are general material characteristics of common MDSHA pavement materials. Typical material property values are obtained from laboratory testing and assumed from engineering experience of the materials commonly used by MDSHA.
4.02.01 Poisson Ratio
The Poisson Ratio is a measure of a material’s lateral strain compared to the axial strain. In other words, it is the ratio of lateral movement compared to vertical movement of a material under a vertical load. Therefore, very stiff materials (PCC) will have a smaller Poisson Ratio compared to those materials that are elastic and have a flowable nature (soil and HMA). Poisson ratio can measure during resilient modulus testing. Poisson Ratio is a critical material property when performing backcalculation analysis. Poisson Ratio allows the pavement designer to model the behavior of a material under loading. The following table provides typical ranges of Poisson Ratio for common MDSHA pavement materials.
4.02.02 Coefficient of Thermal Expansion
The coefficient of thermal expansion is a measure of the change in volume of a material subjected to a change in temperature. There are two areas interest with regard to thermal expansion for pavement design purposes, PCC and steel. The PCC coefficient of thermal expansion varies with such factors as the water-cement ratio, concrete age, cement content, and relative humidity. However, the coarse aggregate thermal properties are the most significant influence on the thermal expansion and contraction of a PCC slab.
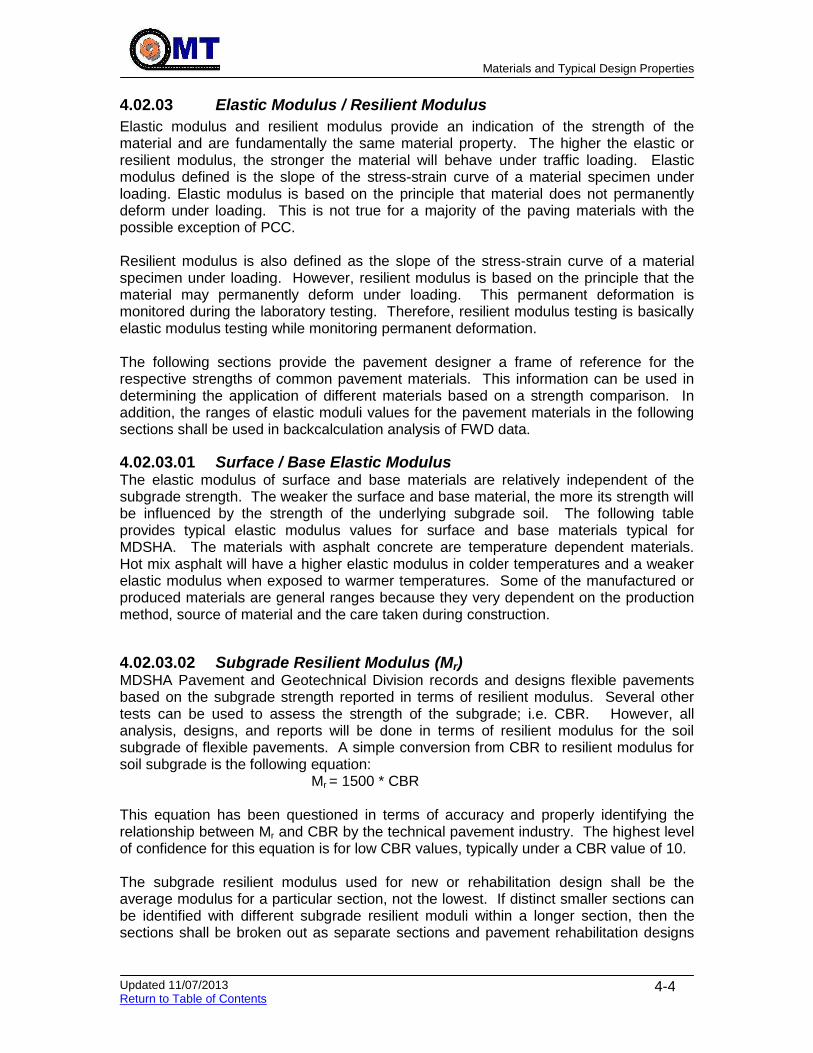
Materials and Typical Design Properties
Updated 11/07/2013 Return to Table of Contents
4-4
4.02.03 Elastic Modulus / Resilient Modulus
Elastic modulus and resilient modulus provide an indication of the strength of the material and are fundamentally the same material property. The higher the elastic or resilient modulus, the stronger the material will behave under traffic loading. Elastic modulus defined is the slope of the stress-strain curve of a material specimen under loading. Elastic modulus is based on the principle that material does not permanently deform under loading. This is not true for a majority of the paving materials with the possible exception of PCC. Resilient modulus is also defined as the slope of the stress-strain curve of a material specimen under loading. However, resilient modulus is based on the principle that the material may permanently deform under loading. This permanent deformation is monitored during the laboratory testing. Therefore, resilient modulus testing is basically elastic modulus testing while monitoring permanent deformation. The following sections provide the pavement designer a frame of reference for the respective strengths of common pavement materials. This information can be used in determining the application of different materials based on a strength comparison. In addition, the ranges of elastic moduli values for the pavement materials in the following sections shall be used in backcalculation analysis of FWD data.
4.02.03.01 Surface / Base Elastic Modulus The elastic modulus of surface and base materials are relatively independent of the subgrade strength. The weaker the surface and base material, the more its strength will be influenced by the strength of the underlying subgrade soil. The following table provides typical elastic modulus values for surface and base materials typical for MDSHA. The materials with asphalt concrete are temperature dependent materials. Hot mix asphalt will have a higher elastic modulus in colder temperatures and a weaker elastic modulus when exposed to warmer temperatures. Some of the manufactured or produced materials are general ranges because they very dependent on the production method, source of material and the care taken during construction.
4.02.03.02 Subgrade Resilient Modulus (Mr) MDSHA Pavement and Geotechnical Division records and designs flexible pavements based on the subgrade strength reported in terms of resilient modulus. Several other tests can be used to assess the strength of the subgrade; i.e. CBR. However, all analysis, designs, and reports will be done in terms of resilient modulus for the soil subgrade of flexible pavements. A simple conversion from CBR to resilient modulus for soil subgrade is the following equation: Mr = 1500 * CBR This equation has been questioned in terms of accuracy and properly identifying the relationship between Mr and CBR by the technical pavement industry. The highest level of confidence for this equation is for low CBR values, typically under a CBR value of 10. The subgrade resilient modulus used for new or rehabilitation design shall be the average modulus for a particular section, not the lowest. If distinct smaller sections can be identified with different subgrade resilient moduli within a longer section, then the sections shall be broken out as separate sections and pavement rehabilitation designs

Materials and Typical Design Properties
Updated 11/07/2013 Return to Table of Contents
4-5
shall be done for each section. It is the policy of MDSHA Pavement and Geotechnical Division to have a maximum design subgrade modulus. The maximum design Mr is 10,500 psi or a CBR of approximately 7. Occasionally, higher subgrade moduli values are found throughout the state, but because of the moist climatic seasons and the natural soils of Maryland, it has been decided to cap the maximum design subgrade modulus. The subgrade strength is an extremely influential parameter in the AASHTO pavement design process and every effort shall be completed to obtain an accurate and specific value for each section.
4.02.03.03 Modulus of Subgrade Reaction (k) Click to go to Foundation Support in the AC overlay over JCP section.
PAGD records and designs rigid and composite pavements based on the subgrade strength reported in terms of modulus of subgrade reaction (k). In the same manner as flexible pavements, several other tests can be used to assess the strength of the subgrade; i.e. CBR. However, all analysis, designs, and reports will be done in terms of resilient modulus for the soil subgrade of flexible pavements and in terms of modulus of subgrade reaction for rigid and composite pavements. In the case of flexible pavements, the resilient modulus is simply a material property of the soil subgrade. In the case of rigid and composite pavements, the modulus of subgrade reaction is a material property of the subgrade and aggregate base material as a whole. The aggregate base layer in AASHTO pavement design procedures does not contribute to the structural capacity of the pavement structure; it provides additional support to the subgrade. Therefore, for subsequent rehabilitation strategies involving a HMA overlay of a rigid pavement, or additional HMA overlays of a composite pavement, the aggregate base layer and subgrade are viewed and analyzed a single material property, referred to a modulus of subgrade reaction. Unlike the resilient modulus of the subgrade in flexible pavements, the effect of k value is minimal in terms of structural improvements required for rigid and composite pavements. A relationship has been developed between resilient modulus of the subgrade and the modulus of subgrade reaction of the subgrade/aggregate base combination. That relationship is represented in the following equation: k = Mr / 19.4 Occasionally, the pavement structure deflection behavior of the pavement structure does not provide a reasonable k value from the FWD analysis. A typical range a k values for MDSHA pavement materials is from 100 pci to a maximum of 600 pci. Modulus of subgrade reaction greater than 700 should be closely evaluated to assure that any error in testing or analysis has not occurred. Refer to Unbound Materials Properties.

Materials and Typical Design Properties
Updated 11/07/2013 Return to Table of Contents
4-6
4.03 MATERIAL PROPERTIES – ASPHALT Click to go to Reasonable Layer Modulus Range
4.03.01 Recommended Material Property Inputs for new HMA Layers
Property Input Level
Value
Asphalt Mix
Dynamic Modulus 1 Future Input
Aggregate Gradation and Volumetric Properties
2/3 See Aggregate Gradation and Volumetric Properties
Asphalt Binder
Superpave Binder Dynamic Stiffness
1/2 Future Input
Superpave Binder Grade 3 See Performance Grade Binder Selection
Asphalt General
Reference Temperature All 70
Effective Binder Content All See Aggregate Gradation and Volumetric Properties
In-Place Air Voids All See Aggregate Gradation and Volumetric Properties
Total Unit Weight All See HMA Unit Weight
Poisson’s Ratio All Use 0.35. See Poisson Ratio
Thermal Conductivity All 0.67
Heat Capacity Asphalt All 0.23
Short Wave Absorption All 0.85
4.03.01.01 Aggregate Gradation and Volumetric Properties Click to go to Mixture Volumetrics: Click to go to Recommended Material Property Inputs for Existing HMA Layers
NMAS (mm)
Mix Type
%Retained above 3/4” sieve
%Retained above 3/8” sieve
%Retained above #4 sieve
%Passing #200 sieve
Effective Volumetric Binder Content (%)
In-Place Air Voids (%)
4.75 Virgin 0.0 0.0 6.9 7.7 14.06 6.54
9.5 Shingle 0.0 4.8 39.2 6.4 11.61 6.47
9.5 RAP 0.0 4.7 38.1 5.5 11.59 6.47
9.5 Virgin 0.0 3.7 34.5 6.0 11.88 6.47
9.5 GAP 0.0 10.7 61.3 9.2 14.85 6.47
9.5 HPV 0.0 3.4 36.7 5.5 11.76 6.47
12.5 HPV 0.0 14.0 49.1 5.1 11.09 6.47
12.5 RAP 0.0 13.0 50.0 5.4 10.70 6.47
12.5 Shingle 0.0 14.2 50.7 6.1 10.73 6.47
12.5 Virgin 0.0 15.6 45.3 5.3 11.14 6.47
12.5 GAP 0.0 21.7 66.8 8.6 14.31 6.47
19 GAP 5.0 44.0 74.0 8.1 13.84 6.47
19 RAP 3.5 26.6 57.4 5.0 9.69 6.47
19 Shingle 4.1 29.5 58.8 5.6 9.72 6.47
19 HPV 2.5 30.4 58.3 5.3 10.20 6.47
19 Virgin 5.5 33.5 55.5 4.9 10.08 6.47
25 RAP 11.7 40.6 65.2 4.7 9.10 6.47
25 Virgin 15.0 47.0 63.5 4.2 9.46 6.47
37.5 RAP 23.0 52.2 70.8 4.4 8.38 6.47
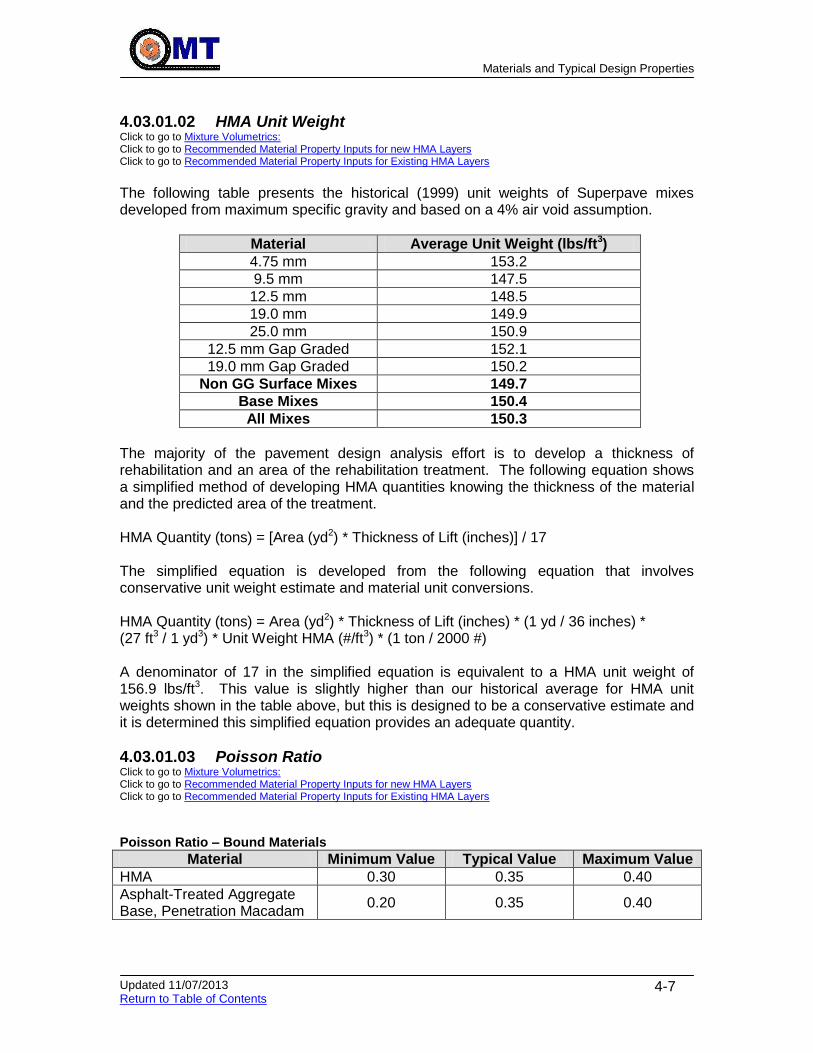
Materials and Typical Design Properties
Updated 11/07/2013 Return to Table of Contents
4-7
4.03.01.02 HMA Unit Weight Click to go to Mixture Volumetrics: Click to go to Recommended Material Property Inputs for new HMA Layers Click to go to Recommended Material Property Inputs for Existing HMA Layers
The following table presents the historical (1999) unit weights of Superpave mixes developed from maximum specific gravity and based on a 4% air void assumption.
Material Average Unit Weight (lbs/ft3)
4.75 mm 153.2
9.5 mm 147.5
12.5 mm 148.5
19.0 mm 149.9
25.0 mm 150.9
12.5 mm Gap Graded 152.1
19.0 mm Gap Graded 150.2
Non GG Surface Mixes 149.7
Base Mixes 150.4
All Mixes 150.3
The majority of the pavement design analysis effort is to develop a thickness of rehabilitation and an area of the rehabilitation treatment. The following equation shows a simplified method of developing HMA quantities knowing the thickness of the material and the predicted area of the treatment. HMA Quantity (tons) = [Area (yd2) * Thickness of Lift (inches)] / 17 The simplified equation is developed from the following equation that involves conservative unit weight estimate and material unit conversions. HMA Quantity (tons) = Area (yd2) * Thickness of Lift (inches) * (1 yd / 36 inches) * (27 ft3 / 1 yd3) * Unit Weight HMA (#/ft3) * (1 ton / 2000 #) A denominator of 17 in the simplified equation is equivalent to a HMA unit weight of 156.9 lbs/ft3. This value is slightly higher than our historical average for HMA unit weights shown in the table above, but this is designed to be a conservative estimate and it is determined this simplified equation provides an adequate quantity.
4.03.01.03 Poisson Ratio Click to go to Mixture Volumetrics: Click to go to Recommended Material Property Inputs for new HMA Layers Click to go to Recommended Material Property Inputs for Existing HMA Layers
Poisson Ratio – Bound Materials
Material Minimum Value Typical Value Maximum Value
HMA 0.30 0.35 0.40
Asphalt-Treated Aggregate Base, Penetration Macadam
0.20 0.35 0.40

Materials and Typical Design Properties
Updated 11/07/2013 Return to Table of Contents
4-8
4.03.01.04 Recommended Thermal Cracking Inputs for new HMA Layers Click to go to Mechanical Properties: Click to go to Flexible Pavements
Property Input Level
Value
Average tensile strength at 14 OC 3 MEPD Calculated
Creep Compliance 3 MEPD Calculated
Mixture Coefficient of Thermal Contraction
3 MEPD Calculated
Aggregate Coefficient of Thermal Contraction
3 See Coefficient of Thermal Expansion
4.03.02 Recommended Material Property Inputs for Existing HMA Layers
Property Input Level
Value
Asphalt Mix
Aggregate Gradation and Volumetric Properties
All See Aggregate Gradation and Volumetric Properties
Asphalt Binder
Superpave Binder Dynamic Stiffness
½ Future input
Superpave Binder Grade 3 See Performance Grade Binder Selection
Asphalt General
Reference Temperature All 70
Effective Binder Content All See Aggregate Gradation and Volumetric Properties
In-Place Air Voids All See Aggregate Gradation and Volumetric Properties
Total Unit Weight All See HMA Unit Weight
Poisson’s Ratio All Use 0.35. See Poisson Ratio
Thermal Conductivity All 0.67
Heat Capacity Asphalt All 0.23
Short Wave Absorption All 0.85
Pavement Condition Rating
All See Visual Pavement Condition Assessment
4.03.03 General Ranges for Surface / Base Elastic Modulus Click to go to New Pavement Design Using AASHTO 1993
Material Minimum Modulus (psi)
Typical Modulus (psi)
Maximum Modulus (psi)
HMA, Surface2 250,000 750,000 1,500,000
HMA, Base2 200,000 600,000 1,250,000
Asphalt Treated Aggregate Base
50,000 150,000 500,000
Penetration Macadam 30,000 75,000 250,000
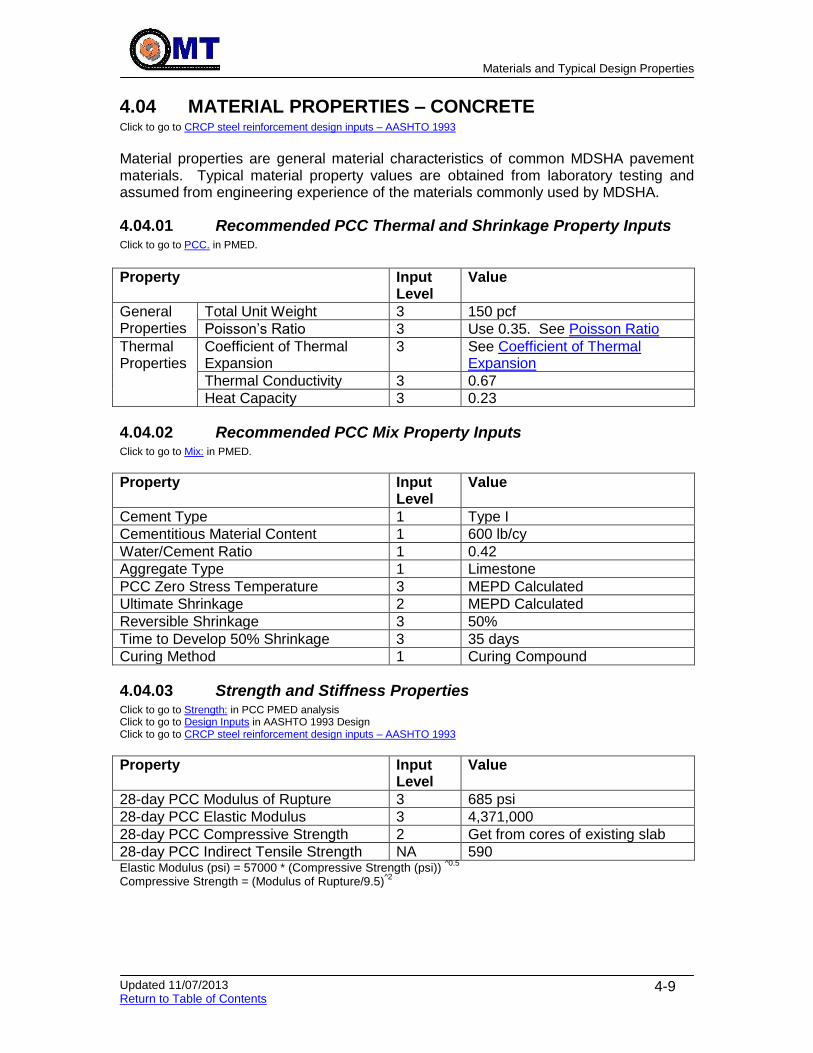
Materials and Typical Design Properties
Updated 11/07/2013 Return to Table of Contents
4-9
4.04 MATERIAL PROPERTIES – CONCRETE Click to go to CRCP steel reinforcement design inputs – AASHTO 1993
Material properties are general material characteristics of common MDSHA pavement materials. Typical material property values are obtained from laboratory testing and assumed from engineering experience of the materials commonly used by MDSHA.
4.04.01 Recommended PCC Thermal and Shrinkage Property Inputs Click to go to PCC. in PMED.
Property Input Level
Value
General Properties
Total Unit Weight 3 150 pcf
Poisson’s Ratio 3 Use 0.35. See Poisson Ratio
Thermal Properties
Coefficient of Thermal Expansion
3 See Coefficient of Thermal Expansion
Thermal Conductivity 3 0.67
Heat Capacity 3 0.23
4.04.02 Recommended PCC Mix Property Inputs Click to go to Mix: in PMED.
Property Input Level
Value
Cement Type 1 Type I
Cementitious Material Content 1 600 lb/cy
Water/Cement Ratio 1 0.42
Aggregate Type 1 Limestone
PCC Zero Stress Temperature 3 MEPD Calculated
Ultimate Shrinkage 2 MEPD Calculated
Reversible Shrinkage 3 50%
Time to Develop 50% Shrinkage 3 35 days
Curing Method 1 Curing Compound
4.04.03 Strength and Stiffness Properties Click to go to Strength: in PCC PMED analysis Click to go to Design Inputs in AASHTO 1993 Design Click to go to CRCP steel reinforcement design inputs – AASHTO 1993
Property Input Level
Value
28-day PCC Modulus of Rupture 3 685 psi
28-day PCC Elastic Modulus 3 4,371,000
28-day PCC Compressive Strength 2 Get from cores of existing slab
28-day PCC Indirect Tensile Strength NA 590 Elastic Modulus (psi) = 57000 * (Compressive Strength (psi))
^0.5
Compressive Strength = (Modulus of Rupture/9.5)^2
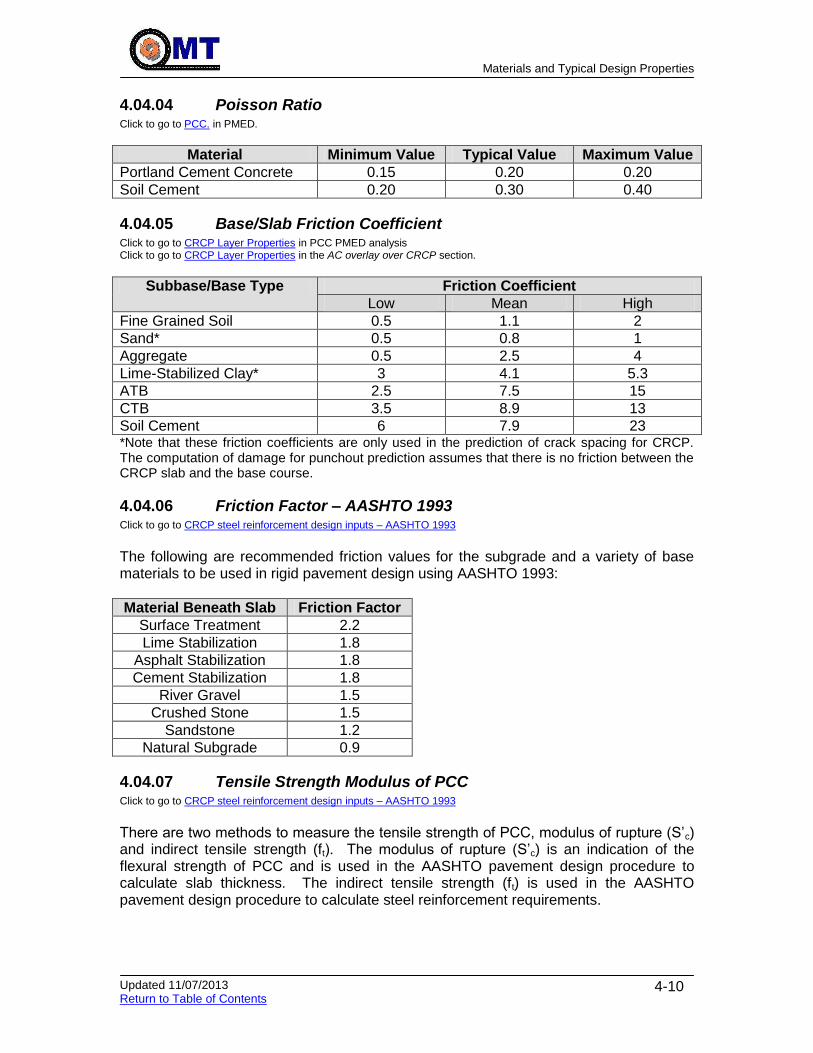
Materials and Typical Design Properties
Updated 11/07/2013 Return to Table of Contents
4-10
4.04.04 Poisson Ratio Click to go to PCC. in PMED.
Material Minimum Value Typical Value Maximum Value
Portland Cement Concrete 0.15 0.20 0.20
Soil Cement 0.20 0.30 0.40
4.04.05 Base/Slab Friction Coefficient Click to go to CRCP Layer Properties in PCC PMED analysis Click to go to CRCP Layer Properties in the AC overlay over CRCP section.
Subbase/Base Type Friction Coefficient
Low Mean High
Fine Grained Soil 0.5 1.1 2
Sand* 0.5 0.8 1
Aggregate 0.5 2.5 4
Lime-Stabilized Clay* 3 4.1 5.3
ATB 2.5 7.5 15
CTB 3.5 8.9 13
Soil Cement 6 7.9 23 *Note that these friction coefficients are only used in the prediction of crack spacing for CRCP. The computation of damage for punchout prediction assumes that there is no friction between the CRCP slab and the base course.
4.04.06 Friction Factor – AASHTO 1993 Click to go to CRCP steel reinforcement design inputs – AASHTO 1993
The following are recommended friction values for the subgrade and a variety of base materials to be used in rigid pavement design using AASHTO 1993:
Material Beneath Slab Friction Factor
Surface Treatment 2.2
Lime Stabilization 1.8
Asphalt Stabilization 1.8
Cement Stabilization 1.8
River Gravel 1.5
Crushed Stone 1.5
Sandstone 1.2
Natural Subgrade 0.9
4.04.07 Tensile Strength Modulus of PCC Click to go to CRCP steel reinforcement design inputs – AASHTO 1993
There are two methods to measure the tensile strength of PCC, modulus of rupture (S’c) and indirect tensile strength (ft). The modulus of rupture (S’c) is an indication of the flexural strength of PCC and is used in the AASHTO pavement design procedure to calculate slab thickness. The indirect tensile strength (ft) is used in the AASHTO pavement design procedure to calculate steel reinforcement requirements.
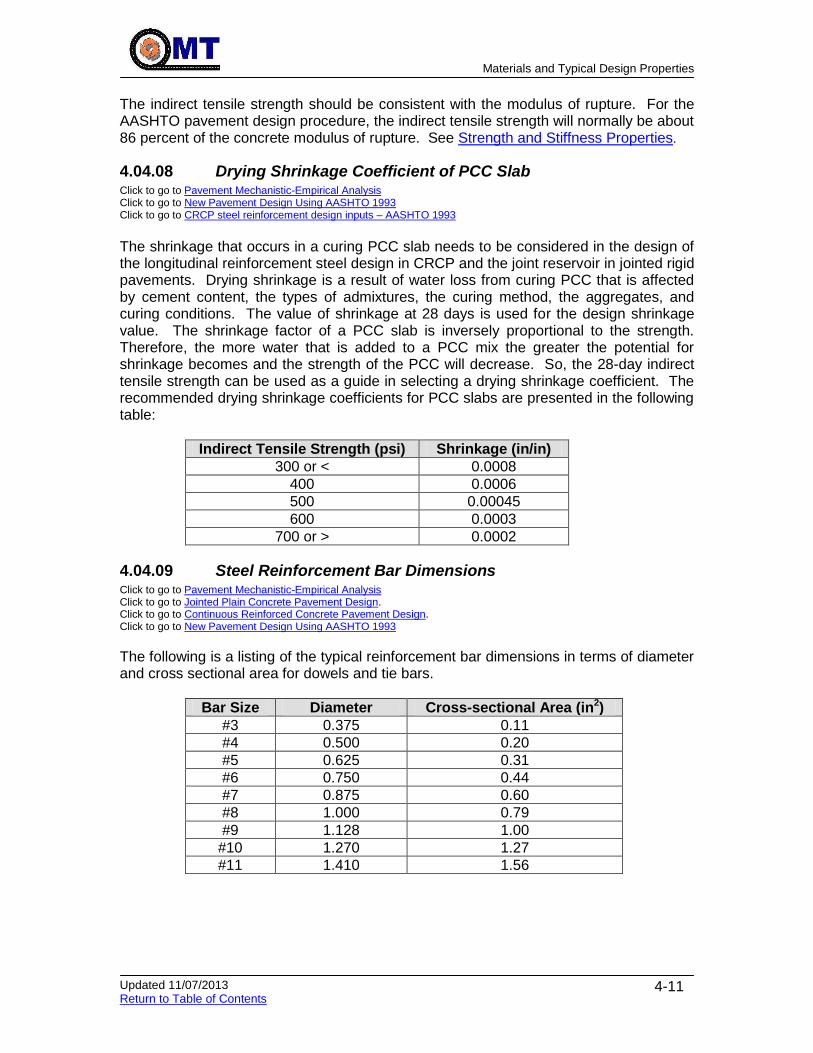
Materials and Typical Design Properties
Updated 11/07/2013 Return to Table of Contents
4-11
The indirect tensile strength should be consistent with the modulus of rupture. For the AASHTO pavement design procedure, the indirect tensile strength will normally be about 86 percent of the concrete modulus of rupture. See Strength and Stiffness Properties.
4.04.08 Drying Shrinkage Coefficient of PCC Slab Click to go to Pavement Mechanistic-Empirical Analysis Click to go to New Pavement Design Using AASHTO 1993 Click to go to CRCP steel reinforcement design inputs – AASHTO 1993
The shrinkage that occurs in a curing PCC slab needs to be considered in the design of the longitudinal reinforcement steel design in CRCP and the joint reservoir in jointed rigid pavements. Drying shrinkage is a result of water loss from curing PCC that is affected by cement content, the types of admixtures, the curing method, the aggregates, and curing conditions. The value of shrinkage at 28 days is used for the design shrinkage value. The shrinkage factor of a PCC slab is inversely proportional to the strength. Therefore, the more water that is added to a PCC mix the greater the potential for shrinkage becomes and the strength of the PCC will decrease. So, the 28-day indirect tensile strength can be used as a guide in selecting a drying shrinkage coefficient. The recommended drying shrinkage coefficients for PCC slabs are presented in the following table:
Indirect Tensile Strength (psi) Shrinkage (in/in)
300 or < 0.0008
400 0.0006
500 0.00045
600 0.0003
700 or > 0.0002
4.04.09 Steel Reinforcement Bar Dimensions Click to go to Pavement Mechanistic-Empirical Analysis Click to go to Jointed Plain Concrete Pavement Design. Click to go to Continuous Reinforced Concrete Pavement Design. Click to go to New Pavement Design Using AASHTO 1993
The following is a listing of the typical reinforcement bar dimensions in terms of diameter and cross sectional area for dowels and tie bars.
Bar Size Diameter Cross-sectional Area (in2)
#3 0.375 0.11
#4 0.500 0.20
#5 0.625 0.31
#6 0.750 0.44
#7 0.875 0.60
#8 1.000 0.79
#9 1.128 1.00
#10 1.270 1.27
#11 1.410 1.56

Materials and Typical Design Properties
Updated 11/07/2013 Return to Table of Contents
4-12
4.05 MATERIAL PROPERTIES – UNBOUND LAYERS Click to go to Subgrade
Material properties are general material characteristics of common MDSHA pavement materials. Typical material property values are obtained from laboratory testing and assumed from engineering experience of the materials commonly used by MDSHA.
4.05.01 Soil Classification Charts Click to go to Geotechnical Design Properties
The following table provides a list and description of the soil types identified by MDSHA:
AASHTO Material MSMT Material
Description
A-1-a, A-1-b A-2 Sand and Fines
A-1-a, A-1-b A-2-4 Silty Sand
A-2-5, A-2-6 A-2-7 Clayey Sand
A-1-a, A-1-b, A-3 A-3 Sand
A-4 A-4 Silt
A-2-4 A-4-2 Sandy Silt
A-6, A-7-5 A-4-7 Clayey Silt
A-5, A-6, A-7 A-5 Mica, Diatoms, Decomposed Rock
A-7 A-6 Colloidal Clay
A-7 A-7 Clay
A-2-7 A-7-2 Sandy Clays
A-7-6 A-7-4 Silty clay
A-8 A-8 Swamp Muck
Rock Refusal Rock Refusal
4.05.01.01 AASHTO Soil Classification Click to go to Format – Soil Classifications
Refer to Standard No. MD 000.04 and Standard No. MD 000.01.
4.05.01.02 MSMT Soil Classification Click to go to Format – Soil Classifications
Refer to Standard No. MD 000.03 and Standard No. MD 000.01.
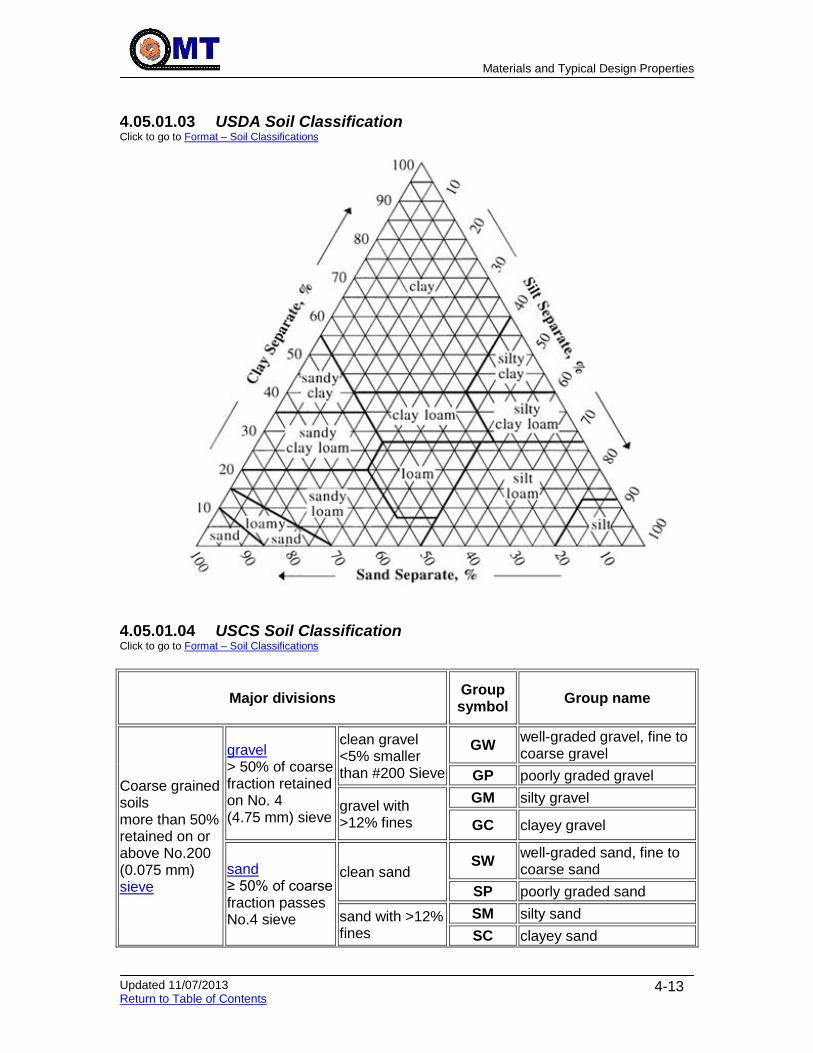
Materials and Typical Design Properties
Updated 11/07/2013 Return to Table of Contents
4-13
4.05.01.03 USDA Soil Classification Click to go to Format – Soil Classifications
4.05.01.04 USCS Soil Classification Click to go to Format – Soil Classifications
Major divisions Group symbol
Group name
Coarse grained soils more than 50% retained on or above No.200 (0.075 mm) sieve
gravel > 50% of coarse fraction retained on No. 4 (4.75 mm) sieve
clean gravel <5% smaller than #200 Sieve
GW well-graded gravel, fine to coarse gravel
GP poorly graded gravel
gravel with >12% fines
GM silty gravel
GC clayey gravel
sand ≥ 50% of coarse fraction passes No.4 sieve
clean sand SW
well-graded sand, fine to coarse sand
SP poorly graded sand
sand with >12% fines
SM silty sand
SC clayey sand

Materials and Typical Design Properties
Updated 11/07/2013 Return to Table of Contents
4-14
Major divisions Group symbol
Group name
Fine grained soils more than 50% passes No.200 sieve
silt and clay liquid limit < 50
inorganic
ML silt
CL clay of low plasticity, lean clay
organic OL organic silt, organic clay
silt and clay liquid limit ≥ 50
inorganic
MH silt of high plasticity, elastic silt
CH clay of high plasticity, fat clay
organic OH organic clay, organic silt
Highly organic soils Pt peat
4.05.02 Recommended Material Property Inputs for Unbound Layers
Property Input Level
Value
Strength Properties (ICM Calculated)
Poisson’s Ratio 3 Use Default. See Poisson Ratio
Coefficient of Lateral Pressure
3 Use Default. See Coefficient of Lateral Pressure
Modulus 2/3 If not available from borings, see Unbound Materials Properties
ICM (Mean Values)
Gradation 2/3 Use Level 3 default or see Unbound Materials Properties
Plasticity Index 2/3 Use Level 3 default or see Unbound Materials Properties
Liquid Limit 2/3 Use Level 3 default or see Unbound Materials Properties
Maximum Dry Unit Weight 2/3 Use Level 3 default or see Unbound Materials Properties
Specific Gravity 2/3 Use Level 3 default
Saturated Hydraulic Conductivity
3 Use Level 3 default
Optimum Gravimetric Water Content
2/3 Use Level 3 default or see Unbound Materials Properties
Degree of Saturation at Optimum
2/3 Use Level 3 default or see Unbound Materials Properties
Soil-Water Characteristic Curve Parameters (af, bf, cf, hr)
3 Use Level 3 default
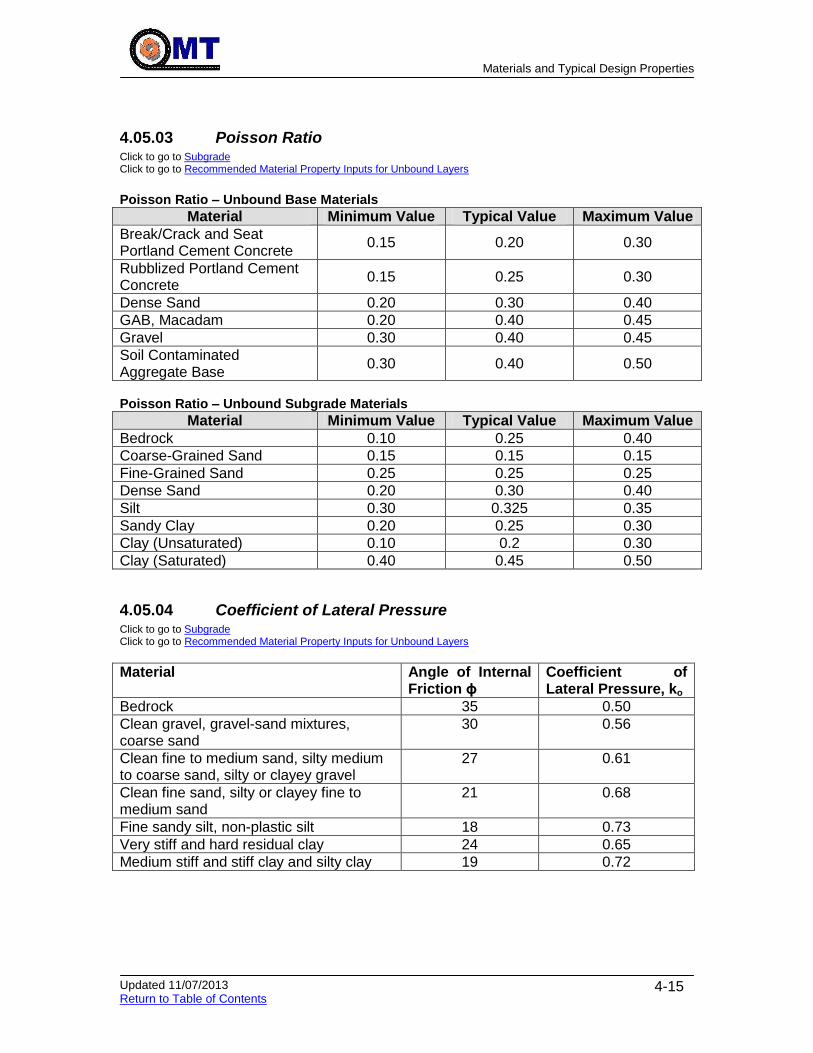
Materials and Typical Design Properties
Updated 11/07/2013 Return to Table of Contents
4-15
4.05.03 Poisson Ratio Click to go to Subgrade Click to go to Recommended Material Property Inputs for Unbound Layers
Poisson Ratio – Unbound Base Materials
Material Minimum Value Typical Value Maximum Value
Break/Crack and Seat Portland Cement Concrete
0.15 0.20 0.30
Rubblized Portland Cement Concrete
0.15 0.25 0.30
Dense Sand 0.20 0.30 0.40
GAB, Macadam 0.20 0.40 0.45
Gravel 0.30 0.40 0.45
Soil Contaminated Aggregate Base
0.30 0.40 0.50
Poisson Ratio – Unbound Subgrade Materials
Material Minimum Value Typical Value Maximum Value
Bedrock 0.10 0.25 0.40
Coarse-Grained Sand 0.15 0.15 0.15
Fine-Grained Sand 0.25 0.25 0.25
Dense Sand 0.20 0.30 0.40
Silt 0.30 0.325 0.35
Sandy Clay 0.20 0.25 0.30
Clay (Unsaturated) 0.10 0.2 0.30
Clay (Saturated) 0.40 0.45 0.50
4.05.04 Coefficient of Lateral Pressure Click to go to Subgrade Click to go to Recommended Material Property Inputs for Unbound Layers
Material Angle of Internal Friction ϕ
Coefficient of Lateral Pressure, ko
Bedrock 35 0.50
Clean gravel, gravel-sand mixtures, coarse sand
30 0.56
Clean fine to medium sand, silty medium to coarse sand, silty or clayey gravel
27 0.61
Clean fine sand, silty or clayey fine to medium sand
21 0.68
Fine sandy silt, non-plastic silt 18 0.73
Very stiff and hard residual clay 24 0.65
Medium stiff and stiff clay and silty clay 19 0.72

Materials and Typical Design Properties
Updated 11/07/2013 Return to Table of Contents
4-16
4.05.05 Unbound Materials Properties Click to go to Subgrade Click to go to Modulus of Subgrade Reaction (k) Click to go to Recommended Material Property Inputs for Unbound Layers
Class N LL
(%) PI
(%) % <
No. 4 % < No.
200 OMC (%)
S at OMC (%)
Max Dry Unit Weight (PCF)
Subgrade Mr (psi)
A-1-b 5 23.8 7.0 60 15 6.7 53.6 135.3
A-2-4 42 24.2 8.7 97 28 8.9 60.3 129.5 10,000
A-2-6 12 26.0 13.6 89 29 8.9 59.0 128.3 10,000
A-3 4 99 8 10.8 58.2 111.3
A-4 96 29.5 8.0 99 48 11.8 67.8 122.5 6,000
A-5 3 41.0 8.0 99 71 15.6 57.2 112.6
A-6 34 31.0 12.1 99 54 12.3 76.1 121.5 5,500
A-7-5 12 46.0 14.5 100 57 16.0 75.1 114.3 8,000
A-7-6 6 49.5 22.0 100 64 16.8 76.8 110.1 7,500
The Mr values in the table above shall be used when FWD analysis data or laboratory information are not available. The subgrade strength is an extremely influential parameter in the AASHTO pavement design process and every effort shall be completed to obtain an accurate and specific value for each section.
4.05.06 Coefficient of Thermal Expansion Click to go to Requests for Pavement Field Work Click to go to Pavement Mechanistic-Empirical Analysis Click to go to New Pavement Design Using AASHTO 1993 Click to go to CRCP steel reinforcement design inputs – AASHTO 1993 Click to go to Recommended Thermal Cracking Inputs for new HMA Layers Click to go to Recommended PCC Thermal and Shrinkage Property Inputs
The CTE values for the various types of aggregate used below can be used to adjust default CTE values. If it is not specifically known which aggregate will be used, it can be estimated by the Region that the project is in. If a section has more than one type of applicable aggregate, use the aggregate with the higher CTE value.
Region Type of Aggregate
Coefficient of Thermal
Expansion (1x10⁻⁶ in/in/F)
Howard, Montgomery Co. Basalt 4.8
Eastern Washington Co. Dolomite 5.5
Cecil Co. Granite 5.3
Western Carroll and west Limestone 3.8
Eastern Carroll, Baltimore, Harford Co.
Marble 3.9
East of I-95 Quartz 6.6
Western Washington Co. and west
Sandstone 6.5
The steel coefficient of thermal expansion should be dependent on the steel type manufacturer. Without that knowledge, the designer should use 6 X 10⁻⁶ in/in/F for the reinforcing steel coefficient of expansion.
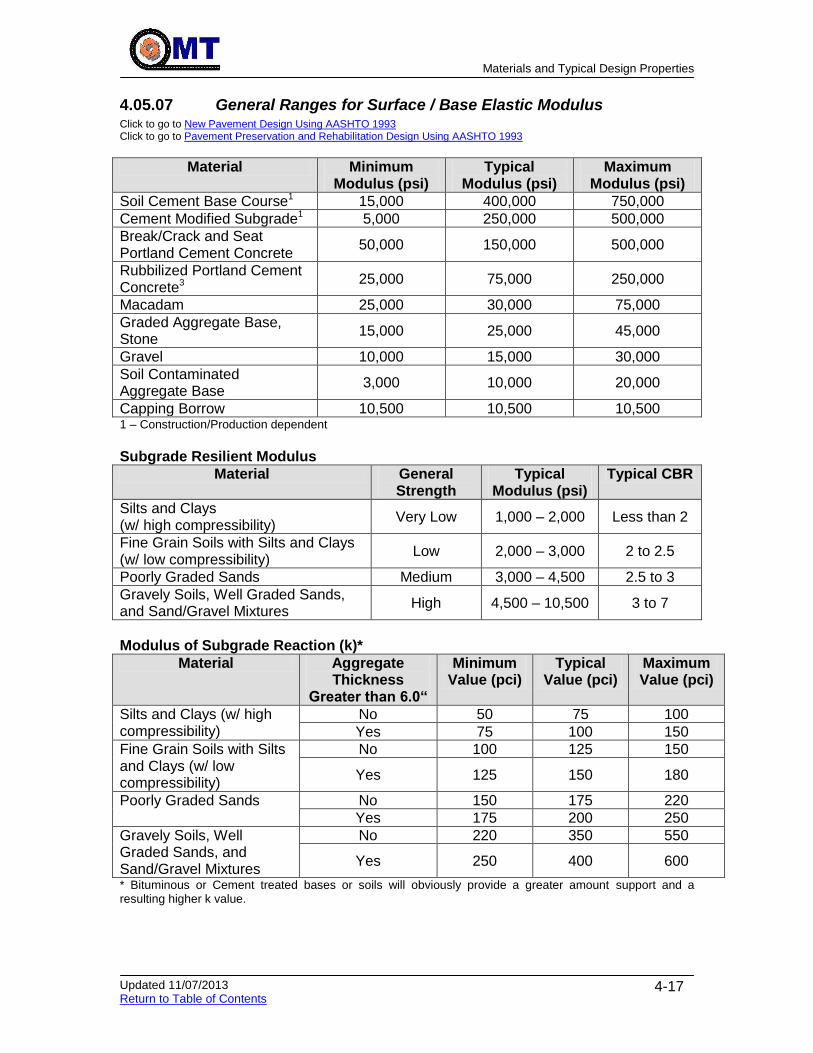
Materials and Typical Design Properties
Updated 11/07/2013 Return to Table of Contents
4-17
4.05.07 General Ranges for Surface / Base Elastic Modulus Click to go to New Pavement Design Using AASHTO 1993 Click to go to Pavement Preservation and Rehabilitation Design Using AASHTO 1993
Material Minimum Modulus (psi)
Typical Modulus (psi)
Maximum Modulus (psi)
Soil Cement Base Course1 15,000 400,000 750,000
Cement Modified Subgrade1 5,000 250,000 500,000
Break/Crack and Seat Portland Cement Concrete
50,000 150,000 500,000
Rubbilized Portland Cement Concrete3
25,000 75,000 250,000
Macadam 25,000 30,000 75,000
Graded Aggregate Base, Stone
15,000 25,000 45,000
Gravel 10,000 15,000 30,000
Soil Contaminated Aggregate Base
3,000 10,000 20,000
Capping Borrow 10,500 10,500 10,500 1 – Construction/Production dependent
Subgrade Resilient Modulus
Material General Strength
Typical Modulus (psi)
Typical CBR
Silts and Clays (w/ high compressibility)
Very Low 1,000 – 2,000 Less than 2
Fine Grain Soils with Silts and Clays (w/ low compressibility)
Low 2,000 – 3,000 2 to 2.5
Poorly Graded Sands Medium 3,000 – 4,500 2.5 to 3
Gravely Soils, Well Graded Sands, and Sand/Gravel Mixtures
High 4,500 – 10,500 3 to 7
Modulus of Subgrade Reaction (k)*
Material Aggregate Thickness
Greater than 6.0“
Minimum Value (pci)
Typical Value (pci)
Maximum Value (pci)
Silts and Clays (w/ high compressibility)
No 50 75 100
Yes 75 100 150
Fine Grain Soils with Silts and Clays (w/ low compressibility)
No 100 125 150
Yes 125 150 180
Poorly Graded Sands No 150 175 220
Yes 175 200 250
Gravely Soils, Well Graded Sands, and Sand/Gravel Mixtures
No 220 350 550
Yes 250 400 600
* Bituminous or Cement treated bases or soils will obviously provide a greater amount support and a resulting higher k value.

Materials and Typical Design Properties
Updated 11/07/2013 Return to Table of Contents
4-18
4.05.08 Geotextile Properties Click to go to Geotextiles/Geosynthetics (Geotextile)
Maryland Application Class
Type of Geotextile
Grab Strength
(lb) D 4632
Puncture Strength
(lb) D 4833
Permittivity (sec-1) D 4491
Apparent Opening
Size, Max (mm)
D 4751
Trapezoid Tear
Strength (lb)
D 4533
SD: Type I Woven, Monofilament
250 90 0.50 0.43 90
Nonwoven 160 56 0.50 0.43 55
SD: Type II Woven, Monofilament
250 90 0.20 0.25 90
Nonwoven 160 56 0.20 0.25 55
PE: Type I Woven, Monofilament
250 90 0.70 0.43 90
Nonwoven 200 80 0.70 0.43 80
PE: Type II Woven, Monofilament
250 90 0.20 0.25 90
Nonwoven 200 80 0.20 0.25 80
PE: Type III Woven, Monofilament
250 90 0.10 0.22 90
Nonwoven 200 800 0.10 0.22 80
SE Woven 250 90 0.02 0.30 90
Nonwoven 200 80 0.02 0.30 80
ST Woven 300* 110 0.05 0.15** 110
F Woven 100 -- 0.05 0.30 --
E Nonwoven 90 30 0.50 0.30 30 Note 1: All property values are based on minimum average roll values in the weakest principle direction, except apparent opening size Note 2: The ultraviolet stability shall be 50% after 500 hours of exposure for all classes, except Class F, which shall be 70%. (D 4355) *Minimum 15% elongation **This is a MINIMUM apparent opening size, not a maximum
4.05.09 Drainage Coefficient Factor – AASHTO 1993
The drainage coefficient or any variation of the structural coefficient based on saturation levels shall only be considered for unbound material layers. The drainage coefficient for bound materials shall be equal to one (1.0). MDSHA has adopted an approach to adjust the structural coefficient of unbound layers based on the saturation level rather than introduce a drainage coefficient. The following equations present the relation between the subgrade strength, degree of saturation, and material type to the structural coefficient of unbound layers. Graded Aggregate Base, Stone HMA Thickness <= 5.0” a2 = (0.14 + 0.0029 * (Subgrade (CBR)) + fs

Materials and Typical Design Properties
Updated 11/07/2013 Return to Table of Contents
4-19
HMA Thickness > 5.0” a2 = (0.14 + 0.0029 * (Subgrade (CBR)) – 0.035 + fs fs = 0.0 for dry conditions fs = -0.033 for wet conditions Gravel HMA Thickness <= 5.0” a2 = (0.08 + 0.0064 * (Subgrade (CBR)) + fs HMA Thickness > 5.0” a2 = (0.10 + 0.0021 * (Subgrade (CBR)) + fs fs = 0.0 for dry conditions fs = -0.046 for wet conditions Wet conditions are defined as when the unbound material is saturated more than 60% of the time. Based on the climatic conditions and the natural soils in Maryland, it is recommended to assume that wet conditions exist unless evidence can be provided to show that the unbound base is dry a majority of the time. These special cases would only exist where an open-graded base was used or in topographical conditions with good vertical drainage and clean sands/gravel exists for several feet beneath the top of subgrade.
4.06 GEOTECHNICAL DESIGN PROPERTIES For typical material properties of soils and aggregates, refer to the following references: 1. “Geotechnical Engineering Circular No. 5 - Evaluation of Soil and Rock
Properties”, FHWA-IF-02-034 2. Federal Highway Administration and National Highway Institute, “Geotechnical
Aspect of Pavements” FHWA NHI 132040. Section 5 3. For aggregate gradation requirements, refer to Section 901 of “Standard
Specifications for Construction and Materials, July 2008”
4. For typical material properties of geotextile, refer to Federal Highway Administration and National Highway Institute, “Geosynthetic Design and Construction Guidelines” FHWA HI-95-038.
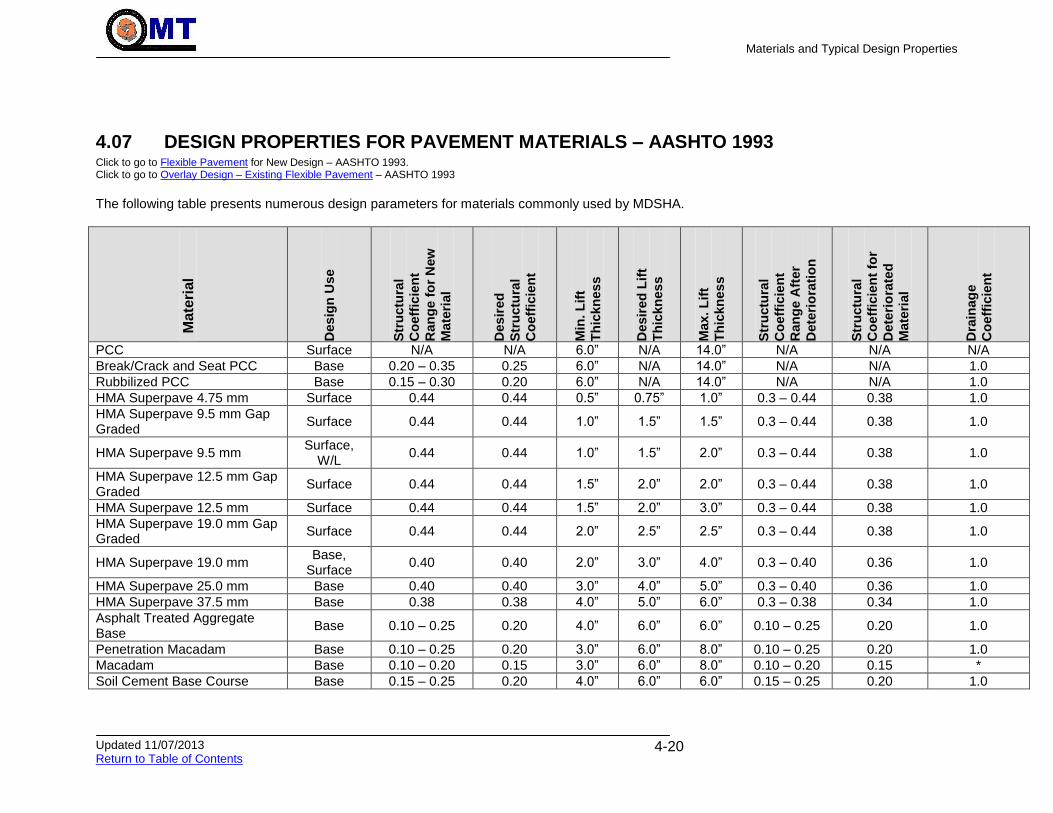
Materials and Typical Design Properties
Updated 11/07/2013 Return to Table of Contents
4-20
4.07 DESIGN PROPERTIES FOR PAVEMENT MATERIALS – AASHTO 1993 Click to go to Flexible Pavement for New Design – AASHTO 1993. Click to go to Overlay Design – Existing Flexible Pavement – AASHTO 1993 The following table presents numerous design parameters for materials commonly used by MDSHA.
M
ate
rial
Desig
n U
se
Str
uctu
ral
Co
eff
icie
nt
Ran
ge f
or
New
Mate
rial
Desir
ed
Str
uctu
ral
Co
eff
icie
nt
Min
. L
ift
Th
ickn
es
s
Desir
ed
Lif
t
Th
ickn
es
s
Max. L
ift
Th
ickn
es
s
Str
uctu
ral
Co
eff
icie
nt
Ran
ge A
fter
Dete
rio
rati
on
Str
uctu
ral
Co
eff
icie
nt
for
Dete
rio
rate
d
Mate
rial
Dra
inag
e
Co
eff
icie
nt
PCC Surface N/A N/A 6.0” N/A 14.0” N/A N/A N/A
Break/Crack and Seat PCC Base 0.20 – 0.35 0.25 6.0” N/A 14.0” N/A N/A 1.0
Rubbilized PCC Base 0.15 – 0.30 0.20 6.0” N/A 14.0” N/A N/A 1.0
HMA Superpave 4.75 mm Surface 0.44 0.44 0.5” 0.75” 1.0” 0.3 – 0.44 0.38 1.0
HMA Superpave 9.5 mm Gap Graded
Surface 0.44 0.44 1.0” 1.5” 1.5” 0.3 – 0.44 0.38 1.0
HMA Superpave 9.5 mm Surface,
W/L 0.44 0.44 1.0” 1.5” 2.0” 0.3 – 0.44 0.38 1.0
HMA Superpave 12.5 mm Gap Graded
Surface 0.44 0.44 1.5” 2.0” 2.0” 0.3 – 0.44 0.38 1.0
HMA Superpave 12.5 mm Surface 0.44 0.44 1.5” 2.0” 3.0” 0.3 – 0.44 0.38 1.0
HMA Superpave 19.0 mm Gap Graded
Surface 0.44 0.44 2.0” 2.5” 2.5” 0.3 – 0.44 0.38 1.0
HMA Superpave 19.0 mm Base,
Surface 0.40 0.40 2.0” 3.0” 4.0” 0.3 – 0.40 0.36 1.0
HMA Superpave 25.0 mm Base 0.40 0.40 3.0” 4.0” 5.0” 0.3 – 0.40 0.36 1.0
HMA Superpave 37.5 mm Base 0.38 0.38 4.0” 5.0” 6.0” 0.3 – 0.38 0.34 1.0
Asphalt Treated Aggregate Base
Base 0.10 – 0.25 0.20 4.0” 6.0” 6.0” 0.10 – 0.25 0.20 1.0
Penetration Macadam Base 0.10 – 0.25 0.20 3.0” 6.0” 8.0” 0.10 – 0.25 0.20 1.0
Macadam Base 0.10 – 0.20 0.15 3.0” 6.0” 8.0” 0.10 – 0.20 0.15 *
Soil Cement Base Course Base 0.15 – 0.25 0.20 4.0” 6.0” 6.0” 0.15 – 0.25 0.20 1.0

Materials and Typical Design Properties
Updated 11/07/2013 Return to Table of Contents
4-21
M
ate
rial
Desig
n U
se
Str
uctu
ral
Co
eff
icie
nt
Ran
ge f
or
New
Mate
rial
Desir
ed
Str
uctu
ral
Co
eff
icie
nt
Min
. L
ift
Th
ickn
es
s
Desir
ed
Lif
t
Th
ickn
es
s
Max. L
ift
Th
ickn
es
s
Str
uctu
ral
Co
eff
icie
nt
Ran
ge A
fter
Dete
rio
rati
on
Str
uctu
ral
Co
eff
icie
nt
for
Dete
rio
rate
d
Mate
rial
Dra
inag
e
Co
eff
icie
nt
Cement Modified Subgrade* Subbase 0.05 – 0.07 0.06 4.0” 6.0” 8.0” 0.05 – 0.07 0.06 1.0
Graded Aggregate Base, GAB Base 0.08 – 0.14 0.12 3.0” 6.0” 6.0” 0.08 – 0.14 0.11 *
Bank Run Gravel Base 0.06 – 0.12 0.10 3.0” 6.0” 6.0” 0.06 – 0.12 0.10 *
GSS w/ GAB Base 0.05 – 0.10 0.08 3.0” 6.0” 12.0” 0.05 – 0.10 0.08 *
Soil Contaminated Aggregate Base
Base 0.05 – 0.10 0.08 3.0” 6.0” 6.0” 0.05 – 0.10 0.08 *
Common Borrow Subbase 0.03 – 0.06 0.04 3.0” 6.0” 8.0” 0.03 – 0.06 0.04 *
Select Borrow Subbase 0.04 – 0.08 0.05 3.0” 6.0” 8.0” 0.04 – 0.08 0.05 *
Capping Borrow Subbase 0.04 – 0.08 0.06 3.0” 6.0” 8.0” 0.04 – 0.08 0.06 *
Modified Borrow Subbase 0.05 – 0.09 0.07 3.0” 6.0” 8.0” 0.05 – 0.09 0.07 *
* MDSHA has adopted an approach to adjust the structural coefficient of unbound base rather than introduce a drainage coefficient. The structural coefficient of the unbound layer is affected by the thickness of the overlying material and degree of saturation of the base layer. This section further describes this relationship between degree of saturation and the effect on structural coefficient.
Analysis Procedures
Section 01: Traffic Analysis
Updated 09/04/2013 Return to Table of Contents
5-1
5 ANALYSIS PROCEDURES Click to go to New Pavement Design Click to go to Pavement Preservation & Rehabilitation Design Click to go to New Pavement Design Using AASHTO 1993 Click to go to Pavement Preservation and Rehabilitation Design Using AASHTO 1993
5.01 TRAFFIC ANALYSIS
5.01.01 Purpose
Traffic Analysis is performed on new and rehabilitation pavement designs to:
Develop the expected traffic volumes for a pavement section
Develop the expected truck weight characteristics for a pavement section
Develop the expected cumulative number of trucks over the service life of a pavement section
Develop the expected ESAL for Superpave mix design information
5.01.02 Resource Requirements
The traffic analysis process documented below requires the following staffing needs for a typical job:
Position Function Resources Effort Level (man-hours)
Pavement Engineer Data Collection 1
4
Data QA
ADT Calculation
WIM Site Selection
Truck Factor Development
Future ESAL Calculation
Reference: Federal Highway Administration’s Traffic Monitoring Guide; discussion of vehicle classification system.
5.01.03 Procedure
The procedure described in the following text should be followed to perform traffic analysis. Numerous steps contained in this procedure can be completed within software applications that PAGD currently uses and has under development. The software application tools available to PAGD that can be principally used to complete traffic analysis at this time are AASHTOWare ME Pavement Design (MEPD) and other in-house programs. The following procedure was written to provide the design engineer with adequate information to complete a traffic analysis with access to these computer software applications.
5.01.03.01 Data Collection & QA
Retrieve required project-level traffic input data needed to initiate the traffic analysis process. This data is typically provided by the OPPE, Data Services Engineering Division (DSED). If project-level traffic input data is not provided by DSED, it needs to be requested. The traffic input data request is typically handled by the project owner, but on occasion PAGD may need to make a request. The type of project-level traffic input data needed is the following:
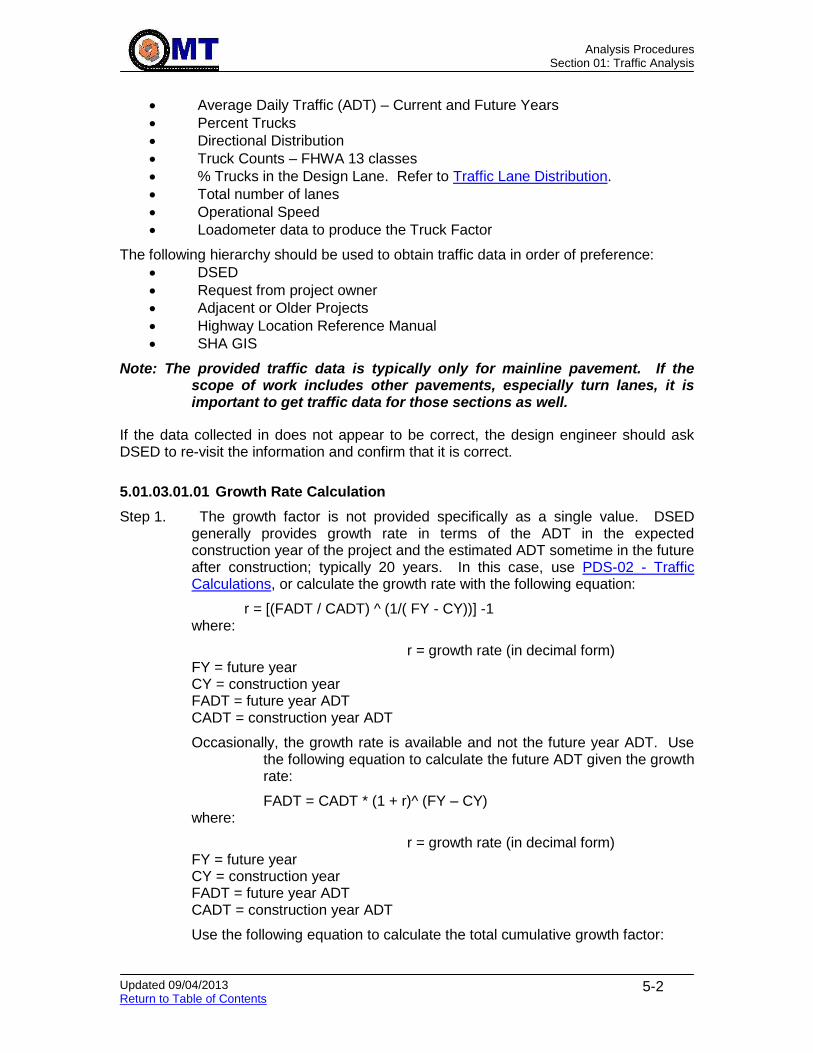
Analysis Procedures
Section 01: Traffic Analysis
Updated 09/04/2013 Return to Table of Contents
5-2
Average Daily Traffic (ADT) – Current and Future Years
Percent Trucks
Directional Distribution
Truck Counts – FHWA 13 classes
% Trucks in the Design Lane. Refer to Traffic Lane Distribution.
Total number of lanes
Operational Speed
Loadometer data to produce the Truck Factor
The following hierarchy should be used to obtain traffic data in order of preference:
DSED
Request from project owner
Adjacent or Older Projects
Highway Location Reference Manual
SHA GIS
Note: The provided traffic data is typically only for mainline pavement. If the scope of work includes other pavements, especially turn lanes, it is important to get traffic data for those sections as well.
If the data collected in does not appear to be correct, the design engineer should ask DSED to re-visit the information and confirm that it is correct.
5.01.03.01.01 Growth Rate Calculation
Step 1. The growth factor is not provided specifically as a single value. DSED generally provides growth rate in terms of the ADT in the expected construction year of the project and the estimated ADT sometime in the future after construction; typically 20 years. In this case, use PDS-02 - Traffic Calculations, or calculate the growth rate with the following equation:
r = [(FADT / CADT) ^ (1/( FY - CY))] -1 where:
r = growth rate (in decimal form) FY = future year CY = construction year FADT = future year ADT CADT = construction year ADT
Occasionally, the growth rate is available and not the future year ADT. Use the following equation to calculate the future ADT given the growth rate:
FADT = CADT * (1 + r)^ (FY – CY) where:
r = growth rate (in decimal form) FY = future year CY = construction year FADT = future year ADT CADT = construction year ADT
Use the following equation to calculate the total cumulative growth factor:

Analysis Procedures
Section 01: Traffic Analysis
Updated 09/04/2013 Return to Table of Contents
5-3
G = [((1 + r )^ (FY – CY)) – 1] / r where:
G = total cumulative growth factor r = growth rate (in decimal form) FY = future year CY = construction year
Responsible Party – Engineer
5.01.03.01.02 Truck Factor Development
While the truck factor (TF) is not used in any pavement design calculations in AASHTO’s MEPD, it is still needed to determine the cumulative 20-year ESALs to determine the correct HMA Superpave compaction level. Refer to Traffic Level Selection.
Use the loadometer data to identify the TF for flexible pavements. There is a TF corresponding to various structural numbers (SN). Use the following equations as approximate conversions of existing pavement thickness to SN:
HMA thickness x 0.4
PCC thickness x 1.0
GAB thickness x 0.12
Responsible Party – Engineer
5.01.03.02 Future Traffic Data Calculations
Step 1. Determine the Construction Year ADT for each of the 13 FHWA classes. This can be done by taking the current year ADT for each (as collected in Traffic Data Collection) and applying the growth rate.
Use PDS-02 - Traffic Calculations to input the current year ADT for each class, and the Construction Year ADT for each class will be calculated.
Responsible Party – Engineer
Step 2. Calculate the future cumulative ESAL applications using the following equation:
Cumulative ESAL = (CADT) * 365 * (%T) * (TF) * (G) * (D) * (L) where:
CADT = average daily traffic in construction year
%T = percent trucks TF = truck factor G = cumulative growth factor D = directional distribution L = Lane distribution
The cumulative growth factor (G) in the equation above is a function of the number of years into the future for the analysis, or design life of the pavement. Therefore, a different (G) must be calculated for each ESAL

Analysis Procedures
Section 01: Traffic Analysis
Updated 09/04/2013 Return to Table of Contents
5-4
design life needed in the pavement design process and then used in the equation above to develop the cumulative ESAL. The type of design lives needed for development of cumulative ESAL values are the Design Life for the HMA and the 20-year Superpave Mix Design ESAL. Use PDS-02 - Traffic Calculations to input the current year ADT for each class, and the Construction Year ADT for each class will be calculated.
Responsible Party – Engineer
Step 3. Determine the Traffic Capacity Cap. Use the following equation:
Number of lanes x 24hrs/day x 2600vehicles/lane/hour
Step 4. Place results of ESAL calculation and analysis inputs into project file in a summary sheet.
Responsible Party – Engineer
5.01.03.03 Traffic Analysis in MEPD Click to go to Pavement Mechanistic-Empirical Analysis
In the MEPDG software, several traffic inputs are required in the Traffic tab. The following sections detail the required inputs in each group.
5.01.03.03.01 AADTT
Under the AADTT section, all of the inputs are project-specific, and can be found on PDS-02 - Traffic Calculations.
5.01.03.03.02 Traffic Capacity Cap
Click on the down-arrow to bring up the dialog box. Click the Enforce Highway Capacity Limits checkbox to yes. Determine the Traffic Capacity Cap using the following equation:
Number of lanes x 24hrs/day x 2600vehicles/lane/hour
This is calculated on PDS-02 - Traffic Calculations. Click the User-Specified Capacity Limit checkbox to yes, and input the calculated Cap.
5.01.03.03.03 Axle Configuration
Use all of the provided defaults.
5.01.03.03.04 Lateral Wander
The Mean wheel location is taken from the pavement right edge. Use the mean and standard deviation provided defaults unless given specific information stating otherwise. Update the Design lane width as appropriate for the project.
5.01.03.03.05 Wheelbase
Use all of the provided defaults.
Analysis Procedures
Section 01: Traffic Analysis
Updated 09/04/2013 Return to Table of Contents
5-5
5.01.03.03.06 Identifiers
Use all of the provided defaults.
5.01.03.03.07 Vehicle Class Distribution and Growth
Input the Distribution % for each of Classes 4 through 13. The sum of these percentages must add to 100%, as they essentially are the distribution of truck traffic. This is calculated on PDS-02 - Traffic Calculations, under the column labeled “VCD%”. In addition, at least one of Classes 8 through 13 must be at least 1%.
In the absence of distribution data, use the default values by clicking on “”Load Default Distribution. This will bring up a window called Truck Traffic Classification (TTC) Groups.
Input the project’s growth rate for each Class. The Growth Function shall all be Compound.
5.01.03.03.07.1 Truck Traffic Classification (TTC) Groups
From the General category window, select the route type that most closely represents the roadway functional class at the project site. Choose the TTC that has a * next to it based on engineering judgment and the truck mix description. Once the TTC has been checked yes, review the Vehicle Class Distribution to ensure it is reasonable.
5.01.03.03.08 Monthly Adjustment
Use all of the provided defaults, unless monthly data is available. The sum of each column must equal 12.
5.01.03.03.09 Axles Per Truck
Use all of the provided defaults.
5.01.03.03.10 Axles Distribution
Use all of the provided defaults. The Single, Double, Tridem and Quad Axle Distributions are shown on the left side of the MEPG main screen, under the Traffic module. Simply double-click each Axle Distribution.
5.01.03.03.11 Hourly Adjustment (Composite pavements only)
Use the provided distribution percentage provide by DSED. If the provided defaults are within 75% of the values provided by DSED, it is acceptable to use the defaults.

Analysis Procedures
Section 02: FWD Data Analysis
Updated 09/06/2013 Return to Table of Contents
5-6
5.02 FWD DATA ANALYSIS PROCEDURE Click to go to Slab Stabilization Click to go to Pavement Preservation and Rehabilitation Design Using AASHTO 1993
5.02.01 Purpose & Resource Requirements
Refer to FWD Data Analysis Background.
5.02.02 Procedure
Refer to FWD Data Analysis Background for detailed discussion of the concepts of FWD testing and analysis. This section contains the steps necessary to complete FWD analysis using the Deflexus software.
Step 1. To begin the process of analyzing FWD data, open Deflexus, and import the project FWD data by clicking on the FWD link on the menu bar, then clicking on “Add FWD file” and importing the appropriate FWD data. SHA uses F25 files (Dynatest F25 files).
Step 2. In Deflexus, two grids appear on the left half of the screen. The top grid contains the FWD testing performed. Click on the FWD tests that need to be analyzed.
In the bottom grid (the Analyses List), right-click “Layer Modulus” then click on “AASHTO93 Flexible”.
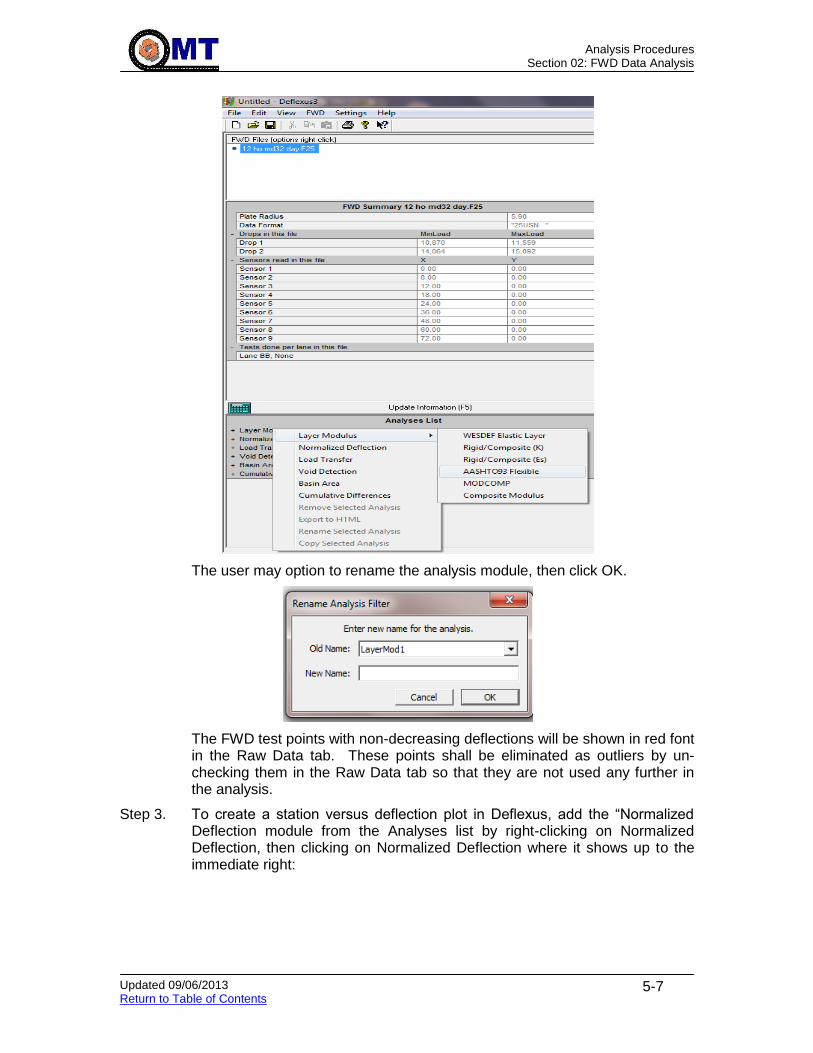
Analysis Procedures
Section 02: FWD Data Analysis
Updated 09/06/2013 Return to Table of Contents
5-7
The user may option to rename the analysis module, then click OK.
The FWD test points with non-decreasing deflections will be shown in red font in the Raw Data tab. These points shall be eliminated as outliers by un-checking them in the Raw Data tab so that they are not used any further in the analysis.
Step 3. To create a station versus deflection plot in Deflexus, add the “Normalized Deflection module from the Analyses list by right-clicking on Normalized Deflection, then clicking on Normalized Deflection where it shows up to the immediate right:

Analysis Procedures
Section 02: FWD Data Analysis
Updated 09/06/2013 Return to Table of Contents
5-8
Check the box for “AC Temperature Correction?” and enter “Layer Thickness 1”, which is the HMA thickness. Enter the Base Type. Check the box for “Bells3 AC Temp. Correction” and input the average air temperature from the air temperatures given in the Raw Data tab. Finally, hit F5 to update the information. Go to the “View Plot” tab in the grid on the right, and scroll through the various sensors.
Step 4. In Deflexus, add the “Composite Modulus” module, from right-clicking Layer Modulus:
Check the box for “Bells3 AC Temp. Correction” and input the average air temperature from the air temperatures given in the Raw Data tab. Next, click on “Edit Composite Modulus Layers” and input the pavement structure. Finally, hit F5 to update the information.
Go to the “View Plot” tab in the grid on the right, and scroll through the various stations. If there is a pattern of non-linear composite modulus plots, then consider eliminating the outermost sensors (i.e. sensor 9, 8, 7, etc.) so that the lowest modulus is used. The outermost sensors can be eliminated in the upper half of the left grid by un-checking the boxes:

Analysis Procedures
Section 02: FWD Data Analysis
Updated 09/06/2013 Return to Table of Contents
5-9
If there is no pattern of non-linear composite plots, but it occurs on just a few stations, consider eliminating those stations altogether.
Step 5. To create the normalized deflection plot in Deflexus, take the same steps as Step 2 to get the AASHTO93 layer modulus. Input the pavement structure by clicking on “Edit AASHTO93 Flexible Layers. Finally, hit F5 to save the updates. Go to the “View Plot” tab in the grid on the right to see the deflection plot.
Step 6. To create the cumulative sum plot, click on “Cumulative Differences” from the Analyses List.
Next, enter the beginning station in the “Start of Pavement” field in the upper half of the left grind. The beginning station can be found in the Raw Data tab. Finally, hit F5 to save the updates.

Analysis Procedures
Section 02: FWD Data Analysis
Updated 09/06/2013 Return to Table of Contents
5-10
Go to the “View Plot” tab in the grid on the right to see the cumulative sums plot. Review the plots for each sensor; it is quite possible that significant slope changes occur at different locations for the subgrade versus the surface. When this occurs, consider sectioning the pavement and subgrade separately.
To obtain the resilient modulus and composite pavement modulus for flexible pavements in Deflexus, take the same steps as Step 2 to get the AASHTO93 layer modulus. Check the box for “Bells3 AC Temp. Correction” and input the average air temperature from the air temperatures given in the Raw Data tab. Input the pavement structure by clicking on “Edit AASHTO93 Flexible Layers.
Finally, hit F5 to save the updates. This will display the analysis results and change the Update Information (F5) button from red to green.
Go to the “Calculated Data” tab to see the pavement modulus and resilient modulus, as well as any error comments. The “View Plot” tab shows these results graphically.
Step 7. To obtain the deflection data in Deflexus, right click in the Analyses List grid area and choose “Load Transfer”.
Next, in the Lane-Tests selected area, make sure that only Joint tests have a check mark.

Analysis Procedures
Section 02: FWD Data Analysis
Updated 09/06/2013 Return to Table of Contents
5-11
Finally, hit F5 to save the updates. This will display the analysis results and change the Update Information (F5) button from red to green.
On the “Calculated Data” tab, the “DD (mils)” column shows the difference in deflections between the loaded and unloaded sensors. Identify any locations with high deflections for repair. The “View Plot” tab can assist with this.
Step 8. To perform the void detection in Deflexus, right click in the Analyses List grid area and choose “Void Detection”.
Click to go to JPCP Layer Properties in the AC overlay over JCP section.
Location with high deflection difference

Analysis Procedures
Section 02: FWD Data Analysis
Updated 09/06/2013 Return to Table of Contents
5-12
Next, ensure that the “Void Threshold” is 2 mils then hit F5 to update. Go to the “Calculated Data” tab. Locations with voids are shown in the “Is Void” column.
Step 9. To obtain the PCC Elastic Modulus and Modulus of Subgrade Reaction in Deflexus, right click in the Analyses List grid area and choose “Layer Modulus”, then “Rigid/Composite (K).
Click to go to Foundation Support in the AC overlay over JCP section. Click to go to For the PCC Layer: in the AC overlay over JPCP section.
Next, in the Required Inputs area, provide the following:
Sensor Grouping: AS5
Number of Layers: 1 for rigid, 2 for composite pavements. Layer 1 is the bottom layer.
Input the layer thickness(es)
Input the Poisson ratio
Check the box for Interface Friction
Modular Ratio shall be 0.1
Check the box for Slab Correction
Input the slab width and length
The Dynamic to Static factor should be 0.5
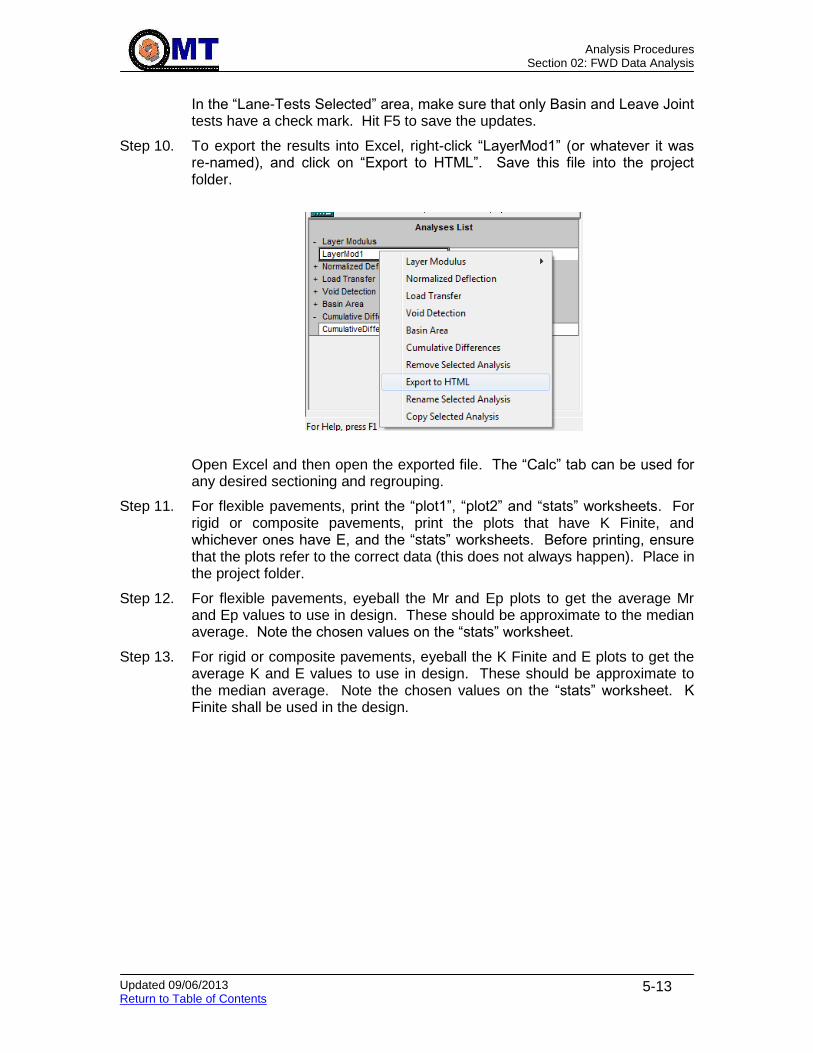
Analysis Procedures
Section 02: FWD Data Analysis
Updated 09/06/2013 Return to Table of Contents
5-13
In the “Lane-Tests Selected” area, make sure that only Basin and Leave Joint tests have a check mark. Hit F5 to save the updates.
Step 10. To export the results into Excel, right-click “LayerMod1” (or whatever it was re-named), and click on “Export to HTML”. Save this file into the project folder.
Open Excel and then open the exported file. The “Calc” tab can be used for any desired sectioning and regrouping.
Step 11. For flexible pavements, print the “plot1”, “plot2” and “stats” worksheets. For rigid or composite pavements, print the plots that have K Finite, and whichever ones have E, and the “stats” worksheets. Before printing, ensure that the plots refer to the correct data (this does not always happen). Place in the project folder.
Step 12. For flexible pavements, eyeball the Mr and Ep plots to get the average Mr and Ep values to use in design. These should be approximate to the median average. Note the chosen values on the “stats” worksheet.
Step 13. For rigid or composite pavements, eyeball the K Finite and E plots to get the average K and E values to use in design. These should be approximate to the median average. Note the chosen values on the “stats” worksheet. K Finite shall be used in the design.

Analysis Procedures
Section 03: Processing Boring/Laboratory Data
Updated 11/26/2013 Return to Table of Contents
5-14
5.03 PROCESSING BORING/LABORATORY DATA Click to go to Stormwater Management
This section presents the processing of the boring and laboratory data for conventionally advertised projects and Design-Build projects after the drilling and subsequent testing of soil samples is performed. Conventionally Advertised Projects (Design-Bid-Build): All projects where design is performed in-house or by the consultants working for the agency. Design typically includes wide range of services not limited to geotechnical investigations, pavement design, bridge design, embankments, sinkhole remediation, storm water management facilities design, and etc. After the designs are complete, the project is advertised for bidding and construction. Design-Build Projects: The Office of Highway Development (OHD) has explored the Design-Build method as a means to deliver projects to meet the demands of more projects, faster and within budget. This method of contracting also provides the benefits of shifting responsibility and risks to a single source -- the design-build team. The design-build method can shorten delivery project time; foster innovation and creativity in design and construction techniques reduce change orders, disputes and claims, and reduce the urge of the owner to make changes. Design-build can allow owners to know the total cost up front. For Design-Build projects, minimal geotechnical investigation is performed to know in advance if any uncertainties are involved which might increase the cost on bidding. Design is not performed by the Client (State) but the design staff reviews project designs submitted by the Design-Build team for compliance with standards and the project IFB. The construction management staff monitors the project to ensure safety, compliance with project criteria, and oversee the design-build teams public relations efforts and payment/progress records. Soils information obtained from borings should be part of the Contract Documents for use by the Contractor.
5.03.01 Format – Soil Classifications
This section involves the different soil classification methods used in Maryland for highway related projects. Generally, AASHTO (American Association of State Highway Transportation Official) soils classification is preferred in classifying soils for highway related project as it is widely accepted and used in the Highway Industry. See AASHTO Soil Classification for soils classifications based on gradations, and index properties. USDA (United States Department of Agriculture) method of soil classification is another method which is widely used in design of Storm Water Management Facilities. See USDA Soil Classification for soils classifications based on typical grading. USCS (Unified Soil Classification and Symbol) method of soil classification is another method which is widely used. See USCS Soil Classification for soils classifications based on typical grading and index properties.
Analysis Procedures
Section 03: Processing Boring/Laboratory Data
Updated 11/26/2013 Return to Table of Contents
5-15
MDSHA previously used the MSMT (Maryland Standard Method of Tests) Soils and Soil-Aggregate Mixtures Guide to Classifications for classifying the soils but is now using AASHTO soil classification. MSMT Classification is still included in archived project files and as-built plans. See MSMT Soil Classification for more information.
5.03.02 gINT Instructions
General
The gINT software is used by MDSHA to store and reproduce the soil information pertaining to a particular project. The soil information contains soil borings, foundation borings, SWM boring, and the lab testing data. Ensure you have the latest gINT software and the template installed on your computer. Refer to Reference Guidelines for assistance in entering the soil information into gINT software.
5.03.03 Soil Survey Boring Log Summary Sheets – Conventionally Advertised Projects
Design of conventionally advertised projects is generally done in-house or by use of consultants by the respective divisions. This following table provides general guidelines in reporting the soils information (format) to the PM (client) for conventionally advertised projects. This soils information is obtained by auger boring and is usually done when there is base-widening or new construction or for SWM facilities. Auger borings (soil and pavement typicals) are performed by Soil Survey Crew of FED. Roadway coring is performed by the FED’s SPID crew.
*Guidelines on how to input soil boring information in gINT is described in VIII.B Note: The PAGD Engineer should emphasize the importance of having boring information in gINT format. Borings from gINT file can be transferred onto the plan sheets (profiles) which are archived when the project is complete. Soil Boring Log Summary Sheets are included in the Invitation for Bids book, which are not archived and hence cannot be accessed in future. If a project has only roadway coring (ex: Fund 77 – Single Ad, pavement rehabilitation projects), the information transmitted to the PM should be in excel format as provided by SPID with some modifications. Refer to the “Coring Log” in Appendix V for an example transmittal of roadway coring information.
Project Origination Division Transmittal Type
OHD, OOS, District Office
If the PM agrees to using gINT
Input borings in gINT* and electronically send to PM.
If the PM does not agree to gINT
Input borings in Soil Boring Log Summary (See Appendix V).

Analysis Procedures
Section 03: Processing Boring/Laboratory Data
Updated 11/26/2013 Return to Table of Contents
5-16
5.03.04 Soil Survey Borings – Design-Build Projects
Soil survey borings drilled by MDSHA should be entered in gINT, Refer to gINT Instructions. The soil borings are then printed using the attachment Guidelines for using Microsoft Excel Macro for soil survey borings (refer to Reference Guidelines). After printing, review individual soil boring with the original soil boring logs for any correction. The final soil survey borings should be included as part of the Contract Document. The Design-Builders should plot all soils information provided by MDSHA as well as their own soils information on the Contract Documents for submittal to MDSHA for review.
5.03.05 Structure Borings - Conventionally Advertised Projects
Design of conventionally advertised projects is generally done in-house or by use of consultants by the respective divisions. This soils information is obtained by SPT boring and is usually done when Structures are included in the project scope. The borings may be drilled using in-house resources or by using consultant drilling contract services. During the drilling process, draft copies of the boring logs (already drilled) should be transmitted by fax or e-mail (scanned copy) to the requesting office to facilitate the design process. Once all the borings are completed, FED personal will enter the boring information in gINT software and provide a completed boring log in gINT format. If requested, FED will provide the boring logs in BLOG format too. BLOG is the format which the OOS uses in plotting the boring information onto the plans. This following table provides general guidelines in reporting the soils information (format) to the PM (client) for conventionally advertised projects.
*Remove the drillers name from the final boring log copy sent to PM to be included in Contract Documents. Note: The PAGD Engineer should emphasize the importance of having boring information transferred onto the plan sheets (profiles or on separate sheet) and not into the Invitation for Bids (IFB) Book. If the soils information is included in the IFB as part of the Contract Documents, it is not accessible in the future once the project is complete.
5.03.06 Structure Borings – Design-Build Projects
Structure borings drilled by MDSHA should be entered in gINT, Refer to gINT Instructions. The borings are then printed using gINT. After printing, review individual
Project Origination Division Transmittal Type
OOS Save the BLOG file on S:Drive and e-mail the link to PM
OHD Pdf file of gINT boring logs*
District Office (rarely) Pdf file of gINT boring logs*

Analysis Procedures
Section 03: Processing Boring/Laboratory Data
Updated 11/26/2013 Return to Table of Contents
5-17
structure boring with the original structure boring log for any correction. The final structure borings should be included as part of the Contract Document. The Design-Builders should to plot all soils information provided by MDSHA as well as their own soils information on the Contract Documents for submittal to MDSHA for review.
5.03.07 Laboratory Data – Design-Build Projects
The laboratory data for Design-Build projects can be done in following two ways: 1. Laboratory data drilled by MDSHA and entered in gINT. The laboratory data
is then printed using the attachment Guidelines for Using Microsoft Excel Macro for laboratory data (refer to Reference Guidelines). After printing, review the laboratory data with the original data for any correction. The final laboratory data should be included as part of the Contract Document.
2. The Design-Builder should submit all laboratory data to MDHSA for review as
part of the submittal.
5.03.08 Environmental Water/Soil Samples Data
General
Chemical tests are performed to alert the PM about the soil and water problems which will require special treatment by the Contractor. Usually tests are performed on the samples retrieved from any areas on the project where construction will cause a change in the soils that are in contact with existing waters. Listed below are the typical chemical tests performed on water samples: pH, Conductivity, Chlorides, Sulfates, Fluorides, Phosphates, Nitrates, Dissolved Solids, Suspended Solids, Turbidity, Aluminum, Iron, Sodium, Calcium, Manganese, Magnesium and etc,. Listed below are the typical chemical tests performed on soil samples: pH, ORG%, Corrosivity, Resistivity and etc. All test results should be tabulated in an MS-Excel Sheet or in MS-Word corresponding to the location and depth of the sample and be transferred to the PM to be included in the Contract Documents. Refer to Example Memos for examples.
Analysis Procedures
Section 04: Geotechnical Data Analysis
Updated 11/26/2013 Return to Table of Contents
5-18
5.04 GEOTECHNICAL DATA ANALYSIS
5.04.01 QA/QC of Field and Laboratory Data
5.04.01.01 Purpose QA/QC of Field and Laboratory Data is conducted to verify all the information requested was obtained and is correct in order to perform design and provide recommendations.
Verify with the project plans to determine if the boring and lab testing data is sufficient for the design and the recommendations. If not, request additional soil borings and or lab testing after discussion with the PAGD TL and the PAGD ADC-Design.
Verify soils classified by the driller correspond with the laboratory test results.
5.04.01.02 Resource Requirements The QA/QC of Field and Laboratory Data procedure documented below requires the following staffing needs for a typical project:
Position Function Resources Effort Level (man-hours)
PAGD Engineer Review soil boring logs and laboratory results
1 2*
PAGD Engineer Follow up with drillers or lab for data
1 2*
* The time required would vary depending on the size and complexity of a project.
5.04.01.03 Procedure The procedure presented in the attached flowchart and described in the following text should be followed for a typical project in QA/QC of Field and Laboratory Data. The following procedure was written to provide the design engineer with adequate information to complete a typical QA/QC of Field and Laboratory Data procedure without specific knowledge or access to computer software applications, but with the assumption that these tools were available. QA/QC of Field and Laboratory Data begins when the PAGD engineer receives the soil boring logs from the driller and related laboratory test results. Follow the steps below to complete the QA/QC of Field and Laboratory Data:
Step 1. Compare the field boring logs with the laboratory test results and staple like
copies together. Step 2. Using a green pencil, make corrections to the field boring log sheets based
on information obtained from the laboratory results.
Step 3. The following information should be transferred onto the soil boring log
sheets from lab test results. i. AASHTO Soil Class ii. Input LL and PI

Analysis Procedures
Section 04: Geotechnical Data Analysis
Updated 11/26/2013 Return to Table of Contents
5-19
iii. Input USDA Soil Class (If any) iv. Input Moisture Content (If any). Note saturated or liquefied
conditions if moisture samples were not obtained. v. Determine if gravel (MSMT) is present based on the following:
a. If more than 10% is retained on the #4 sieve, then, note as: Soil Type “w/ Gravel” or “w/ Rock Fragments”
b. If more than 50% is retained on the #4 sieve, then, note as : “Gravel w/” or “Rock Fragments w/” Soil Type
vi. Input Proctor Test Results (if any). Proctor tests are run only if the field boring logs are marked for Proctors. Usually T-180 is the test performed on bulk (bag) samples retrieved. However, in cases of very fine grained soils and clays, T-99 may be run and the results should be used with discretion.
Step 4. If Topsoil samples were obtained ensure that lab tests have been performed
on those samples for pH, Organic Content and USDA Classification. For topsoil samples, no tests are required for Atterberg Limits, and AASHTO or MSMT soil classification.
Step 5. If soil samples were obtained for chemical testing, ensure that lab tests have
been performed for pH, Sulfates, Chlorides, and Resistivity. In some cases the laboratory may perform soil classification testing.
Step 6. If water samples were obtained for chemical testing, ensure that lab tests
have been performed for Aluminum, Calcium, Iron, Magnesium, Manganese, Sodium, Sodium Chloride, Chloride, Dissolved Solids, Fluoride, Detergent, Nitrate, pH, Phosphate, Sulfate, Suspended Solids, and Turbidity.
5.04.02 Surface and Subsurface Conditions Click to go to Geotextiles/Geosynthetics (Geotextile)
Surface and Subsurface Conditions are included in the Final Geotechnical Report (FGR). The following are the typical topics addressed in the FGR; soil conditions, moisture conditions, rock conditions, special areas and treatment, swamps, low saturated areas, and active springs.
5.04.02.01 Purpose Soil information (soil types and moisture conditions) are submitted to the PM to show the basis for the recommendations. This data is also included in the Contract Documents to provide the Contractor an insight into conditions to be expected on the project.
5.04.02.02 Resource Requirements Surface and Subsurface Conditions procedure documented below requires the following staffing needs for a typical project:
Analysis Procedures
Section 04: Geotechnical Data Analysis
Updated 11/26/2013 Return to Table of Contents
5-20
Position Function Resources Effort Level (man-hours)
PAGD Engineer Review boring logs, lab data, QA/QC of lab data
1 4*
PAGD Engineer Plot soil boring information on roadway plan sheets and cross-
sections
1 4*
* The time required would vary depending on the size and complexity of a project.
5.04.02.03 Procedure The procedure presented in the attached flowchart and described in the following text should be followed for a typical project in analyzing Surface and Subsurface Conditions. The following procedure was written to provide the design engineer with adequate information to complete a typical Surface and Subsurface Conditions procedure without specific knowledge or access to computer software applications, but with the assumption that these tools were available.
Surface and Subsurface Conditions begins when the PAGD Engineer receives the soil boring logs from the driller and related laboratory test results.
Follow the steps below to complete Surface and Subsurface Conditions:
Step 1. Review soil boring logs and relative laboratory test results to find the predominant soils, moisture contents of the soils, ground water levels, soft cohesive soils, muck, low wet areas, springs, topography tabulation, other notable conditions like, surface dumps, unconsolidated fills, existing wells, underground storage tanks, petroleum contaminated soils, and rock encountered if any within the project limits.
Step 2. After reviewing the boring logs and relative laboratory test results, determine the predominant soils in cuts, fills and at proposed subgrade. There can be more than one predominant soils encountered within the project limits.
Step 3. Diatomaceous and river bottom material (A-6) encountered at locations and depths shown on the soil plans should not be permitted as embankment material within the limits of the roadway typical section. Note this in a Special Provision (SP). Soils with a Maximum Dry Density less than 100 pounds per cubic foot (pcf) should not be used as embankment material and should be noted in the FGR and in SP.
Step 4. If very fine grained soils (clay and clayey silts) are encountered throughout the project site, during the field investigation, then compaction difficulties should be expected due to the high percentage of fine grained soils and their inherent water retention characteristics. In such cases, an adjustment to the compaction requirements and/or moisture tolerance may be required and stated in the Specifications.
Step 5. If SPT borings reveal cohesive soils (with N values < 4 bpf) below the finished subgrade, settlement of the structures (roadway embankments, bridge approaches, etc.) may occur. Stability and settlement analysis may be warranted (See VI.C and VI.D). The treatment of these areas should be noted in the FGR and in a SP.
Step 6. If A-5 micaceous silt with moisture content above optimum moisture content with high water table is noted, it should be anticipated that soil and moisture
Analysis Procedures
Section 04: Geotechnical Data Analysis
Updated 11/26/2013 Return to Table of Contents
5-21
conditions will present construction difficulties which cannot be completely avoided or corrected, irrespective of final grade or construction restrictions. This should be noted in the FGR and the Contractor should be alerted of this situation via a SP.
Step 7. If high groundwater tables occur throughout the project, locations and depths should be reported. Also, the moisture conditions of the soils within the project limits should be reported (ex. below optimum to liquified). Based on the data from borings, groundwater may or may not impact the excavation with an exception of some isolated areas. Provisions for drainage, drying of wet materials and wasting of some excavation should be considered. The Contractor should be alerted of the situation in an SP attached with the report. A percentage of the total Class 1 Excavation should be treated as unsuitable material for embankment construction due to high moisture contents and wasted.
Step 8. Swamp areas encountered within the project limits are investigated to the
depths and limits of A-8 muck. This information should be shown on the plans, noted in the FGR and used as a basis for recommendations; and in the case where material is to be wasted, to assist the PM in adjusting quantities.
Considerations: Muck Removal: When swamp removal is recommenced due to the presence of A-8 muck or unsuitable material (the usual procedure), the soil report should include length, width and depth of the removal as well as clas-sifications of removal: Class 1 Excavation or Class 1-A Excavation and Backfill Material. This area should be plotted on the roadway plans and the FGR should also include a sketch showing details of cross-section removal and backfilling. Surcharge: When economics is a prime consideration and deposition of existing material is extensive to a depth that is not practical for excavation and removal, it may be feasible and desirable to surcharge the muck and program the settlement as indicated by consolidation tests. Periodic checks can be made in the subsequent construction through readings on settlement plates.
Step 9. Low saturated areas encountered during the field investigation may require undercutting or other special treatment and should be noted and addressed in the FGR and in a SP.
Step 10. Active spring locations encountered during the field investigation may require
increasing the quantity of underdrain pipe for spring control and should be noted and addressed in the FGR and in a SP. A note should be placed on the plans identifying the locations of active springs.
Step 11. Topsoil:
The following criteria should be followed to report if Topsoil may be salvaged or not:
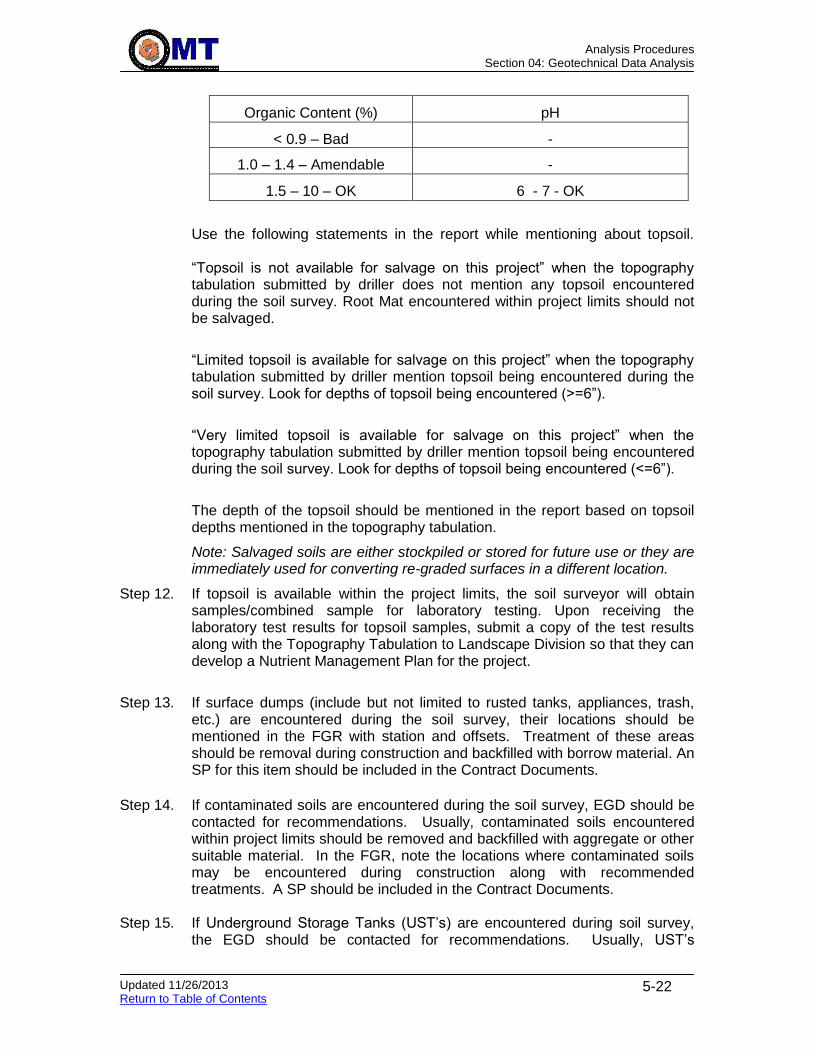
Analysis Procedures
Section 04: Geotechnical Data Analysis
Updated 11/26/2013 Return to Table of Contents
5-22
Organic Content (%) pH
< 0.9 – Bad -
1.0 – 1.4 – Amendable -
1.5 – 10 – OK 6 - 7 - OK
Use the following statements in the report while mentioning about topsoil. “Topsoil is not available for salvage on this project” when the topography tabulation submitted by driller does not mention any topsoil encountered during the soil survey. Root Mat encountered within project limits should not be salvaged.
“Limited topsoil is available for salvage on this project” when the topography tabulation submitted by driller mention topsoil being encountered during the soil survey. Look for depths of topsoil being encountered (>=6”).
“Very limited topsoil is available for salvage on this project” when the topography tabulation submitted by driller mention topsoil being encountered during the soil survey. Look for depths of topsoil being encountered (<=6”).
The depth of the topsoil should be mentioned in the report based on topsoil depths mentioned in the topography tabulation.
Note: Salvaged soils are either stockpiled or stored for future use or they are immediately used for converting re-graded surfaces in a different location.
Step 12. If topsoil is available within the project limits, the soil surveyor will obtain samples/combined sample for laboratory testing. Upon receiving the laboratory test results for topsoil samples, submit a copy of the test results along with the Topography Tabulation to Landscape Division so that they can develop a Nutrient Management Plan for the project.
Step 13. If surface dumps (include but not limited to rusted tanks, appliances, trash,
etc.) are encountered during the soil survey, their locations should be mentioned in the FGR with station and offsets. Treatment of these areas should be removal during construction and backfilled with borrow material. An SP for this item should be included in the Contract Documents.
Step 14. If contaminated soils are encountered during the soil survey, EGD should be
contacted for recommendations. Usually, contaminated soils encountered within project limits should be removed and backfilled with aggregate or other suitable material. In the FGR, note the locations where contaminated soils may be encountered during construction along with recommended treatments. A SP should be included in the Contract Documents.
Step 15. If Underground Storage Tanks (UST’s) are encountered during soil survey,
the EGD should be contacted for recommendations. Usually, UST’s

Analysis Procedures
Section 04: Geotechnical Data Analysis
Updated 11/26/2013 Return to Table of Contents
5-23
encountered within project limits should be removed and backfilled with aggregate or other suitable material. In the FGR, note the locations where UST’s may be encountered during construction along with recommended treatments. A SP should be included in the Contract Documents.
Step 16. If existing wells are encountered during soil survey, the EGD should be
contacted for recommendations for wells which may be impacted by construction. Well may be backfilled and abandoned or removed. These recommendations should be noted in the FGR with the locations of the wells. A SP should be included in the Contract Documents.
Step 17. If soil borings reveal rock at subgrade level or at shallower depths, mention
the number of borings where rock is encountered along with the depths (elevations) in the FGR. Also, mention the type of rock encountered (Auger Refusal or Rock Penetrated by Power Soil Auger (RPPSA)). Contact the EGD if rock is encountered on the project. Review the boring logs to verify if the presence of rock (elevations) will impact the proposed roadway construction within the project limits. If the rock encountered impacts roadway construction, methods for removal should be provided in the FGR. Depending on the rock conditions, rock may be excavated with conventional equipment or methods such as blasting or jack hammering. A SP noting where rock is encountered and the methods for removal should be included in the Contract Documents.
Special attention should be given to the cut slope areas revealing rock at the limits of slope. It may be necessary to submit recommendations on special cut slopes and benching. Contact the EGD for further recommendations.
Step 18. If Johnsongrass has been identified in the vicinity of the project, Topsoil and
root mat contaminated with Johnsongrass should be buried within roadway embankment or other suitable on-site location approved by the Engineer. Johnsongrass contaminated topsoil or root mat should not be buried within stormwater management pond embankment. If buried within roadway embankment, contaminated material should be placed at least 8 ft below the Top of Subgrade with a minimum of 2 ft cover of uncontaminated material on embankment side slopes. Contaminated material should be placed in maximum 6 in. layers with alternating layers of a minimum of 6 in. of uncontaminated material. Compaction of the contaminated material should be to the satisfaction of the Engineer. Uncontaminated material should be compacted to Specification requirements. If buried at an approved, on-site, non-roadway embankment location, the contaminated material should be covered with at least 2 ft of uncontaminated soil. The presence of Johnson grass should be noted in the FGR and a SP addressing Johnsongrass should be included in the Contract Documents.
Step 19. Check if expansive soils or soils with swell potential (Refer to Federal
Highway Administration and National Highway Institute, “Geotechnical Aspect of Pavements” FHWA NHI 132040) are present within the project limits. These soils may require undercutting or other special treatment and should be noted and addressed in the FGR and in a SP.

Analysis Procedures
Section 05: Pavement ME Analysis
Updated 11/07/2013 Return to Table of Contents
5-24
5.05 PAVEMENT MECHANISTIC-EMPIRICAL ANALYSIS Click to go to New Pavement Design Click to go to Pavement Preservation & Rehabilitation Design Click to go to Application for Removal (Milling/Grinding) Click to go to Remaining Service Life Analysis Click to go to Preliminary Pavement Recommendation
5.05.01 Purpose
Pavement Mechanistic-Empirical (ME) Analysis is conducted to determine the future structural and functional performance of a pavement structure over time. ME analysis and design can be used interchangeably, to also be known as pavement ME design (PMED).
Prior to the implementation of PMED, the pavement design methodology involved treating design life as an input, and pavement thickness needed to meet that life was an output. With PMED, the pavement structure is an input, and performance over time is the output. The following analyses are contained herein:
Flexible Pavements
Jointed Plain Concrete Pavement
Continuous Reinforced Concrete Pavement
Asphalt Overlay over JCP
Asphalt Overlay over CRCP
JPCP Restoration These analyses can be used for both new design and rehabilitation or preservation design, as the procedures for new versus existing are very similar.
5.05.02 Resource Requirements
The pavement ME analysis procedure documented below requires the following staffing needs for a typical job:
Position Function Resources Effort Level (man-hours)
Pavement Engineer Data Analysis 1 16
5.05.03 Procedure
The procedure described in the following text should be followed in a typical pavement analysis. Reference to specific design inputs for analysis can be located in Design Input Policies. The following procedure was written to provide the design engineer with adequate information to complete a new design using PMED. For pavement designs using AASHTO 1993 procedures (such as for Design-Build), refer to New Pavement Design Using AASHTO 1993 or Pavement Preservation and Rehabilitation Design Using AASHTO 1993.
With the AASHTO 1993 methodology, a required structural value was the output that could be used by the engineer to develop a pavement section. With the PMED methodology, the engineer will have to develop a pavement section independently
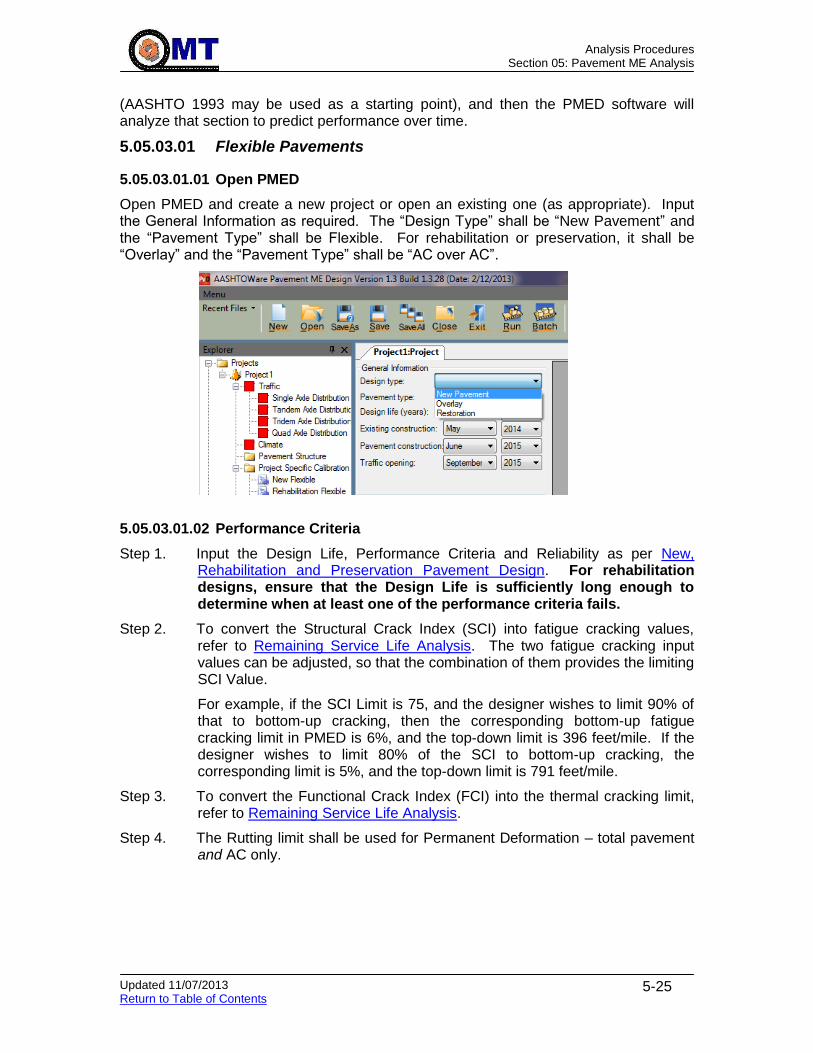
Analysis Procedures
Section 05: Pavement ME Analysis
Updated 11/07/2013 Return to Table of Contents
5-25
(AASHTO 1993 may be used as a starting point), and then the PMED software will analyze that section to predict performance over time.
5.05.03.01 Flexible Pavements
5.05.03.01.01 Open PMED
Open PMED and create a new project or open an existing one (as appropriate). Input the General Information as required. The “Design Type” shall be “New Pavement” and the “Pavement Type” shall be Flexible. For rehabilitation or preservation, it shall be “Overlay” and the “Pavement Type” shall be “AC over AC”.
5.05.03.01.02 Performance Criteria
Step 1. Input the Design Life, Performance Criteria and Reliability as per New, Rehabilitation and Preservation Pavement Design. For rehabilitation designs, ensure that the Design Life is sufficiently long enough to determine when at least one of the performance criteria fails.
Step 2. To convert the Structural Crack Index (SCI) into fatigue cracking values, refer to Remaining Service Life Analysis. The two fatigue cracking input values can be adjusted, so that the combination of them provides the limiting SCI Value.
For example, if the SCI Limit is 75, and the designer wishes to limit 90% of that to bottom-up cracking, then the corresponding bottom-up fatigue cracking limit in PMED is 6%, and the top-down limit is 396 feet/mile. If the designer wishes to limit 80% of the SCI to bottom-up cracking, the corresponding limit is 5%, and the top-down limit is 791 feet/mile.
Step 3. To convert the Functional Crack Index (FCI) into the thermal cracking limit, refer to Remaining Service Life Analysis.
Step 4. The Rutting limit shall be used for Permanent Deformation – total pavement and AC only.

Analysis Procedures
Section 05: Pavement ME Analysis
Updated 11/07/2013 Return to Table of Contents
5-26
5.05.03.01.03 Traffic Click to go to Traffic in the JPCP section. Click to go to Traffic in the CRCP section. Click to go to Traffic in the AC overlay over JCP section. Click to go to Traffic in the AC overlay over CRCP section.
Double-click on the “Traffic” button in the left menu, and enter all of the traffic information as per Traffic Analysis in MEPD. Once traffic is complete, all of the traffic items should have a green circle.
5.05.03.01.04 Climate Click to go to Climate in the JPCP section. Click to go to Climate in the CRCP section. Click to go to Climate in the AC overlay over JCP section. Click to go to Climate in the AC overlay over CRCP section.
Step 1. Double-click on the “Climate” button in the left menu.
Step 2. Obtain the latitude, longitude and elevation information from Google Earth or similar.

Analysis Procedures
Section 05: Pavement ME Analysis
Updated 11/07/2013 Return to Table of Contents
5-27
Step 3. The water table depth can be obtained from USGS groundwater watch and clicking on the Google Earth version to access water tables by location. This can be used in conjunction with boring information to determine the annual water table.
Step 4. Weather Stations: If the project is close to a weather station, if is sufficient to use one station. If the project is not close, use the “Create a virtual weather station”. Check the boxes for the weather stations that will be used. When determining which stations to use, judge relevance by distance and elevation. In addition, refer to Climatic_Stations.xlsx to determine which stations have complete data.
Step 5. Once climate is complete, it should be shown with a green circle.
5.05.03.01.05 AC Layer Properties
Double-click on the “AC Layer Properties” button.
5.05.03.01.05.1.1 AC Layer Properties. Click to go to AC Layer Properties in the AC overlay over JPCP section. Click to go to AC Layer Properties in the AC overlay over CRCP section.
Step 1. AC surface shortwave absorptivity: Use the default value.
Step 2. Endurance Limit applied: Make False.
Step 3. Endurance limit: Use the default value.
Step 4. Layer Interface: For new pavement, give 1. For rehabilitation or preservation design, the “Layer Interface” should be adjusted based on the bond between existing layers. Click on the dropdown arrow to the right, and give 0 for no bond, 1 for full bond, and somewhere between for partial bond, which can be estimated based on core results and percentage of low severity alligator cracking in the wheel paths.

Analysis Procedures
Section 05: Pavement ME Analysis
Updated 11/07/2013 Return to Table of Contents
5-28
5.05.03.01.05.1.2 Rehabilitation.
Step 1. Condition of existing flexible pavement: Choose:
a. Level 1 if FWD is available;
b. Level 2 is FWD is not available or if you feel the % fatigue cracking should control;
c. Level 3 if FWD is not available and % fatigue cracking should not control the design.
Step 2. Click on the dropdown arrow to the right.
a. Input the milled thickness, if applicable
b. Input the rut depth of the surface only. If any layers get removed from grinding, the rut depth of the newly exposed surface will be zero.
c. If Level 2 is chosen, input the % fatigue cracking, combining all severity levels.
d. If Level 3 is chosen, input the general pavement condition.
5.05.03.01.06 Pavement Structure
Click in the asphalt picture to edit the asphalt layer. For each layer under the AC surface
layer, click on the green +++ button to add a layer. For the subgrade, choose the AASHTO
description provided by the lab results. Ensure that AASHTO, not MSMT, descriptions are used.
5.05.03.01.06.1 For each AC Layer: Click to go to For each AC Layer: in the AC overlay over JPCP section. Click to go to For each AC Layer: in the AC overlay over CRCP section.
5.05.03.01.06.1.1 Asphalt Layer: Enter the surface layer thickness.

Analysis Procedures
Section 05: Pavement ME Analysis
Updated 11/07/2013 Return to Table of Contents
5-29
5.05.03.01.06.1.2 Mixture Volumetrics:
Step 3. Unit Weight: Use the default value. Refer to HMA Unit Weight.
Step 4. Effective binder content (%): Depends on the mix, refer to Aggregate Gradation and Volumetric Properties. These should be used only if Level 1 data is not available. These are sensitive inputs, so level 1 is recommended.
Step 5. Air void (%): Depends on the mix, refer to Aggregate Gradation and Volumetric Properties. These should be used only if Level 1 data is not available. These are sensitive inputs, so level 1 is recommended.
Step 6. Poisson’s ratio: Use the default value. Refer to Poisson Ratio.
5.05.03.01.06.1.3 Mechanical Properties: Click to go to Thermal Cracking in the AC overlay over JPCP section.
Refer to Recommended Thermal Cracking Inputs for new HMA Layers
Step 1. Dynamic Modulus (E*): Leave as Level-3. Click on the dropdown to the right, and adjust the gradation to match the chosen mix type if the provided gradation is not within 75% of the gradation as per Aggregate Gradation and Volumetric Properties.
Step 2. Select HMA E* predictive model: Use the default value. Make G* false.
Step 3. Reference Temperature: Use the default value.
Step 4. Asphalt Binder: Enter the PG binder. For existing AC pavement that is not Superpave, assume PG 64-22.
Step 5. Indirect Tensile Strength: Use the default value.
Step 6. Creep Compliance: Use the default value.
5.05.03.01.06.1.4 Thermal Click to go to Thermal Cracking in the AC overlay over JPCP section.
Refer to Recommended Thermal Cracking Inputs for new HMA Layers.
Step 1. Thermal Conductivity: Use the default value.
Step 2. Heat Capacity: Use the default value
Step 3. Thermal Contraction: Use the default calculated value.
5.05.03.01.06.2 GAB Click to go to GAB in the JPCP section. Click to go to GAB in the CRCP section. Click to go to GAB in the AC overlay over JPCP section. Click to go to GAB in the AC overlay over CRCP section.
In PMED, Graded Aggregate Base (GAB) is non-stabilized base (gravel) A-1-a.
For each GAB layer, use the default values.
5.05.03.01.06.3 Subgrade Click to go to Subgrade in the JPCP section. Click to go to Subgrade in the CRCP section. Click to go to Subgrade in the AC overlay over JPCP section.

Analysis Procedures
Section 05: Pavement ME Analysis
Updated 11/07/2013 Return to Table of Contents
5-30
Click to go to Subgrade in the AC overlay over CRCP section.
In PMED, there must be at least one unbound layer in the analysis, so if there are only bound materials directly on the subgrade, then a 12” subgrade layer should be inserted above the infinite subgrade layer. Refer to Material Properties – Unbound Layers.
5.05.03.01.06.3.1 For each subgrade layer:
Thickness: Enter the layer thickness (12” if not infinite).
Poisson’s ratio: Use the default value. Refer to Poisson Ratio
Lateral Earth Coefficient: Use the default. Refer to Coefficient of Lateral Pressure
Resilient Modulus (Mr): Refer to Unbound Materials Properties
Gradation: Unbound Materials Properties
Step 1. Use lab results to adjust the gradation.
Step 2. Adjust the LL and PI from the lab results. If the provided defaults are within 75% of the lab results, it is acceptable to use the defaults.
Step 3. Layer Compacted: Ensure that the check box is checked yes.
Step 4. All other values: Use the default value.
5.05.03.02 Jointed Plain Concrete Pavement
5.05.03.02.01 Open PMED
Open PMED and create a new project or open an existing one (as appropriate). Input the General Information as required. The “Design Type” shall be New Pavement, and the “Pavement Type” shall be Jointed Plain Concrete Pavement.
5.05.03.02.02 Performance Criteria Click to go to Performance Criteria in the AC overlay over JCP section.
Input the Design Life, Performance Criteria and Reliability as per New, Rehabilitation and Preservation Pavement Design.
Until unique criteria are developed for JPCP transverse cracking and Mean joint faulting, use the default criteria given in PMED.

Analysis Procedures
Section 05: Pavement ME Analysis
Updated 11/07/2013 Return to Table of Contents
5-31
5.05.03.02.03 Traffic
Refer to Traffic from the Flexible Pavement section.
5.05.03.02.04 Climate
Refer to Climate from the Flexible Pavement section.
5.05.03.02.05 JPCP Layer Properties Click to go to JPCP Layer Properties in the AC overlay over JCP section.
Double-click on the “JPCP Design Properties” button.
Step 1. PCC surface shortwave absorptivity: Use the default value (0.85).
Step 2. PCC joint spacing: 15 feet. Refer to Jointed Plain Concrete Pavement Design.
Step 3. Sealant type: No Sealant.
Step 4. Doweled joints: Refer to Jointed Plain Concrete Pavement Design.
Step 5. Widened slab: Refer to Jointed Plain Concrete Pavement Design. The widened slab should be checked “True” only if the longitudinal joint is at least one foot wider than the paint line.
Step 6. Tied shoulders: If the shoulder is concrete, this should be “True”, and the Load Transfer Efficiency should be 100%
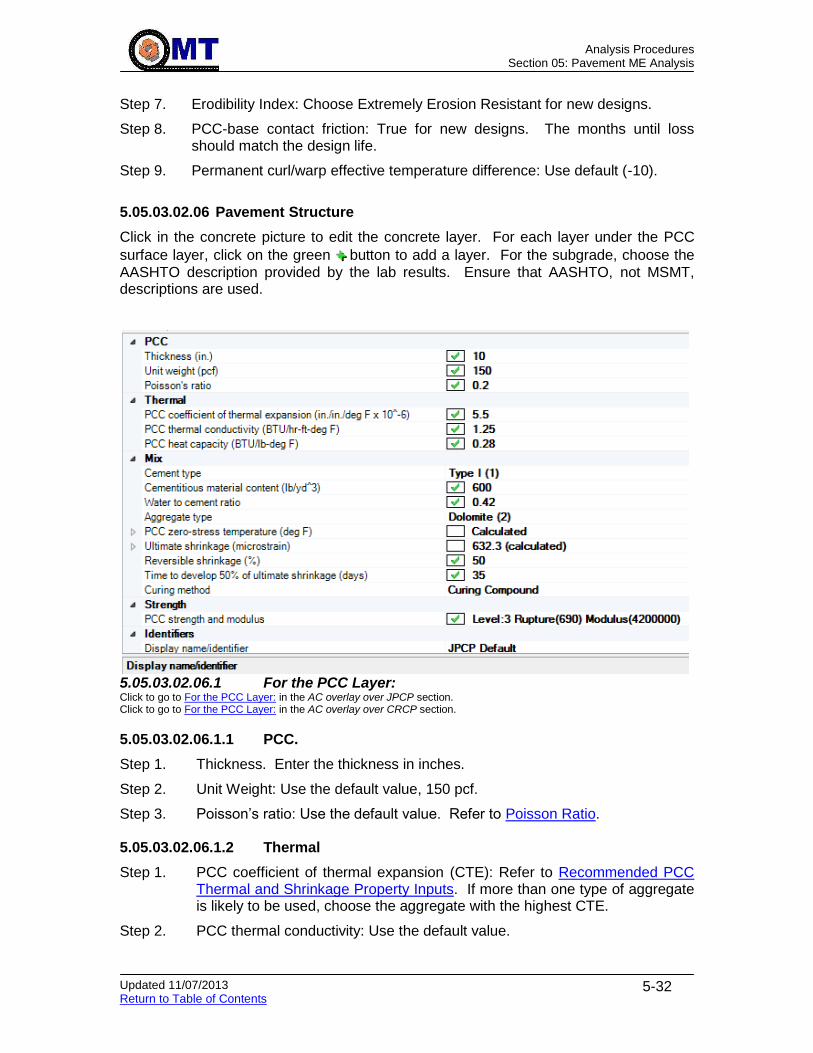
Analysis Procedures
Section 05: Pavement ME Analysis
Updated 11/07/2013 Return to Table of Contents
5-32
Step 7. Erodibility Index: Choose Extremely Erosion Resistant for new designs.
Step 8. PCC-base contact friction: True for new designs. The months until loss should match the design life.
Step 9. Permanent curl/warp effective temperature difference: Use default (-10).
5.05.03.02.06 Pavement Structure
Click in the concrete picture to edit the concrete layer. For each layer under the PCC
surface layer, click on the green +++ button to add a layer. For the subgrade, choose the
AASHTO description provided by the lab results. Ensure that AASHTO, not MSMT, descriptions are used.
5.05.03.02.06.1 For the PCC Layer: Click to go to For the PCC Layer: in the AC overlay over JPCP section. Click to go to For the PCC Layer: in the AC overlay over CRCP section.
5.05.03.02.06.1.1 PCC.
Step 1. Thickness. Enter the thickness in inches.
Step 2. Unit Weight: Use the default value, 150 pcf.
Step 3. Poisson’s ratio: Use the default value. Refer to Poisson Ratio.
5.05.03.02.06.1.2 Thermal
Step 1. PCC coefficient of thermal expansion (CTE): Refer to Recommended PCC Thermal and Shrinkage Property Inputs. If more than one type of aggregate is likely to be used, choose the aggregate with the highest CTE.
Step 2. PCC thermal conductivity: Use the default value.

Analysis Procedures
Section 05: Pavement ME Analysis
Updated 11/07/2013 Return to Table of Contents
5-33
Step 3. PCC Heat Capacity: Use the default value
5.05.03.02.06.1.3 Mix: Refer to Recommended PCC Mix Property Inputs
Step 1. Cement type: Use Type I.
Step 2. Cementitious material content: Use the default value.
Step 3. Water to cement ratio: Use the default value
Step 4. Aggregate Type: Use the type that was used to determine the PCC CTE.
Step 5. PCC zero-stress temperature: Use the default value.
Step 6. Ultimate shrinkage: Use the default value.
Step 7. Reversible shrinkage: Use the default value.
Step 8. Time to develop 50% of ultimate shrinkage: Use the default value.
Step 9. Curing method: Use Curing Compound.
5.05.03.02.06.1.4 Strength:
PCC Strength and modulus:
Step 1. Use the dropdown button, choose Level 3.
Step 2. Click on 28-day compressive strength. Refer to Strength and Stiffness Properties.
Step 3. Check the box for 28-day PCC elastic modulus. Refer to Strength and Stiffness Properties.
5.05.03.02.06.2 GAB
Refer to GAB from the Flexible Pavement section.
5.05.03.02.06.3 Subgrade
Refer to Subgrade from the Flexible Pavement section.
5.05.03.03 Continuous Reinforced Concrete Pavement
5.05.03.03.01 Open PMED
Open PMED and create a new project or open an existing one (as appropriate). Input the General Information as required. The “Design Type” shall be New Pavement, and the “Pavement Type” shall be Continuously Reinforced Concrete Pavement.
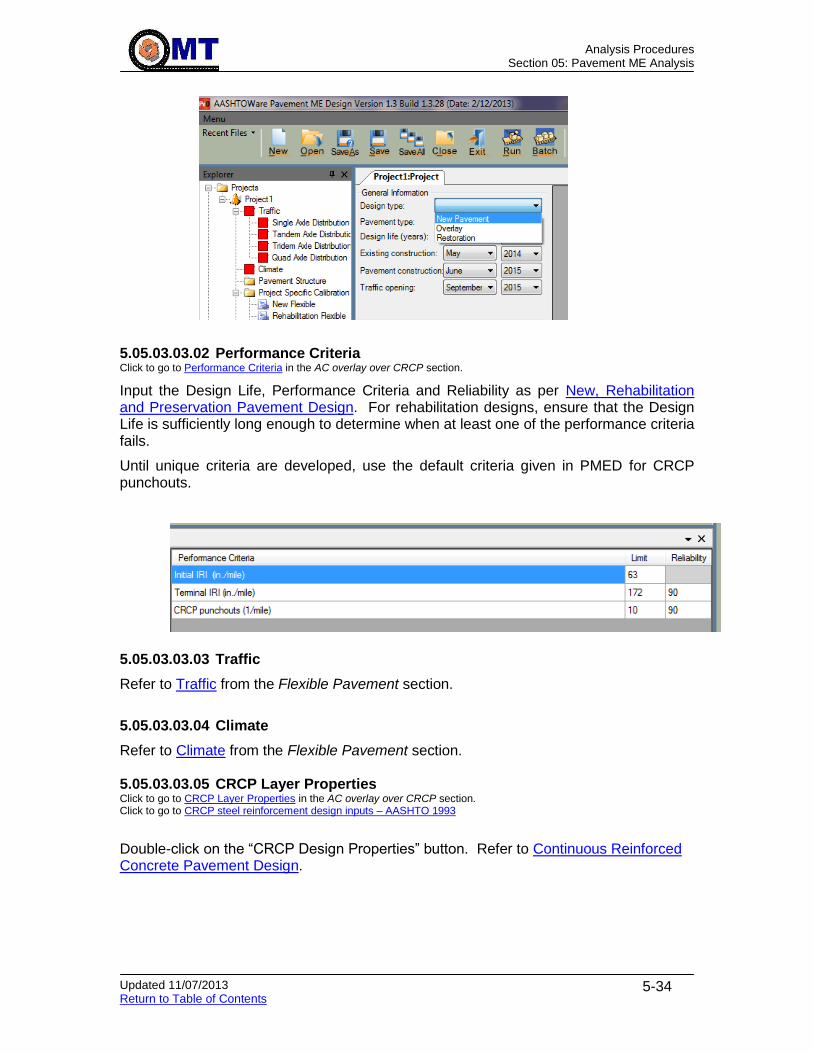
Analysis Procedures
Section 05: Pavement ME Analysis
Updated 11/07/2013 Return to Table of Contents
5-34
5.05.03.03.02 Performance Criteria Click to go to Performance Criteria in the AC overlay over CRCP section.
Input the Design Life, Performance Criteria and Reliability as per New, Rehabilitation and Preservation Pavement Design. For rehabilitation designs, ensure that the Design Life is sufficiently long enough to determine when at least one of the performance criteria fails.
Until unique criteria are developed, use the default criteria given in PMED for CRCP punchouts.
5.05.03.03.03 Traffic
Refer to Traffic from the Flexible Pavement section.
5.05.03.03.04 Climate
Refer to Climate from the Flexible Pavement section.
5.05.03.03.05 CRCP Layer Properties Click to go to CRCP Layer Properties in the AC overlay over CRCP section. Click to go to CRCP steel reinforcement design inputs – AASHTO 1993
Double-click on the “CRCP Design Properties” button. Refer to Continuous Reinforced Concrete Pavement Design.
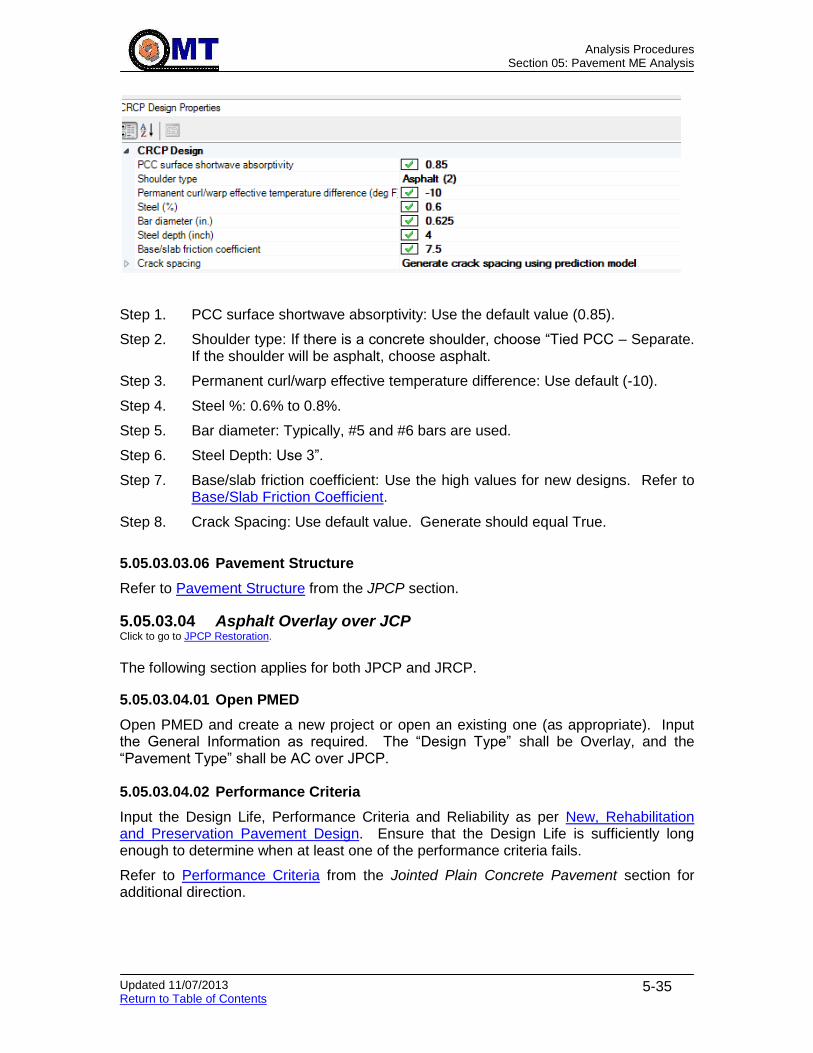
Analysis Procedures
Section 05: Pavement ME Analysis
Updated 11/07/2013 Return to Table of Contents
5-35
Step 1. PCC surface shortwave absorptivity: Use the default value (0.85).
Step 2. Shoulder type: If there is a concrete shoulder, choose “Tied PCC – Separate. If the shoulder will be asphalt, choose asphalt.
Step 3. Permanent curl/warp effective temperature difference: Use default (-10).
Step 4. Steel %: 0.6% to 0.8%.
Step 5. Bar diameter: Typically, #5 and #6 bars are used.
Step 6. Steel Depth: Use 3”.
Step 7. Base/slab friction coefficient: Use the high values for new designs. Refer to Base/Slab Friction Coefficient.
Step 8. Crack Spacing: Use default value. Generate should equal True.
5.05.03.03.06 Pavement Structure
Refer to Pavement Structure from the JPCP section.
5.05.03.04 Asphalt Overlay over JCP Click to go to JPCP Restoration.
The following section applies for both JPCP and JRCP.
5.05.03.04.01 Open PMED
Open PMED and create a new project or open an existing one (as appropriate). Input the General Information as required. The “Design Type” shall be Overlay, and the “Pavement Type” shall be AC over JPCP.
5.05.03.04.02 Performance Criteria
Input the Design Life, Performance Criteria and Reliability as per New, Rehabilitation and Preservation Pavement Design. Ensure that the Design Life is sufficiently long enough to determine when at least one of the performance criteria fails.
Refer to Performance Criteria from the Jointed Plain Concrete Pavement section for additional direction.
Analysis Procedures
Section 05: Pavement ME Analysis
Updated 11/07/2013 Return to Table of Contents
5-36
5.05.03.04.03 Traffic
Refer to Traffic from the Flexible Pavement section.
5.05.03.04.04 Climate
Refer to Climate from the Flexible Pavement section.
5.05.03.04.05 AC Layer Properties
Double-click on the “AC Layer Properties” button. Refer to AC Layer Properties. from the Flexible Pavement section.
5.05.03.04.06 Thermal Cracking Click to go to Thermal Cracking in the AC overlay over CRCP section.
Use the drop-down arrow on the right to find Thermal Cracking. Use all of the default values. Refer to Mechanical Properties: and Thermal from the Flexible Pavement section.
5.05.03.04.07 Foundation Support Click to go to Foundation Support in the AC overlay over CRCP section.
Double-click on the “Foundation Support” button.
If FWD data was obtained, click the modulus of subgrade reaction box to be true, and enter the dynamic modulus of subgrade reaction and month FWD data was collected. If no FWD data was obtained, click the modulus of subgrade reaction box to be false. Refer to Modulus of Subgrade Reaction (k).
5.05.03.04.08 JPCP Layer Properties
Double-click on the “JPCP Design Properties” button. Refer to JPCP Layer Properties from the Jointed Plain Concrete Pavement section.
Step 1. PCC surface shortwave absorptivity: Use the default value (0.85).
Step 2. PCC joint spacing: Input the existing joint spacing. If the existing spacing is greater than 30’, limit the spacing to 30’ to enable the software to run.
Step 3. Sealant type: If the sealant is visible, input the sealant type. Otherwise, input No Sealant.
Step 4. Doweled joints: Unless it is known that dowels are not present, assume that they are, as that has been the standard practice in Maryland. If dowel information is not known, use the default values.
Step 5. Widened slab: Unless it is known that the slab is widened, check “False” and input the lane width. The widened slab should be checked “True” only if the longitudinal joint is at least one foot wider than the paint line.
Step 6. Tied shoulders: Unless it is known that the shoulder is concrete and tied to the concrete mainline, check “False”. When checking “True” the Load Transfer Efficiency should be 50%
Step 7. Erodibility Index: Choose the following:
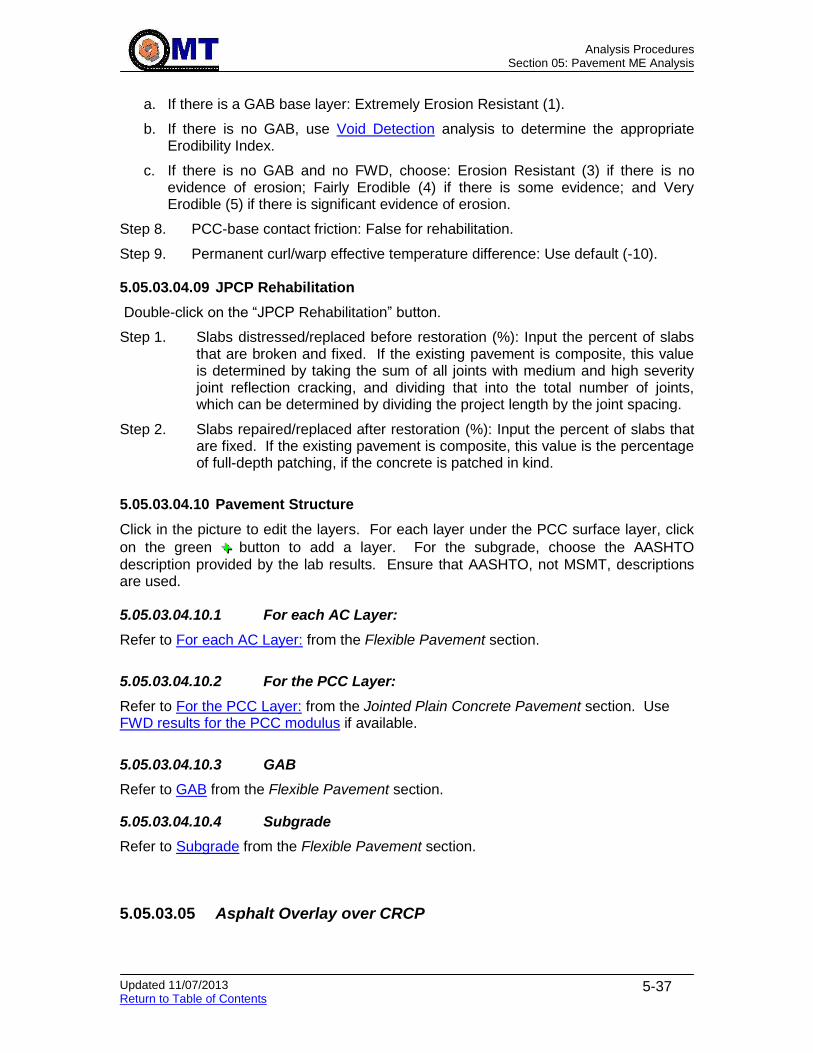
Analysis Procedures
Section 05: Pavement ME Analysis
Updated 11/07/2013 Return to Table of Contents
5-37
a. If there is a GAB base layer: Extremely Erosion Resistant (1).
b. If there is no GAB, use Void Detection analysis to determine the appropriate Erodibility Index.
c. If there is no GAB and no FWD, choose: Erosion Resistant (3) if there is no evidence of erosion; Fairly Erodible (4) if there is some evidence; and Very Erodible (5) if there is significant evidence of erosion.
Step 8. PCC-base contact friction: False for rehabilitation.
Step 9. Permanent curl/warp effective temperature difference: Use default (-10).
5.05.03.04.09 JPCP Rehabilitation
Double-click on the “JPCP Rehabilitation” button.
Step 1. Slabs distressed/replaced before restoration (%): Input the percent of slabs that are broken and fixed. If the existing pavement is composite, this value is determined by taking the sum of all joints with medium and high severity joint reflection cracking, and dividing that into the total number of joints, which can be determined by dividing the project length by the joint spacing.
Step 2. Slabs repaired/replaced after restoration (%): Input the percent of slabs that are fixed. If the existing pavement is composite, this value is the percentage of full-depth patching, if the concrete is patched in kind.
5.05.03.04.10 Pavement Structure
Click in the picture to edit the layers. For each layer under the PCC surface layer, click
on the green +++ button to add a layer. For the subgrade, choose the AASHTO
description provided by the lab results. Ensure that AASHTO, not MSMT, descriptions are used.
5.05.03.04.10.1 For each AC Layer:
Refer to For each AC Layer: from the Flexible Pavement section.
5.05.03.04.10.2 For the PCC Layer:
Refer to For the PCC Layer: from the Jointed Plain Concrete Pavement section. Use FWD results for the PCC modulus if available.
5.05.03.04.10.3 GAB
Refer to GAB from the Flexible Pavement section.
5.05.03.04.10.4 Subgrade
Refer to Subgrade from the Flexible Pavement section.
5.05.03.05 Asphalt Overlay over CRCP
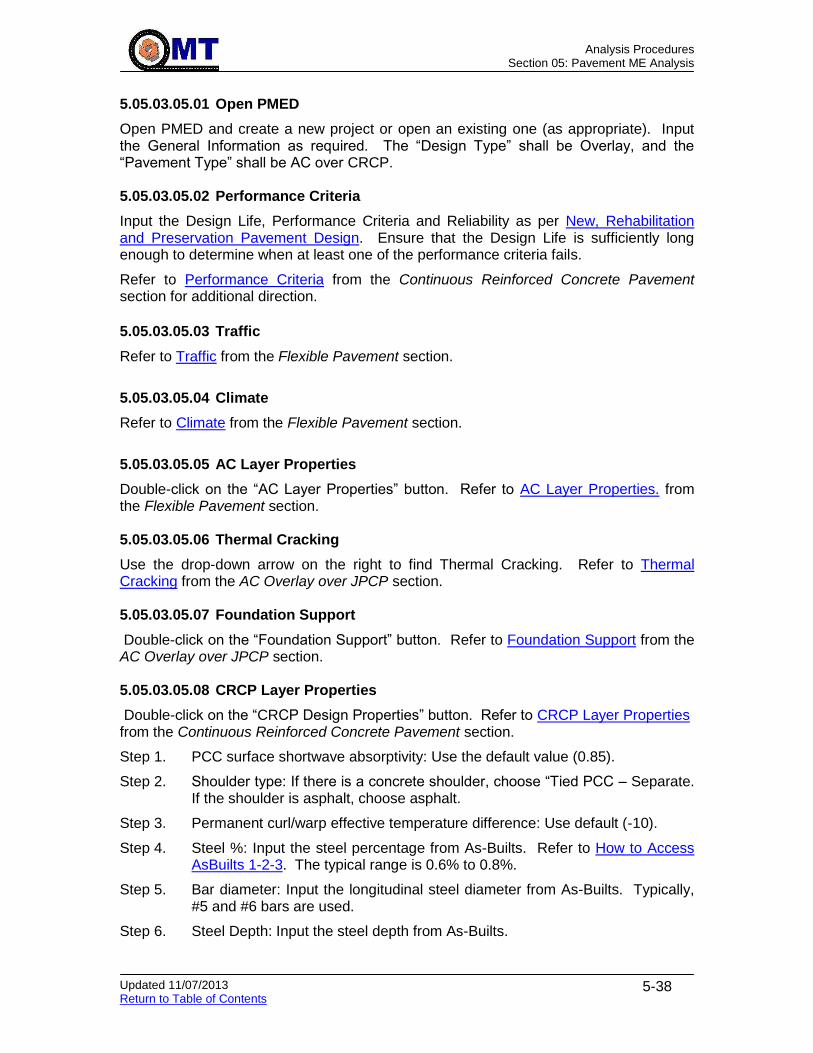
Analysis Procedures
Section 05: Pavement ME Analysis
Updated 11/07/2013 Return to Table of Contents
5-38
5.05.03.05.01 Open PMED
Open PMED and create a new project or open an existing one (as appropriate). Input the General Information as required. The “Design Type” shall be Overlay, and the “Pavement Type” shall be AC over CRCP.
5.05.03.05.02 Performance Criteria
Input the Design Life, Performance Criteria and Reliability as per New, Rehabilitation and Preservation Pavement Design. Ensure that the Design Life is sufficiently long enough to determine when at least one of the performance criteria fails.
Refer to Performance Criteria from the Continuous Reinforced Concrete Pavement section for additional direction.
5.05.03.05.03 Traffic
Refer to Traffic from the Flexible Pavement section.
5.05.03.05.04 Climate
Refer to Climate from the Flexible Pavement section.
5.05.03.05.05 AC Layer Properties
Double-click on the “AC Layer Properties” button. Refer to AC Layer Properties. from the Flexible Pavement section.
5.05.03.05.06 Thermal Cracking
Use the drop-down arrow on the right to find Thermal Cracking. Refer to Thermal Cracking from the AC Overlay over JPCP section.
5.05.03.05.07 Foundation Support
Double-click on the “Foundation Support” button. Refer to Foundation Support from the AC Overlay over JPCP section.
5.05.03.05.08 CRCP Layer Properties
Double-click on the “CRCP Design Properties” button. Refer to CRCP Layer Properties from the Continuous Reinforced Concrete Pavement section.
Step 1. PCC surface shortwave absorptivity: Use the default value (0.85).
Step 2. Shoulder type: If there is a concrete shoulder, choose “Tied PCC – Separate. If the shoulder is asphalt, choose asphalt.
Step 3. Permanent curl/warp effective temperature difference: Use default (-10).
Step 4. Steel %: Input the steel percentage from As-Builts. Refer to How to Access AsBuilts 1-2-3. The typical range is 0.6% to 0.8%.
Step 5. Bar diameter: Input the longitudinal steel diameter from As-Builts. Typically, #5 and #6 bars are used.
Step 6. Steel Depth: Input the steel depth from As-Builts.
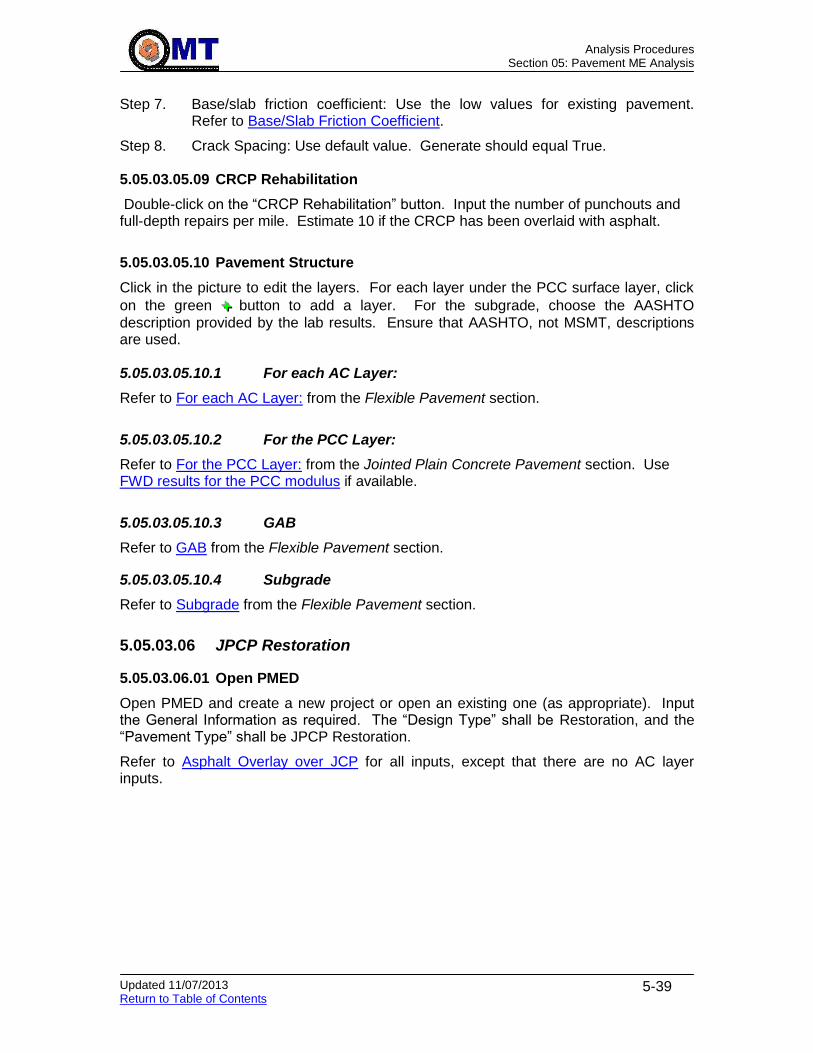
Analysis Procedures
Section 05: Pavement ME Analysis
Updated 11/07/2013 Return to Table of Contents
5-39
Step 7. Base/slab friction coefficient: Use the low values for existing pavement. Refer to Base/Slab Friction Coefficient.
Step 8. Crack Spacing: Use default value. Generate should equal True.
5.05.03.05.09 CRCP Rehabilitation
Double-click on the “CRCP Rehabilitation” button. Input the number of punchouts and full-depth repairs per mile. Estimate 10 if the CRCP has been overlaid with asphalt.
5.05.03.05.10 Pavement Structure
Click in the picture to edit the layers. For each layer under the PCC surface layer, click
on the green +++ button to add a layer. For the subgrade, choose the AASHTO
description provided by the lab results. Ensure that AASHTO, not MSMT, descriptions are used.
5.05.03.05.10.1 For each AC Layer:
Refer to For each AC Layer: from the Flexible Pavement section.
5.05.03.05.10.2 For the PCC Layer:
Refer to For the PCC Layer: from the Jointed Plain Concrete Pavement section. Use FWD results for the PCC modulus if available.
5.05.03.05.10.3 GAB
Refer to GAB from the Flexible Pavement section.
5.05.03.05.10.4 Subgrade
Refer to Subgrade from the Flexible Pavement section.
5.05.03.06 JPCP Restoration
5.05.03.06.01 Open PMED
Open PMED and create a new project or open an existing one (as appropriate). Input the General Information as required. The “Design Type” shall be Restoration, and the “Pavement Type” shall be JPCP Restoration.
Refer to Asphalt Overlay over JCP for all inputs, except that there are no AC layer inputs.
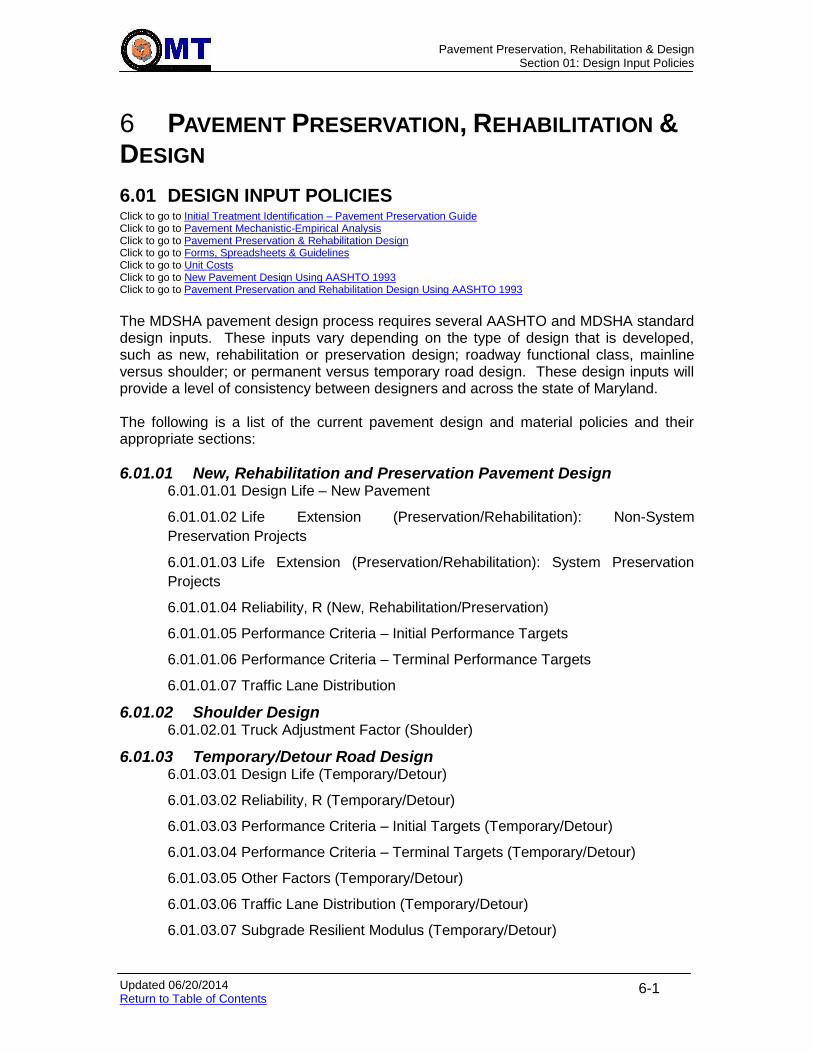
Pavement Preservation, Rehabilitation & Design
Section 01: Design Input Policies
Updated 06/20/2014 Return to Table of Contents
6-1
6 PAVEMENT PRESERVATION, REHABILITATION &
DESIGN
6.01 DESIGN INPUT POLICIES Click to go to Initial Treatment Identification – Pavement Preservation Guide Click to go to Pavement Mechanistic-Empirical Analysis Click to go to Pavement Preservation & Rehabilitation Design Click to go to Forms, Spreadsheets & Guidelines Click to go to Unit Costs Click to go to New Pavement Design Using AASHTO 1993 Click to go to Pavement Preservation and Rehabilitation Design Using AASHTO 1993
The MDSHA pavement design process requires several AASHTO and MDSHA standard design inputs. These inputs vary depending on the type of design that is developed, such as new, rehabilitation or preservation design; roadway functional class, mainline versus shoulder; or permanent versus temporary road design. These design inputs will provide a level of consistency between designers and across the state of Maryland. The following is a list of the current pavement design and material policies and their appropriate sections:
6.01.01 New, Rehabilitation and Preservation Pavement Design 6.01.01.01 Design Life – New Pavement
6.01.01.02 Life Extension (Preservation/Rehabilitation): Non-System
Preservation Projects
6.01.01.03 Life Extension (Preservation/Rehabilitation): System Preservation
Projects
6.01.01.04 Reliability, R (New, Rehabilitation/Preservation)
6.01.01.05 Performance Criteria – Initial Performance Targets
6.01.01.06 Performance Criteria – Terminal Performance Targets
6.01.01.07 Traffic Lane Distribution
6.01.02 Shoulder Design 6.01.02.01 Truck Adjustment Factor (Shoulder)
6.01.03 Temporary/Detour Road Design 6.01.03.01 Design Life (Temporary/Detour)
6.01.03.02 Reliability, R (Temporary/Detour)
6.01.03.03 Performance Criteria – Initial Targets (Temporary/Detour)
6.01.03.04 Performance Criteria – Terminal Targets (Temporary/Detour)
6.01.03.05 Other Factors (Temporary/Detour)
6.01.03.06 Traffic Lane Distribution (Temporary/Detour)
6.01.03.07 Subgrade Resilient Modulus (Temporary/Detour)

Pavement Preservation, Rehabilitation & Design
Section 01: Design Input Policies
Updated 06/20/2014 Return to Table of Contents
6-2
6.01.01 New, Rehabilitation and Preservation Pavement Design Click to go to Pavement Mechanistic-Empirical Analysis
The design inputs required for pavement design vary depending on the existing conditions at the project site, the functional classification of the roadway, and the pavement type. Beginning with the implementation of the MEPDG, design life or life extension will also be dependent on structural and functional distresses. The design structural distresses for HMA pavements are alligator cracking (bottom up) and
longitudinal top-down cracking. The design structural distresses for PCC pavements are
transverse joint faulting, transverse cracking and punchouts.
The design functional distresses for HMA pavements are ride quality, rutting, transverse cracking and skid resistance. The design functional distresses for PCC pavements are
ride quality and skid resistance.
These design inputs follow the same guidelines as those developed by AASHTO, but modified for local conditions. The design inputs in this section are needed to develop pavement design recommendations.
6.01.01.01 Design Life – New Pavement The structural design life for all new pavements shall be 25 years. It is recognized that the surface of many HMA pavements does not last 25 years; however, it is critical that the pavement is structurally sufficient to meet sustainability needs, as structural distresses are typically more expensive to repair and they reduce the life-cycle of the pavement more than functional distresses. The functional design life for all new pavements shall be 15 years for HMA and 25 years for new PCC.
6.01.01.02 Life Extension (Preservation/Rehabilitation): Non-System Preservation Projects For non-Fund 77 projects, the midpoint of the range listed in Supplemental Treatment Information shall be used for the Design Structural Life Extension, and the minimum of the range given shall be used for the Minimum Structural Life Extension. The functional life extension shall be the lesser of 15 years and the structural life extension.
6.01.01.03 Life Extension (Preservation/Rehabilitation): System Preservation Projects For Fund 77 projects, there will be no established life extension, since the appropriate fix will dictate the life, rather than the other way around. The appropriate fix will be determined by the District and PAGD through discussion/coordination, based on optimization targets and suggestions as well as MDSHA’s Pavement Preservation Guide. Given the existing conditions, proposed fix, and the design terminal condition values (formerly serviceabilities) described in Performance Criteria – Terminal Performance Targets, the estimated life extension will be calculated.
6.01.01.04 Reliability, R (New, Rehabilitation/Preservation) At MDSHA, Reliability has historically been based on functional class as a way to distinguish risk. With the implementation of MEPDG, risk will be accounted for through the use of variable terminal serviceabilities that are based on functional class. Reliability will now be based on whether the scope of work is for new pavement, or
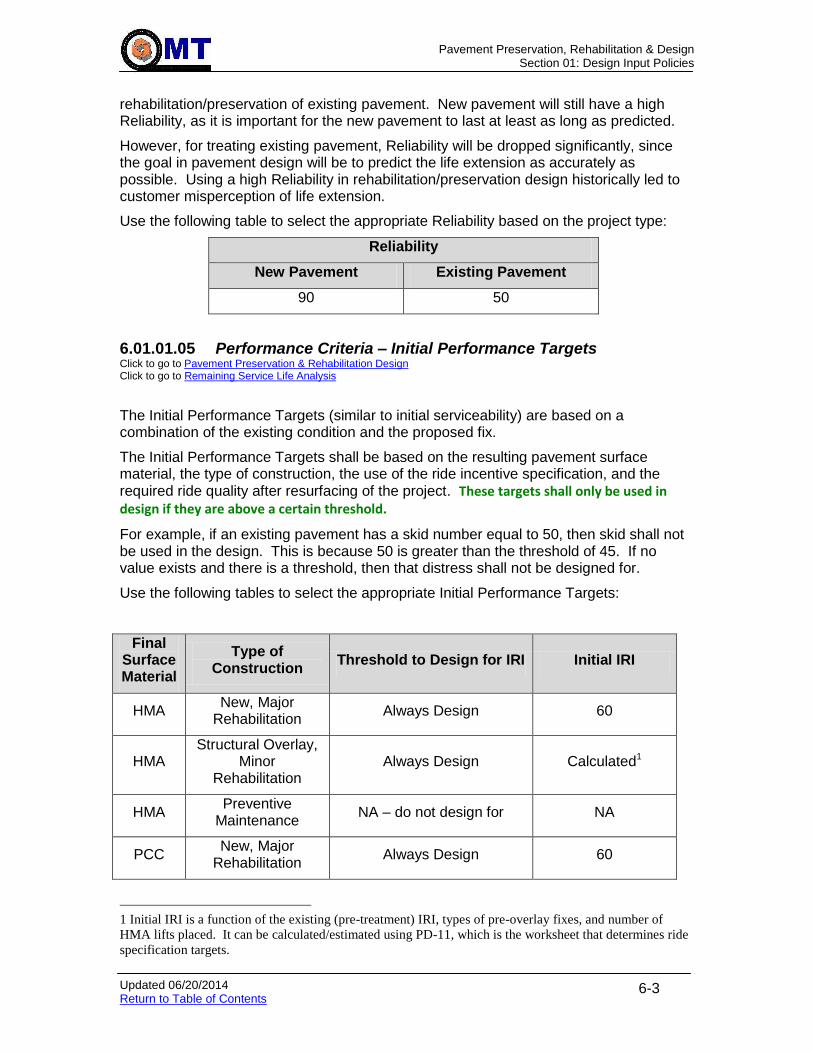
Pavement Preservation, Rehabilitation & Design
Section 01: Design Input Policies
Updated 06/20/2014 Return to Table of Contents
6-3
rehabilitation/preservation of existing pavement. New pavement will still have a high Reliability, as it is important for the new pavement to last at least as long as predicted.
However, for treating existing pavement, Reliability will be dropped significantly, since the goal in pavement design will be to predict the life extension as accurately as possible. Using a high Reliability in rehabilitation/preservation design historically led to customer misperception of life extension.
Use the following table to select the appropriate Reliability based on the project type:
Reliability
New Pavement Existing Pavement
90 50
6.01.01.05 Performance Criteria – Initial Performance Targets Click to go to Pavement Preservation & Rehabilitation Design Click to go to Remaining Service Life Analysis
The Initial Performance Targets (similar to initial serviceability) are based on a combination of the existing condition and the proposed fix.
The Initial Performance Targets shall be based on the resulting pavement surface material, the type of construction, the use of the ride incentive specification, and the required ride quality after resurfacing of the project. These targets shall only be used in design if they are above a certain threshold.
For example, if an existing pavement has a skid number equal to 50, then skid shall not be used in the design. This is because 50 is greater than the threshold of 45. If no value exists and there is a threshold, then that distress shall not be designed for.
Use the following tables to select the appropriate Initial Performance Targets:
Final Surface Material
Type of Construction
Threshold to Design for IRI Initial IRI
HMA New, Major
Rehabilitation Always Design 60
HMA Structural Overlay,
Minor Rehabilitation
Always Design Calculated1
HMA Preventive
Maintenance NA – do not design for NA
PCC New, Major
Rehabilitation Always Design 60
1 Initial IRI is a function of the existing (pre-treatment) IRI, types of pre-overlay fixes, and number of
HMA lifts placed. It can be calculated/estimated using PD-11, which is the worksheet that determines ride
specification targets.

Pavement Preservation, Rehabilitation & Design
Section 01: Design Input Policies
Updated 06/20/2014 Return to Table of Contents
6-4
PCC Structural Overlay,
Minor Rehabilitation
Always Design Calculated1
PCC Preventive
Maintenance NA NA
Final Surface Material
Type of Construction
Threshold to Design for Cracking/ Faulting/
Punchouts
Occurrences of Initial Cracking/ Faulting/
Punchouts
HMA New, Major
Rehabilitation Always Design 0
HMA Structural Overlay,
Minor Rehabilitation
Always Design 0
HMA Preventive
Maintenance Design if >5%2 0 to Existing3
PCC New, Major
Rehabilitation Always Design 0
PCC Structural Overlay,
Minor Rehabilitation
Always Design 0
PCC Preventive
Maintenance Design if >5%2 0 to Existing3
Final Surface Material
Type of Construction
Threshold to Design for Rutting
Initial Rutting (inches)
HMA New, Major
Rehabilitation Always Design 0.15
HMA Structural Overlay,
Minor Rehabilitation
Always Design 0.15
HMA Preventive
Maintenance Design only if micro-
surfacing 0.15 to Existing3
PCC New, Major
Rehabilitation NA – do not design for NA
2 Only for Preventive Maintenance treatments that are intended to improve cracking/ faulting/ punchouts.
3 Preventive Maintenance treatments may not improve cracking/faulting/ punchouts or rutting. Refer to the
MDSHA Guide to Pavement Preservation for further guidance.

Pavement Preservation, Rehabilitation & Design
Section 01: Design Input Policies
Updated 06/20/2014 Return to Table of Contents
6-5
PCC Structural Overlay,
Minor Rehabilitation
NA – do not design for NA
PCC Preventive
Maintenance NA – do not design for NA
Final Surface Material
Type of Construction
Threshold to Design for Skid Number
Initial Skid Number
HMA New, Major
Rehabilitation Design if <35 See Following Chart
HMA Structural Overlay,
Minor Rehabilitation
Design if <35 See Following Chart
HMA Preventive
Maintenance Design if <35 See Following Chart 4
PCC New, Major
Rehabilitation Design if <35 See Following Chart
PCC Structural Overlay,
Minor Rehabilitation
Design if <35 See Following Chart
PCC Preventive
Maintenance Design if <35 See Following Chart 4
Initial Skid Values by Surface Material
Functional Class
Urban Interstates, Freeways and Collectors (11,12,17)
Rural Interstates, Arterials and Major Collectors; Urban Locals (1,2,6,7,19)
Rural Minor Collectors and Locals (8,9)
Urban Non-Freeway Arterials (14,16)
Dense-Graded HMA
46 49 53 42
Gap-Graded HMA 52 55 59 48
Micro-Surfacing 54 57 61 50
High Friction 71 74 78 67
4 Preventive Maintenance treatments may make friction worse or better, depending on the treatment. Refer to the Pavement Preservation Guide for further guidance.
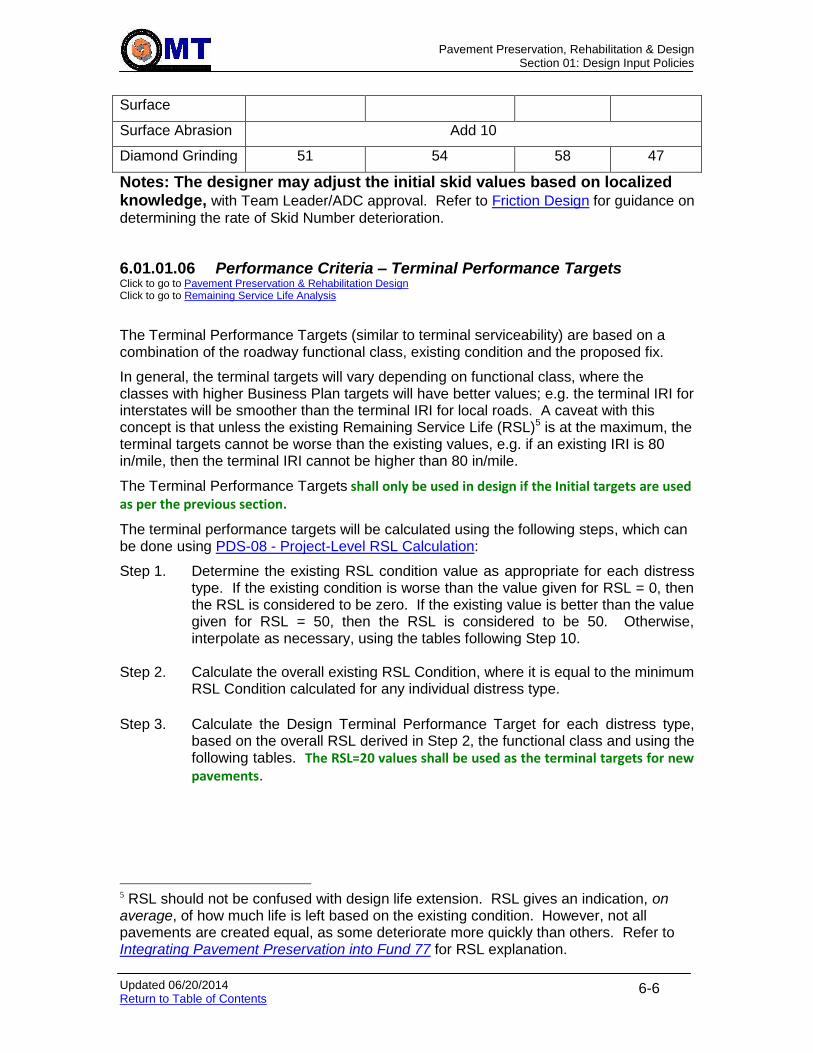
Pavement Preservation, Rehabilitation & Design
Section 01: Design Input Policies
Updated 06/20/2014 Return to Table of Contents
6-6
Surface
Surface Abrasion Add 10
Diamond Grinding 51 54 58 47
Notes: The designer may adjust the initial skid values based on localized knowledge, with Team Leader/ADC approval. Refer to Friction Design for guidance on
determining the rate of Skid Number deterioration.
6.01.01.06 Performance Criteria – Terminal Performance Targets Click to go to Pavement Preservation & Rehabilitation Design Click to go to Remaining Service Life Analysis
The Terminal Performance Targets (similar to terminal serviceability) are based on a combination of the roadway functional class, existing condition and the proposed fix.
In general, the terminal targets will vary depending on functional class, where the classes with higher Business Plan targets will have better values; e.g. the terminal IRI for interstates will be smoother than the terminal IRI for local roads. A caveat with this concept is that unless the existing Remaining Service Life (RSL)5 is at the maximum, the terminal targets cannot be worse than the existing values, e.g. if an existing IRI is 80 in/mile, then the terminal IRI cannot be higher than 80 in/mile.
The Terminal Performance Targets shall only be used in design if the Initial targets are used as per the previous section.
The terminal performance targets will be calculated using the following steps, which can be done using PDS-08 - Project-Level RSL Calculation:
Step 1. Determine the existing RSL condition value as appropriate for each distress type. If the existing condition is worse than the value given for RSL = 0, then the RSL is considered to be zero. If the existing value is better than the value given for RSL = 50, then the RSL is considered to be 50. Otherwise, interpolate as necessary, using the tables following Step 10.
Step 2. Calculate the overall existing RSL Condition, where it is equal to the minimum RSL Condition calculated for any individual distress type.
Step 3. Calculate the Design Terminal Performance Target for each distress type,
based on the overall RSL derived in Step 2, the functional class and using the following tables. The RSL=20 values shall be used as the terminal targets for new pavements.
5 RSL should not be confused with design life extension. RSL gives an indication, on average, of how much life is left based on the existing condition. However, not all pavements are created equal, as some deteriorate more quickly than others. Refer to Integrating Pavement Preservation into Fund 77 for RSL explanation.
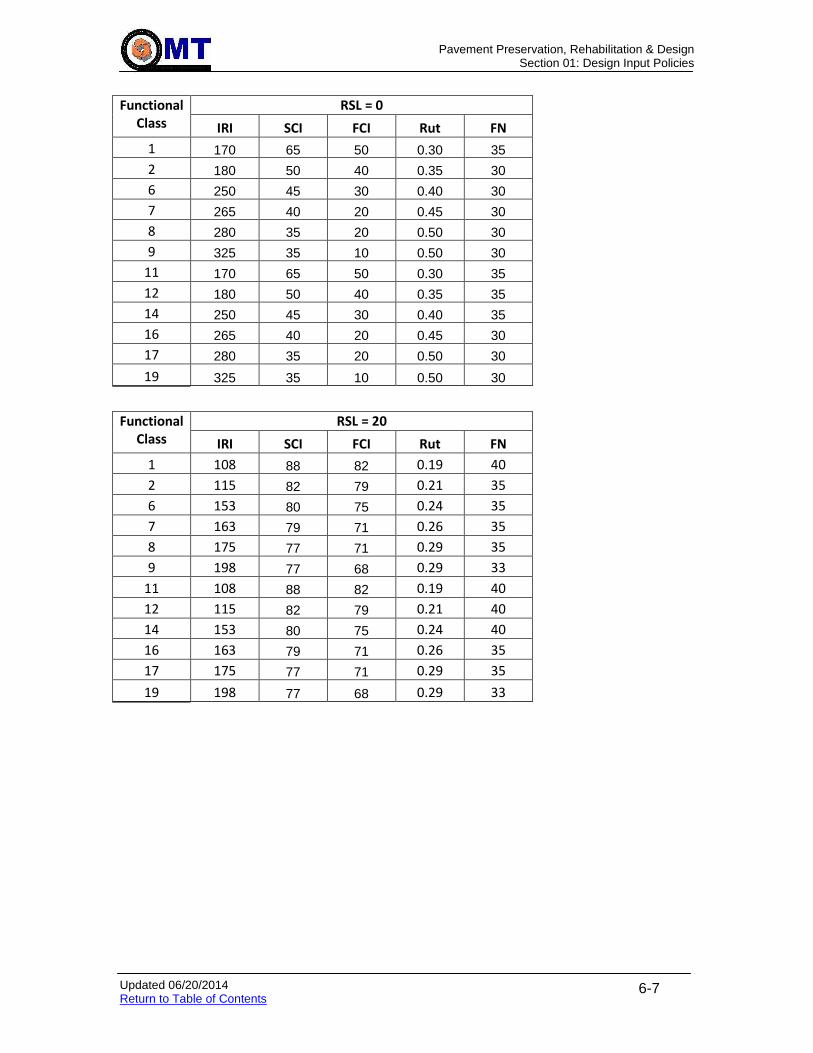
Pavement Preservation, Rehabilitation & Design
Section 01: Design Input Policies
Updated 06/20/2014 Return to Table of Contents
6-7
Functional Class
RSL = 0
IRI SCI FCI Rut FN
1 170 65 50 0.30 35
2 180 50 40 0.35 30
6 250 45 30 0.40 30
7 265 40 20 0.45 30
8 280 35 20 0.50 30
9 325 35 10 0.50 30
11 170 65 50 0.30 35
12 180 50 40 0.35 35
14 250 45 30 0.40 35
16 265 40 20 0.45 30
17 280 35 20 0.50 30
19 325 35 10 0.50 30
Functional Class
RSL = 20
IRI SCI FCI Rut FN
1 108 88 82 0.19 40
2 115 82 79 0.21 35
6 153 80 75 0.24 35
7 163 79 71 0.26 35
8 175 77 71 0.29 35
9 198 77 68 0.29 33
11 108 88 82 0.19 40
12 115 82 79 0.21 40
14 153 80 75 0.24 40
16 163 79 71 0.26 35
17 175 77 71 0.29 35
19 198 77 68 0.29 33
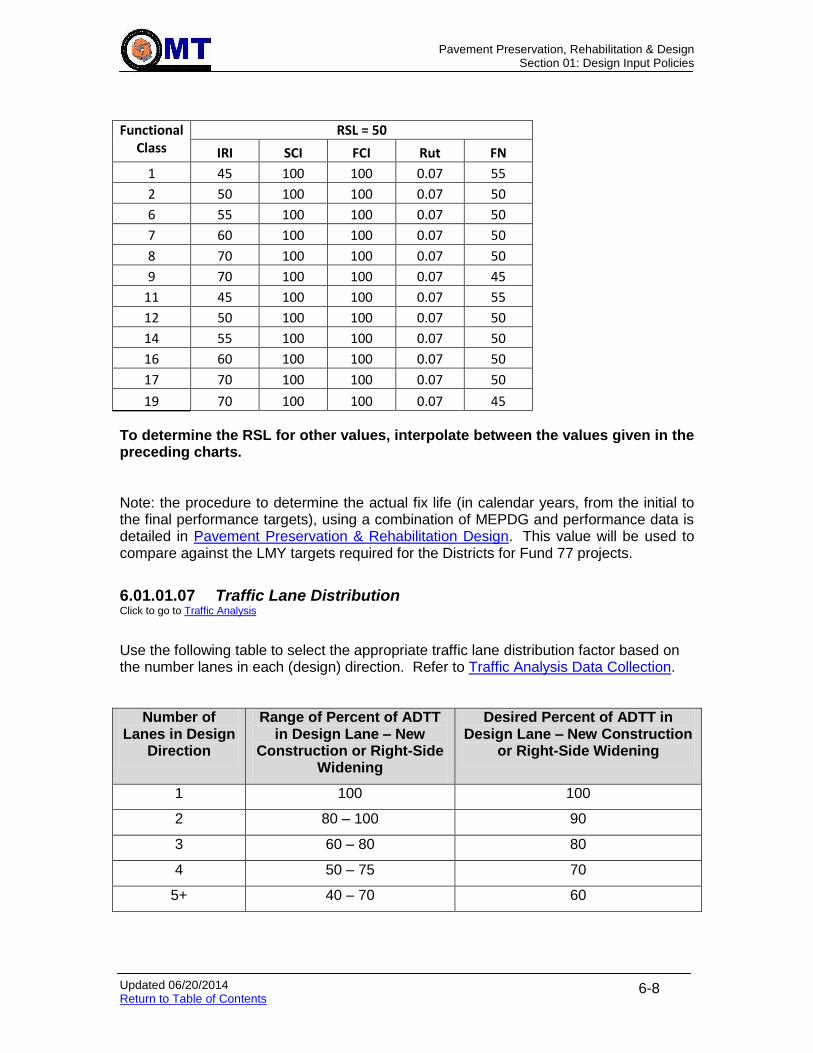
Pavement Preservation, Rehabilitation & Design
Section 01: Design Input Policies
Updated 06/20/2014 Return to Table of Contents
6-8
Functional Class
RSL = 50
IRI SCI FCI Rut FN
1 45 100 100 0.07 55
2 50 100 100 0.07 50
6 55 100 100 0.07 50
7 60 100 100 0.07 50
8 70 100 100 0.07 50
9 70 100 100 0.07 45
11 45 100 100 0.07 55
12 50 100 100 0.07 50
14 55 100 100 0.07 50
16 60 100 100 0.07 50
17 70 100 100 0.07 50
19 70 100 100 0.07 45
To determine the RSL for other values, interpolate between the values given in the preceding charts. Note: the procedure to determine the actual fix life (in calendar years, from the initial to the final performance targets), using a combination of MEPDG and performance data is detailed in Pavement Preservation & Rehabilitation Design. This value will be used to compare against the LMY targets required for the Districts for Fund 77 projects.
6.01.01.07 Traffic Lane Distribution Click to go to Traffic Analysis
Use the following table to select the appropriate traffic lane distribution factor based on the number lanes in each (design) direction. Refer to Traffic Analysis Data Collection.
Number of Lanes in Design
Direction
Range of Percent of ADTT in Design Lane – New
Construction or Right-Side Widening
Desired Percent of ADTT in Design Lane – New Construction
or Right-Side Widening
1 100 100
2 80 – 100 90
3 60 – 80 80
4 50 – 75 70
5+ 40 – 70 60

Pavement Preservation, Rehabilitation & Design
Section 01: Design Input Policies
Updated 06/20/2014 Return to Table of Contents
6-9
Number of Lanes in Design
Direction
Range of Percent of ADTT in Design Lane – Left Side
Widening
Desired Percent of ADTT in Design Lane – Left Side
Widening
2 30 – 50 40
3 10 – 30 20
4+ 5 – 15 10
6.01.02 Shoulder Design Click to go to New Pavement Design
The design inputs required for shoulder pavement design vary depending on the existing conditions at the project site, the functional classification of the roadway, and the pavement type. These design inputs follow the same guidelines as those developed by AASHTO, but modified for local conditions. The design inputs are identical to those for new design with the exception of the truck adjustment factor.
6.01.02.01 Truck Adjustment Factor (Shoulder) The design ADTT for the pavement design of the shoulder will be based on a percentage of the design ADTT for the mainline roadway. Use the following table to select the appropriate ADTT adjustment factor based on the functional class of the roadway:
Functional Class Percent of Design
ADTT
Interstate 100%
Freeways and Expressways 100%
Principal Arterial – Other 100%
Minor Arterial 10%
Major Collector 10%
Minor Collector 10%
Collector 10%
Local 10%
For pavement design purposes, any auxiliary, acceleration, deceleration and ramp lanes that are directly adjacent to mainline pavement shall be considered to be part of the mainline pavement until those lanes split off at the gore area.
6.01.03 Temporary/Detour Road Design
The design inputs required for temporary / detour road pavements vary depending on the existing conditions at the project site, the functional classification of the roadway, the pavement type, and whether the road will be removed or left in service. These design inputs follow the same guidelines as those developed by AASHTO, but modified for local conditions.

Pavement Preservation, Rehabilitation & Design
Section 01: Design Input Policies
Updated 06/20/2014 Return to Table of Contents
6-10
6.01.03.01 Design Life (Temporary/Detour) The design life for a temporary or detour road shall be the MOT construction duration (verify with highway design and construction inspection), or if that information is not available, 2 years.
6.01.03.02 Reliability, R (Temporary/Detour) Temporary or detour roads that are to be removed shall be designed with a Reliability of 75%. Temporary or detour roads that are to be left in service shall be designed with a Reliability of 90%.
6.01.03.03 Performance Criteria – Initial Targets (Temporary/Detour) The Initial Targets for temporary or detour roads shall be determined using the same procedures as used for permanent mainline pavement.
6.01.03.04 Performance Criteria – Terminal Targets (Temporary/Detour) The Terminal Targets for temporary or detour roads that are to be removed shall correspond to an RSL = 0 years.
The Terminal Targets for temporary or detour roads that are to remain in service shall be determined using the same procedures as for permanent mainline pavement.
6.01.03.05 Other Factors (Temporary/Detour) Temporary / detour roads shall be designed with the goal to minimize the amount of HMA material placed in the temporary pavement structure. The minimum HMA thickness shall be 4”. The goal should be to utilize graded aggregate base to the fullest extend to keep material costs for a temporary pavement structure to a minimum.
6.01.03.06 Traffic Lane Distribution (Temporary/Detour) Use the following table to select the appropriate traffic lane distribution factor based on the number lanes in each (design) direction. The ADTT is increased by approximately 25% over the typical mainline distribution for Temporary / Detour roads to account for the increase in heavy construction traffic.
Number of Lanes in Design Direction
Range of Percent of ADTT in Design Lane
Desired Percent of ADTT in Design Lane
1 125 125
2 100 – 125 110
3 75 – 100 100
4 60 – 90 85
5+ 50 – 85 75
6.01.03.07 Subgrade Resilient Modulus (Temporary/Detour) The subgrade resilient modulus for new temporary / detour roads shall be a maximum of 4,500 psi unless a higher value can be justified due to presence of rock and field verified during construction. Passing test rolling at the Top of Subgrade shall be equivalent as reaching 4,500 psi.
The subgrade resilient modulus for existing roads/shoulders that will be used as detour roads will be 4,500 psi unless shown to be different as a result of testing (FWD, borings).

Pavement Preservation, Rehabilitation & Design
Section 02: Material Selection Policies
Updated 07/10/2014 Return to Table of Contents
6-11
6.02 MATERIAL SELECTION POLICIES There was a need to develop a section of material selection policies because of the numerous pavement material designations available to an MDSHA pavement designer. Policies for material selection provide both guidance to and consistency between MDSHA pavement designers. This need is especially true with the adoption of the Superpave HMA mix design criteria and the numerous types of HMA mixes that were generated. In addition, policy and guidance for wearing course selection and reflective crack control are also addressed in this section. Click to go to Superpave HMA Criteria Click to go to HMA Mix Selection Click to go to Wearing Surface Selection Click to go to Reflective Crack Control
6.02.01 PCC Criteria
PCC mixes shall be specified per the following uses:
SHA MIX NUMBER
PROPOSED USES REMARKS
1 Junk – backfill material
2 Light pole bases, footers
3 Piers, columns, caissons, sidewalks, curb & gutter
4 Underwater (tremie), Caissons below frost line
5 Same as mix 3, but with #7 stone
6 Structures, bridge decks, parapets, precast – noise walls, superstructures, driveways, ramps
7 Paving, ramps
8 Overlay bridge decks
9 Pavement Patching Old Mod #6 12 hr mix
10 Standard Lightweight bridge decks
11 High performance concrete decks (HPC)
12 High performance lightweight concrete deck (HPLC)
Repair of bridge decks
WT Concrete overlays (white-topping)
6.02.02 Superpave HMA Criteria
The adoption of the Superpave HMA mix design criteria and the numerous types of HMA mixes that were generated sparked the need for policy in material selection. Material selection items crucial to the Superpave HMA mix criteria include the performance grade binder, traffic level or compaction level (ESAL category), and HMA mix size. In addition, policies regarding the type and number of HMA mixes on a typical construction project are also provided.
6.02.02.01 Performance Grade Binder Selection Click to go to Recommended Material Property Inputs for new HMA Layers Click to go to Recommended Material Property Inputs for Existing HMA Layers
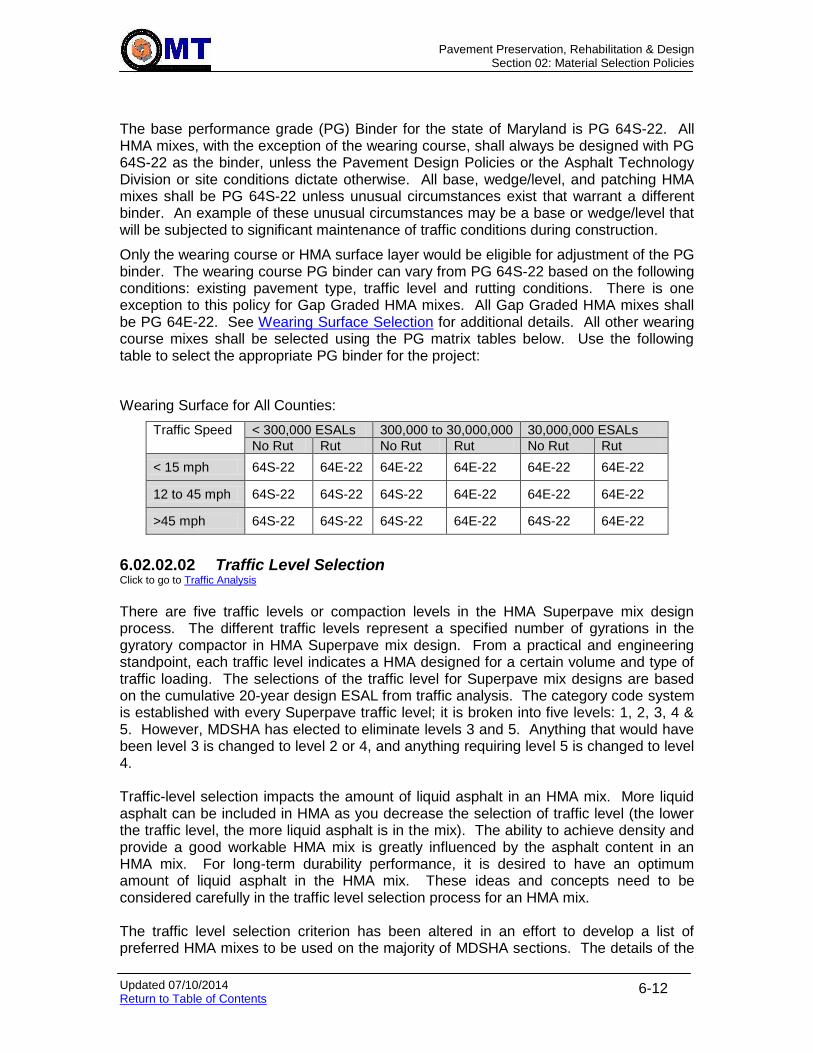
Pavement Preservation, Rehabilitation & Design
Section 02: Material Selection Policies
Updated 07/10/2014 Return to Table of Contents
6-12
The base performance grade (PG) Binder for the state of Maryland is PG 64S-22. All HMA mixes, with the exception of the wearing course, shall always be designed with PG 64S-22 as the binder, unless the Pavement Design Policies or the Asphalt Technology Division or site conditions dictate otherwise. All base, wedge/level, and patching HMA mixes shall be PG 64S-22 unless unusual circumstances exist that warrant a different binder. An example of these unusual circumstances may be a base or wedge/level that will be subjected to significant maintenance of traffic conditions during construction.
Only the wearing course or HMA surface layer would be eligible for adjustment of the PG binder. The wearing course PG binder can vary from PG 64S-22 based on the following conditions: existing pavement type, traffic level and rutting conditions. There is one exception to this policy for Gap Graded HMA mixes. All Gap Graded HMA mixes shall be PG 64E-22. See Wearing Surface Selection for additional details. All other wearing course mixes shall be selected using the PG matrix tables below. Use the following table to select the appropriate PG binder for the project:
Wearing Surface for All Counties:
Traffic Speed < 300,000 ESALs 300,000 to 30,000,000 30,000,000 ESALs
No Rut Rut No Rut Rut No Rut Rut
< 15 mph 64S-22 64E-22 64E-22 64E-22 64E-22 64E-22
12 to 45 mph 64S-22 64S-22 64S-22 64E-22 64E-22 64E-22
>45 mph 64S-22 64S-22 64S-22 64E-22 64S-22 64E-22
6.02.02.02 Traffic Level Selection Click to go to Traffic Analysis
There are five traffic levels or compaction levels in the HMA Superpave mix design process. The different traffic levels represent a specified number of gyrations in the gyratory compactor in HMA Superpave mix design. From a practical and engineering standpoint, each traffic level indicates a HMA designed for a certain volume and type of traffic loading. The selections of the traffic level for Superpave mix designs are based on the cumulative 20-year design ESAL from traffic analysis. The category code system is established with every Superpave traffic level; it is broken into five levels: 1, 2, 3, 4 & 5. However, MDSHA has elected to eliminate levels 3 and 5. Anything that would have been level 3 is changed to level 2 or 4, and anything requiring level 5 is changed to level 4. Traffic-level selection impacts the amount of liquid asphalt in an HMA mix. More liquid asphalt can be included in HMA as you decrease the selection of traffic level (the lower the traffic level, the more liquid asphalt is in the mix). The ability to achieve density and provide a good workable HMA mix is greatly influenced by the asphalt content in an HMA mix. For long-term durability performance, it is desired to have an optimum amount of liquid asphalt in the HMA mix. These ideas and concepts need to be considered carefully in the traffic level selection process for an HMA mix. The traffic level selection criterion has been altered in an effort to develop a list of preferred HMA mixes to be used on the majority of MDSHA sections. The details of the
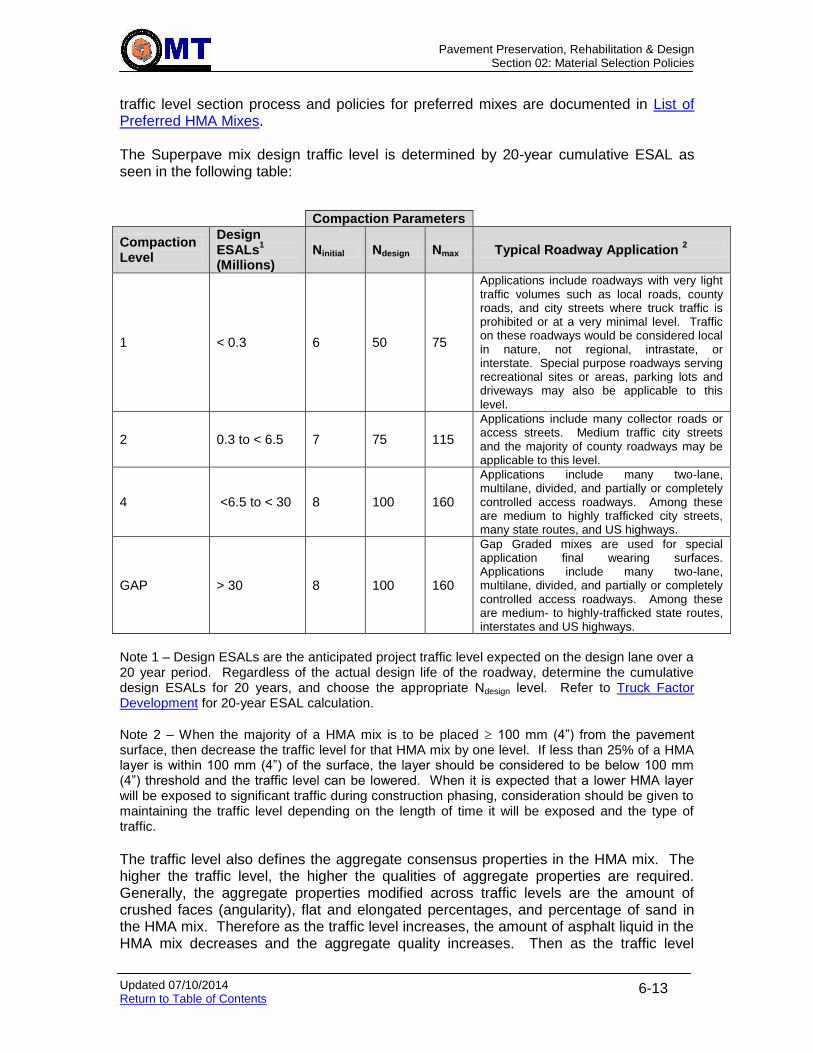
Pavement Preservation, Rehabilitation & Design
Section 02: Material Selection Policies
Updated 07/10/2014 Return to Table of Contents
6-13
traffic level section process and policies for preferred mixes are documented in List of Preferred HMA Mixes. The Superpave mix design traffic level is determined by 20-year cumulative ESAL as seen in the following table:
Compaction Parameters
Compaction Level
Design ESALs
1
(Millions) Ninitial Ndesign Nmax Typical Roadway Application
2
1 < 0.3 6 50 75
Applications include roadways with very light traffic volumes such as local roads, county roads, and city streets where truck traffic is prohibited or at a very minimal level. Traffic on these roadways would be considered local in nature, not regional, intrastate, or interstate. Special purpose roadways serving recreational sites or areas, parking lots and driveways may also be applicable to this level.
2 0.3 to < 6.5 7 75 115
Applications include many collector roads or access streets. Medium traffic city streets and the majority of county roadways may be applicable to this level.
4 <6.5 to < 30 8 100 160
Applications include many two-lane, multilane, divided, and partially or completely controlled access roadways. Among these are medium to highly trafficked city streets, many state routes, and US highways.
GAP > 30 8 100 160
Gap Graded mixes are used for special application final wearing surfaces. Applications include many two-lane, multilane, divided, and partially or completely controlled access roadways. Among these are medium- to highly-trafficked state routes, interstates and US highways.
Note 1 – Design ESALs are the anticipated project traffic level expected on the design lane over a 20 year period. Regardless of the actual design life of the roadway, determine the cumulative design ESALs for 20 years, and choose the appropriate Ndesign level. Refer to Truck Factor Development for 20-year ESAL calculation.
Note 2 – When the majority of a HMA mix is to be placed 100 mm (4”) from the pavement surface, then decrease the traffic level for that HMA mix by one level. If less than 25% of a HMA layer is within 100 mm (4”) of the surface, the layer should be considered to be below 100 mm (4”) threshold and the traffic level can be lowered. When it is expected that a lower HMA layer will be exposed to significant traffic during construction phasing, consideration should be given to maintaining the traffic level depending on the length of time it will be exposed and the type of traffic.
The traffic level also defines the aggregate consensus properties in the HMA mix. The higher the traffic level, the higher the qualities of aggregate properties are required. Generally, the aggregate properties modified across traffic levels are the amount of crushed faces (angularity), flat and elongated percentages, and percentage of sand in the HMA mix. Therefore as the traffic level increases, the amount of asphalt liquid in the HMA mix decreases and the aggregate quality increases. Then as the traffic level
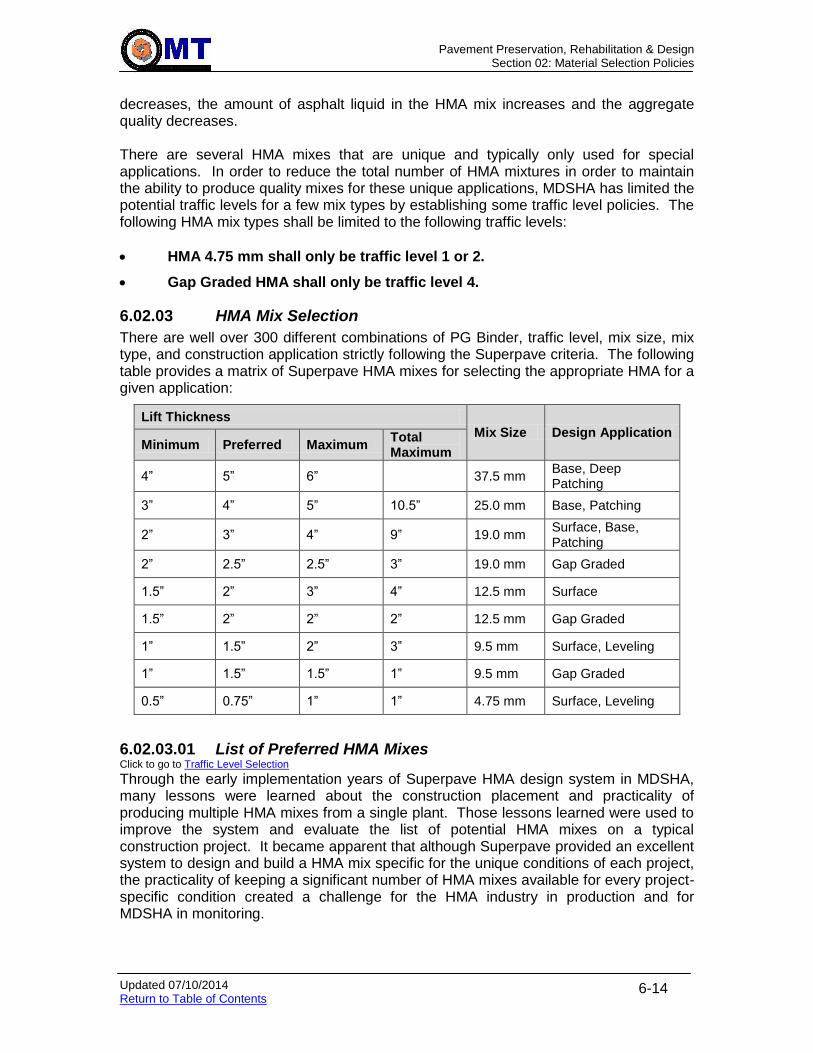
Pavement Preservation, Rehabilitation & Design
Section 02: Material Selection Policies
Updated 07/10/2014 Return to Table of Contents
6-14
decreases, the amount of asphalt liquid in the HMA mix increases and the aggregate quality decreases. There are several HMA mixes that are unique and typically only used for special applications. In order to reduce the total number of HMA mixtures in order to maintain the ability to produce quality mixes for these unique applications, MDSHA has limited the potential traffic levels for a few mix types by establishing some traffic level policies. The following HMA mix types shall be limited to the following traffic levels:
HMA 4.75 mm shall only be traffic level 1 or 2.
Gap Graded HMA shall only be traffic level 4.
6.02.03 HMA Mix Selection
There are well over 300 different combinations of PG Binder, traffic level, mix size, mix type, and construction application strictly following the Superpave criteria. The following table provides a matrix of Superpave HMA mixes for selecting the appropriate HMA for a given application:
Lift Thickness
Mix Size Design Application Minimum Preferred Maximum
Total Maximum
4” 5” 6” 37.5 mm Base, Deep Patching
3” 4” 5” 10.5” 25.0 mm Base, Patching
2” 3” 4” 9” 19.0 mm Surface, Base, Patching
2” 2.5” 2.5” 3” 19.0 mm Gap Graded
1.5” 2” 3” 4” 12.5 mm Surface
1.5” 2” 2” 2” 12.5 mm Gap Graded
1” 1.5” 2” 3” 9.5 mm Surface, Leveling
1” 1.5” 1.5” 1” 9.5 mm Gap Graded
0.5” 0.75” 1” 1” 4.75 mm Surface, Leveling
6.02.03.01 List of Preferred HMA Mixes Click to go to Traffic Level Selection
Through the early implementation years of Superpave HMA design system in MDSHA, many lessons were learned about the construction placement and practicality of producing multiple HMA mixes from a single plant. Those lessons learned were used to improve the system and evaluate the list of potential HMA mixes on a typical construction project. It became apparent that although Superpave provided an excellent system to design and build a HMA mix specific for the unique conditions of each project, the practicality of keeping a significant number of HMA mixes available for every project-specific condition created a challenge for the HMA industry in production and for MDSHA in monitoring.

Pavement Preservation, Rehabilitation & Design
Section 02: Material Selection Policies
Updated 07/10/2014 Return to Table of Contents
6-15
Therefore, MDSHA and the Asphalt industry partnered together to evaluate the use of HMA mixes and the applications over several construction seasons. The goal was to develop a list of preferred HMA mixes that would be used on a majority of the projects for MDSHA. The partnering team first identified the HMA mix types used most frequently on MDSHA projects for construction applications. That list was then compared to the production and storage demands of a typical HMA industry producer. This preferred list was focused on using HMA mixes that provide high quality long term performance and yield consistent production results. The following is the preferred list of HMA mixes:
Preferred HMA Mixes # Mix Designation
1 9.5 mm PG 64S-22 Level 2
2 9.5 mm PG 64S-22 Level 4
3 9.5 mm PG 64E-22 Level 2
4 9.5 mm PG 64E-22 Level 4
5 9.5 mm PG 64S-22 Level 2 HDFV
6 9.5 mm PG 64S-22 Level 4 HDFV
7 9.5 mm PG 64E-22 Level 2 HDFV
8 9.5 mm PG 64E-22 Level 4 HDFV
9 9.5 mm PG 64E-22 Level 4 GAP
10 12.5 mm PG 64S-22 Level 2
11 12.5 mm PG 64S-22 Level 4
12 12.5 mm PG 64E-22 Level 2
13 12.5 mm PG 64E-22 Level 4
14 12.5 mm PG 64S-22 Level 2 HDFV
15 12.5 mm PG 64S-22 Level 4 HDFV
16 12.5 mm PG 64E-22 Level 2 HDFV
17 12.5 mm PG 64E-22 Level 4 HDFV
18 12.5 mm PG 64E-22 Level 4 GAP
19 19.0 mm PG 64S-22 Level 2
20 25.0 mm PG 64S-22 Level 2
The preferred list does not prohibit other HMA mixes from being utilized on projects that require specific material selection properties. However, this list shall be used on the vast majority of all MDSHA projects.
Traffic Level 4 shall be specified for base, patching and wedge/level applications when the cumulative 20-year ESALs is greater than 30 million. A Gap Graded surface shall be used in conditions with greater than 30 million cumulative 20-year ESALs.
6.02.03.02 Number of Traffic Levels per Mix One (1) traffic level will be specified for each mix within a contract. Exceptions to this policy will be granted if the quantity of the mixes exceed 5,000 tons for each traffic level.
6.02.03.03 Number of PG Binders per Contract A maximum of two (2) PG binders will be specified within a contract. If a minimum PG binder can be specified for a particular project, the contractor can provide a higher grade

Pavement Preservation, Rehabilitation & Design
Section 02: Material Selection Policies
Updated 07/10/2014 Return to Table of Contents
6-16
PG binder without objection. The temperature range for the PG Binder has to be the same or greater than that specified in the contract specifications.
6.02.03.04 Number of HMA Mix Sizes per Contract The goal is to have a maximum of three (3) HMA Superpave mix sizes per contract. Exceptions to this policy will be granted if the quantity of the mixes exceed 5,000 tons for a HMA mix.
6.02.03.05 Placement of Final Surface Material An effort shall be made to place the final surface layer on an HMA Superpave 19.0 mm base layer or finer material when grinding is not included in the project. This surface layer policy also includes the placement of the surface layer over full-depth and partial-depth patch areas. The goal is to provide the best opportunity for optimum final ride quality.
6.02.04 Wearing Surface Selection Click to go to Performance Grade Binder Selection
The wearing surface in a HMA pavement can vary depending on the existing site conditions, anticipated traffic conditions, and material availability. Some of the decisions made about the wearing course selection can greatly alter the performance and the cost of the materials in a particular project. For that reason and to provide a level of consistency through the state, material selection policies were developed for a wearing course.
6.02.04.01 Specifying Gap Graded HMA Mixes All HMA Gap Graded mixes shall be PG 64E-22 and traffic level 4. The following conditions need to the present prior to considering the selection of a Gap Graded HMA mix for the wearing course:
Traffic level 4 or higher, and
With a functional class of Principal Arterial or greater.
In addition, minor arterials can be considered for Gap Graded mixes if joint reflection cracking is an issue, since performance data and laboratory testing have shown that Gap Graded mixes perform significantly better than dense graded mixes in inhibiting joint reflection cracks. Refer to Gap Graded Stone Matrix Asphalt (SMA) Mixtures: for further discussion on reflective crack control.
6.02.04.02 Specifying High Dynamic Friction Value HMA Mixes The following conditions need to the present prior to considering the selection of a High Dynamic Friction HMA mix for the wearing course:
At least 1 of the following items:
Greater than 25,000 ADT (Two-way) in the design year, or
Skid Number values < 40, or
Greater than 25% of the mainline area is exhibiting polished aggregate as a distress.
Pavement Preservation, Rehabilitation & Design
Section 02: Material Selection Policies
Updated 07/10/2014 Return to Table of Contents
6-17
6.02.04.03 Specifying HMA Superpave 4.75 mm Mix The HMA Superpave 4.75 mm mix shall not be used, as it historically has had poor, short-lived performance.
6.02.05 Reflective Crack Control
Composite pavements make up the second largest pavement type percentage of MDSHA’s pavement network. Reflective cracking is the most predominant distress present in composite pavements in Maryland. For this reason, several policies were developed in an attempt to limit the amount of reflective cracking in Maryland’s composite pavements. HMA overlays may be applied to an existing pavement (flexible or rigid) when the structural or functional conditions of the pavement have reached an unacceptable level of deterioration. Most of the overlays are designed to reflect an increase in the pavement resistance to fatigue and rutting. However, pavements that are structurally sound after the placement of the overlay, and that are adequately designed against rutting and fatigue, may show cracking patterns similar to existing ones in the old pavement after a short period of time. This pattern is known as “reflective cracking”. Although it is certainly the most common failure mechanism in rehabilitated pavements, the reflection of existing discontinuities in the pavement through the overlay is rarely considered in the design process. Field experiences indicate that reflective cracks usually propagate to the pavement surface at a rate of approximately 1 inch every 1 to 3 years and appear at the surface. Reflective cracks should be minimized to retain the structural integrity of the HMA overlays, prevent water intrusion and thereby preserve the bearing capacity of the underlying layers, prevent pumping of soil particles, increase user safety and maintain a smooth riding surface. Before any attempt can be made to prevent these cracks, it is important to understand the type of reflection cracking for a given project, so that the appropriate mitigation strategy can be designed and an economical determination of material properties and treatments can be established.
6.02.05.01 Types of Reflective Cracking 6.02.05.01.01 Thermally-induced Reflective Cracking: The most common accepted cause of reflective cracking is from horizontal movements concentrated at joints and cracks in the existing pavement, and is referred to as thermally-induced reflective cracking. These horizontal movements are caused by temperature changes in the PCC slab and from temperature changes in the HMA layers that exhibit transverse cracks. The critical condition for reflective cracks due to horizontal slab movements occurs when the temperature drops from day time to night time. The tensile stresses and strains resulting from joint movements become critical in the areas of construction joints and cracks, because of the bond between the overlay and the existing pavement as shown in Figure 1 below. The movement of transverse cracking due to thermal forces (daily and seasonal) is very important to understand ie., whether they initiate at the surface of a pavement (overlay) and grow downwards or they originate and propagate from an old crack or joint in the existing pavement structure upwards. This will dictate the optimum or cost-effective maintenance strategy.
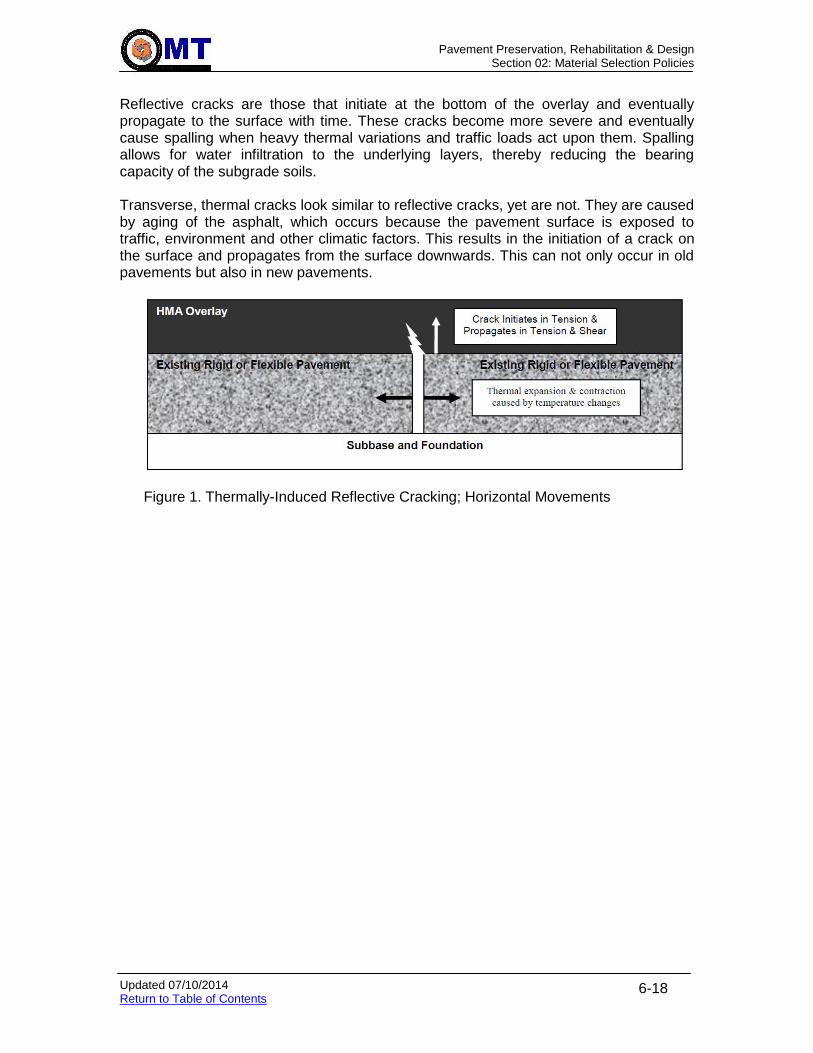
Pavement Preservation, Rehabilitation & Design
Section 02: Material Selection Policies
Updated 07/10/2014 Return to Table of Contents
6-18
Reflective cracks are those that initiate at the bottom of the overlay and eventually propagate to the surface with time. These cracks become more severe and eventually cause spalling when heavy thermal variations and traffic loads act upon them. Spalling allows for water infiltration to the underlying layers, thereby reducing the bearing capacity of the subgrade soils.
Transverse, thermal cracks look similar to reflective cracks, yet are not. They are caused by aging of the asphalt, which occurs because the pavement surface is exposed to traffic, environment and other climatic factors. This results in the initiation of a crack on the surface and propagates from the surface downwards. This can not only occur in old pavements but also in new pavements.
Figure 1. Thermally-Induced Reflective Cracking; Horizontal Movements
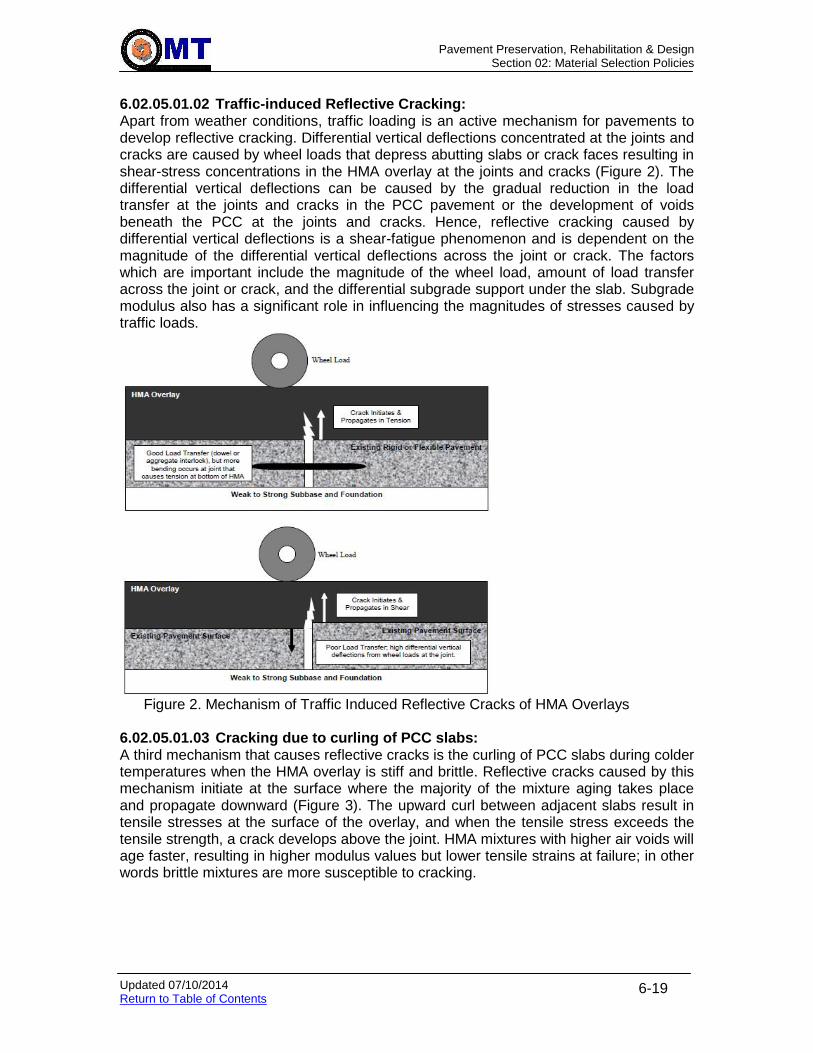
Pavement Preservation, Rehabilitation & Design
Section 02: Material Selection Policies
Updated 07/10/2014 Return to Table of Contents
6-19
6.02.05.01.02 Traffic-induced Reflective Cracking: Apart from weather conditions, traffic loading is an active mechanism for pavements to develop reflective cracking. Differential vertical deflections concentrated at the joints and cracks are caused by wheel loads that depress abutting slabs or crack faces resulting in shear-stress concentrations in the HMA overlay at the joints and cracks (Figure 2). The differential vertical deflections can be caused by the gradual reduction in the load transfer at the joints and cracks in the PCC pavement or the development of voids beneath the PCC at the joints and cracks. Hence, reflective cracking caused by differential vertical deflections is a shear-fatigue phenomenon and is dependent on the magnitude of the differential vertical deflections across the joint or crack. The factors which are important include the magnitude of the wheel load, amount of load transfer across the joint or crack, and the differential subgrade support under the slab. Subgrade modulus also has a significant role in influencing the magnitudes of stresses caused by traffic loads.
Figure 2. Mechanism of Traffic Induced Reflective Cracks of HMA Overlays
6.02.05.01.03 Cracking due to curling of PCC slabs: A third mechanism that causes reflective cracks is the curling of PCC slabs during colder temperatures when the HMA overlay is stiff and brittle. Reflective cracks caused by this mechanism initiate at the surface where the majority of the mixture aging takes place and propagate downward (Figure 3). The upward curl between adjacent slabs result in tensile stresses at the surface of the overlay, and when the tensile stress exceeds the tensile strength, a crack develops above the joint. HMA mixtures with higher air voids will age faster, resulting in higher modulus values but lower tensile strains at failure; in other words brittle mixtures are more susceptible to cracking.
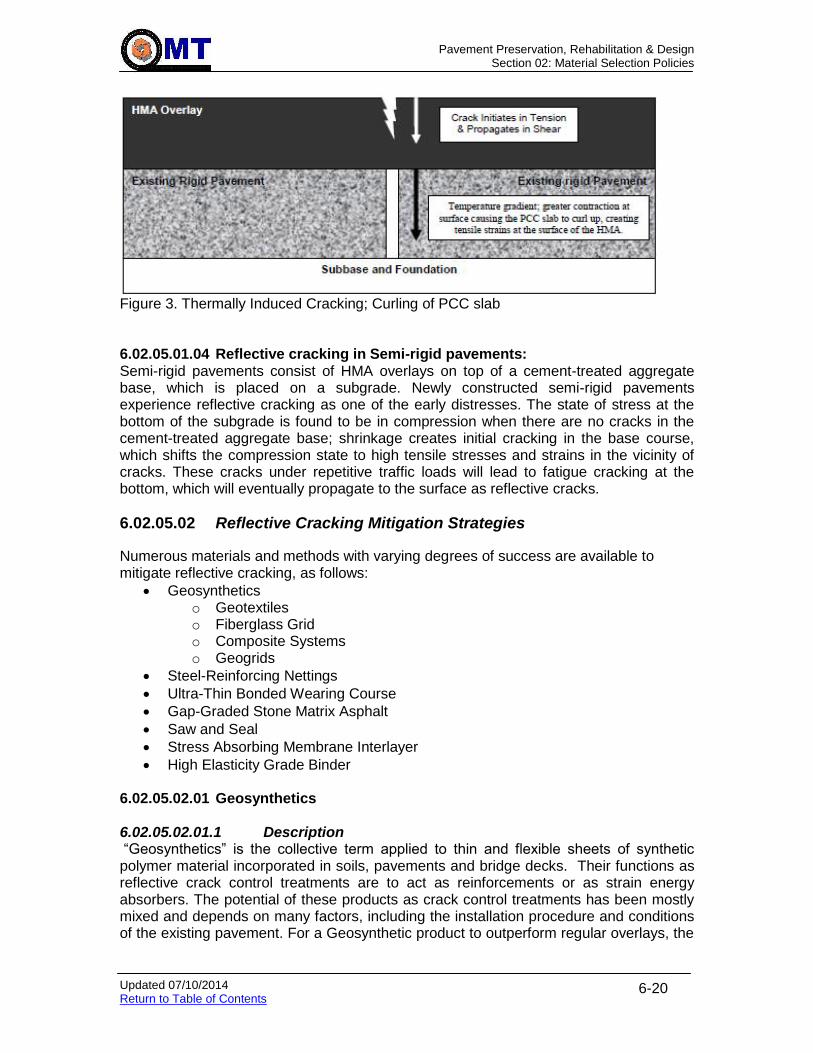
Pavement Preservation, Rehabilitation & Design
Section 02: Material Selection Policies
Updated 07/10/2014 Return to Table of Contents
6-20
Figure 3. Thermally Induced Cracking; Curling of PCC slab 6.02.05.01.04 Reflective cracking in Semi-rigid pavements: Semi-rigid pavements consist of HMA overlays on top of a cement-treated aggregate base, which is placed on a subgrade. Newly constructed semi-rigid pavements experience reflective cracking as one of the early distresses. The state of stress at the bottom of the subgrade is found to be in compression when there are no cracks in the cement-treated aggregate base; shrinkage creates initial cracking in the base course, which shifts the compression state to high tensile stresses and strains in the vicinity of cracks. These cracks under repetitive traffic loads will lead to fatigue cracking at the bottom, which will eventually propagate to the surface as reflective cracks.
6.02.05.02 Reflective Cracking Mitigation Strategies
Numerous materials and methods with varying degrees of success are available to mitigate reflective cracking, as follows:
Geosynthetics o Geotextiles o Fiberglass Grid o Composite Systems o Geogrids
Steel-Reinforcing Nettings
Ultra-Thin Bonded Wearing Course
Gap-Graded Stone Matrix Asphalt
Saw and Seal
Stress Absorbing Membrane Interlayer
High Elasticity Grade Binder 6.02.05.02.01 Geosynthetics 6.02.05.02.01.1 Description “Geosynthetics” is the collective term applied to thin and flexible sheets of synthetic polymer material incorporated in soils, pavements and bridge decks. Their functions as reflective crack control treatments are to act as reinforcements or as strain energy absorbers. The potential of these products as crack control treatments has been mostly mixed and depends on many factors, including the installation procedure and conditions of the existing pavement. For a Geosynthetic product to outperform regular overlays, the
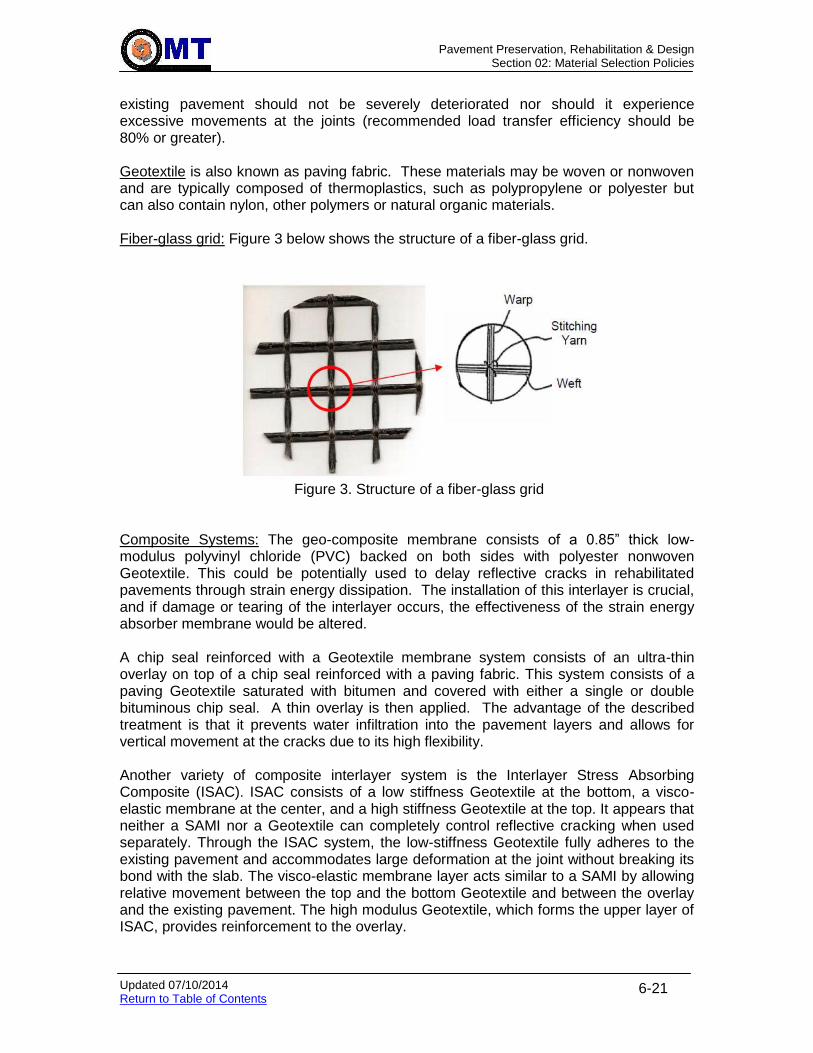
Pavement Preservation, Rehabilitation & Design
Section 02: Material Selection Policies
Updated 07/10/2014 Return to Table of Contents
6-21
existing pavement should not be severely deteriorated nor should it experience excessive movements at the joints (recommended load transfer efficiency should be 80% or greater). Geotextile is also known as paving fabric. These materials may be woven or nonwoven and are typically composed of thermoplastics, such as polypropylene or polyester but can also contain nylon, other polymers or natural organic materials. Fiber-glass grid: Figure 3 below shows the structure of a fiber-glass grid.
Figure 3. Structure of a fiber-glass grid
Composite Systems: The geo-composite membrane consists of a 0.85” thick low-modulus polyvinyl chloride (PVC) backed on both sides with polyester nonwoven Geotextile. This could be potentially used to delay reflective cracks in rehabilitated pavements through strain energy dissipation. The installation of this interlayer is crucial, and if damage or tearing of the interlayer occurs, the effectiveness of the strain energy absorber membrane would be altered. A chip seal reinforced with a Geotextile membrane system consists of an ultra-thin overlay on top of a chip seal reinforced with a paving fabric. This system consists of a paving Geotextile saturated with bitumen and covered with either a single or double bituminous chip seal. A thin overlay is then applied. The advantage of the described treatment is that it prevents water infiltration into the pavement layers and allows for vertical movement at the cracks due to its high flexibility.
Another variety of composite interlayer system is the Interlayer Stress Absorbing Composite (ISAC). ISAC consists of a low stiffness Geotextile at the bottom, a visco-elastic membrane at the center, and a high stiffness Geotextile at the top. It appears that neither a SAMI nor a Geotextile can completely control reflective cracking when used separately. Through the ISAC system, the low-stiffness Geotextile fully adheres to the existing pavement and accommodates large deformation at the joint without breaking its bond with the slab. The visco-elastic membrane layer acts similar to a SAMI by allowing relative movement between the top and the bottom Geotextile and between the overlay and the existing pavement. The high modulus Geotextile, which forms the upper layer of ISAC, provides reinforcement to the overlay.
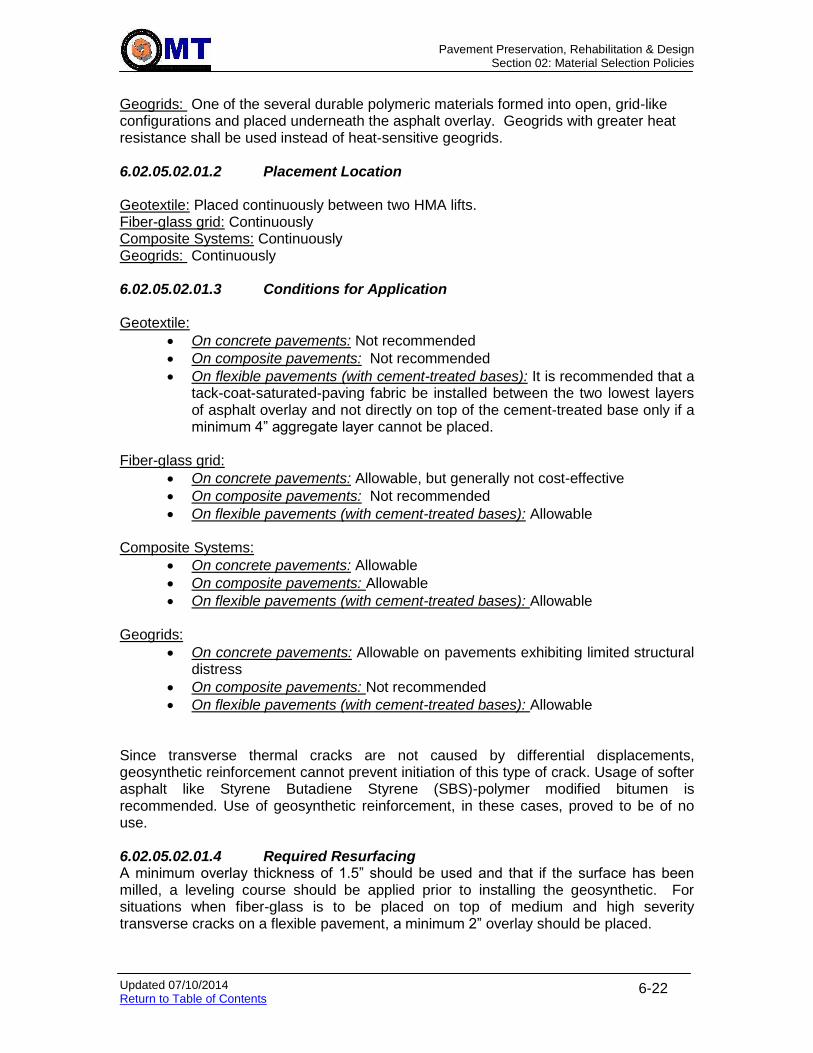
Pavement Preservation, Rehabilitation & Design
Section 02: Material Selection Policies
Updated 07/10/2014 Return to Table of Contents
6-22
Geogrids: One of the several durable polymeric materials formed into open, grid-like configurations and placed underneath the asphalt overlay. Geogrids with greater heat resistance shall be used instead of heat-sensitive geogrids. 6.02.05.02.01.2 Placement Location Geotextile: Placed continuously between two HMA lifts. Fiber-glass grid: Continuously Composite Systems: Continuously Geogrids: Continuously 6.02.05.02.01.3 Conditions for Application Geotextile:
On concrete pavements: Not recommended
On composite pavements: Not recommended
On flexible pavements (with cement-treated bases): It is recommended that a tack-coat-saturated-paving fabric be installed between the two lowest layers of asphalt overlay and not directly on top of the cement-treated base only if a minimum 4” aggregate layer cannot be placed.
Fiber-glass grid:
On concrete pavements: Allowable, but generally not cost-effective
On composite pavements: Not recommended
On flexible pavements (with cement-treated bases): Allowable
Composite Systems:
On concrete pavements: Allowable
On composite pavements: Allowable
On flexible pavements (with cement-treated bases): Allowable Geogrids:
On concrete pavements: Allowable on pavements exhibiting limited structural distress
On composite pavements: Not recommended
On flexible pavements (with cement-treated bases): Allowable Since transverse thermal cracks are not caused by differential displacements, geosynthetic reinforcement cannot prevent initiation of this type of crack. Usage of softer asphalt like Styrene Butadiene Styrene (SBS)-polymer modified bitumen is recommended. Use of geosynthetic reinforcement, in these cases, proved to be of no use. 6.02.05.02.01.4 Required Resurfacing A minimum overlay thickness of 1.5” should be used and that if the surface has been milled, a leveling course should be applied prior to installing the geosynthetic. For situations when fiber-glass is to be placed on top of medium and high severity transverse cracks on a flexible pavement, a minimum 2” overlay should be placed.
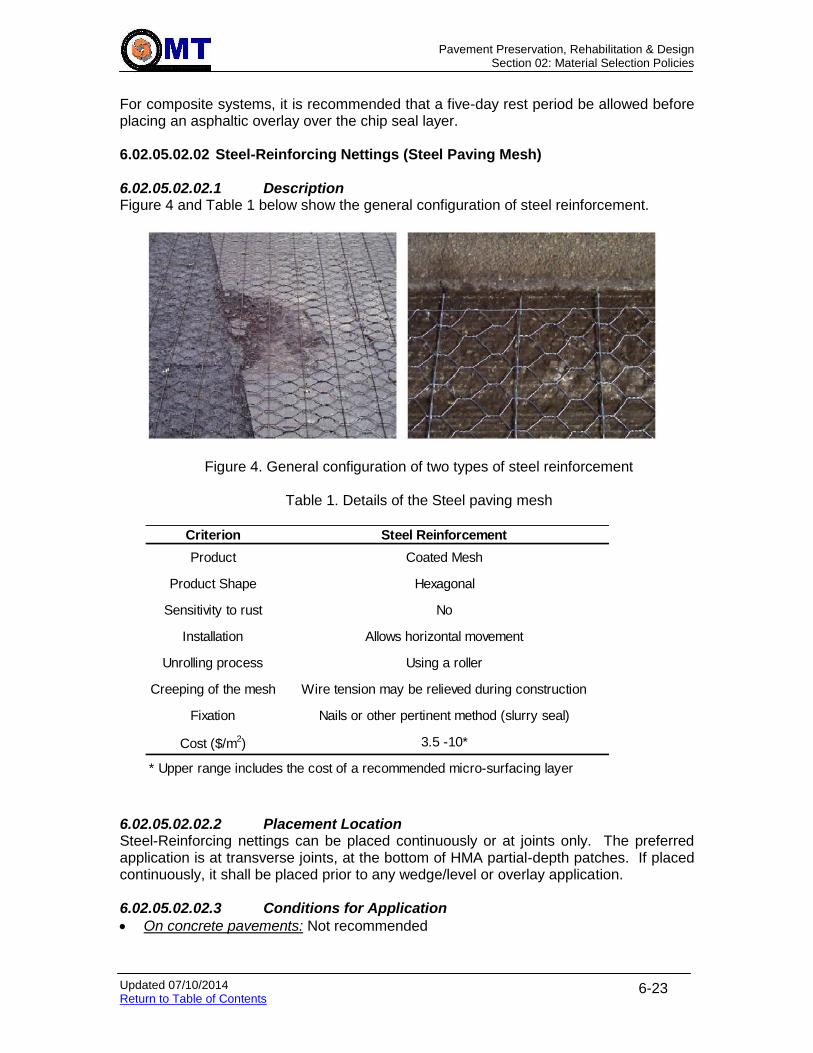
Pavement Preservation, Rehabilitation & Design
Section 02: Material Selection Policies
Updated 07/10/2014 Return to Table of Contents
6-23
For composite systems, it is recommended that a five-day rest period be allowed before placing an asphaltic overlay over the chip seal layer.
6.02.05.02.02 Steel-Reinforcing Nettings (Steel Paving Mesh)
6.02.05.02.02.1 Description Figure 4 and Table 1 below show the general configuration of steel reinforcement.
Figure 4. General configuration of two types of steel reinforcement
Table 1. Details of the Steel paving mesh
6.02.05.02.02.2 Placement Location Steel-Reinforcing nettings can be placed continuously or at joints only. The preferred application is at transverse joints, at the bottom of HMA partial-depth patches. If placed continuously, it shall be placed prior to any wedge/level or overlay application.
6.02.05.02.02.3 Conditions for Application
On concrete pavements: Not recommended
Criterion Steel Reinforcement
Product Coated Mesh
Product Shape Hexagonal
Sensitivity to rust No
Installation Allows horizontal movement
Unrolling process Using a roller
Creeping of the mesh Wire tension may be relieved during construction
Fixation Nails or other pertinent method (slurry seal)
Cost ($/m2) 3.5 -10*
* Upper range includes the cost of a recommended micro-surfacing layer
Pavement Preservation, Rehabilitation & Design
Section 02: Material Selection Policies
Updated 07/10/2014 Return to Table of Contents
6-24
On composite pavements: Recommended at the interface between PCC and HMA at joints only.
On flexible pavements (with cement-treated bases): Not recommended Since transverse thermal cracks are not caused by differential displacement, steel-reinforcing netting cannot prevent initiation of this type of crack. Usage of softer asphalt like SBS-polymer modified bitumen is recommended. 6.02.05.02.02.4 Required Resurfacing A minimum 3” overlay on top of the steel reinforcement should be used. It is important to note that this steel netting cannot be ground in future mill and overlay operations.
6.02.05.02.03 Ultrathin Bonded Wearing Course 6.02.05.02.03.1 Description Refer to the Ultrathin Bonded Wearing Course section in HMA Overlay:. 6.02.05.02.03.2 Placement Location Ultrathin Bonded Wearing Course shall be placed continuously, and is the surface.
6.02.05.02.03.3 Conditions for Application
On concrete pavements: Not recommended
On composite pavements: Recommended.
On flexible pavements (with cement-treated bases): Recommended. 6.02.05.02.03.4 Required Resurfacing NA. 6.02.05.02.04 Gap Graded Stone Matrix Asphalt (SMA) Mixtures 6.02.05.02.04.1 Description Refer to Material Description. In the laboratory and field, use of SMA appeared to reduce reflective cracking by a factor of 5, and even when reflective cracks appeared, these few cracks remained tight and were not raveling. This could be attributed to the high asphalt content and to the use of polymers, which allow SMA to remain adjacent to the cracks. 6.02.05.02.04.2 Placement Location SMA shall be placed continuously, and is the surface.
6.02.05.02.04.3 Conditions for Application Recommended for all cases with reflective cracking, provided sufficient ADT exists. Refer to Specifying Gap Graded HMA Mixes. 6.02.05.02.04.4 Required Resurfacing NA.

Pavement Preservation, Rehabilitation & Design
Section 02: Material Selection Policies
Updated 07/10/2014 Return to Table of Contents
6-25
6.02.05.02.05 Saw and Seal 6.02.05.02.05.1 Description Refer to the Saw and Seal section in Crack / Joint Seals: 6.02.05.02.05.2 Placement Location The saw and seal operation should be performed promptly after placement of the overlay but at least 48 hours after paving. The success of saw and seal depends on applying the treatment at the exact locations of the joints. It was observed that a saw cut more than 1 in. away from the joint would result in secondary cracking. Prior to the overlay, the existing joints on the concrete pavement are located and marked. Joints are then reestablished with chalk after the overlay. These joints are dry cut using a rideable concrete saw. The cuts are cleaned prior to placing the sealant. The cleaning process involves usage of hot compressed air to get rid of all the dust particles, loose debris and most importantly, moisture that clings to the walls of the groove. For cleaner joints, a sand blaster may be used to remove any remaining debris. The final step is to seal the joints with a low-modulus rubberized sealant. Most of the grooves are overfilled from the bottom up and then followed by squeegeeing to make the applied sealant flush with the pavement surface. The sealant cools and contracts quickly once the squeegeeing process is completed.
6.02.05.02.05.3 Conditions for Application
On concrete pavements: Recommended
On composite pavements: Not recommended.
On flexible pavements (with cement-treated bases): Not recommended. 6.02.05.02.05.4 Required Resurfacing NA. 6.02.05.02.06 Stress Absorbing Membrane Interlayer (SAMI): 6.02.05.02.06.1 Description SAMI is constructed by placing a seal coat made of rubber asphalt binder (80 percent asphalt cement and 20 percent ground tire rubber) on the surface of the old pavement and then rolling in coarse aggregate chips. This layer may be used as a stress-relief interlayer. Two types of SAMI are available: SAMI-R (rubberized) and SAMI-F (fabric). SAMI-R was designed to provide structural strength to the pavement besides retarding reflective cracks when used with rubberized asphaltic concrete. There are some factors that may limit the performance of SAMI if it is not properly constructed. In a hot environment, SAMI should be used carefully as it prevents evaporation of moisture from the subgrade, which would eventually weaken the substructure of the pavement.
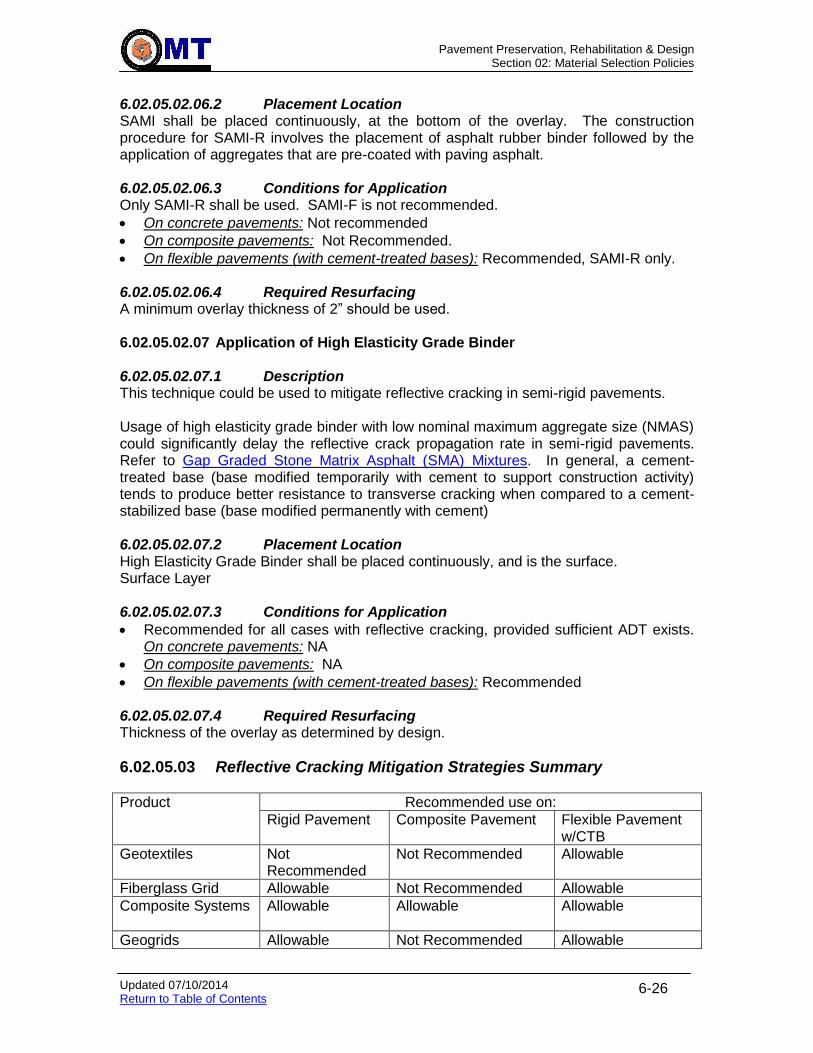
Pavement Preservation, Rehabilitation & Design
Section 02: Material Selection Policies
Updated 07/10/2014 Return to Table of Contents
6-26
6.02.05.02.06.2 Placement Location SAMI shall be placed continuously, at the bottom of the overlay. The construction procedure for SAMI-R involves the placement of asphalt rubber binder followed by the application of aggregates that are pre-coated with paving asphalt.
6.02.05.02.06.3 Conditions for Application Only SAMI-R shall be used. SAMI-F is not recommended.
On concrete pavements: Not recommended
On composite pavements: Not Recommended.
On flexible pavements (with cement-treated bases): Recommended, SAMI-R only.
6.02.05.02.06.4 Required Resurfacing A minimum overlay thickness of 2” should be used. 6.02.05.02.07 Application of High Elasticity Grade Binder 6.02.05.02.07.1 Description This technique could be used to mitigate reflective cracking in semi-rigid pavements. Usage of high elasticity grade binder with low nominal maximum aggregate size (NMAS) could significantly delay the reflective crack propagation rate in semi-rigid pavements. Refer to Gap Graded Stone Matrix Asphalt (SMA) Mixtures. In general, a cement-treated base (base modified temporarily with cement to support construction activity) tends to produce better resistance to transverse cracking when compared to a cement-stabilized base (base modified permanently with cement) 6.02.05.02.07.2 Placement Location High Elasticity Grade Binder shall be placed continuously, and is the surface. Surface Layer
6.02.05.02.07.3 Conditions for Application
Recommended for all cases with reflective cracking, provided sufficient ADT exists. On concrete pavements: NA
On composite pavements: NA
On flexible pavements (with cement-treated bases): Recommended 6.02.05.02.07.4 Required Resurfacing Thickness of the overlay as determined by design.
6.02.05.03 Reflective Cracking Mitigation Strategies Summary
Product Recommended use on:
Rigid Pavement Composite Pavement Flexible Pavement w/CTB
Geotextiles
Not Recommended
Not Recommended Allowable
Fiberglass Grid Allowable Not Recommended Allowable
Composite Systems
Allowable Allowable Allowable
Geogrids Allowable Not Recommended Allowable

Pavement Preservation, Rehabilitation & Design
Section 02: Material Selection Policies
Updated 07/10/2014 Return to Table of Contents
6-27
Product Recommended use on:
Rigid Pavement Composite Pavement Flexible Pavement w/CTB
Steel-Reinforcing Nettings
Not Recommended
Recommended Not Recommended
Ultra-Thin Bonded Wearing Course
Not Recommended
Recommended Recommended
Gap-Graded Stone Matrix Asphalt
Recommended Recommended Recommended
Saw and Seal Recommended Not Recommended Not Recommended
Stress Absorbing Membrane Interlayer
Not Recommended
Not Recommended Recommended
High Elasticity Grade Binder
Not Recommended
Not Recommended Allowable
6.02.05.04 Minimum HMA Overlay Thickness on Rigid Pavement
Four inches is the minimum thickness for a plain HMA overlay on bare jointed concrete pavement, without the use of any other material to limit reflective cracking. CRCP pavements can have a 3” overlay.
6.02.06 GAB vs. Capping Borrow
In general, Graded Aggregate Base is the preferred base type. However, Capping Borrow should be strongly considered in southern Maryland on either side of the Chesapeake: areas where sandy material is common and GAB would have to be shipped long distances. For these areas, consult with the District to determine their preference.

Pavement Preservation, Rehabilitation & Design
Section 03: New Pavement Design
Updated 06-11-14 Return to Table of Contents
6-28
6.03 NEW PAVEMENT DESIGN Click to go to Pavement Mechanistic-Empirical Analysis Click to go to Pavement Preservation & Rehabilitation Design Click to go to Standard Pavement Designs Click to go to Preliminary Pavement Recommendation Click to go to New Pavement Design Using AASHTO 1993
6.03.01 Purpose
New pavement designs are conducted to:
Create a pavement system that will meet the future structural and functional demands of the expected traffic volumes
Identify the material requirements to provide a structurally and functionally adequate pavement system.
6.03.02 Resource Requirements
The new pavement design procedure documented below requires the following staffing needs for a typical job:
Position Function Resources Effort Level (man-hours)
Pavement Engineer New Design 1 24
6.03.03 Procedure
The procedure described in the following text should be followed in a typical new pavement design recommendation. The following procedure was written to provide the design engineer with adequate information to complete a new design using PMED. For pavement designs using AASHTO 1993 procedures (such as for Design-Build), refer to New Pavement Design Using AASHTO 1993.
Certain steps in the new pavement design process and other processes overlap. It is important to keep in mind that although these processes are broken out and written in separate sections, they are a part of an overall process to provide logically and technically sound recommendations.
In most cases, a new pavement design is completed in conjunction with a pavement rehabilitation design; i.e. “widening and resurfacing.” Therefore, the new and rehabilitation design process may occur concurrently and use the same data and information. The basic difference is that pavement rehabilitation design requires the evaluation and assessment of the existing roadway, both structurally and functionally.
New pavement design does not take into account any of the existing conditions of the pavement other than geotechnical and drainage conditions because it is a new design. It is the design engineer’s responsibility to use both design processes concurrently where needed and take care to monitor that both designs are agreeable with one another for design and for construction related reasons.
6.03.03.01 Preliminary Steps
Step 1. Enter the project and pertinent project information into the DesignProjects database so the project can be tracked. Also, create a folder on the network server under the ‘Projects’ folder under the appropriate District and county. Refer to Electronic File Storage.

Pavement Preservation, Rehabilitation & Design
Section 03: New Pavement Design
Updated 06-11-14 Return to Table of Contents
6-29
Step 2. Conduct the steps as detailed in Preliminary Procedures.
Step 3. Conduct the steps as detailed in Testing & Data Collection.
Step 4. Conduct the steps as detailed in Analysis Procedures.
6.03.03.02 New Pavement ME Design
Step 1. Create a pavement structure and analyze it per Pavement Mechanistic-Empirical Analysis.
Step 2. Ideally, the various distresses that are analyzed will reach their respective terminal thresholds at around the same time. If that is the case, the design is good. If they do not, repeat Step 1 as needed using different designs by varying layer types and thicknesses.
6.03.03.02.01 Flexible Pavement Design Click to go to Flexible Pavements
Flexible pavements must have a minimum 4” drainage layer.
6.03.03.02.02 Jointed Plain Concrete Pavement Design Click to go to Jointed Plain Concrete Pavement in PMED Click to go to Jointed Plain Concrete Pavement in AASHTO 1993
Step 1. JPC pavements must have a minimum 4” drainage layer.
Step 2. PCC joint spacing: The transverse joint spacing shall not be greater than 15 feet. A general guideline is that the joint spacing in feet should be twice the slab thickness in inches. Consistently spaced joints shall be used in the design of rigid pavement for MDSHA. Skewed joints shall not be used.
Step 3. Sealant type: MDSHA does not recommend the use of sealant in transverse joints.
Step 4. Transverse Joints: The depth of the transverse joint should be ¼ of the slab thickness. Sawing should be 1/8” wide and done as soon as possible after adequate compressive strength as been achieved by the PCC slab.
Dowels joints: A load transfer mechanism at all transverse joints using dowel bars are required for all JPCP pavement designs. Dowels shall be round smooth steel bars, conforming to a Grade 60 or higher.
As a guideline, the dowel diameter should be approximately one-eighth (1/8th) that of the slab thickness. Dowel bars shall be 18 inches long, spaced 12 inches on center. Dowels shall be coated with epoxy to retard corrosion in the steel. Dowels are placed mid-depth of the PCC slab.
Step 5. Widened slab: The widened slab should be checked “True” only if the longitudinal joint is at least one foot wider than the paint line. Where feasible, it is recommended to have a widened slab, one foot wider than the travel lane. Where this occurs, it is not necessary to tie the longitudinal joints. If a widened slab is not feasible, it is recommended to tie the longitudinal joints.
Pavement Preservation, Rehabilitation & Design
Section 03: New Pavement Design
Updated 06-11-14 Return to Table of Contents
6-30
Longitudinal Joints: Longitudinal joints are typically formed during PCC placement when lanes are paved in separate passes.
When slabs need to be tied, a tie bar steel design is required. Use the following guidelines to design the tie bar steel reinforcement for longitudinal joints:
Steel Grade: Use Grade 40. Yield strength for Grade 40 steel is 40 ksi.
Bar Diameter: The bar diameter is the dimension of interest for steel design of rigid pavement. Use #4 (0.5” diameter) or #5 (0.625” diameter) size bars. Refer to Steel Reinforcement Bar Dimensions.
Tie Bar Spacing: 36”
Tie Bar Length: 36”
6.03.03.02.03 Continuous Reinforced Concrete Pavement Design Click to go to Continuous Reinforced Concrete Pavement Click to go to CRCP steel reinforcement design inputs – AASHTO 1993
Step 1. CRC pavements must have a minimum 4” drainage layer.
Step 2. The shoulder should be concrete. If for some reason that is not chosen, HMA is the secondary choice.
Step 3. For the steel percentage, less steel equals higher crack spacing and larger crack widths. Ideally, crack spacing should be between 3 and 6 feet, and most importantly, the maximum crack width should be 0.02 inches. Typical steel percentage should be between 0.7% and 0.8%, but may go as low as 0/6%.
Step 4. Longitudinal Steel: for the reinforcing steel size and spacing, target 5” to 6” spacing, which combined with the steel percentage will help determine rebar size. Refer to Steel Reinforcement Bar Dimensions. All rebar should be placed on chairs. Avoid splices along the same line; splices should be skewed or staggered to avoid rebar/concrete interference.
Step 5. Transverse Steel: Specify #5 bars at 36” spacing.
Historical performance and PMED modeling have shown the best performance when steel reinforcement is placed as shallow as possible, without compromising minimum cover depth.
Tie-Bar Spacing and Length: 36”. Use Grade 40 steel.
6.03.03.03 Shoulder Design The following guidelines should be considered when designing the shoulders:
Median shoulders less than 4’ in width are designed with the same pavement structure as the mainline roadway.
Median shoulders greater than 4’ in width are designed with 2’ of the shoulder next to the mainline having the same pavement structure as the mainline roadway. The
Pavement Preservation, Rehabilitation & Design
Section 03: New Pavement Design
Updated 06-11-14 Return to Table of Contents
6-31
remaining width of the shoulder is designed following shoulder design guidelines. Refer to Shoulder Design.
Outside shoulders requiring a traffic level of 4 (greater than 10 million ESAL) or greater for Superpave mix design shall be designed with 2’ of the shoulder next to the mainline match the pavement structure of the mainline roadway. The remaining width of the shoulder is designed following shoulder design guidelines. Refer to Shoulder Design.
6.03.03.04 Design QA
The new pavement design shall be checked for constructability issues. For base widening and new pavement designs, care shall be taken to ensure that the new section does not affect the performance of the existing roadway; i.e. drainage problems from a “bathtub” effect or poor construction joint from different pavement types, etc.
For new construction or reconstruction, care shall be taken to ensure that the pavement design can be constructed and perform well over the pavement service life; geometric and grade demands, MOT constraints, regional material constraints, etc.
Step 1. Develop a cost estimate as per Quantity & Cost Development.
Step 2. Discuss the new pavement design alternative with the Team Leader and Assistant Division Chief. Determine if the project meets the criteria established in Pavement Type Selection.
Step 3. Discuss new pavement design alternatives with the project owner and to select the final design alternative. The discussion with the project owner should involve input from Construction regarding constructability issues with each alternative.
Step 4. Prepare a memorandum and details as per Final Pavement & Geotechnical Report.
Step 5. Gather the appropriate Special Provisions and Detail Specifications to be attached to the recommendation memorandum. Refer to Construction and Material Specifications. The engineer should be familiar with the appropriate Special Provisions Inserts that need to be included in the contract documents.
Step 6. Complete the appropriate forms review process as per Management Review & QA. Place forms in project file.
Pavement Preservation, Rehabilitation & Design
Section 04: Pavement Drainage
Updated 11/26/2013 Return to Table of Contents
6-32
6.04 PAVEMENT DRAINAGE Click to go to New Pavement Design Using AASHTO 1993 Click to go to Pavement Preservation and Rehabilitation Design Using AASHTO 1993
Pavement drainage is a type of subsurface drainage for a specific reason; to drain the pavement section. Pavement drainage is intended to address the water that enters into the pavement structure from the surface and is intended to only drain the base and sub-base layers of the pavement structure. Existing groundwater, underground springs, or wet soil conditions are not going to be addressed through pavement drainage. Other drainage techniques need to be utilized in these cases. Refer to Subsurface Drainage for more information on these cases. The following section provides pavement drainage guidelines for new construction and widening projects.
6.04.01 Purpose
Pavement drainage is essential drain the base and sub-base layers in order to prevent premature deterioration and failures of the roadway pavement structure.
6.04.02 Resource Requirements
An evaluation of the current conditions/features and proposed scope is necessary to determine which pavement drainage tool(s) can be most beneficial and practical for the specific project. This procedure documented below requires the following staffing needs for a typical project:
Position Function Resources Effort Level (man-hours)
PAGD Engineer Records Review 1 4*
PAGD Engineer Prepare Recommendation and
Details
1 4*
* The time required would vary depending on the size and complexity of a project.
6.04.03 Procedure
The procedure described in the following text should be followed when selecting pavement drainage methods. Step 1. Review proposed plans, profiles and typicals thoroughly and make notes.
Note low points, areas of pavement superelevation, potential existing and proposed conflict with utilities and guardrail. Review as-builts for the possible existence of previous underdrain construction.
Step 2. Select an appropriate pavement drainage tool listed below and explained
later in this section. Longitudinal Underdrain is the default method for pavement drainage.
Step 3. Once a method(s) has been selected, include the recommendation for
pavement drainage as part of the Final Pavement and Geotechnical Report and Pavement Details.
Step 4. Review the Final Review plans. The Final Review plans should show
detailed construction notes for pavement drainage and outletting as noted

Pavement Preservation, Rehabilitation & Design
Section 04: Pavement Drainage
Updated 11/26/2013 Return to Table of Contents
6-33
from the FPGR. Pavement Details and pavement typical should show pavement drainage where applicable.
The drainage tools listed below are used to address pavement drainage for a specific project. Longitudinal Underdrain is the primary tool used by MDSHA to address pavement drainage. 1. Longitudinal Underdrain 2. Pre-fabricated Edge Drain 3. Open Graded Base
6.04.04 Longitudinal Underdrain
Longitudinal underdrain is a pavement drainage underdrain technique used specifically to drain the pavement section. Longitudinal underdrain is not design to address wet soils or correct other high water table issues. It is used to remove water that enters the pavement structure. Longitudinal underdrain by definition is placed longitudinally at the edge of the roadway. Longitudinal underdrain is to be used in conditions when water entering the pavement structure may not have an easy path away from the pavement structure either because of the geometry of the roadway or because of the draining capacity of the subgrade. Longitudinal underdrain is used for roadways in areas with fine grain frost susceptible or high capillary soils. They are placed continuously through all cuts and fills. Use four lines of longitudinal underdrain on divided highways with an unpaved median by placing one at each pavement edge. Use the three lines with a paved median with one line under the barrier. For closed sections, place longitudinal underdrain only through non-piped areas, opposite the storm drains. Always use longitudinal underdrain on PCC pavements, pavements with open graded base courses and interstate pavements. Be aware of the superelevation on high speed roadways because placing longitudinal underdrain at the high side of the super is not always logical. Longitudinal underdrain should not be used generally in rock cuts, projects that are mostly fill and have low water tables, projects that are very dry and have easily drainable soils, projects located where sand capping material is available and moisture conditions are not extreme, or projects with poor topography (i.e. flat). The following two tables provide guidelines for pavement base drainage (primarily though the use of Longitudinal Underdrains – LU) for new construction and widening projects:
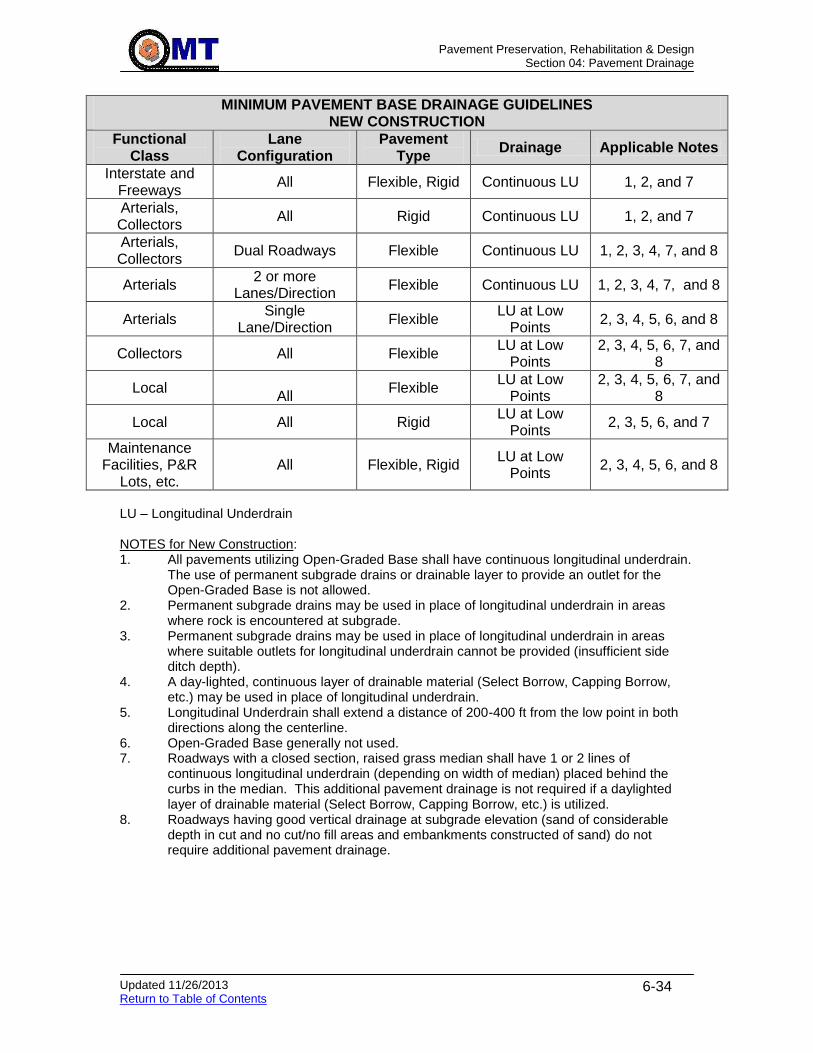
Pavement Preservation, Rehabilitation & Design
Section 04: Pavement Drainage
Updated 11/26/2013 Return to Table of Contents
6-34
MINIMUM PAVEMENT BASE DRAINAGE GUIDELINES NEW CONSTRUCTION
Functional Class
Lane Configuration
Pavement Type
Drainage Applicable Notes
Interstate and Freeways
All Flexible, Rigid Continuous LU 1, 2, and 7
Arterials, Collectors
All Rigid Continuous LU 1, 2, and 7
Arterials, Collectors
Dual Roadways Flexible Continuous LU 1, 2, 3, 4, 7, and 8
Arterials 2 or more
Lanes/Direction Flexible Continuous LU 1, 2, 3, 4, 7, and 8
Arterials Single
Lane/Direction Flexible
LU at Low Points
2, 3, 4, 5, 6, and 8
Collectors All Flexible LU at Low
Points 2, 3, 4, 5, 6, 7, and
8
Local
All Flexible
LU at Low Points
2, 3, 4, 5, 6, 7, and 8
Local All Rigid LU at Low
Points 2, 3, 5, 6, and 7
Maintenance Facilities, P&R
Lots, etc. All Flexible, Rigid
LU at Low Points
2, 3, 4, 5, 6, and 8
LU – Longitudinal Underdrain NOTES for New Construction: 1. All pavements utilizing Open-Graded Base shall have continuous longitudinal underdrain.
The use of permanent subgrade drains or drainable layer to provide an outlet for the Open-Graded Base is not allowed.
2. Permanent subgrade drains may be used in place of longitudinal underdrain in areas where rock is encountered at subgrade.
3. Permanent subgrade drains may be used in place of longitudinal underdrain in areas where suitable outlets for longitudinal underdrain cannot be provided (insufficient side ditch depth).
4. A day-lighted, continuous layer of drainable material (Select Borrow, Capping Borrow, etc.) may be used in place of longitudinal underdrain.
5. Longitudinal Underdrain shall extend a distance of 200-400 ft from the low point in both directions along the centerline.
6. Open-Graded Base generally not used. 7. Roadways with a closed section, raised grass median shall have 1 or 2 lines of
continuous longitudinal underdrain (depending on width of median) placed behind the curbs in the median. This additional pavement drainage is not required if a daylighted layer of drainable material (Select Borrow, Capping Borrow, etc.) is utilized.
8. Roadways having good vertical drainage at subgrade elevation (sand of considerable depth in cut and no cut/no fill areas and embankments constructed of sand) do not require additional pavement drainage.

Pavement Preservation, Rehabilitation & Design
Section 04: Pavement Drainage
Updated 11/26/2013 Return to Table of Contents
6-35
MINIMUM PAVEMENT BASE DRAINAGE GUIDELINES WIDENINGS
Functional Class
Widening Type
Widening Pavement
Type Drainage Applicable Notes
Interstate and Freeways
All Flexible, Rigid Continuous LU 2, 3, 7, and 9
Arterials, Collectors
All Rigid Continuous LU 2, 3, 7, and 9
Arterials, Collectors
Continuous Flexible Continuous LU to LU at Low Points
All
Arterials, Collectors
Limited Flexible LU at Low Points All
Local All Flexible, Rigid LU at Low Points All
Maintenance Facilities, P&R
Lots, etc. All Flexible, Rigid LU at Low Points
1, 2, 3, 4, 5, 6, 7, 8, and 10
LU – Longitudinal Underdrain NOTES for Widening: 1. At a minimum, new drainage for widening should mimic the drainage of the existing
pavement. 2. Provisions shall be made to provide outlets for any existing longitudinal underdrains, or
remove the underdrain. 3. Permanent subgrade drains may be used in place of longitudinal underdrain in areas
where rock is encountered at subgrade. 4. Permanent subgrade drains may be used in place of longitudinal underdrain in areas
where suitable outlets for longitudinal underdrain cannot be provided (insufficient side ditch depth).
5. A day-lighted, continuous layer of drainable material (Select Borrow, Capping Borrow, etc.) may be used in place of longitudinal underdrain.
6. See MINIMUM PAVEMENT BASE DRAINAGE GUIDELINES - NEW CONSTRUCTION above for additional guidance.
7. Open-Graded Base layers shall be extended when utilized in the existing pavement. All pavements utilizing Open-Graded Base shall have continuous longitudinal underdrain. The use of permanent subgrade drains or drainable layer to provide an outlet for the Open-Graded Base is not allowed.
8. Longitudinal Underdrain shall extend a distance of 200-400 ft from the low point in both directions along the centerline.
9. Roadways with a closed section, raised grass median shall have 1 or 2 lines of continuous longitudinal underdrain (depending on width of median) placed behind the curbs in the median. This additional pavement drainage is not required if a daylighted layer of drainable material (Select Borrow, Capping Borrow, etc.) is utilized.
10. Roadways having good vertical drainage at subgrade elevation (sand of considerable depth in cut and no cut/no fill areas and embankments constructed of sand) do not require additional pavement drainage.
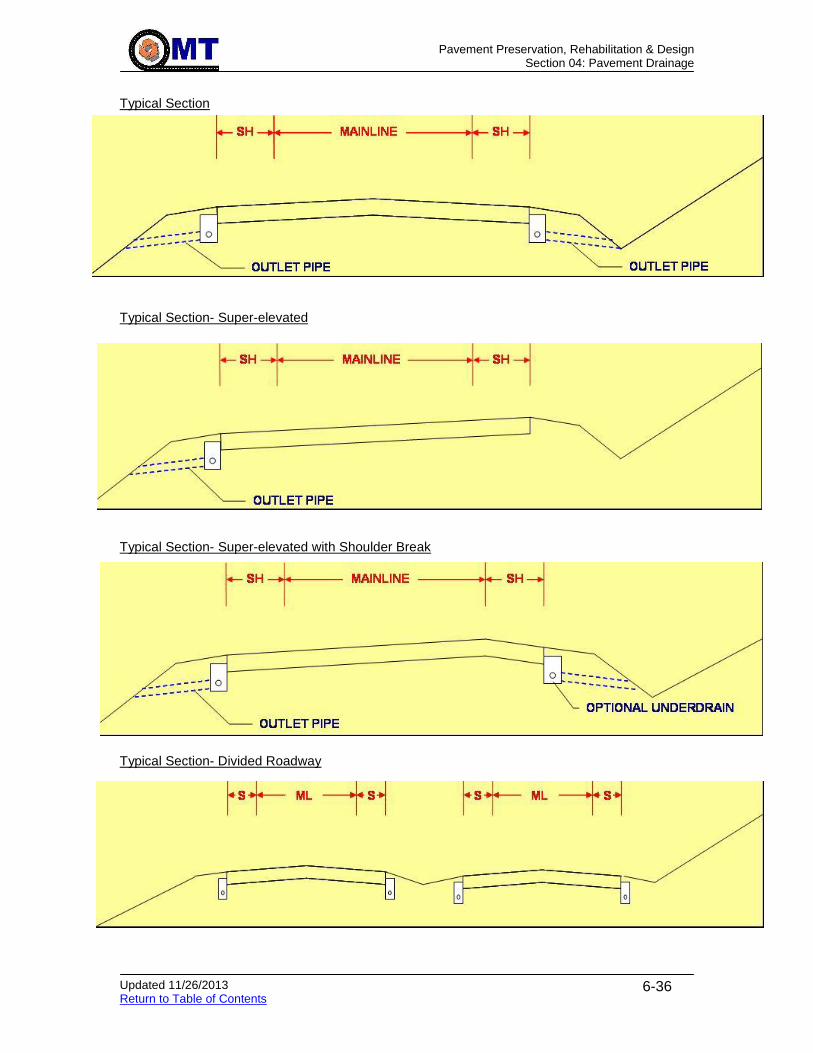
Pavement Preservation, Rehabilitation & Design
Section 04: Pavement Drainage
Updated 11/26/2013 Return to Table of Contents
6-36
Typical Section Typical Section- Super-elevated Typical Section- Super-elevated with Shoulder Break Typical Section- Divided Roadway

Pavement Preservation, Rehabilitation & Design
Section 04: Pavement Drainage
Updated 11/26/2013 Return to Table of Contents
6-37
Typical Section- Divided Roadway and Super-elevated Typical Section- Divided Roadway, Super-elevated with Shoulder Break
6.04.05 Karst Topography
Karst topography poses some interesting challenges with any type of pavement drainage, especially pavement drainage. The introduction of collected water from a pavement structure into a water sensitive area of karst creates the potential increase of sink holes. The engineer should develop and design the subsurface drainage needs of the roadway based on the needs of the facility. The potential risk and remediation needs for karst topography needs to be coordinated with Engineering Geology Division. Therefore coordination and review by representatives from the Engineering Geology Division are required.
6.04.06 Raised Grass Median
A raised grass median presents an interesting challenge for pavement drainage during the winter months. Snow and ice is plowed from the roadway is piled onto the grass median area. The melting snow in the median poses icy hazardous conditions because the water has nowhere to drain during times when the subgrade is frozen and has low permeability. The water from the melting snow makes its way across the pavement surface and then may freeze. Longitudinal underdrain should be placed in raised grass medians to prevent this situation from occurring. The number of lines will be depended on the width of the median and the availability of drainage structures to put outlet pipes. The line should be placed behind the curb and single line down the center of the median.
6.04.07 Guardrail Placement
In cases where longitudinal underdrain is to placed, care must be taken to ensure guardrail posts are not driven through the pipe of the underdrain. This is especially challenging in limited space condition cases with a closed section and guardrail. The longitudinal underdrain can be moved to under the curb if space is limited.

Pavement Preservation, Rehabilitation & Design
Section 04: Pavement Drainage
Updated 11/26/2013 Return to Table of Contents
6-38
6.04.08 Pre-Fabricated Edge Drains
Prefabricated edge drains are a type of pavement drainage that function in the same manner as longitudinal underdrain in that they are designed to only drain the pavement. A pre-fabricated edge drain is generally placed after construction and after the pavement has been in service. They are generally used to handle conditions where the water amount is low.
6.04.09 Open Graded Base
An open graded base (OGB) is a free draining pavement base layer used for pavement drainage. OGB is a stabilized mix using either asphalt or cement concrete. OGB should be used to control water infiltrating through the pavement surface only and it should not be used to correct a high water table problem. All PCC pavements will be considered for OGB and longitudinal underdrain. Generally OGB shall not be used with flexible pavements. Truck traffic and soil type shall also be considered when evaluating the need for OGB. Silty and clayey soils are prime candidates for use of OGB. The presence of good vertical drainage from clean sands and gravels for a considerable depth at the top of subgrade may diminish the need for OGB provided that the base course used is not erodible and permeable (greater than 1x10⁻³ cm/sec). When OGB is used it shall be a 4" layer beneath PCC roadway placed on a Graded Aggregate Base coupled with the use of longitudinal underdrain to provide an outlet for water.
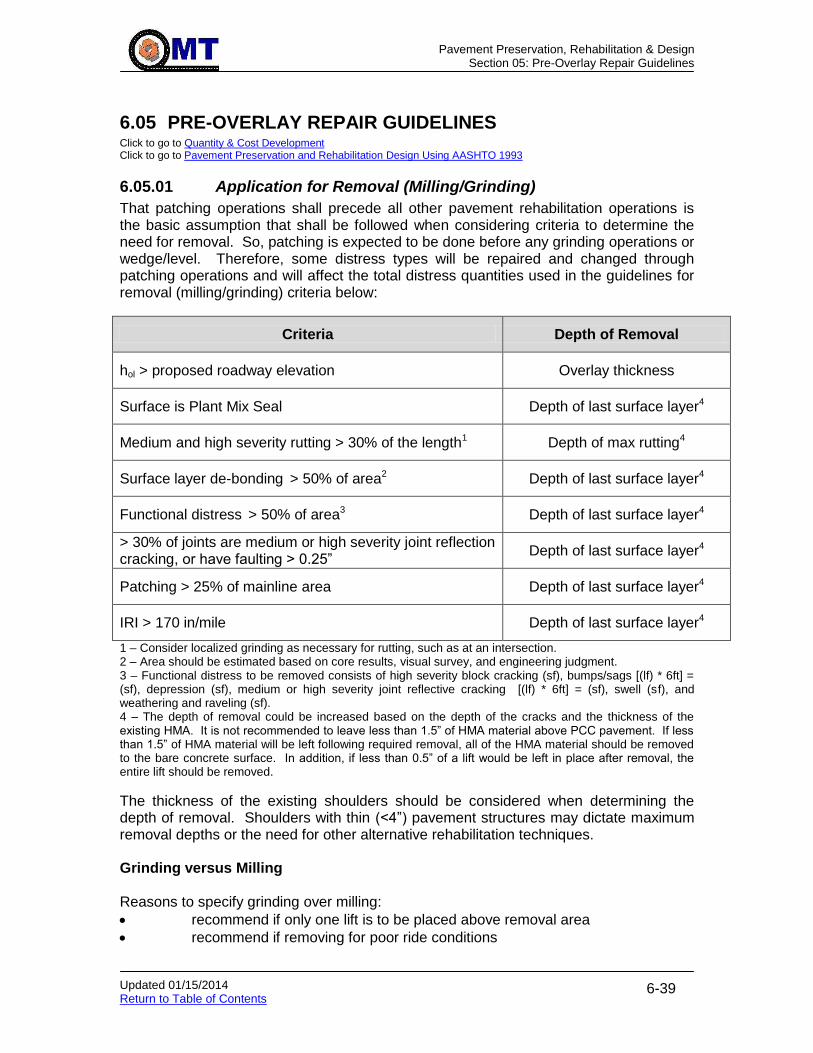
Pavement Preservation, Rehabilitation & Design
Section 05: Pre-Overlay Repair Guidelines
Updated 01/15/2014 Return to Table of Contents
6-39
6.05 PRE-OVERLAY REPAIR GUIDELINES Click to go to Quantity & Cost Development Click to go to Pavement Preservation and Rehabilitation Design Using AASHTO 1993
6.05.01 Application for Removal (Milling/Grinding)
That patching operations shall precede all other pavement rehabilitation operations is the basic assumption that shall be followed when considering criteria to determine the need for removal. So, patching is expected to be done before any grinding operations or wedge/level. Therefore, some distress types will be repaired and changed through patching operations and will affect the total distress quantities used in the guidelines for removal (milling/grinding) criteria below:
Criteria Depth of Removal
hol > proposed roadway elevation Overlay thickness
Surface is Plant Mix Seal Depth of last surface layer4
Medium and high severity rutting > 30% of the length1 Depth of max rutting4
Surface layer de-bonding > 50% of area2 Depth of last surface layer4
Functional distress > 50% of area3 Depth of last surface layer4
> 30% of joints are medium or high severity joint reflection cracking, or have faulting > 0.25”
Depth of last surface layer4
Patching > 25% of mainline area Depth of last surface layer4
IRI > 170 in/mile Depth of last surface layer4
1 – Consider localized grinding as necessary for rutting, such as at an intersection. 2 – Area should be estimated based on core results, visual survey, and engineering judgment. 3 – Functional distress to be removed consists of high severity block cracking (sf), bumps/sags [(lf) * 6ft] = (sf), depression (sf), medium or high severity joint reflective cracking [(lf) * 6ft] = (sf), swell (sf), and weathering and raveling (sf). 4 – The depth of removal could be increased based on the depth of the cracks and the thickness of the existing HMA. It is not recommended to leave less than 1.5” of HMA material above PCC pavement. If less than 1.5” of HMA material will be left following required removal, all of the HMA material should be removed to the bare concrete surface. In addition, if less than 0.5” of a lift would be left in place after removal, the entire lift should be removed.
The thickness of the existing shoulders should be considered when determining the depth of removal. Shoulders with thin (<4”) pavement structures may dictate maximum removal depths or the need for other alternative rehabilitation techniques. Grinding versus Milling Reasons to specify grinding over milling:
recommend if only one lift is to be placed above removal area
recommend if removing for poor ride conditions
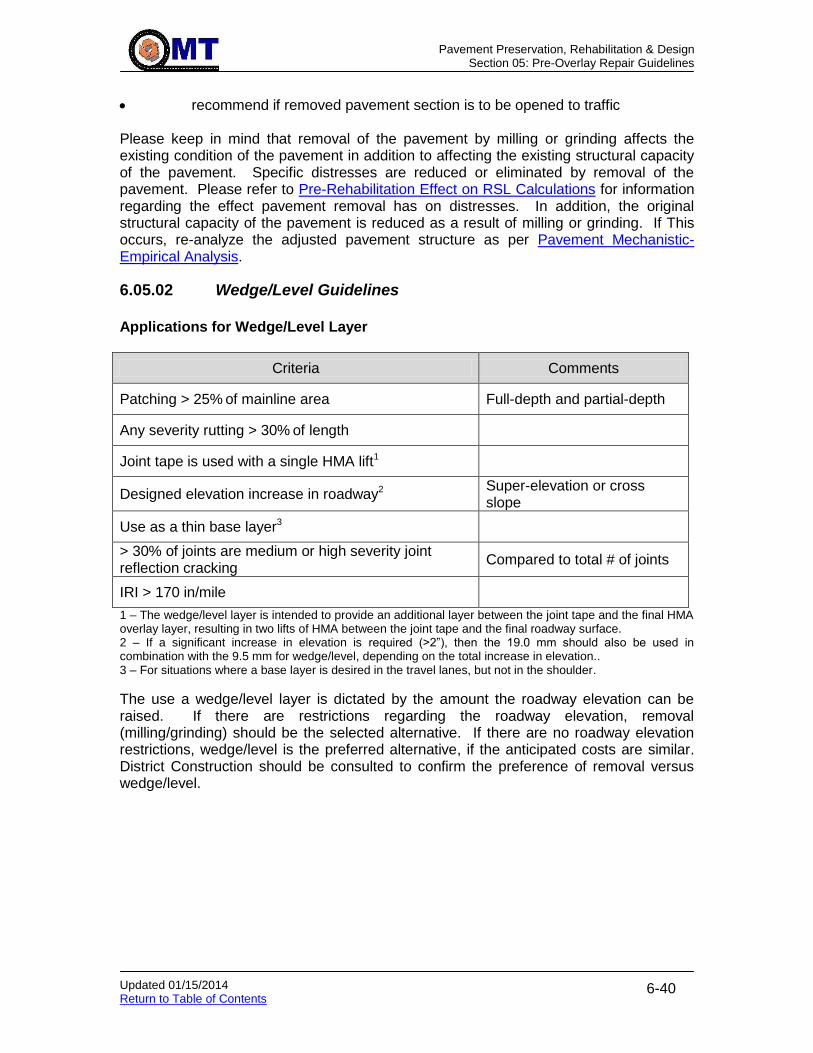
Pavement Preservation, Rehabilitation & Design
Section 05: Pre-Overlay Repair Guidelines
Updated 01/15/2014 Return to Table of Contents
6-40
recommend if removed pavement section is to be opened to traffic Please keep in mind that removal of the pavement by milling or grinding affects the existing condition of the pavement in addition to affecting the existing structural capacity of the pavement. Specific distresses are reduced or eliminated by removal of the pavement. Please refer to Pre-Rehabilitation Effect on RSL Calculations for information regarding the effect pavement removal has on distresses. In addition, the original structural capacity of the pavement is reduced as a result of milling or grinding. If This occurs, re-analyze the adjusted pavement structure as per Pavement Mechanistic-Empirical Analysis.
6.05.02 Wedge/Level Guidelines
Applications for Wedge/Level Layer
Criteria Comments
Patching > 25% of mainline area Full-depth and partial-depth
Any severity rutting > 30% of length
Joint tape is used with a single HMA lift1
Designed elevation increase in roadway2 Super-elevation or cross slope
Use as a thin base layer3
> 30% of joints are medium or high severity joint reflection cracking
Compared to total # of joints
IRI > 170 in/mile
1 – The wedge/level layer is intended to provide an additional layer between the joint tape and the final HMA overlay layer, resulting in two lifts of HMA between the joint tape and the final roadway surface. 2 – If a significant increase in elevation is required (>2”), then the 19.0 mm should also be used in combination with the 9.5 mm for wedge/level, depending on the total increase in elevation.. 3 – For situations where a base layer is desired in the travel lanes, but not in the shoulder.
The use a wedge/level layer is dictated by the amount the roadway elevation can be raised. If there are restrictions regarding the roadway elevation, removal (milling/grinding) should be the selected alternative. If there are no roadway elevation restrictions, wedge/level is the preferred alternative, if the anticipated costs are similar. District Construction should be consulted to confirm the preference of removal versus wedge/level.
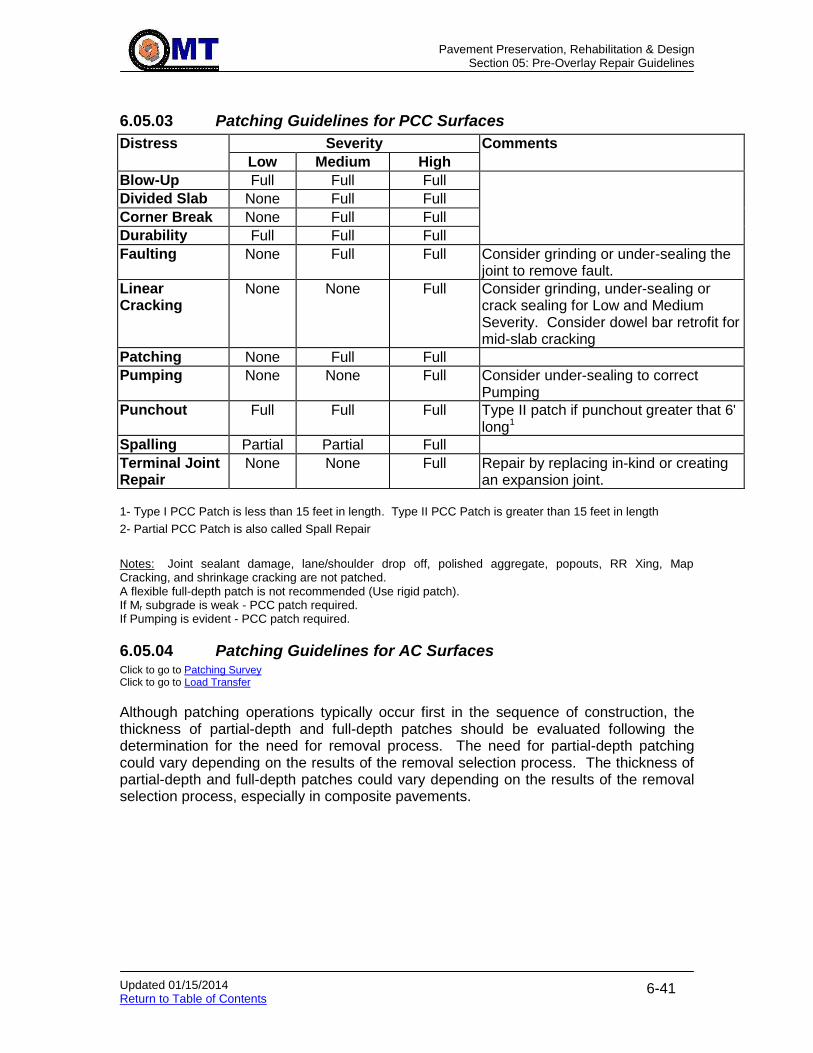
Pavement Preservation, Rehabilitation & Design
Section 05: Pre-Overlay Repair Guidelines
Updated 01/15/2014 Return to Table of Contents
6-41
6.05.03 Patching Guidelines for PCC Surfaces
Distress Severity Comments
Low Medium High
Blow-Up Full Full Full
Divided Slab None Full Full
Corner Break None Full Full
Durability Full Full Full
Faulting None Full Full Consider grinding or under-sealing the joint to remove fault.
Linear Cracking
None None Full Consider grinding, under-sealing or crack sealing for Low and Medium Severity. Consider dowel bar retrofit for mid-slab cracking
Patching None Full Full
Pumping None None Full Consider under-sealing to correct Pumping
Punchout Full Full Full Type II patch if punchout greater that 6' long1
Spalling Partial Partial Full
Terminal Joint Repair
None None Full Repair by replacing in-kind or creating an expansion joint.
1- Type I PCC Patch is less than 15 feet in length. Type II PCC Patch is greater than 15 feet in length
2- Partial PCC Patch is also called Spall Repair
Notes: Joint sealant damage, lane/shoulder drop off, polished aggregate, popouts, RR Xing, Map Cracking, and shrinkage cracking are not patched. A flexible full-depth patch is not recommended (Use rigid patch). If Mr subgrade is weak - PCC patch required. If Pumping is evident - PCC patch required.
6.05.04 Patching Guidelines for AC Surfaces Click to go to Patching Survey Click to go to Load Transfer
Although patching operations typically occur first in the sequence of construction, the thickness of partial-depth and full-depth patches should be evaluated following the determination for the need for removal process. The need for partial-depth patching could vary depending on the results of the removal selection process. The thickness of partial-depth and full-depth patches could vary depending on the results of the removal selection process, especially in composite pavements.

Pavement Preservation, Rehabilitation & Design
Section 05: Pre-Overlay Repair Guidelines
Updated 01/15/2014 Return to Table of Contents
6-42
Travel Lanes
Distress Severity No Milling Milling (1" - 2") Comments
AC Material Thickness*
> 6" < 6" > 6" < 6" *After HMA removal
Non-wheel-path Cracking OR
Low and Medium
None None None None
If the crack depth is greater than ½ HMA thickness, then use full-depth patch.
Edge Cracking High Partial Full Partial Full
Fatigue Cracking Low None None None None Investigate whether surface has de-bonded from base; if so, then remove surface.
Medium Partial Full Partial Full
Investigate whether surface has de-bonded from base, and whether cracking is limited to surface; if so, remove surface rather than patch.
High Full Full Full Full
Potholes/ Failures
Low Partial Partial None None
Medium Partial Partial Partial Partial
High Full Full Full Full
Slippage Crack Low None None None None Full-depth patching may be required if distress is significantly deep (>1/2 total HMA thickness).
Shoving Medium Partial Partial None None
Corrugation High Partial Partial None None
Depression Low None None None None Soil/Subgrade could be cause of depression, bumps/sags, and swelling.
Bumps/Sags Medium Partial Partial None None
Swelling High Partial Full Partial Full
Patches Low None None None None
Medium Partial Full Partial Full
High Full Full Full Full
Joint Reflection Low None None None None
Cracking Medium None** None** None** None** (Type A Patch). Remove to PCC. **Consider for Patch-Only projects.
∆ of loaded and unloaded slabs <16 mils – Good
High Partial Partial Partial Partial
Joint Reflection Low None None None None Patch with PCC in kind with PCC Cracking Medium Partial Partial Partial Partial
∆ of loaded and unloaded slabs > 16 mils - Bad
High Full Full Full Full

Pavement Preservation, Rehabilitation & Design
Section 05: Pre-Overlay Repair Guidelines
Updated 01/15/2014 Return to Table of Contents
6-43
Shoulders
Distress Severity No Milling Milling (1" - 2") Comments
AC Material Thickness*
> 6" < 6" > 6" < 6" *Thickness is after HMA removal
Fatigue Cracking Low None None None None
Medium None None None None
High Full Full Full Full
Edge Cracking Low None None None None If the crack depth is greater than ½ HMA thickness, then use full-depth patch.
Medium None None None None
High Partial Full Partial Full
Potholes/Failures Low Partial Partial None None
Medium Partial Partial Partial Partial
High Full Full Full Full
Patches Low None None None None
Medium None None None None
High Full Full Full Full
Joint Reflection Low None None None None
Cracking Medium None None None None (Type A Patch). Remove to PCC ∆ of loaded and
unloaded slabs <16 mils – Good
High Partial Partial Partial Partial
Joint Reflection Low None None None None Patch with PCC in kind with PCC. Cracking Medium None None None None
∆ of loaded and unloaded slabs > 16 mils - Bad
High Full Full Full Full
Notes: 1) Polished aggregate, bleeding, RR Xing, weathering, and lane/shoulder drop off are not patched.
2) Minimum patch size is generally 6 ft x 6 ft for projects where grinding and/or overlay will follow. For
Patch Only projects the minimum patch size shall be 20 ft x 6 ft. This will create a smooth transition and improve the ride quality.
3) Partial-depth patching should not exceed 50% of the pavement depth (flexible pavement).
4) If a distress exists on the mainline and spills over to the shoulder, the patch thickness shall be the
thicker of the two pavement sections, unless it is clear that the mainline and shoulder patching will be done in separate passes.
5) For Patching- only projects take into consideration the following items when performing the field survey:
a) Determine if the patching will be for a long- or short-term period (e.g. is the District considering a
project coming up in the next 4 years within the same limits)? Consider including the Medium
Severity items (identified with a “ ** “) if the patching will be for a long period of time.
b) Determine the overall condition of the project and compare the Pavement Preservation options
with the overall result of the field survey. Consider the option of having some of the areas repaired with crack seal instead of just patching the majority of the project.

Pavement Preservation, Rehabilitation & Design
Section 05: Pre-Overlay Repair Guidelines
Updated 01/15/2014 Return to Table of Contents
6-44
c) Evaluate the cracking distress and determine if the depth of the cracking is superficial (surface
layer only) or if extends further (PDP versus FDP).
d) Rutting – if MRUT is present the patching should extend at least 1” below the rutting deepest
point (this needs to be measured or very well estimated during the field survey). If HRUT is present consider Note 3) and the 6” HMA thickness guideline for Milling versus No Milling scenarios on the above tables.
Patching and Joint Tape Guidelines for PCC Surfaces and Patching and Joint Tape Guidelines for AC Surfaces are to be used as guidelines to determine specific patching requirements. These guidelines can be customized to specific project conditions and demands. Any major changes to the patching guidelines should be discussed with the Assistant Pavement and Geotechnical Division Chief - Design.
6.05.05 Other Pre-Overlay Techniques
6.05.05.01 Slab Stabilization Use if FWD testing indicates a large presence of voids, see FWD Data
Analysis Procedure.
Consider if a large presence of corner breaks or pumping exist on a project.
6.05.06 Pre-Rehabilitation Effect on RSL Calculations Click to go to Application for Removal (Milling/Grinding)
Certain facets of RSL calculations, such as Crack Indices (CI), can be calculated from the visual survey are based on the existing distresses in the roadway. Pre-resurfacing repairs alter the existing distresses and the RSL and therefore affect the existing structural and functional capacity of the pavement structure. For example, if high severity alligator cracking were repaired with a full-depth patch, that amount of structural cracking would no longer exist, thereby improving the structural CI. Refer to Visual Pavement Condition Assessment for recalculating CI.
Depending on the distress type and severity, pre-resurfacing repairs may increase the RSL values. Therefore, certain pre-resurfacing repair strategies will influence the type of the pavement resurfacing. A significant step in the pavement preservation process is to re-calculate RSL for each pavement section based on the selected pre-resurfacing repairs. Patching and removal (milling/grinding) can both be completed as pre-resurfacing repairs. Refer to Supplemental Treatment Information for guidance. The following table shows the effect of different pre-resurfacing repairs on RSL for flexible/composite. RSL equations have not yet been developed for the cracking or faulting of concrete pavements.
Pre-Resurfacing Repairs for AC-Surfaced Pavements Distress Patch Surface Removal
Ride Quality No effect See Forms, Spreadsheets &
Guidelines for PD-11
Structural Cracking
No Distress for that quantity. Refer to Visual Pavement
Condition Assessment for CI calculation
No effect

Pavement Preservation, Rehabilitation & Design
Section 05: Pre-Overlay Repair Guidelines
Updated 01/15/2014 Return to Table of Contents
6-45
Pre-Resurfacing Repairs for AC-Surfaced Pavements Distress Patch Surface Removal
Functional Cracking
No Distress for that quantity. Refer to Visual Pavement
Condition Assessment for CI calculation
No Distress for that quantity. Refer to Visual Pavement
Condition Assessment for CI calculation
Rutting No effect RSL = 50 Friction No effect RSL = 50
Pre-Resurfacing Repairs for PCC-Surfaced Pavements
Distress Patch/Spall Repair Surface Removal
Ride Quality No effect See Forms, Spreadsheets
& Guidelines for PD-11
Friction No effect RSL = 50

Pavement Preservation, Rehabilitation & Design
Section 06: Pavement Preservation & Rehabilitation Design
Updated 11/26/2013 Return to Table of Contents
6-46
6.06 PAVEMENT PRESERVATION & REHABILITATION DESIGN Click to go to Pavement Mechanistic-Empirical Analysis Click to go to Design Input Policies Click to go to Pavement Type Selection Click to go to Preliminary Pavement Recommendation Click to go to Pavement Preservation and Rehabilitation Design Using AASHTO 1993
6.06.01 Purpose
Pavement rehabilitation designs are conducted to:
Identify the existing condition of the pavement
Identify the deterioration trend in the existing pavement
Determine the future structural requirements of the pavement
Determine the future functional requirements of the pavement
Determine the necessary improvements to the existing pavement
Identify the material requirements to improve the pavement
Historically, the Maryland State Highway Administration (MDSHA) has relied almost exclusively upon rehabilitation strategies to maintain their pavement system. While rehabilitation is a valid strategy, it is not necessarily the most cost-effective strategy; quite often, the more cost-effective treatments to maintain the pavement system are pavement preservation treatments. Pavement preservation is an important facet of maintaining MDSHA’s roadways. However, no current AASHTO methodology is geared towards preservation. The purpose of this section is to provide general guidance on the selection of pavement preservation and rehabilitation treatments by analyzing and designing for structural and functional requirements using a combination of methodologies.
This section will assist in determining “the right fix for the right road at the right time” when used in conjunction with network-level and project specific data. Step-by-step instructions on determining treatment options are provided. At the end of the step-by-step process, many treatment options will be available, and ultimately the final treatment option(s) should be determined in a partnership between the districts and PAGD.
6.06.02 Resource Requirements
The pavement preservation or rehabilitation design procedure documented below requires the following staffing needs for a typical job:
Position Function Resources Effort Level (man-hours)
Staff Engineer or Project Engineer Rehabilitation Design 1 12
Staff Engineer or Project Engineer Memo Development 1 24
* The time required would vary depending on the size, complexity and location of the project.
6.06.03 Procedure
The procedure described in the following text should be followed in a typical preservation or rehabilitation pavement design recommendation. Reference to specific design inputs for design development can be located in Design Input Policies. Numerous steps contained in this procedure can be completed within several software applications that PAGD currently uses, including PMED.

Pavement Preservation, Rehabilitation & Design
Section 06: Pavement Preservation & Rehabilitation Design
Updated 11/26/2013 Return to Table of Contents
6-47
The following procedure was written to provide the design engineer with adequate information to complete a preservation or rehabilitation design with the assumption that these tools are available.
Certain steps in the pavement preservation and rehabilitation design process and other processes overlap. It is important to keep in mind that although these processes are broken out and written in separate sections, they are a part of an overall process to provide logically and technically sound recommendations.
This section contains analysis and design procedures for the following parameters:
• Ride Quality
• Structural Cracking
• Functional Cracking
• Rutting
• Friction
• Faulting (future)
6.06.03.01 Preliminary Steps
Step 1. If the project involves any base-widening, reconstruction, storm water management, embankment slopes, new construction, or has special soil issues, refer to New Pavement Design.
Step 2. Conduct the steps as detailed in Preliminary Procedures.
Step 3. Conduct the steps as detailed in Testing & Data Collection.
Step 4. Conduct the steps as detailed in Analysis Procedures.
6.06.03.02 Analysis & Design These steps should be performed for each treatment option.
6.06.03.02.01 Identify Existing Values for Analysis Click to go to Remaining Service Life Analysis
Because of the uncertainty involved in the annual network collection of distress data, it is not necessarily appropriate to use the most recent values given. The engineer should look at several recent years of data when available to determine which value is most appropriate for design.
Step 1. Input the IRI, SCI, FCI, Rut and FN values into PDS-09 Automated Project-Level Design Help.
Step 2. Review the graphs of these data both by station and by year, and compare them to the calculated averages for the most recent year available.
Step 3. If the calculated averages seem reasonable, use them; if not, adjust up or down to be more in line with the graphic output.
Step 4. If there are distinct sections in terms of performance, analyze those sections separately, and repeat steps 1-3.

Pavement Preservation, Rehabilitation & Design
Section 06: Pavement Preservation & Rehabilitation Design
Updated 11/26/2013 Return to Table of Contents
6-48
6.06.03.02.02 Determine Values immediately after treatment Click to go to Remaining Service Life Analysis
Step 1. Refer to Performance Criteria – Initial Performance Targets. For ride quality, if the treatment is an HMA overlay, use Form PD-11.
6.06.03.02.03 Determine Deterioration over Time Click to go to Remaining Service Life Analysis
Refer to Performance Criteria – Terminal Performance Targets to determine the design terminal thresholds.
Step 1. Determine the number of years until the design terminal threshold is met using PMED as per Pavement Mechanistic-Empirical Analysis. This can be done for all distresses except for friction.
Step 2. Determine the number of years until the design terminal threshold is met using historical performance data. This can be done by using PDS-09 Automated Project-Level Design Help. This can be done for all distresses except for friction.
Step 3. For friction design, refer to Friction Design.
Step 4. Refer to Supplemental Treatment Information to ensure that the numbers of years determined in Steps 1 through 3 are reasonable given the treatment.
Step 5. Use engineering judgment to determine which life extension best represents the results of Steps 1-4.

Pavement Preservation, Rehabilitation & Design
Section 06: Pavement Preservation & Rehabilitation Design
Updated 11/26/2013 Return to Table of Contents
6-49
6.06.03.02.03.1 Friction Design Click to go to Design Input Policies
On average, analysis performed by the Pavement Management section has shown that the rate of deterioration is fairly static. Use the following equation to determine the projected skid number based on number of years in service:
If the future SNt is known (i.e. it is a terminal design target and the designer wishes to determine the number of years until it is reached), the equation can be re-written as follows:
Where:
SNt = Terminal/Target Skid number after the number of years in question
SNi = the initial skid number for a new surface, from Performance Criteria – Initial Performance Targets.
Years = The number of years in question
SNf = values in the following chart:
SNf Skid Values by Surface Material
Functional Class
Urban Interstates, Freeways and Collectors (11,12,17)
Rural Interstates, Arterials and Major Collectors; Urban Locals (1,2,6,7,19)
Rural Minor Collectors and Locals (8,9)
Urban Non-Freeway Arterials (14,16)
Dense-Graded HMA
44 44 49 39
Gap-Graded HMA 50 50 55 45
Micro-Surfacing 52 52 57 47
High Friction Surface
69 69 74 64
Surface Abrasion Add 10
Diamond Grinding Return to pre-grind value after 5 years
Note: If the designer adjusted the initial skid values based on localized knowledge with Team Leader/ADC approval, then a similar adjustment should be
made to the SNf values as well.
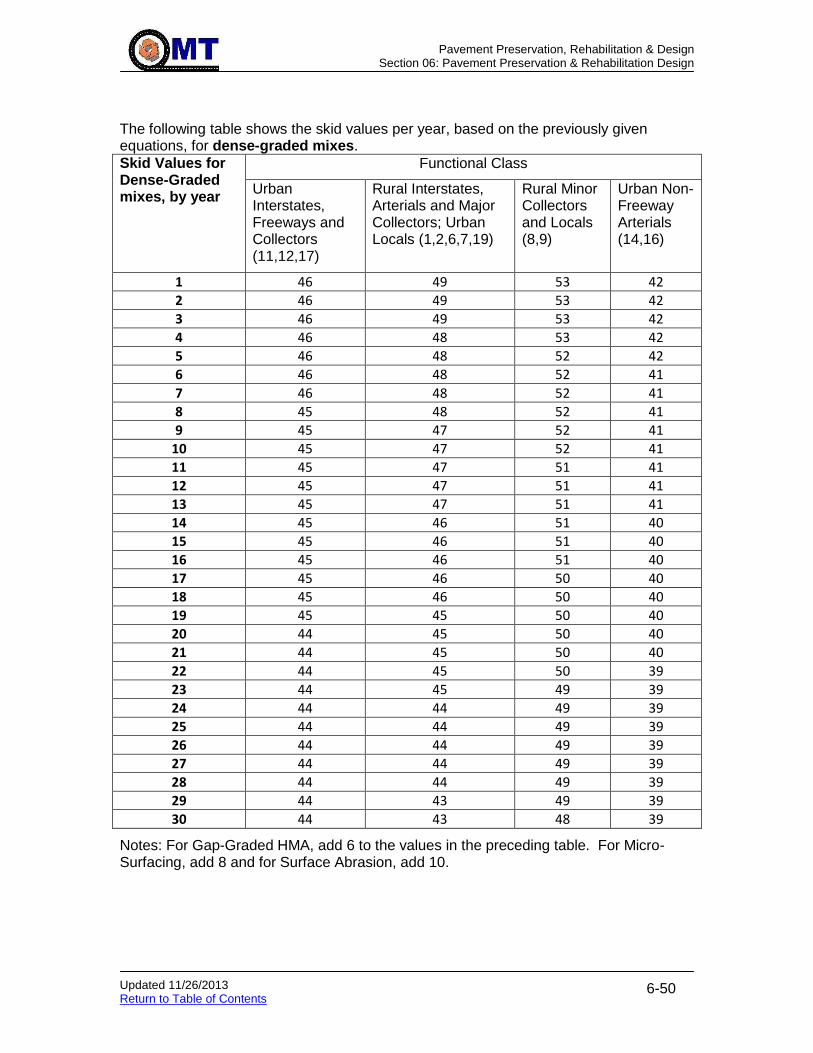
Pavement Preservation, Rehabilitation & Design
Section 06: Pavement Preservation & Rehabilitation Design
Updated 11/26/2013 Return to Table of Contents
6-50
The following table shows the skid values per year, based on the previously given equations, for dense-graded mixes.
Skid Values for Dense-Graded mixes, by year
Functional Class
Urban Interstates, Freeways and Collectors (11,12,17)
Rural Interstates, Arterials and Major Collectors; Urban Locals (1,2,6,7,19)
Rural Minor Collectors and Locals (8,9)
Urban Non-Freeway Arterials (14,16)
1 46 49 53 42
2 46 49 53 42
3 46 49 53 42
4 46 48 53 42
5 46 48 52 42
6 46 48 52 41
7 46 48 52 41
8 45 48 52 41
9 45 47 52 41
10 45 47 52 41
11 45 47 51 41
12 45 47 51 41
13 45 47 51 41
14 45 46 51 40
15 45 46 51 40
16 45 46 51 40
17 45 46 50 40
18 45 46 50 40
19 45 45 50 40
20 44 45 50 40
21 44 45 50 40
22 44 45 50 39
23 44 45 49 39
24 44 44 49 39
25 44 44 49 39
26 44 44 49 39
27 44 44 49 39
28 44 44 49 39
29 44 43 49 39
30 44 43 48 39
Notes: For Gap-Graded HMA, add 6 to the values in the preceding table. For Micro-Surfacing, add 8 and for Surface Abrasion, add 10.
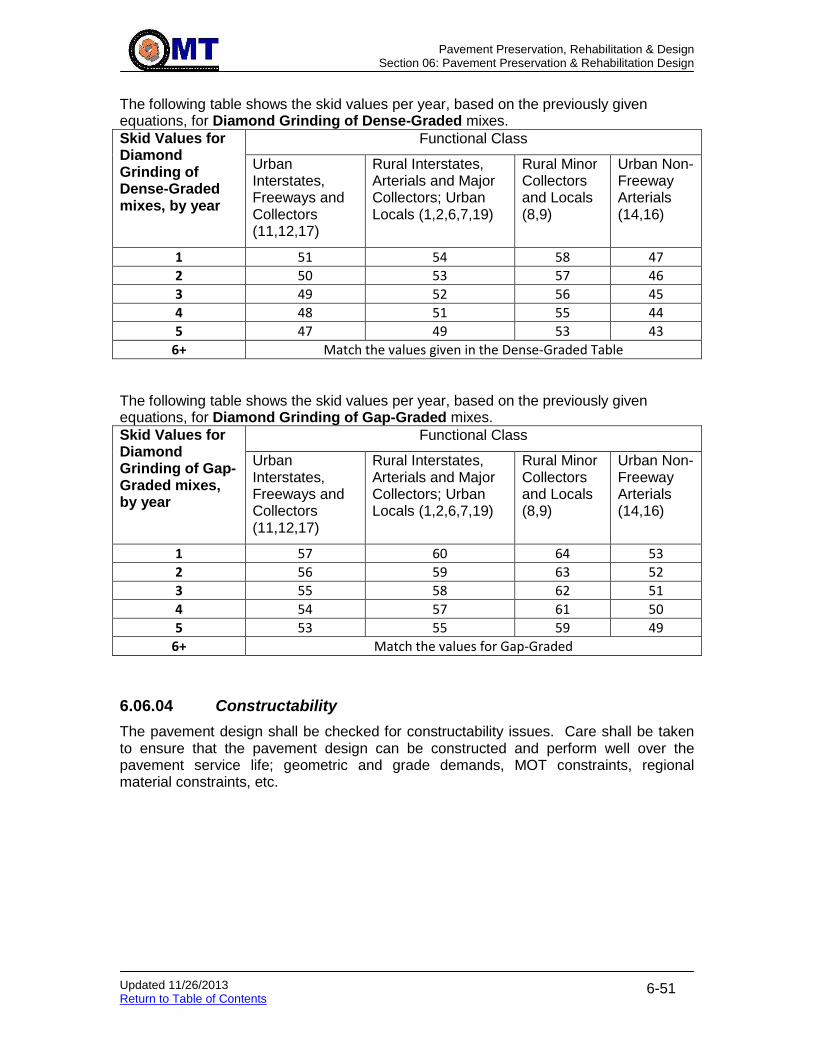
Pavement Preservation, Rehabilitation & Design
Section 06: Pavement Preservation & Rehabilitation Design
Updated 11/26/2013 Return to Table of Contents
6-51
The following table shows the skid values per year, based on the previously given equations, for Diamond Grinding of Dense-Graded mixes.
Skid Values for Diamond Grinding of Dense-Graded mixes, by year
Functional Class
Urban Interstates, Freeways and Collectors (11,12,17)
Rural Interstates, Arterials and Major Collectors; Urban Locals (1,2,6,7,19)
Rural Minor Collectors and Locals (8,9)
Urban Non-Freeway Arterials (14,16)
1 51 54 58 47
2 50 53 57 46
3 49 52 56 45
4 48 51 55 44
5 47 49 53 43
6+ Match the values given in the Dense-Graded Table
The following table shows the skid values per year, based on the previously given equations, for Diamond Grinding of Gap-Graded mixes.
Skid Values for Diamond Grinding of Gap-Graded mixes, by year
Functional Class
Urban Interstates, Freeways and Collectors (11,12,17)
Rural Interstates, Arterials and Major Collectors; Urban Locals (1,2,6,7,19)
Rural Minor Collectors and Locals (8,9)
Urban Non-Freeway Arterials (14,16)
1 57 60 64 53
2 56 59 63 52
3 55 58 62 51
4 54 57 61 50
5 53 55 59 49
6+ Match the values for Gap-Graded
6.06.04 Constructability
The pavement design shall be checked for constructability issues. Care shall be taken to ensure that the pavement design can be constructed and perform well over the pavement service life; geometric and grade demands, MOT constraints, regional material constraints, etc.

Pavement Preservation, Rehabilitation & Design
Section 07: Quantity & Cost Development
Updated 02/06/13 Return to Table of Contents
6-52
6.07 QUANTITY & COST DEVELOPMENT Click to go to New Pavement Design
6.07.01 Purpose
Quantities and costs are developed are developed for each project to:
Provide the Project Owner an estimate of the cost for pavement-related items.
Provide a basis to compare multiple treatment options.
6.07.02 Resource Requirements
The quantity and cost estimate procedure documented below requires approximately two man-hours of effort by the project engineer.
6.07.03 Procedure
The procedure described in the following text should be followed to complete a quantity and cost estimate. The majority of the effort in this process to develop the cost estimate value is done within PDS-03 - Costs & Quantities, on the Quantities & Costs worksheet. This effort will involve entering or verifying project geometry quantities, various material areas and thicknesses, and unit costs. This will result in projected quantities for each pavement-related bid items, as well as costs for those and an overall cost.
Step 1. Open PDS-03 - Costs & Quantities, and go to the Quantities and Costs worksheet. For each section, input/verify the number of lanes, section length, mainline width and shoulder width.
Step 2. Input patching quantities, developed following the procedure in Pre-Overlay Repair Guidelines. Provide both thickness and area.
Step 3. Provide grinding depth, if applicable.
Step 4. Provide total thickness for each material type to be used in the section.
Step 5. If the section will use HMA, input the thickness, where applicable of the base, wedge/level and surface HMA layers.
Step 6. If the section will have an HMA surface layer, identify whether that layer will consist of Gap-Graded, PG 64E-22 or HDFV, in that hierarchy. For example, if Gap-Graded will be used, it will not matter if PG 64E-22 or HDFV is used.
Step 7. Input whether wedge/level will be used on the shoulder.
Step 8. Input the quantities any other miscellaneous items.
Step 9. In most cases, unit costs will be computer automatically. Verify that those unit costs are reasonable.
Step 10. Input the missing unit costs for any other miscellaneous items.
Step 11. Select the chosen option for each section, by typing “Yes” in that column for the “Chosen Option?” row.
Step 12. Input the total costs for non-paving items, obtained from the project manager.
Step 13. The total cost is thus calculated, and can be transferred for RSL analysis.

Pavement Preservation, Rehabilitation & Design
Section 08: Remaining Service Life Analysis
Updated 02/06/2013 Return to Table of Contents
6-53
6.08 REMAINING SERVICE LIFE ANALYSIS Click to go to Discussion/Selection Alternative with Project Owner Click to go to Pavement Mechanistic-Empirical Analysis
6.08.01 Purpose
Remaining Service Life Analysis (RSL) is performed on each Fund 77 project to:
Identify which distress type (i.e. ride quality, cracking, rutting and friction) will control the design.
Help the engineer determine how much benefit each considered treatment will provide.
Provide a basis to compare multiple treatment options, once cost is calculated.
6.08.02 Resource Requirements
The RSL procedure documented below requires approximately one man-hour of effort by the project engineer. This effort does not include the time needed to collect the information to be used in this analysis, as that effort is accounted for elsewhere.
6.08.03 Procedure
The procedure described in the following text should be followed to complete an RSL analysis. The majority of the effort in this process is done within the PDS-08 - Project-Level RSL Calculation form. This effort will involve entering condition data and predicted performance. Many of the calculations performed in the PDS-08 form are documented in Performance Criteria – Terminal Performance Targets.
Step 1. Determine the roadway functional class for the project. This can be found in the Highway Location Reference, which provides the verbal description. Determine the corresponding functional class number, using the following chart:
Functional Class (FC) FC #
Rural Interstate 1
Rural Principal Arterial - Other 2
Rural Minor Arterial 6
Rural Major Collector 7
Rural Minor Collector 8
Rural Local 9
Urban Interstate 11
Urban Principal Arterial - Other Freeways 12
Urban Principal Arterial - Other 14
Urban Minor Arterial 16
Urban Collector 17
Urban Local 19

Pavement Preservation, Rehabilitation & Design
Section 08: Remaining Service Life Analysis
Updated 02/06/2013 Return to Table of Contents
6-54
Step 2. Open the PDS-08 form, and go to the worksheet that corresponds to whether the project is Urban or Rural.
Step 3. Input the Project Description and Treatment Option in the appropriate boxes.
Step 4. Input the FC #.
Step 5. Input the existing IRI, SCI, FCI, Rut and FN in the “Existing Performance Value” row. Refer to Identify Existing Values for Analysis.
Note: Only input the values that are necessary, if they meet the thresholds given in the tables as per Performance Criteria – Initial Performance Targets.
Step 6. Input the predicted values for IRI, SCI, FCI, Rut and FN that are estimated for the pavement once the treatment is placed in the “Predicted Performance Value – Post Fix” row. These will reflect the pavement condition once preservation or rehabilitation is complete. Refer to Determine Values immediately after treatment.
Step 7. For structural cracking, input the percent of structural distress that is to be considered bottom-up. This value is to be used with PMED, since the two PMED outputs related to structural cracking (bottom-up and top-down) are combined to determine the overall amount of structural cracking and corresponding structural cracking index. As the amount of allowable bottom-up cracking is increased, the amount of allowable top-down cracking decreases. Refer to Pavement Mechanistic-Empirical Analysis.
Step 8. At this point, the terminal performance targets for each distress type (IRI, SCI, FCI, Rut and FN) are calculated. Input the number of years it will take to reach those terminal performance targets for each target, as per the procedures given in Determine Deterioration over Time.
Step 9. Input the number of lane-miles for the project.
Step 10. Input the total project cost as per Quantity & Cost Development. This is not the pavement cost, but the total cost.
Step 11. The overall cost/benefit ratio is provided. Perform this procedure for each treatment option being considered, and use as appropriate per Discussion/Selection Alternative with Project Owner.
Pavement Preservation, Rehabilitation & Design
Section 09: Pavement Type Selection
Updated 03/10/2014 Return to Table of Contents
6-55
6.09 PAVEMENT TYPE SELECTION Click to go to New Pavement Design Click to go to Unit Costs
Details and information about the Pavement Type Selection Process (PTSP) is documented in the MDSHA “Pavement Type Selection Process”. Refer to Reference Guidelines for the LCCA files. That process applies to major projects. Go to the Forms section for the PTSP checklist form.
For smaller projects for which the PTSP does not apply, the pavement engineer has the responsibility of determining which pavement type to recommend. This determination is based on a simple benefit/cost analysis as per Pavement Preservation & Rehabilitation Design.

Pavement Preservation, Rehabilitation & Design
Section 10: Standard Pavement Designs
Updated 05/02/2014 Return to Table of Contents
6-56
6.10 STANDARD PAVEMENT DESIGNS The pavement design standards contained in this section are to be used by Pavement and Geotechnical Division of the OMT only and are not considered to be part of the MDSHA “Book of Standards.” The standards are intended to maintain consistency in the distribution of recommendations from the Pavement and Geotechnical Division. The following standards are provided in this section: A. Roundabout B. Park and Ride C. Narrow Base Widening with Curb (< 4 ft) D. Composite Patch (HMA and PCC) E. Bike Path and Driveways
F. Bridge Approaches
G. Permeable Pavement Systems
6.10.01 Roundabout
A roundabout is a circular intersection intended to regulate traffic flow with the use of a signalized lighting. A roundabout consists of travel way (which may be either a flexible or rigid pavement) and a truck apron at the inner radius of the circle intended for truck with trailers incapable of making a tight radius turn. A mountable curb resides between the paved travel way and the truck apron. Typically some type of curb or wall at the boundary with the truck apron with landscaping at the very center of the roundabout. The mainline travel way shall be design following the guidelines.
6.10.01.01 Truck Apron The truck apron of a roundabout shall be Jointed Plain Concrete Pavement (JPCP) to limit pavement distress from the slow moving, turning truck traffic. The inner and outer radius of the truck apron will differ because in is a circle. The joints in the truck apron shall be doweled to provide for load transfer. Truck aprons are typically constructed in conjunction with a Type ‘C” mountable curb that is 8” to 10” in depth with a 3” high mountable lip.
6.10.01.02 Material and Thickness Design The truck apron shall be constructed with the following pavement structure:
9” Portland Cement Concrete – Mix #7 8” Graded Aggregate Base
The thickness of the lifts of the graded aggregate base (GAB) will vary depending on the thickness of the Type “C” curb, but the overall GAB thickness shall remain at 8”. The thickness of the lifts will vary because of the construction sequence to place a base on which to construct the Type “C” curb. Given the 9” thickness of the JPCP layer in a truck apron, the Type “C” curb shall be either 9” or 10” in depth. If a 9” Type “C” curb is placed, the GAB shall be placed in one 3” lift and one 5” lift. If a 10” Type “C” curb is
Pavement Preservation, Rehabilitation & Design
Section 10: Standard Pavement Designs
Updated 05/02/2014 Return to Table of Contents
6-57
placed, the GAB shall be placed in two one 4” lifts. This information can be seen in the detail at the end of this section.
6.10.01.03 Joint Design and Spacing All longitudinal joints on a truck apron shall be either formed or constructed with a slip form paver. All transverse joints shall be contraction joints with the exception of two joints on opposite side of the truck apron. There shall be two expansion joints (only two) on opposite sides of the truck apron to allow for the expansion of the unique geometry of a circular truck apron. The maximum joint spacing at the outer radius of the truck apron shall be 15 feet. Every attempt shall be attempt to have equal and consistent joint spacing around the truck apron.
6.10.01.04 Steel Design
The dowel bars shall have the following design:
#8 bars – 18” long, 12” on center, placed 6” from the longitudinal joint
Longitudinal tie bars shall be placed at all longitudinal joints and slab /curb interfaces and have the following design:
#4 bars – 14” (J) Bar, placed 36” on center

Pavement Preservation, Rehabilitation & Design
Section 10: Standard Pavement Designs
Updated 05/02/2014 Return to Table of Contents
6-58
6.10.01.05 Curb and Truck Apron Tie The truck apron and curb shall be tied together with the specified steel design as described above. The “j” shaped longitudinal devices shall be placed with the bend in the horizontal plane, i.e. the entire bar is at the same elevation. The following detail is provided:
1) Modified Curb and Gutter 2) Longitudinal Tie Devices - #4 “J” Bar, 14” long, placed on 36” center 3) 9” Portland Cement Concrete – Mix #7 4) 4” Graded Aggregate Base 5) Type “C” Curb and Gutter – 10” Depth
6.10.01.06 Travel Way The material type and thickness of the travel portion of the roundabout shall be designed as new pavement section is typically designed in accordance to New Pavement Design. An attempt shall be made to match the thickness of the aggregate base layer in the travel way with that of the truck apron, for ease of construction. This is demonstrated in the pavement detail for the truck apron shown above.
Travel way
Pavement
Section
3.0”
1
2 3 2
5
4
6”

Pavement Preservation, Rehabilitation & Design
Section 10: Standard Pavement Designs
Updated 05/02/2014 Return to Table of Contents
6-59
6.10.02 Park and Ride
The Park and Ride has three possible pavement sections: passenger vehicle area, bus lane area, and bus stop pad area. Adjustments to the design can be made to suit local traffic patterns and regional climates; for example, the use of PG 76-22 for I-95 park and ride lots. The typical pavement sections for all three cases are shown in the following section.
6.10.02.01 Passenger Vehicle The passenger vehicle area shall be designed with the following pavement section:
2” HMA Superpave 9.5mm for Surface – PG64S-22, Level 2 3” HMA Superpave 19.0mm for Base – PG64S-22, Level 2 6” Graded Aggregate Base
6.10.02.02 Bus Lane The bus lane area shall be designed with the following pavement section:
2” HMA Superpave 9.5mm for Surface – PG64S-22, Level 2 5” HMA Superpave 19.0mm for Base – PG64S-22, Level 2 (2 – 2.5” lifts) 6” Graded Aggregate Base
6.10.02.03 Bus Stop Pad The bus stop pad area shall be designed with the following pavement section:
9” Portland Cement Concrete – Mix #7 6” Graded Aggregate Base
The joint spacing shall be 15 feet or less. This length of joint spacing allows for the placement of unreinforced PCC slabs. Therefore, there will be no mid slab steel reinforcement. The dowel bars shall have the following design:
#8 bars – 18.0” long, 12” on center, placed 6” from longitudinal joint
Longitudinal tie bars shall be placed at all longitudinal joints and slab /curb interfaces and have the following design:
#4 bars – 14.0” (J) Bar, placed 36” on center
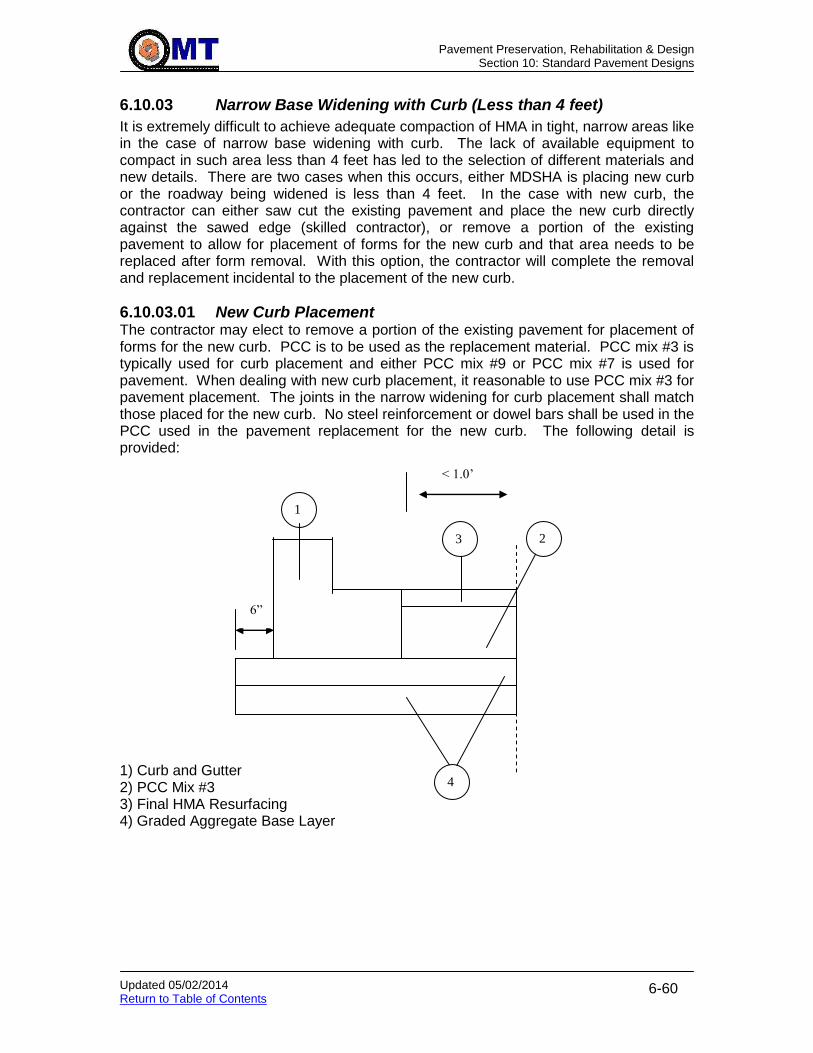
Pavement Preservation, Rehabilitation & Design
Section 10: Standard Pavement Designs
Updated 05/02/2014 Return to Table of Contents
6-60
6.10.03 Narrow Base Widening with Curb (Less than 4 feet)
It is extremely difficult to achieve adequate compaction of HMA in tight, narrow areas like in the case of narrow base widening with curb. The lack of available equipment to compact in such area less than 4 feet has led to the selection of different materials and new details. There are two cases when this occurs, either MDSHA is placing new curb or the roadway being widened is less than 4 feet. In the case with new curb, the contractor can either saw cut the existing pavement and place the new curb directly against the sawed edge (skilled contractor), or remove a portion of the existing pavement to allow for placement of forms for the new curb and that area needs to be replaced after form removal. With this option, the contractor will complete the removal and replacement incidental to the placement of the new curb.
6.10.03.01 New Curb Placement The contractor may elect to remove a portion of the existing pavement for placement of forms for the new curb. PCC is to be used as the replacement material. PCC mix #3 is typically used for curb placement and either PCC mix #9 or PCC mix #7 is used for pavement. When dealing with new curb placement, it reasonable to use PCC mix #3 for pavement placement. The joints in the narrow widening for curb placement shall match those placed for the new curb. No steel reinforcement or dowel bars shall be used in the PCC used in the pavement replacement for the new curb. The following detail is provided:
1) Curb and Gutter 2) PCC Mix #3 3) Final HMA Resurfacing 4) Graded Aggregate Base Layer
1
3
6”
2
< 1.0’
4
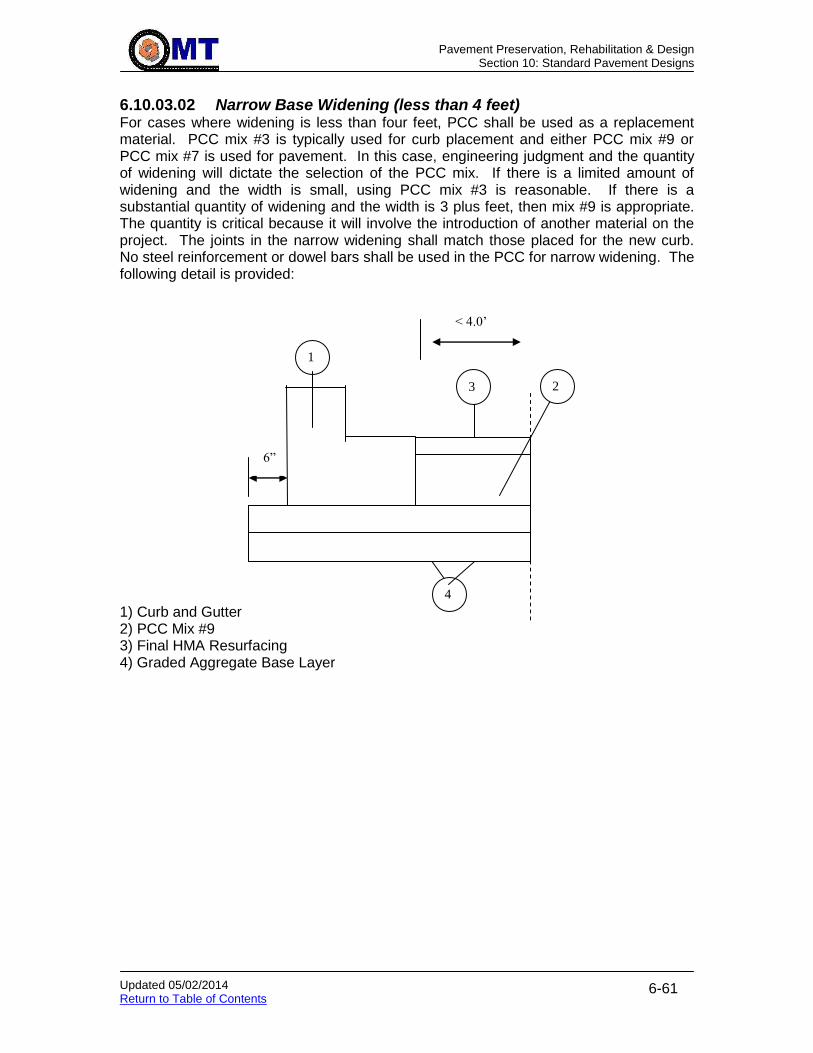
Pavement Preservation, Rehabilitation & Design
Section 10: Standard Pavement Designs
Updated 05/02/2014 Return to Table of Contents
6-61
6.10.03.02 Narrow Base Widening (less than 4 feet) For cases where widening is less than four feet, PCC shall be used as a replacement material. PCC mix #3 is typically used for curb placement and either PCC mix #9 or PCC mix #7 is used for pavement. In this case, engineering judgment and the quantity of widening will dictate the selection of the PCC mix. If there is a limited amount of widening and the width is small, using PCC mix #3 is reasonable. If there is a substantial quantity of widening and the width is 3 plus feet, then mix #9 is appropriate. The quantity is critical because it will involve the introduction of another material on the project. The joints in the narrow widening shall match those placed for the new curb. No steel reinforcement or dowel bars shall be used in the PCC for narrow widening. The following detail is provided:
1) Curb and Gutter 2) PCC Mix #9 3) Final HMA Resurfacing 4) Graded Aggregate Base Layer
< 4.0’
6”
1
3
4
2
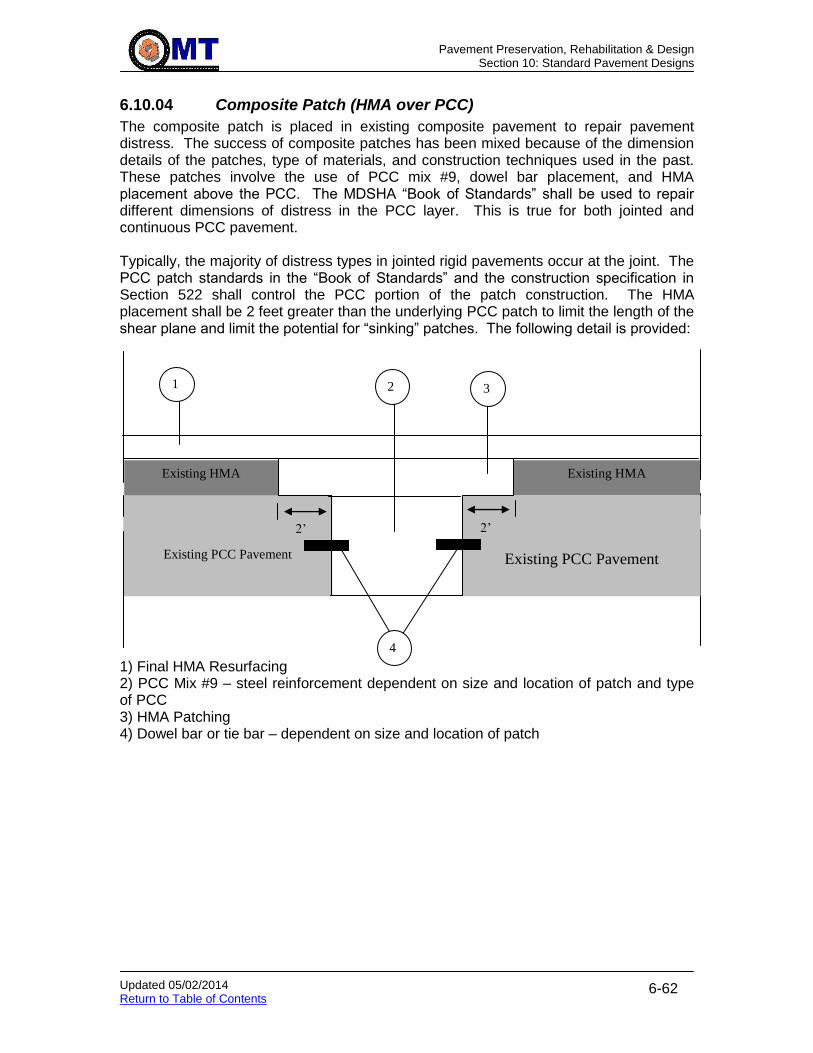
Pavement Preservation, Rehabilitation & Design
Section 10: Standard Pavement Designs
Updated 05/02/2014 Return to Table of Contents
6-62
6.10.04 Composite Patch (HMA over PCC)
The composite patch is placed in existing composite pavement to repair pavement distress. The success of composite patches has been mixed because of the dimension details of the patches, type of materials, and construction techniques used in the past. These patches involve the use of PCC mix #9, dowel bar placement, and HMA placement above the PCC. The MDSHA “Book of Standards” shall be used to repair different dimensions of distress in the PCC layer. This is true for both jointed and continuous PCC pavement. Typically, the majority of distress types in jointed rigid pavements occur at the joint. The PCC patch standards in the “Book of Standards” and the construction specification in Section 522 shall control the PCC portion of the patch construction. The HMA placement shall be 2 feet greater than the underlying PCC patch to limit the length of the shear plane and limit the potential for “sinking” patches. The following detail is provided:
1) Final HMA Resurfacing 2) PCC Mix #9 – steel reinforcement dependent on size and location of patch and type of PCC 3) HMA Patching 4) Dowel bar or tie bar – dependent on size and location of patch
Existing HMA
Existing PCC Pavement
Existing HMA
Existing PCC Pavement
2’ 2’
1 2 3
4

Pavement Preservation, Rehabilitation & Design
Section 10: Standard Pavement Designs
Updated 05/02/2014 Return to Table of Contents
6-63
6.10.05 Driveways & Bike Paths
In general, bike paths and driveways shall match the existing material of the facility. For new applications, the typical pavement sections for both cases shall be designed with the following flexible pavement section:
1.5” HMA Superpave 9.5mm for Surface – PG64S-22, Level 1 2.5” HMA Superpave 19.0mm for Base – PG64S-22, Level 1 4” Graded Aggregate Base
In cases where roadway resurfacing is to be done in the same contract, make an effort to use the same mixes that are to be used on the roadway resurfacing. If a rigid pavement structure is desired, following pavement design section shall be used for bike paths:
5” Portland Cement Concrete – Mix #7 3” Graded Aggregate Base
The joint spacing shall remain at 15 feet. There are no load transfer requirements for bike paths. For rigid driveways, refer to standards MD 630.01 through MD 630.03.
Pavement Preservation, Rehabilitation & Design
Section 10: Standard Pavement Designs
Updated 05/02/2014 Return to Table of Contents
6-64
6.10.06 Bridge Approaches Click to go to Roadway Project Request (Soil Survey)
As per an agreement with the Office of Structures, three standard pavement sections are provided for bridge approaches (nominally, 50’ sections). These sections shall be used when the existing bridge approach pavement needs to be removed to allow for work on the bridge abutments, and shall also apply to shoulders when the existing shoulders have been determined to not be traffic-bearing during MOT operations.
6.10.06.01 Light traffic (ADT < 10,000 vehicles per day) The light traffic section shall be designed with the following pavement section:
2” HMA Superpave 12.5mm for Surface – PG64S-22, Level 2 8” HMA Superpave 25.0mm for Base – PG64S-22, Level 2 (Two 4” lifts) 12” Graded Aggregate Base (Two 6” lifts)
6.10.06.02 Moderate traffic (ADT > 10,000 to < 30,000 vehicles per day) The moderate traffic section shall be designed with the following pavement section:
2” HMA Superpave 12.5mm for Surface – PG64S-22, Level 2 10” HMA Superpave 25.0mm for Base – PG64S-22, Level 2 (Two 5” lifts) 12” Graded Aggregate Base (Two 6” lifts)
6.10.06.03 Heavy traffic (ADT > 30,000 vehicles per day) The heavy traffic section shall be designed with the following pavement section:
2” Gap-Graded Asphalt Mix 12.5mm, PG64E-22 12” HMA Superpave 25.0mm for Base – PG64S-22, Level 2 (Three 4” lifts) 12” Graded Aggregate Base (Two 6” lifts)
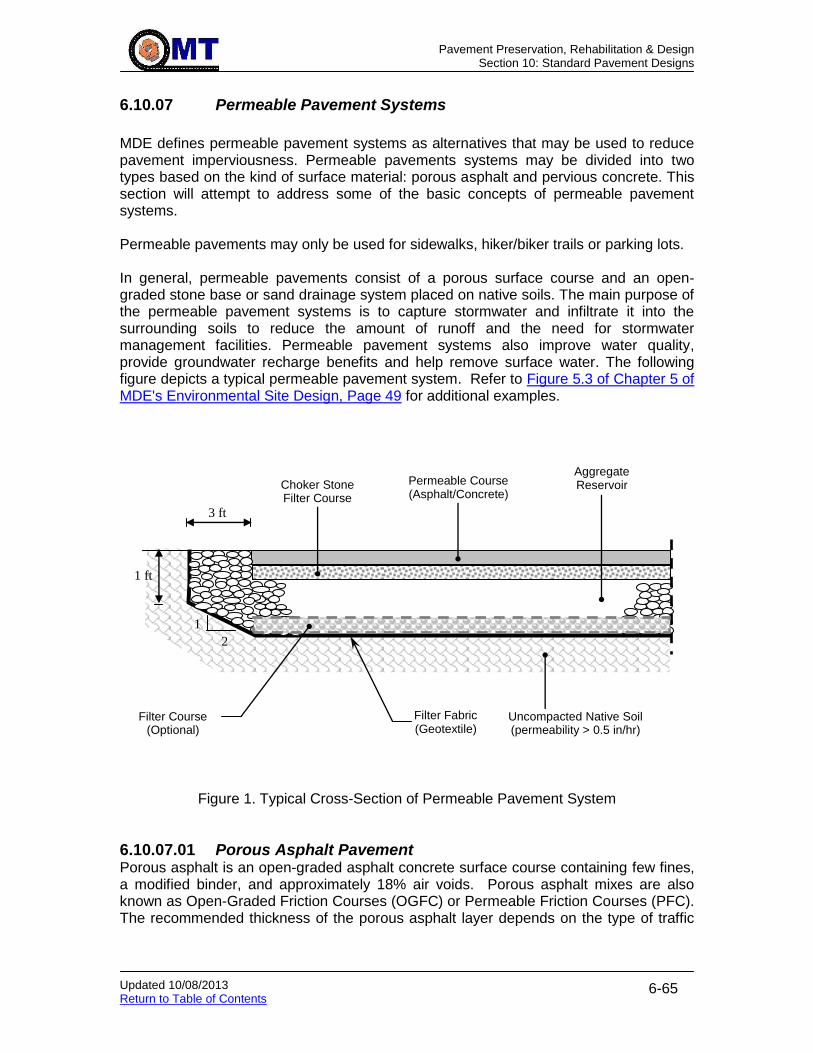
Pavement Preservation, Rehabilitation & Design
Section 10: Standard Pavement Designs
Updated 10/08/2013 Return to Table of Contents
6-65
6.10.07 Permeable Pavement Systems
MDE defines permeable pavement systems as alternatives that may be used to reduce pavement imperviousness. Permeable pavements systems may be divided into two types based on the kind of surface material: porous asphalt and pervious concrete. This section will attempt to address some of the basic concepts of permeable pavement systems. Permeable pavements may only be used for sidewalks, hiker/biker trails or parking lots. In general, permeable pavements consist of a porous surface course and an open-graded stone base or sand drainage system placed on native soils. The main purpose of the permeable pavement systems is to capture stormwater and infiltrate it into the surrounding soils to reduce the amount of runoff and the need for stormwater management facilities. Permeable pavement systems also improve water quality, provide groundwater recharge benefits and help remove surface water. The following figure depicts a typical permeable pavement system. Refer to Figure 5.3 of Chapter 5 of MDE's Environmental Site Design, Page 49 for additional examples.
Figure 1. Typical Cross-Section of Permeable Pavement System
6.10.07.01 Porous Asphalt Pavement Porous asphalt is an open-graded asphalt concrete surface course containing few fines, a modified binder, and approximately 18% air voids. Porous asphalt mixes are also known as Open-Graded Friction Courses (OGFC) or Permeable Friction Courses (PFC). The recommended thickness of the porous asphalt layer depends on the type of traffic
Uncompacted Native Soil (permeability > 0.5 in/hr)
Aggregate Reservoir Permeable Course
(Asphalt/Concrete) Choker Stone Filter Course
Filter Course (Optional)
Filter Fabric (Geotextile)
3 ft
2
1
1 ft

Pavement Preservation, Rehabilitation & Design
Section 10: Standard Pavement Designs
Updated 10/08/2013 Return to Table of Contents
6-66
expected for the site in question. The following table provides the thickness of the porous asphalt layer:
Type of Traffic Compacted Thickness
Sidewalk, Hiker- Biker Trail 3”
Passenger Vehicles Only 4”
Passenger and Light Trucks 5”
Trucks Not appropriate
6.10.07.02 Pervious Concrete Pervious concrete generally consists of a uniform open-graded aggregate Portland Cement Concrete mix with no fines and high porosity (approximately 20%). Porous concrete is mixed in conventional dense concrete plants. The recommended thickness of the pervious concrete layer depends on the type of traffic expected. The following table provides the thickness of the pervious concrete layer:
Type of Traffic Thickness
Sidewalk, Hiker- Biker Trail 5”
Passenger and Light Trucks 6”
Heavy Trucks (ADTT < 10) 8”
6.10.07.03 Choker, reservoir, and filter layers
6.10.07.03.01 Choker Layer The main goal of the choker (or bedding) layer is to fill the voids of the aggregate reservoir and provide a smoother base for the placement of the surface course material. The choker layer shall be comprised of 1.5” AASHTO No. 8. 6.10.07.03.02 Reservoir Layer In addition to providing structure to the permeable pavement system, the purpose of the reservoir is to store the runoff stormwater so it can infiltrate into the soil. The thickness of the reservoir must be determined based on the particular design hydraulic event (established by the Highway Hydraulics Division (HHD) using a typical retention time from 24 to 72 hrs; however, it must also meet structural requirements. The minimum thickness shall be 8” if there are no trucks and it shall be 12” minimum if there are trucks. Thicknesses may vary from 8” to 32”. The thickness design shall be performed by HHD. The reservoir layer is typically comprised of AASHTO No. 2 aggregate or ¾” to 2” size clean crushed stone that contains approximately 40% voids.

Pavement Preservation, Rehabilitation & Design
Section 10: Standard Pavement Designs
Updated 10/08/2013 Return to Table of Contents
6-67
6.10.07.03.03 Filter Course An optional filter course may be included in the permeable pavement system to allow for additional filtration. In some cases, the thickness of this layer may be increased for frost/heaving protection. The filter course may be AASHTO No. 57 aggregate, 3/8” pea gravel or sand. The decision of whether to use the Filter Course rests with HHD. 6.10.07.03.04 Filter Fabric Non-woven geotextiles are normally recommended to prevent subgrade fines from migrating into the aggregate layers. Class PE Type I Geotextile may be used as filter fabric. The decision of whether to use Filter Fabric rests with HHD. 6.10.07.03.05 Longitudinal Underdrains Some designs may require the installation of longitudinal underdrains and outlets underneath the surface material to prevent overflowing. The decision of whether to use Longitudinal Underdrains rests with HHD.
6.10.07.04 General design considerations
6.10.07.04.01 Soil, Topography, and Climate Conducive site conditions for pervious pavement systems should include gentle slopes (should not exceed 5%), preferably flat, and permeable soils (field infiltration tests are necessary during the site evaluation – MDE recommends Hydrologic Soil Groups A, B, or C) to assure the infiltration of stormwater. Optimum conditions also require a relatively deep water table (minimum 3ft of vertical separation from the water table) to prevent overflowing. Refer to USGS groundwater watch and click on the Google Earth version to access water tables by location. This can be used in conjunction with boring information to determine the seasonal high water table. The presence of rock in the area should be taken into account for both design purposes and karst potential. Permeable pavement systems in karst terrain are not typically recommended; however, some literature indicates that pervious pavement systems can be lined to minimize the likelihood of sinkhole development. At the same time, lining the pervious pavement system would defeat the purpose of infiltrating the runoff. If karst topography is found, the site conditions and needs have to be discussed with the hydraulics and geology contacts. If rock is present, it should be at least 4’ below the permeable pavement system. The prevalent climate of the site will affect the design of the pervious pavement system since the volume of the reservoir will be based on the amount of expected rainfall. Frost/heave effects must also be considered in the design of the system’s layers. As much as possible, the subgrade shall be uncompacted. 6.10.07.04.02 Permeable Pavement Systems in Fill Embankments Permeable pavement systems are generally not recommended in fill embankments. Depending on the height of the embankments, the water may affect the stability of the embankment. Additionally, the water might not infiltrate all the way into the surrounding native soil and stay within the fill material. Slope stability must be verified and/or other drainage systems must be considered in fill area on a project specific basis.

Pavement Preservation, Rehabilitation & Design
Section 10: Standard Pavement Designs
Updated 10/08/2013 Return to Table of Contents
6-68
6.10.07.04.03 Maintenance Permeable pavement systems should only be used on sites where regular maintenance can be performed to ensure long-term performance. Inspections shall be scheduled on a regular basis, especially after storm events, to make sure that there is no surface clogging. It is recommended that the surface course be vacuumed at least twice a year with a commercial cleaning unit. Pressure washing (not high-pressure) may also be used in addition to vacuuming. Repairs may be carried out with traditional methods; however, it should not exceed 10% of the surfaced area. Sand shall not be used for winter maintenance. 6.10.07.04.04 Special Provisions Refer to Specifications for the latest versions of the Special Provisions for permeable pavement systems, materials, and associated construction procedures. These should be reviewed by the pavement designer before including permeable pavements in any project.
Geotechnical Design
Section 01: Earthwork (Excavation)
Updated 10/15/2013 Return to Table of Contents
7-1
7 GEOTECHNICAL DESIGN
7.01 EARTHWORK (EXCAVATION) Click to go to Top of Subgrade
7.01.01 General
This section provides the PAGD Engineer specific steps for computing the earth work quantities and any material specifications required to be included in the Contract Documents. This section includes information regarding Limits of Class 1 Excavation, Top of Subgrade, Class 1-A Excavation, Backfill Material for Class 1-A Excavation, Wasting a % of Class 1 Excavation, Shrinkage and Swell factors to determine the quantity of borrow available, etc.
7.01.02 Purpose
Class 1 Excavation and Top of Subgrade: To inform the PM of the lowest normal grading limit for roadway excavation so that earthwork quantities can be computed accurately. The Top of Subgrade, which generally can be defined as an imaginary line immediately below the bottom of the sub base, base or pavement, and is designated to establish where the top one ft compaction requirements and test rolling requirements apply. (Refer to Section 201 – Roadway Excavation (Class 1, Class 1-A, Class 2) of “Standard Specifications for Construction and Materials, July 2008”)
Class 1-A Excavation: This item is established when undercutting is anticipated because of excessive moisture conditions, low bearing capacity soils at subgrade, or where definite areas of muck removal exist. The quantity estimate established by the PAGD Engineer for replacement of Class 1-A Excavation is based on any or all of the above conditions. Backfill quantities for areas such as swamps and dumps should be established under the appropriate borrow item.
Wasting a % of Class 1 Excavation: This information is provided to the PM in order to establish earthwork quantities based on the amount of unsuitable material on a project.
Shrinkage and Swell factors: An arithmetical figure to be applied to a cut volume so that the PM can estimate the quantity of material available for use in embankments.
7.01.03 Resource Requirements
Below are the following staffing needs for a typical project:
Position Function Resources Effort Level (man-hours)
PAGD Engineer Review project file, plans, soils information
1 8*
* The time required would vary depending on the size and complexity of a project.
7.01.04 Procedure
The procedure presented in the attached flowchart and described in the following text should be followed for a typical project in defining Limits of Excavation, Top of Subgrade, Backfill materials required, and therefore assisting the PM in developing the grading table. The following procedure was written to provide the PAGD Engineer with adequate information to complete a typical Earthwork Excavation and Backfill procedure without specific knowledge or access to computer software applications, but with the assumption that these tools were available.
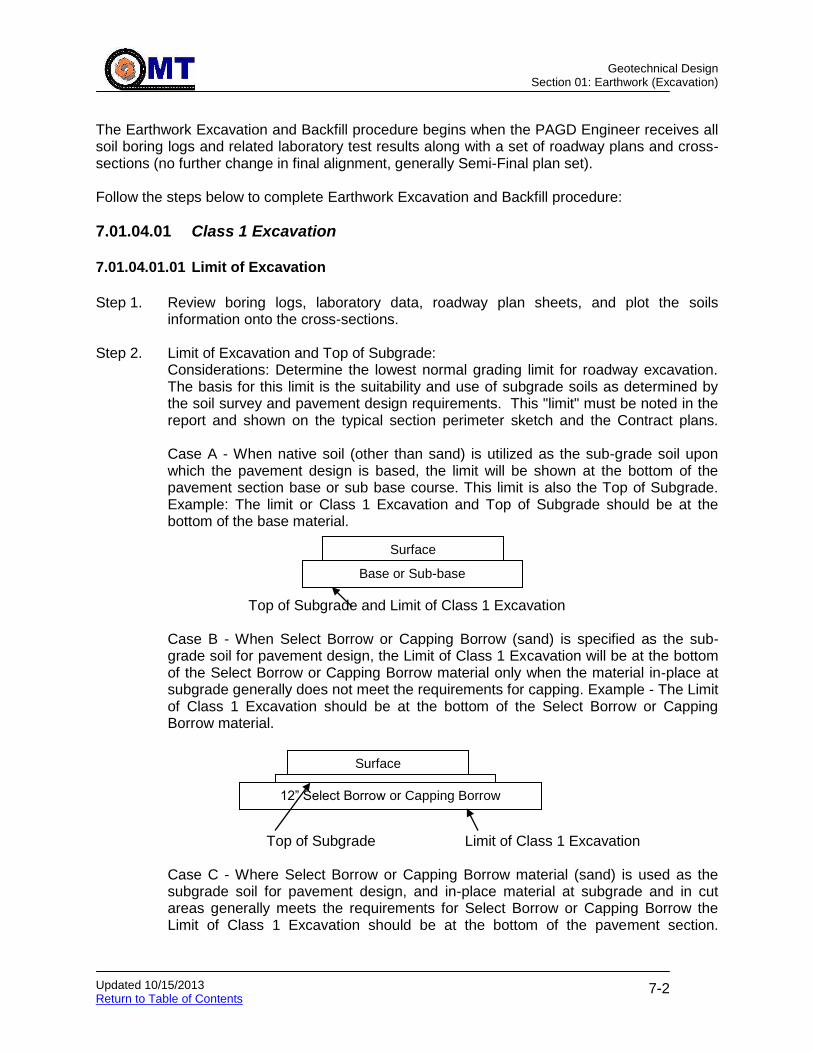
Geotechnical Design
Section 01: Earthwork (Excavation)
Updated 10/15/2013 Return to Table of Contents
7-2
The Earthwork Excavation and Backfill procedure begins when the PAGD Engineer receives all soil boring logs and related laboratory test results along with a set of roadway plans and cross-sections (no further change in final alignment, generally Semi-Final plan set). Follow the steps below to complete Earthwork Excavation and Backfill procedure:
7.01.04.01 Class 1 Excavation 7.01.04.01.01 Limit of Excavation
Step 1. Review boring logs, laboratory data, roadway plan sheets, and plot the soils
information onto the cross-sections. Step 2. Limit of Excavation and Top of Subgrade:
Considerations: Determine the lowest normal grading limit for roadway excavation. The basis for this limit is the suitability and use of subgrade soils as determined by the soil survey and pavement design requirements. This "limit" must be noted in the report and shown on the typical section perimeter sketch and the Contract plans. Case A - When native soil (other than sand) is utilized as the sub-grade soil upon which the pavement design is based, the limit will be shown at the bottom of the pavement section base or sub base course. This limit is also the Top of Subgrade. Example: The limit or Class 1 Excavation and Top of Subgrade should be at the bottom of the base material.
Top of Subgrade and Limit of Class 1 Excavation
Case B - When Select Borrow or Capping Borrow (sand) is specified as the sub-grade soil for pavement design, the Limit of Class 1 Excavation will be at the bottom of the Select Borrow or Capping Borrow material only when the material in-place at subgrade generally does not meet the requirements for capping. Example - The Limit of Class 1 Excavation should be at the bottom of the Select Borrow or Capping Borrow material.
Top of Subgrade Limit of Class 1 Excavation
Case C - Where Select Borrow or Capping Borrow material (sand) is used as the subgrade soil for pavement design, and in-place material at subgrade and in cut areas generally meets the requirements for Select Borrow or Capping Borrow the Limit of Class 1 Excavation should be at the bottom of the pavement section.
Surface
Base or Sub-base
Surface
Base or Sub-base 12” Select Borrow or Capping Borrow
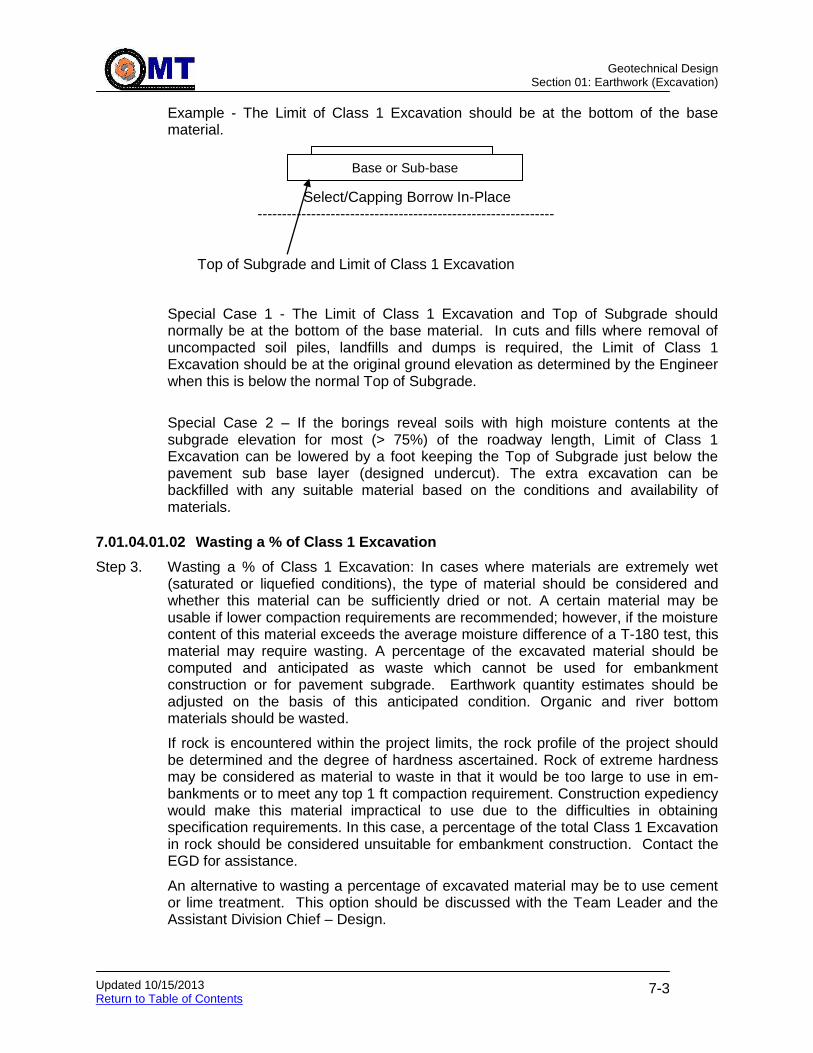
Geotechnical Design
Section 01: Earthwork (Excavation)
Updated 10/15/2013 Return to Table of Contents
7-3
Example - The Limit of Class 1 Excavation should be at the bottom of the base material.
Select/Capping Borrow In-Place
------------------------------------------------------------- Top of Subgrade and Limit of Class 1 Excavation
Special Case 1 - The Limit of Class 1 Excavation and Top of Subgrade should normally be at the bottom of the base material. In cuts and fills where removal of uncompacted soil piles, landfills and dumps is required, the Limit of Class 1 Excavation should be at the original ground elevation as determined by the Engineer when this is below the normal Top of Subgrade.
Special Case 2 – If the borings reveal soils with high moisture contents at the subgrade elevation for most (> 75%) of the roadway length, Limit of Class 1 Excavation can be lowered by a foot keeping the Top of Subgrade just below the pavement sub base layer (designed undercut). The extra excavation can be backfilled with any suitable material based on the conditions and availability of materials.
7.01.04.01.02 Wasting a % of Class 1 Excavation
Step 3. Wasting a % of Class 1 Excavation: In cases where materials are extremely wet (saturated or liquefied conditions), the type of material should be considered and whether this material can be sufficiently dried or not. A certain material may be usable if lower compaction requirements are recommended; however, if the moisture content of this material exceeds the average moisture difference of a T-180 test, this material may require wasting. A percentage of the excavated material should be computed and anticipated as waste which cannot be used for embankment construction or for pavement subgrade. Earthwork quantity estimates should be adjusted on the basis of this anticipated condition. Organic and river bottom materials should be wasted.
If rock is encountered within the project limits, the rock profile of the project should be determined and the degree of hardness ascertained. Rock of extreme hardness may be considered as material to waste in that it would be too large to use in em-bankments or to meet any top 1 ft compaction requirement. Construction expediency would make this material impractical to use due to the difficulties in obtaining specification requirements. In this case, a percentage of the total Class 1 Excavation in rock should be considered unsuitable for embankment construction. Contact the EGD for assistance.
An alternative to wasting a percentage of excavated material may be to use cement or lime treatment. This option should be discussed with the Team Leader and the Assistant Division Chief – Design.
Surface Base or Sub-base

Geotechnical Design
Section 01: Earthwork (Excavation)
Updated 10/15/2013 Return to Table of Contents
7-4
7.01.04.01.03 Shrinkage and Swell Factors
Step 4. Shrinkage and Swell Factors: Shrinkage and Swell factors are provided to the PM to compute earthwork quantities. Considerations: Normally, material compacted by nature will occupy a smaller vol-ume when compacted to its maximum dry density at an optimum moisture content determined by AASHO T-180. On the other hand, rock and rock soils, such as old road beds, will occupy a larger volume when disturbed and fractured during excavation. Evaluation of in place density checks of native material is important especially if it represents a large quantity of Class 1 Excavation material. Other important tools used in determining shrinkage or swell factors include profile of auger refusals and an evaluation of rock cores above and below refusal elevation. The following table gives an average factor for the various soils. Consideration should be given to obtain lab tested Shrinkage/Swell Factors on large earthwork projects. It should be noted that factors vary considerably and it is desirable that this table only be used if no other information is available: Table: Shrinkage and Swell Factors
Soil Type Shrinkage/Swell Factors For T-180-57
Clayey 0.80
Silt 0.83
Sandy 0.85
Sand A-2 0.87
Gravel 0.90
Soft Rock or Shale 1.05 to 1.15
Hard Rock 1.10 to 1.20
A-5 W/Little Rock Shale 0.84
Sand Borrow Densified 10% to 12%
Borrow Densified 1-S.F x 100 = % Borrow Densified S.F
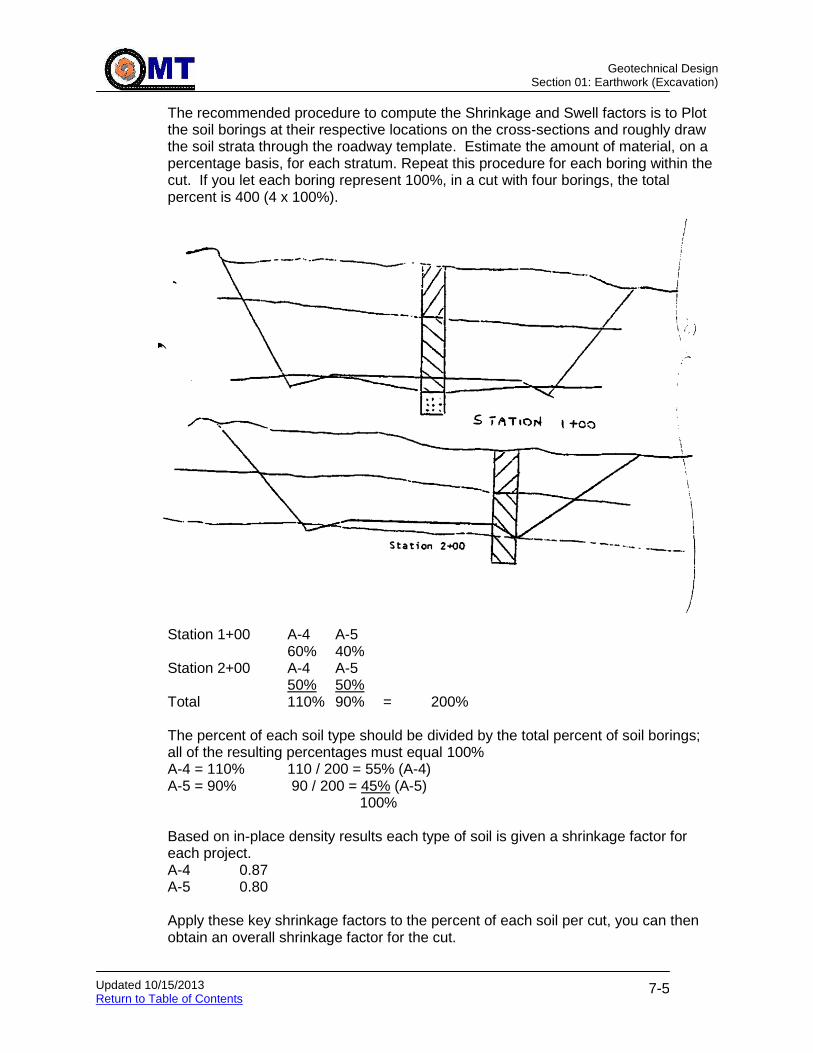
Geotechnical Design
Section 01: Earthwork (Excavation)
Updated 10/15/2013 Return to Table of Contents
7-5
The recommended procedure to compute the Shrinkage and Swell factors is to Plot the soil borings at their respective locations on the cross-sections and roughly draw the soil strata through the roadway template. Estimate the amount of material, on a percentage basis, for each stratum. Repeat this procedure for each boring within the cut. If you let each boring represent 100%, in a cut with four borings, the total percent is 400 (4 x 100%).
Station 1+00 A-4 A-5 60% 40% Station 2+00 A-4 A-5 50% 50% Total 110% 90% = 200% The percent of each soil type should be divided by the total percent of soil borings; all of the resulting percentages must equal 100% A-4 = 110% 110 / 200 = 55% (A-4) A-5 = 90% 90 / 200 = 45% (A-5) 100% Based on in-place density results each type of soil is given a shrinkage factor for each project. A-4 0.87 A-5 0.80 Apply these key shrinkage factors to the percent of each soil per cut, you can then obtain an overall shrinkage factor for the cut.

Geotechnical Design
Section 01: Earthwork (Excavation)
Updated 10/15/2013 Return to Table of Contents
7-6
% A-4 (S.F) + % A-5 (S.F) = Shrinkage Factor per cut 0.55 (0.87) + 0.45 (0.80) = 0.4785 + 0.3600 = 0.8385 = 0.84 The shrinkage factor of 0.84 may be applied to a particular cut. If you estimate other cuts also have shrinkage factors of 0.84 then these may be combined (a) or two cuts of approximately the same volume may be “averaged” (b). (a) Station 10 to 18 0.84 Station 20 to 27 1.10 Station 27 to 30 0.84 Station 35 to 43 0.84 Therefore use a shrinkage factor of 0.84 for all cuts on the project except for Stations 20 to 27, where the factor of 1.10 is applicable. (b) Station 100 to 120 0.84 Station 140 to 160 0.86 0.86 Station 165 to 185 0.88 A shrinkage factor of 0.86 should be applied to all cut on this project.
A second recommended procedure: A more simplified method is to assign key shrinkage factors to each soil type based on in-place densities and apply these factors to the profiles. Silt w/Rock Frag. (Hor. Lines) S.F = 0.89 Soil w/o Frag. (No Shade) S.F = 0.85 Soft Rock (Black Shaded) S.F =1.05 Hard Rock (Inclined Lines) S.F = .15
43+00 49+00 52+00 57+00 40% @ 1.15 = 0.46 10% @ 1.05 = 0.11 15% @ 1.05 = 0.16 90% @ 0.85 = 0.76 45% @ 0.89 = 0.40 0.87 1.02 Recommend in the report Station 20+ to 23+ 0.84 Station 43+ to 49+ 1.02 A1I other cuts 0.87

Geotechnical Design
Section 01: Earthwork (Excavation)
Updated 10/15/2013 Return to Table of Contents
7-7
Another way to compute the Shrinkage Factors for a project where there is excavation due to base-widening, re-alignment of the road, etc. is to gather the list of soils encountered during the soil survey and apply shrinkage factors to the predominant soils and average it. All excavated soils on a project are stockpiled together before they are used elsewhere as a Common Borrow.
7.01.04.01.04 Drying of wet material Step 5 If it is anticipated that the Contractor will not have a reasonable amount of time nor a
location to stockpile wet material, consideration should be given to wasting the wet material (Refer to Step 3).
7.01.04.01.05 Sequence of Construction and Availability of Excavated Material Step 6 The sequence of construction (fill and cut operations) should be considered when
making material recommendations. For example, if fill operations occur in the first stages of a project and there is limited cut operations, most material for construction will likely be borrow material as there would be limited material available from excavation. On the other hand, if cut operations occur in the first stages, this excavated material, if suitable, must be used for fill operations prior to borrow material.
7.01.04.02 Class 1-A Excavation and Backfill Click to go to Embankments Click to go to Advanced Geotechnical Report
Step 7. Class 1-A Excavation: All Excavation of unsuitable material below the lowest excavation limits established (Class 1, Class 2, etc.). Unsuitable material comprises of unstable soils (soils which fail test/proof rolling), soils with excessive moisture content, Muck (A-8), highly organic soils, rubble, landfills, non-compacted man-made or natural fills, etc. Class 1-A Excavation locations for roadways may be below Top of Subgrade elevation in Cut and No Cut/No Fill areas and below existing ground for Embankment/Fill areas. Below Top of Subgrade elevation, Class 1-A Excavation and Backfill is required to improve the bearing capacity, provide a stable platform to construct the pavement section. Below existing ground for Embankment/Fill areas, Class 1-A Excavation and Backfill is required to improve the bearing capacity, increase the stability of slopes, potentially reduce settlement (short term, long term, and differential), and provide a stable working platform for construction equipment.
The following factors (conditions calling for unsuitable material) should be considered while computing the quantities for Class 1-A Excavations in the project design phase from soil borings and lab data:
When low to non-plastic materials like AASHTO A-4 and A-5 with moisture
contents greater than 20% are encountered at subgrade elevations during new roadway construction.
When plastic materials like AASHTO A-6 and A-7 (A-7-5, and A-7-6) are encountered at subgrade elevations during new roadway construction.
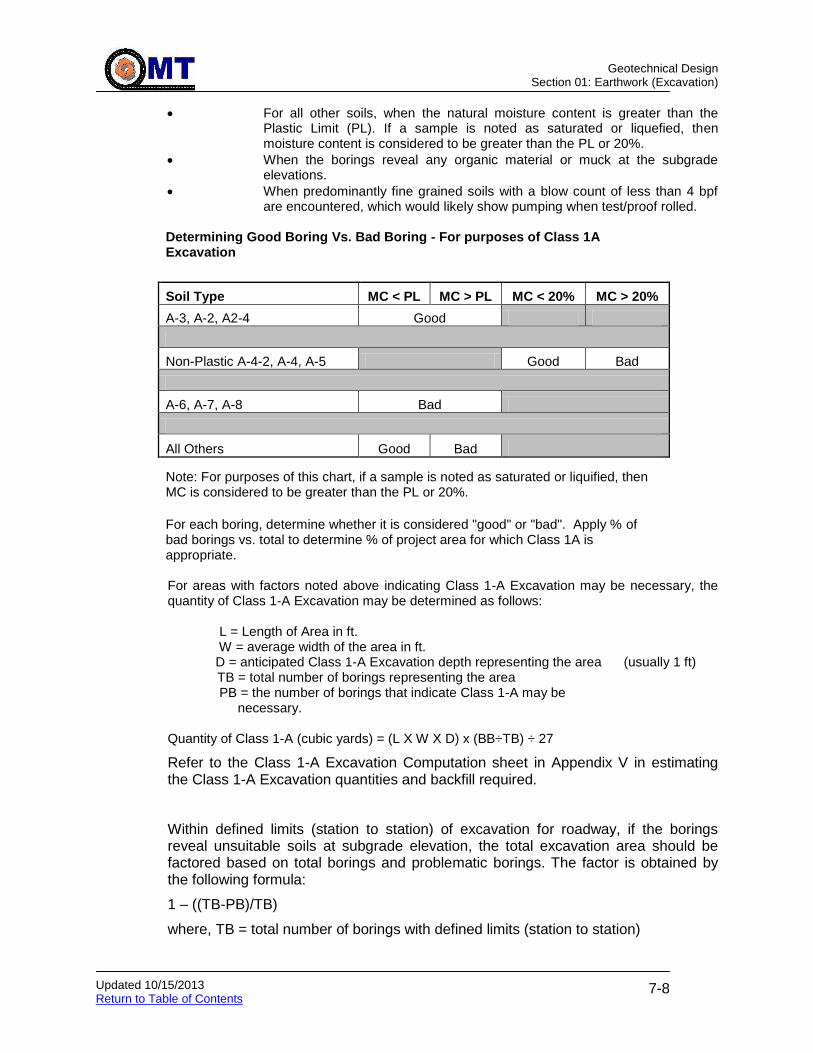
Geotechnical Design
Section 01: Earthwork (Excavation)
Updated 10/15/2013 Return to Table of Contents
7-8
For all other soils, when the natural moisture content is greater than the Plastic Limit (PL). If a sample is noted as saturated or liquefied, then moisture content is considered to be greater than the PL or 20%.
When the borings reveal any organic material or muck at the subgrade elevations.
When predominantly fine grained soils with a blow count of less than 4 bpf are encountered, which would likely show pumping when test/proof rolled.
Determining Good Boring Vs. Bad Boring - For purposes of Class 1A Excavation
Soil Type MC < PL MC > PL MC < 20% MC > 20%
A-3, A-2, A2-4 Good
Non-Plastic A-4-2, A-4, A-5 Good Bad
A-6, A-7, A-8 Bad
All Others Good Bad
Note: For purposes of this chart, if a sample is noted as saturated or liquified, then MC is considered to be greater than the PL or 20%.
For each boring, determine whether it is considered "good" or "bad". Apply % of bad borings vs. total to determine % of project area for which Class 1A is appropriate. For areas with factors noted above indicating Class 1-A Excavation may be necessary, the quantity of Class 1-A Excavation may be determined as follows: L = Length of Area in ft. W = average width of the area in ft.
D = anticipated Class 1-A Excavation depth representing the area (usually 1 ft) TB = total number of borings representing the area PB = the number of borings that indicate Class 1-A may be necessary. Quantity of Class 1-A (cubic yards) = (L X W X D) x (BB÷TB) ÷ 27
Refer to the Class 1-A Excavation Computation sheet in Appendix V in estimating the Class 1-A Excavation quantities and backfill required.
Within defined limits (station to station) of excavation for roadway, if the borings reveal unsuitable soils at subgrade elevation, the total excavation area should be factored based on total borings and problematic borings. The factor is obtained by the following formula:
1 – ((TB-PB)/TB)
where, TB = total number of borings with defined limits (station to station)
Geotechnical Design
Section 01: Earthwork (Excavation)
Updated 10/15/2013 Return to Table of Contents
7-9
PB = problematic number of borings with defined limits (station to
station)
Backfill for Class 1-A Excavation may be various materials and selection depends on the geographical location of the project and material availability.
For areas below Top of Subgrade, Backfill for Class 1-A Excavation may be Geosynthetic Stabilized Subgrade using Graded Aggregate Base (GSSGAB), Select Borrow, Capping Borrow or Modified Borrow. Use the following based on the geography of Maryland. Eastern MD = Select Borrow or Capping Borrow (densification factor = 18%) Southern MD = Select Borrow or Capping Borrow (densification factor = 18%) Western MD = Modified Borrow (densification factor = 15%) Rest of MD = GSSGAB (densification factor = 11%) For Embankment/Fill areas, use Select Borrow, Capping Borrow or Modified Borrow for Backfill of Class 1-A Excavation if anticipated from borings and not GSSGAB.
Step 8. Provide an approximate quantity of the Class 1-A Excavation and Backfill Material to the PM following Step 4 in the Final Pavement and Geotechnical Report and in an SP.
7.01.04.03 Class 3 Excavation and Backfill
Step 9. Class 3 Excavation and Backfill - If the borings reveal unsuitable material near pipe invert elevations, the PM should be alerted in the Final Pavement and Geotechnical Report that some material from pipe excavations may not be suitable for backfilling pipe trenches. An item of Class 3 Excavation and Selected Backfill should be recommended to be included in the Contract.

Geotechnical Design
Section 02: Slopes)
Updated 10/15/2013 Return to Table of Contents
7-10
7.02 SLOPES
7.02.01 Slopes Stability Analysis
Slope stability analyses are required for the design of cut and fill slopes, embankments and retaining structures on slopes. Slope stability analyses may be performed using charts for preliminary designs or computer software for final designs. Generation of appropriate soil strength parameters, soil stratigraphy and water levels are critical when performing the analysis. An understanding of potential failure mechanisms is also necessary in order to investigate and determine the critical failure surface and applicable factor of safety. Refer to the US Army Corps of Engineer’s Slope Stability Manual EM 1110-2-1902 for more information.
It is anticipated that EGD will be the lead for Slope Stability Analysis and this procedure is intentionally not explained in detail. PAGD Engineers should request an EGD Contact for slope stability analysis for cuts/fills < 10 feet with potentially unstable soil; for all cuts/fills over 10 feet; and for any cuts in rock.
7.02.02 Cut Slope Design (Soil and Rock)
During project design phase, it is sometimes necessary to design cut slopes due to right of way constraints to support highway structures. The design or recommendations of cut slope must consider measures that will prevent immediate and sudden failures, and protect the slope over the long term unless the slope is cut for temporary reasons only. Recommendations should include the slope inclinations required for stability, mitigation requirements if needed and the unsuitability of excavated cut material. In some situations, cut stability at the end of construction may be a critical design consideration. It is anticipated that EGD will be the lead for Cut Slope Design and this procedure is intentionally not explained in detail. Refer to Reference Guidelines.
7.02.03 Fill Slope Design – Soil
During project design phase, it is sometimes necessary to design fill slopes to support highway structures. The design or recommendations of fill slope must consider measures that will prevent immediate and sudden failures, and protect the slope over the long term. Recommendations should include the slope inclinations required for stability, mitigation requirements. It is anticipated that EGD will be the lead for Fill Slope Design and this procedure is intentionally not explained in detail.
Geotechnical Design
Section 03: Embankments
Updated 10/15/2013 Return to Table of Contents
7-11
7.03 EMBANKMENTS
7.03.01 General
The design of a roadway embankment can utilize a wide range of soil materials and permit substantial amounts of settlement without affecting the performance of the highway. Roadway designers necessarily permit such materials to reduce project costs by utilizing locally available soils. The primary purpose of this section is for the design and construction of soil embankments. The key geotechnical issues for design and construction of embankments include stability and settlement of the underlying soil, impact of the stability and settlement on the construction staging and time requirements, and the impact to adjacent and nearby structures, such as bridge foundations, utilities, and building etc,.
7.03.02 Purpose
Information on a typical roadway base widening or new construction project which involves roadway embankments or bridge approach embankments is needed to:
Determine the type of soils and moisture conditions of soils at embankment foundation level.
Identifying different strata.
Check embankment stability and settlement due to loadings.
Methods to expedite the consolidation of embankments built over compressible soils.
Engineer fills with available material.
7.03.03 Resource Requirements
The embankment analysis process is typically done with data available to the PAGD Engineer in the office coupled with soil boring logs from the driller and related laboratory test results. The request procedure documented below requires the following staffing needs for a typical project:
Position Function Resources Effort Level (man-hours)
PAGD Engineer/EGD Representative
Review cross-sections 2 4*
PAGD Engineer/EGD Representative
Analyzing lab data for soil properties, soil profile
2 4*
EGD Representative/PAGD Engineer
Settlement Analysis 2 16*
* The time required would vary depending on the size and complexity of a project.
7.03.04 Embankment Materials
Roadway embankments are constructed on soils which support the embankment along with the traffic loading. Embankments may be built with different types of borrow materials such as Common Borrow, Select Borrow, Modified Borrow, etc. If the embankments are to be built abutting a stream or water bodies, Rip-Rap should be used up to 6” above the flood level and then Select Borrow or Common Borrow may be used to the Top of Subgrade. Rip-Rap should be choked with CR-6. Alternately, geosynthetics for

Geotechnical Design
Section 03: Embankments
Updated 10/15/2013 Return to Table of Contents
7-12
stabilization may be used to prevent migration of finer borrow into the void spaces of the coarser underlying material. Following embankment materials are typically used in different geographical locations of Maryland.
Geographic Area Type of Material
Eastern Shore Common Borrow, Select Borrow or Capping
Borrow
Southern MD Common Borrow, Select Borrow or Capping Borrow
Western MD Common Borrow or Modified Borrow
Lightweight Fills: Lightweight embankment fill is another means of building roadway embankments along with improving the embankment stability. Lightweight fills are generally used for two conditions: the reduction of the driving forces contributing to instability, and reduction of potential settlement resulting from consolidation of compressible foundation soils. Situations where lightweight fill may be appropriate include conditions where the construction schedule does not allow the use of staged construction, where existing utilities or adjacent structures are present that cannot tolerate the magnitude of settlement induced by placement of typical fill, and at locations where post-construction settlements may be excessive under conventional fills. Lightweight fill can consist of a variety of materials including polystyrene blocks (geofoam), light weight aggregates (rhyolite, expanded shale, blast furnace slag, fly ash), wood fiber, and other materials. If a project warrants the usage of lightweight fills, EGD should be contacted. For more information on lightweight fill embankments, refer to the NCHRP document titled “Geofoam Applications in the design and construction of Highway Embankments”.
7.03.05 Unstable Foundation Materials and Treatments
If the soils borings at foundation level for embankments reveal soft/wet soils, soils with low bearing capacity, or Muck (A-8) it may be necessary to excavate the full depth of the soft layer or provide an alternate treatment with the assistance of EGD. Embankment foundations may be undercut and replaced with Select Borrow or Modified Borrow or bridged with thick lifts of Select Borrow or Modified Borrow. Undercut depths are typically 1 to 3 ft, but can be as deep as 5 ft. Undercutting for depths greater than these is impractical and an alternate treatment should be considered. Follow the guidelines for conditions outlined in Class 1-A Excavation and Backfill, where the embankment foundation soils are anticipated to fail test/proof rolling. Note these guidelines are intended to provide a stable platform for construction equipment in order to construct the embankment. These guidelines may not solve all issues regarding the settlement or stability of embankments:

Geotechnical Design
Section 03: Embankments
Updated 10/15/2013 Return to Table of Contents
7-13
1. If the embankment fill is more than 3 ft height, a. Undercut (1 to 3 ft) and replace with Select Borrow or Modified Borrow, or b. Provide bridge lift (1 to 3 ft) of Select Borrow or Modified Borrow. There will be
no Class 1-A Excavation. 2. If the embankment fill is less than 3 ft in height, the embankment should be constructed with Select Borrow or Modified Borrow. Section 204 of the “Standard Specifications for Construction and Materials, July 2008” does not require test/proof rolling of the embankment foundation. When warranted based on the project scope and soil conditions, it is recommended a SP should be provided requiring test/proof rolling and specifying treatments. Fine grained soils with an N value less than 4 blows per foot are likely to exhibit pumping when test/proof rolled. Localized soft spots identified by test/proof rolling and not accounted for during design will be stabilized and grades will be restored prior to placing the embankment resulting in an overrun of Class 1-A Excavation and/or backfill material.
7.03.06 Settlement Analysis
Settlement should be assessed for all embankments if soil conditions warrant. For cohesionless materials, the majority of the settlement will be immediate settlement. For cohesive soft materials, the settlement typically consists of three potential components: immediate settlement, consolidation settlement, and secondary compression. Refer to “Soils and Foundations Workshop”, NHI Course No. 132012 for more information. It is anticipated that EGD will be the lead for Settlement Analysis and this procedure is intentionally not explained in detail. PAGD Engineers should request an EGD Contact for settlement analysis for embankments/fills < 10 feet with potentially unstable soil and for all embankments/fills over 10 feet.

Geotechnical Design
Section 04: Subgrades
Updated 10/15/2013 Return to Table of Contents
7-14
7.04 SUBGRADES
7.04.01 General
Subgrade is the material in cuts and fills directly beneath the bottom layer of the pavement section, and to such depth as may affect the structural design. Uniform subgrade support is necessary for the satisfactory performance of any pavement and may be attained by insuring that material with acceptable uniform physical characteristics be maintained directly beneath the pavement section when it is economically feasible.
7.04.02 Resilient Modulus
Characterizing subgrade soil in terms of Resilient Modulus (Mr) is essential for the pavement design, both flexible and rigid pavements. The 1986 AASHTO Guide for design of flexible pavements replaces the SSV (soil support value) and recommends the use of Mr for characterizing the subgrade soil as it indicates a basic material property which can be used in mechanistic analysis of multi-layered systems. The Mr attribute has been recognized widely for characterizing pavement materials in pavement design and evaluation. Mr is a measure or estimate of the elastic modulus of the material at a given stress or temperature. Mathematically, it is expressed as the ratio of applied deviator stress to recoverable strain. Mr is generally determined in the laboratory using repeated load triaxial tests, indirectly through correlation with other standard tests, or by back calculating from deflection test results. For a new design, Mr is generally obtained by conducting repeated load triaxial tests on disturbed samples. Due to high costs and complexity of the test involved in testing samples, many State Departments have alternatively developed correlation equations involving stress states and soil physical properties to derive the resilient modulus of subgrade soils. For projects involving significant base widening, re-alignment, new construction, etc, disturbed (bulk bag) samples are retrieved for Mr testing. Use the Mr values obtained from the resilient modulus test with discretion for pavement design. Mr tests are run on samples at three different moisture conditions. Use the one which best fits the field moisture conditions. For larger projects, consideration may be given to undisturbed sampling (Shelby Tubes) for Mr testing with discussion with the Assistant Division Chief – Design. MDSHA PAGD is in the process of developing Mr correlation equations for typical Maryland soils based on soil physical properties. MDSHA PAGD designs flexible pavements based on the subgrade strength reported in terms of resilient modulus. Several other tests can be used to assess the strength of the subgrade; i.e. CBR. However, all analysis, designs, and reports will be done in terms of resilient modulus for the soil subgrade for flexible pavements. A simple conversion from CBR to resilient modulus for soil subgrade is the following equation:
Mr = 1500 * CBR
This equation has been questioned in terms of accuracy and properly identifying the relationship between Mr and CBR by the technical pavement industry. The highest level of confidence for this equation is for low CBR values, typically under a CBR value of 10.

Geotechnical Design
Section 04: Subgrades
Updated 10/15/2013 Return to Table of Contents
7-15
The subgrade resilient modulus used for new or rehabilitation design should be the average modulus for a particular section, not the lowest. If distinct smaller sections can be identified with different subgrade resilient moduli within a longer section, then the sections should be broken out as separate sections and pavement rehabilitation designs should be done for each section. It is the policy of MDSHA PAGD to have a maximum design subgrade modulus. The maximum design Mr is 10,500 psi or a CBR of approximately 7. Occasionally, higher subgrade moduli values are found throughout the state, but because of the moist climatic seasons and the natural soils of Maryland; it has been decided to cap the maximum design subgrade modulus. The following table provides typical resilient modulus values for materials typical for MDSHA. Subgrade Resilient Modulus
Material General Strength
Typical Modulus (psi)
Typical CBR
Silts and Clays (w/ high compressibility)
Very Low 1,000 – 2,000 Less than 2
Fine Grain Soils with Silts and Clays (w/ low compressibility)
Low 2,000 – 3,000 2 to 2.5
Poorly Graded Sands Medium 3,000 – 4,500 2.5 to 3
Gravely Soils, Well Graded Sands, and Sand/Gravel Mixtures
High 4,500 – 10,500 3 to 7
Subgrade Resilient Modulus based on Geography of Maryland
Material Typical Modulus (psi)
Eastern MD (Sandy Soils) 4,500 – 6,000
Western MD (soils w/gravel or rock fragments) 6,000 – 7,500
Rest of MD 4,500
The values in the table above should be used when FWD analysis, or laboratory information are not available. Whenever sand (Select borrow or Capping Borrow) is recommended for the top 12” of subgrade, the design Mr should be 10,500 psi, unless soft material (less than 4 bpf) is underneath the proposed Select or Capping Borrow. Whenever, 6” of (Select borrow or Capping Borrow) is recommended, the design Mr of native subgrade soil, as determined herein, should be increased by 3,000 psi. For example, if the native subgrade Mr is determined to be 6,000 psi, then 6” of sand capping would increase the design Mr to 9,000 psi.
7.04.03 Frost Depth
The following information pertains to the design and construction of pavements in areas having frost susceptible soils. Frost susceptible soils based on AASHTO Classification: Very High - A-4, A-5, A-6, A-7 High - A-2-4, A-7-5, A-7-6

Geotechnical Design
Section 04: Subgrades
Updated 10/15/2013 Return to Table of Contents
7-16
APPROXIMATE FROST DEPTH BASED ON THE X VALUE FOR MODIFIED BERGGREN FORMULA
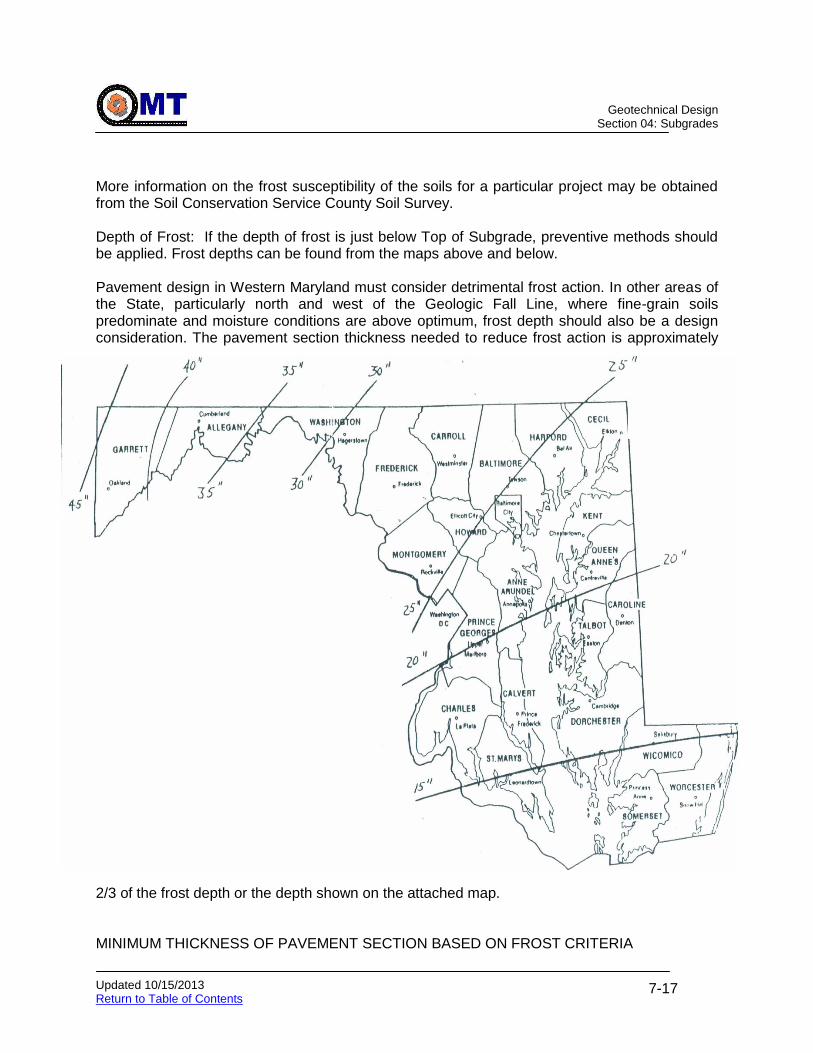
Geotechnical Design
Section 04: Subgrades
Updated 10/15/2013 Return to Table of Contents
7-17
More information on the frost susceptibility of the soils for a particular project may be obtained from the Soil Conservation Service County Soil Survey. Depth of Frost: If the depth of frost is just below Top of Subgrade, preventive methods should be applied. Frost depths can be found from the maps above and below. Pavement design in Western Maryland must consider detrimental frost action. In other areas of the State, particularly north and west of the Geologic Fall Line, where fine-grain soils predominate and moisture conditions are above optimum, frost depth should also be a design consideration. The pavement section thickness needed to reduce frost action is approximately
2/3 of the frost depth or the depth shown on the attached map. MINIMUM THICKNESS OF PAVEMENT SECTION BASED ON FROST CRITERIA
Geotechnical Design
Section 04: Subgrades
Updated 10/15/2013 Return to Table of Contents
7-18
The following are some preventive methods when encountering frost susceptible soils in a freezing climate:
Eliminate the effects of soil fines. Stabilizing with lime or cement will reduce the frost
susceptibility of soils.
Proper drainage will reduce frost penetration. Drainage should restrict the migration of water into the frost susceptible soil. The development of ice lenses is entirely dependent on the presence of water.
Undercutting the frost susceptible soils below the depth of frost and replacing with less frost susceptible soils will eliminate the heaving action of frost.
The use of a thicker pavement section (increasing the thickness of the stone base in place of hot mix asphalt) or the use of capping may also help prevent frost action.
7.04.04 Top of Subgrade
The Top of Subgrade, which generally can be defined as an imaginary line immediately below the bottom of the sub base, base or pavement, and is designated to establish where the top one foot compaction requirements and test rolling requirements apply. In most cases the Top of Subgrade and the Limit of Class 1 Excavation are the same. Cases where the Top of Subgrade and the Limit of Class 1 Excavation are not the same are described below.
When subgrade drainage blanket is introduced within the project limits. The Top of Subgrade in these situations should be at the bottom of sub-base layer (GAB) with Limit of Excavation being at the bottom of the subgrade drainage blanket.
When specifying Capping Borrow as part of the pavement section. The Top of Subgrade in these situations should be at the bottom of HMA base layer with Limit of Excavation being at the bottom of the 12” Capping Borrow layer.
Refer to Earthwork (Excavation) for further information on Top of Subgrade and Limit of Excavation.
7.04.05 Test/Proof Rolling Subgrade
Section 204 of the “Standard Specifications for Construction and Materials, July 2008” requires test/proof rolling of the subgrade after grading and compaction. Based on OMT experience, it is expected that a subgrade that passes test/proof rolling will have a resilient modulus of 4,500 psi. Fine grained soils with an N value of less than 4 blows per foot are likely to exhibit pumping when test/proof rolled. Localized soft spots identified by test/proof rolling and not accounted for during design will be stabilized and grades will be restored before pavement sub-base layers are placed resulting in an overrun of Class 1-A Excavation and backfill material.

Geotechnical Design
Section 04: Subgrades
Updated 10/15/2013 Return to Table of Contents
7-19
7.04.06 Subgrade Stabilization
Soils those are highly susceptible to volume and strength changes may cause severe roughness and accelerate the deterioration of the pavement structure in the form of increased cracking and decreased ride quality when combined with truck traffic. Generally, the stiffness (in terms of resilient modulus) of some soils is highly dependent on moisture and stress state. In some cases, the subgrade soil can be treated with various materials to improve the strength and stiffness characteristics of the soil. Stabilization of soils is usually performed for three reasons:
As a construction platform to dry very wet soils and facilitate compaction of the upper layers - for this case, the modified soil is usually not considered as a structural layer in the pavement design process.
To strengthen a weak soil and restrict the volume change potential of a highly plastic or compressible soil - for this case, the stabilized soil is usually given some structural value or credit in the pavement design process.
To reduce moisture susceptibility of fine grain soils.
A summary of the stabilization methods most commonly used in pavements, the types of soils for which they are most appropriate, and their intended effects on soil properties is presented in Table below:
Stabilization Method
Soil Type Improvement Remarks
Mechanical - More Gravel - Blending - Geosynthetics - Lightweight fill
Silts and Clays Moderately plastic Other Silts and Clays Very weak silts, clays, peats
None None Improve gradation Reduce plasticity Reduce breakage Strength gain through minimum disturbance and consolidation None Thermal barrier for frost protection
Reduce dynamic stress level Too difficult to mix Fast, plus provides long-term separation Fast, and reduces dynamic stress level
Admixture - Portland cement - Lime
Plastic Coarse Plastic
Drying strength gain Reduce plasticity Coarsen texture
Less pronounced hydration of cement Hydration of cement Rapid Rapid Rapid

Geotechnical Design
Section 04: Subgrades
Updated 10/15/2013 Return to Table of Contents
7-20
-Lime-flyash -Lime-cement- flyash -Bituminous - Pozzolanic and slags - Chemicals
Coarse with fines Nonplastic Same as lime Same as lime Coarse Some fines Fine Silts and coarse Plastic
Long-term pozzolanic cementing Same as plastic None Same as lime Same as lime Strengthen/bind Waterproof Same as coarse None Acts as a filler Cementing of grains Strength increase and volume stability
Rapid Slow Dependent on quantity of plastic fines No reactive material Covers broader range Covers broader range Asphalt cement or liquid asphalt Liquid asphalt Cant Mix Dense and strong Slower than cement See vendor literature Difficult to mix
Water proofers -Asphalt - Geomembranes
Plastic and Collapsible Plastic and collapsible
Reduce change in Moisture Reduce change in moisture
Long-term moisture migration Problem Long-term moisture migration problem
Courtesy: FHWA NHI-05-037 “Geotechnical Aspects of Pavements”
MDSHA prefers performing subgrade stabilization by design undercuts rather than altering soil properties by changing the gradation through mixing with other soils, densifying the soils compaction efforts. However, MDSHA will consider chemical stabilization as an alternative to undercutting in areas where excavation and hauling costs are high; where more than 50% of the project requires undercutting; or for Design-Build projects.
7.04.07 Mechanical Stabilization (Designed Undercuts)
A common remedial procedure for wet and soft subgrade soil is to partially remove and replace the wet subgrade with a granular material to a pre-determined depth. The compacted granular layer distributes the wheel loads over a wider area and serves as a working platform. The following are the typical designed undercut sections:
If low bearing material is encountered at subgrade level or soils with high moisture content are present at the subgrade level, the subgrade may fail under test/proof rolling. It is recommended to undercut up to 1 foot below the proposed excavation limits and

Geotechnical Design
Section 04: Subgrades
Updated 10/15/2013 Return to Table of Contents
7-21
backfill with GSSGAB (Geosynthetic Stabilized Subgrade Using Graded Aggregate Base), Select Borrow, Modified Borrow or any other suitable material as recommended by the Engineer during construction. Backfilling with GSSGAB, in most cases will eliminate the need further undercutting.
In some cases, it may be necessary to undercut more than 1 ft below the Limit of Excavation due to the presence of very low bearing material. In that case, undercutting to a depth of 2 ft should be considered followed by installation of Class ST or equivalent material at the bottom of the excavated area. This is followed by the placement, using the end dump method, of 12 inches of No. 3 stone or equivalent material. During placement of the 12 inches of No.3 stone, minimal disturbance should be made to the native soil; no compaction activity should be performed. Class SE or ST Geotextile should be placed, using the end dump method, on the top of the placed No. 3 stone followed by the placement of 12 inches of AASHTO No. 57 aggregate or Graded Aggregate Base (depending on the cost factor). During placement of the 12 inches of AASHTO No. 57 aggregate, a minimal disturbance should made to the underlying materials by using minimal compaction efforts with a static roller. If the sub-base material shows sign of fatigue or distress, terminate the compaction effort. Traffic movement on the top of the stabilized material should be minimized.
Undercut depths can be varied depending on the situations. Design of deeper undercuts mostly applies to localized soft spots and not for the total length of the project.
7.04.08 Chemical Stabilization
Geotechnical Engineers often come across soils which does not possess sufficient strength to support wheel loads imposed on them either in construction or during the service life of the pavement. It is, at times necessary to treat these soils to provide a stable subgrade or a working platform for the construction of the pavement. The results of these treatments are that less time and energy is required in the production, handling, and placement of road and subgrades and therefore, less time to complete the construction process. These treatments are generally classified into two processes, soil modification and soil stabilization. The purpose of subgrade modification is to create a working platform for construction equipment and increased strength is not taken into account in the pavement design process. The purpose of subgrade stabilization is to enhance the strength of the subgrade and this increased strength is taken into account in the pavement design process. Stabilization requires a more thorough design methodology during construction than soil modification. The methods of subgrade modification or stabilization include physical processes such as soil densification, blending with granular material, chemical processes such as mixing with cement, fly ash, lime and lime by-products, etc. Soil properties such as strength, compressibility, hydraulic conductivity, workability, swelling potential, and volume change tendencies may be altered by various soil modification or stabilization methods. Subgrade modification should be considered when a majority of soils with natural moisture content greater than their optimum moisture content are encountered on a project. When used, modification or stabilization should be required for the full roadbed width including shoulders or curbs. Subgrade stabilization should be considered for all subgrade soils with a Mr < 3,000 psi. (Ref.: INDOT Design Procedures for Soil Modification or Stabilization)

Geotechnical Design
Section 04: Subgrades
Updated 10/15/2013 Return to Table of Contents
7-22
Cement Modified Subgrade and Soil-Cement Base Course are two types of cement stabilization techniques available for the Engineer to consider. Lime or Lime By-Products and Fly Ash options are also available as part of chemical stabilization.
7.04.08.01 Cement Modified Subgrade (CMS) In situations where undercutting is not a viable option and the soils at subgrade level have high moisture contents and high volume change characteristics, leading to potential constructability issues, CMS may be a good option. Cement-modified soil is an unhardened or semi-hardened mixture of soil and cement. When relatively small (2-5% by dry weight of the soil) quantities of Portland Cement are added to granular soil or silt-clay soil, the chemical and physical properties of that soil are changed. Cement reduces the plasticity and water-holding capacity of the soil and increases its bearing value. The degree of improvement depends upon the quantity of the cement used and the type of soil. In cement-modified soil, only enough cement is used to change the physical properties of the soil to the degree desired. Cement-modified soils may be used for base courses, sub bases, treated subgrades, highway fills, and as trench backfill material. Step 1. Review boring logs and laboratory test data to determine the type and moisture
condition of soils at subgrade level. Step 2. If soils with excessive moisture contents well above optimum moisture, high
plasticity index, light weight soils (low density, < 100 pcf), and low N values are encountered, consider CMS to improve constructability by providing a stable working platform.
Step 3. Usually sandy soils with PI less than 30, and fine grained soils with PI less than 20
and LL less than 40 are considered for CMS. (InDOT uses CMS with soils having PI less than 5 and percent passing 200 sieve less than or equal to 35%)
Step 4. Ensure enough bag samples are requested and collected so that the unconfined compressive strength tests may be performed at different cement contents.
Step 5. For lab testing, suggest a cement quantity: 2% to 8%. Use Figure 39 of PCA Soil Cement Handbook for estimating the cement content.
Step 6. Once a cement content is selected, request lab tests be performed at plus/minus 2% contents.
Step 7. Request AASHTO T 134 proctors, (soil with cement) to obtain the corresponding
maximum dry density and optimum moisture content for each cement content. Step 8. Request specimens should be molded for compressive strength only. Two
specimens for each cement content selected, and cured for seven days in the moisture room before testing.
Step 9. % Cement vs: Unconfined compressive strength is plotted and design is based on
300 psi. If compressive strength of 300 psi is obtained for a certain cement content,
Geotechnical Design
Section 04: Subgrades
Updated 10/15/2013 Return to Table of Contents
7-23
then a value of 10,500 psi can be used for subgrade modulus in pavement design. If a value less than 300 psi is obtained, % cement content should be increased until the minimum compressive strength is achieved. However, beyond certain % of cement content (> 15%), it will not be a cost effective alternative to use CMS.
Step 10. If CMS is solely used to improve the physical properties of the subgrade soils, like
plasticity, no strength tests are required. However, what percentage of cement content is required to achieve desired physical properties is dependent on liquid, plastic and shrinkage limit tests.
7.04.08.02 Soil-Cement Compacted Soil-Cement, often referred to as simply Soil-Cement, is a mixture of pulverized soil and calculated amounts of Portland Cement and water that is compacted to a high density. The result is a rigid slab having moderate compressive strength and resistance to the disintegrating effects of wetting and drying and freezing and thawing. Usually Soil-Cement is referred to as Soil-Cement Base Course which is a part of pavement structure. Refer to Section 502 of “Standard Specifications for Construction and Materials, July 2008” for further information. Step 1. Review boring logs and laboratory test data to determine the type of soils available
on project site. Soils should meet Select borrow specifications.
Step 2. Request T-180 density. Step 3. Estimate cement content, PCA Soil Cement Handbook, Figure 39 Chapter 6, sandy
soils.
Step 4. Once a cement content is selected from charts go plus/minus 2% around chosen value.
Step 5. Request AASHTO T-134 proctors, (soil with cement) to obtain the corresponding maximum dry density and optimum moisture content for each cement content.
Step 6. Mold four specimens at the each selected cement content. Two compressive strength specimens, one wet/dry specimen and one freeze/thaw specimen. The samples are cured for seven days after molding in the moisture room prior to testing.
Step 7. Unconfined compressive strengths must obtain a minimum 450 psi.
Step 8. Wet/dry testing takes approximately 3 weeks; freeze/thaw testing takes between 6 – 8 weeks.
7.04.08.03 Lime Stabilized Subgrade Treatment (LSST) Lime may be used to treat soils to varying degrees, depending upon the objective. The least amount of treatment is used to dry and temporarily modify soils to facilitate construction. A greater degree of treatment - supported by testing, design, and proper construction techniques -produces permanent structural stabilization of soils.

Geotechnical Design
Section 04: Subgrades
Updated 10/15/2013 Return to Table of Contents
7-24
Step 1. Review boring logs and laboratory test data to determine the type and moisture
condition of soils at subgrade level. Step 2. In general, fine-grained clay soils (with a minimum of 25 percent passing the #200
sieve and a PI greater than 10) are considered to be good candidates for stabilization with Lime. Soils containing significant amounts of organic material (greater than about 1 percent) or sulfates (greater than 0.3 percent) may require additional lime and/or special construction procedures.
Step 3. Lime can permanently stabilize fine-grained soil employed as a subgrade or sub-
base to create a layer with structural value in the pavement system. The treated soils may be in-place (subgrade) or borrow materials. Subgrade stabilization usually involves in-place “road mixing,” and generally requires adding 3 to 8 percent lime by weight of the dry soil.
Step 4. Fine grained soils with PI more than 25 which exhibit significant swell. Lime will
reduce swell in these soils to greater or lesser degrees depending on the activity of the clay minerals present.
Step 5. Suggested Lime or Lime by Products in quantity: 3% to 8%. Step 6. For lime stabilization of clay (or highly plastic) soils, the lime content should be from
3 – 8% of the dry weight of the soil, and the cured mass should have an unconfined compressive strength of at least 0.34 MPa (50 psi) within 28 days. The optimum lime content should be determined with the use of unconfined compressive strength and the Atterberg limits tests on laboratory lime-soil mixtures molded at varying percentages of lime. (Source: Geotechnical Aspects of Pavements NHI - 132040).
Step 7. Resilient modulus (Mr) of lime stabilized soils can be estimated from unconfined compressive strength of the cured soil-lime samples performed in accordance with the MDTP (Little, 2000) can be estimated from 28-day qu test using the following formula: Mr = 0.124(qu) + 9.98 (ksi) (Thompson, 1966) where, Mr = resilient modulus, ksi, qu = unconfined compressive strength,
psi. (Thompson, M.R. (1966). “Shear Strength and Elastic Properties of Lime-Soil
Mixtures,” Transportation Research Record No. 139, Transportation Research Board, Washington, D.C.)
Little, D.L. (2000). Evaluation of Structural Properties of Lime Stabilized Soils and Aggregates, Mixture Design and Testing Protocol for Lime Stabilized Soils (Vol.
For other types of stabilization methods or techniques, refer to NHI Course No. 132040 – “Geotechnical Aspects of Pavements”
Geotechnical Design
Section 05: Retaining Walls
Updated 11/26/2013 Return to Table of Contents
7-25
7.05 RETAINING WALLS
Design of all Retaining Walls are performed by Office of Structures (OOS) using soil boring and lab testing information provided by OMT. The OOS is currently adopting LRFD methodology, which may require additional in-situ and lab testing. Future changes to our processes should be anticipated due to this change to LRFD. For more information on MSE Wall Design, refer to “FHWA SA-96-072, Mechanically Stabilized Earth Walls and Reinforced Soil Slopes Design and Construction Guidelines” and “AASHTOO Standard Specifications for Highway Bridges – Latest Edition”

Geotechnical Design
Section 06: Stormwater Management
Updated 11/26/2013 Return to Table of Contents
7-26
7.06 STORMWATER MANAGEMENT
7.06.01 General
Design of all Stormwater Management (SWM) BMP’s is performed by Highway Hydraulics Division (HHD). OMT’s PAGD Engineer serves as a liaison from OMT for the project and is not involved in the design process. OMT just performs the drilling of SWM borings and performs in-situ infiltration testing requested by the client (HHD) and provide the soils information and in-situ infiltration rates required for the SWM design. Reference information on SWM BMP types, design and procedure, refer to the following link: http://www.mde.maryland.gov/programs/Water/StormwaterManagementProgram/MarylandStormwaterDesignManual/Pages/Programs/WaterPrograms/SedimentandStormwater/stormwater_design/index.aspx
7.06.02 Purpose
Provide soils, water level reading and in-situ infiltration rateinformation to the HHD designer from soil boring operations and laboratory testing information.
Check the side slopes of the SWM facility or channel to make sure they abide with the slope angles mentioned in the pavement and geotechnical report.
Provide a pavement section for construction entrance if asked by the PM.
7.06.03 Resource Requirements
The request process is typically done with data available to the designer in the office coupled with soil boring information from the driller. The request procedure documented below requires the following staffing needs for a typical project:
Position Function Resources Effort Level (man-hours)
PAGD Engineer QC of boring data and boring data submittal
1 4*
* The time required would vary depending on the size and complexity of a project.
Procedure For SWM boring request need and submittal refer to the section on Stormwater Management Boring Request. For submission of soils information to the designer (HHD) from the boring results and laboratory test results, refer Processing Boring/Laboratory Data. Soil Stabilization Matting can be used as an erosion control measure on channels to or from the facility. Typically Type A, Type B and Type C matting’s are used based on the channel velocities. Type A (< 5 fps), Type B (5 fps to 8 fps), and Type C (> 8 fps). Sod is also considered in some cases. Type A is generally used for temporary slopes as it is degradable material and Types B and C for permanent slopes as they are non-degradable material.

Geotechnical Design
Section 07: Miscellaneous
Updated 11/26/2013 Return to Table of Contents
7-27
7.07 MISCELLANEOUS (UST, KARST, GEOTEXTILES, ETC.)
7.07.01 Underground Storage Tanks
7.07.01.01 General An Underground Storage Tank (UST) is a tank and any underground piping connected to the tank that has at least 10 percent of its combined volume underground. Most of the UST’s carry petroleum or other potentially hazardous substances. The greatest potential hazard from a leaking UST is that the petroleum or other hazardous substance can seep into the soil and contaminate groundwater. A leaking UST can present other health and environmental risks, including the potential for fire and explosion. UST’s within the project limits need to be assessed to identify potential contamination in the surface soil, subsurface soil, and groundwater.
7.07.01.02 Purpose Site assessment of the UST is needed to:
Identify potential contamination in the surface soil, subsurface soil, and groundwater, the source of drinking water for nearly half of all Americans
To identify a leak that can present health and environmental risk, including the potential for fire and explosion
To alert the Contractor of the presence of potential hazardous materials within the project limits
7.07.01.03 Resource Requirements An initial and final site assessment by EGD is required to identify the potential contaminants and hazardous materials. This procedure documented below requires the following staffing needs for a typical project:
Position Function Resources Effort Level (man-hours)
PAGD Engineer/EGD Representative
Records Review 2 8*
PAGD Engineer/EGD Representative
Site Visit 2 8*
PAGD Engineer/EGD Representative
Prepare Details/Report 2 4*
* The time required would vary depending on the size and complexity of a project.
7.07.01.04 Procedure The procedure described in the following text should be followed for identifying and preparing recommendation for UST. Follow the steps below to complete site assessment for UST’s: Step 1. Review proposed plans thoroughly and identify locations of UST’s.
Contact the PM if any information is available on potential locations of UST’s within the project limits.

Geotechnical Design
Section 07: Miscellaneous
Updated 11/26/2013 Return to Table of Contents
7-28
Step 2. Review previous engineering geology studies within and adjacent to the project.
Step 3. Request test borings, if necessary, to identify contaminated material. Step 4. Request site assessments (ISA, Phase I and Phase II). Step 5. Include a summary of the site assessment report in the FGR Step 6. Generally, the UST’s are removed and backfilled by their respective
owners such as a gas station etc. It is recommended to remove the backfill for UST’s within the project limits and re-backfill per MDSHA guidelines and note in the FGR.
Step 7. Establish an item for disposal of contaminated soils in the FGR. Step 8. Establish an item for graded aggregate base or other suitable material in
the FGR. Step 9. Establish an item for removal, backfilling, and compaction with Common
Borrow/Select Borrow of the UST area in the FGR. Step 10. Include Special Provision 200 – Contaminated Soils and Special
Provision 200 – UST Removal in the FGR. Refer to Construction and Material Specifications.
7.07.02 Construction Hazards
Construction hazards present a great danger on the ongoing construction projects, regardless of the size of the project. The top four causes of construction fatalities are: Falls, Struck-By, Caught-In/Between, and Electrocutions. Refer to United States Department of Labor – Occupational Safety and Health Administration: www.osha.gov for additional information/guidelines.
7.07.03 Karst
This section not yet developed.
Geotechnical Design
Section 07: Miscellaneous
Updated 11/26/2103 Return to Table of Contents
7-29
7.07.04 Geotextiles/Geosynthetics (Geotextile)
7.07.04.01 General
The prefix of geotextile, geo, means earth and the “textile” means fabric. Geotextile is a permeable geosynthetic comprised solely of textiles.
7.07.04.02 Purpose Geotextiles are used with foundation, soil, rock, earth, or any other geotechnical engineering-related material as an integral part of human-made project, structure, or system.
In general, there are four types of geotextile used for highway projects. They are for Subsurface Drainage (SD), Separation (SE), Stabilization (ST), and Permanent Erosion (PE):
Subsurface Drainage (SD), a geotextile against a soil to allow for long-term passage of water into a subsurface drain system retaining the in situ soil. The primary function of the geotextile in subsurface drainage applications is filtration. Geotextile filtration properties are a function of the in situ soil gradation, plasticity, and hydraulic conditions.
Separation (SE), a geotextile to prevent mixing of a subgrade soil and an aggregate cover material (sub-base, base, select embankment, etc.). This specification may also apply to situations other than beneath pavements where separation of two dissimilar materials is required, but where water seepage through the geotextile is not a critical function.
Stabilization (ST), a geotextile in wet, saturated conditions to provide the coincident functions of separation and filtration. In some installations, the geotextile can also provide the function of reinforcement. Stabilization is applicable to pavement structures constructed over soils with a California Bearing Ratio between one and three (1 < CBR > 3).
Permanent Erosion (PE), a geotextile between energy absorbing armor systems and in the in situ soil to prevent soil loss resulting in excessive scour and to prevent hydraulic uplift pressures causing instability of the permanent erosion control system.
7.07.04.03 Resource Requirements The various geotextiles are typically analyzed to determine which can be the most beneficial and practical for a specific project. This procedure documented below requires the following staffing needs for a typical project:
Position Function Resources Effort Level (man-hours)
PAGD Engineer Select/Prepare Details 1 8*
* The time required would vary depending on the size and complexity of a project. ** Additional site visit. If required.
7.07.04.04 Procedure The procedure described in the following text should be followed when selecting geotextiles for a specific project.

Geotechnical Design
Section 07: Miscellaneous
Updated 11/26/2103 Return to Table of Contents
7-30
Follow the steps below to select geotextiles:
Step 1. Complete steps in Surface and Subsurface Conditions.
Step 2. Discuss project with Team Leader and Engineering Geology Division (EGD) for the locations and type of geotextile/s required on the project based on the site conditions. Refer to Geotextile Properties. Refer to Reference Guidelines for additional reference information.
Step 3. Include the detail, location, and SP for the selected geotextile(s) as part of the FGR.
Step 4. Review the Final Review submittal to ensure inclusion of details, locations, and SP as per the FGR.
7.07.05 Compaction Charts (Family of Curves)
7.07.05.01 General This procedure provides for a rapid determination of the maximum density and optimum moisture content of a soil sample utilizing a family of curves and a one-point determination in accordance with AASHTO T 272. This procedure is related to AASHTO T 99, and AASHTO T 180. One-point determinations are made by compacting the soil in a mold of a given size with a specified rammer dropped from a specified height. Four alternate methods – A, B, C, and D – are used and correspond to the methods described in AASHTO T 99 or T 180. The method used in AASHTO T 272 must match the method used in AASHTO T 99 or T 180.
7.07.05.02 Purpose Families of Curves are needed to:
To provide the project inspector and laboratory personnel with a graphic guide of the maximum dry densities at the corresponding moisture contents which are expected to be encountered on a project.
To check the compaction for an embankment as a results of a one step proctor using material taken from in-place and compacting it to an in-place density test from the same location.
7.07.05.03 Resource Requirements This procedure documented below requires the following staffing needs for a typical project:
Position Function Resources Effort Level (man-hours)
Staff Engineer or Project Engineer Prepare Charts 1 16*
* The time required would vary depending on the size and complexity of a project.
7.07.05.04 Procedure The procedure described in the following text should be followed when preparing family of curves. The SATD should be contacted when developing the family of curves. Numerous steps contained in this procedure can be completed with software applications (Microsoft Excel) that the PAGD currently uses and has under development. The following procedure was written to provide the PAGD Engineer with adequate

Geotechnical Design
Section 07: Miscellaneous
Updated 11/26/2103 Return to Table of Contents
7-31
information to prepare family of curves without specific knowledge or access to computer software applications, but with the assumption that these tools were available. Step 1. All maximum dry densities and optimum moisture content should be
plotted, with the lab classification adjacent to each point. Refer to the spreadsheet “Family of Curves.xls” attached in the Appendix V.
Step 2. Through evaluation of the points previously plotted, a line representing
the mean average maximum dry density and optimum moisture is drawn. This line also represents one “Family of Curves”. If, through evaluation, it is evident that more than one “Family of Curves” occurs on your project, you will be required to draw additional mean average lines.
Step 3. Locate and plot a typical curve at the high end and low end of the mean
average lines. Also, locate and plot a typical curve at one or two points along the line where its maximum dry density and optimum moisture point falls on the line. Enough curves should be plotted in order to accurately determine the typical slope of the curves.
Step 4. Additional curves should be interpolated to fall within the typical curves at
intervals of 3 to 5 pounds. Step 5. If the moisture-density one point falls on one of the curves in the family of
curves, the maximum dry density and optimum moisture content defined by that curve should be used.
Step 6. If the moisture-density one point falls within the family of curves but not
on an existing curve, a new curve should be drawn through the plotted single point parallel and in character with the nearest existing curve in the family of curves. The maximum dry density and optimum moisture content as defined by the new curve should be used.
Step 7. If the family of curves is such that the new curve through a one point is
not well defined or is in any way questionable, a full moisture-density relationship should be made for the soil to correctly define the new curve and verify the applicability of the family of curves.
Step 8. All portions of the typical curves and interpolated curves which fall above
the average mean line (above optimum) should not be used during construction.
Step 9. An example of the interpolation of one step proctor and an explanatory
note should be shown on the chart, along with a note explaining the overall use of the Family of Curves. Refer to Forms, Spreadsheets & Guidelines for an example of Family of Curves and the aforementioned explanatory note.

Geotechnical Design
Section 08: Subsurface Drainage
Updated 11/26/2013 Return to Table of Contents
7-32
7.08 SUBSURFACE DRAINAGE Click to go to Pavement Drainage Click to go to New Pavement Design Using AASHTO 1993
Subsurface drainage is a critically important element to the performance of pavement structure and the roadway facility. Subsurface drainage is used to address existing sources of water and high moisture soil conditions that can deteriorate the structural strength of a pavement structure and lead to premature failures. This is not to be confused with pavement drainage which is intended to address water that enters the pavement structure through the surface. For guidelines on pavement drainage, see Section 5.04 Pavement Drainage. All geotechnical investigations should anticipate encountering groundwater and/or high moisture soil conditions in some form. An estimation of groundwater levels at the investigation site should be made prior to drilling. Estimates can be based on USGS Topographic maps, previous experience in the area or from reviewing publications by the http://www.mgs.md.gov/ or http://www.dnr.state.md.us/ and by consulting the EGD. If from these initial estimates and/or borings taken for the project, groundwater is expected to have an adverse effect on the construction or the life of the project, various groundwater control methods should be evaluated.
7.08.01 Purpose
Information on subsurface drainage tools is needed to address existing sources of groundwater and high moisture soil conditions that can deteriorate the structural strength of a roadway pavement, embankments, or structures leading to premature failures.
7.08.02 Resource Requirements
An analysis of subsurface groundwater and soil conditions is performed to determine which subsurface drainage tool(s) can be most beneficial and practical for the specific project. This procedure documented below requires the following staffing needs for a typical project:
Position Function Resources Effort Level (man-hours)
PAGD Engineer Records Review/Plot Borings Information
1 8*
PAGD Engineer Prepare Details 1 4*
* The time required would vary depending on the size and complexity of a project.
7.08.03 Procedure
The procedure described in the following text should be followed when selecting a subsurface drainage and groundwater control method. Numerous steps contained in this procedure can be completed with software applications that the PAGD currently uses or has under development. The following procedure was written to provide the design engineer with adequate information to select a method without specific knowledge or access to computer software applications, but with the assumption that these tools were available. Follow the steps below to analyze groundwater and soil conditions in order to select appropriate groundwater control and subsurface drainage method(s):

Geotechnical Design
Section 08: Subsurface Drainage
Updated 11/26/2013 Return to Table of Contents
7-33
Step 5. Review proposed plans thoroughly and make notes. Mark the location of
borings on the plans. Plot the borings on the roadway profile and/or cross sections. An alternate for this can be printing stick logs from gINT and pasting on respective cross sections.
Step 6. Plot groundwater level readings on the roadway profile and the cross sections
based on 0-hr and 24-hr readings from borings and the readings from Monitoring Wells, if any. Also, plot soil moisture conditions and soil moisture lab test results on the roadway profile and the cross sections.
Step 7. Discuss the project with the EGD for groundwater table, its seasonal variation, the location of perched water table, the location of aquifers, and the presence of artesian conditions.
Step 8. A site visit may be required to further evaluate existing drainage issues (wet ditches, slope seepage) and verify wetland impacts on proposed infrastructure improvements.
Step 9. If groundwater and/or soil with high moisture conditions are anticipated to
impact the vertical and horizontal alignment the PM should be notified immediately.
Step 10. Discuss different drainage tools/methods mentioned below with the PAGD TL
and EGD to select one or more methods appropriate for the project. Step 11. Once a method(s) has been selected, calculate the approximate quantity
required for the selected method/s. Include the detail, location, and offset for the above methods as part of the Final Pavement and Geotechnical Report (FPGR).
Step 12. Review the Final Review plans. The Final Review plans should show the
detail, location, and offset of the methods included in the FPGR. The drainage tools listed below are used to address groundwater, high moisture content soil conditions, and/or drainage issues based on the existing conditions encountered for a specific project:
1. Underdrain and Trench Drain 2. Drainage Blanket and Slope Drainage Blanket 3. Subgrade Drain 4. Spring Control 5. Other Alternatives to Subsurface Drainage
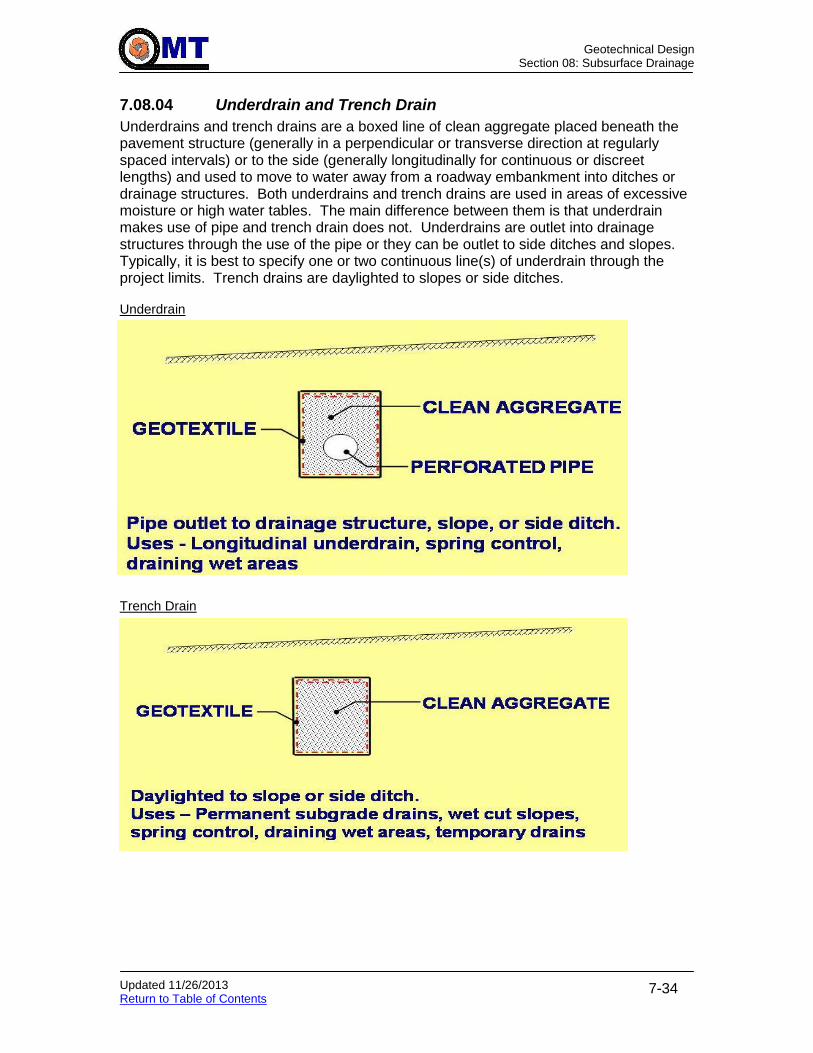
Geotechnical Design
Section 08: Subsurface Drainage
Updated 11/26/2013 Return to Table of Contents
7-34
7.08.04 Underdrain and Trench Drain
Underdrains and trench drains are a boxed line of clean aggregate placed beneath the pavement structure (generally in a perpendicular or transverse direction at regularly spaced intervals) or to the side (generally longitudinally for continuous or discreet lengths) and used to move to water away from a roadway embankment into ditches or drainage structures. Both underdrains and trench drains are used in areas of excessive moisture or high water tables. The main difference between them is that underdrain makes use of pipe and trench drain does not. Underdrains are outlet into drainage structures through the use of the pipe or they can be outlet to side ditches and slopes. Typically, it is best to specify one or two continuous line(s) of underdrain through the project limits. Trench drains are daylighted to slopes or side ditches. Underdrain
Trench Drain

Geotechnical Design
Section 08: Subsurface Drainage
Updated 11/26/2013 Return to Table of Contents
7-35
7.08.05 Drainage Blanket and Slope Drainage Blanket
A drainage blanket is a layer of Select Borrow, Capping Borrow, or well draining aggregate in areas of high water tables or in areas of wet soil conditions. A minimum of a 6” to 12” layer is recommended. The final thickness of the layer is dependent on the specific site and material conditions. The drainage blanket may be combined with a geotextile in sandy or silty soil conditions. The drainage layer is day-lighted to the edge of the slope or to the back face of curb. It is recommended to use a drainage layer as the first layer in embankment construction in wetland areas, wetland buffer areas and/or in anticipated low points that could become wet or saturated. A drainage layer is also recommended to intercept groundwater seepage through the face of anticipated wet slopes and in side-hill fills. When a drainage layer is used in slope applications, it is referred to as a Slope Drainage Blanket. Note: The use of Capping Borrow beneath pavement sections may not drain as well as expected. Drainage Blanket Example – Capping Layer Slope Drainage Blanket Example – Cut Slope

Geotechnical Design
Section 08: Subsurface Drainage
Updated 11/26/2013 Return to Table of Contents
7-36
Drainage Blanket Example 1 - First Layer in Wetlands Specified by Depth (Profile) Drainage Blanket Example 1 – First Layer in Wetlands Specified by Depth (Cross Section) Drainage Blanket Example 2 – First Layer in Wetlands Specified by Elevation (Profile)

Geotechnical Design
Section 08: Subsurface Drainage
Updated 11/26/2013 Return to Table of Contents
7-37
Drainage Blanket Example 2 – First Layer in Wetlands Specified by Elevation (Cross Section) Slope Drainage Blanket Example – Side Hill Fill Drainage Blanket Example – Wet Soil or Wet Cut Areas

Geotechnical Design
Section 08: Subsurface Drainage
Updated 11/26/2013 Return to Table of Contents
7-38
7.08.06 Subgrade Drain
Subgrade drains are trenches excavated through the shoulder and roadside grading from the edges of the pavement to a side ditch, embankment slope, or drainage outlet that are backfilled with #57 aggregate. The excavation and placement of the subgrade drain is at least 2” below the Top of Subgrade. The subgrade drain is placed perpendicular across the roadway at low points. It is construction expedient because it can be done during pavement aggregate base placement. It is adequate to use when anticipated moisture is not serious. Subgrade drains should be specified through limits where rock exists at subgrade. Subgrade drains are often used in replacement of longitudinal underdrains in areas when rock is encountered near Top of Subgrade. This is to save in the expense of rock excavation for the trench for longitudinal underdrain. MDSHA standards 387.51 and 387.61 provide additional details for subgrade drains.
7.08.07 Spring Control
Spring control is used to manage springs and control their impact on the roadway facility. Spring control is done with the use of underdrains backfilled with #57 stone is areas with springs and ground water. It is recommended to ensure there is adequate quantity of underdrain for spring control in construction projects to handle site conditions when springs were identified as part of the soil survey.
7.08.08 Other Alternatives to Subsurface Drainage
In some cases high water tables will exist in poor soil areas or in areas of rock at subgrade and the potential for subsurface drainage techniques will be limited. Beyond the various techniques listed in the list section, there are a few other alternatives to subsurface drainage. One alternative is to recommend raising the grade of the roadway to move it away from the water and challenging soil conditions. This strategy is typically suggested early in the planning or design process at the time of the Advance Geotechnical Report. Cost impact analysis will dictate the final approach when the expense to build the roadway at a higher elevation is compared to the expenses to build in wet and poor soil conditions. Another alternative to subsurface drainage is to account for the poor subgrade and wet conditions in the design of the pavement structure. Additional thickness or alternative materials can be designed into the pavement section to account for a wet or saturated base and subgrade. Special provisions and construction operations can be written to account for the conditions as well. However, the construction costs for this type of conditions will be significantly higher than working in better conditions.
Deliverables and Report
Section 01: Preliminary Pavement Recommendation
Updated 11/07/2013 Return to Table of Contents
8-1
8 DELIVERABLES AND REPORT Click to go to Discussion/Selection Alternative with Project Owner
This section is designed to explain the deliverables and report that a PAGD Engineer needs to produce when a new project is received from a customer (Office of Highway Development/Office of Structures/Districts, etc.). Several of these procedures may be performed concurrently. Although most of the procedures have a step-by-step outline to follow, the individual PAGD Engineer should coordinate with PAGD Team Leader (TL) at all stages of the design phase of the project to implement the most effective and appropriate procedures.
8.01 PRELIMINARY PAVEMENT RECOMMENDATION
8.01.01 Purpose
Preliminary pavement recommendations are developed to:
Provide a preliminary material and construction cost estimate to customers for planning purposes, based on network level data.
8.01.02 Resource Requirements
The preliminary pavement recommendation process is typically done with data available to the pavement designer in the office coupled with a site visit. Typically, FWD and core results are not available at the time a preliminary pavement recommendation is developed. The pavement design in a preliminary pavement recommendation is based on available network level data and standard design inputs and policies provided in this guide. The preliminary pavement recommendation procedure documented below requires the following staffing needs for a typical job:
Position Function Resources Effort Level (man-hours)
Staff Engineer or Project Engineer Project Communication 1 2
Staff Engineer or Project Engineer Pavement Design 1 2
Staff Engineer or Project Engineer Memo Development 1 8
* The time required would vary depending on the size, complexity and location of the project.
8.01.03 Procedure
The procedure presented in the following text should be followed in a preliminary pavement recommendation.
8.01.03.01 Preliminary Steps
Step 1. Enter the project and pertinent project information into the DesignProjects database so the project can be tracked. Also, create a folder on the network server under the ‘Projects’ folder under the appropriate District and county. Refer to Electronic File Storage.
Step 2. Conduct the steps as detailed in Preliminary Procedures.
Step 3. Conduct the steps as detailed in New Pavement Design and Pavement Preservation & Rehabilitation Design as appropriate. For steps involving Pavement Mechanistic-Empirical Analysis, use defaults and information collected in Step 2 only.

Deliverables and Report
Section 01: Preliminary Pavement Recommendation
Updated 11/07/2013 Return to Table of Contents
8-2
Step 4. Relay the preliminary design information to the person that requested the recommendation in the appropriate form based on the type of request. This response could be in the form of an e-mail, formal or informal memorandum, and phone conversation. Refer to Example Memos. Documentation shall be placed in the project file folder regarding the recommendation that was provided.

Preliminary Procedures
Section 02: Advanced Geotechnical Report
Updated 10/15/2013 Return to Table of Contents
8-3
8.02 ADVANCED GEOTECHNICAL REPORT
8.02.01 Purpose
On some projects an advanced geotechnical report or preliminary soils report is submitted prior to or after the completion of the subsurface exploration. Its usual purpose is to provide, prior to preparation of the final report, information to the customer, who would use it in conjunction with their own work to expedite the progress of the project. An example would be slopes for Right-of-Way Plats. A review is usually held with the PAGD ADC-Design to finalize the preparation of this report.
8.02.02 Resource Requirements
The advanced geotechnical report process is typically done with data available to the design engineer in the office coupled with a site visit. The design is based on available network level data and standard design inputs and policies provided in this guide. The procedure documented below requires the following staffing needs for a typical job:
Position Function Resources Effort Level (man-hours)
PAGD Engineer Records Review 1 2*
PAGD Engineer Review/Plot Boring Data 1 4*
PAGD Engineer Prepare and Submit Report
1 4*
PAGD TL and PAGD ADC-Design Review Report 1 2*
* The time required would vary depending on the size, complexity and location of the project.
8.02.03 Procedure
The following aspects of design should be included in the advance report when subsurface explorations are not yet competed:
Slope angles – Recommend 2(H):1(V) or flatter unless erodible soils or slope stability issues are anticipated, in which case even flatter slopes may be needed.
Typical soils to be encountered based on soil survey maps and information from adjacent projects.
Presence of any shallow groundwater tables based on information from soil survey maps
Presence of rock at the site based on information from adjacent projects or observation of outcrops.
Any other information which might affect the construction
The following should be addressed (as applicable) in the advance report when subsurface explorations have been competed (Lab testing does not necessarily need to be complete to provide this information):
Line and grade approval
Fill and cut slope angles - Specify 2:1 or flatter unless erodible soils or slope stability issues are anticipated. Need for benching for high embankments (>20 ft).
Typical soils within project limits

Preliminary Procedures
Section 02: Advanced Geotechnical Report
Updated 10/15/2013 Return to Table of Contents
8-4
Estimate of Class 1-A Excavation and material required for backfilling Class 1-A Excavation (If unsuitable soils are present at subgrade level). Refer to Class 1-A Excavation and Backfill.
Information on groundwater levels and their effects on proposed construction
Use of geotextile for use in underdrain trenches
Soil moisture conditions of material excavated for storm drain pipe trenches
Presence of rock and the need for blasting
Presence of contaminated material and need for further assessments
Settlement issues anticipated for high embankments due to the presence of compressible soils.
Need for geotechnical instrumentation to monitor the short and long term stability of various earth fill or structures.
See Example Memos for examples of Advanced Geotechnical Reports.

Deliverables and Report
Section 03: Final Pavement & Geotechnical Report
Updated 06/13/2013 Return to Table of Contents
8-5
8.03 FINAL PAVEMENT & GEOTECHNICAL REPORT Click to go to New Pavement Design Click to go to Management Review & QA
8.03.01 Final Pavement & Geotechnical Reports
8.03.01.01 Conventionally Advertised Project
Most of the projects advertised by MDSHA are Conventionally Advertised Projects and have different stages including planning, design, and construction. Planning, design, and establishing the Contract Documents are performed by MDSHA.
The Final Pavement & Geotechnical Report (FPGR) includes the final pavement and geotechnical recommendations from PAGD. The PAGD Engineer will develop the FPGR to be reviewed by the PAGD TL, ADC-Design, and DC.
Certain steps in preparing the FPGR and other procedures might overlap. It is important to keep in mind that although these procedures are broken out and written into separate sections, they are part of an overall process to provide technically and practically sound recommendations.
Refer to Example Memos for boilerplate, cover letter, and examples of the FPGR for Conventionally Advertised Projects.
8.03.01.02 Design-Build Project – TC Section 3.10.06
Project data and design inputs will be provided by PAGD as part of the Pavement Performance Specification, specifically at the end of TC Section 3.10. TC Section 3.10.06 is prepared by PAGD and submitted along with the Pavement and Geotechnical Performance specifications to the project manager. These will be included in the Contract Documents. The Design-Build team bids on lump sum basis on the Contract. Once the Contract is awarded, the Design-Builder submits pavement and geotechnical designs to PAGD using the project data and design inputs included in the Contact Documents. The Design-Builder is responsible for performing supplemental field and lab work necessary for the final design.
Refer to Example Memos for Design-Build Project templates.

Deliverables and Report
Section 04: Topsoil Memo
Updated 11/26/2013 Return to Table of Contents
8-6
8.04 TOPSOIL MEMO
Laboratory test results for topsoil and root mat are noted in the Topsoil Memo to provide the PM with the information regarding these materials and to complement the Topography Tabulation which is used for quantity estimates. This information is also used by the Landscape Operations Division in developing the Nutrient Management Plan for a project.
The summary of topsoil results should be tabulated and a memo is developed and submitted to Landscape Operations Division with a copy to the PM.
Note that the particle size distribution reports should not be attached with the Topsoil Memo.
Refer to Example Memos for an example of a Topsoil Memo.

Deliverables and Report
Section 05: Plans, IFB, and Estimate Comments
Updated 12/06/2012 Return to Table of Contents
8-7
8.05 PLANS, IFB, AND ESTIMATE COMMENTS
8.05.01 Purpose
The Final Review process is a critical step in the design process to ensure the design effort is documented properly and to ensure designs from other divisions are incorporated accurately into the final advertised package. A Final Review process ensures the accuracy and the correctness of the contract documents for a project prior to that project being advertised for bids. The review verifies that the designs, plans, specifications, bid quantities, and estimates are accurate and the most recent. In addition, it is an opportunity to verify that designs from different design groups are brought together in an accurate MDSHA project design. For the Pavement and Geotechnical Division to prepare for Final Review, one must conduct a review or verify the following:
Verify the accuracy of plans and specifications
Ensure proposed pavement recommendations can be physically constructed within the constraints of the project
Verify quantities provided in pavement recommendation are accurately included into the advertised documents
Verify the pavement recommendations provided are presented accurately in the advertised documents
Reduce the number Addendum and Extra Work Orders
8.05.02 Resource Requirements
The Final Review procedure documented below requires the following staffing needs for a typical job:
Position Function Resources Effort Level (man-hours)
Staff Engineer or Project Engineer Verify Recommendations 1 1*
Staff Engineer or Project Engineer Review Plans 1 3*
Staff Engineer or Project Engineer Internal Constructability Review 1 1*
Staff Engineer or Project Engineer Review Specifications 1 1*
Staff Engineer or Project Engineer Review Estimate and Quantities 1 2*
* The time required would vary depending on the size and complexity of a project.
8.05.03 Procedure
The procedure presented in the attached flowchart and described in the following text should be followed for a typical final review of a project. Several steps in the Final Review process may be done out of sequence. It is important that all the steps are completed and not necessarily followed in the order in which they are presented in this section. The Final Review process begins when OMT receives the notice for the Final Review meeting and the final review package. The contract document package could include plans and specifications or in the case of a “proposal” only advertisement, details should be included in the specifications. On projects involving the Engineering Geology Division, their Division should conduct their own review of the contract documents concentrating on Geotechnical issues. There will be some overlap between the PAGD and EGD review, but it is important to concentrate on our own area of responsibility and be aware of other’s areas. All divisions at OMT should work as a team to ensure that all area’s OMT is responsible for are done accurately and are sound designs. The review should begin with the plans first and then the specifications.

Deliverables and Report
Section 05: Plans, IFB, and Estimate Comments
Updated 12/06/2012 Return to Table of Contents
8-8
Step 1. Verify that EGD has received the final contract document package. Discuss with the EGD contact the areas each division would review and attendance at the Final Review meeting.
Step 2. Verify the existing conditions of the roadway have not significantly changed since the pavement recommendations were developed. These changes include, but are not limited to the following: project scope, alignment, distress conditions, traffic levels, other geometric improvements. This step is critical for review of “shelf” projects and projects done by others.
Step 3. Verify pavement recommendations used to develop final review package meet our current MDSHA Pavement and Geotechnical Division design standards and policies. This step is critical for review of “shelf” projects and projects done by others.
Step 4. Verify the materials used in the project follow MDSHA Pavement and Geotechnical Division current material policies. This step is critical for review of “shelf” projects and projects done by others.
Step 5. Review the Title sheet of plans to ensure that the traffic data provided is correct and matches the data used in the pavement design. Verify the Soil Legend provided on the Title sheet is accurate. Verify the correct contract number and job description are shown.
Step 6. Review the typical section sheets of the plans. Each of the following items shall be reviewed for accuracy and correctness in the typical section sheets: o Base-widening locations and dimensions shown. o Width of widening shown accurately. o Reconstruction limits and dimensions shown. o Pavement details shown or referred to on typical sections. o Correct typical sections shown within specific station limits. o Curb and gutter shown in correct location. o Varying roadway or widening widths shown as separate typical sections. o Longitudinal underdrain (LUD) shown correctly. o Guardrail placements interfere with LUD.
Step 7. Review the pavement details sheets of the plans. Each of the following items shall be reviewed for accuracy and correctness in the pavement details sheets: o Pavement details match our recommendations. o Correct nomenclature and category code numbers. o Legend items refer to proper material in detail. o Notes for details are correct.
Step 8. Review the plan sheets of the plans. Each of the following items shall be reviewed for accuracy and correctness in the plan sheets: o Preservation/Rehabilitation strategy shown correctly with shading/legend
of plan sheets. o Ensure Construction Notes are shown on plans. Construction Notes
should be included for LUD and Outlets, existing LUD and any other items as noted in the PAGD report.
Deliverables and Report
Section 05: Plans, IFB, and Estimate Comments
Updated 12/06/2012 Return to Table of Contents
8-9
o Identify possible conflicts with utility or hydraulic construction that may have been added since our recommendations were provided.
o Drain pipes in roadway, wheel path. Construction parallel to roadway or crossing roadway in transverse direction. Excavation needs and dimension. Reconstruction needs or utility patch. Utility patch details provided.
o Bridges – end walls/wingwalls. Pavement replacement detail. o Guardrail or other structure placement interferes with pavement section or
construction. o Identify between existing, new, and relocated utility lines/drains. o Project scope changes or limit adjustments. Additional roadway area
inclusion after recommendations provided.
Step 9. Review the profile sheets of the plans. Each of the following items shall be reviewed for accuracy and correctness in the profile sheets: o Centerline roadway elevation changes – increase or decrease. Verify
structural capacity needs. o Identify low areas or sump areas for longitudinal underdrain need areas. o Pavement/soil borings shown with results of field and laboratory testing.
Step 10. Review the cross section sheets of plans. Each of the following items shall be reviewed for accuracy and correctness in the cross section sheets: o Base-widening locations and dimensions shown. o Width of widening shown accurately. o Reconstruction limits and dimensions shown. o Full-width roadway elevation changes – increase or decrease. Check at
mainline/shoulder edge for reduction in pavement thickness. o Cross slope improvements – removal of material to correct cross slope.
Verify structural capacity needs. Reconstruction may be needed for reduction requirements.
o Identify fill/cut areas. Identify grading slopes beyond roadway. Verify Class 1A needs based on fill/cut areas.
Step 11. Review the grading chart of the plans, applicable in any new construction or widening projects. Each of the following items shall be reviewed for accuracy and correctness in the grading chart: o Ensure quantities from cross sections are transposed correctly. o Verify that Shrinkage/Swell and Densification factors, Class 1-A quantities
and material to backfill Class 1-A are included as per PAGD report. o Verify calculation of quantities is correct.
Step 12. Review the Maintenance of Traffic (MOT) sheets of the plans. Each of the following items shall be reviewed for accuracy and correctness in the MOT sheets: o Verify duration of MOT pavement sections. o Verify use of traffic bearing pavement sections exist during all phases of
MOT. o Ensure construction sequence does not conflict with the use of traffic
bearing pavement sections.

Deliverables and Report
Section 05: Plans, IFB, and Estimate Comments
Updated 12/06/2012 Return to Table of Contents
8-10
o MOT pavement sections to be used after construction project complete. o MOT pavement sections able to be constructed.
Step 13. Review the landscaping sheets of the plans. Each of the following items shall be reviewed for accuracy and correctness in the landscaping sheets: o Verify any cross walk is traffic bearing and at minimum has the same
service life of the pavement rehabilitation. Use of mortar or bedding sand for paver blocks.
o Verify if any specifications related to stamped asphalt or decorative PCC are required.
o Verify that any unique landscaping, curbs, or other visual enhancements do not adversely affect pavement performance.
Step 14. Review the hydraulic sheets of the plans. Each of the following items shall be reviewed for accuracy and correctness in the hydraulic sheets: o Ensure storm water management facilities do not adversely affect
structural capacity of the pavement section, either from change of water flow or movement.
o Ensure that ditches and other SWM facility inverts are below Top of Subgrade so as not to impact the pavement section.
Step 15. Review project for construction issues. The construction review shall be used to verify pavement sections can be constructed given the existing conditions, geometry, MOT phasing, and materials. Every unique aspect of each construction project cannot be documented into one procedure. However, several key construction items are consistent among the majority of the projects. The following construction items can help ease of construction: o Depth of pavement sections compared to adjacent existing or new
pavement sections. Eliminate “bathtub” conditions. Be consistent with the thickness and material type with adjacent pavement sections.
o Utility patch and limit of utility work in roadway. Amount of excavation needed for placement and effect on roadway.
o Sequence of construction relative to placement of different pavement sections. For example, ramps, mainlines, and intersecting roadways.
o Sequence of construction relative to MOT and structural capacity of pavement sections. For example, shoulders and turn lanes used for mainline traffic. Also, grinding, patching, and widening operations relative to functional and structural capacity.
o Width of paving less than 4’. Areas less than 4’ in width develop compaction issues with HMA material.
o Location and placement of longitudinal underdrain. o Percentage of reconstruction and resurfacing on a project with respect to
the final ride quality and the structural integrity of the project. o Joint layout and steel design and construction of rigid pavements.
Step 16. Review the specifications. Each of the following items shall be reviewed for accuracy and correctness in the specifications: o Ensure specifications provided by the Pavement & Geotechnical Division
are included and unedited.

Deliverables and Report
Section 05: Plans, IFB, and Estimate Comments
Updated 12/06/2012 Return to Table of Contents
8-11
o Verify specifications in the 200, 500 and 900 sections have the most recent and accurate information and revisions dates.
o Verify correct nomenclature used in “other” special provisions provided other divisions.
o If no plans will be used for advertised package, follow steps 2 through 4 above with the details provided in the specifications.
Step 17. Review bid estimate and quantities. Communication with the project owners is needed in this step to ensure the same correct area values are used to develop quantities. Each of the following items shall be reviewed for accuracy and correctness in the bid estimate and quantities: o Verify all quantities needed for pavement rehabilitation are identified and
presented accurately. o Verify actual quantity provided for each item in recommendation is
presented accurately. For example patching, Class 1A, removal/replacement of unsuitable material, and longitudinal underdrain and outlets.
o Verify nomenclature of material types is correct and consistent with plans and specifications.
o Verify unit costs for paving items are reasonable and accurate. o Verify actual quantity calculated by project owner provided for each item
in the recommendation is presented accurately. For example HMA tonnage or area, grinding, joint tape, etc.
Step 18. Provide oral comments from the design team (PAGD and EGD) review at the Final Review meeting. If attendance at meeting is not possible, provide written comments from the design team to the project owner. If comments are significant or project is large and complex, attendance at meeting and written comments are recommended. Comments can be provided via e-mail or memorandum depending on significance of project. Place written comments into project file folder.

Deliverables and Report
Section 06: Other Reports
Updated 01/03/2014 Return to Table of Contents
8-12
8.06 OTHER REPORTS
8.06.01 Other Geotechnical Reports
8.06.01.01 Routine Geotechnical Supplemental Reports
Supplemental geotechnical reports may be required for projects in cases where some geotechnical-related issues were not addressed initially in the FGR. This usually happens when the scope of the project is altered at later design stages due to the introduction of some new elements which need design, any issues arising during the construction (ex. subgrade undercutting, unstable embankment foundations, ground-water issues, materials selection, change orders, etc).
Refer to Example Memos for an example of Routine Geotechnical Supplemental Report.
8.06.01.02 Non-Routine Geotechnical Reports Non-routine geotechnical reports are often required apart from routine pavement and geotechnical reports for major projects (large scale intersection improvements, new bridges, embankments over highly compressible soils, etc.). These reports enable the PM to select the most cost-effective alternatives for various design elements. These types of reports are developed by EGD or with the EGD’s assistance. Some examples of areas covered in the report include, but are not limited to, Mechanically Stabilized Earth (MSE) wall feasibility, settlement analysis for bridge approach embankments, evaluating types of deep foundations for embankments on highly compressible soils, slope stability analysis and slope failure remedial measures, recommendations on geotechnical instrumentation, sinkhole treatments, pavement subsidence, etc.
8.06.02 Design-Build Projects
Design-Build (DB) projects are different from traditional design-bid-build projects, in that for PAGD pavement sections are provided in addition to the input and design criteria used to develop those pavement sections, in case the DB team wishes to design and construct alternative pavement sections. At a minimum for DB projects, PAGD provides a cover page memo, TC Section 3.10.06 (which is the pavement performance spec, and is not to be altered), TC Section 3.10.06 (an add-on that is to be altered), and TC Section 3.14 (the geotechnical performance spec, not to be altered). Refer to Example Memos for these templates.
8.06.03 Access Management Permit Project Reviews
The MDSHA is authorized under Maryland law to control access along the State highways in order to provide and maintain a safe and properly functioning highway system. Control of access is accomplished through a number of statutory and regulatory mechanisms, including the acquisition of certain real property rights and the permit process. A permit must be obtained from SHA prior to any construction activity within the State’s right-of-way (ROW), including but not limited to the construction of driveways, entrances, and street connections for site development and subdivision access.

Deliverables and Report
Section 06: Other Reports
Updated 01/03/2014 Return to Table of Contents
8-13
MDSHA’s Access Management Division (AMD) administers regulations pertaining to commercial and subdivision access to State highways and issues permits for the construction of approved entrances, street connections, and highway capacity improvements. The regulation and permitting of certain residential driveway access, utility work, and other construction activity is handled by MDSHA’s seven District Offices. In any case, the design and construction of all improvements on State property must adhere to the State’s standards, specifications, and accepted highway engineering practices. This is ensured through a comprehensive plan review and inspection process. During plan review, proposed access is carefully evaluated with respect to highway safety, traffic conditions, and functional requirements. Only properly designed access points that are necessary for the approved site use and consistent with the functional requirements of the highway may be permitted. To ensure appropriate control of vehicular movements and to provide the means to handle site-generated traffic, SHA may require the construction of frontage channelization, turning lanes, and other highway improvements as a condition of the access permit. During the design process, the Developer submits copies of plans, which may include a Pavement and Geotechnical Report (depending on the scope of the project), to AMD. AMD then provides this submittal to the Chief of OMT’s Material Management Division who then coordinates reviews with PAGD and EGD. The submittal should be reviewed and evaluated by the PAGD Engineer for conformance with MDSHA Design Standards. For more information on Design Requirements for AMD projects, refer to the document “Maryland State Highway Administration - Engineering Access Permits - Office of Materials Technology - Geotechnical Report and Design Requirements” on OMT’s intranet web page.
8.06.04 County Reviews
Some projects or portions of the project are designed based on County Design Standards based on the functionality or the interest of the owner. If a project is designed based on County Design Standards, the PAGD Engineer should review and evaluate the design recommendations for conformance with the applicable County Design Standards.
Deliverables and Report
Section 07: Construction and Material Specifications
Updated 10/01/2013 Return to Table of Contents
8-14
8.07 CONSTRUCTION AND MATERIAL SPECIFICATIONS Click to go to New Pavement Design
8.07.01 General
A pavement designer in the Pavement and Geotechnical Division of OMT must be familiar with construction operations and the specifications required by MDSHA on the contractor performing the work. The most beneficial and economical pavement recommendation is useless if it cannot be constructed or built with the existing construction or material specifications. Therefore, the pavement engineer must be intimately familiar with existing materials and construction specifications, and possess the ability to develop new specifications. MDSHA currently has two documents that dictate the specifications and standards by which all projects shall be constructed: “Standard Specification for Construction and Materials” and “Book of Standards.” Obviously, other specification documents are occasionally required for construction, but the initial reference and binding documentation are the two books previously mentioned. The “Standard Specification for Construction and Materials” controls material and construction specifications. The “Specification” book is broken out into a “Terms and Conditions” (TC) section and a Technical Requirements section. The TC section establishes the scope of work, definitions of terms, legal relations, restrictions and permits, and payment practices. The Technical Requirements section is broken out into the following category items:
Category 100 – Preliminary
Category 200 – Grading
Category 300 – Drainage
Category 400 – Structures
Category 500 – Paving
Category 600 – Shoulders
Category 700 – Landscaping
Category 800 – Traffic
Category 900 – Materials The “Book of Standards” controls typical details and dimensions of items. The “Book of Standards” is broken out into the same category section as the Technical Requirements section of the “Specification” book. Category 200, 500 and 900 shall be of particular interest to the pavement designer in the Pavement and Geotechnical Division of the OMT. Typically, MDSHA provides contractors desiring to bid on a construction project a proposal book and plans as part of the invitation for bid package. The plans provide a plan view of the project, typical sections, and specific details of construction. The proposal book provides additions to the “Standard Specification for Construction and Materials” and specific specification unique to the project. Special Provisions Inserts (SPIs) are specifications that are revisions or addenda to the current “Standard Specification for Construction and Materials” book. An SPI is a general specification that is applicable to all construction projects. A Special Provision (SP) is also a specification that is a revision or an addendum to the current “Standard Specification for Construction
Deliverables and Report
Section 07: Construction and Material Specifications
Updated 10/01/2013 Return to Table of Contents
8-15
and Materials” book. However, a SP is specific to a particular project and is not applicable to all construction projects. When a particular item or subject is not covered by the plans or proposal book, then the “Standard Specification for Construction and Materials” and the “Book of Standards” are the controlling articles of documentation. The following is the hierarchy for all construction and material specification / standard documentation, with the most controlling at the top:
Redline Revision
Addendum
Special Provisions (SP)
Plans
Special Provision Inserts (SPI)
Book of Standards & Specification Book The Specification Team of OMT provides regular updates of all current SPIs and potential SPs to all pavement designers.
8.07.02 Resource Requirements
This procedure documented below requires the following staffing needs for a typical project:
Position Function Resources Effort Level (man-hours)
PAGD Engineer Prepare and Review 1 4*
* The time required would vary depending on the size and complexity of a project.
8.07.03 Procedure
The literature below presents circumstances where Special Provision’s (SP’s) may be called. All project-specific Specifications should be used at PAGD Engineer’s discretion and the approval of PAGD TL/ADC-Design/DC. For example specs, refer to Specifications\Ready for Use\Example Geotechnical Specs. Step 1. Review the latest copy of the PAGD Spec Guide list. Refer to Specification
Development Priorities.xlsx. Category 100: Step 2. If the stability of nearby buildings or structures could be impacted by
construction activity; a “Construction Noise and Vibration” special provision might be needed to be included with the Contract Documents. This specification is developed with the help of EGD. If buildings are removed as part of the proposed plan to construct a roadway or roadway associated structures, a special provision “Removal and Disposal of Existing Buildings” should be included in the Contract Documents. Co-ordinate with EGD for a special provision.

Deliverables and Report
Section 07: Construction and Material Specifications
Updated 10/01/2013 Return to Table of Contents
8-16
Step 3. If there are abandoned monitoring wells within the project limits and are required to remove them, a special provision “Abandoned Monitoring Well” should be included in the Contract Documents. This specification is developed with the help of EGD.
Step 4. In some projects, pre and post construction surveys may be used to
determine if there are precautions required to prevent damage to the structures during the reconstruction work. These surveys may also be used to determine if any damage has occurred to the structures during construction and the extent of the damage. A special provision “Construction Survey” should be included in the Contract Documents. This specification is developed with the help of EGD.
Step 5. If there are any surface dumps, abandoned wells or other possible situations
where clearing and grubbing is required before the contractor proceeds to grading for roadway, a special provision “Clearing and Grubbing” should be included in the Contract Documents. This specification is developed with the help of EGD.
Category 200: Step 6. A “Construction Sequence for Sinkholes” special provision should be included
in the Contract Documents when there are sinkholes within the project limits and need to be filled before roadway is constructed. Also, this spec can be used in other projects where the engineer feels that following a sequence would be beneficial.
Step 7. If there is any wetland mitigation involved in the project scope, a special
provision reading “Wetland Mitigation Site Grading” should be included in the Contract Documents.
Step 8. If the borings reveal presence of Johnsongrass within the project limits, it
should be treated as contaminated soil and is removed. A special provision “Disposal of Topsoil and Root Mat Contaminated with Johnsongrass” should be included in the Contract Documents.
Step 9. If Sulphidic soils are encountered within the project limits, a special provision
“Sulphidic Soils” stating about the treatment of sulphidic soils should be included in the Contract Documents.
Step 10. In projects where Quicklime is proposed for drying the wet soils, include a
special provision “Quicklime Treatment for drying” in the Contract Documents.
Step 11. For projects where embankment construction is proposed on soft clays, slope
inclinometers, telescoping inclinometer casing are used to monitor the stability and settlement of the embankment as it is built. Where inclinometers are included, provide a special provision “Inclinometers” to be included in the Contract Documents.
Deliverables and Report
Section 07: Construction and Material Specifications
Updated 10/01/2013 Return to Table of Contents
8-17
Step 12. For projects where embankment construction and slopes are proposed on soft clays, settlement plates monitor the slope movements. In cases where settlement plates are included, provide a special provision “Settlement Plates” to be included as part of the Contract Documents.
Step 13. In some projects, high moisture contents of fine grained soils and high water
tables might make subgrade very unstable during test/proof rolling. Drainage Blanket provided will assist in stabilizing the subgrade, bridging unstable material, and minimizing the practice of undercutting. The drainage blanket is being used to prevent seasonal fluctuations in the groundwater from damaging the integrity of the pavement section and to stabilize the subgrade in order to expedite construction activities. Provide a special provision “Subgrade Drainage Blanket” to be included in the Contract Documents.
Step 14. If rock is encountered in any of the borings, review the borings for auger
refusal (hard or soft rock). If soft rock is encountered, it can be excavated by conventional equipment. If hard rock is encountered, rock blasting may be required. Provide a special provision “SP 201 - Roadway Excavation” to be included in the Contract Documents. Co-ordinate with EGD for a special provision.
Step 15. For Underground Storage Tank removal and backfill, a special provision “SP
201 - Roadway Excavation” to be included in the Contract Documents. Co-ordinate with EGD for a special provision. Refer to Miscellaneous (UST, Karst, Geotextiles, etc.)
Step 16. If the borings reveal soft material with high moisture contents at subgrade
level, then the subgrade may not support the pavement and construction equipment. It has to be replaced with a better material. All excavated material should be accounted as Class 1-A Excavation. Usually for backfilling Class 1-A Excavation, GSSGAB is preferred but other borrow materials can also be used based on the availability and approval of Engineer. The Contractor should be alerted of the situation about encountering soft materials and is need to do Class 1-A Excavation as needed. Provide a special provision “SP 201 - Roadway Excavation” to be included in the Contract Documents.
Step 17. If an embankment is to be placed on soft soils to support the roadway
structure, the foundation soils may not provide enough bearing for construction equipment to maneuver. In such cases, either the foundation soil is excavated and backfilled with better material or should be bridged with thick lifts of borrow material. Provide a special provision “SP 204 – Embankment and Subgrade” to be included in the Contract Documents.
Step 18. If an embankment has to be placed over wetlands or ponds, co-ordinate with
Engineering Geology Division for a special provision. Provide a special provision “SP 204 – Embankment and Subgrade” to be included in the Contract Documents..
Step 19. If the embankments are built on soft compressible soils in staged construction
so that soils gain strength over time by consolidation, settlement plates are

Deliverables and Report
Section 07: Construction and Material Specifications
Updated 10/01/2013 Return to Table of Contents
8-18
required to monitor the settlement of the embankment lifts placed. Provide a special provision “SP 204 – Embankment and Subgrade” to be included in the Contract Documents. Co-ordinate with Engineering Geology Division for a special provision.
Step 20. If Lime is proposed for subgrade stabilization, “Lime Treated Subgrade”
Specification should be included in the Contract Documents. However, the percentage of lime required for stabilization is based on the results obtained from laboratory testing of different soil samples with various lime percentages. Provide a special provision “SP 200 – Lime Treated Subgrade” to be included in the Contract Documents.
Step 21. If Cement is proposed for subgrade stabilization, “Cement Treated Subgrade”
Specification should be included in the Contract Documents. However, the percentage of cement required for stabilization is based on the results obtained from laboratory testing of different soil samples with various cement percentages. Provide a special provision “SP 200 – Cement Treated Subgrade” to be included in the Contract Documents.
Step 22. Due to right of way constraints, providing a slope flatter than 2:1 for high
embankments with benches (10 ft wide) may not be possible. If the slopes have to be steeper, then they should be reinforced with high strength geotextiles. Provide a special provision “SP 200 – Geotextile Inclusion and High Strength Geotextile for Reinforcement” to be included in the Contract Documents. Co-ordinate with EGD for a special provision.
Step 23. If the borings reveal any petroleum traces or the soil is determined to be
contaminated, it should be excavated and backfilled with borrow or aggregate. A Special Provision stating about Contaminated Soils should be developed and put in the Contract. Provide a special provision “SP 200 – Contaminated Soils” to be included in the Contract Documents. Co-ordinate with EGD for a special provision.
Step 24. If temporary cut slopes are required during construction, a Special Provision
should be developed and be included in the Contract Documents. Provide a special provision “SP 200 – Temporary Cut Slopes” to be included in the Contract Documents.
Step 25. If any underdrains are required to keep the subgrade from being wet during
and after construction, a special provision stating the locations and types of underdrains should be developed. Provide a special provision “SP 201 – Roadway Excavation” to be included in the Contract Documents.
Category 300: Step 26. If wick drains are proposed to expedite the settlement of the embankment
over soft soils, provide a special provision “SP 300 – Drainage Wicks” to be included in the Contract Documents.
Deliverables and Report
Section 07: Construction and Material Specifications
Updated 10/01/2013 Return to Table of Contents
8-19
Step 27. If Slope Drainage Blanket is proposed for cut slopes in stabilizing the slope against ground water, provide a special provision “SP 300 – Slope Drainage Blanket” to be included in the Contract Documents.
Step 28. If Bioretention facility is proposed in the project, include a spec “SP 300 –
Bioretention Facilities”. Step 29. If Dry swale facility is proposed in the project, include a spec “SP 300 – Dry
Swale Facilities”. Step 30. If flowable backfill is recommended to backfill abandoned existing pipes,
include a spec “SP 300 – Flowable Backfill for Abandoned Existing Pipe”.
Step 31. If Rip Rap is recommended buttress pond or embankment against water,
include a spec “SP 300 – Rip Rap Slope Chanel Protection”.
Category 500: Step 32. If patching, include the Patching Photo specification.
Step 33. As appropriate, include specifications related to unique project aspects, such
as the Dowel Bar Retro Fit spec, White topping, etc.
8.07.03.01 Ride Quality Material acceptance specifications can significantly affect the lay down operations of a HMA mat and ultimately the performance of the pavement. MDSHA pavement designers have influence over some of those specifications and should use consistent policies to ensure that quality material is placed to provide the potential for most improvement to the MDSHA pavement network. The ride quality of the roadway is typically one of the first criteria the travelling public notices about a roadway.
8.07.03.02 Ride Specification MDSHA implemented a ride specification in 2002 that requires the use of high speed laser profilers and measures ride quality in terms of International Roughness Index (IRI). IRI is a ride quality roughness scale that provides a higher value as the roughness of the roadway increased. FHWA provides guidance on roadway condition based on ride quality following the parameters below:
Condition IRI (inches/mile)
Very Good 0 - 60
Good 61 - 94
Fair 95 - 170
Mediocre 171 - 220
Poor >220
The ride specification states the Contractor is responsible for performing ride quality control for paving projects and MDSHA completes ride quality assurance on an as-needed basis. The ride specification places more focus on quality placement practices

Deliverables and Report
Section 07: Construction and Material Specifications
Updated 10/01/2013 Return to Table of Contents
8-20
and provides an opportunity for incentive, disincentive, and corrective action based on the IRI of each section. All travel ways are measured in 25-foot sections with a high speed laser profiler. Those sections are then averaged for the entire project to determine the overall quality of the project. Individual 25-foot sections with extremely high IRI values are identified as defects and require addressing. Special Provision 535 identifies the ride quality measurement and performance requirements for all construction projects.
8.07.03.03 Ride Specification Details The pavement design engineer needs to make decisions concerning the required ride quality for the Special Provision 535 – Pavement Surface Profile specification. The target ride quality values for incentive, full pay, defects, corrective action, and disincentive vary depending on the existing ride quality, the materials being placed, and the proposed construction operations.
Step 34. The pavement design engineer shall use PD-11 Ride Spec to determine the pay target values and range for full pay, incentive, disincentive and defect on a paving project. The following factors are used to assist the engineer to determine ride quality limits:
Existing ride quality
Potential number of opportunities for ride improvement:
Grinding,
Wedge/level
Number of resurfacing lifts
The Ride Specification Details form computes the target values based on the average expected percent improvement in IRI for the number of opportunities available to improve ride. Incentive will be awarded to significantly better-than-average performance, and disincentive will be collected from equally worse-than-average performance. The Incentive and Disincentive is measured based on a lump sum amount per lane-mile of resurfacing in combination with the average overall project ride quality and the number of defects. Special Provision 535, the Ride Specification Details form and MSMT 736 are used as a guide to assist in determining all ride quality targets and pay adjustment amounts. The table below shows how the pay targets will be computed:
Pay Target
Value
IRIa 2 Standard Deviations better than the anticipated IRI after construction
IRIb 1 Standard Deviation better than the anticipated IRI after construction
IRIc 1 Standard Deviation worse than the anticipated IRI after construction, OR the “floor” value (as noted below), whichever is worse.
IRId 2 Standard Deviations worse than the anticipated IRI after construction, OR the “floor” value (as noted below), whichever is worse.
IRIe 3 Standard Deviations worse than the anticipated IRI after construction OR the “floor” value (shown in the table below), whichever is worse.
Deliverables and Report
Section 07: Construction and Material Specifications
Updated 10/01/2013 Return to Table of Contents
8-21
The following “floor” values are established for the disincentive targets (IRIc and IRId) when the existing IRI is less than 65:
IRIc = Existing IRI and IRId = 4 to 5 points higher than IRIc.
The following “floor” values are established for the defect threshold (IRIe) for each functional class depending on the number of opportunities available to improve ride:
Number of opportunities to improve ride
Roadway Functional Class
1 2 3
Interstates & Freeways/Expressways
160 150 140
All other routes 180 170 160
Locals 210 200 190
Category 600: Step 35. If stabilized topsoil shoulders are proposed in a project, provide a special
provision “SP 600 – Stabilized Topsoil Shoulder” to be included in the Contract Documents.
Category 700: Step 36. If stabilized topsoil shoulders are proposed in a project, provide a special
provision “SP 700 – Stabilized Topsoil Surface” to be included in the Contract Documents. This specification has to be modified by Landscaping Division.

Deliverables and Report
Section 08: Management Review & QA
Updated 01/06/2014 Return to Table of Contents
8-22
8.08 MANAGEMENT REVIEW & QA Click to go to New Pavement Design
8.08.01 Purpose
In order to ensure that pavement designs are of high quality, PAGD management must perform a series of reviews. This is necessary to:
Ensure that pavement analyses and designs are correct
Ensure that pavement design processes are followed
Ensure there are no constructability issues for any given repair strategy
Ensure that all appropriate items and specifications are provided to the customer
8.08.02 Resource Requirements
Review is done by three layers of management. The Team Leader is responsible for the bulk of the review; as he/she is responsible for the quality of all deliverables of his/her team. Following that, the PAGD ADC performs a slightly less-detailed review, and then the PAGD DC performs the final review. The reviews require the following staffing needs for a typical project:
Position Function Resources Effort Level (man-hours)
PAGD TL Detailed Review 1 8*
PAGD ADC Moderate Review 1 6*
PAGD DC Final Review 1 1*
* The time required would vary depending on the size and complexity of a project.
8.08.03 Procedure
The PAGD Engineer should fill out the appropriate QCQA form (depending on the project type, see Forms & Spreadsheets) in its entirety. Once that is complete, the PAGD engineer should submit the project folder to his/her Team Leader.
8.08.03.01 Team Leader
8.08.03.01.01 Project Folder Review each section of the project folder to make sure that all required data has been collected and all required analysis and design has been performed. Also make sure everything is where it belongs. Refer to Paper Files and Plan Storage.
8.08.03.01.01.1 Design QA and Summaries At a minimum, this section should have the following forms: PD-02, PD-06, PD-11 and PDS-08. Review each form completeness and correctness. 8.08.03.01.01.2 Reports Review this section to see if any reports from previous/adjacent projects were included, and if so, whether they contain information that could impact the current project’s recommendations and memo/report.

Deliverables and Report
Section 08: Management Review & QA
Updated 01/06/2014 Return to Table of Contents
8-23
8.08.03.01.01.3 Correspondence All correspondence should be in this section. Review the correspondence and any set of plans to be fully aware of the scope of work in order to make sure all required recommendations are provided. 8.08.03.01.01.4 Records Review Review this section to ensure all in-house records are included. This may include, but not be limited to, the following:
Highway Location Reference page(s).
Traffic data
Construction History data
Pavement condition performance data
Other background information from previous or adjacent projects. 8.08.03.01.01.5 Project-Level Collected Data Review this section to ensure all field and lab data are included. This may include, but not be limited to, the following:
Drilling information
Lab information
Patch survey information
Visual survey information
8.08.03.01.01.6 Design/Analysis Review this section to ensure all calculations, designs and analyses are included and correct. This may include, but not be limited to, the following:
Pavement Preservation Guide treatment matrix page(s).
PD Forms (Pavement design/analysis)
AASHTOWare Pavement ME Design outputs
Geotechnical design/analysis
Pavement condition performance data
Other background information from previous or adjacent projects.
8.08.03.01.02 Projects Database Review the Projects database to ensure that all pertinent data is completed.
8.08.03.01.02.1 Project Entry Page Find the specific project, and verify that all relevant fields are filled in. Particular attention should be paid to the dates. 8.08.03.01.02.2 Edit Detail Info/Detailed Project Information Page At a minimum, the Request Type should show Final Recommendation. Verify that all relevant fields are filled in. 8.08.03.01.02.3 Enter Lab Info/Soil Lab Data Page If any lab work was completed, verify that all relevant fields are filled in. 8.08.03.01.02.4 Enter Field Info/Field Testing Data Page Refer to Required Pavement Testing Guidelines. Verify that each test that is required is on this page, at a minimum. For each required test, the Required Testing check box should be checked yes. Verify that all relevant fields are filled in.

Deliverables and Report
Section 08: Management Review & QA
Updated 01/06/2014 Return to Table of Contents
8-24
8.08.03.01.03 Memo/Report Review Review the pavement memo/report. Ensure that all information is correct (e.g. data is transferred correctly. Ensure that all required information has been included and is correct. Refer to Example Memos to determine whether all information is included. Check for grammar. Verify that recommendations are complete and appropriate. Verify that necessary specifications and pavement details are included.
8.08.03.01.04 PD-06 Form Ensure that the header containing the project details is correctly filled out, and that the appropriate PD-06 form was used.
For each process, ensure that each box in the date column has either a date or “NA”. If “NA” is listed, make sure that NA is appropriate. If a date is listed, verify that particular step was completed correctly. Initial the corresponding box under the Team Leader column once the review for that process is complete and any identified problems are corrected. Once all Team Leader review is complete, submit the folder to the ADC.
8.08.03.02 Assistant Division Chief
8.08.03.02.01 Project Folder Review each section of the project folder to make sure that everything is where it belongs. Follow the same procedures as shown in the Project Folder section for Team Leader.
8.08.03.02.02 Projects Database Review the Projects database to ensure that all pertinent data is completed. Follow the same procedures as shown in the Project Folder section for Team Leader.
8.08.03.02.03 Memo/Report Review Review the pavement memo/report. Ensure that all information is correct (e.g. data is transferred correctly. Ensure that all required information has been included and is correct. Refer to Example Memos to determine whether all information is included. Check for grammar. Verify that recommendations are complete and appropriate. Verify that necessary specifications and pavement details are included.
8.08.03.02.04 PD-06 Form Ensure that the header containing the project details is correctly filled out, and that the appropriate PD-06 form was used.
For each process, ensure that each box in the date column has either a date or “NA”. If “NA” is listed, make sure that NA is appropriate. If a date is listed, verify that particular step was completed correctly. Verify that the Team Leader initialed all boxes as appropriate. Initial the corresponding box under the ADC column once the review for that process is complete and any identified problems are corrected.
Deliverables and Report
Section 08: Management Review & QA
Updated 01/06/2014 Return to Table of Contents
8-25
Once the ADC review is complete, submit the folder to the DC.
8.08.03.03 Division Chief
8.08.03.03.01 Project Folder Review the correspondence and any set of plans to be aware of the scope of work. Review the first section of the project folder to make sure that all required forms have been properly completed. Review Visidata to get an idea of the project conditions.
8.08.03.03.02 Projects Database Perform a cursory review the Projects database to ensure that all pertinent data is completed. Ensure that the Accomplishment Tracker is updated.
8.08.03.03.03 Memo/Report Review Review the pavement memo/report. Ensure that all information is correct (e.g. data is transferred correctly. Ensure that all required information has been included and is correct. Refer to Example Memos to determine whether all information is included. Check for grammar. Verify that recommendations are complete and appropriate. Verify that necessary specifications and pavement details are included. Once the DC review is complete, return the folder to the project engineer. 8.08.03.03.04 Final Signature and Memo/Report Distribution Once the project engineer addresses all DC comments, then the engineer shall submit the final memo/report on SHA letterhead, which the DC will sign. The DC shall also fill out the remaining portions of PD-06 as appropriate. Refer to Final Pavement & Geotechnical Report for memo/report distribution.

Appendices
Section 01: Glossary
Updated 05/07/2014 Return to Table of Contents 9-1
9 APPENDICES
9.01 GLOSSARY
9.01.01 Pavement Preservation Guide Click to go to Initial Treatment Identification – Pavement Preservation Guide Click to go to Table C. List of Treatment Options Click to go to Materials and Typical Design Properties
9.01.01.01 Crack / Joint Seals: A-1: Crack Fill and Crack Seal (Asphalt-Surfaced pavements) A-1a: Crack Fill is a process that consists of placing a generally bituminous material into “non-working” cracks to substantially reduce water infiltration and reinforce adjacent top-down cracks. Non-working cracks are cracks that have vertical or horizontal movement of less than 2.5mm (0.1”), and are typically diagonal or longitudinal cracks. A-1b: Crack Seal is a process of placing higher-quality material into or on top of "working" cracks in order to reduce water infiltration into a pavement. Working cracks are cracks that have vertical or horizontal movement of at least 2.5mm (0.1”), and are typically transverse and reflective cracks. In contrast with crack filling, crack sealing requires more crack preparation procedures and uses higher-quality sealant materials. Generally, one pound of material equate to ½” by ½” by 5’ of crack filling/sealing. A-2: Crack Seal (Concrete-Surfaced pavements) (Concrete-Surfaced pavements) An operation involving thorough crack preparation and placement of high quality material into or over candidate cracks to significantly reduce moisture infiltration and to retard the rate of crack deterioration. Sealed candidates in the concrete pavements deteriorate less and contribute less to the deterioration of the pavements. Concrete cracks are typically sealed with thermosetting bituminous material. A-3: Joint Sealing (and Resealing) Sealing (and Resealing) transverse joints in concrete pavements is intended to minimize the infiltration of surface water into the underlying pavement structure and to prevent the intrusion of incompressibles into the joints. A range of materials from bitumen to silicone to neoprene is used in design configurations. Neoprene is rarely if ever used on resealing projects. A-4: Saw and Seal A method of controlling reflective cracking in HMA overlays that involves sawing joints in the new overlay exactly over the joints in the existing pavement. (Return to Saw and Seal for reflective cracking discussion).
Appendices
Section 01: Glossary
Updated 05/07/2014 Return to Table of Contents 9-2
9.01.01.02 Asphalt Sealers / Rejuvenators: B-1: Fog Seal Very light applications of a diluted asphalt emulsion (1 part emulsion + 1 part water) placed directly on the pavement surface with no aggregate. Typical application rates range from 0.05 to 0.1 gallon per square yard. B-2: Rejuvenators Specialized emulsions of maltenes (2 parts maltene + 1 part water) that are sprayed on an existing asphalt surface with the intent of softening the existing binder, enriching the oxidized pavement, thereby reducing thermal cracking and inhibiting raveling. The emulsions used are typically mixtures of asphalt, polymer latex, and other additives, such as softening agents. An asphalt binder consists of maltenes and asphaltenes. Asphaltenes are unaffected by the environment. Maltenes are affected by the environment, and their loss causes brittleness in the asphalt leading to weathering/raveling. The function of fog seals/rejuvenators is to restore maltenes to the asphalt binder.
9.01.01.03 Aggregate Seals: C-1: Cape Seal A surface treatment that involves the application of a slurry seal or micro-surfacing to a newly constructed chip seal. Cape seals are used to provide a dense water proof surface with improved skid resistance and smoother ride. C-2a: Chip Seal Asphalt (commonly as emulsion) is applied directly to the pavement surface followed by the application of aggregate chips, which are then immediately rolled to embed chips. Application rates depend upon surface condition, aggregate gradation and maximum size. Chip seal can be applied in multiple layers (i.e., double chip seals). In addition, there are high-performance chip seals and modified chip seals in use. Use of stone obtained as a by-product from SMA is ideal, as it provides a uniform single-sized stone. C-2b: Modified Chip Seal When the asphalt emulsion is modified with a blend of ground tire or latex rubber or polymer modifiers to enhance the elasticity and adhesion characteristics, it is called a modified chip seal. C-2c: High-performance Chip Seal A synchronized continuous application of ultra fast polymer asphalt emulsion and single-size durable aggregate. C-3: High Friction Surface An ultrathin, uniformly graded friction improvement course bonded to existing pavement with epoxy. The aggregate material is typically calcined bauxite. The epoxy bonds well to both HMA and PCC surfaces. A variety of colors are available for traffic calming purposes. Significantly improves skid resistance. Typically used for spot treatments to address wet accident locations, tight curves, or heavy braking locations.

Appendices
Section 01: Glossary
Updated 05/07/2014 Return to Table of Contents 9-3
C-4: Sand Seal A thin asphalt surface treatment constructed by spraying a non-diluted emulsion, spreading a thin layer of fine aggregate (i.e. sand), and rolling. Sand seals are typically 0.1” to 0.2” thick. The primary purpose of a sand seal is to increase surface friction; however, in some cases, sand seals are used to "lock" the aggregates in a chip seal. C-5: Sandwich Seal An application of a one-layer course of aggregate particles, followed by an application of an emulsion, followed by a second course of smaller aggregates to fill the voids. The term sandwich is derived from the fact that the asphalt application is placed between the two layers of the aggregate. There is a possible placement of emulsion before the coarse aggregate. C-6: Scrub Seal A thin asphalt surface treatment constructed by spraying a polymer-modified emulsion onto an existing pavement, dragging a broom across the surface to scrub the emulsified asphalt into the surface cracks, immediately spreading a thin fine aggregate (i.e. sand or screenings) over the emulsified asphalt, dragging another broom over the surface to scrub the fine aggregate into the emulsion and the surface cracks, and rolling the surface with a pneumatic tire roller. Thicknesses generally range from 0.4” to 0.75”. C-7: Slurry Seal Similar to micro-surfacing, slurry seals are mixtures of well-graded aggregate (fine sand and mineral filler) and asphalt emulsion spread over the entire pavement surface with either a squeegee or spreader box attached to the back of a truck. Slurry seals are effective in sealing low-severity surface cracks, waterproofing the pavement surface, and improving skid resistance at speeds below 30 mph. Thickness is generally < 0.4”. They are not effective where the underlying pavement experiences vertical movement due to load. Placement requirements are fairly stringent and include limitations on temperature, traffic, and moisture. C-8: Micro-surfacing (aka in MDSHA as Latex-Modified Slurry Seal) Micro-surfacing is a mixture of polymer-modified asphalt emulsion, crushed dense graded aggregate, mineral filler, additives, and water. Micro-surfacing provides thin resurfacing of 10 to 20 mm (3/8” to ¾”) to the pavement and returns traffic use in one hour under average conditions. Materials selection and mixture design make it possible for micro-surfacing to be applied in multiple applications and provide minor re-profiling. The product can fill wheel ruts up to 40 mm (1.5”) in depth in one pass and produces high surface friction values. Micro-surfacing is suitable for use on limited access, high-speed highways as well as residential streets, arterials and roadways. When a single application is placed, all cracks greater than 3/8” wide must be filled or patched. A double application of Micro-Surfacing may be recommended on older pavements that have become severely oxidized and have lost surface fines causing larger aggregate to be lost. An example would be on Open Graded Friction Courses. A double coat of Micro-Surfacing should be used for filling minor rutting (generally a Type III aggregate to fill the ruts followed by a Type II aggregate for the surface), or when it is more cost-effective than filling cracks and placing a single coat.
Appendices
Section 01: Glossary
Updated 05/07/2014 Return to Table of Contents 9-4
9.01.01.04 HMA Overlay: D-1: Thin Overlay D-1a: Ultrathin Bonded Wearing Course (Asphalt) A gap-graded or open-graded ultra thin Hot-Mix specialized membrane for bonding using innovative equipment, over a thick polymer modified asphalt emulsion membrane. Lift thickness ranges from 5/8” to 1”. Can be applied on asphalt surfaces. (Return to Ultrathin Bonded Wearing Course for Joint-Reflection Mitigation discussion) D-1b: HMA Overlay – Open Graded Friction Course Open Graded Friction Course is a surface course with an aggregate gradation that provides an open void structure as compared with conventional dense graded asphalt concrete. Air void content typically ranges from 15-25%, resulting in a highly permeable mixture relative to conventional HMA, which is typically impermeable. D-1c: HMA Overlay – Ultrathin (<1.5”) Plant Mix Combinations of Asphalt Cement and Aggregate applied to pavement in thicknesses between 0.75" to 1.5". Dense graded, open graded, and stone matrix mixes are all used. Like all overlays, a tack coat is required before placement of the overlay. Polymer modification should be specified for binders in thin wearing surfaces. (0.75” or less). D-1d: HMA Overlay – Ultrathin (<1.5”) (High Performance Thin Overlay) Plant Mix Combinations of Asphalt Cement and Aggregate applied to pavement in thicknesses between 0.75" to 1.5". This typically includes a high percentage of polymer-modified binder, resulting in a more crack-resistant wearing course than a dense-graded mix. D-2a: Grind and HMA Overlay This activity is a combination of grinding the existing pavement surface up to 4” and overlaying with Hot-Mix Asphalt. D-2b: Deep Grind and Thick Overlay Removal of several layers of existing pavement, followed by placement of at least 4” HMA or PCC overlay. At least a portion of the base layer is left in place, and the subgrade is not disturbed. This is usually done in cases where the grade must be maintained or lowered and additional structure is needed, and the way to achieve that is to essentially substitute unbound aggregate with stronger HMA or PCC. This fix is considered a Major Rehabilitation. D-3: HMA Overlay This activity consists of resurfacing the existing pavement with Hot-Mix Asphalt. D-4: Wedge/Level and HMA Overlay This activity is a combination of placing a Wedge/level layer on the existing pavement surface and resurfacing with Hot-Mix Asphalt. Wedge/level is a layer of variable HMA thickness used for grade or cross-slope adjustments, as a structural layer, and to improve ride quality.
Appendices
Section 01: Glossary
Updated 05/07/2014 Return to Table of Contents 9-5
D-5: Hot In-Place HMA Recycling (HIR) A process which consists of softening the existing asphalt surface with heat, mechanically removing the softened surface material (typically 1” to 2”), mixing the material with a recycling agent, adding virgin asphalt and aggregate to the material (if required), and then replacing the material on the pavement.
9.01.01.05 PCC Overlay: E-1a: PCC Overlay – Unbonded (Asphalt pavements) Unbonded overlays are basically new pavements constructed on an existing stable platform. It is a 4" - 11" PCC layer as applied on an existing flexible or composite pavement. It is generally unbonded, but may be partially bonded to the existing HMA to increase the load carrying capacity. E-1b: PCC Overlay – Unbonded (PCC-Surfaced pavements) Placement of a PCC overlay on a rigid pavement. Prior to placement of a PCC overlay, a bond breaker is placed to isolate the two PCC layers. The bond breaker is typically a 1"-2" HMA overlay directly on the old PCC pavement prior to the placement of the new PCC overlay. The bond breaker is designed to allow the two PCC layers to move independently and limit the amount of reflective cracking. Typical thickness ranges from 6" - 10". Thicknesses as low as 4” have been placed. E-2: PCC Overlay – Bonded Placement of a PCC overlay on a rigid/flexible pavement. Additional care and construction practices are taken to ensure a good bond between underlying pavement and new overlay. Typical thickness ranges from 2" - 5".
9.01.01.06 Patch: F-1: HMA Patch This consists of the removal of areas of unsound pavement material for a portion or the full thickness of the pavement material and replacement with HMA. The pavement thickness is defined as the thickness of all bound materials in the pavement structure, including HMA, PCC and any other asphalt or cement modified materials. F-2: PCC Partial-Depth (Spall Repair) Partial depth repairs are defined as the removal of small, shallow (less than 1/3 of the thickness of the concrete pavement) areas of deteriorated PCC that are then replaced with a suitable material. These repairs restore structural integrity and improve ride quality, thereby extending the service life of the pavements that have spalled or distressed joints. F-3: PCC Full-Depth Repair Full-Depth Repairs (FDR) are cast in-place PCC repairs that extend through the full thickness of the existing PCC slab. The technique involves the full-depth removal and replacement of a full or half lane width areas of an existing deteriorated PCC pavement. The minimum specified repair length is typically six feet. However, it may be more cost effective and reliable to replace a large area rather than placing a series of short repairs. Note: HMA material shall not be used to patch concrete pavements.

Appendices
Section 01: Glossary
Updated 05/07/2014 Return to Table of Contents 9-6
9.01.01.07 Joint Treatments: G-1: Cross-stitching A longitudinal crack and joint repair technique that consists of grouting tie bars in holes drilled across non-working longitudinal cracks/joints at an angle to the pavement surface. Cross-stitching prevents horizontal and vertical crack movements. G-2: Dowel Bar Retrofit Placement of load transfer devices across joints or cracks in an existing jointed concrete pavement to restore load transfer at the joints. Poor load transfer can lead to pumping, faulting and corner breaks. Slots are cut, concrete removed, dowel bars inserted, backfill material filled, the surface finished, cured, and most often diamond ground. G-3: Undersealing /Slab Stabilization The pressure insertion of flowable material beneath the concrete slab to fill voids between the slab and the base, reducing the deflections and consequently, deflection-related distresses such as pumping or faulting. It is often performed at areas where pumping or loss of support occur, such as beneath transverse joints and deteriorated cracks. The voids filled by this technique are generally less than 3mm (0.12") thick.
9.01.01.08 Surface Texturizing: H-1: Diamond Grinding – Asphalt-Surfaced Pavements The removal of a thin layer of HMA, generally about 1/16" to 0.25", from the surface of the pavement using equipment outfitted with closely spaced diamond saw blades. H-2: Diamond Grinding – Concrete-Surfaced Pavements It is the removal of a thin layer of concrete, generally about 3/16" to 0.25", from the surface of the pavement using special equipment outfitted with a series of closely spaced diamond saw blades. H-3: Surface Carbide Grinding Grinding an existing pavement with carbide tipped grinding teeth resulting in a pavement surface with a transverse pattern of 0.2” center to center of each strike area and with a difference of high and low of the matted surface not exceeding 1/16”. This is different from milling, which maintains a tolerance of ±1/8”. H-4: Diamond Grooving A surface restoration procedure which can be performed on both PCC and HMA pavements. This procedure involves the use of diamond saw blades, with a typical spacing of 3/4" on center, to cut parallel grooves into the pavement surface. It can be performed in both longitudinal and transverse directions. Diamond grooving should be applied to pavements with sound structural and functional characteristics. The purpose of diamond grooving is to improve wet weather pavement/tire interaction. H-5: Surface Abrasion A surface restoration procedure which involves abrading the surface by utilizing a high-impact method to shoot steel abrasive material onto the pavement, then collecting and recycling the steel material so that no cleanup is required. Surface abrasion significantly restores wet weather skid resistance.
Appendices
Section 01: Glossary
Updated 05/07/2014 Return to Table of Contents 9-7
9.01.01.09 Major (Heavy) Rehabilitation: I-1: Cold In-Place HMA Recycling A process in which a portion of an existing bituminous pavement is pulverized or milled, and then the reclaimed material is mixed with new emulsified or foamed neat 64-22 asphalt binder and, when needed, virgin aggregates, lime or cement. The binder used most often is emulsified asphalt with or without a softening agent. The resultant blend is placed as a base for a subsequent overlay or surface treatment. I-2: Break/Crack & Seat and HMA Overlay Placement of a HMA overlay on a jointed concrete pavement (JCP) that has been altered via break/crack and seat. The break/crack and seat method differs from rubblization in that a large percentage of the structural integrity of a rigid pavement remains following a break/crack and seat operation. The break/crack and seat operation involves breaking the existing slab in much shorter slabs followed by compaction of those smaller slabs to “seat” them. This operation is designed to limit the potential for reflective cracking while maintaining a majority of the structural capacity of the rigid pavement. The Break and Seat technique is applied to Jointed Reinforced Concrete Pavements (JRCP), while Crack and Seat technique is applied to Jointed Plain Concrete Pavements (JPCP). Break and Seat involves breaking the concrete to pieces of 1 to 2 ft2 in size, and Crack and Seal involves breaking the concrete to pieces of 1 to 3 ft2 in size. For Break and Seat, the reinforcing steel must be ruptured, or the bond must be broken. I-3: Rubbilization and HMA Overlay Placement of an HMA overlay on a rigid pavement that has been structurally altered via rubblization. Rubblization involves breaking the PCC layer into smaller pieces of less than 6” in diameter. This effectively creates a cement treated aggregate base from the rigid pavement. Rubblization is generally completed to eliminate the potential for reflective cracking. Rubblization is generally completed on rigid pavements that are beyond their structural life, or are experiencing materials or construction problems that can not otherwise be addressed.
9.01.01.10 Reconstruction: J-1: Reconstruction Complete reconstruction of the existing pavement type with a flexible or rigid pavement design, choosing from a variety of subgrade and base types. J-2: Full-Depth Reclamation (FDR) Technique in which the full thickness of the asphalt pavement and a predetermined portion of the underlying material (base, subbase and/or subgrade) is uniformly pulverized and blended to provide an upgraded, homogeneous base material. FDR is performed on the roadway without the addition of heat, similar to CIR. Treatment depths vary depending on the thickness of the existing pavement structure, but generally range between 4” to 12”. FDR consists of pulverization/reclamation of the existing pavement materials, adding more materials (when necessary), mixing, initial shaping of the resultant mix, compaction, final shaping or “tight blading”, and application of a bituminous surface or wearing course.

Appendices
Section 01: Glossary
Updated 10/16/2012 Return to Table of Contents 9-8
9.01.02 Pavement System Preservation Terms and Definitions
In an effort to promote a uniform vocabulary throughout MDSHA, the following System Preservation terms and definitions will be used. Cracking Index (CI) An index created that quantifies the amount of pavement cracking. CI is reported on a 0-100 scale, where 0 = failed, and 100 = no cracks. Data to calculate the CI is collected by the ARAN. Cracking data has been collected since 2001, but the results have been unreliable. As a more reliable historical record is established, the remaining service life calculations may be revised. The CI is a function of Structural CI and Functional CI, where the cracks are distinguished by whether they are caused from structural or functional reasons. Design Life The number of years anticipated for a pavement section at the time of initial construction, until zero-life is reached. Design life does not include any additional life estimates provided by anticipated future preventive maintenance, but does include routine maintenance as needed. Fix Life The anticipated life extension provided by the pavement treatment, excluding any future pavement treatments. This will be the life that the Pavement & Geotechnical Division (PAGD) provides when reporting how long a certain fix will last. Faulting A measure of differential settlement between adjacent concrete slabs. Faulting is not currently collected in Maryland on a network level. Life Extension The number of years until the pavement condition deteriorates and reaches the condition that existed prior to the most recent fix. Performance Measure Measured test results of existing or past pavement performance in terms of the property measured (IRI, CI, FN, Rutting). Performance Target A future performance measure (inital or terminal). A target is something which has not yet been achieved. Remaining Service Life, (RSL) The estimated number of years until a pavement section reaches the Zero-Life threshold. RSL is a function of the distress level and rate of deterioration. The RSL is calculated for each of Ride Quality, Cracking, Rutting and Friction. RSL Years A translation of performance measures or targets into Remaining Service Life Years (0 through 50 RSLY). A given performance measure has a corresponding RSLY.

Appendices
Section 01: Glossary
Updated 10/16/2012 Return to Table of Contents 9-9
RSLY Overall A function of IRI, Rut, CI, and SN RSLY, where the Overall RSLY is the lowest of the four individual RSLYs. RSLY: Functional Class Terminal RSLY 0 Years RSLY as determined by the table in Step 3 of Chapter VI.A.1.6. RSLY: Primer Terminal Overall RSLY The Better of the two RSLYs, comparing Existing Overall and Functional Class Terminal RSLY. RSLY: Policy Terminal Overall RSLY The Lowest Terminal Value allowed by current policy. RSLY: Design Terminal RSLY The better of the two RSLYs, comparing the Primer Terminal RSLY and the Policy Terminal RSLY. Ride Quality, International Ride Index (IRI) A measure of pavement smoothness that quantifies the user’s perception of pavement ride quality. Ride quality is represented by the IRI, which is reported in inches per mile and increases as ride quality deteriorates. Ride Quality data is collected by the ARAN, and is measured in the slow lanes to represent the directional IRI for each surveyed route. The ARAN becomes less reliable at low speeds (under 20 mph). This affects IRI results in areas with many traffic stops, and other slow speed zones such as roundabouts and sharp curves. In some of these locations, the IRI data may be artificially high. Rutting A measure that quantifies the transverse profile, also known as wheel ruts. Rutting is reported in terms of the average depth, in inches, between the highest and lowest peaks transversely. Service Life (Analysis Period) The anticipated life of a rehabilitation or new/reconstruction, including additional pavement life provided by anticipated future preventive maintenance. This term is used to describe the number of years from initial new construction, reconstruction or rehabilitation of a pavement to a subsequent rehabilitation or reconstruction. A service life or analysis period equals the sum of the original design/fix life plus any additional pavement life provided by future anticipated preventive maintenance. Analysis period is the term typically used to describe the time used in a life cycle cost analysis. Skid Index, Skid Number (SN) An index created that quantifies the skid resistance of a pavement. SN is a unit-less number, and increases as skid resistance increases.
Appendices
Section 01: Glossary
Updated 10/16/2012 Return to Table of Contents 9-10
9.01.02.01 Pavement Fix Categories There are four general categories of pavement fixes: Reconstruction, Structural Rehabilitation, Pavement Preservation, and Reactive Maintenance. More specific activities are sub-categories of these, as shown in Table 2. Historically, any type of resurfacing project has been considered rehabilitation, and types of maintenance have not been distinguished. They are now distinguished because of their potential impact on ADA and MDE requirements, to fall in line with FHWA definitions, and to enable more logical project candidate and fix selection. 9.01.02.01.01 Reconstruction Reconstruction is the replacement of the entire existing pavement structure with a flexible or rigid pavement design to achieve an equivalent or increased pavement structure. Reconstruction usually requires the complete removal and replacement of the existing pavement structure, including all bound and unbound stabilized material (e.g. GAB) to at least the top of the subgrade. If any of the existing pavement structure is left in place, it is not considered reconstruction. Reconstruction can involve a variety of subgrades and bases. Reconstruction may utilize either new or recycled materials. Reconstruction is required when a pavement has either failed or become functionally obsolete. Reconstruction is NOT necessarily needed at the zero-year life threshold. 9.01.02.01.02 Structural Rehabilitation This includes Major (Heavy) Rehabilitation and Structural Overlay. This consists of treatments that enhance the pavement structure and improve its load carrying capacity. Rehabilitation is considered structural if the grade increases by more than 1.5” from overlay or grind/overlay. Examples include an overlay (without grinding) of more than 1.5”, or an overlay (with a 1.5” grind) of more than 3”. Rehabilitation is also considered structural if at least 5% of the project area receives patching for structural distress. Structural distress primarily includes fatigue (alligator) cracking in HMA, or cracked slabs in PCC. 9.01.02.01.03 Pavement Preservation Pavement Preservation consists primarily of three components: preventive maintenance, minor rehabilitation (non-structural), and some routine maintenance activities. The distinctive characteristics of pavement preservation activities are that they restore the function of the existing system and extend its service life, not increase its capacity or strength. 9.01.02.01.04 Reactive Maintenance Reactive Maintenance consists of maintenance that is not planned. It includes Corrective Maintenance and Catastrophic Maintenance.
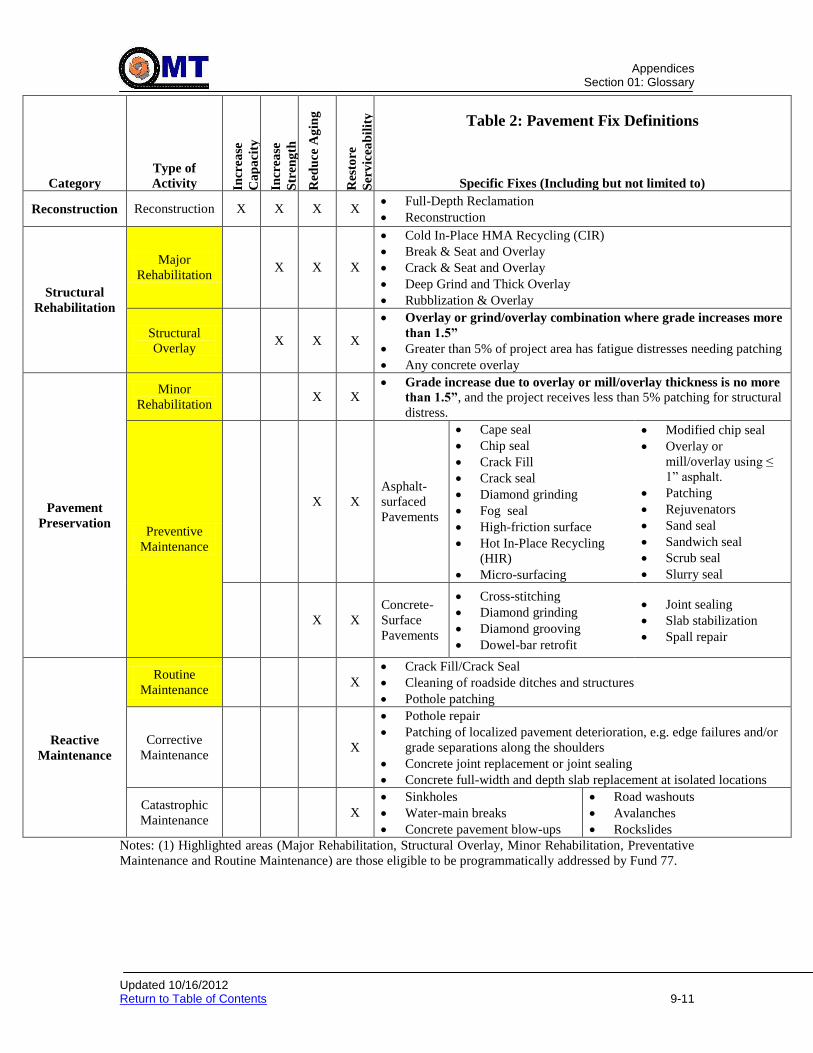
Appendices
Section 01: Glossary
Updated 10/16/2012 Return to Table of Contents 9-11
Category
Type of
Activity Incr
ea
se
Ca
pa
city
Incr
ea
se
Str
eng
th
Red
uce
Ag
ing
Res
tore
Ser
vic
eab
ilit
y
Table 2: Pavement Fix Definitions
Specific Fixes (Including but not limited to)
Reconstruction Reconstruction X X X X Full-Depth Reclamation
Reconstruction
Structural
Rehabilitation
Major
Rehabilitation X X X
Cold In-Place HMA Recycling (CIR)
Break & Seat and Overlay
Crack & Seat and Overlay
Deep Grind and Thick Overlay
Rubblization & Overlay
Structural
Overlay X X X
Overlay or grind/overlay combination where grade increases more
than 1.5”
Greater than 5% of project area has fatigue distresses needing patching
Any concrete overlay
Pavement
Preservation
Minor
Rehabilitation X X
Grade increase due to overlay or mill/overlay thickness is no more
than 1.5”, and the project receives less than 5% patching for structural
distress.
Preventive
Maintenance
X X
Asphalt-
surfaced
Pavements
Cape seal
Chip seal
Crack Fill
Crack seal
Diamond grinding
Fog seal
High-friction surface
Hot In-Place Recycling
(HIR)
Micro-surfacing
Modified chip seal
Overlay or
mill/overlay using ≤
1” asphalt.
Patching
Rejuvenators
Sand seal
Sandwich seal
Scrub seal
Slurry seal
X X
Concrete-
Surface
Pavements
Cross-stitching
Diamond grinding
Diamond grooving
Dowel-bar retrofit
Joint sealing
Slab stabilization
Spall repair
Reactive
Maintenance
Routine
Maintenance X
Crack Fill/Crack Seal
Cleaning of roadside ditches and structures
Pothole patching
Corrective
Maintenance X
Pothole repair
Patching of localized pavement deterioration, e.g. edge failures and/or
grade separations along the shoulders
Concrete joint replacement or joint sealing
Concrete full-width and depth slab replacement at isolated locations
Catastrophic
Maintenance X
Sinkholes
Water-main breaks
Concrete pavement blow-ups
Road washouts
Avalanches
Rockslides
Notes: (1) Highlighted areas (Major Rehabilitation, Structural Overlay, Minor Rehabilitation, Preventative
Maintenance and Routine Maintenance) are those eligible to be programmatically addressed by Fund 77.

Appendices
Section 01: Glossary
Updated 10/16/2012 Return to Table of Contents 9-12
9.01.02.02 Structural Rehabilitation Terms
9.01.02.02.01 Major (Heavy) Rehabilitation Major Rehabilitation consists of significant, deep repair to existing pavement, generally involving removing or significantly altering most of the pavement structure, without exposing the subgrade. Major Rehabilitation includes items such as Cold In-Place Recycling, Break & Seat and Overlay, and Rubblization and Overlay, among other items.
9.01.02.02.02 Structural Overlay An overlay whose intention is to improve the structural capacity of the pavement. Any overlay or grind/overlay combination that adds more than 1.5” to the total bound structure is considered structural. Alternatively, if more than 5% of the project area has fatigue distress that require patching, it is also considered a structural overlay.
9.01.02.02.03 Fatigue Distress (to determine whether Structural Overlay or not) Fatigue distresses are pavement distresses caused by a combination of poor subgrade support, thin/weak pavement structure, and/or applied loads that exceed the capacity of the structure. Fatigue distresses typically start at the bottom of the pavement and work their way up to the surface. Because of this, the entire pavement thickness should be replaced during patch operations. Fatigue distress predominantly shows up in the form of alligator cracking. Refer to LTPP’s Distress Identification Manual6 for descriptions of various distresses.
9.01.02.03 Pavement Preservation Terms
9.01.02.03.01 Minor (Light) Rehabilitation Consists of non-structural enhancements made to the existing pavement sections to eliminate age-related, top-down surface cracking that develop in flexible pavements due to environmental exposure. Because of the non-structural nature of minor rehabilitation techniques, these types of rehabilitation techniques are placed in the category of pavement preservation. Rehabilitation is considered minor if the grade increase due to overlay or mill/overlay thickness is no more than 1.5”, and the project receives less than 5% patching for structural distress.
9.01.02.03.02 Preventive Maintenance Consists of planned maintenance treatments to structurally sound pavements, with the intent to preserve the system, retard future deterioration, and maintain or improve the functional condition. As a major component of pavement preservation, preventive maintenance is a strategy of extending the service life by applying cost-effective treatments to the surface or near-surface of pavements in good condition having significant remaining service life.
Examples of preventive treatments include asphalt crack sealing, chip sealing, slurry sealing or micro-surfacing, thin and ultra-thin hot-mix asphalt overlay, concrete joint sealing, diamond grinding, dowel-bar retrofit, and isolated, partial and/or full-depth patches to restore functionality of the pavement. In MDSHA, Preventative Maintenance activities are performed by contractors, and are normally eligible for Federal-aid funding.
6 http://www.tfhrc.gov/pavement/ltpp/reports/03031/03031.pdf

Appendices
Section 01: Glossary
Updated 10/16/2012 Return to Table of Contents 9-13
9.01.02.04 Reactive Maintenance Terms
9.01.02.04.01 Routine Maintenance Routine maintenance consists of day-to-day activities that are scheduled by maintenance personnel to maintain and preserve the condition of the highway system at a satisfactory level of service. Examples of pavement-related routine maintenance activities include cleaning of roadside ditches and structures, maintenance of pavement markings, pothole patching and isolated overlays. Routine Maintenance activities are “in-house” or agency-performed and are not normally eligible for Federal-aid funding. 9.01.02.04.02 Corrective Maintenance Corrective maintenance activities are generally reactive, not proactive, and are performed to restore a pavement to an acceptable level of service due to unforeseen conditions. Activities such as pothole repair, patching of localized pavement deterioration (e.g. edge failures and/or grade separations along the shoulders, are considered examples of corrective maintenance of flexible pavements). Examples for rigid pavements might consist of joint replacement, concrete patching or full-width and depth slab replacement at isolated locations. 9.01.02.04.03 Catastrophic Maintenance Describes work activities generally necessary to return a roadway facility back to a minimum level of service while a permanent restoration is being designed and scheduled. Examples of situations requiring catastrophic pavement maintenance activities include concrete pavement blow-ups, road washouts, avalanches, or rockslides.
Appendices
Section 01: Glossary
Updated 10/19/2012 Return to Table of Contents
9-14
9.01.03 Acronyms
1. ADT: Average Daily Traffic 2. ASR: Alkali Silica Reactivity 3. CSAB: Cement Stabilized Aggregate Base 4. CIR: Cold In-Place Recycling 5. CRCP: Continuously Reinforced Concrete Pavement 6. DOT: Department of Transportation 7. EGD: Engineering Geology Division 8. FCI: Functional Cracking Index 9. FED: Field Explorations Division 10. FDR: Full-Depth Reclamation 11. FGR: Final Geotechnical Report 12. FWD: Falling Weight Deflectometer 13. GAB: Graded Aggregate Base 14. GAP – SMA: Gap Graded Stone Matrix Asphalt 15. GDR: Geotechnical Data Report 16. GPR: Ground Penetrating Radar 17. HDFV: High Dynamic Friction Value 18. HHD: Highway Hydraulics Division 19. HIR: Hot In-Place Recycling 20. HLR: Highway Location Reference 21. HMA: Hot-Mix Asphalt 22. HPV: High Polish Value 23. IRI: International Roughness Index 24. JPCP: Jointed Plain Concrete Pavement 25. JRCP: Jointed Reinforced Concrete Pavement 26. LKD: Lime Kiln Dust 27. MDSHA: Maryland State Highway Administration 28. MOT: Maintenance of Traffic 29. OGFC: Open Graded Friction Course 30. OHD: Office of Highway Design 31. OMT: Office of Materials Technology 32. OOS: Office of Structures 33. PAGD ADC-Design: Pavement and Geotechnical Division – Assistant Division Chief
– Design 34. PAGD DC: Pavement and Geotechnical Design - Division Chief 35. PAGD Engineer: Pavement and Geotechnical Design Engineer 36. PAGD TL: Pavement and Geotechnical Design Team Leader 37. PAGD: Pavement and Geotechnical Division 38. PCC: Portland Cement Concrete 39. PM: Project Manager 40. PM Base: Pavement Management Database 41. RCC: Roller Compacted Concrete 42. RQD: Rock Quality Designation 43. SATD: Soils and Aggregate Testing Division 44. SCI: Structural Cracking Index 45. W/L: Wedge and Level

Appendices
Section 02: Geotechnical Investigation Equipment
Updated 11/26/2013 Return to Table of Contents
9-15
9.02 GEOTECHNICAL INVESTIGATION EQUIPMENT A wide variety of equipment is available for performing borings and obtaining soil samples. The method used to advance the boring should be compatible with the soil and groundwater conditions to assure that soil samples of suitable quality are obtained. For more information on types of equipment available to perform borings and obtaining samples, refer to: 1. Federal Highway Administration and National Highway Institute, “Subsurface
Investigation Qualification” FHWA NHI 132079.
2. Federal Highway Administration and National Highway Institute, “Subsurface Investigations – Geotechnical Site Characterization” FHWA NHI 132031, Chapter 3.0 and Chapter 5.0.
3. “Geotechnical Engineering Circular No. 5 - Evaluation of Soil and Rock Properties”, FHWA-IF-02-034, Chapter 4.0.

Appendices
Section 03: Laboratory Testing Procedures
Updated 11/26/2013 Return to Table of Contents
9-16
9.03 LABORATORY TESTING PROCEDURES
Laboratory testing of soil samples recovered during subsurface explorations is the most common technique to obtain engineering properties necessary for design. Following references provides information on common laboratory test methods for soil including testing equipment, general procedures related to each test, and parameters measured by the tests: 1. ASTM (1997). Annual Book of ASTM Standards. American Society for Testing
and Materials, Philadelphia, Penn. 2. American Association of State Highway and Transportation Officials (AASHTO)
(1986). “Standard Specifications for Transportation Materials and Methods of Sampling and Testing, Part I, Specifications, 14th ed.” AASHTO, Washington, D.C.
3. AASHTO (1992). “Standard Specifications for Transportation Materials and
Methods of Sampling and Testing, Part II, Tests.” Washington, D.C. 4. Federal Highway Administration and National Highway Institute, “Subsurface
Investigation Qualification” FHWA NHI 132079. 5. Federal Highway Administration and National Highway Institute, “Subsurface
Investigations – Geotechnical Site Characterization” FHWA NHI 132031 Chapter 7.0.
6. “Geotechnical Engineering Circular No. 5 - Evaluation of Soil and Rock
Properties”, FHWA-IF-02-034, Chapter 4.0.
Appendices
Section 04: Geotechnical Instrumentation
Updated 11/26/2013 Return to Table of Contents
9-17
9.04 GEOTECHNICAL INSTRUMENTATION
The most common geotechnical instrumentation specified to monitor foundation movement and performance on highway projects where stability and settlement are a concern consists of:
Slope Inclinometers
Piezometers
Settlement Devices. For a detailed explanation on geotechnical instrumentation, refer to: 1. Federal Highway Administration and National Highway Institute, (1998),
“Geotechnical Instrumentation”, FHWA HI-98-034.
2. OMT Technical Bulletin Vol. 9, September 2007 “Geotechnical Instrumentation- the eyes and ears of geotechnical engineers”
.

Appendices
Section 05: Forms, Spreadsheets & Reference Guidelines
Updated 03/10/2014 Return to Table of Contents
9-18
9.05 FORMS, SPREADSHEETS & REFERENCE GUIDELINES Click to go to Site Reconnaissance Click to go to Requests For Geotechnical Field work Click to go to Requests for Lab Work Click to go to Pre-Rehabilitation Effect on RSL Calculations Click to go to Pavement Type Selection Click to go to Geotextiles/Geosynthetics (Geotextile) Click to go to Management Review & QA Click to go to Paper Files and Plan Storage
9.05.01 Forms
In order to standardize pavement data collection, analysis and design efforts, several forms, reference guides and spreadsheets were collected or developed for pavement designers to use while developing pavement and geotechnical recommendations. These are referred to and described in the procedures throughout this pavement design guide. The following table lists all the current Forms:
Form Form Name Purpose
PD-01 Condition Summary Form Estimate
PD-02 Treatment Option Discussions with District Design
PD-03 IRI Profiling Request Request
PD-04 Field Testing Request Form Request
PD-05 Summary of Geotechnical Design Elements and Delegation
Design
PD-06 Pavement Design QAQC Form – Non Fund 77 QA
PD-06 Fund 77 Pavement Design QA Form – Fund 77 QA
PD-07 Boring Request Checklist Design
PD-08 Soil Survey Request Form Request
PD-08a Soil Survey Notes Example Request
PD-09 SPT Boring Request Form Request
PD-09a SPT Boring Criteria Example Request
PD-10 Laboratory Test Request Form Request
PD-11 Ride Quality Specification Pay Limit Form Design
PD-12 Pavement Patching Survey Form Patching
PD-13 Pavement Type Selection Process Form Design
9.05.02 Reference Guidelines Click to go to gINT Instructions Click to go to Geotextiles/Geosynthetics (Geotextile) Click to go to Laboratory Data – Design-Build Projects Click to go to Soil Survey Borings – Design-Build Projects Click to go to Cut Slope Design (Soil and Rock) Click to go to Pavement Type Selection
The following table lists current Reference Guidelines:
Reference Guideline
Reference Guideline Name
REF-01 gINT V8i Standards
REF-02 gINT_Input_Guidelines_DRAFT

Appendices
Section 05: Forms, Spreadsheets & Reference Guidelines
Updated 03/10/2014 Return to Table of Contents
9-19
Reference Guideline
Reference Guideline Name
REF-03 Guidelines for Selecting Geotextiles
REF-04 Guidelines for Using Microsoft Excel Macro for laboratory data
REF-05 Guidelines for using Microsoft Excel Macro for soil survey borings
REF-06 Category Code Numbers
REF-07 Cut Slope Design
REF-08 How to Access AsBuilts 1-2-3
REF-09 Slopes & Drainage Cheat Sheet
REF-10 Users Guide (SWM tool)
REF-11 Asphalt Distress Paver Manual
REF-12 Concrete Distress Paver Manual
REF-13 Commonly Used Pavement Details – MS Word
REF-14 Commonly Used Pavement Details – MicroStation
REF-15 LCCA Files
REF-16 GPR Instructions
9.05.03 Pavement Design Spreadsheets
The following table lists current Spreadsheets:
Spreadsheet Spreadsheet Name
PDS-01 PE Cost Estimate
PDS-02 Traffic Calculations
PDS-03 Costs & Quantities
PDS-04 Class 1-A Computations
PDS-05 Family of Curves
PDS-06 SPT to CBR to Mr
PDS-07 Truck Factor Calculations
PDS-08 Project-Level RSL Calculations
PDS-09 Automated Project-Level Design Help

Appendices
Section 06: Example Memos
Updated 03/31/2014 Return to Table of Contents
9-20
9.06 EXAMPLE MEMOS Click to go to Preliminary Engineering Cost Estimate Click to go to Preliminary Pavement Recommendation Click to go to Advanced Geotechnical Report Click to go to Final Pavement & Geotechnical Report Click to go to Topsoil Memo Click to go to Other Reports Click to go to Construction and Material Specifications Click to go to Management Review & QA In order to standardize reports and memoranda to ensure that they are as complete as possible, several templates were developed for pavement designers to use while developing pavement and geotechnical recommendations. These examples are referred to and described in the procedures throughout this pavement design guide. The following table lists all the current Memoformats and their purposes:
Form Report/Memo Name
RPT-01 Preliminary Engineering Cost Estimate
RPT-02 Advanced Geotechnical Report
RPT-03 Preliminary Pavement Recommendation
RPT-04 Final Pavement Memo (Fund 77)
RPT-05 Final Pavement & Geotechnical Report (Non-Fund 77)
RPT-06a Design-Build Cover Letter
RPT-06b Design-Build TC 3.10
RPT-06c Design-Build TC 3.10.06
RPT-06d Design-Build TC 3.14
RPT-06e Design-Build Data Attachments
RPT-07 Topsoil Memo
RPT-08 Pavement Core Log Example
RPT-09 Soil Boring Log Example
RPT-10 Chemical Results Sheet Example
RPT-11 Water Chemical Test Sheet Example
RPT-12a LCCA-PTSP Letter to HMA Industry seeking input
RPT-12p LCCA-PTSP Letter to PCC Industry seeking input
RPT-13 LCCA-PTSP Outcome Memo to SHA PTST
RPT-13a LCCA-PTSP Outcome Letter to HMA Industry
RPT-13p LCCA-PTSP Outcome Letter to PCC Industry
RPT-14 Fund 77 Preventive Maintenance Memo Template
RPT-15a Preliminary Recs Areawide Mother Contract Memo
RPT-15b XX projects Preliminary Recommendations for Mother Contract
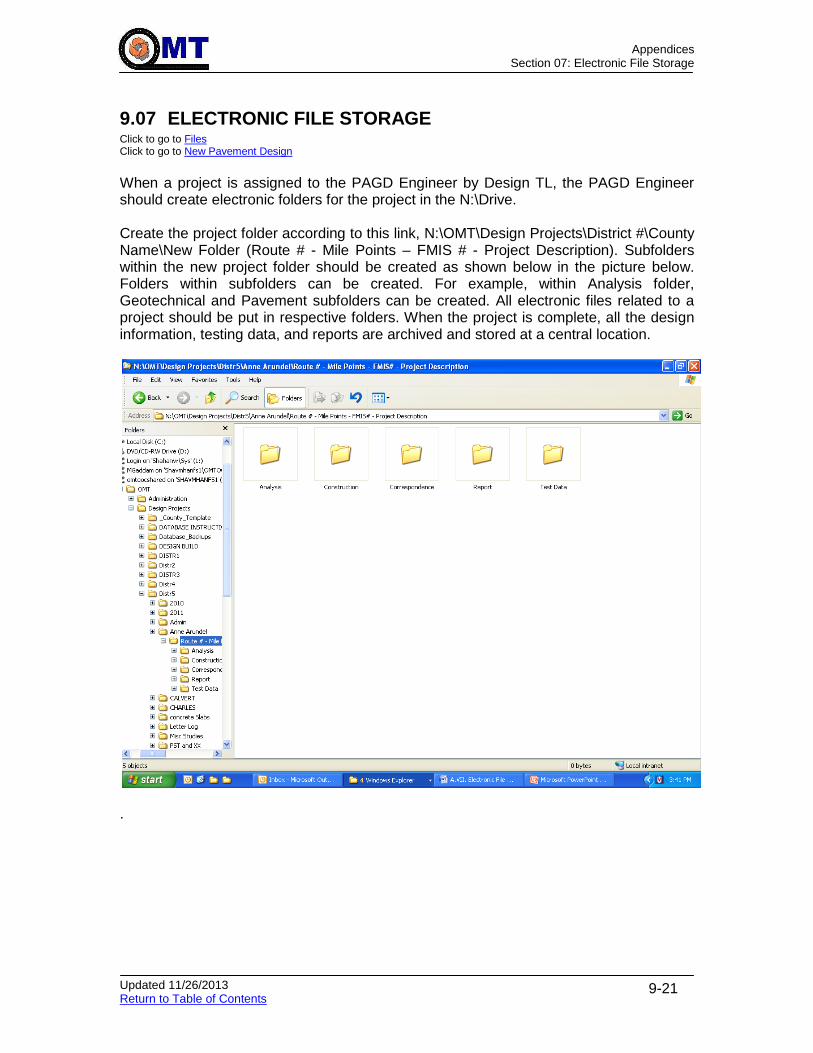
Appendices
Section 07: Electronic File Storage
Updated 11/26/2013 Return to Table of Contents
9-21
9.07 ELECTRONIC FILE STORAGE Click to go to Files Click to go to New Pavement Design
When a project is assigned to the PAGD Engineer by Design TL, the PAGD Engineer should create electronic folders for the project in the N:\Drive. Create the project folder according to this link, N:\OMT\Design Projects\District #\County Name\New Folder (Route # - Mile Points – FMIS # - Project Description). Subfolders within the new project folder should be created as shown below in the picture below. Folders within subfolders can be created. For example, within Analysis folder, Geotechnical and Pavement subfolders can be created. All electronic files related to a project should be put in respective folders. When the project is complete, all the design information, testing data, and reports are archived and stored at a central location.
.

Appendices
Section 08: Paper Files and Plan Storage
Updated 01/06/2014 Return to Table of Contents
9-22
9.08 PAPER FILES AND PLAN STORAGE Click to go to Files Click to go to Management Review & QA
9.08.01 Procedure
1) Project File Folder Set-Up and Identification
Folder Type: Six Section file folder
Folder Tab
Project identifiers on folder tab should be County – Route - Milepoints
Folder Front Cover
Project identifiers on front cover should be Project Description – Contract # - FMIS Charge #
2) Organization of Project File Folders for PAGD
In some cases due to the volume and design information, more than one physical file maybe needed, but it will be viewed as one project folder in the file room log. The final project file folder will broken out into the following six sections:
Section Heading Typical Contents
1. Design QA and summaries
PD Forms 2, 6, 11, PDS-08
2. Reports Memoranda or reports issued by PAGD
3. Correspondence All info to be stored in chronological order :
Letters from requesting division
Printouts of project related e-mails
Correspondence after Final Review and Addendum information
Notes from all meetings attended
4. Records Review PDS Spreadsheets 2, 7
Traffic and Loadometer data
Construction history, as-built project data
Field and office review notes
Performance Data (IRI, Rutting, Friction, Cracking, etc.)
HLR sheet(s)
Nearby or previous project data, Other background information
HO MD 32 MP (6.45 - 7.65)
MD 32 from US 29 to Brokenland Pkwy Contract # HO8255176
Charge # HO825B21

Appendices
Section 08: Paper Files and Plan Storage
Updated 01/06/2014 Return to Table of Contents
9-23
Section Heading Typical Contents
5. Field and Lab Data
PD Forms 1, 3, 4, 7-10, 12
Pavement Core Logs
GPR Results
Soils Lab testing results
6. Design/Analysis PDS Spreadsheets 1, 3-6, 8
Pavement design outputs (including RSL Calculations and AASHTO ME design outputs)
Cut/Fill quantity calculations
Soil property information – shrinkage factors, in-situ moisture, densities
Data Analysis calculations/outputs
Geotechnical design outputs
3) Organization of Project File Folders
All project file folders are stored by County, Route Number, Route (IS/MD/US), Route Suffix (AL/BU/SC) and Mile points in PAGD file room.
Project files without a route number (county roads, etc.) will be filed at the end of the county in alphabetical order by road name or project location. 4) Organization of Project Plans
All project plans are stored by District. Keep plans according to District area in PAGD file room, and document in Projects Database where they are located. 5) Plan Identification
Plan identification information should be written on the outside of all plans. The identification information should include the following: – Project Limit Description – Contract # and FMIS # or Charge # – Type of plans – (PI, Semi-Final, Final, Addendum, Red Line, etc.) 6) Life Cycle of Project Plans
Project plans should remain in the possession and the responsibility of the designer throughout the design process. For all active projects, PI plans should remain in the possession of the designer until semi-final or final review plans become available. At that time, the new plans should be checked to verify that comments and corrections were made. If corrections and/or additions have been made, then the older set of plans can be recycled. Field set of plans should not be recycled, unless all information on the field set is recorded in a future version. This sequence of recycling older sets of plans after proper verification should continue until the project is ready for archive.
MD 32 from US 29 to Brokenland Pkwy Contract # HO8255176 Semi-Final Plans
Date ?

Appendices
Section 09: Contractor Requests
Updated 11/26/2013 Return to Table of Contents
9-24
9.09 CONTRACTOR REQUESTS
The Contractor can request to review the project related data after Advertisement. Generally, the project related data includes the following: 1. Soil or rock samples 2. Monitoring Well Data, if not included in the Contract Document 3. Copy of the Site Assessment Report for potential hazards and hazardous site on
the project is available for review only during the bidding process 4. A copy of the Site Assessment Report will be furnished to the successful bidder The Contractor should make a request, preferably by a letter/memo addressed to OMT - Director, to review or get access to the project related data after advertisement. PAGD Engineer to discuss the request with PAGD TL to fill out the paper work to process the Contractor’s request.
Appendices
Section 10: Unit Costs
Updated 12/06/2012 Return to Table of Contents
9-25
9.10 UNIT COSTS Click to go to Table C. List of Treatment Options
The cost of materials and construction operations is a critical element in determining the most beneficial and cost effective pavement recommendation for MDSHA projects. The unit costs of particular construction materials and operations have been used extensively in life cycle costs analysis (LCCA) procedures like the MDSHA process described in Pavement Type Selection. The MDSHA Pavement and Geotechnical Division of OMT has taken the unit cost information beyond LCCA for use in determining the most economical rehabilitation alternatives for MDSHA. This approach is documented in several areas of Pavement Preservation, Rehabilitation & Design. The Pavement Management Section of the Pavement & Geotechnical Division maintains a database of pavement-related materials and operations. These include special items and “write-in” items for unit prices. All unit prices are extremely dependent on the quantity of material in the project. Actual prices will vary widely depending on the contractor and their approach to bidding and figuring profit in various project items. During a partnering effort with both the flexible and rigid pavement industries to develop a pavement type selection process, a significant amount of analysis was done in the unit costs area. A three-year running average is calculated for various material and construction items for LCCA purposes. The current prices for some items may be different than the 3-year average, but an average of this length provides adequate data to develop trends and bridge across short term spikes in prices. The Unit Price table located on the OMT network provides the latest average unit prices.
Appendices
Section 11: FWD Data Analysis
Updated 09/26/2013 Return to Table of Contents 9-26
9.11 FWD DATA ANALYSIS BACKGROUND Click to go to FWD Data Analysis Procedure
9.11.01 Purpose
FWD Data Analysis is conducted to:
Verify the accuracy of FWD Data
Sub-section the FWD data in analysis sections
Determine general characteristics of analysis sections
Determine the structural capacity of the pavement structure, individual pavement layers and subgrade
Estimate the load transfer ability of joints in jointed rigid and composite pavements
Report FWD analysis results in a form conducive to pavement rehabilitation design
9.11.02 Resource Requirements
The FWD Analysis procedure documented below requires the following staffing needs for a typical job:
Position Function Resources Effort Level (man-hours)
Staff Engineer or Project Engineer Quality Control of FWD Data 1 1
Staff Engineer or Project Engineer Pre-Process FWD Data 1 1
Staff Engineer or Project Engineer Backcalculation Analysis of FWD Data
1 2
Staff Engineer or Project Engineer Quality Assurance of Backcalculation Analysis
1 1
Staff Engineer or Project Engineer Reporting/Summary of Analysis Results
1 1
9.11.03 Procedure
The basic concept of FWD testing is to simulate typical traffic loads and monitor the deflection response of the pavement structure from that load. FWD analysis is the science of taking recorded deflections and loads and using knowledge of pavement material characteristics to estimate the existing material properties of the pavement structure.
The primary data collected from FWD testing is a measured vertical load and the resulting deflections in the pavement surface measured at radial distances from the load. The largest deflection from the load occurs under the load plate and decreases outwardly from the load plate. Deflections under the load plate provide an indication of the material properties of all the layers at that location. As recorded deflections move further away from the load plate, the data is representative of the layers deeper into the pavement structure with less influence from the layers near the surface.
This concept is presented in the following figure:
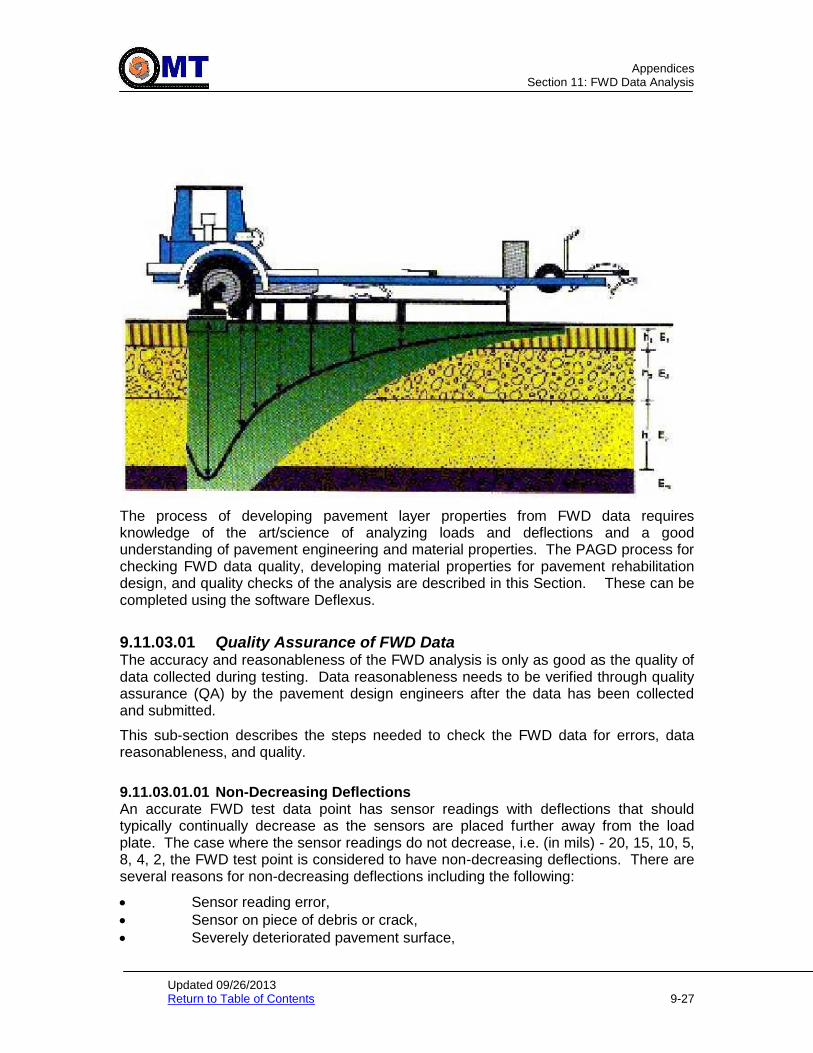
Appendices
Section 11: FWD Data Analysis
Updated 09/26/2013 Return to Table of Contents 9-27
The process of developing pavement layer properties from FWD data requires knowledge of the art/science of analyzing loads and deflections and a good understanding of pavement engineering and material properties. The PAGD process for checking FWD data quality, developing material properties for pavement rehabilitation design, and quality checks of the analysis are described in this Section. These can be completed using the software Deflexus.
9.11.03.01 Quality Assurance of FWD Data The accuracy and reasonableness of the FWD analysis is only as good as the quality of data collected during testing. Data reasonableness needs to be verified through quality assurance (QA) by the pavement design engineers after the data has been collected and submitted.
This sub-section describes the steps needed to check the FWD data for errors, data reasonableness, and quality.
9.11.03.01.01 Non-Decreasing Deflections An accurate FWD test data point has sensor readings with deflections that should typically continually decrease as the sensors are placed further away from the load plate. The case where the sensor readings do not decrease, i.e. (in mils) - 20, 15, 10, 5, 8, 4, 2, the FWD test point is considered to have non-decreasing deflections. There are several reasons for non-decreasing deflections including the following:
Sensor reading error,
Sensor on piece of debris or crack,
Severely deteriorated pavement surface,

Appendices
Section 11: FWD Data Analysis
Updated 09/26/2013 Return to Table of Contents 9-28
Pavement change boundary within range of sensors. 9.11.03.01.02 Out of Range Errors Each sensor on the FWD that records deflection has a total range of vertical movement available for recording data. An “out of range” error occurs when the maximum vertical movement of the sensor has been exceeded. The FWD software that collects the test data also recognizes the fact that the maximum sensor measurement has been exceeded and tags an “out of range” error along with the specific test point data for that sensor. There are several reasons for “out of range” deflections including the following:
Sensor reading error,
Severely deteriorated pavement surface,
Weak structural capacity of the pavement structure,
Load applied to pavement is too great for existing structure.
The FWD test points with an “out of range” error will be shown with an “out of range” error in the “Error Comments” field. These points shall be eliminated as outliers by un-checking them in the Raw Data field so that they are not used any further in the analysis. If a significant number of out of range errors are encountered during testing, the load package may need to be lowered because the load may be too great for the existing pavement structural capacity. If the load package is not altered in the field and cores indicate a thin pavement structure, additional testing at a lower load may need to be completed.
9.11.03.02 Pre-Process FWD Data Once FWD data has been ensured for reasonableness and accuracy, the data is further processed to arrange it into logical and manageable sub sets that will be used to complete the data analysis. The outline steps in this sub-section are designed to assist the pavement designer to filter out the most beneficial FWD test data and establish sections for further analysis. Analysis sections are pavement sections with similar pavement structures and similar performing pavement materials properties.
9.11.03.02.01 Select FWD Load The typical roadway load plate is approximately 5.91” in radius and is designed to mimic the contact area patch of a dual tire load from an 18-kip axle. Therefore, to simulate an 18-kip axle load, the 9,000-pound load level or FWD drop height #2 should be used in FWD analysis. In some cases in the MDSHA roadway network, the pavement structure is significantly thick and a 9,000-pound load will not allow a sufficient amount of load to be transferred to the lower layers in the pavement structure. In these cases, a larger load applied should be analyzed in addition to the 9,000 pound load. Guidelines for the designer to select the appropriate FWD load package are outlined in Falling Weight Deflectometer (FWD) Testing.
A deflection versus station plot allows the designer to identify weak areas and to delineate sections that are performing differently. In order to view a deflection versus station plot accurately, every load should be normalized to the same standard load. Although the same drop height maybe applied to consecutive points, the actual measured applied load may vary due to slight variations in the pavement structure and FWD mechanical equipment. Normalizing the deflections will eliminate these slight changes in load allow numerous test points to be compared equally. The collected

Appendices
Section 11: FWD Data Analysis
Updated 09/26/2013 Return to Table of Contents 9-29
deflection is converted into normalized deflection by equating the measured load to a normal load. The following equation shows the process to normalize a deflection to 9,000 pounds:
Measured Load = 9,252# Measure Deflection = 15.2 mils
Normal Load = 9,000#
Normalized Deflection = 15.2 * (9,000 / 9,252) = 14.8 mils
Several different drop heights are typically recorded at each test point. Some materials behave differently depending on the amount of load that applied; these are called “stress sensitive” or “non-linear” materials. Therefore, a stress-sensitive pavement structure can be identified if two separate FWD data analysis runs with different load levels result in different material properties at the same test point. If different loads result in similar FWD data analysis results, then the pavement layers can be considered not to contain stress sensitive material. In either case, the selection of one, several, or all the load levels applied to the pavement via the FWD need to be selected and filtered for analysis.
9.11.03.02.02 Composite Modulus Plots The composite modulus of a pavement structure is a single-value representation of the overall pavement stiffness based on the modulus of elasticity of all the pavement layers at a given point and radial distance from the load plate. The composite modulus is a computed value based on the applied load, plate radius, sensor spacing, measured deflection, and an assumed Poisson ratio of the entire pavement structure. A composite modulus can be calculated for every test point at each sensor. The composite modulus is typically reported graphically to allow the designer to identify erroneous data or non-linear subgrade.
The composite modulus derived from the sensor directly under the load provides a representation of the stiffness of all the pavement layers as a single layer system. The composite moduli derived from the outer sensors lose the contributing effect of the stronger upper layers of the pavement while maintaining the influence of the subgrade and lower layers. Therefore, the composite modulus plot of all of the sensors from a test point should have a general decreasing or “half bowl” shape as the distance from the

Appendices
Section 11: FWD Data Analysis
Updated 09/26/2013 Return to Table of Contents 9-30
load increases. Sharp fluctuation or an irregular shaped composite modulus plot may indicate an erroneous test point. The following two plots show a typical and an irregular shape composite modulus plot.
The shape of the composite modulus plot can help to identify the presence of non-linear materials and subgrade. This is possible because the sensors further away from the load provide an indication of the material properties and behavior of the lower pavement layers and subgrade. The load experienced by the outer sensors decreases as the distance from the load increases.
Stress sensitive materials can either increase or decrease in strength as the stress applied to the material increases. Typically with the materials in Maryland, the strength or stiffness of a stress sensitive or non-linear subgrade is inversely proportional to the amount of the applied load. Therefore, a non-linear subgrade will appear to have a higher modulus with a lighter load and as the applied load increases, the weaker the non-linear subgrade behaves.
The composite modulus plot allows the designer to identify non-linear subgrade because the amount of load decreases as the distance from the load increases and because the composite modulus is a numerical representation of the pavement stiffness at varying depths. Therefore, if the composite modulus begins to increase at the outer sensors, it is an indication of a non-linear subgrade. This is because the load is decreasing at the outer sensors, yet the composite modulus is increasing. The following composite modulus is an example of plot displaying a pavement structure with a non-linear subgrade.

Appendices
Section 11: FWD Data Analysis
Updated 09/26/2013 Return to Table of Contents 9-31
Knowledge of the expected FWD data analysis tool and its specific technique for estimating the subgrade modulus are necessary when evaluating composite modulus plots. Most FWD data analysis tools use some type of combination of the outer sensor deflection and algorithms to estimate the subgrade modulus.
In the case that a non-linear subgrade is present, the estimated subgrade modulus would be too great if the last sensor were used in the calculation. The last sensor reading from a test point with a non-linear subgrade would be falsely greater because of the soil behaving differently at varying loads. In the case of a pavement structure with a non-linear subgrade as we have in the previous plot, the subgrade modulus estimated from data collected from the sensor at 36” would produce a more representative subgrade modulus. The sensor reading at 36” provides a deflection based on the soil behaving with the highest encountered load.
In the case of the non-linear subgrade shown in the previous plot, the last 2 sensors would not be used in the analysis to develop layer properties. Typically, all software applications used for FWD data analysis need at least sensors out to 36” in order to perform their internal algorithms.
9.11.03.02.03 Delineate Distinct Sections The FWD data collection software stores both test type and specific test point header information. The header information can be used to sort out specific details of a particular test point or a group of similar test points. The ability to sort out particular tests allows the pavement designer to analyze specific data points or areas of interest for rehabilitation design. This type of header information includes, but is not limited to, the following:
Test Type – Joint, Basin, Void, Subgrade
Test Lane – 1, 2, 3, …..
Field Comments – FWD operator provides input about particular test point operations and pavement conditions

Appendices
Section 11: FWD Data Analysis
Updated 09/26/2013 Return to Table of Contents 9-32
9.11.03.02.03.1 Normalized Deflection Plots In addition to header information, the normalized deflection data can be used to delineate similar sections of project for FWD data analysis. The response of a pavement structure to a simulated traffic load can be used to identify thickness variations and areas of variability in material strengths. Variability in the pavement layer properties can be observed by observing a plot of the normalized deflections versus station. To better view the variations in material properties, each sensor can be viewed in a plot or only selected sensors. The most critical sensors to view in a normalized deflection plot are the sensors at the load plate and the sensor farthest away from the load. These two provide an indication of the overall pavement structure (load plate sensor) and of the subgrade (farthest sensor). The following plots are examples of normalized deflection plots versus station.
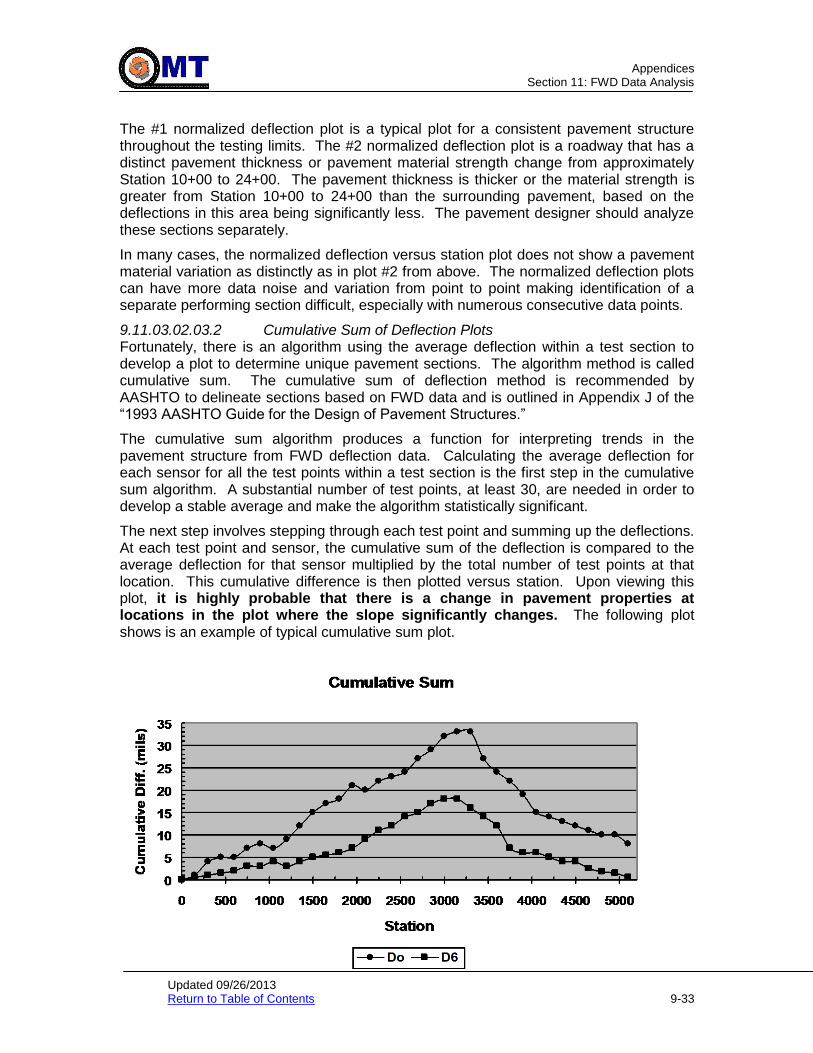
Appendices
Section 11: FWD Data Analysis
Updated 09/26/2013 Return to Table of Contents 9-33
The #1 normalized deflection plot is a typical plot for a consistent pavement structure throughout the testing limits. The #2 normalized deflection plot is a roadway that has a distinct pavement thickness or pavement material strength change from approximately Station 10+00 to 24+00. The pavement thickness is thicker or the material strength is greater from Station 10+00 to 24+00 than the surrounding pavement, based on the deflections in this area being significantly less. The pavement designer should analyze these sections separately.
In many cases, the normalized deflection versus station plot does not show a pavement material variation as distinctly as in plot #2 from above. The normalized deflection plots can have more data noise and variation from point to point making identification of a separate performing section difficult, especially with numerous consecutive data points.
9.11.03.02.03.2 Cumulative Sum of Deflection Plots Fortunately, there is an algorithm using the average deflection within a test section to develop a plot to determine unique pavement sections. The algorithm method is called cumulative sum. The cumulative sum of deflection method is recommended by AASHTO to delineate sections based on FWD data and is outlined in Appendix J of the “1993 AASHTO Guide for the Design of Pavement Structures.”
The cumulative sum algorithm produces a function for interpreting trends in the pavement structure from FWD deflection data. Calculating the average deflection for each sensor for all the test points within a test section is the first step in the cumulative sum algorithm. A substantial number of test points, at least 30, are needed in order to develop a stable average and make the algorithm statistically significant.
The next step involves stepping through each test point and summing up the deflections. At each test point and sensor, the cumulative sum of the deflection is compared to the average deflection for that sensor multiplied by the total number of test points at that location. This cumulative difference is then plotted versus station. Upon viewing this plot, it is highly probable that there is a change in pavement properties at locations in the plot where the slope significantly changes. The following plot shows is an example of typical cumulative sum plot.

Appendices
Section 11: FWD Data Analysis
Updated 09/26/2013 Return to Table of Contents 9-34
As with the normalized deflection plot, the cumulative sum plot can be done for any of the sensor locations, but the sensor at the load and farthest from the load are the most important to view initially. In the case of the plot above, two statistically homogeneous units can be identified. The change in pavement material properties is at approximately station 32+50. This change could be a difference in thickness or material strength properties. In either case, cores taken in both sections would verify the case and allow the pavement designer to analyze these sections separately for design.
9.11.03.03 Analysis of FWD Data The analysis of FWD data involves evaluating the measured load and resulting deflections to determine the material properties of the pavement structure. A typical “forward” material calculation requires knowledge of the material properties and the deflection is estimated based on the applied load. The use of FWD requires a “back” calculation method because the deflections and load are known and the material properties are estimated. This method of obtaining the material response and estimating the material properties is called “backcalculation.”
The FWD applies a simulated dual tire load to the pavement through a 12” diameter circular load plate for paved surfaces. The amount of load a particular pavement layer experiences is based on the depth of the layer in the pavement structure. The deeper a pavement layer is in the pavement structure, the less the amount of stress the layer is subjected to from the load. This decreasing stress is a result of the vertical load being distributed outwardly in a stress zone down and out from the load plate into the pavement structure.
The distribution of FWD load allows the individual pavement layer properties to be estimated through backcalculation. From the load plate, the load is distributed outwardly
and down into the pavement structure at approximately a 30 angle. This angle varies depending on the various layer properties. Directly under the load plate, the sensor deflection reading provides an indication of the layer properties of all the pavement layers at that point. The sensor deflection readings further away from the load plate provide an indication of the layer properties of the pavement layers deeper into the pavement at that point. This concept is presented in the following figure.
HMA/PCC
GAB/Base
Sensor at 0” Sensors Load Plate
Subgrade
Zone of Stress

Appendices
Section 11: FWD Data Analysis
Updated 09/26/2013 Return to Table of Contents 9-35
9.11.03.03.01 Flexible Standard Calculations The type of data analysis is dependent on the pavement type. Information about the structural capacity of the pavement can be obtained through FWD testing of flexible pavement. Subgrade strength values and overall composite modulus of the pavement structure can be obtained from flexible pavement FWD testing. These values can be used directly in pavement structural analysis to assist in determining the effective structural capacity. The following sub-sections describe the FWD data analysis procedures for flexible pavements.
9.11.03.03.01.1 Resilient Modulus of Subgrade Typically, subgrade resilient modulus results obtained from FWD testing will be less conservative and give higher results than those obtained in the laboratory. The difference in testing mechanisms between static laboratory testing and dynamic field testing will provide different strength properties of the subgrade. Therefore, any dynamic testing must be correlated to laboratory testing.
The AASHTO equation to calculate the subgrade resilient modulus from FWD testing is the following: Mr = (0.24 * P) / (dr * r) where: Mr = resilient modulus of the subgrade P = applied load , pounds dr = measured deflection at radial distance r, inches r = radial distance of measured deflection, inches The key to this equation is selecting the radial distance to ensure the measured deflection is due to the subgrade and not other layers, but yet close enough to the load plate to ensure data accuracy. The minimum distance can be determined using the following AASHTO equation:
r >= 0.7 * ae where: ae = radius of the stress bulb at the subgrade-pavement interface, inches The stress bulb is calculated using the following AASHTO equation:
2
3
r
p2e
M
E*Daa
where: a = FWD load plate radius, inches D = total pavement thickness of pavement layers above the subgrade, inches Ep = effective modulus of all pavement layers above the subgrade, psi
Based on the equations provided above, the resilient modulus cannot be calculated without the effective modulus of all pavement layers above the subgrade. Yet, the effective modulus of all pavement layers above the subgrade cannot be calculated without the subgrade resilient modulus. Therefore, an iterative process is required to obtain both values using the equations provided above. However, engineering judgment can be used coupled with information from composite modulus plots to estimate the sensor to use to obtain the resilient subgrade modulus.
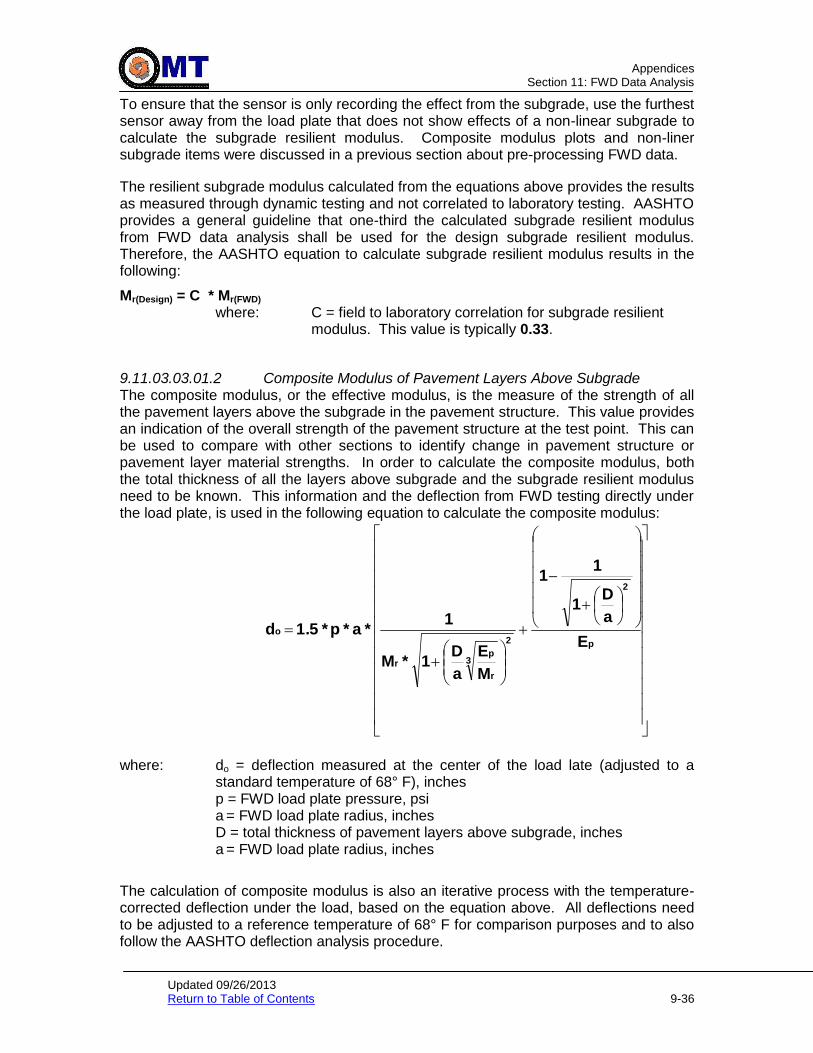
Appendices
Section 11: FWD Data Analysis
Updated 09/26/2013 Return to Table of Contents 9-36
To ensure that the sensor is only recording the effect from the subgrade, use the furthest sensor away from the load plate that does not show effects of a non-linear subgrade to calculate the subgrade resilient modulus. Composite modulus plots and non-liner subgrade items were discussed in a previous section about pre-processing FWD data.
The resilient subgrade modulus calculated from the equations above provides the results as measured through dynamic testing and not correlated to laboratory testing. AASHTO provides a general guideline that one-third the calculated subgrade resilient modulus from FWD data analysis shall be used for the design subgrade resilient modulus. Therefore, the AASHTO equation to calculate subgrade resilient modulus results in the following:
Mr(Design) = C * Mr(FWD)
where: C = field to laboratory correlation for subgrade resilient modulus. This value is typically 0.33.
9.11.03.03.01.2 Composite Modulus of Pavement Layers Above Subgrade The composite modulus, or the effective modulus, is the measure of the strength of all the pavement layers above the subgrade in the pavement structure. This value provides an indication of the overall strength of the pavement structure at the test point. This can be used to compare with other sections to identify change in pavement structure or pavement layer material strengths. In order to calculate the composite modulus, both the total thickness of all the layers above subgrade and the subgrade resilient modulus need to be known. This information and the deflection from FWD testing directly under the load plate, is used in the following equation to calculate the composite modulus:
p
2
2
3
r
pr
o
E
a
D1
11
M
E
a
D1*M
1*a*p*1.5 d
where: do = deflection measured at the center of the load late (adjusted to a
standard temperature of 68° F), inches p = FWD load plate pressure, psi a = FWD load plate radius, inches
D = total thickness of pavement layers above subgrade, inches a = FWD load plate radius, inches
The calculation of composite modulus is also an iterative process with the temperature-corrected deflection under the load, based on the equation above. All deflections need to be adjusted to a reference temperature of 68° F for comparison purposes and to also follow the AASHTO deflection analysis procedure.

Appendices
Section 11: FWD Data Analysis
Updated 09/26/2013 Return to Table of Contents 9-37
9.11.03.03.01.3 Temperature Correction Factor In order to allow to equal comparisons between FWD test points done at different under varying weather and temperature conditions, all test data needs to be corrected to a reference temperature. The material properties of a majority of pavement materials are temperature dependent; some material like hot mix asphalt are more temperature susceptible than other materials. The same flexible pavement structure may provide drastically different strength characteristics in Maryland at mid-day testing in August than in the morning testing in late October. Therefore, all FWD testing data must be corrected to a reference temperature of 68° F for valid comparison. There are two basic ways to correct for temperature, either the measured deflection can be corrected or the resulting calculated modulus could be corrected to the reference temperature. The equations used by AASHTO require the correction to occur for the deflection. Temperature correction curves for deflections are contained on pages III-99 and III-100 in the 1993 “AASHTO Guide for Design of Pavement Structures.” Deflexus uses these equations within the software calculations. These curves will be used to temperature correct deflection for MDSHA pavement design projects. The BELLS equation will be used to temperature correct the backcalculated modulus for MDSHA pavement design projects. The BELLS equation calculates the mid-depth HMA temperature and calculates an adjustment factor to be applied to the uncorrected layer modulus. 9.11.03.03.02 Rigid/Composite Standard Calculations Subgrade strength values, slab bending /compression factors, joint load transfer efficiency, void detection, and PCC material properties can be obtained from rigid and composite pavement FWD testing. These values can be used directly in pavement analysis to determine the effective structural capacity. The following sub-sections describe the FWD data analysis procedures for composite and rigid pavements.
9.11.03.03.02.1 Slab Bending Factor / AC Compression Factor The slab bending factor / AC compression factor (B) is used in the calculation of load transfer efficiency of joints in rigid and composite pavements; slab bending factor for rigid pavements and AC compression factor for composite pavements. This factor corrects for the differential bending of the slab under vertical loading in rigid and composite pavements. It also accounts for the compression of the AC material under loading in composite pavements. This correction is needed because of the slight slab bending that occurs even when testing sound concrete at the center of the slab. Even the deflections measured at the first 2 sensor locations at the center of a slab, with theoretically 100% load transfer efficiency, would not be equal. Several basin tests at the mid-slab away from the joints are needed to develop a reasonable bending factor (B). The bending/compression correction factor is obtained from the ratio of deflection under the load plate to the deflection 12” away from the center of the load plate, for a typical center slab location. Typical values for B range from 1.05 and 1.20. Values above 1.25 should be reconsidered prior to using for analysis based on reasonable data. It is reasonable and conservative to base all load transfer analysis on a bending factor equal to 1.0.

Appendices
Section 11: FWD Data Analysis
Updated 09/26/2013 Return to Table of Contents 9-38
9.11.03.03.02.2 Load Transfer MDSHA’s Pavement and Geotechnical Division uses load transfer information to assist in determining pre-overlay repair strategies. See the Joint Reflection section in Patching Guidelines for AC Surfaces. The deflection data can be used to calculate differential deflection, which may be more relevant to the rate of deterioration of joints and cracks and to the likelihood of reflection cracking in asphalt overlays. Differential deflection is the absolute difference between the loaded joint side deflection and the unloaded joint side deflection. 9.11.03.03.02.3 Void Detection Click to go to JPCP Layer Properties in the AC overlay over JCP section.
Void detection analysis is used to identify joints that have lost base material under the concrete slab. FWD testing for void detection involves corner testing at three load levels, typically 6, 9, and 12 kips; greater loads can be used depending on the thickness and type of pavement structure. The deflection versus load plot is produced for each test location in order to identify the presence of voids. If no voids exist, the slope of the line between the three load drop points will cross very near the origin (less than 2 mils). When the slope of the line crosses further away from the origin (greater than 2 mils), the presence of a void is expected. This method identifies the presence of a void, but does provide any indication as to the size of the void. The graphs below demonstrate this concept.

Appendices
Section 11: FWD Data Analysis
Updated 09/26/2013 Return to Table of Contents 9-39
9.11.03.03.02.4 Structural Capacity using the Area Method A simple two-layer pavement system approach to backcalculation of FWD data that is used to determine the structural capacity of rigid and composite pavements is the AREA method. Each FWD test measures the load and resulting deflection basin from that applied load. The size and shape of the deflection basin provides an indication of the structural capacity of the pavement structure at the test point. Therefore, the AREA method uses the deflection basin to calculate the pavement structural capacity. For rigid pavements, AREA is calculated with the following equation:
0
60
0
36
0
24
0
18
0
12
0
87
d
d*12
d
d*18
d
d*9
d
d*6
d
d*5
d
d*64AREA
where: d0 = deflection in center of load plate, inches di = deflection at 0, 8, 12, 18, 36, and 60 inches from load plate center, inches
AREA has units of length, not area, since each of the deflections is normalized with respect to the deflection under the load plate in order to remove the effect of different load levels and to restrict the range of values. For sound concrete, the AREA will range from 29 to 32. For composite pavements, AREA is calculated with the following equation:
12
60
0
36
12
24
12
185
d
d*12
d
d*18
d
d*9
d
d*63AREA
where: d0 = deflection in center of load plate, inches
di = deflection at 0, 8, 12, 18, 36, and 60 inches from load plate center, inches
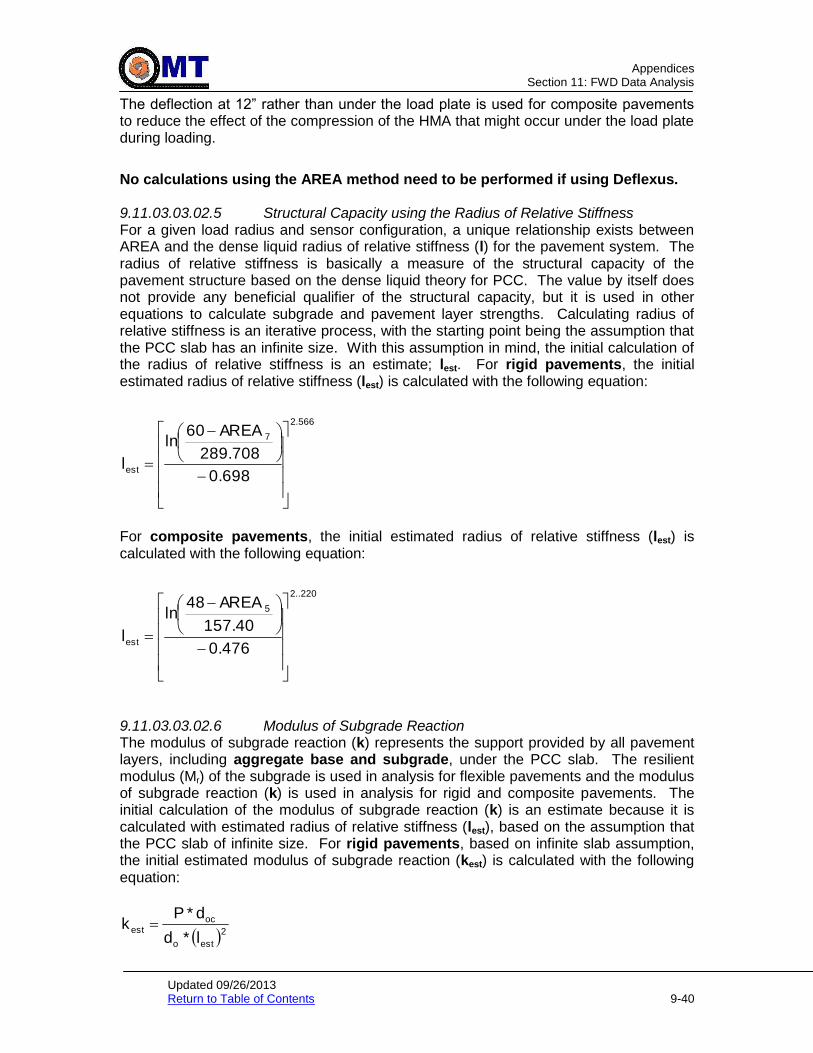
Appendices
Section 11: FWD Data Analysis
Updated 09/26/2013 Return to Table of Contents 9-40
The deflection at 12” rather than under the load plate is used for composite pavements to reduce the effect of the compression of the HMA that might occur under the load plate during loading.
No calculations using the AREA method need to be performed if using Deflexus. 9.11.03.03.02.5 Structural Capacity using the Radius of Relative Stiffness For a given load radius and sensor configuration, a unique relationship exists between AREA and the dense liquid radius of relative stiffness (l) for the pavement system. The radius of relative stiffness is basically a measure of the structural capacity of the pavement structure based on the dense liquid theory for PCC. The value by itself does not provide any beneficial qualifier of the structural capacity, but it is used in other equations to calculate subgrade and pavement layer strengths. Calculating radius of relative stiffness is an iterative process, with the starting point being the assumption that the PCC slab has an infinite size. With this assumption in mind, the initial calculation of the radius of relative stiffness is an estimate; lest. For rigid pavements, the initial estimated radius of relative stiffness (lest) is calculated with the following equation:
2.566
7
est0.698
289.708
AREA60ln
l
For composite pavements, the initial estimated radius of relative stiffness (lest) is calculated with the following equation:
2..220
5
est0.476
157.40
AREA48ln
l
9.11.03.03.02.6 Modulus of Subgrade Reaction The modulus of subgrade reaction (k) represents the support provided by all pavement layers, including aggregate base and subgrade, under the PCC slab. The resilient modulus (Mr) of the subgrade is used in analysis for flexible pavements and the modulus of subgrade reaction (k) is used in analysis for rigid and composite pavements. The initial calculation of the modulus of subgrade reaction (k) is an estimate because it is calculated with estimated radius of relative stiffness (lest), based on the assumption that the PCC slab of infinite size. For rigid pavements, based on infinite slab assumption, the initial estimated modulus of subgrade reaction (kest) is calculated with the following equation:
2esto
ocest
l*d
d*Pk

Appendices
Section 11: FWD Data Analysis
Updated 09/26/2013 Return to Table of Contents 9-41
where: kest = estimated backcalculated modulus of subgrade reaction
P = load, pounds do = deflection measured at the center of load plate, inch lest = estimated radius of relative stiffness, inches (see above) doc = nondimensional coefficient of deflection at center of plate
stel*0.07565
e*0.14707
e*0.1245ocd
For composite pavements, based on infinite slab assumption, the initial estimated modulus of subgrade reaction (kest) is calculated with the following equation:
2est12
12cest
l*d
d*Pk
where: d12 = deflection measured 12” from center of load plate, inch
d12c = nondimensional coefficient of deflection 12” from center of plate
stel*0.07074
e*0.79432
e*0.1218812c
d
As discussed previously, all the previous equations were based on the assumption of an infinite slab. The correction factor for the slab size is identified as, L. The next step is to correct for the size of slab in the pavement structure.
If length <= 2 * width, Width*LengthL
If length > 2 * width, 2*LengthL
There are two resulting adjustment factors based on the slab size correction factor, AFdo and AFl. The correction factor for the deflection under the load plate AFdo, for both rigid and composite pavements is the following equation:
0.80151
estl
L0.71878
e*1.15085-1o
dAF
The correction factor for the radius for relative stiffness AFl, for both rigid and composite pavements is the following equation:

Appendices
Section 11: FWD Data Analysis
Updated 09/26/2013 Return to Table of Contents 9-42
1.04831
estl
L0.61662
e*10.89434-1l
AF
The dynamic modulus of subgrade reaction, k, for both composite and rigid pavements, corrected for slab size, is the following equation:
od
AF*2l
AF
estk
k
Using the FWD data and performing a backcalculation analysis to obtain the modulus of subgrade reaction provides a result based on a dynamic load applied in the field. All AASHTO design equations were based on static loads applied in a laboratory. Therefore, to obtain a modulus of subgrade reaction design value for pavement design, the results obtained from backcalculation analysis must be corrected. Use the following equation to determine the design modulus of subgrade reaction (kdesign)
2
dynamick
designk
9.11.03.03.02.7 PCC Elastic Modulus The PCC elastic modulus is a required input for the AASHTO pavement design process. Use the following equation to calculate PCC elastic modulus:
3PCC
dynamick*20.151*12*
estl
pccE
where: PCC = thickness of PCC slab, inches
Epcc = Elastic modulus of PCC layer, psi
9.11.03.03.03 Backcalculation Software There are several backcalculation software applications available on the market today. MDSHA uses the backcalculation algorithms in the Deflexus software, which is based on the AASHTO deflection analysis procedures. Most of these procedures have been documented in this section earlier and can be replicated by hand without the assistance of a software application. The AASHTO deflection analysis procedures do not produce individual pavement layer moduli for flexible pavement, only a composite modulus for all layers. Other software applications are required if individual pavement layers strengths are desired.
Appendices
Section 11: FWD Data Analysis
Updated 09/26/2013 Return to Table of Contents 9-43
9.11.03.04 Quality Control of FWD Analysis In the same manner the quality of the data collected during deflection testing needs to be controlled for quality to ensure accurate pavement design recommendations, so does the results of the backcalculation analysis. FWD deflection analysis produces estimates of subgrade strengths, composite layer modulus (all layers), individual layer moduli, load transfer, void detection, and etc, all of which need to be verified for logical and reasonable results.
This sub-section describes the steps needed to check the FWD deflection analysis for backcalculation errors, data reasonableness, and quality. The following headings should be viewed, as the general steps needed to control the quality of the FWD deflection analysis.
9.11.03.04.01 Reasonable Layer Modulus Range The results produced from backcalculation analysis need to be reasonable for the type of material under investigation. The Material Properties section of the Material Library, Material Properties, of this pavement design guide should be used to determine the reasonable strength range for pavement materials used by MDSHA. In addition, these ranges should be used to confirm the reasonableness of analysis results involving the combining of several pavement layer materials into one value, i.e. composite modulus.
9.11.03.05 Reporting/Plots of FWD Data Analysis Results It is beneficial to present the results of FWD data analysis in a form that can be easily interpreted and presented to others not privy to the details of FWD data analysis. In addition, the task of formalizing the data into a presentable form will force the pavement designer to look over the data for errors and compile numerous data points into beneficial summary data results.
The following material properties from FWD data analysis are beneficial and informative for flexible pavements when plotted versus station:
subgrade resilient modulus (Mr),
backcalculated individual layer moduli. The following material properties from FWD data analysis are beneficial and informative for rigid or composite pavements when plotted versus station:
modulus of subgrade reaction, k
strength of PCC - elastic modulus of PCC elastic - Epcc
strength of PCC - modulus of rupture of PCC - S’c
load transfer differences
backcalculated layer moduli The following material properties from FWD data analysis are beneficial and informative for flexible pavements when presented in table form and broken out into different analysis sections or segments: mean, minimum, maximum, standard deviation of Mr and backcalculated layer moduli. The following material properties from FWD data analysis are beneficial and informative for rigid or composite pavements when presented in table form and broken out into different analysis sections or segments: mean, minimum, maximum, and standard deviation of k, Epcc, S’c, and backcalculated layer moduli.

Appendices
Section 12: New Pavement Design Using AASHTO 1993 Procedures
Updated 09/26/2013 Return to Table of Contents
9-44
9.12 NEW PAVEMENT DESIGN USING AASHTO 1993
Click to go to Pavement Mechanistic-Empirical Analysis Click to go to Pavement Preservation and Rehabilitation Design Using AASHTO 1993
9.12.01 Purpose
New pavement designs are conducted to:
Determine the future structural and functional demands of the new pavement necessary to support the expected traffic volumes
Identify the material requirements to provide a structurally and functionally adequate pavement system.
9.12.02 Resource Requirements
The new pavement design procedure documented below requires the following staffing needs for a typical job:
Position Function Resources Effort Level (man-hours)
Pavement Engineer Records Review 1 4
Pavement Engineer Site Visit 1 16
Pavement Engineer Data Analysis 1 16
Pavement Engineer Project Communication 1 16
Pavement Engineer New Design 1 8
Pavement Engineer Memo Development 1 24
9.12.03 Procedure
The procedure described in the following text should be followed in a typical new pavement design recommendation, and is intended for Design-Build projects, since the MEPD software cannot be used for those projects. For design-bid-build projects, refer to New Pavement Design.
Reference to specific design inputs for rehabilitation design development can be located in Design Input Policies. Numerous steps contained in this procedure can be completed within several software applications that PAGD currently uses. The software application tool available to PAGD that can be principally used to complete new pavement designs using the AASHTO 1993 procedures is DARWin. The following procedure was written to provide the design engineer with adequate information to complete a new design without specific knowledge or access to computer software applications, but with the assumption that these tools were available.
Certain steps in the new pavement design process and other processes overlap. It is important to keep in mind that although these processes are broken out and written in separate sections, they are a part of an overall process to provide logically and technically sound recommendations.
In most cases, a new pavement design is completed in conjunction with a pavement rehabilitation design; i.e. “widening and resurfacing.” Therefore, the new and rehabilitation design process will occur concurrently and use the same data and information. The basic difference is that pavement rehabilitation design requires the evaluation and assessment of the existing roadway, both structurally and functionally.

Appendices
Section 12: New Pavement Design Using AASHTO 1993 Procedures
Updated 09/26/2013 Return to Table of Contents
9-45
New pavement design does not take into account any of the existing conditions of the pavement other than geotechnical and drainage conditions because it is a new design.
It is the design engineer’s responsibility to use both design processes concurrently where needed and take care to monitor that both designs are agreeable with one another for design and for construction related reasons.
9.12.03.01 Preliminary Steps
Step 1. Conduct the steps as detailed in Preliminary Procedures.
Step 2. Conduct the steps as detailed in Testing & Data Collection.
Step 3. Conduct the steps as detailed in Analysis Procedures.
9.12.03.02 Design Inputs
Calculate the required structural capacity (SCf) for future traffic for each new pavement section. SCf is obtained from Figures 3.1 and 3.7 and the nomograph equations on page II-32 and II-45 in the “AASHTO Guide for Design of Pavement Structures”, for flexible and rigid pavement sections respectively. The following design inputs are required in order to use the nomograph or equation on pages II-32 and II-45:
Initial Serviceability: 4.2
Terminal Serviceability:
Interstates 3.0
Other Expressways and Principal Arterials 2.9
Minor Arterials 2.8
Collectors and Locals 2.6
Reliability:
Interstates 95
Other Expressways and Principal Arterials 90
Minor Arterials 85
Collectors and Locals 80
Standard Deviation: 0.49 for Flexible, 0.39 for Rigid
Design ESALs: Refer to Traffic Analysis.
Design Subgrade Resilient Modulus (Mr) – Obtained from geotechnical soils investigation for new pavement designs. Materials and Typical Design Properties includes default values for various types of subgrade materials.
Modulus of Subgrade Reaction (k) – Obtained from geotechnical soils investigation for new pavement designs. Materials and Typical Design Properties includes default values for various types of subgrade materials. The modulus of subgrade reaction can also be calculated following the procedures identified in Section 3.2.1 of Chapter II of the “AASHTO Guide for Design of Pavement Structures.”
Appendices
Section 12: New Pavement Design Using AASHTO 1993 Procedures
Updated 09/26/2013 Return to Table of Contents
9-46
J Factor (J) – 3.2
PCC Elastic Modulus (Epcc)– 57,000 x [Compressive Strength (psi) ^2]. Refer to Strength and Stiffness Properties.
PCC Modulus of Rupture (S’c)– Calculate the modulus of rupture based on the PCC elastic modulus using the following equation:
S’c = 43.5(Epcc)/1,000,000+488.5
Drainage Factor (Cd) – 1.0
Consider drainage treatments that would be appropriate improvements or repair strategies to address the source of any potential pavement or subsurface drainage concerns. Refer to Pavement Drainage and Subsurface Drainage.
9.12.03.03 Flexible Pavement Click to go to Pavement Preservation and Rehabilitation Design Using AASHTO 1993
Step 1. Identify the individual pavement layers and thickness that will provide the structural capacity to satisfy traffic demands represented by SCf. Use the following guidelines to determine the individual pavement layers and thickness:
Flexible Pavements: SCf = SNf
SNf <= a1*d1 + a2*d2 + aidi
where:
d = layer thickness; the thickness of each layer shall be rounded up in 0.5” increments for HMA and PCC materials and rounded up in 1.0” increments for all other materials.
a = layer structural coefficient: Refer to Design Properties for Pavement Materials – AASHTO 1993
9.12.03.04 Jointed Plain Concrete Pavement
Step 1. Identify the individual pavement layers and thickness that will provide the structural capacity to satisfy traffic demands represented by SCf. Use the following guidelines to determine the individual pavement layers and thickness: Rigid Pavements: SCf = Df Df <= d
Where d = PCC layer thickness; rounded up in 0.5” increments.
Step 2. Refer to Jointed Plain Concrete Pavement Design in the PMED section for other design parameters.

Appendices
Section 12: New Pavement Design Using AASHTO 1993 Procedures
Updated 09/26/2013 Return to Table of Contents
9-47
9.12.03.05 CRCP steel reinforcement design inputs – AASHTO 1993
The following are details of the CRCP steel reinforcement design input material properties if using AASHTO 1993 for inputs not listed in CRCP Layer Properties and Material Properties – Concrete:
PCC Indirect Tensile Strength: 0.86 x S’c. Refer to Tensile Strength Modulus of PCC.
PCC Shrinkage Factor: Refer to Drying Shrinkage Coefficient of PCC Slab
PCC Thermal Coefficient: Refer to Coefficient of Thermal Expansion
Reinforcing Bar Thermal Coefficient: Refer to Coefficient of Thermal Expansion
Design Temperature Drop: The design temperature drop is the difference between the average concrete curing temperature and a design minimum temperature. The average concrete curing temperature may be taken as the average daily high temperature during the month the pavement is expected to be constructed. The design minimum temperature is defined as the average daily low temperature for the coldest month during the pavement life.
Wheel Load Stress: The wheel load stress can be estimated using the graph presented on page II-55 in the “1993 AASHTO Guide for Design of Pavement Structures.”
Allowable Steel Stress: 75% of steel grade.
Allowable Crack Width: Make as close to 0.020 inches as the software will allow so that the maximum steel percentage is not less than the minimum.
Friction Factor: Refer to Friction Factor – AASHTO 1993.
Follow Section 3.4.3 of the AASHTO 1993 Guide for the Transverse Steel Reinforcement Requirements procedure.
9.12.03.06 Constructability
Step 1. The new pavement design shall be checked for constructability issues. For base widening and new pavement designs, care shall be taken to ensure that the new section does not affect the performance of the existing roadway; i.e. drainage problems from a “bathtub” effect or poor construction joint from different pavement types, etc. For new construction or reconstruction, care shall be taken to ensure that the pavement design can be constructed and perform well over the pavement service life; geometric and grade demands, MOT constraints, regional material constraints, etc.

Appendices
Section 13: Pavement Rehabilitation Design Using AASHTO 1993
Updated 10/10/2013 Return to Table of Contents 9-48
9.13 PAVEMENT PRESERVATION AND REHABILITATION DESIGN USING AASHTO 1993
Click to go to Pavement Mechanistic-Empirical Analysis
9.13.01 Purpose
Pavement preservation and rehabilitation designs are conducted to:
Identify the existing condition of the pavement
Identify the deterioration trend in the existing pavement
Determine the future structural requirements of the pavement
Determine the future functional requirements of the pavement
Determine the necessary improvements to the existing pavement
Identify the material requirements to improve the pavement following the Pavement Design Policies
Historically, the Maryland State Highway Administration (MDSHA) has relied almost exclusively upon rehabilitation strategies to maintain their pavement system. While rehabilitation is a valid strategy, it is not necessarily the most cost-effective strategy; quite often, the more cost-effective treatments to maintain the pavement system are pavement preservation treatments. Pavement preservation is an important facet of maintaining MDSHA’s roadways. However, the AASHTO 1993 methodology is not geared towards preservation. Refer to Pavement Preservation & Rehabilitation Design for preservation guidance. The purpose of this section is to provide general guidance on the selection of pavement preservation and rehabilitation treatments. This section will assist in determining “the right fix for the right road at the right time” when used in conjunction with network-level and project specific data. Step-by-step instructions on determining treatment options are provided through the use of flow charts, decision trees and treatment tables. At the end of the step-by-step process, many treatment options will be available, and ultimately the final treatment option(s) should be determined in a partnership between the districts and PAGD.
9.13.02 Resource Requirements
The pavement rehabilitation design procedure documented below requires the following staffing needs for a typical job:
Position Function Resources Effort Level (man-hours)
Staff Engineer or Project Engineer Records Review 1 2
Staff Engineer or Project Engineer Site Visit 1 8*
Staff Engineer or Project Engineer Data Analysis 1 16
Staff Engineer or Project Engineer Project Communication 1 8
Staff Engineer or Project Engineer Rehabilitation Design 1 12
Staff Engineer or Project Engineer Memo Development 1 24
* The time required would vary depending on the size, complexity and location of the project.
Appendices
Section 13: Pavement Rehabilitation Design Using AASHTO 1993
Updated 10/10/2013 Return to Table of Contents 9-49
9.13.03 Procedure
The procedure described in the following text should be followed in a typical new pavement design recommendation, and is intended for Design-Build projects, since the MEPD software cannot be used for those projects. For design-bid-build projects, refer to Pavement Preservation & Rehabilitation Design.
The procedure described in the following text should be followed in a typical pavement preservation or rehabilitation design recommendation. Reference to specific design inputs for design development can be located in Design Input Policies. Numerous steps contained in this procedure can be completed within several software applications that PAGD currently uses. The software application tool available to PAGD that can be principally used to complete pavement rehabilitation designs at this time is DARWin.
The following procedure was written to provide the design engineer with adequate information to complete a rehabilitation design with the assumption that these tools were available.
Certain steps in the pavement preservation and rehabilitation design process and other processes overlap. It is important to keep in mind that although these processes are broken out and written in separate sections, they are a part of an overall process to provide logically and technically sound recommendations.
9.13.03.01 Preliminary Steps
Step 1. If the project involves any base-widening, reconstruction, storm water management, embankment slopes, new construction, or has special soil issues, refer to New Pavement Design Using AASHTO 1993.
Step 2. Conduct the steps as detailed in Preliminary Procedures.
Step 3. Conduct the steps as detailed in Testing & Data Collection.
Step 4. Conduct the steps as detailed in Analysis Procedures.
9.13.03.02 Overlay Design – Existing Flexible Pavement
Step 1. Calculate original structural capacity (SNo) of each pavement analysis section.
SNo = a1*d1 + a2*d2 + aidi
where:
d = layer thickness
a = layer structural coefficient. Refer to Design Properties for Pavement Materials – AASHTO 1993
Construction History information and core results will assist the pavement designer in determining the age and thickness of pavement layers.)
Step 2. Calculate the effective structural capacity (SNeff) of each analysis section following the condition (visual survey) analysis approach. It is important to note that the visual survey approach only evaluates the condition of the pavement based on the visual observation of the surface. Use the following guidelines to determine SNeff following the visual condition survey analysis approach:

Appendices
Section 13: Pavement Rehabilitation Design Using AASHTO 1993
Updated 10/10/2013 Return to Table of Contents 9-50
Option 1:
SNeff = SNo * Cx
where:
Cx = Condition Factor from visual condition analysis (=< 1.0). To obtain Cx use the following equation:
Cx = (PCI / 100)^1/2
> 0.65
where:
PCI = Average PCI for analysis section.
Note: The engineer must determine if the majority of the distresses captured by the PCI are structural or functional. If they are structural, then the Cx factor should apply to the entire pavement structure. If they are functional, then the Cx factor should apply only to the top layer(s) as judged by the engineer.
Option 2:
SNeff = a1*d1 + a2*d2 + aidi
where:
d = layer thickness
a = layer structural coefficient (Follow guidelines established in by AASHTO found in Table 5.2 on page III-105 in the 1993 AASHTO Guide
Step 3. Calculate the effective structural capacity (SNeff) of each analysis section following the non-destructive testing analysis approach:
SNeff = 0.0045 * D * (Ep)1/3
Where
D = Total thickness of all pavement layers above the subgrade, inches
Ep = Effective modulus of the pavement layers above the subgrade, psi
SNeff and Ep shall be calculated following the guidelines provided in FWD Data Analysis Procedure.
It is possible for SNeff to be greater than SNo. If this is true then SNo should be redefined to be equal to SNeff and Steps 1 and 2 should be repeated to calculate SNeff.
9.13.03.02.01 HMA Overlay
Step 1. Calculate the required structural capacity (SNf) for future traffic for each analysis section. SNf is obtained from Figure 3.1 and the nomograph equations on page II-32 in the 1993 AASHTO Guide. For all design inputs required to use the nomograph or equation on pages II-32, refer to Design Inputs.
Step 2. Identify pre-overlay needs as per Supplemental Treatment Information and Pre-Overlay Repair Guidelines for each selected, applicable repair alternative. Also, consider drainage treatments from Pavement Drainage that would be appropriate repairs and/or rehabilitation strategies to address the source of any drainage issues.

Appendices
Section 13: Pavement Rehabilitation Design Using AASHTO 1993
Updated 10/10/2013 Return to Table of Contents 9-51
Step 3. If milling or grinding is to be used as a pre-overlay repair then recalculate SNo as follows:
SNo(ar) = SNo(br) – hrem * aac
where: SNo(ar) = Corrected SNo value after pavement removal SNo(br) = SNo value before pavement removal hrem = Depth of pavement removal; 0.5” increments aac = Layer coefficient of sound asphalt surface material at the time of the last
rehabilitation in the past. However, if SNo was set equal to the SNeff (NDT), then the layer coefficient should be that of the existing deteriorated surface material.
Step 4. Estimate the corrected PCI and related Cx based on the pre-overlay fix and recalculate SNeff.(PCI).
Step 5. Use this information from the adjusted SNeff.(PCI) to adjust the SNeff calculated based on AASHTO. Use Design Properties for Pavement Materials to assist in determining the correct layer coefficient for each pavement layer following pre-overlay repairs for flexible pavements.
Step 6. If milling or grinding is to be used as a pre-overlay repair then recalculate SNeff based on NDT for flexible pavements as follows:
SNeff(ar) = SNeff(br) –(hrem*aac)
where: SNeff(ar) = Corrected SNeff value after pavement removal SNeff(br) = SNeff value before pavement removal hrem = Depth of pavement removal; 0.5” increments aac = 0.44 or layer coefficient of existing asphalt surface material
Step 7. Select the SNeff to use for each rehabilitation design based on the following guidelines:
Compare SNeff calculated based on the corrected visual survey to the SNeff calculated from NDT and select the lower of the two.
Note: If SNeff was not calculated based on PCI results then compare the SNeff calculated following AASHTO procedures to the SNeff calculated from NDT.
If the SNeff calculated from the corrected visual survey is considerable lower than the SNeff calculated from NDT then determine if the distresses driving the PCI are predominantly functional. If this is the case, then revisit the pavement structure used in analysis, and repeat the previous steps until the different calculated SNeff values are similar.
Step 8. Calculate the total required HMA overlay thickness based on the following guidelines:
SNol = SNf - SNeff
Calculate overlay thickness using the following equation:

Appendices
Section 13: Pavement Rehabilitation Design Using AASHTO 1993
Updated 10/10/2013 Return to Table of Contents 9-52
hol = SNol/0.44
where hol = HMA overlay thickness
9.13.03.02.02 Concrete Overlay
PCC Bonded and Unbonded Overlay procedures to be developed.
9.13.03.03 Overlay Design – Rigid or Composite Pavement
Step 1. Calculate the original structural capacity (SCo) of each pavement analysis section.
Rigid Pavement: SCo = Do = d
where:
d = PCC layer thickness
Composite Pavement : SCo = Do
Do = dpcc + hpcc
where:
dpcc = PCC layer thickness
hpcc = The existing AC layer thickness converted to an equivalent PCC layer thickness. Use the hpcc = dac/2.
Step 2. Calculate the effective structural capacity (SCeff) of each analysis section following the condition (visual survey) analysis approach. It is important to note that the visual survey approach only evaluates the condition of the pavement based on the visual observation of the surface. Use the following guidelines to determine SCeff following the visual condition survey analysis approach for each pavement type:
9.13.03.03.01 Option 1: Rigid or Composite Pavement – PCI Method Sceff = Deff
Deff = Do * Cx
where:
Cx = Condition Factor from visual condition analysis (=< 1.0). To obtain Cx for rigid pavements use the following equation:
Cx = (PCI / 100)^1/2
> 0.65
where:
PCI = Average PCI for analysis section
Note: The engineer must determine if the majority of the distresses captured by the PCI are structural or functional. If they are structural, then the Cx factor should apply to the entire pavement structure. If they are functional, then the Cx factor should apply only to the top layer(s) as judged by the engineer.

Appendices
Section 13: Pavement Rehabilitation Design Using AASHTO 1993
Updated 10/10/2013 Return to Table of Contents 9-53
9.13.03.03.02 Option 2: Rigid Pavement – AASHTO Method Deff = Do * Fjc * Fdur * Ffat
where:
Fjc = Joints and cracks adjustment factor. Fjc is calculated from Figure 5.12 on page III-124 in the 1993 “AASHTO Guide for Design of Pavement Structures.” All of the input values needed to use Figure 5.12 can be tabulated in the field during the pavement designer windshield survey or estimated based on the distress quantities from the PCI visual survey results. Fjc ranges from approximately 0.4 to 1.0. In order to use Figure 5.12 the following items need to be summed:
o Number of unrepaired deteriorated joints per mile
o Number of unrepaired deteriorated cracks per mile
o Number of unrepaired punchouts per mile
o Number of expansion joints, exceptionally wide joints (>1.0”), and full-depth AC patches per mile
Fdur = Durability adjustment factor. Fdur is a function of the amount of durability problems such as D-cracking in the existing PCC slab. The Durability adjustment factor range is 0.8 to 1.0. The summary results from the PCI survey will provide adequate information to develop an accurate Durability adjustment factor. The 1993 AASHTO Guide for Design of Pavement Structures” provides the following guidelines:
o 1.00: No signs of PCC durability problems
o 0.96 – 0.99: Durability cracking exists, but no spalling
o 0.88 – 0.95: Substantial cracking and some spalling exists
o 0.80 – 0.88: Extensive cracking and severe spalling exists
Durability related problems from reactive aggregate are not a prevalent distress in Maryland. The durability adjustment factor is typically close to 1.0 for a majority of Maryland roadways. With extrapolated PCI survey results, use the following equation to calculate Fdur:
Fdur = 1.0 – 0.2 * (A / B)
A = Extrapolated number of slabs with D-cracking of any severity
B = Total number of slabs in section
Ffat = Fatigue damage adjustment factor. Ffat is a function of the amount of past fatigue or structural damage that may exist in the PCC slab. The fatigue damage adjustment factor range is 0.9 to 1.0. The summary results from the PCI survey will provide adequate information to develop an accurate Fatigue adjustment factor. The 1993 AASHTO Guide for Design of Pavement Structures” provides the following guidelines for each PCC pavement type:
JPCP (Plain):
0.97 – 1.00 < 5% of slabs are cracked
0.94 – 0.96: 5 to 15 % of slabs are cracked
0.90 – 0.93: > 15% of slabs are cracked
Appendices
Section 13: Pavement Rehabilitation Design Using AASHTO 1993
Updated 10/10/2013 Return to Table of Contents 9-54
JRCP (Reinforced):
0.97 – 1.00 < 25 cracks / lane mile
0.94 – 0.96: 25 to 75 cracks / lane mile
0.90 – 0.93: > 75 cracks / lane mile
CRCP (Continuously Reinforced):
0.97 – 1.00 < 4 punchouts / lane mile
0.94 – 0.96: 4 to 12 punchouts / lane mile
0.90 – 0.93: > 12 punchouts / lane mile
9.13.03.03.03 Option 2: Composite Pavement – AASHTO Method Deff = (dpcc * Fjc * Fdur ) + (hpcc * Fac)
where:
dpcc = PCC layer thickness
Fjc = Joints and cracks adjustment factor. Refer to Option 2: Rigid Pavement.
Fdur = Durability adjustment factor. Refer to Option 2: Rigid Pavement.
This value will be an estimated based on the visual survey and past history of durability problems. For the most part, Maryland does not typically have a reactive aggregate problem. The majority of the problems with composite pavements in Maryland are from reflective cracking, full-depth flexible patches, and flexible pavement widening. PCC durability factor is typically close to 1.0 for a majority of Maryland roadways.
hpcc = The existing AC layer thickness converted to an equivalent PCC layer thickness.
Fac = The AC quality adjustment factor. Fac adjusts for the quality of the asphalt concrete (AC) with respect to the effective structural capacity of the composite pavement. Fac is a function of the existing AC material quality related distress in the AC layer. AC material quality distresses include the following: rutting, stripping, bleeding, weathering/raveling. Reflective cracking is not considered an AC material quality related distress for pavement design purposes although the AC material properties may contribute to the development of the distress.
1.00: No AC material quality distress
0.96 – 0.99: Minor AC material quality distress
0.88 – 0.95: Significant AC material quality distress
0.80 – 0.88: Severe AC material quality distress
Use the following table to determine Fac:
< 25% Weathering >= 25% Weathering % Rutting % Rutting
<10% 10-25% >25% <10% 10-25% >25%
1.0 0.95 0.80 0.97 0.90 0.80

Appendices
Section 13: Pavement Rehabilitation Design Using AASHTO 1993
Updated 10/10/2013 Return to Table of Contents 9-55
9.13.03.03.04 HMA Overlay
Step 1. Calculate the required structural capacity (SCf) for future traffic for each analysis section. SCf is obtained from Figure 3.7 and the nomograph equations on page II-45 in the 1993 AASHTO Guide for rigid/composite sections. For all design inputs required to use the nomograph or equation on page II-45 refer to Design Inputs, except for the J Factor (J), PCC Elastic Modulus (E) and PCC Modulus of Rupture (S’c). These values should be obtained as per FWD Data Analysis Procedure.
Step 2. Identify pre-overlay needs as per Supplemental Treatment Information and Pre-Overlay Repair Guidelines for each selected, applicable repair alternative. Also, consider drainage treatments from Pavement Drainage that would be appropriate repairs and/or rehabilitation strategies to address the source of any drainage issues.
Step 3. If milling or grinding of composite pavements is to be used as a pre-overlay repair then recalculate SCo as follows:
SCo(ar) = SCo(br) – hrem / 2
where: SCo(ar) = Corrected SCo value after pavement removal SCo(br) = SCo value before pavement removal hrem = Depth of pavement removal; 0.5” increments
Step 4. Estimate the corrected PCI and related Cx based on the pre-overlay fix and recalculate SCeff.(PCI).
Step 5. Use this information from the adjusted SCeff.(PCI) to adjust the SCeff calculated based on AASHTO. Use Tables 5.8 and 5.10 on page III-126 and III-136 in the 1993 AASHTO Guide in determining the existing distresses based on corrections made to the pavement from pre-overlay repairs for rigid and composite pavements.
Step 6. Select the SCeff to use for each rehabilitation design based on the following guidelines:
Compare SCeff calculated based on the corrected PCI to the SCeff calculated based on the corrected AASHTO survey and select the lower of the two. If the difference between the two is considerable, then revisit the pavement structure used in analysis, and repeat the previous steps until the different calculated SCeff values are similar.
Step 7. Calculate the total required HMA overlay thickness based on the following guidelines:
hol = (Df - Deff)*A
where:
A = 2.2233 + 0.0099 * (Df – Deff)2 – 0.1534 * (Df – Deff)
hol = HMA overlay thickness

Appendices
Section 13: Pavement Rehabilitation Design Using AASHTO 1993
Updated 10/10/2013 Return to Table of Contents 9-56
9.13.03.03.05 Concrete Overlay
PCC Bonded and Unbonded Overlay procedures to be developed.
9.13.03.04 Constructability
The pavement design shall be checked for constructability issues. Care shall be taken to ensure that the pavement design can be constructed and perform well over the pavement service life; geometric and grade demands, MOT constraints, regional material constraints, etc.
Appendices
Section 14: References
Updated 09/13/2013 9-57
9.14 REFERENCES American Association of State Highway and Transportation Officials (AASHTO) (1988). Manual on Subsurface Investigations, Developed by the Subcommittee on Materials, Washington, D.C. “AASHTOO Standard Specifications for Highway Bridges – Latest Edition” American Association of State Highway and Transportation Officials (AASHTO) (1986). “Standard Specifications for Transportation Materials and Methods of Sampling and Testing, Part I, Specifications, 14th ed.” AASHTO, Washington, D.C. AASHTO (1992). “Standard Specifications for Transportation Materials and Methods of Sampling and Testing, Part II, Tests.” Washington, D.C. American Concrete Pavement Association. Concrete Pavement Field Reference Preservation and Repair. Skokie, IL. 2008. American Concrete Pavement Association. The Concrete Pavement Restoration Guide. Skokie, IL. 1997. Asphalt Institute. Manual Series No. 17 (MS-17), Asphalt Overlays for Highway and Street Rehabilitation. Lexington, KY. January 2000. Asphalt Recycling and Reclaiming Association. Basic Asphalt Recycling Manual. Annapolis, MD. 2001. ASTM (1997). Annual Book of ASTM Standards. American Society for Testing and Materials, Philadelphia, Penn. EM 1110-2-1902. 2003. “Engineering and Design - Slope Stability,” U.S. Army Corps of Engineers, Washington, DC. Federal Highway Administration. Pavement Preservation: Optimal Timing of Pavement Preservation Treatments. Washington D.C. December 2007. Federal Highway Administration. Pavement Preservation: Preventive Maintenance Treatment, Timing, and Selection. Washington D.C. November 2007 Federal Highway Administration and National Highway Institute, “Geosynthetic Design and Construction Guidelines” FHWA HI-95-038. Federal Highway Administration and National Highway Institute, “Geotechnical Aspect of Pavements” FHWA NHI 132040.
Federal Highway Administration and National Highway Institute, “Soils and Foundation Workshop”, NHI 132012. Federal Highway Administration and National Highway Institute, “Subsurface Investigations – Geotechnical Site Characterization” FHWA NHI 132031. Federal Highway Administration and National Highway Institute, “Subsurface Investigation Qualification” FHWA NHI 132079. FHWA SA-96-072, Mechanically Stabilized Earth Walls and Reinforced Soil Slopes Design and Construction Guidelines”.

Appendices
Section 14: References
Updated 09/13/2013 9-58
“Geotechnical Engineering Circular No. 5 - Evaluation of Soil and Rock Properties” Maryland Department of the Environment. Maryland Stormwater Design Manual, Volumes I & II. Baltimore, MD. May 2009. Maryland Department of Transportation. Standard Specifications for Construction and Materials. Baltimore, MD. July 2008. Maryland State Highway Administration. Book of Standards for Highway and Incidental Structures. Baltimore, MD. Maryland State Highway Administration. Pavement Design Guide. Baltimore, MD. May 2006. National Concrete Pavement Technology Center. Guide to Concrete Overlays. Ames, IA. September 2008. NAVFAC. (1982). DM.- 7.1 Design Manual: Soil Mechanics; May 1982, U.S. Government Printing Office, Washington, D.C. NCHRP Web Document 65 – “Geofoam Applications in the design and construction of Highway Embankments”. Nebraska Department of Roads. Pavement Maintenance Manual. Lincoln, NE. 2002. State of California Department of Transportation. Asphalt Rubber Usage Guide. Sacramento, January 2003. State of California Department of Transportation. Maintenance Technical Advisory Guide (TAG). Sacramento, October 2003. Texas Department of Transportation. Pavement Design Guide. Austin, TX. November 2008. Transportation Research Board. National Cooperative Highway Research Program (NCHRP Synthesis 338): Thin and Ultra-thin Whitetopping. Washington D.C, 2004 United States Army Corps of Engineers. Hot-Mix Asphalt Paving Handbook 2000. Washington, D.C. 2000. Transportation Research Board. SHRP2 Renewal Research (SHRP2 Report S2-R26-RR-2): Guidelines for the Preservation of High-Traffic-Volume Roadways. Washington D.C, 2011 United States Army Corps of Engineers. Hot-Mix Asphalt Paving Handbook 2000. Washington, D.C. 2000. Virginia Department of Transportation. Road and Bridge Specifications. Richmond, VA. 2007. Washington State DOT link on aggregates, http://training.ce.washington.edu/wsdot/modules/03_materials/03-2_body.htm