pavement smoothness acceptance testing: survey of · pdf filepavement smoothness acceptance...
TRANSCRIPT

State of Florida
Department of Transportation
Pavement Smoothness Acceptance Testing:
Survey of Current State Practices
FDOT Office State Materials Office
Research Report Number
FL/DOT/SMO/10-533
Authors Bouzid Choubane
Stacy Scott Alex Mraz
John Schiffermuller
Date of Publication April 2010

i
TABLE OF CONTENTS
List of Figures ................................................................................................................................. ii
Executive Summary ....................................................................................................................... iii
1 Introduction ............................................................................................................................. 1
2 Smoothness-Measuring Devices ............................................................................................. 3
2.1 High-Speed Inertial Profilers ........................................................................................... 3
2.2 Lightweight Profiler ......................................................................................................... 4
2.3 California Profilograph .................................................................................................... 5
2.4 Reinhardt Profilograph ..................................................................................................... 6
2.5 Rolling Straightedge ......................................................................................................... 6
3 Summary of Survey Responses .............................................................................................. 8
4 Observations ......................................................................................................................... 21
5 References ............................................................................................................................. 23
6 Disclaimer ............................................................................................................................. 24
Appendix A ................................................................................................................................. A-1

ii
LIST OF FIGURES
Figure Page
Figure 1 FDOT High Speed Inertial Profiler .................................................................................. 4
Figure 2 FDOT Lightweight Profiler .............................................................................................. 5
Figure 3 California Profilograph ..................................................................................................... 6
Figure 4 15-feet Rolling Straightedge ............................................................................................. 7
Figure 5 Smoothness and other distress data collected by agencies ............................................... 8
Figure 6 Profiling equipment specified for dense-graded HMA .................................................... 9
Figure 7 Profiling equipment specified for open-graded HMA .................................................... 10
Figure 8 Profiling equipment specified for PCC .......................................................................... 10
Figure 9 Inertial profiler sensor footprint ..................................................................................... 11
Figure 10 Profile sampling interval .............................................................................................. 12
Figure 11 Agencies with profile analysis software ....................................................................... 13
Figure 12 Agencies with warranty specification(s) ...................................................................... 14
Figure 13 Agencies with smoothness acceptance specification(s) ............................................... 15
Figure 14 Agencies with smoothness incentive/penalty specification ......................................... 16
Figure 15 Agencies with smoothness retest requirement(s) ......................................................... 17
Figure 16 Agencies with an inertial profiler certification protocol .............................................. 18
Figure 17 Responsible party to conduct smoothness acceptance test ........................................... 19
iii
Executive Summary
In June 2009, the Florida Department of Transportation (FDOT) conducted a survey to assess the
current smoothness measurement techniques and acceptance practices implemented by the
various highway agencies for both concrete and asphalt roadway surfaces. A total of 36 agencies
responded to the survey including 33 State DOTs, the Federal Highway Administration
(FHWA), and 2 Canadian highway agencies. This report provides a summary of the information
gathered through this survey.
1
1 Introduction
Pavement smoothness is an important indicator of pavement condition, both in terms of
performance, and as a determinant of road user costs. Therefore, attaining acceptable surface
smoothness on newly constructed or rehabilitated pavements is becoming a major concern to
highway agencies (1). This need to quantify pavement surface smoothness has resulted in the
development of numerous measurement techniques and devices. Of greater interest to highway
agencies are those that would provide for versatility, ease and speed of use (2, 3).
High-speed pavement profiling technology was initially introduced in the 1960s at the General
Motors Research Laboratory (4). Since then, a considerable amount of research has been
conducted to gain further understanding on the factors affecting high-speed profiling from both
the analytical and experimental points of view. Comparative studies have indicated, for instance,
that optical and laser-based profilers generally exhibited better performance, in terms of
repeatability and accuracy. These studies have also shown that the use of ultrasonic-based
profilers may not be appropriate for textured surfaces such as chip seal or open-graded
pavements, while ambient light could contaminate optical sensors (5, 6, 7).
Once a longitudinal profile is measured, any profile-based roughness index may be calculated.
Although a number of roughness indices exist, the International Roughness Index (IRI) and Ride
Number (RN) statistics are generally used as pavement surface condition indicators. IRI is
defined as a mathematical transform (a property) of a true profile describing surface roughness
that causes vehicle vibration (8). The underlying IRI model is a series of differential equations
that relate the motions of a simulated quarter-car to a road profile. The IRI is computed as a
linear accumulation of the simulated suspension motion, normalized by the length of the profile.
IRI has, therefore, units of slope and is computed from a single longitudinal wheel path profile.
It has demonstrated a strong compatibility with the equipment used to develop pavement
management systems. The Federal Highway Administration (FHWA) currently requires state
agencies to report IRI on a portion of their network for the national Highway Performance
Monitoring System (HPMS) (9). RN is obtained through a practical mathematical process of the
longitudinal road surface profiles. The practice is the result of NCHRP work on the effect of

2
road surface roughness on ride comfort conducted in the 1980s (9). The objective of that work
was to determine how road profiles were linked to the subjective opinion about the road ride
quality from members of the public. Thus, RN is linked by statistical correlation to public
opinion of ride quality (10).
In June 2009, the Florida Department of Transportation (FDOT) conducted a survey to assess the
current smoothness measurement techniques and acceptance practices implemented by the
various highway agencies for both concrete and asphalt roadway surfaces. This report provides a
summary of the information collected through this survey.

3
2 Smoothness-Measuring Devices
The pavement profile-measuring devices of interest to this survey are described in the following
sections.
2.1 High-Speed Inertial Profilers
High-Speed Inertial Profilers (HSIP) are devices that collect profile data at ordinary traffic
speeds. A typical inertial profiler (Figure 1) consists of an instrumented vehicle with three
essential transducers, namely, (1) accelerometer(s), (2) road sensing transducer(s), and (3) a
distance-measuring instrument. The respective outputs from these three sensors are combined to
compute a pavement surface profile. The accelerometers measure the vertical motion of the
vehicle body. Data processing algorithms convert the vertical acceleration signals to the
elevation path followed by the body of the host vehicle as it travels along the roadway. The
distance of the road surface below the elevation path of the vehicle is measured with non-
contacting sensors such as lasers, optical, or infrared transducers. When this measurement is
subtracted from the elevation of the vehicle body, the road profile is obtained. The distance-
measuring instrument (DMI) determines the longitudinal position along the road, and is usually
recorded from the vehicle speedometer or from direct measurements of rotation of one of the
vehicle wheels. The longitudinal distance measurement is needed to associate a position with
each profile elevation.

4
Figure 1 FDOT High-Speed Inertial Profiler
2.2 Lightweight Profiler
As illustrated in Figure 2, the lightweight profiler is a golf-cart like vehicle light enough to drive
on “green” concrete pavements. It uses an infrared laser sensor and a precision accelerometer to
measure pavement’s longitudinal profile. The laser and accelerometer are mounted on the front
bumper of the vehicle. The data collected can be used to produce a variety of ride parameters
such as IRI, RN, or simulate the output from a California profilograph. The equipment operates
at speeds of up to approximately 20 mph and complies with the requirements of ASTM E950 for
Class 1 profiling equipment.

5
Figure 2 FDOT Lightweight Profiler
2.3 California Profilograph
Profilographs are used to measure the longitudinal profile of a concrete pavement. The
mechanical models of the profilographs have been produced since 1960, while the automated
version was introduced in the mid-1980s.
California profilograph (Figure 3) is relatively inexpensive, manually operated by one person at
walking speed, and provides a trace of the pavement surface users can easily understand. It
consists of a 25-ft aluminum frame supported on both ends by a non-uniformly spaced series of
wheels. The surface-sensing wheel and recorder are located at the center of the reference
platform. Support wheels have varied in number from four to twelve, with systems in many
states using twelve wheels. These wheels are attached to the ends of a 25-foot long truss
mounted on a multiple axle carriage that includes four wheels spaced 17 inches from the truss
centerline and two wheels spaced 17 inches on the opposite side of the truss centerline. The
support wheels are commonly spaced at 2.7-feet intervals and positioned near the ends of the
truss, resulting in an overall profilograph span of approximately 33 feet.

Figure 3 California Profilograph
2.4 Rainhart Profilograph The Rainhart profilograph operates similar to the California profilograph. The major difference
is that the Rainhart profilograph uses twelve wheels arranged in four groups of three. This wheel
arrangement ensures that each wheel travels a separate path. This allows measurement of twelve
wheel paths instead of just three as with the California profilograph.
2.5 Rolling Straightedge The rolling straightedge (Figure 4) is an apparatus used for quick assessment of the road surface
irregularities, i.e., bumps or dips. The apparatus is approximately 15-feet long and 0.82-feet wide
and has a strong aluminum frame to which wheels are attached at the bottom edge of both sides.
The wheels are attached such as to create a moving straight reference line. Midway along the
length of the straightedge is a wheel that moves vertically in relation to the reference line and the
vertical movement is continuously measured on a dial, visible to the operator. A particular
vertical measurement can be set as a reference and any pavement deviation exceeding it will give
an indication of a suspect area.
6

7
Figure 4 A 15-feet Rolling Straightedge

8
3 Summary of Survey Responses
In June 2009, the Florida Department of Transportation (FDOT) conducted a survey to assess the
current smoothness, measurement techniques, and acceptance practices implemented by the
various highway agencies for both concrete and asphalt roadway surfaces. A total of 36 agencies
responded to the survey including 33 State DOTs, the Federal Highway Administration
(FHWA), and 2 Canadian highway agencies. In this section, the survey results are summarized
on a question by question basis.
Question 1: Please select the data collected (check all that apply)
Smoothness
Rutting
Cross Slope
Grade
Figure 5 Smoothness and other distress data collected by agencies

9
Question 2: What type of smoothness testing device is specified for?
Dense-Graded Hot Mix Asphalt (HMA)
Open-Graded Hot Mix Asphalt (HMA)
Portland Cement Concrete (PCC)
As a note, some agencies used more than one device for measurement on a particular pavement
surface type. The resulting graph differentiates these agencies from those that used a single
device.
Figure 6 Profiling equipment specified for dense graded HMA

10
Figure 7 Profiling equipment specified for open graded HMA
Figure 8 Profiling Equipment specified for PCC

11
Question 3: What type of sensor and sensor “footprint” (ex: wide-spot or narrow-spot) is
used to collect smoothness data for?
Dense-Graded Hot Mix Asphalt
Open-Graded Hot Mix Asphalt
Portland Cement Concrete
Figure 9 Inertial profiler sensor footprint

12
Question 4: What sampling interval is used for?
Dense-Graded Hot Mix Asphalt
Open-Graded Hot Mix Asphalt
Portland Cement Concrete
Figure 10 Profile sampling interval

13
Question 5: What program (software) do you use to analyze the data for?
Dense-Graded Hot Mix Asphalt
Open-Graded Hot Mix Asphalt
Portland Cement Concrete
Figure 11 Agencies with profile analysis software

14
Question 6: Does your state have a warranty specification for (if so, please provide latest)?
Dense-Graded Hot Mix Asphalt
Open-Graded Hot Mix Asphalt
Portland Cement Concrete
Figure 12 Agencies with warranty specification(s)
15
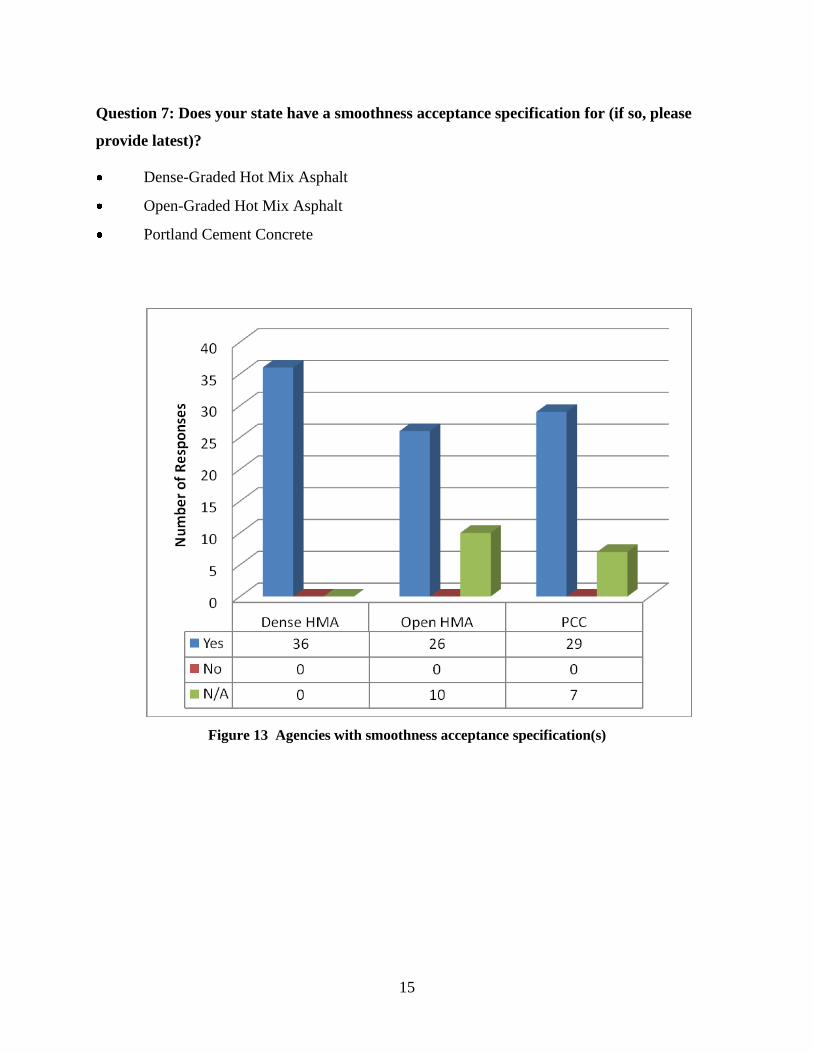
Question 7: Does your state have a smoothness acceptance specification for (if so, please
provide latest)?
Dense-Graded Hot Mix Asphalt
Open-Graded Hot Mix Asphalt
Portland Cement Concrete
Figure 13 Agencies with smoothness acceptance specification(s)
16
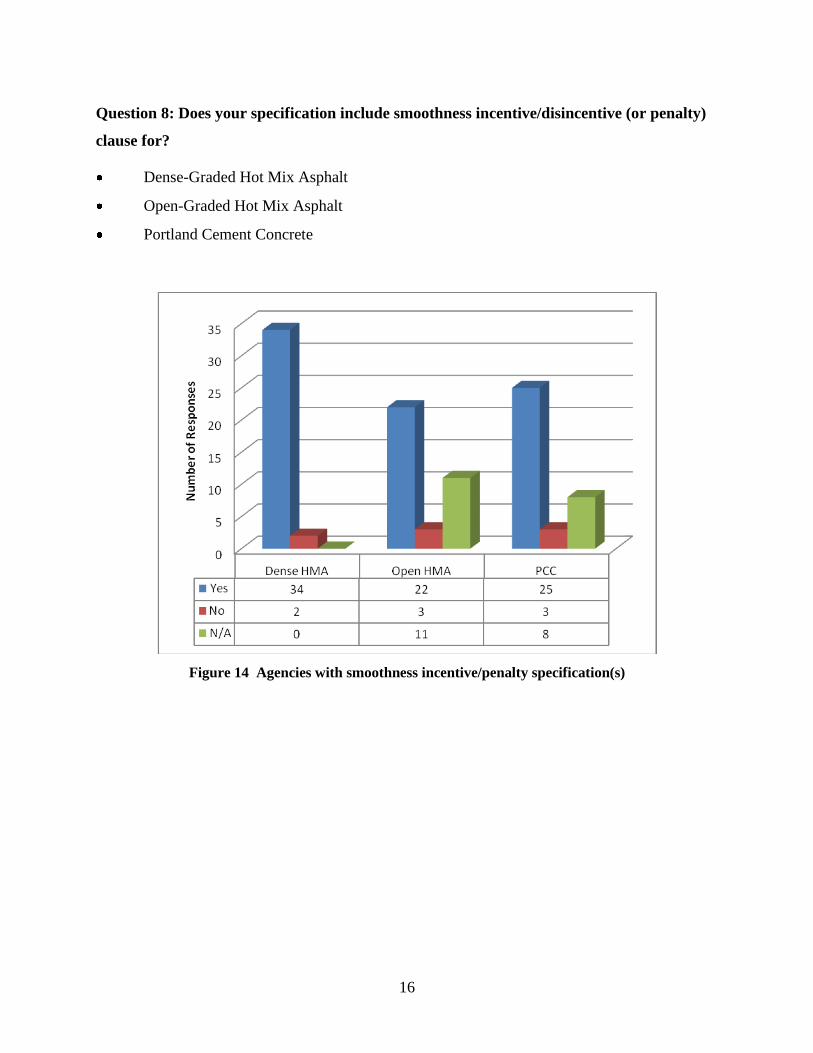
Question 8: Does your specification include smoothness incentive/disincentive (or penalty)
clause for?
Dense-Graded Hot Mix Asphalt
Open-Graded Hot Mix Asphalt
Portland Cement Concrete
Figure 14 Agencies with smoothness incentive/penalty specification(s)

17
Question 9: Is a retest required/allowed after the contractors make any required
smoothness corrections?
Dense-Graded Hot Mix Asphalt
Open-Graded Hot Mix Asphalt
Portland Cement Concrete
Figure 15 Agencies with smoothness retest requirement(s)

18
Question 10: What protocol do you follow to certify an inertial profiler used for your
project acceptance?
Dense-Graded Hot Mix Asphalt type
Open-Graded Hot Mix Asphalt
Portland Cement Concrete
Figure 16 Agencies with an inertial profiler certification protocol

19
Question 11: Is the acceptance testing performed by the state, consultant, or contractor?
Dense-Graded Hot Mix Asphalt
Open-Graded Hot Mix Asphalt
Portland Cement Concrete
Figure 17 Responsible party to conduct smoothness acceptance test

20
Question 12: What challenges/problems have you encountered in implementing
smoothness specifications for
Dense-Graded Hot Mix Asphalt
Open-Graded Hot Mix Asphalt
Portland Cement Concrete
Different agencies reported different challenges in implementing their smoothness
specification(s). Due to the open-ended nature of this question, it was decided not to summarize
the responses for this question. Instead, the submitted responses are provided in Appendix A for
the interested readers.

21
4 Observations
The following observations were made from the survey results:
Out of 36 agencies that responded to the survey, 31 agencies (86%) collect data for
smoothness only, four (11%) collect data for both smoothness and rutting, and one
agency (3%) collects data for smoothness, rutting and cross-slope.
76% of agencies use HSIP to evaluate open-graded HMA while 86% use HSIP on dense-
graded HMA. The results were evenly split (50/50) between HSIP and profilographs for
PCC.
Regardless of the surface types, the narrow-spot sensor footprint is the most commonly
used sensor in conjunction with inertial profilers. Most agencies that allow use of wide
spot sensors also allow the use of the narrow-spot sensors.
There is no discernable trend among agencies regarding profile sampling interval except
that they all use an interval that is less than 6 inches.
ProVal and manufacturer supplied programs are used equally by agencies for all HMA
surface profile analysis. A slight majority (11 vs. 10) of agencies use manufacturer
supplied programs over other analytical software for PCC profile analysis.
Only four agencies use warranty specifications on dense-graded HMA, and three
agencies use warranty specifications on open-graded HMA and PCC pavements. A one
year warranty period was specified by one agency on dense-graded HMA, but this
requirement is only applied when paving is completed outside of the defined paving
season, which is not routinely done. Another agency uses 3-year criteria for all HMA
surfaces and 5-year for PCC surfaces. The rest of the agencies did not specify a warranty
period(s).
All agencies use smoothness acceptance specifications for all surface types.

22
Smoothness incentives/disincentives are used by 95% of agencies on dense-graded HMA
surfaces while 88% use them on open-graded HMA and PCC surfaces.
95% of agencies require a retest after smoothness corrections on dense-graded HMA; all
agencies require a retest on open-graded HMA and PCC surfaces.
56% of agencies conduct an in-house certification of HSIP for dense-graded HMA
surfaces; 64% and 77% of agencies conduct an in-house certification for open-graded
HMA and PCC surfaces, respectively. One agency uses the ASTM E-950 method on
dense-graded HMA surfaces. AASHTO PP-49 method is used by three agencies for
dense-graded HMA surfaces and only one agency uses this standard for open-graded
HMA surfaces. ASTM E-950 and AASHTO PP-49 standards were not used on PCC
surface by any agency.
For all HMA surfaces, 50% of agencies perform their own acceptance testing, 40% allow
contractors to perform the testing, and the remaining 10% contract out the testing
services. For PCC surfaces, 35% of agencies perform their own acceptance testing, 50%
allow contractors to perform the testing, and the remaining 15% contract out the services.

23
5 References
1. B. Choubane R. McNamara, and S. Gokhale. Assessing Laser Profilers for
Measurement of Pavement Smoothness in Florida. Proceedings, International
Conference on Highway Pavement Data, Analysis and Mechanistic Design
Applications, Columbus, OH, 2003.
2. B. Choubane R. McNamara, and G. Page. Evaluation of High-Speed Profilers for
Measurement of Asphalt Pavement Smoothness in Florida. Transportation Research
Record 1813, Journal of the Transportation Research Board, The National
Academies, Washington, D.C., 2002, pp. 62-67.
3. B. Choubane and R. McNamara. Evaluation of a Lightweight Profiler for
Measurement of PCC Pavement Roughness in Florida. Proceedings, 7th International
Conference on Concrete Pavements, Orlando, FL, 2001.
4. Spangler, E.B., and W. J. Kelley. GMR Road Profilometer – A Method for
Measuring Road Profile. Research Publication GMR-452. General Motor Research
Laboratory, Warren, MI, 1964.
5. Perera, R. W., and S. D. Kohn. Road Profiler Data Analysis and Correlation. Proc.,
5th
Annual Meeting of Road Profiler User Group. Plymouth, MI, 1994.
6. Perera, R. W., and S. D. Kohn. Road Profiler Data Analysis and Correlation. Proc.,
6th
Annual Meeting of Road Profiler User Group. Plymouth, MI, 1995.
7. Sayers, M. W., and S. M. Karamihas. Interpretation of Road Roughness Profile
Data. Federal Highway Administration, FHWA/rd-96/101, 1996.
8. Sayers, M. W., T. D. Gillespie, and W. O. Paterson. Guidelines for Conducting and
Calibrating Road Roughness Measurements. Technical Paper 46. World Bank,
Washington, D.C., 1986.
9. Highway Performance Monitoring System, Field Manual, Appendix J, Order M
5600.1A. FHWA, U.S. Department of Transportation, 1990.
10. Janoff, M. S., J. B. Nick, and P. S. Davit. Pavement Roughness and Rideability.
NCHRP Report 275. TRB, National Research Council, Washington, D.C., 1985.
24
6 Disclaimer
The survey results provided in this report are summarized based on the recorded responses of the
participating agencies interpreted by the authors of this report. As such, the responses had been
categorized and summarized to the best of the authors’ knowledge and the responses deemed
irrelevant to the questionnaire had been subsequently removed and excluded from the report.
Comments and questions arising from any misinterpretation may be submitted to the authors for
corrective actions and/or further clarification. However, the Florida Department of
Transportation and the authors assume no liability for the contents of this report or use thereof.

A-1
Appendix A
Question 12
Question Statement
What challenges/problems have you encountered in implementing smoothness specifications
for?
Dense-Graded Hot Mix Asphalt
Open-Graded Hot Mix Asphalt
Portland Cement Concrete
Responses:
STATE Q12
Dense HMA Open HMA PCC Alabama N/A N/A N/A
Alaska Most of the time, contractor thinks that the pavement is smoother than what the profiler measures.
Arizona N/A N/A N/A
Colorado Testing every project with the CDOT profiler. We switched to having the contractor measure smoothness and having the data submitted to the state for analysis. CDOT verifies at least 25% of a contractor's projects statewide
N/A Longitudinal tinning has kept us from using IRI. We are currently in the process of upgrading the CDOT profiler to Roline laser to switch to IRI for the 2010 construction season.
FHWA Overcoming "Black Box Syndrome" and trying to get pay incentives and disincentives to be similar to what we paid under Pri smoothness specification.
Overcoming "Black Box Syndrome" and trying to get pay incentives and disincentives to be similar to what we paid under Pri smoothness specification.
N/A
Florida Current Spec treats Dense-Graded pavement the same as Open-Graded even though texture of Open Graded surface typically causes RN to be rougher, especially with pin-point laser sensors. Often get complaints from contractors claiming that the laser data is not valid or that it agrees with their perception of the smoothness of the project. Some of this appears to be due to a lack of understanding of how the laser profiler works, or because of resistance to change.
Current Spec treats Dense-Graded pavement the same as Open-Graded even though texture of Open Graded surface typically causes RN to be rougher, especially with pin-point laser sensors. Often get complaints from contractors claiming that the laser data is not valid or that it agrees with their perception of the smoothness of the project. Some of this appears to be due to a lack of understanding of how the laser profiler works, or because of resistance to change.
Because placement of PCC pavement in Florida is rather rare, refresher training and technical support is often needed by project personnel when dealing with the profilograph testing.

A-2
STATE Q12
Dense HMA Open HMA PCC Georgia When SP mix design was not
customized for GA conditions, mixes were drier and were harder to compact, which in turn made the final ride not as smooth as it used to be.
OGFC's are used on Interstates and higher volume State routes. OGFC's become smoother after one to two weeks due to additional seating / compacting.
Narrow footprint sensors are highly variable on ground PCC surfaces.
Idaho Questions regarding the value of smoothness, i.e. are we overpaying with our incentives? Initial buy in from the contractors regarding purchasing the profilers and change in specifications.
N/A Industry buy-in of the limits for the IRI specification. Equipment requirements, wide footprint sensor. This discussion is ongoing
Iowa Developing reasonable incentive-disincentive levels.
N/A Developing reasonable incentive-disincentive levels.
Kansas None None None
Kentucky Concern from HMA industry that HMA specifications are more stringent than PCC. Occasionally have problems when smoothness is specified on projects where project limitations make smoothness difficult to obtain.
N/A Concerns from PCC industry that tinning of concrete pavements causes higher IRI values that do not accurately reflect the ride experienced by motorists.
Louisiana Training on ProVAL. Our IRI spec does not adequately address bumps.
N/A N/A
Maryland It is difficult to accommodate the varying conditions encountered by the contractor in different geographical and functional sections of the state: urban vs. rural, flat vs. mountainous, interstate vs. streetscape. This year we modified our specification to include a clause to address conditions encountered that are beyond the control of the contractor.
We have very little OG HMA We have very little (non bridge) Portland Cement Concrete
Massachusetts Establishing test sites for verification and certification of contractor roughness equipment
N/A N/A
Minnesota N/A N/A N/A
Mississippi We are currently developing new specifications to switch from P.I. to an IRI based acceptance. We are in the latter stages of this process and is obviously in depth and detailed. Feel free to contact me for any information regarding this process.
We are currently developing new specifications to switch from P.I. to an IRI based acceptance. We are in the latter stages of this process and is obviously in depth and detailed. Feel free to contact me for any information regarding this process.
We are currently developing new specifications to switch from P.I. to an IRI based acceptance. We are in the latter stages of this process and is obviously in depth and detailed. Feel free to contact me for any information regarding this process.
Missouri N/A N/A N/A
Nevada N/A N/A N/A
New Hampshire none none N/A

A-3
STATE Q12
Dense HMA Open HMA PCC New Jersey Contractors unable to attain positive PA
complain spec is unattainable. We don't get the same complaints from contractors gaining positive PA (majority of tests.)
Contractors unable to attain positive PA complain spec is unattainable. We don't get the same complaints from contractors gaining positive PA (majority of tests.)
Inertial profiler not yet implemented for PCC.
New York There has been debate between the State and Industry regarding how to best deal with manholes, DI's and other obstructions in the travel lanes being tested. We currently omit these sections. The State currently only uses smoothness specs on controlled-access highways (Interstates and Parkways). We would like to expand to secondary roads but are trying to decide the best way to do it.
N/A The State would like to switch from a Profile Index spec to IRI. Industry seems ok with using IRI however they are hesitant until they can be assured there will be no problems with error due to the texturing of PCC pavements. Hopefully multi-point and line lasers will solve this problem.
North Carolina Getting a feel for the IRI numbers compared to our PI numbers. Cost of the high speed profilers. Establishing a profiler calibration track.
N/A N/A
North Dakota Contractors are not familiar with non-contact laser profiling. Equipment must operate at minimum speeds; making collection of data up to and through intersections difficult. * Speed limits and traffic through urban sections makes it difficult to maintain constant speed and collection path.
N/A Currently using California Profilograph. It has been a challenge to win contractor acceptance of smoothness results from non-contact laser profilers. NDDOT has collected data from PCC projects for several years in preparation for the transition to laser profiling. Data has been shared with contractors to prepare them when the change occurs.
Ohio Getting contractors to follow reporting requirements to the letter. Getting state project staff to enforce localized roughness criteria/limits; getting all to understand IRI based rideability; getting contactors to finally recognize that tools within ProVAL are really there to help them achieve incentives, that light bulb recently came on for the contractors in general
We use very little OGSF. When we do, we measure the course just below the OGSF for smoothness acceptance.
Getting PCC contractors to understand IRI and what material issues and construction practices affect such. Those guys get one shot at it which is much more difficult than the AC boys. Further, the animal continues to changes shape after the contractor has finished touching it as it cures.
Ontario, Canada Getting the contractors on side was extremely difficult at first and we ended up phasing in the penalties over several years. There was also an issue over contracts carried over the winter and the effect that traffic on the upper binder would have on the surface course placed in the spring. As far as the inertial profilers go, the greatest challenge has been switching from QC for acceptance to QA for acceptance.
Getting the contractors on side was extremely difficult at first and we ended up phasing in the penalties over several years. There was also an issue over contracts carried over the winter and the effect that traffic on the upper binder would have on the surface course placed in the spring. As far as the inertial profilers go, the greatest challenge has been switching from QC for acceptance to QA for acceptance.
N/A
Oregon Certification site location. Certification of inertial profiler based upon the Profile Index (PI)
Certification site location. Certification of inertial profiler based upon the Profile Index (PI)
Certification site location. Certification of inertial profiler based upon the Profile Index (PI)

A-4
STATE Q12
Dense HMA Open HMA PCC Saskatchewan, Canada
none, since we have both penalty and bonus clauses
N/A N/A
South Carolina Work quality issues. Work quality issues. Work quality issues. Also, for bridge decks, some issues with correcting for errors in readings due to longitudinal texture (diamond grinding).
South Dakota N/A N/A N/A
Tennessee Initial transition from Mays Meters to Road Profilers in 2000/2001 was challenging. We performed many miles of side by side testing to produce correlation curves and maintained industry involvement throughout the process of changing equipment and updating acceptance specifications.
Initial transition from Mays Meters to Road Profilers in 2000/2001 was challenging. We performed many miles of side by side testing to produce correlation curves and maintained industry involvement throughout the process of changing equipment and updating acceptance specifications.
Initial transition from Mays Meters to Road Profilers in 2000/2001 was challenging. We performed many miles of side by side testing to produce correlation curves and maintained industry involvement throughout the process of changing equipment and updating acceptance specifications.
Texas N/A N/A N/A
Utah Requiring one set of smoothness numbers in Table 1 no matter what the original condition of the road that the contractor starts with. Also, keeping the must grinds under 20 square yards per 0.1 mile section.
Not wanting to allow grinding of the Open Graded surface. The debate between the grinding damage and the bump if left in place.
Holding PCC pavement to the same standards of HMA.
Virginia Industry too focused on penalty portion of the spec overlooking the incentive side. Complains from the industry about alleged "mis application" of ride spec. Too sensitivity of small issues arising out of measuring ride number. AASHTO and ASTM standards for calibration and maintaining of profilers too complicated and difficult to follow.
Industry too focused on penalty portion of the spec overlooking the incentive side. Complains from the industry about alleged "mis application" of ride spec. Too sensitivity of small issues arising out of measuring ride number. AASHTO and ASTM standards for calibration and maintaining of profilers too complicated and difficult to follow.
Industry too focused on penalty portion of the spec overlooking the incentive side. Complains from the industry about alleged "mis application" of ride spec. Too sensitivity of small issues arising out of measuring ride number. AASHTO and ASTM standards for calibration and maintaining of profilers too complicated and difficult to follow.
Washington N/A N/A N/A
West Virginia meeting repeatability and accuracy requirements from AASHTO PP49
N/A N/A
Wisconsin N/A N/A Air temperature causes ride quality data to differ, sometimes by the hour.