pavements and studded tire damage … and studded tire damage wsdot - state materials laboratory ......
TRANSCRIPT
PAVEMENTS AND STUDDED TIRE DAMAGE
WSDOT - State Materials Laboratory
UPDATE: December 2008 After working with the vendor of the pavement rutting measurement software it has become clear we will not be able to determine studded tire damage for asphalt pavements. On concrete pavements the only rutting damage comes from studded tires, so measuring the ruts and determining the damage is relatively straightforward. On asphalt, ruts can result from three separate mechanisms: raveling due to studded tires, where material is actually lost from the pavement; rutting due to plastic flow caused by trucks, where the pavement moves and deforms but the total amount of pavement on the road stays the same; and secondary consolidation, where the pavement compacts more tightly due to traffic. Without being able to differentiate between these three we cannot say what proportion is due to studded tires.
We will continue to work with the software vendor to see if this hurdle could be overcome with a new version.
Introduction To date, damage caused by studded tires has been difficult to quantify; however, with improved technology it is now possible to measure the amount of damage studded tires cause on state highways. Direct measurements of this damage can be made on concrete pavements and accurate estimates for hot mix asphalt pavements will be possible in the near future. Measurements on concrete pavements indicate current damage due to studded tires to be $18.2 million.
Studded Tire Pavement Damage Studded tires damage hot mix asphalt and concrete pavements, wearing away the pavement and eventually forming ruts on the pavement surface. This type of rut damage is called “raveling.” Raveling on concrete pavements only comes from studded tire wear; raveling on hot mix asphalt comes primarily from studded tire wear with a lesser portion coming from general tire wear.
Concrete Pavement Studded Tire Damage The carbide steel in the studs is many times stronger than the surface of the concrete pavement and over time the studs grind away at the pavements surface. Eventually ruts form and when the ruts become severe, pavement rehabilitation is required to restore a smooth, even surface.
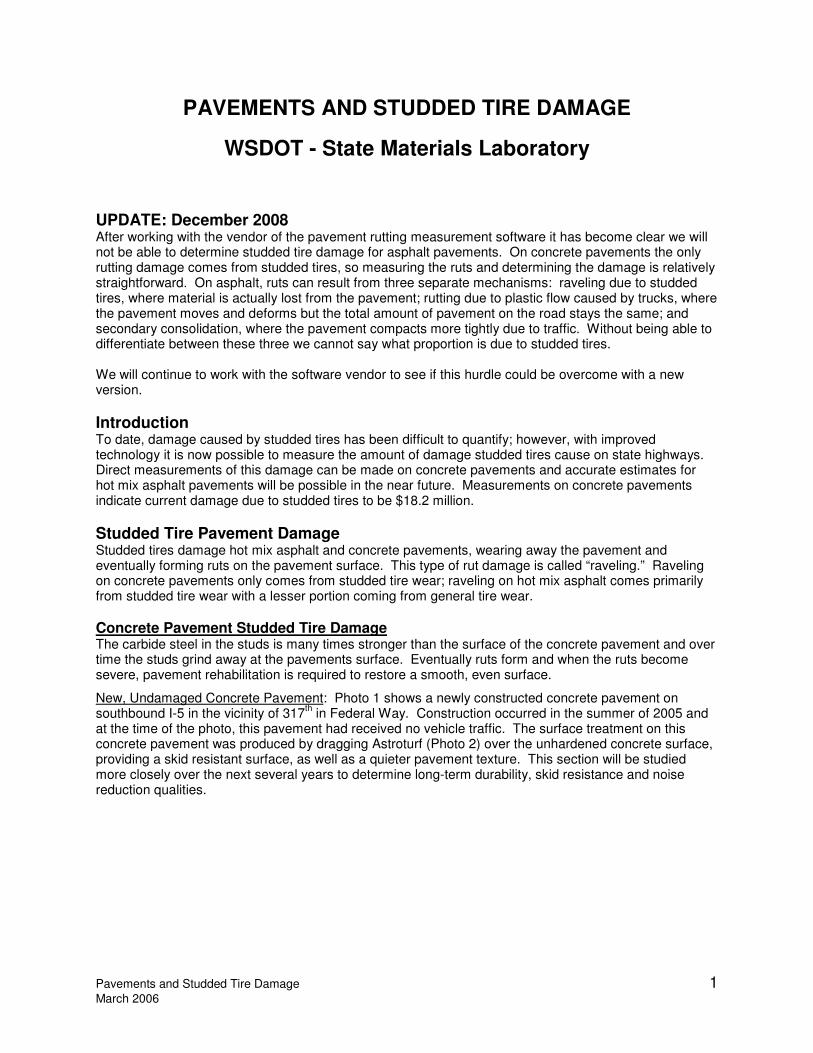
New, Undamaged Concrete Pavement: Photo 1 shows a newly constructed concrete pavement on southbound I-5 in the vicinity of 317
th in Federal Way. Construction occurred in the summer of 2005 and
at the time of the photo, this pavement had received no vehicle traffic. The surface treatment on this concrete pavement was produced by dragging Astroturf (Photo 2) over the unhardened concrete surface, providing a skid resistant surface, as well as a quieter pavement texture. This section will be studied more closely over the next several years to determine long-term durability, skid resistance and noise reduction qualities.
Pavements and Studded Tire Damage
March 2006
1
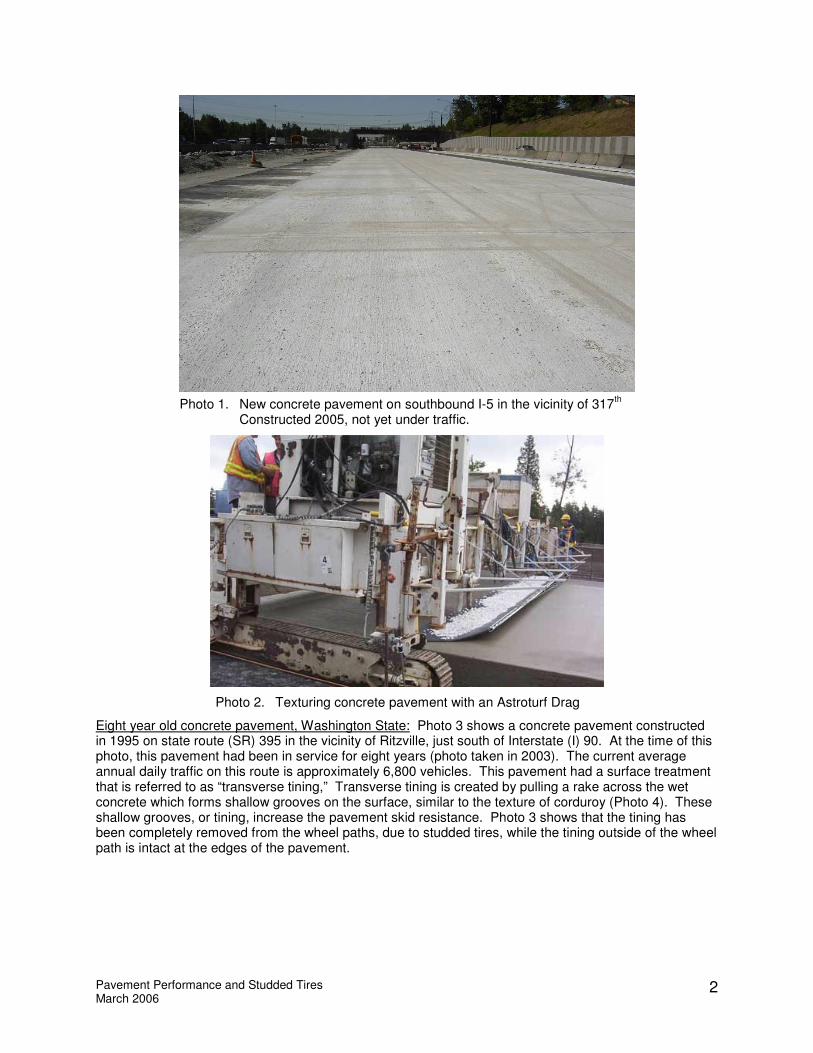
Photo 1. New concrete pavement on southbound I-5 in the vicinity of 317th
Constructed 2005, not yet under traffic.
Photo 2. Texturing concrete pavement with an Astroturf Drag
Eight year old concrete pavement, Washington State: Photo 3 shows a concrete pavement constructed in 1995 on state route (SR) 395 in the vicinity of Ritzville, just south of Interstate (I) 90. At the time of this photo, this pavement had been in service for eight years (photo taken in 2003). The current average annual daily traffic on this route is approximately 6,800 vehicles. This pavement had a surface treatment that is referred to as “transverse tining,” Transverse tining is created by pulling a rake across the wet concrete which forms shallow grooves on the surface, similar to the texture of corduroy (Photo 4). These shallow grooves, or tining, increase the pavement skid resistance. Photo 3 shows that the tining has been completely removed from the wheel paths, due to studded tires, while the tining outside of the wheel path is intact at the edges of the pavement.
Pavement Performance and Studded Tires March 2006
2

Tining
No Tining in wheel paths
Photo 3. Concrete pavement on SR-395 south of I-90. ADT: 6,800 vehicles Pavement age: Eight years
Photo 4. Transverse tining of fresh concrete pavement.
16 year old concrete pavement, Texas: Photo 5 shows a 17 year old concrete pavement constructed in 1989 on I-45 in Houston, Texas (photo taken in 2005). Although the state of Texas allows studded tires, their mild climate results in almost zero studded tire usage, and consequently, no studded tire damage. This roadway carries approximately 178,000 vehicles per day, yet after 16 years the original tining marks are clearly present and unworn. Contrast Photo 5 with Photo 6, which is a similarly aged concrete pavement in the Seattle area with less traffic. The Texas highway has one and a half times the traffic volume of I-90, yet the Washington State pavement clearly shows wear while the Texas highway is in like new condition.
Pavement Performance and Studded Tires March 2006
3

Pavement Performance and Studded Tires March 2006
Photo 5. Concrete pavement on I-45 in Houston, TX. ADT: 178,000 vehicles Pavement Age: 16 years
16 year old concrete pavement, Washington: Photo 6 shows a 16 year old concrete pavement constructed in 1989 on I-90 in Seattle in the vicinity of Rainier Avenue (photo taken in 2005). This pavement has an average annual daily traffic of 120,000 vehicles.
Photo 6. Concrete pavement on I-90 in Seattle (Rainier Avenue). ADT: 120,000 vehicles Pavement Age: 16 years
4

In the 1970’s the state of Minnesota was able to successfully ban the use of studded tires. Photo 7 (taken in 2005) shows the surface of a concrete pavement on I-94 in Minneapolis. This pavement was constructed in 1977 and currently carries an average annual daily traffic of 130,000 vehicles.
Photo 7. Concrete pavement on I-94 in Minneapolis, MN. ADT: 130,000 vehicles Pavement Age: 28 years
28 year old concrete pavement, Washington: Photo 8 shows a 28 year old concrete pavement constructed in 1977 on I-90 near Preston-Fall City. The average annual daily traffic on this section of pavement is 50,000 vehicles.
Photo 8. Concrete pavement on I-90 near Preston Fall City. ADT: 50,000 vehicles Pavement Age: 28 years
Pavement Performance and Studded Tires March 2006
5

34 year old concrete pavement, California: Photo 9 shows a concrete pavement on SR-101 in Ukiah, California. This pavement was constructed in 1967 (photo taken in 2001). Like Texas, California allows studded tires; however, the mild California climate also results in negligible studded tire usage. Contrast this photo with the damage seen in Photo 10. The current average annual daily traffic on SR-101 in Ukiah is approximately 26,000 vehicles.
Photo 9. Concrete pavement on State Route 101 in Ukiah, CA. ADT: 26,000 vehicles Pavement Age: 34 years
34 year old concrete pavement, Washington: Photo 10 shows a 34 year old concrete pavement constructed in 1967 on I-5 in Seattle in the vicinity of Boeing Field (photo taken 2005). The average annual daily traffic on this section of pavement is 204,000 vehicles.
Photo 10. Concrete pavemen t on I-5 near Boeing Field . ADT: 204,000 vehicles Pavement Age: 34 years
Pavement Performance and Studded Tires March 2006
6
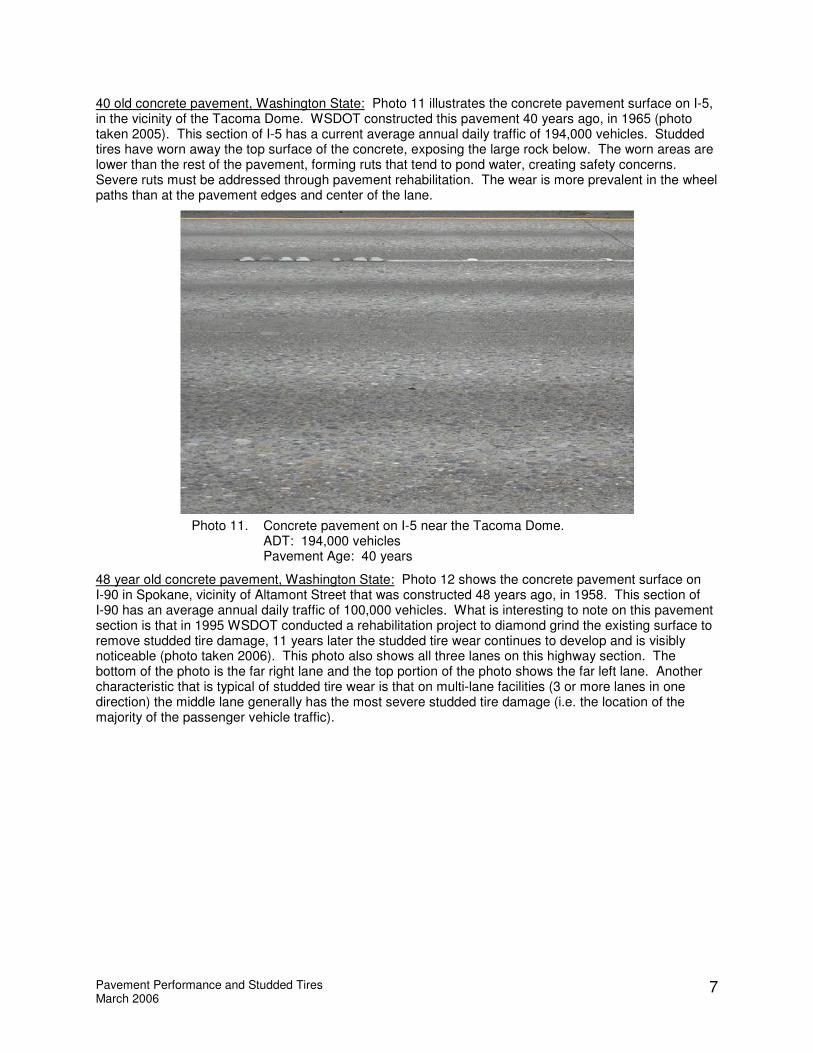
40 old concrete pavement, Washington State: Photo 11 illustrates the concrete pavement surface on I-5, in the vicinity of the Tacoma Dome. WSDOT constructed this pavement 40 years ago, in 1965 (photo taken 2005). This section of I-5 has a current average annual daily traffic of 194,000 vehicles. Studded tires have worn away the top surface of the concrete, exposing the large rock below. The worn areas are lower than the rest of the pavement, forming ruts that tend to pond water, creating safety concerns. Severe ruts must be addressed through pavement rehabilitation. The wear is more prevalent in the wheel paths than at the pavement edges and center of the lane.
Photo 11. Concrete pavement on I-5 near the Tacoma Dome. ADT: 194,000 vehicles Pavement Age: 40 years
48 year old concrete pavement, Washington State: Photo 12 shows the concrete pavement surface on I-90 in Spokane, vicinity of Altamont Street that was constructed 48 years ago, in 1958. This section of I-90 has an average annual daily traffic of 100,000 vehicles. What is interesting to note on this pavement section is that in 1995 WSDOT conducted a rehabilitation project to diamond grind the existing surface to remove studded tire damage, 11 years later the studded tire wear continues to develop and is visibly noticeable (photo taken 2006). This photo also shows all three lanes on this highway section. The bottom of the photo is the far right lane and the top portion of the photo shows the far left lane. Another characteristic that is typical of studded tire wear is that on multi-lane facilities (3 or more lanes in one direction) the middle lane generally has the most severe studded tire damage (i.e. the location of the majority of the passenger vehicle traffic).
Pavement Performance and Studded Tires March 2006
7

Photo 12. Concrete pavement on I-90 in Spokane. ADT: 100,000 vehicles Pavement Age: 48 years
The following table illustrates the amount of wear due to studded tires that is present on the concrete pavements of Washington State compared to comparable pavements (in age) to those in California, Texas and Minnesota.
Table 1. Summary of State Concrete Pavement Performance.
State Roadway Age
Daily Two Way Traffic
Volume
Average Depth of
Wear (mm)
Washington SR-395 Ritzville 11 years 6,800 1 Texas I-45 Houston 16 years 178,000 0 Washington I-90 Seattle – Rainier Avenue 16 years 120,000 2 Minnesota I-84 Minneapolis 28 years 130,000 0 Washington I-90 Preston-Fall City 28 years 50,000 7 California SR-101 Ukiah 34 years 26,000 0 Washington I-5 Seattle – Boeing Field 34 years 204,000 5 Washington I-5 Tacoma 40 years 194,000 7 Washington I-90 Spokane 48 years 100,000 7
Hot Mix Asphalt Pavement Studded Tire Damage Damage to the surface of hot mix asphalt pavements comes in two main forms: pavement rutting and pavement raveling. While both rutting and raveling produce the same results, the source of the damage is quite different. Hot mix asphalt pavement rutting (also referred to as “shoving” or “plastic flow”) comes from trucks: the pavement is insufficient to support the heavy truck weight and deforms under the load. Hot mix asphalt pavement raveling comes from tire wear and especially from studded tire wear. The studded tires dig into the pavement and pick out the small aggregate, eventually forming a rut.
Although both rutting and raveling form ruts, they are quite distinct in cause and appearance. Figure 1 illustrates the difference between rutting (plastic flow caused by trucks) and raveling (caused by studded tires mounted on passenger vehicles).
Pavement Performance and Studded Tires March 2006
8

a. HMA shoving due to trucks
b. HMA raveling due to studded tires
Figure 1. Schematic of rutting (plastic flow) versus raveling.
A spectacular, but not typical, hot mix asphalt pavement rutting failure is shown in Photo 13: too much liquid asphalt in this pavement lead to the rapid rutting and shoving seen in the photo. Please note that this is a rare failure on a very small section of a truck weigh scale; the majority of hot mix asphalt pavement rutting is not this severe.
Photo 13. Spectacular, but not typical, hot mix asphalt pavement rutting (I-90 Port of Entry Weigh Scale, Spokane vicinity).
Hot mix asphalt pavement raveling due to studded tires is quite different in appearance (Photo 14). Studs grind the surface of the hot mix asphalt pavement, wearing a groove into the roadway. In Photo 14, note that the dual wheel width of the semi truck exceeds the width of the studded tire groove (or rut), while the car wheels of the vehicle shown in the background lay directly within the wear pattern. The dynamics of studded tire action include three phases; as the studded tire moves over the pavement, there are “spikes” in force at the beginning and at the end of contact. During these spikes, energy is transferred to the pavement in the form of scratching. Between these spikes, the studs have a “punching” action that breaks up aggregate and picks out the pavement surface.
Pavement Performance and Studded Tires March 2006
9

Photo 14. Wear due to studded tires on a hot mix asphalt pavement (I-90 in the vicinity of the Idaho Border).
Photo 15 shows a close-up of an open-graded hot mix asphalt pavement that has been damaged by studded tires. This pavement was originally placed in 1992 and was replaced three years later due to the significant rut caused by studded tires (approximately 1-½ inches deep).
Photo 15. Studded tires raveling on hot mix asphalt pavement on I-90 vicinity of Idaho border.
WSDOT Methodology for Evaluating Pavement Damage Due to Studded Tires New technology and equipment have provided the opportunity to accurately measure studded tire damage on state highways. Previously, ruts were measured using a system composed of three lasers: one laser near each wheel of the measurement van and one in the center of the lane. Though this system provides a good measure of the rut depth, accurate measurement of the maximum rut depth was
Pavement Performance and Studded Tires March 2006
10

highly dependent on the location of the vehicle within the lane of travel. Now the rut/wear depth measurements are collected with the use of an “INO Laser Rut Measurement System (LRMS).” The INO LRMS, manufactured by the National Optics Institute of Quebec, Canada, employs two laser line sources that measure the entire lane width. The INO laser measures the deformations of the pavement surface at ⅛ inch intervals (over 1280 measurement points per 12 foot lane) allowing for a highly accurate measure of rutting/wear.
The INO LRMS system (Photo 16 displays the INO LRMS mounted on the pavement condition van) is used in conjunction with the Washington State Pavement Management System (WSPMS) to evaluate the pavement condition on all state highways. WSDOT measures the pavement condition (cracking, rutting and roughness) of every state highway, every year. On two lane highways, the most heavily traveled direction is measured and on multi-lane highways the most heavily traveled lane in both directions is measured. In all, WSDOT measures and evaluates the pavement condition on over 7,000 centerline miles (approximately 10,000 lane miles) of highway every year. The pavement condition van (Photo 16), travels at highway speeds and collects the rutting data using the INO system, collects data that relates to the roughness of the roadway, as well as collecting high-resolution digital images for determining the amount of pavement cracking and patching.
Photo 16. High speed WSPMS van and schematic of rut/wear depth determination.
Photo 17. WSDOT pavement condition van.
Pavement Performance and Studded Tires March 2006
11

Ru
t (i
nc
h)
0.30
0.20
0.10
0.00
-0.10
-0.20
-0.30
4.6 feet
pavement
surface
0.0 2.0 4.0 6.0 8.0 10.0 12.0 14.0
Transverse Distance (ft)
Once the rut measurements are collected, they are analyzed to determine the maximum rut/wear depth, the location of the maximum rut/wear and the width of rut/wear in each wheel path. Figure 2 and Photo 18 show the studded tire wear on a concrete pavement.
Studded Tire Wear
Photo 18. Pavement view in location of studded tire wear (I-5, northbound, milepost 112.23, Lacey vicinity, concrete pavement).
Figure 2. Transverse profile in an area of studded tire wear (I-5, northbound, milepost 112.23, Lacey vicinity, concrete pavement).
Figure 3 and Photo 19, show rutting on hot mix asphalt pavement.
Pavement Performance and Studded Tires March 2006
12

shoving
Ru
t (i
nc
h)
0.30
0.20
0.10
0.00
-0.10
-0.20
-0.30
7.4 feet
5.3 feet shoving
pavement
surface
0.0 2.0 4.0 6.0 8.0 10.0 12.0 14.0
Transverse Distance (ft)
Rutting
Photo 19. Pavement view in location of rutting (I-5, southbound, milepost 63.00, Toledo vicinity, hot mix asphalt pavement).
Figure 3. Transverse profile in location of rutting (I-5, southbound, milepost 63.00, Toledo vicinity, hot mix asphalt pavement).
The profiles above are exaggerated on the vertical scale, compared to the horizontal scale, but they provide a clear picture of the amount of wear or rutting. The example on concrete pavement wear is
Pavement Performance and Studded Tires March 2006
13

entirely due to studded tires and shows a loss of material from the pavement. The example on hot mix asphalt pavement ruts are from shoving (or plastic flow) where the pavement has been physically deformed by heavy truck traffic.
Once the rutting/wear data has been collected, the amount of damage due to studded tires can be determined. On concrete pavements all of the wear damage can be attributed to studded tires; if all lane miles of concrete pavements are measured, then the extent of the studded tire damage can be determined. For hot mix asphalt pavements the situation is more complicated, in that shoving (or plastic flow) rutting needs to be distinguished from raveling. The current software used with the INO system cannot separate out these two types of damage to the surface of hot mix asphalt pavements. We are working with the software vendor to have the software revised so that we can determine the amount of studded tire damage on hot mix asphalt pavements. We hope to have this software revision sometime in 2006.
Analysis Considerations
1. The annual pavement condition survey is carried out only on one lane in simple two-way highways and one lane in each direction, generally the outside lane, on multi-lane and divided highways. On highways with hot mix asphalt pavement and three or more lanes per direction, it is often the second and/or third lane from the right that appears to have predominantly studded tire wear and unfortunately, this is currently not the lane where the annual pavement condition survey is collected. For hot mix asphalt pavements, the outside lane evaluation has to be used to estimate the amount studded tire wear on inside lanes. This could probably be accomplished by assuming a passenger car lane distribution factor (i.e., determine the amount of studded tire wear in the survey lane and then relate this amount of wear to the adjacent lanes that have more passenger car traffic).
2. For hot mix asphalt pavements on multi-lane and divided highways, the outside lanes where data is collected may have a combination of studded tire wear and rutting due to trucks. Whether the studded tire wear and rutting can be separately identified from the transverse profile has not yet been evaluated. If it is not possible to separate them, assumptions have to be made to prorate the amount of rutting/wear to each of the failure modes.
3. The INO LRMS is a new technology and has not been perfected with respect to acquiring 100 percent of the data 100 percent of the time, resulting in missing data for some of the roadway sections. These are identified in INO LRMS data acquisition and these can be excluded from the analysis. There are sufficient roadway sections with complete data for the proposed analysis.
Proposed Analysis Methodology For concrete pavements, the maximum wear depth will be evaluated at approximately 0.1-mile interval for all lanes. The wear on PCCP is entirely attributed to studded tires. The cost of the damage to pavement will be evaluated as the amount of grinding required to remove the wear when it reaches a threshold for corrective action.
Results of Concrete Pavement Analysis During 2004, as part of a concrete pavement rehabilitation study, WSDOT evaluated all lanes of concrete pavement on the state highway system. Table 2 illustrates the total number of concrete pavement lane miles according to the amount of measured studded tire damage.
Pavement Performance and Studded Tires March 2006
14

Table 2. Summary of studded tire wear on concrete pavements.
Rut Depth Number of (mm) Lane Miles
2 – 4 285 4 – 6 507 6 – 8 374 8 – 10 200 10 – 12 135 12 – 14 60 14 – 16 24 16 – 18 12 18 – 20 3 Total 1600
Number of lane miles with more 234
than 10mm rutting
WSDOT’s criterion for pavement rehabilitation due to pavement rutting/wear is 10 mm (~0.40 inches). Of the 1600 lane miles of concrete pavement, 234 lane miles exceed the threshold for rutting and need some type of rehabilitation. On concrete pavements, the primary methodology for removing pavement wear (if no other pavement distress is evident) is to diamond grind the pavement surface. The average cost for diamond grinding is approximately $90,000 per lane mile (this includes all construction costs, including traffic control, mobilization, etc).
Concrete pavement rehabilitation projects already programmed for other types of pavement distress overlap with these 234 lane-miles. If we are already going to rehabilitate a section of highway for other reasons (usually due to faulted pavement or structural damage), then we must remove these from the studded tire damage analysis. There are 32 lane-miles of planned rehabilitation; removing these projects leaves 202 lane-miles needing rehabilitation due to studded tire damage. At $90,000 per lane mile and 202 lane-miles, there is $18.2 million worth of studded tire damage to existing concrete pavements.
CONCLUSIONS Studded tire usage has caused at least $18.2 million damage to concrete pavements as determined by detailed rutting measurements. Damage may be similar, or much greater, for hot mix asphalt pavements, but determination of that damage will have to wait until software can be modified to perform the analysis.
Next steps:
1. Modify the INO software to allow calculation of studded tire damage to hot mix asphalt pavements. This work is underway and should be completed before the end of 2006.
2. Continue to gather annual rutting data and determine if there are trends in the accumulation of studded tire damage.
3. Locate funding sources to repair pavements damaged by studded tires.
Pavement Performance and Studded Tires March 2006
15

Appendix A: Studded Tire History in Washington State
Prior to 1969, Washington State law prohibited the use of studded tires. In 1969, legislation was introduced and approved which made the use of studded tires permissive year round. The following is a brief summary of events that have occurred from 1971 to present.
1971 WSDOT interviewed Washington residents to estimate the number of vehicles that were equipped with studded tires. The interviews were conducted at six locations in western Washington and nine locations in eastern Washington. Interview results indicated that 25% of the people in western Washington and 43% of the eastern Washington residents used studded tires. Of those people interviewed at North Bend and Cle Elum who were crossing Snoqualmie Pass, 44% had studded tires on their cars. At that time, WSDOT estimated approximately 30% of the vehicles statewide used studded tires.
Evidence of the damage caused to the roadway (i.e., pavement, striping, and lane markers) was collected and tested on the WSU test track. The department succeeded in having the use of studded tires restricted to the period from November 1
st to April 1
st .
1974 US Department of Transportation issued the following “Statement of Policy” to all states & local government:
“Available information indicates that there is no net safety benefit to be derived from the use of present studded tires. This fact, coupled with the excessive wear and physical damage to the roadway surfaces provides a sound basis for precluding the continued permissive use of a convenience feature, which is effective for relatively short periods of time. This warrants State and local consideration of efforts to ban or limit the use of studded tires which cause more pavement wear than normal treaded tires”.
1977 WSDOT prepared a report on the effects of studded tires on roadway surface integrity. The following is a summary of this report:
“Studded tires wear road surfaces at rates substantially greater than other tires. Most damage is in the form of rutting and reduced skid resistance. Such damage increases the potential for accidents caused by slippery pavements and by hydroplaning. Studded snow tires provide about a ten percent advantage over conventional tires in stopping ability on glare ice and hard packed snow. In all other situations, studded tires provide no advantage and even an 11% disadvantage on wet hot mix asphalt pavements. It’s estimated that there is compact snow or ice on our roadways only 1% of the time.”
1982 The 1977 report was updated to reflect the fact that fourteen states have banned the use of studded tires.
1984 An informal survey conducted in 1981 and again in 1984 indicated that studded tire usage is now about 9% in Western Washington and about 25% in Eastern Washington.
1984 WSDOT prepared and submitted legislation to ban the use of studded tires, legislation failed.
1987 WSDOT prepared a position paper regarding studded tires. The purpose of this document was to provide updated information about the relative merits and impacts of studded tire use. Once again, the Department submitted legislation to ban the use of studded tires. The bid did not pass.
1990 For three years, the Department didn’t pursue legislation to ban the use of studded tires. With improved all weather traction tires on the market and after a survey indicating a decline of studded tire sales, it had been assumed that the problem may eventually solve itself.
1991 HB 1154 was introduced to ban studded tires. The bill was amended to impose a $25 tax on each studded tire sold. This legislation did not pass.
1993 SB 5151 was introduced to ban studded tires. The bill was amended to impose a $25 tax on each studded tire sold. This legislation did not pass.
Pavement Performance and Studded Tires March 2006
16
1994 SB 5151 goes back to its original language. The Department and the Washington State Patrol testified in favor of the bill. The bill was amended to impose a permit fee of $8 per tire to be paid annually. Department of Licensing would issue stickers to be placed in the windshield of automobiles using studded tires. The legislation did not pass.
HB 2233 was introduced which would outlaw studs west of the crest of the Cascade Mountains unless it is snowing in Western WA. WSP testified against the bill because of enforcement. This bill did not pass.
1995 SB 5568 was introduced to define a lightweight stud (50% lighter than today’s studs) and define when the lightweight studs would go into effect. Lightweight studs claim to do half the damage as regular steel studs but the bill never passed out of committee.
1996 SB 5568 was again introduced, ending in the same results as 1995.
1997 SB 5250 was introduced, which is the same bill as in 1996 but the studs are only 35% lighter than the standard stud.
1998 WSDOT requested legislation for a 15% lighter stud, this died in the Rules Committee.
1999 Same request as 1998 but bill passed and became law M ay 7th, 1999.
2000 No legislation.
2001 Due to Blue Ribbon recommendations, legislation was introduced to place a $15 fee on each studded tire sold after July 2001. Also, in the House, a bill would have reduced the length time of studs could be used in Western Washington to just 3 months (December thru February). None passed.
2002 No legislation.
2003 Legislation proposed to enact a $15 fee per studded tire, this bill did not make it out of committee.
Pavement Performance and Studded Tires March 2006
17

1 Letter sent to Chris Christopher, WSDOT State Maintenance Engineer from Richard Nordness, Executive Director, NW Tire Dealers Association on January 27, 2004.
Pavement Performance and Studded Tires March 2006
18
300
250
200
150
100
50
0
1997 2003
Figure B1. NW Tire Dealers Associated estimate of studded tires sold in Washington State.
Stu
dd
ed T
ire
s S
old
Th
ou
sa
nd
s
Appendix B: Industry Estimate of Studded Tire Sales
Washington States Use of Studded Tires
The Northwest Tire Dealers Associated1 provided an estimate of the number of studded tires sold in
Washington State. The result of this estimate is shown in Figure B1 and indicates that the amount of studded tires sold in 2003 is 50 percent of those sold in 1996.

Appendix C: Nationwide Studded Tire Usage
The following graphs illustrate the usage of studded tires in the United States.
Figure A1. States that ban (shown in white) the use of studded tires.
Figure A2. States that allow (shown in white) studded tires with no restrictions.
Pavement Performance and Studded Tires October 2005
19

Figure A3. States that allow (shown in white) studded tires with date restrictions or lightweight stud requirements.
Pavement Performance and Studded Tires October 2005
20

Appendix D: Concrete pavement projects programmed in the 05-07 biennium
State Route Project Title Project Description
Number of miles with
> 10mm wear
5 I-205 to North Fork Lewis River Bridge Dowel bar retrofit and diamond grinding (southbound only)
5.30
5 Pierce County Line to Tukwila - Stage 4 Dowel bar retrofit and diamond grinding
18.19
5 317th HOV Direct Access Four new lanes and HOV southbound and HOV only northbound
2.70
5 Everett HOV Design Build Ads HOV lane and diamond grinding all existing lanes
2.75
90 Argonne to Sullivan Reconstructs an existing hot mix asphalt with concrete
n/a
182 Queensgate Drive Interchange Concrete reconstruction 0.00
195 Trestle Creek Road to Vicinity SR-271 Dowel bar retrofit and diamond grinding
0.00
205 SR-500 to I-5 Dowel bar retrofit and diamond grinding
1.57
240 I-182 to Columbia Center Reconstructs an existing hot mix asphalt with concrete
n/a
405 Renton HOV Design Build Adds HOV lane, rehabilitation to existing yet to be determined
0.00
405 Bellevue HOV Design Build Adds HOV lane, rehabilitation to existing yet to be determined
1.49
543 I-5 to International Boundary Reconstructs hot mix asphalt to concrete
n/a
Total Lane Miles 32.00
Pavement Performance and Studded Tires October 2005
21