pax global technology limited (327.hk) · pax global technology limited (327.hk) –2019 annual...
TRANSCRIPT

1
PAX Global Technology Limited (327.HK)
2019 Annual results

2PAX Global Technology Limited (327.HK) – 2019 Annual results
The information contained in these presentation materials has been prepared by PAX Global Technology Limited ( “Company” or “PAX”) (incorporated inBermuda with limited liability) solely for use at the presentation to prospective investors for introduction of the Company. By accepting this document,you are agreeing to maintain absolute confidentiality regarding the information disclosed in this document.
This document has not been independently verified. No representation or warranty, expressed or implied, is made as to, and no reliance should beplaced on the fairness, accuracy, completeness or correctness of the information contained herein. The information contained herein shall be studiedand considered based on the circumstances at the time as the information has not and will not be updated to reflect progress of events after the date ofthe presentation.
These materials contain statements that reflect the Company's current beliefs and expectations about the future as of the respective dates indicatedherein. You should not place undue reliance on forward-looking statements. These forward-looking statements are based on a number of assumptionsabout the Company's operations and factors beyond the Company's control and are subject to significant risks and uncertainties. Accordingly, actualresults may differ materially from these forward-looking statements. The Company expressly declaims any no obligation to update these forward-lookingstatements for events or circumstances that occur subsequent to such dates. There can be no assurance that the results and events contemplated bythe forward-looking statements contained in these materials will in fact occur.
The information contained in these materials may be of a price-sensitive nature and the provision of any such information shall constitute you and /oryour representatives as “insiders” subject to the laws of Hong Kong or elsewhere. Accordingly, you may not deal in, and will inform your representativesof the restriction against dealing in, any shares in the Company in breach of any applicable laws.
Disclaimer

3PAX Global Technology Limited (327.HK) – 2019 Annual results
❖ Year 2019 highlights
• Key milestones
• 2019 annual results snapshot
❖ Year 2020 recent updates
• Effect from coronavirus disease
• Corporate actions
• China business strategic adjustment
❖ Strategies & targets
• Corporate strategies
• Financial targets
Agenda

4PAX Global Technology Limited (327.HK) – 2019 Annual results
Key milestones in 2019
Record-high
Revenue
HK$ 4,926 million
Net profit
HK$ 625 million
Proposed final
dividend
HK$ 6 cents
Strong contribution
from Android smart
solution
Improved
AR turnover days
158155
134
FY 2017 FY 2018 FY 2019
Outperformed
financial targets
Topline +11.6%
GP margin 39.5%
OP margin 15.5%
(Day)
20%+
Revenue contribution
Android Others

5PAX Global Technology Limited (327.HK) – 2019 Annual results
36.8%
39.5%
35.0%
36.0%
37.0%
38.0%
39.0%
40.0%
FY 2018 FY 2019
Gross profit margin
(%)
2019 Annual results snapshot
• Revenue: HK$ 4,925.7 millionYoY up 11.6%, driven by strong overseas market performance (+21.3%)
• Gross profit: HK$ 1,944.8 millionYoY up 19.6%, gross profit margin: 39.5% (FY 2018: 36.8%)
• Operating profit: HK$ 761.6 millionYoY up 19.1%, operating profit margin: 15.5%
• Profit for the year: HK$ 624.9 millionYoY up 21.2%
• Profit attributable to the owners of the Company: HK$ 623.9 million
YoY up 19.4%
4,415
4,926
3,000
3,500
4,000
4,500
5,000
5,500
FY 2018 FY 2019
Revenue
(HK$ million)+ 11.6%
522
624
400
500
600
700
FY 2018 FY 2019
Profit attributable to the owners of the Company
(HK$ million)+ 19.4%+ 2.7 pts

6PAX Global Technology Limited (327.HK) – 2019 Annual results
Robust growth of overseas markets
HK$ 4,529 M (+21.3% yoy)Record-high overseas revenue
Accounted for more than 90% of the Group’s revenue
EMEA
+36%
APAC
+94%LACIS
+4%
USCA
+32%
HK$
740 M
HK$
928 M
HK$
2,515 M
HK$
346 M
LACIS region
• Gained significant market traction from newly launched smart
solutions A930 and A50 in Brazil
• Captured more market shares in Mexico, Argentina and Russia
EMEA region
• Gained more interests from payment services providers &
acquiring banks for smart terminal solutions
• Achieved robust sales growth in Italy, UK and Germany
• Captured the trend of governments’ initiatives on boosting
cashless societies in the Middle East and Africa
Asia Pacific (excluding China)
United States and Canada
Europe, the Middle East and Africa
Latin America and the Commonwealth of Independent States

7PAX Global Technology Limited (327.HK) – 2019 Annual results
Robust growth of overseas markets
APAC region
• Selected as one of the main smart terminal solution suppliers by
many local acquiring institutions & payment service providers
• Continued high growth momentum, with a record high of
shipments exceeding 600,000 units in India
• Achieved strong terminal shipment driven by government
cashless promotion and global events in Japan
USCA region
• Received magnificent interests and orders from partners for smart
terminal solutions
• Obtained important certifications with nationwide
telecommunications service providers
HK$ 4,529 M (+21.3% yoy)
EMEA
+36%
APAC
+94%LACIS
+4%
USCA
+32%
HK$
740 M
HK$
928 M
HK$
2,515 M
HK$
346 M
Record-high overseas revenue
Accounted for more than 90% of the Group’s revenue
Asia Pacific (excluding China)
Europe, the Middle East and Africa
Latin America and the Commonwealth of Independent States
United States and Canada

8PAX Global Technology Limited (327.HK) – 2019 Annual results
Smart ECR – E800
Smart Mobile - A77 Smart Tablet - AR8
Smart Mobile – A50Smart Mobile - A920
• Contributed more than 20% of the Group‘s total revenue in FY 2019
• Launched more than 15 Android models
• Increasing interests for PAX SmartPOS & Smart ECR solutions globally
Increasing demand of Android smart solutions

9PAX Global Technology Limited (327.HK) – 2019 Annual results
Effects on Coronavirus disease (COVID-19)
• Supply chain management (Short-term impact on shipment)
➢ EMS manufacturing in China
❖More than 90% of its production capacity has been recovered
➢ Major suppliers in China
❖More than 90% of the suppliers have recovered their production capacities
• Customers’ orders (Uncertainty remains)
➢ COVID-19 created uncertainties to global economy and terminal demands
➢ PAX remained conservative on customers’ orders expectation
Prompt actions taken
• A Disease Prevention and Control Committee led by the Group CEO
• Stringent preventive measures implemented in workplaces globally

10PAX Global Technology Limited (327.HK) – 2019 Annual results
China business strategic adjustment
Revised strategy in China in 2019
• Focus more on serving reputable and strong banks and third-party payment processors
Structural adjustments
• Optimize and streamline the operating structure of China business
➢ Headcounts reduction as of 30 March 2020: ~160
➢ 2019 one-off cost: ~ HK$ 6 million
➢ Expected annual saving: ~ HK$ 20 million

11PAX Global Technology Limited (327.HK) – 2019 Annual results
Corporate actions
Shares buyback Cash dividend
In Jan & Feb 2020
Repurchased 12.6 million shares
(1.15% of its ordinary shares)
Repurchased 5 times in 2020
Paid HK$ 49.4 million in total
Proposed final dividend of
HK$ 6 cents per share
+ 50%
Share option scheme
• Granted to employees in 2019
• ~ 82.5 million shares
(7.5% of total number of shares)
• 2019 expense: ~ HK$ 39 million
• Expected 2020 expense:~ HK$ 38 million
• Expected 2021 expense: ~ HK$13 million

12PAX Global Technology Limited (327.HK) – 2019 Annual results
Corporate strategies

13PAX Global Technology Limited (327.HK) – 2019 Annual results
Corporate strategies
Reinforce global sales networkIncrease investment in R&D
Investment and M&A Increase resources inkey overseas markets
Raise PAX brand recognition

14PAX Global Technology Limited (327.HK) – 2019 Annual results
Raise PAX brand recognition
• Roll out diversified Android product series and software products
• Introduce dedicated market strategies and channel agency policies
• Support global partners to become superior local companies
• Exhibit in global payment and fintech events, host global and regional partner conferences
2019 World Partner Conference - Macau 2018 TRUSTECH - France

15PAX Global Technology Limited (327.HK) – 2019 Annual results
Increase resources in key overseas markets
• Riding on the global cashless trend, accelerate the overseas business layout and
boost PAX’s market share
EuropeNorth America
Market: United States Markets: UK, France, Spain
Asia Pacific
Markets: India, Japan, Australia and New Zealand

16PAX Global Technology Limited (327.HK) – 2019 Annual results
• Broaden channel sales networks in Asia Pacific, Middle East, Africa and other regions
• Set up subsidiaries or acquire local distributors to further expand sales channels
• Explore the feasibility of setting up R&D teams and production bases overseas
• Construct a cloud-based technical information exchange platform (PAX Partner Network- PPN)
Reinforce global sales network
Middle East AfricaAsia Pacific

17PAX Global Technology Limited (327.HK) – 2019 Annual results
Increase investment in R&D
• Diversify revenue stream from single hardware business through R&D investment
Software
➢ Focus on the next generation of smart product series
➢ Broaden the application scenarios of self-service payment
➢ Introduce 3-5 new products every year
Hardware
PAXSTORE
➢ Software: gateway products
➢ Platform: PAXSTORE, PAXPAY
➢ Cloud-based technical info exchange platform: PAX Partner Network – PPN
➢ Technical support: PAXRhino

18PAX Global Technology Limited (327.HK) – 2019 Annual results
Investment and M&A
2 Set up overseas subsidiaries in consideration of the market conditions
3 Invest in potential distributors and partners
Acquire companies with synergies globally4
1 Incubate potential companies through PAX’s investment

19PAX Global Technology Limited (327.HK) – 2019 Annual results
3 years financial targets
FY 2020
Topline: Flattish
Gross profit margin: Above 39%
Operating profit margin: Above 15%
FY 2022
Topline: Low double-digit growth
Operating profit margin: Above 15%
FY 2021
Topline: Low double-digit growth
Operating profit margin: Above 15%

20PAX Global Technology Limited (327.HK) – 2019 Annual results
• Calvin Pei, Assistant Vice President - Corporate Finance & Strategy
• Mina Pang, Investor Relation Manager
Email: [email protected] Tel: +852 2500 8510
Investor relations contacts
21PAX Global Technology Limited (327.HK) – 2019 Annual results
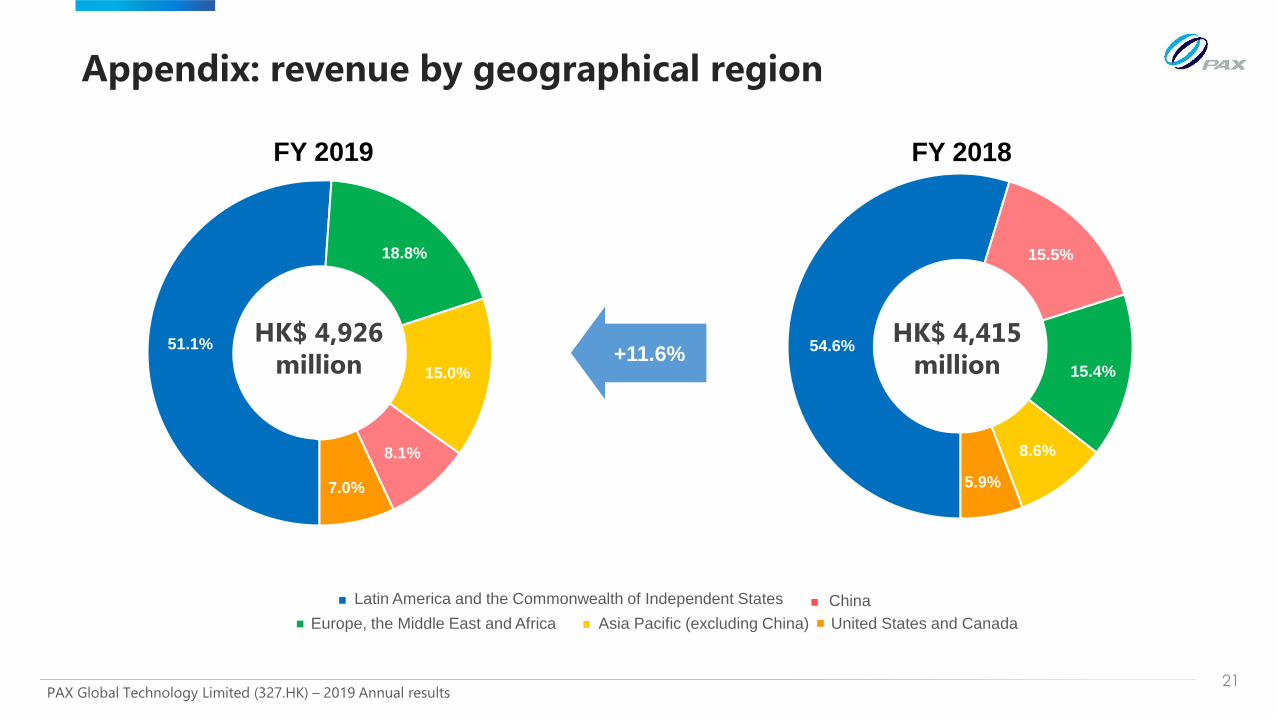
Appendix: revenue by geographical region
54.6%
15.5%
15.4%
8.6%
5.9%
Asia Pacific (excluding China) United States and Canada
China
Europe, the Middle East and Africa
Latin America and the Commonwealth of Independent States
51.1%
18.8%
15.0%
8.1%
7.0%
HK$ 4,415
million
FY 2018
HK$ 4,926
million
FY 2019
+11.6%

22PAX Global Technology Limited (327.HK) – 2019 Annual results
Appendix: financial summary
Income statement For the year ended 31 December
2019 2018
HK$’ 000 HK$’ 000
Revenue 4,925,733 4,415,409
Cost of sales (2,980,900) (2,788,728)
Gross profit 1,944,833 1,626,681
Other income 79,056 76,929
Other gains 12,774 7,577
Selling expenses (465,657) (437,809)
Administrative expenses (743,466) (590,819)Research and development costs (included in administrative expenses) (398,759) (332,016)
Net impairment losses on financial assets (65,914) (43,290)
Operating profit 761,626 639,269
Financial cost (5,155) (4,768)
Share of result of an investment accounted for using the equity method (1,798) (1,759)
Profit before income tax 754,673 632,742
Income tax expenses (129,809) (117,344)
Profit for the year 624,864 515,398
Earnings per hare for the profit attributable to the owners of the Company: HK$ per share HK$ per share
- Basic 0.567 0.475
- Diluted 0.567 0.475
Financial ratios Gross profit margin 39.5% 36.8%
Operating profit margin 15.5% 14.5%
Net profit margin 12.7% 11.7%
Return on equity 13.2% 12.4%
Return on assets 9.3% 9.0%

23PAX Global Technology Limited (327.HK) – 2019 Annual results
Appendix: condensed consolidated balance sheet
*Change in accounting standards
• The Group has adopted the new accounting policy, HKFRS 16 Leases, and made retrospective adjustments
• A new single accounting model is introduced for lessee accounting to recognise assets (i.e. Right-of-use asset) and liabilities (i.e. Lease liability)
arising from the commitments in the lease arrangements, unless the relevant lease term is short and the value of the underlying asset is low
As at 31 December
2019 2018
HK$’ 000 HK$’ 000
Non-current assets 522,520 431,818
*Right-of-use assets 221,347 -
Property, plant and equipment 69,610 72,368
Others 231,563 359,450
Current assets 6,196,703 5,343,736
Cash and cash equivalents 3,230,005 2,160,192
Trade and bills receivables 1,513,374 1,919,408
Inventories 1,301,459 1,182,015
Others 151,865 82,121
Non- current liabilities 104,217 21,964
*Lease liabilities 88,213 -
Others 16,004 21,964
Current liabilities 1,875,654 1,540,982
Trade and bills payables 1,382,487 1,190,447
Others 493,167 350,535
Total equity 4,739,352 4,212,608

24PAX Global Technology Limited (327.HK) – 2019 Annual results
Appendix: working capital
As at 31 December
2019 2018 +/-
HK$ ‘000 HK$ ‘000
Trade and bills receivables 1,513,374 1,919,408 -21.2%
Inventories 1,301,459 1,182,015 +10.1%
Trade and bills payables 1,382,487 1,190,447 +16.1%
Cash and cash equivalents 3,230,005 2,160,192 +49.5%
Turnover days As at 31 December
2019 2018 +/-
Trade and bills receivables 134 155 -21
Inventories 164 146 +18
Trade and bills payables 158 140 +18
Cash and cash equivalents 140 161 -21