payback period analysis -...
TRANSCRIPT

1
CE 231 – ENGINEERING ECONOMY
PAYBACK PERIOD ANALYSIS
Payback analysis (also called payout analysis) is another form of sensitivity analysis that uses
a PW equivalence relation. Payback can take two forms: one for i> 0 % (also called discounted
payback) and another for i = 0 % (also called no-return payback). The payback period np is the
time, usually in years, it will take for estimated revenues and other economic benefits to recover
the initial investment P and a specific rate of return i %. The np value is generally not an integer.
The payback period should be calculated using a required return that is greater than 0 %. In
practice, however, the payback period is often determined with a no-return requirement (i =
0%) to initially screen a project and determine whether it warrants further consideration.
To find the discounted payback period at a stated rate i > 0%, calculate the years np that make
the following expression correct.
0 = −𝑃 + ∑ 𝑁𝐶𝐹𝑡 (𝑃 𝐹, 𝑖, 𝑡)⁄
𝑡=𝑛𝑝
𝑡=1
NCF is the estimated net cash flow for each year t, where NCF = receipts – disbursements (Net
Cash-Flow). If the NCF values are equal each year, the P/A factor may be used to find np.
0 = −𝑃 + 𝑁𝐶𝐹 (𝑃 𝐴, 𝑖, 𝑛𝑝)⁄
After np years, the cash flows will recover the investment and a return of i %. If, in reality, the
asset or alternative is used for more than np years, a larger return may result; but if the useful
life is less than np years, there is not enough time to recover the initial investment and the i%
return. It is very important to realize that in payback analysis, all net cash flows occurring after
np years are neglected. This is significantly different from the approach of all other evaluation
methods (PW, AW (annual worth), ROR, B/C) where all cash flows for the entire useful life
are included. As a result, payback analysis can unfairly bias the selection of alternatives.
Therefore, the payback period, np, should not be used as the primary measure of worth to select
an alternative. It provides initial screening or supplemental information in conjunction with an
analysis performed using the PW or AW method.
No-return payback analysis determines np at i = 0%. This np value serves merely as an initial

2
indicator that a proposal is viable and worthy of a full economic evaluation. To determine the
payback period, substitute i = 0 % in the second equation and find np.
0 = −𝑃 + ∑ 𝑁𝐶𝐹𝑡
𝑡=𝑛𝑝
𝑡=1
For a uniform net cash flow series, the above equation is solved for np directly.
𝑛𝑝 = 𝑃
𝑁𝐶𝐹
An example use of no-return payback, as an initial screening of proposed projects, can be the
case where a president of a corporation, who absolutely insists that every project must recover
the investment in 3 years or less. Therefore, no proposed project with np > 3 at i = 0% should
be considered further.
As with np for i > 0 %, it is incorrect to use the no-return payback period to make final alternative
selections. It neglects any required return, as the time value of money is omitted, and it neglects
all net cash flows after time np, including positive cash flows that may contribute to the return
on investment.
In general, the conclusions are: a 10% return requirement increases payback from 8 to 12 years;
and when cash flows expected to occur after the payback period are considered, project return
increases to 15 % per year.
If two or more alternatives are evaluated using payback periods to indicate initially that one
may be better than the others, the primary shortcoming of payback analysis (i.e., neglection of
cash flows after np) may lead to an economically incorrect decision. When cash flows that occur
after np are neglected, it is possible to favor short-lived assets though longer-lived assets may
produce a higher return. In these cases, PW or AW analysis should always be the primary
alternative evaluation.
There are four important points to be understood about payback period calculations:
1. This is an approximate, rather than an exact, economic analysis calculation.
2. All costs and all profits, or savings of the investment, prior to payback are included
without considering differences in their timing.

3
3. All economic consequences beyond the payback period are completely ignored.
4. Being an approximate calculation, payback period may or may not select the correct
alternative. That is, the payback period calculations may select a different alternative
from that found by exact economic analysis techniques.
But if payback period calculations are approximate, and are even capable of selecting the wrong
alternative, why is the method used at all? The benefits of the payback period can be identified
in twofold. Firstly, the calculations can be easily made by people unfamiliar with economic
analysis, especially in analysis of no-return payback period. One does not need to know how to
use gradient factors, or even to have a set of compound interest tables. Second, payback period
is a readily understood concept.
Moreover, payback period does give us a useful measure, telling us how long it will take for
the cost of the investment to be recovered from the benefits of the investment. Businesses and
industrial firms are often very interested in this time period: a rapid return of invested capital
means that it can be re-used sooner for the other purposes by the firm (Engineering Economic
Analysis by Donald G. Newnan, 6th Edition, Engineering Press).
In summary, the payback period gives some measure of the rate at which a project will recover
its initial outlay. This piece of information is not available from the present value or the internal
rate of return. The payback period may not be used as a direct figure of merit, but it may be
used as constraint: no project may be accepted unless its payback is shorter than some specified
period of time.
Example: A company has two machine alternatives whose economic lives are 6 years. The
price and annual income of these machines are given in the following table. According to the
no return payback period, determine the alternative the company should invest.
Alternatives Cost (TL) Annual Income (TL/yr)
Machine A 200.000 45.000
Machine B 300.000 60.000
Payback Period1= 200.000/45.000 = 4,4 years
Payback Period2= 300.000/60.000 = 5 years
According to the payback periods, first alternative should be preferred.

4
Example: A company wants to buy a production device for their new factory. They have two
alternatives, whose cash flows are given in the following table. According to these cash flows,
determine the no return payback period of these alternatives.
Alternative A Alternative B
Cost 3.000.000 TL 3.500.000 TL
Annual Income 1.200.000 TL first year,
decreasing by 300.000 TL
per year thereafter
100.000 TL for the first year,
increasing 300.000 TL per
year thereafter.
Useful Life 4 years 8 years
Alternative A
Years 0 1 2 3 4
Cash Flow -3.000.000 1.200.000 900.000 600.000 300.000
Cumulative Value -3.000.000 -1.800.000 -900.000 -300.000 0
PBA= 4 years
Alternative B
Years 0 1 2 3 4 5
Cash Flow -3.500.000 100.000 400.000 700 000 1.000.000 1.300.000
Cumulative
Value
-3.500.000 -3.400.000 -3.000.000 -2.300.000 -1.300.000 0
PBB= 5 years
According to the payback periods, alternative A should be preferred.
Example: A construction company allocated a total of 18 million TL to a research on
innovative construction methods that will improve their construction activities. The results are
estimated to positively impact the net cash flow at the start of 6th year, and for the foreseeable
future, at an average level of 6 million TL per year. As an initial screening for economic
viability, determine both the no-return and i = 10% payback periods.

5
The NCF for years 1 through 5 is 0 TL and 6 TL million thereafter. Let x = the number of years
beyond 5 when NCF > 0. For no-return payback. In TL million units,
i = 0%: 0 = -18 + 5(0) + x (6)
np = 5 + x = 5 + 3 = 8 years
for i = 10%
i= 10%: 0= -18+ 6 (P/A, 10%, x) (P/F, 10%, 5)
(P/A, 10%, x)= 18
6 ∗(0,6209)= 4,8319
x= 6,9 years
np= 5+7=12 years (rounded up)
Example: Compute the payback period of the following cash flow both for the no return and i
= 10% payback periods.
End of year 0 1 2 3 4 5 6
Cash Flow -100 25 30 25 -10 45 45
a) For i= 0%, np = 4 + 100− (25+30+25−10)
45 = 4,66 years
b) 0 = -100 + 25 (P/A, 10%, 3) + 5 (P/F, 10%, 2) – 10 (P/F, 10%, 4) + 45 (P/A, 10%, x)
(P/F, 10%, 4)
100 = 25* (2,4869) + 5* (0,8264) -10 (0,6830) + 45 (P/A, 10 %, x) (0,6830)
(P/A, 10 %, x) = 4,5255
30,735 = 1,3185
(by interpolation)
n=1 (P/A, 10%, 1) = 0,9091
n=2 (P/A, 10%, 2) = 1,7355
x= 1+ 1,3185−0,9091
1,7355−0,9091 = 1,495
np = 4+ 1,495 = 5,495 years
OR By trial and error
x = 1,483 years
np = 4+ 1,483 = 5,483 years
OR

6
Years 0 1 2 3 4 5 6
Cash Flow -100 25 30 25 -10 45 45
PW -100 22,73 24,79 18,78 -6,83 27,94 25,40
Cumulative Present Worth -100 -77,27 -52,48 -33,70 -40,53 -12,59 12,82
np = 5+ 12,59
12,59+12,82 = 5,495 years
Example: Compute the payback period of the following cash flow for i = 10% payback periods.
End of year 0 1 2 3 4 5 6
Cash Flow -100 25 30 25 -10 45 50
Years 0 1 2 3 4 5 6
Cash Flow -100 25 30 25 -10 45 50
PW -100 22,73 24,79 18,78 -6,83 27,94 28,225
Cumulative Present Worth -100 -77,27 -52,48 -33,70 -40,53 -12,59 15,635
np= 5 + 12,59
12,59+15,635 = 5,446 years
NOTE: You can use (P/A, i%, x) expression if and only if you have an annual equivalent cash flow
with x to be more than “1”. For other cases you should use percent contribution of present/future value
of the last cash, as follow:
Alternative Solution:
0 = -100 + 25 (P/F, 10%, 1) + 30 (P/F, 10%, 2) + 25 (P/F, 10%, 3) – 10 (P/F, 10%, 4) + 45 (P/F,
10%, 5) + 50 (x%) (P/F, 10%, 6)
0 = -100 + 25 (0,9091) + 30 (0,8264) + 25 (0,7513) – 10 (0,6830) + 45 (0,6209) + 50 (x%)
(0,5645)
0 = -100 + 22,7275 + 24.7920 + 18,7825 – 6,8300 + 27,9405 + 28,2250 (x%)
12,5875 = 28,2250 (x%)
x% = 0,446
np= 5 + 0,446 = 5,446 years

7
Example: A construction company wants to invest on a new regulator that produces electricity.
The initial cost of the regulator is 10,5 million TL. The regulator will produce 40 million kwh
with 81% efficiency per year. The government will buy the electricity at a price of 5 cent per
kwh. After 30 years, the company will transfer the regulator to the government with no salvage
value. If the MARR of the company is 12%, determine the payback period of this project.
C= 10,5 *106 TL
A= 0,81* 40 *106* 5/100= 1,62 *106 TL
-10,5*106 + 1,62*106(P/A, 12%, PB) =0
(P/A, 12%, PB)= 10,5/1,62= 6,4815 (trial and error by looking from interest tables)
PB 13,05 years
Example: A factory was bid at a cost of 25 million TL to a company. In addition, the company
paid 5 million TL for the land of the factory and 16 million TL for the buildings associated with
the factory. The useful life of the factory was determined as 30 years, and the salvage value of
the factory was assumed to be 20 million TL. The average sales per year were determined as
2.500 units. The cost of the each unit is tabulated as follows:
The price of the product : 10.000 TL/unit
Cost TL/unit
Material 2.000
Workmanship 1.500
Energy 1.000
Management 200
Marketing 150
Finance 100
General Expenses 110
By considering the MARR of the company as 25% per year, determine discounted payback
period of the project.
C= 25*106 + 5*106 +16*106 = (46*106) TL
A= (10.000 – 2.000 – 1.500 - 1.000 – 200 – 150 – 100 – 110) * 2.500 = 12,35*106 TL/year

8
46*106 = 12,35*106 (P/A, 25%, X)
(P/A, 25%, X) = 3,725 (trial and error by looking up interest tables)
X 12 years
Example: Consider a three-year project that has a two-year no-return payback period
a) Will the project NPV be positive?
b) Will the project IRR be higher than the cost of capital?
c) Should the project be accepted?
The answer to all parts of the question is: “we cannot know with the information provided.”
Simply because, the project’s payback period tells us nothing about whether it generates a net
positive return or that the return is higher than the cost of capital. Payback does not include the
time value of money. Therefore, we do not know if we should accept the project or not.
Example: A company invested 1.600.000 TL. The cash flow of the investment is illustrated
below. The no-return payback period for this investment is determined as 8 years. Determine
the MARR, if the profit obtained at the end of the life of the investment is 297.440 TL.
1.600.000= X + (X+50.000) + (X+100.000) + (X+150.000) + …+ (X+350.000)
1.600.000= 8X + 50.000 (1+ 2+ 3+ 4+ 5+ 6+ 7)
1.600.000= 8X + 50.000 * (28)
X= 25.000 TL
X X+50.000
X+100.000
X+450.000
0 1 2 3 4 5 6 7 8 9 10
…..
1.600.000
9
297.440 = - 1.600.000 (F/P, i%, 10) + [25.000 + 50.000 (A/G, i %, 10)] (F/A, i%, 10)
297.440 + 1.600.000 (F/P, i%, 10) – [25.000 + 50.000 (A/G, i %, 10)] (F/A, i%, 10) = 0
With trial and error:
i= 8 %
297.440 + 1.600.000 *2,159 – [25.000 + 50.000*3,8713]*14,487= 585.488,85
i= 6%
297.440 + 1.600.000* 1,791 – [25.000 + 50.000*4,0220]*13,181= 182.815,90
i= 5 %
297.440 + 1.600.000*1,629 – [25.000 + 50.000*4,0991]*12,578= 11.466,01
i= 4 %
297.440 + 1.600.000* 1,480 – [25.000 + 50.000* 4,177]*12,006= - 142.163,1
MARR = 4 + [142.163,1 / (142.163,1 + 11.466,01) = 4,925%
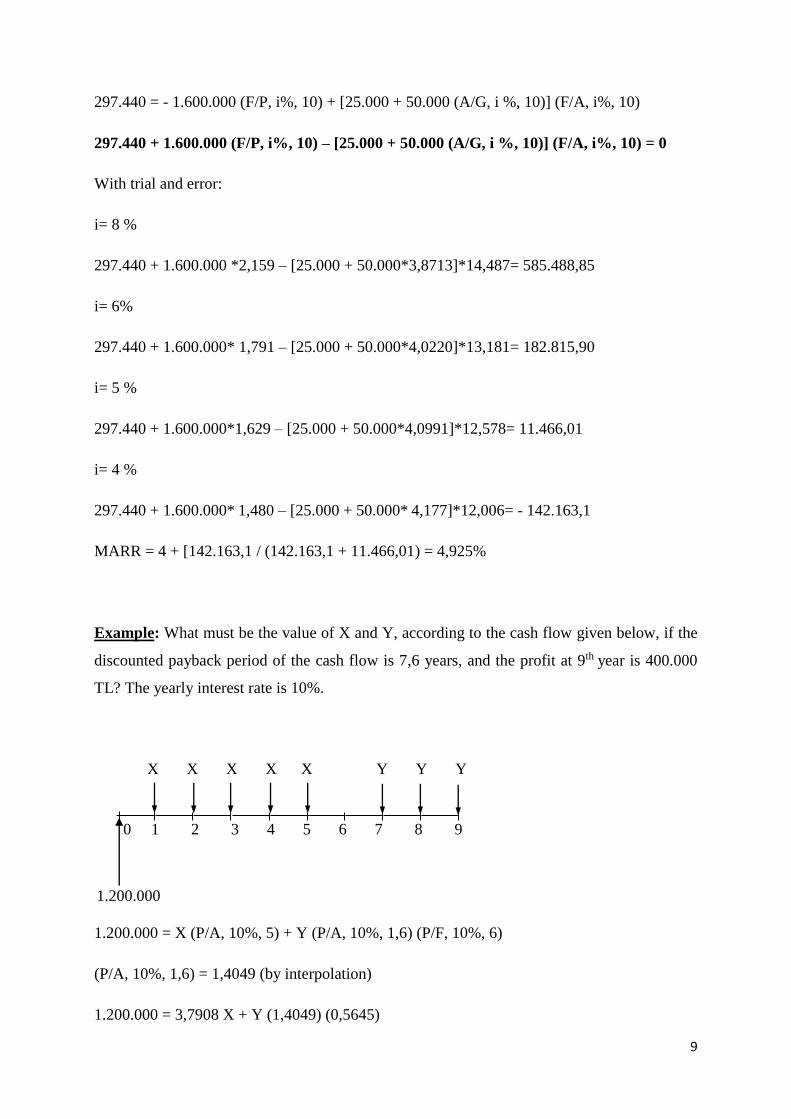
Example: What must be the value of X and Y, according to the cash flow given below, if the
discounted payback period of the cash flow is 7,6 years, and the profit at 9th year is 400.000
TL? The yearly interest rate is 10%.
1.200.000 = X (P/A, 10%, 5) + Y (P/A, 10%, 1,6) (P/F, 10%, 6)
(P/A, 10%, 1,6) = 1,4049 (by interpolation)
1.200.000 = 3,7908 X + Y (1,4049) (0,5645)
0 1 2 3 4 5 6 7 8 9
X X X X X Y Y Y
1.200.000

10
1.200.000 = 3,7908 X + 0,7931 Y (Equation 1)
400.000 = -1.200.000 (F/P, 10%, 9) + X (F/A, 10%, 5) (F/P, 10%, 4) + Y (F/A, 10%, 3)
400.000 = - 1.200.000 (2,3579) + X (6,1051) (1,4641) + 3,3100 Y
3.229.480 = 8,9385 X + 3,3100 Y (Equation 2)
1.200.000 = 3,7908 X + 0,7931 Y
3.229.480 = 8,9385 X + 3,3100 Y
-4,1735*(1.200.000 = 3,7908 X + 0,7931 Y)
-5.008.200 = -15,8209 X – 3,3100 Y 1st equation
3.229.480 = 8,9385 X + 3,3100 Y 2nd equation
6,8824 X = 1.778.720
X= 258.444,73 TL
1.200.000 = 3,7908 (258.444,73) + 0,7931 Y
Y= 277.755,29 TL
Alternative Solution:
400.000 = 0,40 Y (F/P, 10%, 1) + Y
400.000 = 0,40 Y (1,1000) + Y
400.000 = 1,44 Y
Y = 277.777,78 TL
1.200.000 = X (P/A, 10%, 5) + Y (P/F, 10%, 7) + 0,60 Y (P/F, 10%, 8)
1.200.000 = X (3,7908) + 277.777,78 (0,5132) + 277.777,78 (0,60) (0,4665)
1.200.000 = X (3,7908) + 220.305,56
979.694,44 = X (3,7908)
X = 258.440,02 TL
By solving these two equations simultaneously

11
Alternative Solution:
Years 0 1 2 3 4 5 6 7 8 9
Cash
Flow
- C0 X X X X X - Y Y Y
PW - C0 0,9091X 0,8264X 0,7513X 0,6830X 0,6209X 0 0,5132Y 0,4665Y 0,4241Y
Cum.
PW - C0
- C0 +
0,9091X
- C0 +
1,7355X
- C0 +
2,4868X
- C0 +
3,1698X
- C0 +
3,7907X
- C0 +
3,7907X
- C0 +
3,7907X
+
0,5132Y
- C0 +
3,7907X
+
0,9797Y
- C0 +
3,7907X
+
1,4038Y
C0 = 1.200.000 TL
According to discounted payback period;
Between years 7-8 (PW7,6 – PW7: Change to PW=0) / (PW8 – PW7: Total Change in 1-year)
= 0,60
|0 + C0 - 3,7907 X - 0,5132 Y| / |0,4665 Y| = 0,60
(1.200.000 – 3,7907 X – 0,5132 Y) / 0,4665 Y = 0,60
1.200.000 – 3,7907 X – 0,5132 Y = 0,2799 Y
3,7907 X + 0,7931 Y = 1.200.000 1st equation
According to the profit at the end of 9 years;
400.000 = (- C0 + 3,7907 X + 1,4038 Y) (F/P, 10%, 9)
400.000 = (- 1.200.000 + 3,7907 X + 1,4038 Y) (2,3579)
400.000 = - 2.829.480 + 8,9381 X + 3,3100 Y
8,9381 X + 3,3100 Y = 3,229,480 2nd equation
Example: Company A is considering three alternatives for investment, as shown below:
Alternative 1: P = -50.000 TL; n = 5 years; NCF = 28.000 TL per year
Alternative 2: P = -100.000 TL; n = 7 years; NCF = 70.000 TL for first and third year,
decreasing by 10.000 TL per year thereafter
Alternative 3: P = -120.000 TL; n = 10 years; NCF = 40.000 TL for year 1, increasing by
2.500 TL per year thereafter

12
a) According to no-return payback period, which investment should be selected?
b) Calculate the internal rate of return for the cash flows of each project over its respective
life. By considering the calculated internal rate of returns, which investment should be
selected?
c) By considering the net present values (MARR of 12% per year), which investment
should be selected?
d) According to the evaluations above, which alternative should the company invest?
Why?
Alternative 1 Alternative 2
Alternative 3
a) 1+ 22.000
28.000 = 1,786 years
2+ 30.000
70.000 = 2,428 years
2+ ( 120.000−82.500)
45.000 = 2,833 years
Select Alternative 1
28.000 28.000 28.000 28.000 28.000
50.000
0 1 2 3 4 5
100.000
70.000
0 1 2 3 4 5 6 7
30.000
120.000
40.000 42.500
45.000
47.500
0 1 2 3 4 5 6 7 8 9 10
50.000 52.500 55.000
57.500 60.000
62.500
70.000
60.000 50.000
40.000

13
b) For Alternative 1:
PW=-50.000 + 28.000 (P/A, i%, 5) = 0
With trial and error:
i= 40%
50.000 + 28.000 * 2,0351= 6.984,59
i= 45%
50 000 + 28 000 * 1,8755= 2.514,77
i= 50%
50.000 + 28.000 * 1,7366= -1.374,49
45+ 2.514,77
(2.514,77+1.374,49) *5 = 48,23 ROR= 48,23 %
For Alternative 2:
PW=-100.000+ (70.000- 10.000 (A/G, i%, 5))* (P/A, i%, 5)*(P/F, i%, 2) + 70.000 (P/F,
i%, 1) = 0
With trial and error:
i= 40%
-100.000+ (70.000- 10.000* 1,3580)* 2,0351* 0,5102+ 70.000* 0,7143= 8.583,77
i= 45%
-100.000+ (70.000- 10.000* 1,2980)* 1,8755* 0,4756+ 70.000* 0,6896= -859,32
40+ 8.583,77
(8.583,77+859,32) *5 = 44,54 ROR= 44,54 %
For Alternative 3:
PW =-120.000 + (40.000 + 2.500 *(A/G, i%, 10))* (P/A, i%, 10) =0
With trial and error:
i = 40%
-120.000+ (40.000+ 2.500 * 2,1419) * 2,4136= -10.533,1
i = 35%
-120.000+ (40.000+ 2.500 * 2,3337) * 2,715= 4.442,37
35+ 4.442,37
(10.533,1+4.442,37) = 36,48 ROR= 36,48 %
Select Alternative 1

14
c) For Alternative 1:
-50.000 + 28.000 (P/A, i%, 5)
-50.000 + 28.000 (P/A, 12%, 5)
-50.000+ 28.000 * 3,6048= 50.933,73
A= 50.933,73 (A/P, 12%, 5) = 50.933,73*0,2774=14.290,017 TL/yr
Common multiple of years: 70 years
PW (70) = 14.290,017 (P/A, 12%, 70)= 14.290,017*8,3303=117.698,95 TL
For Alternative 2:
-100.000+ (70.000- 10.000 (A/G, i%, 5))* (P/A, i%, 5)*(P/F, i%, 2) + 70.000 (P/F, i%,
1)
-100.000+ (70.000- 10.000 (A/G, 12%, 5))* (P/A, 12%, 5)*(P/F, 12%, 2) + 70.000 (P/F,
12%, 1)
-100.000+ (70.000- 10.000* 1,7746)* 3,6048* 0,8929+ 70.000* 0,8929= 112.662,8
A= 112.662,8*(A/P, 12%, 7) = 112.662,8 *0,2191=24.684,42 TL/yr
PW (70) = 24.684,42 (P/A, 12%, 70) = 24.684,42*8,3303= 205.628,62 TL
For Alternative 3:
-120.000 + (40.000 + 2.500 *(A/G, i%, 10))* (P/A, i%, 10)
-120.000 + (40.000 + 2.500 *(A/G, 12%, 10))* (P/A, 12%, 10)
-120.000+ (40.000+ 2.500 *3,5846)* 5,6502= 156.644,1
A= 156.644,1 (A/P, 12%, 10)= 156.644,1 * 0,1770= 27.726 TL/yr
PW (70) = 27.726(P/A, 12%, 70)= 27.726 *8,3303= 230.965,95 TL
Select Alternative 3
d) Since the time value of money and cash flows that occur after PB are neglected in the
no-return payback analysis, this method leads to a misleading alternative. Also, internal
rate of return has a shortcoming in evaluation of mutually exclusive alternatives;
therefore the projects should be evaluated by using incremental rate of return method.
According to the other methods, the net present value method is a preferable method.
Consequently, alternative 3 is determined as the best alternative among the alternatives.

15
Example: Which alternative should be selected according to
a) Discounted Payback Period Analysis?
b) Present Worth Comparison?
Take MARR = 10% per year (cash units are TL).
Alternative 1
End of year 0 1 2 3 4
Cash Flow -150 50 50 -20 150
Alternative 2
End of year 0 1 2 3 4 5 6
Cash Flow -100 50 40 20 30 -20 50
a) According to Discounted Payback Period:
End of year 0 1 2 3 4
Cash Flow -150 50 50 -20 150
(P/F,10%,n) - 0,9091 0,8264 0,7513 0,6830
PW -150 45,455 41,320 -15,026 102,45
Cum. PW -150 -104,545 -63,225 -78,251 24,199
np = 3 + 78,251/(78,251+21,199) = 3,764 years
End of year 0 1 2 3 4 5 6
Cash Flow -100 50 40 20 30 -20 50
(P/F,10%,n) - 0,9091 0,8264 0,7513 0,6830 0,6209 0,5645
PW -100 45,455 33,056 15,026 20,490 -12,418 28,225
Cum. PW -100 -54,545 -21,489 -6,463 14,027 1,609 29,834
np = 3 + 6,463/(6,463+14,027) = 3,315 years
Since np (Alt 2) < np (Alt 1) Alt 2 should be selected!
b) According to Present Worth Comparison (NPV):
From tables of the previous step;

16
NPV (Alt 1) = 24,199 TL for 4 years
NPV (Alt 2) = 29,834 TL for 6 years
NPV (Alt 1) 12 years = 24,199 [ 1 + (P/F, 10%, 4) + (P/F, 10%, 8) ]
NPV (Alt 1) 12 years = 24,199 [ 1 + (0,6830) + (0,4665) ] = 52,016 TL
NPV (Alt 2) 12 years = 29,834 [ 1 + (P/F, 10%, 6) ] = 29,834 [ 1 + (0,5645) ] = 46,675 TL
Since NPV (Alt 1) > NPV (Alt 2) Alt 1 should be selected!
Example: A family is planning to deposit 2.400 TL/year in a bank with a 25% interest rate.
How many years will they deposit this amount, in order to gain 17.000 TL/year continuously
starting after the year of making last payment? (Hint P=𝐴 [(1+𝑖)𝑛−1
𝑖(1+𝑖)𝑛 ])
lim𝑛→∞
(1+𝑖)𝑛−1
𝑖(1+𝑖)𝑛 = 1
𝑖
P= 17.000/i=17.000/0,25 = 68.000
2.400 (F/A, 25%, n) = 68.000
[(1+0,25)𝑛−1
0,25] = 28,33
(1 + 0,25)𝑛 − 1 = 7,0825
1,25n = 8,0825
n . log (1,25) = log (8,0825)
n = 9,37 years