paying for green energy: the case of the chilean patagonia · for green energy: the case of the...
TRANSCRIPT

Journal of Policy Modeling 38 (2016) 397–414
Available online at www.sciencedirect.com
ScienceDirect
Paying for green energy: The case of theChilean Patagonia�
Juan-Pedro Garces-Voisenat a,∗, Zinnia Mukherjee b
a Department of Economics, Siena College, USAb Department of Economics, Simmons College, USA
Received 2 February 2016; received in revised form 22 February 2016; accepted 10 March 2016Available online 26 March 2016
Abstract
We survey and assess the willingness to pay (WTP) for environmentally-friendly sources of energy, in thecontext of the proposed construction of five hydroelectric dams in the Chilean Patagonia. We then comparethe estimated WTP to the real costs of generating electricity with different currently available technologiesfor renewable sources of energy. Overall, we find that the WTP of Chilean citizens would be more thanenough to pay for greener sources of energy. We also find that the WTP is affected by age and gender of therespondents, but surprisingly not by income.© 2016 The Authors. Published by Elsevier Inc. on behalf of The Society for Policy Modeling. This is anopen access article under the CC BY-NC-ND license (http://creativecommons.org/licenses/by-nc-nd/4.0/).
JEL classification: O1; Q2; Q4
Keywords: Green economy; Sustainable development; Energy; Environment; Chilean Patagonia
1. Introduction
Many emerging economies that are at a crossroads of their development processes face thecritical question of choosing the energy sources needed to promote economic growth. Tradi-tional sources based on fossil fuels have been proved to be damaging to the local and global
� A previous version of this paper has been deposited as a working paper in the Munich Personal RePEc Archive (MPRA),under the name ‘Estimating the willingness to pay for environmental resources in the Chilean Patagonia’ (MPRA paper39320, http://mpra.ub.uni-muenchen.de/39320/). MPRA acts only as a repository, and has no copyright over the paper.
∗ Corresponding author at: 515 Loudon Road, Loudonville, NY 12211, USA. Tel.: +1 518 783 2908.E-mail address: [email protected] (J.-P. Garces-Voisenat).
http://dx.doi.org/10.1016/j.jpolmod.2016.03.0120161-8938/© 2016 The Authors. Published by Elsevier Inc. on behalf of The Society for Policy Modeling. This is anopen access article under the CC BY-NC-ND license (http://creativecommons.org/licenses/by-nc-nd/4.0/).

398 J.-P. Garces-Voisenat, Z. Mukherjee / Journal of Policy Modeling 38 (2016) 397–414
environment. The more environmentally-friendly sources, such as solar, wind, geothermal andmini-hydro generating plants, tend to have higher operational costs, which poses a challenge topoorer economies.
An emerging economy that faces this critical choice is Chile. The country has been increasinglyusing coal- and natural-gas-powered plants to produce energy, along with declining hydroelectricgeneration. Traditionally, the country has exploited its hydroelectric potential by building bighydroelectric dams in several rivers of its central regions. Unfortunately, the rainfall is quiteirregular in the central zone of Chile, which causes frequent disruptions in the supply of electricity.This has prompted a trend toward the construction of thermal fossil fuel plants. However, theunreliable supply of natural gas from Argentina and the declining Chilean coal production, coupledwith the increased environmental awareness of the population, are threatening the viability of thisnew mix.
In recent years, the construction of five big hydro-electric dams was proposed on the riversBaker and Pascua, two pristine rivers in the Patagonia region of Chile. Never before had thisregion been used for such purposes, and in fact its whole extent of some 150 thousand km2
of rainforest, glaciers and snow-capped mountains remains basically in its primitive state, withsparse settlements of aboriginal people and early settlers. There are a few scattered towns whichlive off the agricultural and fisheries activities. But the area is mostly known for its rugged nature,its scenic beauty and the abundant reserves of water it contains.
This project (HidroAysén) would have required flooding 29 km2 of natural reserve lands andalso building power lines and 70-meter-high towers along a stretch of about 1000 km in the ChileanPatagonia, which in turn would have entailed clearing a considerable amount of rainforest. Thebenefits promised by the private consortium in charge of the construction were 2750 MW ofnew installed capacity for the Chilean energy grid, which represents 20% of its current installedcapacity.
The threats to the environment posed by large-scale hydroelectric generation are not circum-scribed to the displacement of local populations, the destruction of native forests and ecosystemsand some esthetic considerations. It has also been found that the operation of large dams inthe generation of electricity can produce considerable amounts of greenhouse gases (Fearnside,2004), on occasions as much as fossil-fuel generating processes.
Before the project was recently rejected on environmental grounds by the government ofChile (June 2014) after seven years of negotiations, some studies and surveys were carried outto measure the degree of support for the project from the local population and the population ofChile at large. Most of them showed reticence to accept alterations to the natural environment ofPatagonia and a relatively widespread support for the introduction of green tariffs in the productionand distribution of electricity. Ponce, Vásquez, Stehr, Debels, and Orihuela (2011), using thecontingent valuation method (CVM), showed that urban dwellers of four major cities in Chile hada willingness to pay (WTP) per year equivalent to 28% of the cost of the project for one of the fivedams.
In this paper, we also use CVM to estimate WTP, with a nationwide sample of respondents andreferring to the whole project (five dams). The study was concluded in March 2013, just a yearbefore the project was canceled. In spite of the project having been recently discarded, we thinkthis exercise has enormous value for the design of energy generation policies – and particularlythe consideration of green policies – in developing countries.
We expect this paper to offer a fresh look at a problem that is currently affecting many devel-oping countries in their quest for growth. In the South American context, this concern is sharedby countries like Ecuador, Peru and Brazil, which face increasing threats over their Amazonian

J.-P. Garces-Voisenat, Z. Mukherjee / Journal of Policy Modeling 38 (2016) 397–414 399
rainforest. Also, from a policy perspective, we aim to find some evidence of the Chileans’ WTP topreserve Patagonia’s pristine status, from where we can extrapolate some conclusions for similarsituations in other developing economies.
There are three questions that are of interest to us, to which we try to offer an answer:
(i) Are there green alternatives (to the dams) that could be capable of generating the electricitythat Chile needs for its developing economy?
This question is addressed in Section 2. We find there to be multiple options which couldreplace hydroelectric power.
(ii) How much is the value of the endangered natural capital, as estimated by the WTP of theChilean people?
We address this question and attempt an answer in Section 6. The validity of this answeris obviously dependent on the representativeness of the random sample used in the survey(which is our main methodological tool for the analysis). We are aware of the fact that alarger sample would eventually be desirable.
(iii) If this value is substantial, would it be enough to pay for the transition to alternative (greener)modes of energy generation?
The value that we have calculated in Section 4, based on the results of the survey, seemsto be more than enough for this purpose, as stated in Section 6 (policy recommendations andconclusions), given the information we have on costs of different modes of energy generation(Section 2).
Additionally, we carry out a brief analysis on the determinants of the WTP for environmentalresources, as revealed by the responses to the survey of this study. This analysis might be usefulfor the purpose of eventually establishing differentiated green tariffs among energy consumers.
The paper is structured as follows. In the next section, we discuss the possible alternativesexisting for Chile regarding environmentally-friendly sources of energy, in an attempt to answerthe first question. Section 3 provides a brief discussion of the relevant literature and our choiceof methodology. Section 4 describes our survey design and responses. In Section 5, we develop asimple empirical model we use to analyze the determinants of the WTP. Finally, Section 6 presentsa brief discussion of the results of the survey and a few concluding remarks.
2. Are there alternatives?
What HidroAysén was proposing was basically expanding the energy grid of Chile with2750 MW of installed capacity, which would generate an average of 18,430 GWh of electric-ity generation annually. This would represent 21% of the demand in the Central InterconnectedSystem (SIC) of Chile by the year 2020, according to their own estimates (HidroAysén Website,2015).
The installed capacity of the Chilean energy grid was 15,700 MW in the year 2010, with thefollowing modes of generation: large-scale hydro (32%), coal and diesel (32%), natural gas (32%)and others, basically mini-hydro, wind and biomass (4%). This compares rather favorably to theworld shares: 65% fossil fuels, 15% nuclear, 15% hydro and 5% others (minenergia.cl, 2012). Themaximum demand in Chile is currently estimated at 8000 MW, which has the system operatingat slightly over 50% of its capacity.
The forms of power generation that are considered “clean” are grouped into what are called the“non-conventional renewable energies” (NCRE), and they can be obtained through wind turbines,

400 J.-P. Garces-Voisenat, Z. Mukherjee / Journal of Policy Modeling 38 (2016) 397–414
biomass (principally poultry and pork manure and agricultural residues), geothermal energy, solarthermal and photovoltaic, ocean tidal waves and mini-hydro plants. The nuclear option has beendiscarded by the Chilean government for now, in the wake of the disaster of Fukushima, Japan,in 2011 (Chile is also a quake-prone country).
Chile has clear comparative advantages in the production of solar energy, especially ofthe photovoltaic type. It has the driest desert in the world (the Atacama Desert), with closeto 365 sunny days per year. This vast extension of land does not have many other alter-native uses. In fact, all the northern half of Chile (a stretch of some 2500 km) enjoysexceptionally high amounts of solar radiation, basically due to the influence of the Hum-boldt current of the Pacific Ocean. It is estimated that solar concentrations in Chile areproducing a KWh at a cost of US$ 10–14 cents. By comparison, coal-powered energy hasa cost of 8–10 (without considering environmental costs). HidroAysén promised to producehydroelectricity at 9–10 cents per KWh (Valdivia, 2015). With the help of nanotechnology,enormous strides of progress are being made in the production, storage and distribution ofsolar energy (Rogers & Wisland, 2015), which should decrease costs further from their currentlevels.
The country also has a significant potential for geothermal energy production. The EnergyMinistry (Ministry of Energy Chile Website, 2015) estimates that Chile could produce up to100,000 MW of this type of energy. Chile has one of the largest undeveloped geothermal areasin the world, with more than 300 hot spring sites along the Andes mountains from north tosouth (Lahsen, Sepúlveda, Rojas, & Palacios, 2005). The government has already laid the foun-dations of future exploration by enacting a Law of Geothermal Concessions. There is someinterest – especially from the mining companies of the northern part of the country –, butvery little has been done until recently (Lahsen et al., 2005). The current costs of geother-mal generation are estimated at around 10 cents per KWh (Energy Information Administration,2015).
Chile could well follow the example of Norway, by building more mini-hydro plants on itsthousands of rivers and streams that run from the Andes mountains through the width of itsterritory toward the Pacific Ocean. Experts estimate that this type of plant could generate in Chileup to 10,000 MW of installed capacity, up from the 1600 generated today (Espinola, Schmidt, &Rudnick, 2015).
Biomass (principally poultry and pork manure and agricultural residues) and wind energy arealso possible in Chile. Pontt, Pontt, and Guinez (2015) estimate that biogas generation costs inChile could range between 7 and 13 cents per KWh, pointing out that this type of energy couldrepresent up to 6% of the total installed capacity.
As for wind, there are already some wind farms producing energy in the Chilean territory, butcertainly the southern region of Magallanes and the area close to Cape Horn (with some of thestrongest winds in the world and very sparse population) could harbor great extensions of windfarms.
The main options of clean energy open for Chile are then solar, wind, geothermal, biomassand small-hydro. All of them are starting to be used in the country. A recent study by a group ofexperts (CCTP, 2015) estimates that by 2025 the installed capacity of NCRE in Chile could be6600 MW (more than 10 times as much as now). It also considers that the country could obtain anadditional 3400 MW from improved energy efficiency. That adds up to 10,000 MW of increasedinstalled capacity (almost four HidroAysén projects). In the longer term, they estimate that Chilehas a potential of 190,000 MW of installed capacity in NCRE (about 12 or 13 times the currentsize of the grid).

J.-P. Garces-Voisenat, Z. Mukherjee / Journal of Policy Modeling 38 (2016) 397–414 401
CCTP (2015) estimates that the average cost of a mix of NCRE for Chile would be muchlower than the prevailing prices of energy in the electric market of Chile (without considering theexternal costs of fossil fuels and mega-dams).
All these possibilities are certainly a realistic hope for the Chilean economy. But the transitionto new modes of energy generation is not easy. There is unquestionable political inertia and manybarriers to overcome. As it happens in many other developing economies in the world (Haineset al., 2007), vested interests could be opposed to any change.
3. Methodology and related literature
Our paper uses the contingent valuation method (CVM) to estimate respondents’ willingnessto pay for preserving the Chilean Patagonia in its pristine state. Contingent valuation is a widelyused survey-based valuation method first proposed in the works of Siegfried von Ciriacy-Wantrup(Hoyos & Mariel, 2010). It is a stated-preference method used for the valuation of non-marketableresources. For example, Yoo (2004) estimated the South Koreans’ mean willingness to pay forthe unification of Korea. Also, Lee, Kwak, and Yoo (2006) estimated the willingness to pay fora cyber-ecological park, which was proposed by the South Korean government to provide thepublic with useful information regarding ecosystems and natural resources related to the Woopoowetland region. And Simpson and Hanna (2010) used CVM to estimate the willingness to payfor a clear-night sky for a sample of students at the Rochester Institute of Technology.
The method is often used in the context of eliciting willingness to pay (WTP) for ecosystemservices and preservation of environmental resources. For example, Carson and Mitchell (1993),an early contingent valuation study, elicited the WTP for minimum water quality in the U.S.that is suitable for swimming, fishing and boating. Veronesi, Chawla, Maurer, and Lienert (2014)surveyed a sample of the Swiss population, and found that 71% would be willing to pay a taxto reduce ecological and health risks from combined sewage overflows in rivers and lakes andwastewater flooding of commercial and residential areas under the uncertainty of climate change.And Yao et al. (2014) estimated the willingness to pay for a proposed biodiversity enhancementof New Zealand’s planted forests.
CVM is one of the most popular methods used by environmental and resource economics toestimate people’s stated preferences for environmental goods. There is some research that hasestimated citizens’ willingness to pay for renewable energy sources in developed nations such asthe United States (Farhar & Coburn, 2015; Roe, Teisl, Levy, & Russell, 2001; Whitehead & Cherry,2007; Wiser, 2007; Zarnikau, 2003), United Kingdom (Batley, Colbourne, Fleming, & Urwin,2001; Diaz-Rainey & Ashton, 2007), Japan (Nomura & Akai, 2004), Australia (Ivanova, 2015),Italy (Polinori, 2009) and Canada (Rowlands, Scott, & Parker, 2003). This extensive literature onvaluation of environmental resources using CVM motivated our choice of methodology for thisstudy.
CVM can be very useful to collect information about consumer preferences, which can beused to design effective green-economy policies. These policies are aimed to provide incentivesto consumers and producers to make choices that are less damaging to the environment. Thesechoices impose some form of cost on the decision makers, typically either in the form of reducedconsumption/production or higher market prices or a combination of the two. Thus, the effective-ness of any policy targeted toward a greener economy essentially depends on how the differentmarket participants respond to the policy by adjusting their consumption and production deci-sions, i.e., on the relative demand and supply elasticities of the good on which the policy has beenimposed. To illustrate this, consider the government imposes a per unit tax ($t) on the supply of

402 J.-P. Garces-Voisenat, Z. Mukherjee / Journal of Policy Modeling 38 (2016) 397–414
P
Q
StS
D
*Q*tQ
*tP
tS
*P
*tP
Q
D
SP
*Q
*P
*tQ
a: Elas tic demand b: Ine lastic de mand
Fig. 1.Source: own composition.
a good whose production generates pollution. The figures below illustrate the alternative marketoutcomes that are possible. Let (P*, Q*) represent the pre-tax equilibrium price and quantityand (P∗
t , Q∗t ) denote the post-tax equilibrium price and quantity combination. The line S shows
the pre-tax linear supply curve and St is the new supply curve after the tax has been imposed.As evident from Fig. 1a and b, the resulting change in the equilibrium price and quantity levelsfrom the green tax can be distinctly different given different elasticities of demand for the good.Suppliers of the good would attempt to shift some of the tax burden to the consumers in the formof an increased market price. If demand for the good is relatively elastic, consumers will respondby sharply cutting down their consumption levels, which would in turn reduce production in themarket and result in improved environmental conditions. Conversely, the improvement in environ-mental quality is likely to be significantly lower when demand is inelastic. Similar considerationscan be drawn for the elasticity of supply.
The above argument illustrates the role of consumer choices in determining the effectiveness ofany green economy policy influencing market behavior and the resulting impact on environmentalquality. Information about consumer preferences (obtained in our case by CVM) would allowgovernments to more accurately predict the market’s response to any green-economy policy.This would lead regulatory agencies to design policies aimed at obtaining the desired impact onenvironmental quality. For the same improvement in environmental quality, the tax rate wouldhave to be adjusted according to the different elasticities of demand and/or supply.
Despite its widespread popularity among researchers, the technique remains controversial (seeHausman, 1993). Also, given that it is essentially a stated-preference method as opposed to arevealed-preference one, there is always concern about the applicability of the results in actualpolicy initiatives that would require individuals to make real payments for the environmental goodthey state as valuable. There is always the possibility that individuals will engage in free-ridingbehavior when they face the option to pay for public goods. Hence, the CVM estimates of meanwillingness to pay for environmental goods are often an over-estimation of the actual paymentsthat would be made, considering the free-riding behavior involved. The hypothetical bias thatarises from the difference in respondents’ behavior between a hypothetical situation and an actualsituation where the respondents would have to make an actual payment remains a major limitationof CVM studies (Paradiso & Trisorio, 2001). Nonetheless, the method remains a valuable toolto elicit individuals’ WTP for environmental goods and to assess whether individuals are awareof certain environmental problems and are consciously thinking about their role in addressing
J.-P. Garces-Voisenat, Z. Mukherjee / Journal of Policy Modeling 38 (2016) 397–414 403
those problems. This is particularly true in situations where there are no mechanisms in place thatwould help identify revealed-preference behavior.
This present paper contributes to the existing literature on green-economy policies by empha-sizing the link between consumer preferences over green goods and services, such as green energy,and green economy policies. Understanding this relationship and incorporating information aboutconsumer preferences in the design of green economy policies is critical for at least a couple of rea-sons. First, the effectiveness of any policy designed to improve environmental quality is dependentof the market response because producers and consumers will revise their decisions in responseto the policy. Second, information about consumer preferences would be useful in identifyingthe degree of government intervention needed in the form of designing and implementing greenpolicies.
Along these lines, Nyborg, Howarth, and Brekke (2006) develop a theoretical model to illustratethat demand for green products and services can exhibit herd behavior when consumers aremotivated by internal social norms. Their results imply that consumers can influence each other inbeing more responsive to any green economy policy, thereby increasing the policy’s effectivenessin meeting the environmental target. Borchers, Duke, and Parsons (2007) use a choice experimentto estimate willingness to pay for voluntary participation in green-energy electricity programs.They use data for Delaware, U.S., and find that there is a positive willingness to pay for greenenergy as exhibited by their sample. However, consumers differ in their willingness to pay fordifferent sources of green energy, solar energy being the most popular choice. A number of studieshighlight the need to understand consumer preferences for designing and implementing effectivegreen-economy policies. For example, Ek (2005) and Yoo and Kwak (2009) show how consumersdiffer in different parts of the world in their responses to the green energy sources.
Our study adds to this growing body of work on green-economy policy initiatives by providingevidence on the specific case of Chile. Following in the footsteps of Ponce et al. (2011) andAravena, Hutchinson, and Longo (2012), our research is wider in scope than the first one andmore policy-specific than the second one, but our results are broadly in line with their findings.While Aravena et al. (2012) focused on the Chilean willingness to pay for renewable energysources in general, our primary focus was on identifying whether respondents are willing to pay(and how much) to preserve Patagonia in its pristine state. In other words, we are more interestedin the value of the environmental resources involved, working toward the establishment of a greeneconomy.
4. The survey results and characteristics of the random sample
In 2013, we designed a survey to collect data on a random sample of the Chilean population.The survey was conducted by random sampling of the entire population of Chilean residents 18years or older, in March 2013, by an online survey company specialized in academic researchwith operations worldwide. The sample contains 334 respondents, with 100% of the participantsagreeing to the statement that their participation has been voluntary and informed and theirresponses are being kept anonymous. The survey asks respondents about their monthly WTP forpreserving Patagonia in its pristine state and also a number of questions that allow us to study thecharacteristics of our sample and identify the key determinants of the respondents’ WTP. Theseother questions refer to (i) energy bill and housing costs as a percentage of the monthly budget, (ii)nationality and place of residence, (iii) age, gender, income and educational level, (iv) politicaland religious preferences, and (v) occupation.

404 J.-P. Garces-Voisenat, Z. Mukherjee / Journal of Policy Modeling 38 (2016) 397–414
Fig. 2. Willingness to pay for protection of environmental resources of Patagonia.Source: own composition, based on survey of this study.
Table 1Responses to main question of the survey.
How much extra money do you think your household is willing to pay in your electricity bill in order to protectPatagonia (i.e., prevent the construction of dams)? Give a specific value between 0 and CLP 50 thousand. (NB: yourresponse to this survey implies no commitment for you.)
Min value Max value Averagevalue
Median Standarddeviation
Responses
Thousands of Chileanpesos (CLP)
0 50 14.86 10 13.45 334
Exchange rate March 2013: USD 1 ≈ CLP 500.
The main question reads as follows (translated from Spanish, the language of the survey):“How much extra money do you think your household is willing to pay in your electricity bill inorder to protect Patagonia (i.e., prevent the construction of dams)? Give a specific value between0 and CLP 50 thousand. (NB: your response to this survey implies no commitment for you)”. Thecap of 50 thousand Chilean pesos (CLP) represented about USD100 per month at the exchangerate of March 2013. We chose to cap the possible responses, because eliciting the WTP from anopen-ended response may lead to substantial bias, as described by Damschroder, Ubel, Riis, andSmith (2007).
The statistics for this main question are summarized above (Fig. 2 and Table 1):The average WTP for the sample was found to be CLP 14.86 thousand or about USD 29.72,
per month. Considering that the average size of the Chilean household is 3.4 persons (INE, 2015)in a country with a population of 17 million, the 5 million households could be contributingan additional USD 1.8 billion annually to the operation of the energy system of Chile. This isequivalent to 20% of the cost of the HidroAysén project.

J.-P. Garces-Voisenat, Z. Mukherjee / Journal of Policy Modeling 38 (2016) 397–414 405
Fig. 3. Place of residence of the respondents of the survey of this study.Source: own composition.
Fig. 4. Gender of the respondents of the survey of this study.Source: own composition.
The high value for the average WTP might seem surprising, but it can be better understood inthe context of growing consciousness about the high levels of pollution in Chile’s major urbancenters. The median is only USD 20, which seems more affordable for most Chilean households(Figs. 3 and 4).
Other interesting characteristics of the sample showed that 98.5% of the persons surveyed wereChilean permanent residents, but only 4.2% lived in Patagonia (the rest in other regions of Chile),which reflects fairly well the proportion of Patagonia residents in the entire Chilean population.The sample contained 55% male respondents. About 45% of the respondents stated they had acollege degree but no post-graduate degree, while 27% had high school degree but incompletecollege education. Of the entire sample, 66% of respondents were between 20 and 39 years ofage (Figs. 5–8).

406 J.-P. Garces-Voisenat, Z. Mukherjee / Journal of Policy Modeling 38 (2016) 397–414
Fig. 5. Educational level of the respondents of the survey of this study.Source: own composition.
This research instrument must be interpreted carefully as the willingness to pay (WTP) ofChileans may reflect more of the existence value of the natural resource to Chileans and notexactly the use value of the resource. Many Chileans (or Chilean respondents of this survey forthat matter) will never in their lives visit Patagonia, so they will not be properly “using” its naturalresources. However, we can claim that a Chilean resident is more a user of Patagonia than a US,African or European resident, since Chileans own that land. On the other hand, most of themwould be enjoying the benefits of hydroelectric energy eventually produced down there, so theyare users by default. We must also consider that many citizens of the rest of the world might be ableto visit that land, which converts them in “users” whose WTP we are not measuring here. Finally,the relatively small size of the sample would also recommend some caution in the interpretationof results. With those caveats in mind, we can proceed.
Fig. 6. Household monthly income of the respondents of the survey of this study.Source: own composition.

J.-P. Garces-Voisenat, Z. Mukherjee / Journal of Policy Modeling 38 (2016) 397–414 407
Fig. 7. Political preferences of the respondents of the survey of this study.Source: own composition.
Fig. 8. Age of the respondents of the survey of this study.Source: own composition.
5. The determinants of the WTP
To obtain estimates for the determinants of respondents’ WTP we used our dataset of 334observations. For all questions where respondents were asked to pick an interval, we chose themean value for that interval. For example, if an individual stated his or her age lies between 20and 29, we chose 25. The rationale for the political and faith questions is to try to discern whetherthese views have any bearing on the WTP for environmental resources.
Although the money responses were in local currency (CLP), we converted all values to dollars(USD) for the purposes of this analysis, using the exchange rate CLP/USD of March 2013.
The model is the following:
WTP = α0 + α1Inc + α2Electric + α3Edu + α4Age + α5Male + α6Political
+ α7Faith + u (1)
where WTP: our dependent variable (in USD, capped at USD 100); Inc: monthly householdincome; Electric: electric bill as a percentage of monthly income; Edu: years of schooling; Age:

408 J.-P. Garces-Voisenat, Z. Mukherjee / Journal of Policy Modeling 38 (2016) 397–414
Table 2Estimation results.
Dependent variable – WTP Coefficient Linearized standard errors t-Test
Inc .0001642 .0012409 0.13Electric .374102 .21625 1.73a
Edu .510652 .64836 0.79Age −.23437 .12317 −1.90a
Male 5.644568 2.93332 1.92a
Political .123173 3.2381 0.04Faith 3.543192 3.17951 1.11Constant 19.66912 11.0609 1.78
a Statistically significant at 10% level.
age of respondent, in years; Male = 1 if male, 0 otherwise; Political: 1 if the person states he/sheis liberal or moderate, 0 if conservative; Faith: 1 if the person agrees (or strongly agrees) withthe following statement “I believe in God and that He created the world and the universe”, 0 ifindifferent or disagrees; u: the error term.
The sampling weight used in the regression analysis is the inverse of the likelihood of beingsampled. Table 2 provides the results:
The standard errors are the linearized standard errors reported by Stata from the survey esti-mation results. They are the counterparts of heteroscedasticity-corrected robust standard errorsobtained from regression analysis of non-survey data.
Table 2 provides some interesting results. The estimates for electric, age and gender were foundto be statistically significant at the 10% level. Specifically, the results indicate that, all else equal,younger citizens and men reveal a higher WTP for preserving Patagonia. A somewhat puzzlingfinding is the result for electric. It shows a higher WTP for respondents whose electricity bills area higher percentage of the monthly income than others in the sample. This, coupled with the factthat income has no discernible effect on the WTP, tends to suggest that poorer people might bemore environmentally-friendly than the rest of the population.
6. Policy recommendations and concluding remarks
We believe that we have adequately answered (with the necessary caveats that we haveexpressed before) the two first questions we proposed ourselves: the existence of alternativesources and the value of the natural capital of Patagonia for Chileans (USD 1.8 billion as a roughestimate).
But, is this enough? Would this additional amount of resources be sufficient to pay for alterna-tive modes of energy generation? The answer to the question we set as our main research objectiveseems fairly easy to discern. If HidroAysén would have been producing (sometime after 2025)18,430 GWh per year (1 GWh = 1 million kWh), then the 1.8 billion dollars of the Chilean house-holds would be able to finance up to a difference of 10 cents per KWh of a cleaner but eventuallycostlier production technology. This WTP would be more than enough (at the current estimatedcosts, specified in Section 3) to substitute HidroAysén or any fossil-fuel source with some typeof non-conventional renewable energy.
What drives this apparent generosity of Chileans (reflected in the high WTP revealed by thesurvey) toward clean sources of energy? Is Chile special in any sense? For one thing, Chileans areextremely conscious of the value of their natural capital. The fact that one third of the population

J.-P. Garces-Voisenat, Z. Mukherjee / Journal of Policy Modeling 38 (2016) 397–414 409
concentrates in a relatively congested and polluted metropolis (Santiago) and another third in thedensely populated central zone of the country makes them appreciate all the more the existenceof their wilder remote areas. But this could be true of most developing countries, and particularlyLatin American ones, like Brazil, Ecuador and Peru. Population tends to concentrate in the largercities in order to have better access to modern facilities and government subsidies.
We believe our study can recommend the imposition of green taxes on the production and/orconsumption of energy derived from fossil fuel sources or big hydroelectric dams. While thiswould certainly prompt exploration and exploitation of NCRE sources under the current Chileanlegislation, it would make industrial production more expensive in the country, and could bepolitically unviable. A more realistic option might be subsidizing new NCRE projects throughthe current incentive mechanisms that the government of Chile has in place for private investmentprojects (CORFO and others).
At an environmental level, Chile has established institutions which, under ideal circumstances,can prevent the realization of investment projects of any kind that could be damaging to the envi-ronment (SEIA, the environmental impact assessment system), and so do other Latin Americancountries. However, the lack of political will to move toward greener options has been a majorhindrance. Without proper initiative on the part of the government, coupled with support from theChilean public, Chile’s ability to find greener sources to meet its energy demand is questionable.It is also very important that the criteria used by the government agencies of environmental impactassessment be based on scientific and social facts (air and water pollution, community displace-ments, biodiversity protection, etc.), and not subject to the swaying needs of financial investmentthat a country might be facing.
Even though in the case we have studied, the user value (the WTP of Chileans) seems to beenough to preserve an ecosystem, it is important to take into account that these ecosystems areglobal assets, and eventually it is important to consider the existence value of the resource beforedeciding about its use. In the case of the Chilean Patagonia, there might also be a substantialexistence value for those lands of the southernmost tip of the world. Even if Chilean householdshad revealed a lower WTP than the cost differential of the different types of energy, the caseagainst such invasive hydroelectric dams as proposed by the HidroAysén project could still havebeen made by appealing to the global value of those environmental resources.
When environmental resources of a country have value for the whole planet, the whole globalcommunity has a responsibility to preserve them, and developing countries who own them shouldbe able to receive the financial support that they require in order to maintain them. This globalresponsibility is starting to be understood as shown by the incipient support that the Organizationof United Nations is lending to the preservation of Amazonia and similar ecosystems throughoutthe world.
The results in our paper, though focused on a small sample of Chileans, have broad implicationsfor Chile’s energy strategy as a whole. Based on the findings of our survey, we believe there isscope for public-private partnership in Chile in the effort of moving toward greener energy sources.Chileans might be responsive to incentives designed to reduce fossil fuel demand. For example,given that a considerable proportion of Chileans resides and works in urban areas, employers couldprovide incentives to employees for carpooling. Also, since the younger generations indicate ahigher WTP for environmental protection, maybe an emphasis can be placed on greening Chile’sacademic campuses flocked by younger members of the population. A green tax on householdenergy consumption can also be an option.
It is hard to predict which strategy will bring about highest environmental benefits. Nonetheless,the results indicate there is scope in Chile to engage in collaborative efforts between the public

410 J.-P. Garces-Voisenat, Z. Mukherjee / Journal of Policy Modeling 38 (2016) 397–414
and private sectors for exploring environmentally-friendly options to meet Chile’s future energydemands. The key to success will lie in the political will of the government.
These policy recommendations could be considered by policymakers, not only in Chile, butalso in middle-income economies of similar characteristics, particularly Latin American ones.
Acknowledgments
Special thanks to Rodrigo Navia and to Walter Fraser for their collaboration in this paper. Thisresearch has been supported by the Center for Energy, Environment and Sustainability (CEES)and by the Department of Economics at Wake Forest University.
Appendix. The survey
The government of Chile has given its technical approval to a project of hydro-electric energygeneration that would entail the construction of five dams in the southern region of Patagonia, oneof the major natural reserve areas of the planet. The project would be carried out by a consortiumof multinational corporations, which would reap the financial benefits of its exploitation.
More information on this project can be found below:
http://news.nationalgeographic.com/news/2010/05/photogalleries/100512/photos-patagonia-rivers-dams/#/patagonia-chile-dams-freshwater-rivers-rave-lake 20178 600x450.jpghttp://www.msnbc.msn.com/id/42965306/ns/world news-world environment/t/chiles-patagonia-get-dams-wild-rivers/#.TqgOoHKZTF8http://en.wikipedia.org/wiki/HidroAys%C3%A9n
If carried out, the project would involve flooding 29 km2 of natural reserves in two riverbasins and building towers and transmission power lines over a stretch of about 1000 miles ofpristine wildlife lands. Its opponents emphasize that this would imply altering a fragile ecosystemand endangering vegetal and animal endemic species, some of which are at risk of extinction(like the huemul, a Patagonian deer). They say it would cause irreparable damage to one of themost beautiful natural reserves of the earth’s biosphere (see pictures attached). According tostudies of some preservation movements, just the construction and access roads will impact sixnational parks, eleven national reserves, twenty-six conservation priority sites, sixteen wetlandareas and thirty-two privately owned protected conservation areas. This is in addition to six tribalcommunities of the aboriginal Mapuche people.
See videos by opponents of the project:
http://www.youtube.com/watch?v=92PdJ nowng&feature=youtu.behttp://rioslibres.com/?p=386
The government and the corporations involved retort that the environmental impact would beminimal and restricted to the areas of the project. In addition, they state that the electrical powerthat these dams would generate is an absolute “imperative” for the future development of theChilean economy, based on studies carried out by the energy agencies of the government:
http://www.minenergia.cl/ministerio/noticias/generales/laurence-golborne-expuso-sobre-los.htmlhttp://www.hidroaysen.cl/?page id=22

J.-P. Garces-Voisenat, Z. Mukherjee / Journal of Policy Modeling 38 (2016) 397–414 411
More specifically, the HidroAysén project would expand the energy grid of Chile in 2750 MWof installed capacity, which would generate an annual average of 18,430 GWh of additionalelectricity. This would represent about 20% of the demand of the Interconnected Central System(SIC) by the year 2023.
On the other hand, independent technical committees have established that while it is truethat the country is in need of more energy for its adequate functioning, there are also somealternative sources that could be explored, probably at a higher cost (ignoring the cost of thedamage the five-dams project would impose on the environment and aboriginal communities),although recent studies differ regarding the magnitude of the increase in costs. One of thosesources is solar energy. The country has one of the greatest potentials in the world of generatingsolar energy in the northern part of the country, and particularly in the Atacama Desert, withits average of 360+ sunny days per year. And it is precisely the mining industry, close to thisdesert and thousands of miles away from Patagonia, which will be needing the greatest amountof energy in Chile over the next few decades. The technology for this type of energy generationis quickly advancing and getting cheaper every day. A citizens’ committee integrated by NGOs,Congress members and energy specialists in Chile has recently suggested that a mix of non-conventional renewable energies (including solar, biomass, geothermal, wind and small-hydro)would not be operationally more expensive than the present more fossil-fuel oriented mode ofgeneration, and would certainly spare the need of building the mega-dams in Patagonia. Moreover,they have calculated that just by increasing the efficiency in the use of energy over the nextthirty years, the energy savings would be larger than the power generated by the Patagonianproject and the country would be meeting its energy needs given the potential growth rate of theeconomy.
http://www.flickr.com/photos/jorgeleoncabello/collections/72157626196641904/ (photos ofthe Patagonia area where the dams would be built).
In any case, it seems that the transition to any alternative mode of energy generation couldbe somewhat more costly in the near term, even though – according to the alluded independentstudies – it promises significant cost advantages in the future and avoids the destruction of somevaluable natural capital. In order to legitimately compare the costs of the five-dams project withalternatives, the cost of the damage to the environment of the project must be taken into account.This is precisely what this survey is directed to do. Specifically, this survey will enable us toestimate the value of preserving Patagonia’s natural environment. The true cost of the five-damsproject can then be ascertained as the monetary cost of the project plus the cost of the value ofpreserving Patagonia’s natural environment. By answering the questions below, you will enableus to determine how much people are willing to pay to avoid the destruction of Patagonia, or putdifferently, the value of the existence of this natural environment to people across the globe. Weare grateful for your willingness to participate in this survey.
Suppose that the dams will be built unless 80% of the respondents to this survey are willingto pay a certain minimum amount of money to amortize the transition from conventional to non-conventional sources of energy. Taking into account this and the above scenario, please answerthe following:
(1) “I hereby state that my participation in this survey has been completely voluntary. Further-more, I understand that it is totally anonymous and that I cannot derive any major directbenefit from or be harmed in any way by it.”(a) Agree(b) Disagree
412 J.-P. Garces-Voisenat, Z. Mukherjee / Journal of Policy Modeling 38 (2016) 397–414
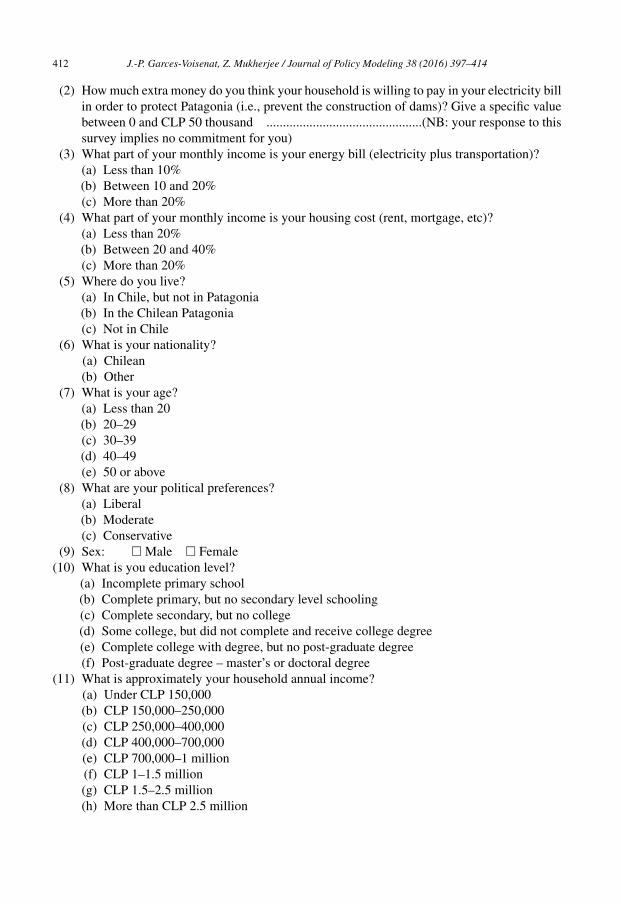
(2) How much extra money do you think your household is willing to pay in your electricity billin order to protect Patagonia (i.e., prevent the construction of dams)? Give a specific valuebetween 0 and CLP 50 thousand ...............................................(NB: your response to thissurvey implies no commitment for you)
(3) What part of your monthly income is your energy bill (electricity plus transportation)?(a) Less than 10%(b) Between 10 and 20%(c) More than 20%
(4) What part of your monthly income is your housing cost (rent, mortgage, etc)?(a) Less than 20%(b) Between 20 and 40%(c) More than 20%
(5) Where do you live?(a) In Chile, but not in Patagonia(b) In the Chilean Patagonia(c) Not in Chile
(6) What is your nationality?(a) Chilean(b) Other
(7) What is your age?(a) Less than 20(b) 20–29(c) 30–39(d) 40–49(e) 50 or above
(8) What are your political preferences?(a) Liberal(b) Moderate(c) Conservative
(9) Sex: � Male � Female(10) What is you education level?
(a) Incomplete primary school(b) Complete primary, but no secondary level schooling(c) Complete secondary, but no college(d) Some college, but did not complete and receive college degree(e) Complete college with degree, but no post-graduate degree(f) Post-graduate degree – master’s or doctoral degree
(11) What is approximately your household annual income?(a) Under CLP 150,000(b) CLP 150,000–250,000(c) CLP 250,000–400,000(d) CLP 400,000–700,000(e) CLP 700,000–1 million(f) CLP 1–1.5 million(g) CLP 1.5–2.5 million(h) More than CLP 2.5 million

J.-P. Garces-Voisenat, Z. Mukherjee / Journal of Policy Modeling 38 (2016) 397–414 413
(12) How strongly do you agree with the following statement: “I believe in God and believe Hecreated the universe and the world”?(a) Strongly agree(b) Agree(c) Not sure/indifferent(d) Disagree(e) Strongly disagree
(13) What is your profession or occupation? ....................................................
References
Aravena, C., Hutchinson, W. G., & Longo, A. (2012). Environmental pricing of externalities from different sources ofelectricity generation in Chile. Energy Economics, 34(4), 1214–1225.
Batley, S., Colbourne, D., Fleming, P., & Urwin, P. (2001). Citizen versus consumer: Challenges in the UK green powermarket. Energy Policy, 29, 479–487.
Borchers, A. M., Duke, J. M., & Parsons, G. R. (2007). Does willingness to pay for green energy differ by source? EnergyPolicy, 35, 3327–3334.
Carson, R. T., & Mitchell, R. C. (1993). The value of clean water – The public’s willingness to pay for boatable, fishable,and swimmable quality water. Water Resources Research, 29(7), 2445–2454.
CCTP. (2015). Chile Necesita una Gran Reforma Energética. http://www.energiaciudadana.cl/libro/chile-necesita-una-gran-reforma-energetica [23.01.15]
Damschroder, L. J., Ubel, P. A., Riis, J., & Smith, D. M. (2007). An alternative approach for eliciting willingness-to-pay:A randomized Internet trial. Judgment and Decision Making, 2(2), 96–106.
Diaz-Rainey, I., & Ashton, J. K. (2007). Characteristics of UK consumers’ willingness to pay for green energy. BusinessStrategy and the Environment, 20(7), 456–470.
Ek, K. (2005). Public and private attitudes towards “green” electricity: The case of Swedish wind power. Energy Policy,33, 1677–1689.
Energy Information Administration. (2015). Annual energy outlook 2011. http://www.eia.gov/forecasts/archive/aeo11/[23.01.15]
Espinola, J., Schmidt, L., & Rudnick, H. (2015). Reactivacion de Proyectos de Centrales de Pasada. http://web.ing.puc.cl/∼power/alumno06/Pasada/index.html [23.01.15]
Farhar, B. C., & Coburn, T. (2015). Colorado homeowner preferences on energy and environmental policy NREL/TP-550-25285. Golden, CO: National Renewable Energy Laboratory. http://www.nrel.gov/docs/fy99osti/25285.pdf [30.04.15]
Fearnside, P. M. (2004). Greenhouse gas emissions from hydroelectric dams: Controversies provide a springboard forrethinking a supposedly “clean” energy source. An editorial comment. Climatic Change, 66(1), 1–8.
Haines, A., Smith, K., Anderson, D., Epstein, P., McMichael, A., Roberts, I., et al. (2007). Policies for accelerating accessto clean energy, improving health, advancing development, and mitigating climatic change. The Lancet, 370(9594),1264–1281.
Hausman, J. A. (1993). Contingent valuation: A critical assessment. Amsterdam, Netherlands: North-Holland.HidroAysén Website (2015). http://www.hidroaysen.cl/ [23.01.15].Hoyos, D., & Mariel, P. (2010). Contingent valuation: Past, present and future. Prague Economic Papers, 4, 329–343.INE. (2015). Compendio Estadistico. http://www.ine.cl/canales/menu/publicaciones/compendio estadistico/compendio
estadistico2010.php [23.01.15]Ivanova, G. (2015). Queensland consumers’ willingness to pay for electricity from renewable energy sources
Working paper of the Australia New Zealand Society for Ecological Economics. http://acquire.cqu.edu.au:8080/vital/access/manager/Repository/cqu:3775 [30.04.15]
Lahsen, A., Sepúlveda, F., Rojas, J., & Palacios, C. (2005). Present status of geothermal exploration in Chile. In Proceedingsworld geothermal congress.
Lee, C. K., Kwak, S. J., & Yoo, S. H. (2006). Willingness to pay for a cyber ecological park. Applied Economics Letters,13(13), 843–846.
Ministry of Energy Chile Website. (2015). Antecedentes sobre la matriz energética en Chile y sus desafíos para el futuro.http://www.cne.cl/estadisticas/balances-energeticos [23.01.15]
Nomura, N., & Akai, M. (2004). Willingness to pay for green electricity in Japan as estimated through contingent valuationmethod. Applied Energy, 78(4), 453–463.

414 J.-P. Garces-Voisenat, Z. Mukherjee / Journal of Policy Modeling 38 (2016) 397–414
Nyborg, K., Howarth, R. B., & Brekke, K. A. (2006). Green consumers and public policy: On socially contingent moralmotivation. Resource and Energy Economics, 28, 351–366.
Paradiso, M., & Trisorio, A. (2001). The effect of knowledge on the disparity between hypothetical and real willingnessto pay. Applied Economics, 33(11), 1359–1364.
Polinori, P. (2009). Italians, renewable energy sources and EU “climate vision”. IAEE Energy Forum, 18(2), 27–28.Ponce, R. D., Vásquez, F., Stehr, A., Debels, P., & Orihuela, C. (2011). Estimating the economic value of landscape losses
due to flooding by hydropower plants in the Chilean Patagonia. Water Resources Management, 25(10), 2449–2466.Pontt, J., Pontt, C., & Guinez, C. (2015). Potencial de Biomasa en Chile. http://www.neim.utfsm.cl/arch/20080808-
02-Biomasa.pdf [24.06.15]Roe, B., Teisl, M., Levy, A., & Russell, M. (2001). US consumers’ willingness to pay for green electricity. Energy Policy,
29, 917–925.Rogers, J., & Wisland, L. (2015). Solar power on the rise. Union of Concerned Scientists. http://www.ucsusa.org/
sites/default/files/attach/2014/08/Solar-Power-on-the-Rise.pdf [24.06.15]Rowlands, I., Scott, D., & Parker, P. (2003). Consumers and green electricity: Profiling potential purchasers. Business
Strategy and the Environment, 12, 36–48.Simpson, S. N., & Hanna, B. G. (2010). Willingness to pay for a clear night sky: Use of the contingent valuation method.
Applied Economics Letters, 17(11), 1095–1103.Valdivia, R. (2015). La otra cara de Hidroaysén. http://www.centralenergia.cl/2011/05/26/la-otra-cara-de-hidroaysen/
[23.01.15]Veronesi, M., Chawla, F., Maurer, M., & Lienert, J. (2014). Climate change and the willingness to pay to reduce ecological
and health risks from wastewater flooding in urban centers and the environment. Ecological Economics, 98, 1–10.Whitehead, J. C., & Cherry, T. L. (2007). Willingness to pay for a green energy program: A comparison of ex-ante and
ex-post hypothetical bias mitigation approaches. Resource and Energy Economics, 29, 247–261.Wiser, R. H. (2007). Using contingent valuation to explore willingness to pay for renewable energy: A comparison of
collective and voluntary payment vehicles. Ecological Economics, 62, 419–432.Yao, R. T., Scarpa, R., Turner, J. A., Barnard, T. D., Rose, J. M., Palma, J. H. N., et al. (2014). Valuing biodiversity enhance-
ment in New Zealand’s planted forests: Socioeconomic and spatial determinants of willingness-to-pay. EcologicalEconomics, 98, 90–101.
Yoo, S. H. (2004). South Koreans’ willingness to pay for Korean unification. Applied Economics Letters, 11(1), 15–19.Yoo, S. H., & Kwak, S. Y. (2009). Willingness to pay for green electricity in Korea: A Contingent Valuation Study. Energy
Policy, 37, 5408–5416.Zarnikau, J. (2003). Consumer demand for green power and energy efficiency. Energy Policy, 31, 1661–1672.