· pb-206/pb-207 is plotted versus pb-208/pb-207 ratios (sometimes it is the pb-207/pb-206 plotted...
TRANSCRIPT
�������� ��� ���
���������� ����
internal
report ���
����������������� ����
��������������
���� ������ ��
���������� � ���� �
����������������
Supervising Scientist

The use of lead isotopes for research and monitoring the environmental impacts of
uranium mining
Andreas Bollhöfer
Environmental Research Institute of the Supervising Scientist GPO Box 461, Darwin NT 0801
September 2003
Registry File SG2001/0157
Supervising Scientist


Contents
Powerpoint presentation: The use of lead isotopes for research and monitoring the environmental impacts of uranium mining 1
References 24

1
Powerpoint presentation
The use of lead isotopes for research and monitoring the environmental impacts of
uranium mining
Andreas Bollhöfer
The use of lead isotopes for research The use of lead isotopes for research and monitoring the environmental and monitoring the environmental
impacts of uranium miningimpacts of uranium mining
Supervising Scientist
This technique has not been used much at eriss yet. In 1996, Gulson et al. studied lead isotopes as seepage indicators around the Ranger tailings dam. Gulson since then works on application of lead isotopes to problems in the environment - especially related to mining - at CSIRO/Macquarie University. This talk is meant to give an overview and explain in easy terms how and why the technique works.
2
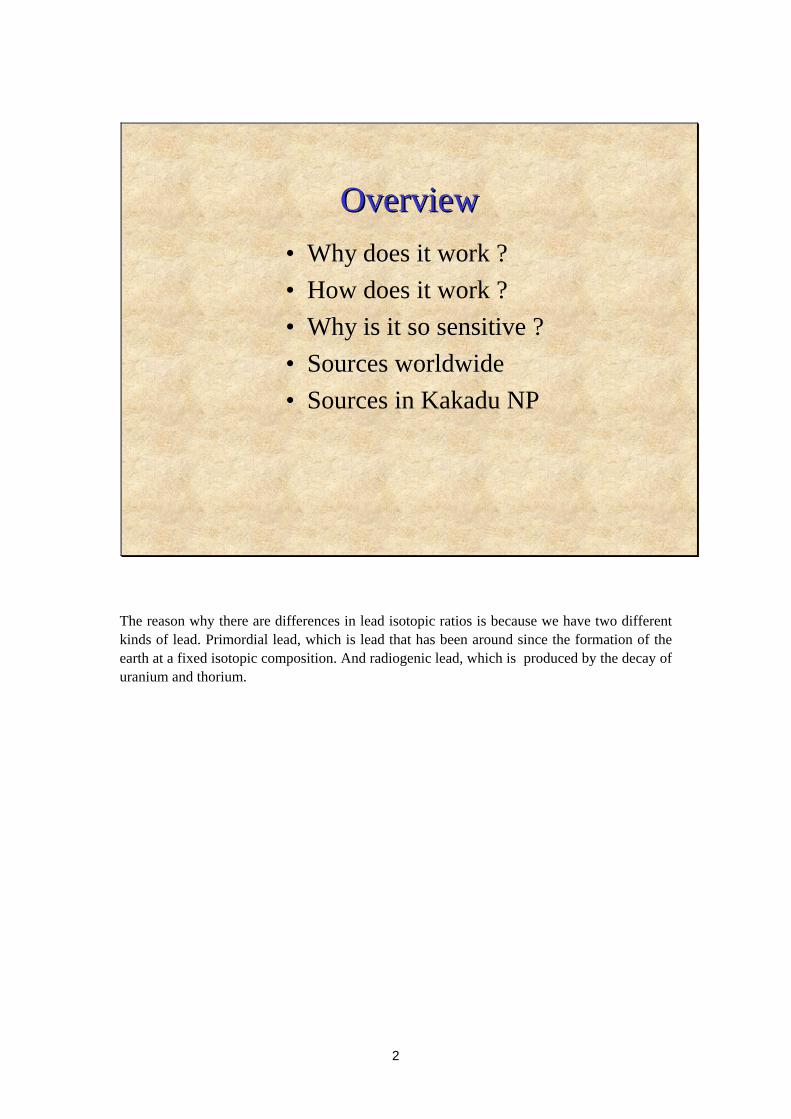
OverviewOverview• Why does it work ? • How does it work ?• Why is it so sensitive ?• Sources worldwide • Sources in Kakadu NP
The reason why there are differences in lead isotopic ratios is because we have two different kinds of lead. Primordial lead, which is lead that has been around since the formation of the earth at a fixed isotopic composition. And radiogenic lead, which is produced by the decay of uranium and thorium.
3
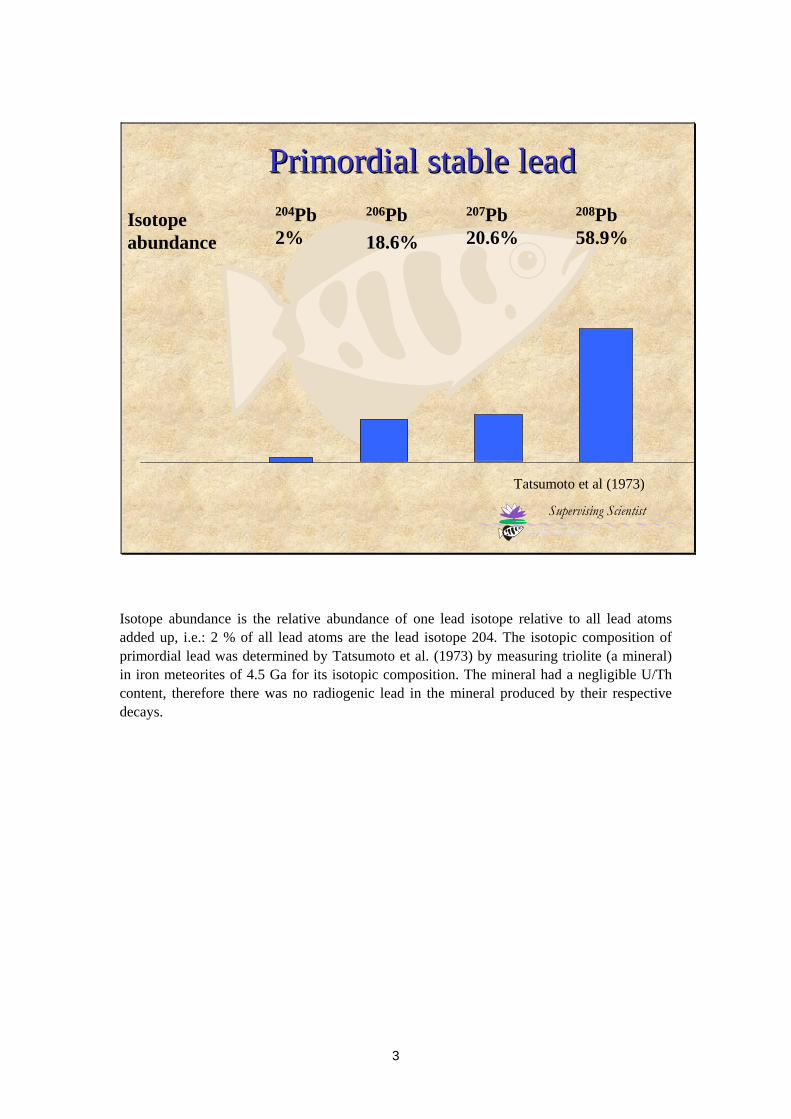
Primordial stable leadPrimordial stable lead
Supervising Scientist
204Pb2%
206Pb18.6%
207Pb20.6%
208Pb58.9%
Tatsumoto et al (1973)
Isotope abundance
Isotope abundance is the relative abundance of one lead isotope relative to all lead atoms added up, i.e.: 2 % of all lead atoms are the lead isotope 204. The isotopic composition of primordial lead was determined by Tatsumoto et al. (1973) by measuring triolite (a mineral) in iron meteorites of 4.5 Ga for its isotopic composition. The mineral had a negligible U/Th content, therefore there was no radiogenic lead in the mineral produced by their respective decays.
4
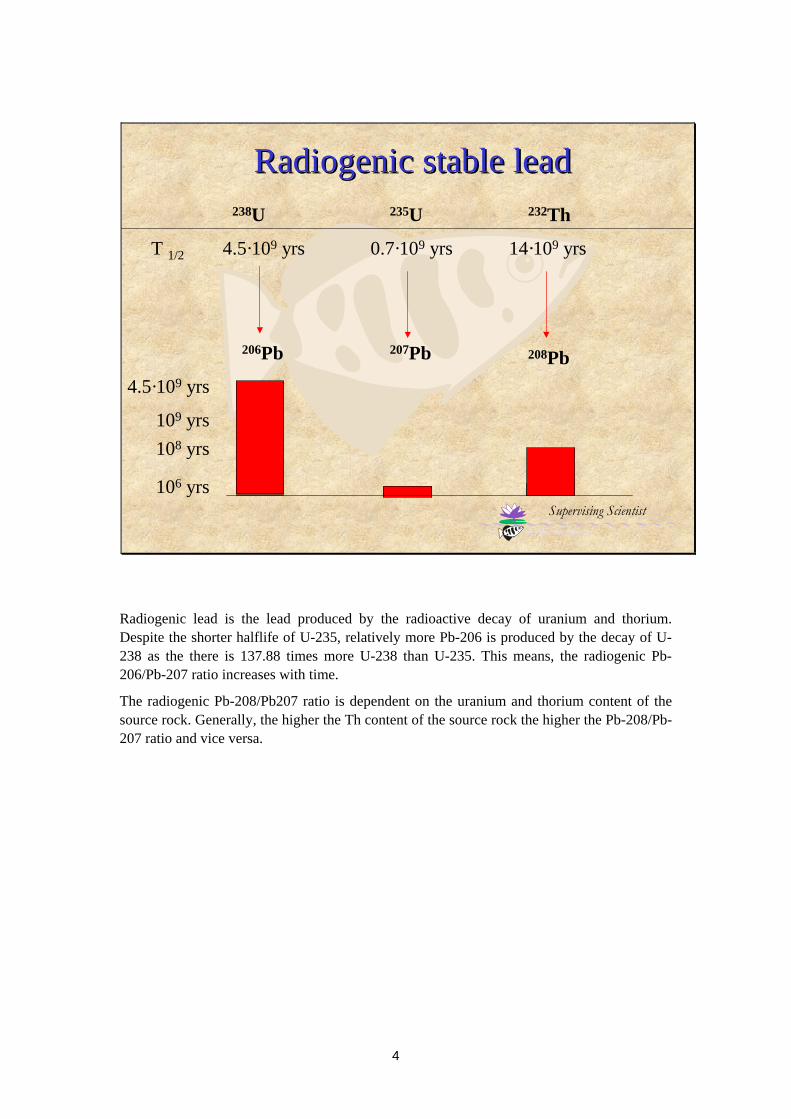
Radiogenic stable leadRadiogenic stable lead
Supervising Scientist
238U 232Th235U
T 1/2 14·109 yrs4.5·109 yrs 0.7·109 yrs
208Pb206Pb 207Pb
106 yrs
109 yrs108 yrs
4.5·109 yrs
Radiogenic lead is the lead produced by the radioactive decay of uranium and thorium. Despite the shorter halflife of U-235, relatively more Pb-206 is produced by the decay of U-238 as the there is 137.88 times more U-238 than U-235. This means, the radiogenic Pb-206/Pb-207 ratio increases with time.
The radiogenic Pb-208/Pb207 ratio is dependent on the uranium and thorium content of the source rock. Generally, the higher the Th content of the source rock the higher the Pb-208/Pb-207 ratio and vice versa.
5
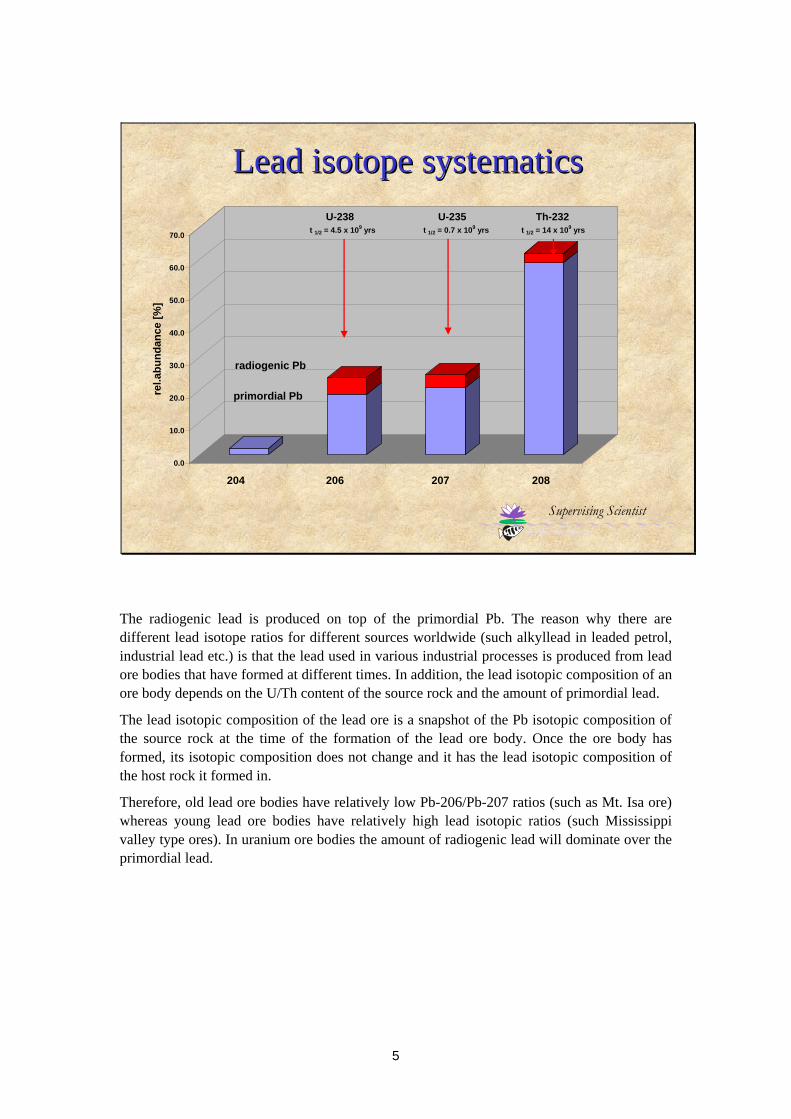
Lead isotope systematicsLead isotope systematics
Supervising Scientist
0.0
10.0
20.0
30.0
40.0
50.0
60.0
70.0
rel.a
bund
ance
[%]
204 206 207 208
U-238 U-235 Th-232t 1/2 = 4.5 x 10⁹ yrs t 1/2 = 0.7 x 10⁹ yrs t 1/2 = 14 x 109 yrs
radiogenic Pb
primordial Pb
The radiogenic lead is produced on top of the primordial Pb. The reason why there are different lead isotope ratios for different sources worldwide (such alkyllead in leaded petrol, industrial lead etc.) is that the lead used in various industrial processes is produced from lead ore bodies that have formed at different times. In addition, the lead isotopic composition of an ore body depends on the U/Th content of the source rock and the amount of primordial lead.
The lead isotopic composition of the lead ore is a snapshot of the Pb isotopic composition of the source rock at the time of the formation of the lead ore body. Once the ore body has formed, its isotopic composition does not change and it has the lead isotopic composition of the host rock it formed in.
Therefore, old lead ore bodies have relatively low Pb-206/Pb-207 ratios (such as Mt. Isa ore) whereas young lead ore bodies have relatively high lead isotopic ratios (such Mississippi valley type ores). In uranium ore bodies the amount of radiogenic lead will dominate over the primordial lead.
6
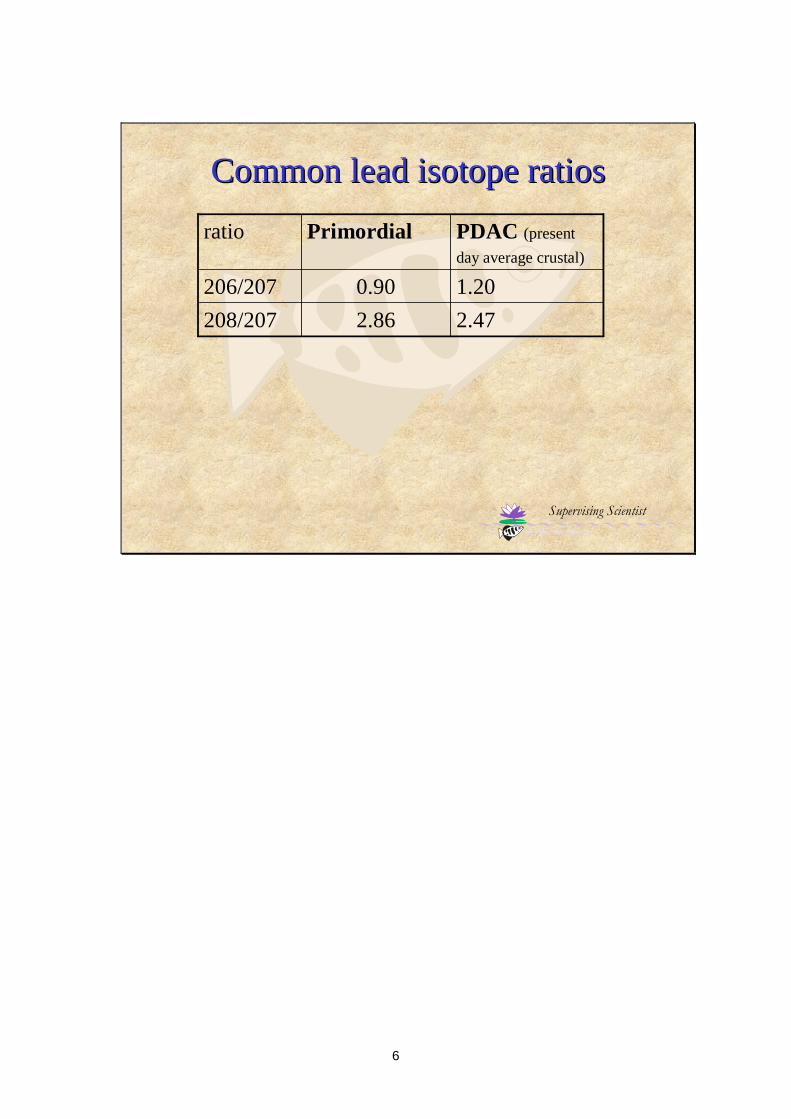
Common lead isotope ratiosCommon lead isotope ratios
Supervising Scientist
2.472.86208/2071.200.90206/207
PDAC (present day average crustal)
Primordialratio
7
Advantages of lead isotopes
Supervising Scientist
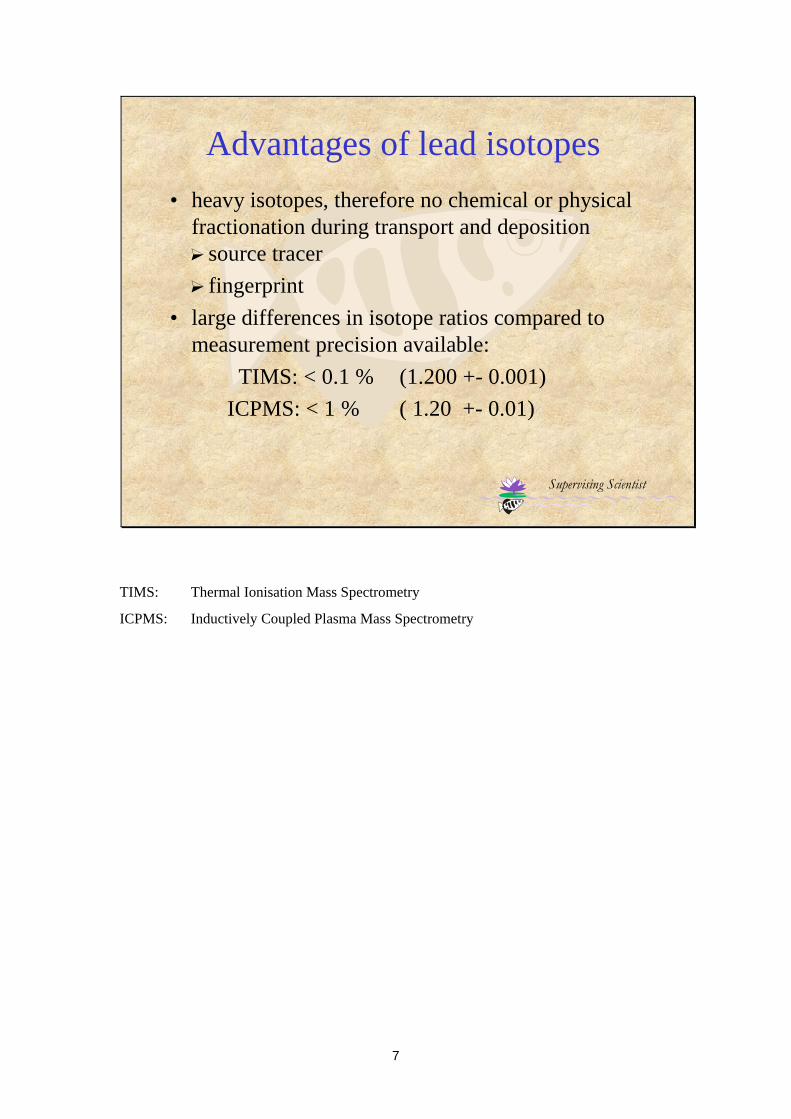
• heavy isotopes, therefore no chemical or physical fractionation during transport and deposition ? source tracer? fingerprint
• large differences in isotope ratios compared to measurement precision available:
TIMS: < 0.1 % (1.200 +- 0.001)ICPMS: < 1 % ( 1.20 +- 0.01)
TIMS: Thermal Ionisation Mass Spectrometry
ICPMS: Inductively Coupled Plasma Mass Spectrometry
8
Supervising Scientist
Three isotope plots
1.00
1.10
1.20
2.30 2.40 2.50
208/207
206/
207
Th-rich
U-rich
A
BC
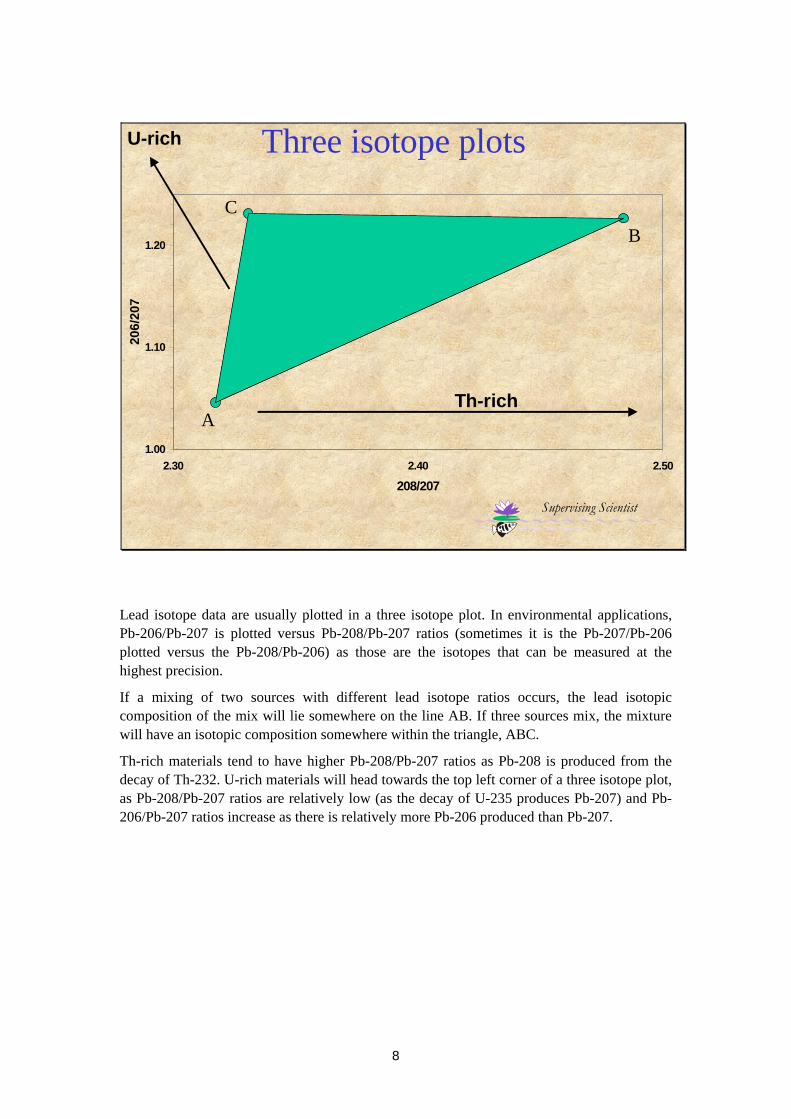
Lead isotope data are usually plotted in a three isotope plot. In environmental applications, Pb-206/Pb-207 is plotted versus Pb-208/Pb-207 ratios (sometimes it is the Pb-207/Pb-206 plotted versus the Pb-208/Pb-206) as those are the isotopes that can be measured at the highest precision.
If a mixing of two sources with different lead isotope ratios occurs, the lead isotopic composition of the mix will lie somewhere on the line AB. If three sources mix, the mixture will have an isotopic composition somewhere within the triangle, ABC.
Th-rich materials tend to have higher Pb-208/Pb-207 ratios as Pb-208 is produced from the decay of Th-232. U-rich materials will head towards the top left corner of a three isotope plot, as Pb-208/Pb-207 ratios are relatively low (as the decay of U-235 produces Pb-207) and Pb-206/Pb-207 ratios increase as there is relatively more Pb-206 produced than Pb-207.
9
Supervising Scientist
1.00
1.10
1.20
2.30 2.40 2.50
208/207
206/
207
Aus.leaded petrol
dust
Darwin. ‘99
Leaded petrol: 95%Dust: 5 %
Global airborne lead isotope ratiosGlobal airborne lead isotope ratios
Bollhöfer and Rosman (2000,2001)
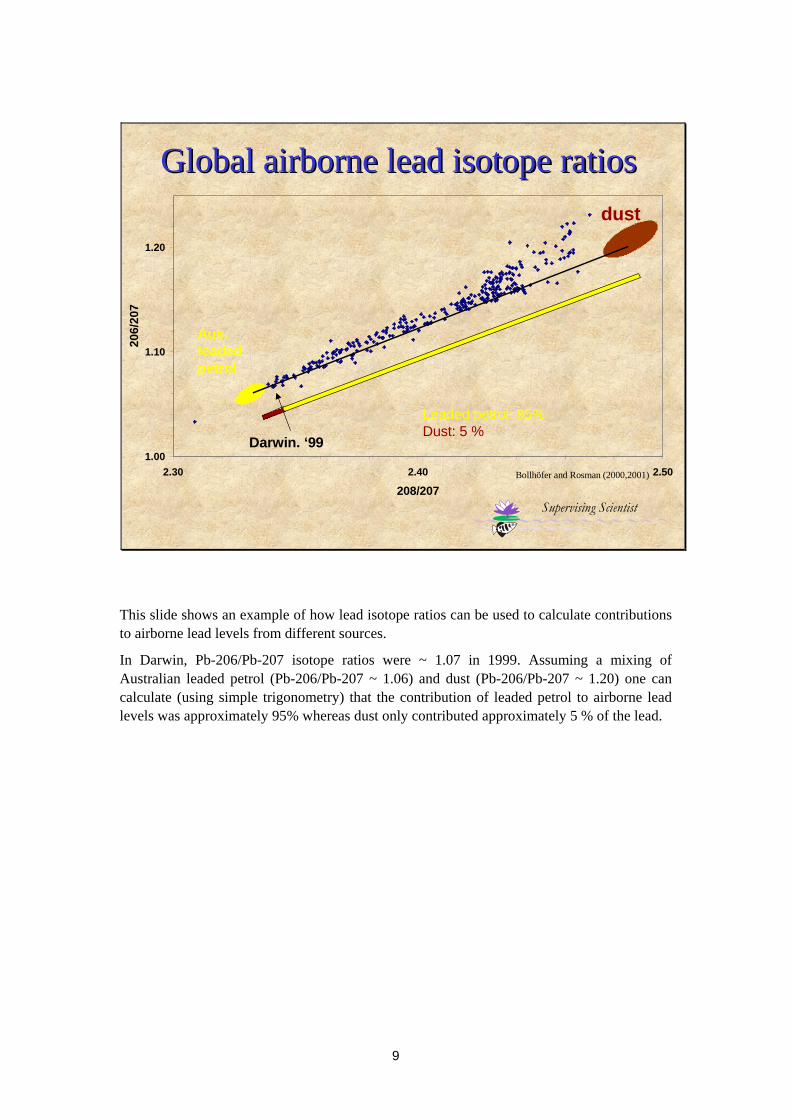
This slide shows an example of how lead isotope ratios can be used to calculate contributions to airborne lead levels from different sources.
In Darwin, Pb-206/Pb-207 isotope ratios were ~ 1.07 in 1999. Assuming a mixing of Australian leaded petrol (Pb-206/Pb-207 ~ 1.06) and dust (Pb-206/Pb-207 ~ 1.20) one can calculate (using simple trigonometry) that the contribution of leaded petrol to airborne lead levels was approximately 95% whereas dust only contributed approximately 5 % of the lead.
10
0.00
1.00
2.00
3.00
4.00
5.00
6.00
7.00
8.00
9.00
10.00
0.00 0.50 1.00 1.50 2.00 2.50 3.00 3.50
208/207
206/
207
Aerosols globally
NgarradjSediments
modern Pb, dust
particulates in RP1(Gulson et al., 1996)
DustKakadu
1.00
1.10
1.20
2.30 2.40 2.50
Lead isotope ratios in KNPLead isotope ratios in KNP
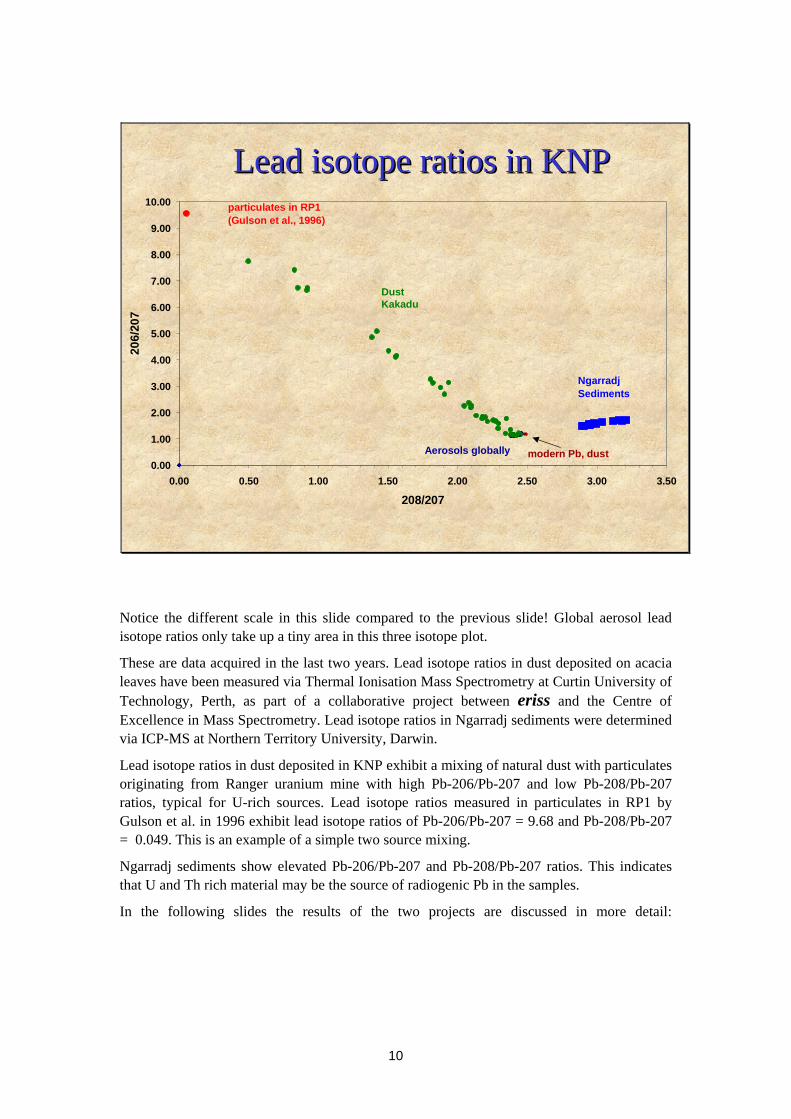
Notice the different scale in this slide compared to the previous slide! Global aerosol lead isotope ratios only take up a tiny area in this three isotope plot.
These are data acquired in the last two years. Lead isotope ratios in dust deposited on acacia leaves have been measured via Thermal Ionisation Mass Spectrometry at Curtin University of Technology, Perth, as part of a collaborative project between eriss and the Centre of Excellence in Mass Spectrometry. Lead isotope ratios in Ngarradj sediments were determined via ICP-MS at Northern Territory University, Darwin.
Lead isotope ratios in dust deposited in KNP exhibit a mixing of natural dust with particulates originating from Ranger uranium mine with high Pb-206/Pb-207 and low Pb-208/Pb-207 ratios, typical for U-rich sources. Lead isotope ratios measured in particulates in RP1 by Gulson et al. in 1996 exhibit lead isotope ratios of Pb-206/Pb-207 = 9.68 and Pb-208/Pb-207 = 0.049. This is an example of a simple two source mixing.
Ngarradj sediments show elevated Pb-206/Pb-207 and Pb-208/Pb-207 ratios. This indicates that U and Th rich material may be the source of radiogenic Pb in the samples.
In the following slides the results of the two projects are discussed in more detail:
11
14
Radiogenic (Radiogenic (PbPb) and radioactive (Ra) ) and radioactive (Ra) isotopes in isotopes in NgarradjNgarradj sedimentssediments
1.45
1.5
1.55
1.65
1.7
1.75
0 2 4 6 8 10 12 14sample
Pb-2
06/P
b-20
7
Trib
Cen
tral
Trib
Cen
tral
Trib
Cen
tral
Trib
Cen
tral
Trib
Nor
th
Trib
Nor
th
Trib
Nor
th
Upm
ain
Swift
Mai
n
Upm
ain
Swift
Mai
n
East
Trib
East
Trib
Control Sites
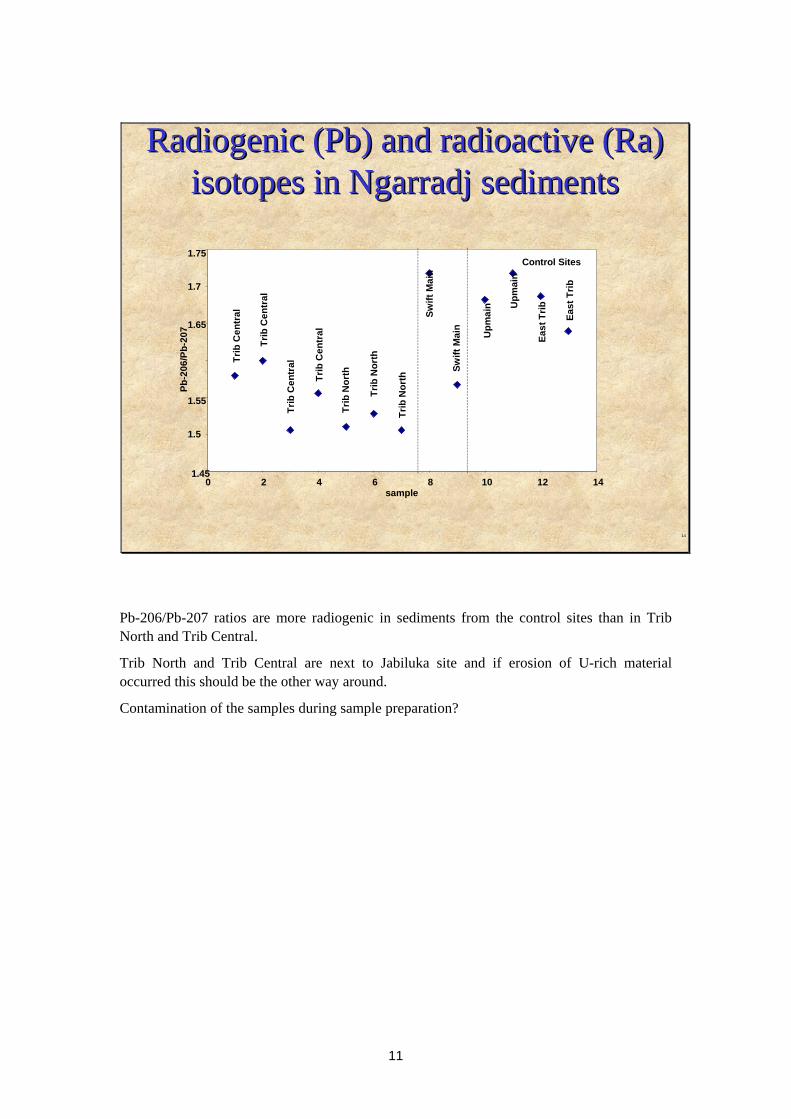
Pb-206/Pb-207 ratios are more radiogenic in sediments from the control sites than in Trib North and Trib Central.
Trib North and Trib Central are next to Jabiluka site and if erosion of U-rich material occurred this should be the other way around.
Contamination of the samples during sample preparation?
12
1.00
1.10
1.20
1.30
1.40
1.50
1.60
1.70
1.80
2.00 2.10 2.20 2.30 2.40 2.50 2.60 2.70 2.80 2.90 3.00 3.10 3.20 3.30208/207
206/
207
Aerosols globally
NgarradjSediments
modern Pb, dust
Ngarradjnot milled
Three isotope plotThree isotope plot
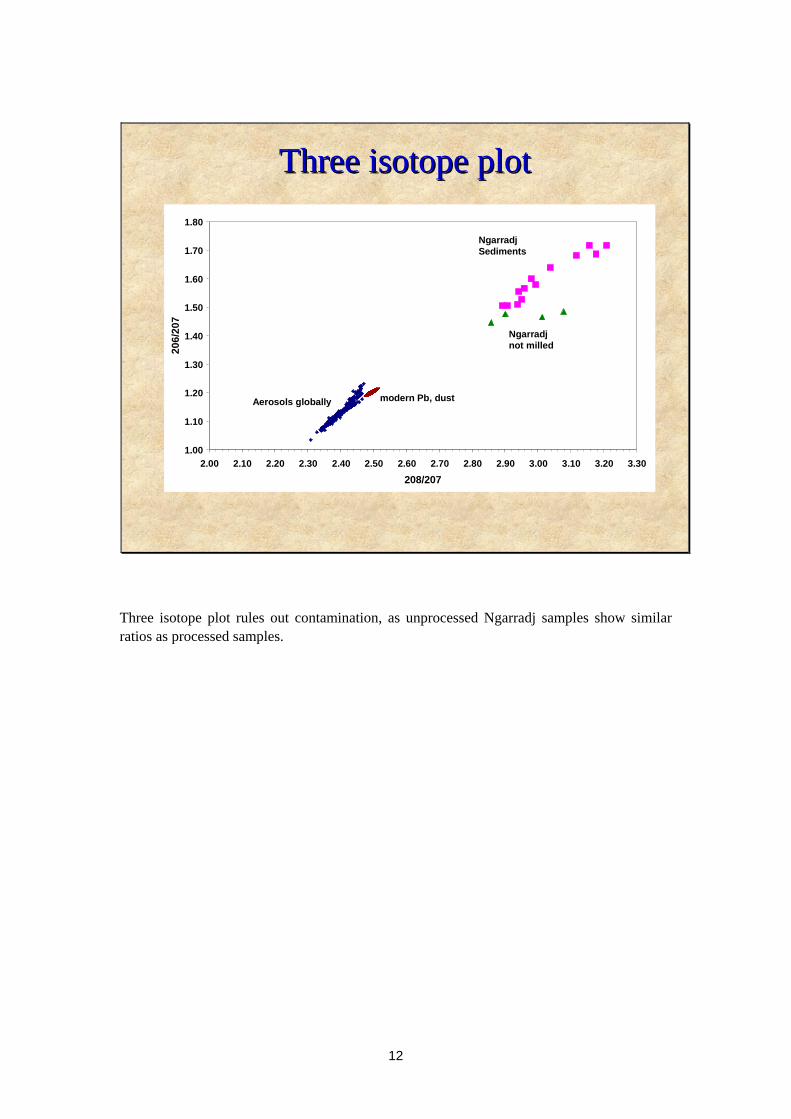
Three isotope plot rules out contamination, as unprocessed Ngarradj samples show similar ratios as processed samples.
13
Radium isotopesRadium isotopes
0
5
10
15
20
25
30
35
40
0 5 10 15 20 25 30 35 40Ra-228
Ra-
226
Trib CentralTrib NorthSwift MainUpmain SwiftEast Trib
Trib North & Trib Central
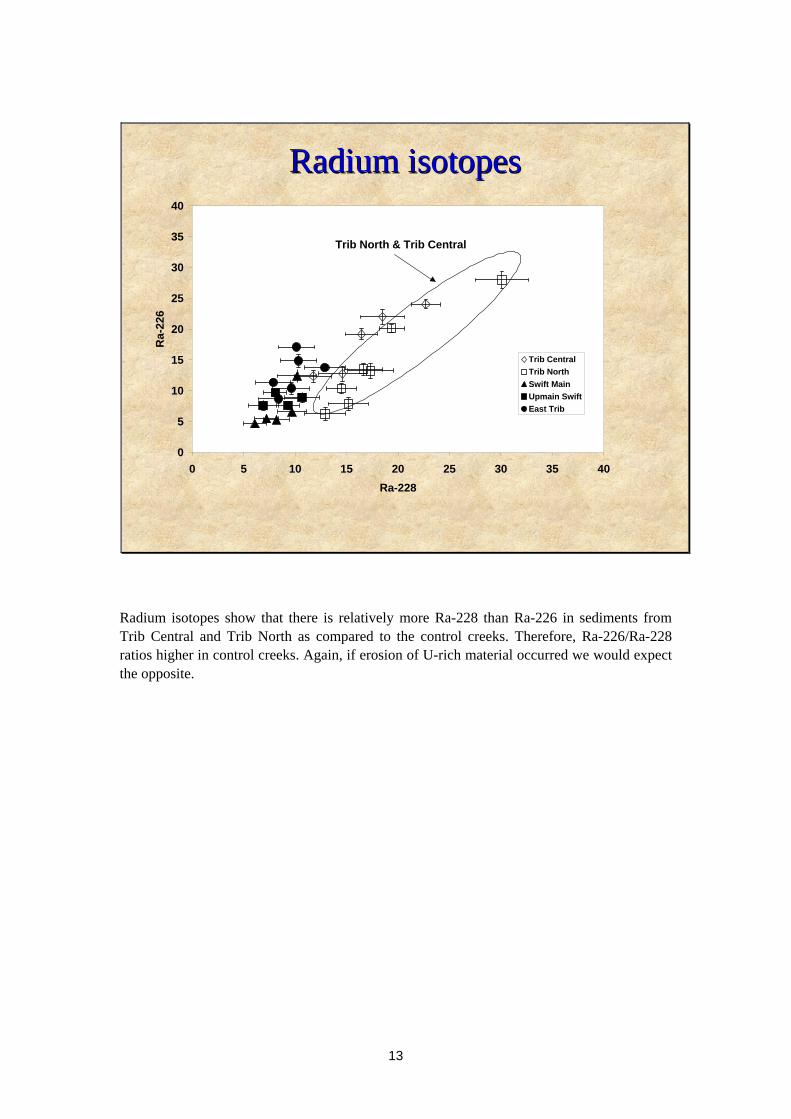
Radium isotopes show that there is relatively more Ra-228 than Ra-226 in sediments from Trib Central and Trib North as compared to the control creeks. Therefore, Ra-226/Ra-228 ratios higher in control creeks. Again, if erosion of U-rich material occurred we would expect the opposite.
14
Inverse concentration plotsInverse concentration plots
y = -5.5x + 1.3R2 = 0.8
y = -8.2x + 2R2 = 0.6
0.00
0.20
0.40
0.60
0.80
1.00
1.20
1.40
1.60
1.80
2.00
0.00 0.02 0.04 0.06 0.08 0.10 0.12 0.14 0.16 0.18 0.20
inv. Ra-conc.
Ra-2
26/R
a-22
8
Trib. North and CentralEast Trib. and Upmain
y = 0.33x + 1.3
1.3
1.35
1.4
1.45
1.5
1.55
1.6
1.65
1.7
1.75
Pb-2
06/P
b-20
7
Upmain and East TribTrib North and Central
a
Inv. Pb conc.
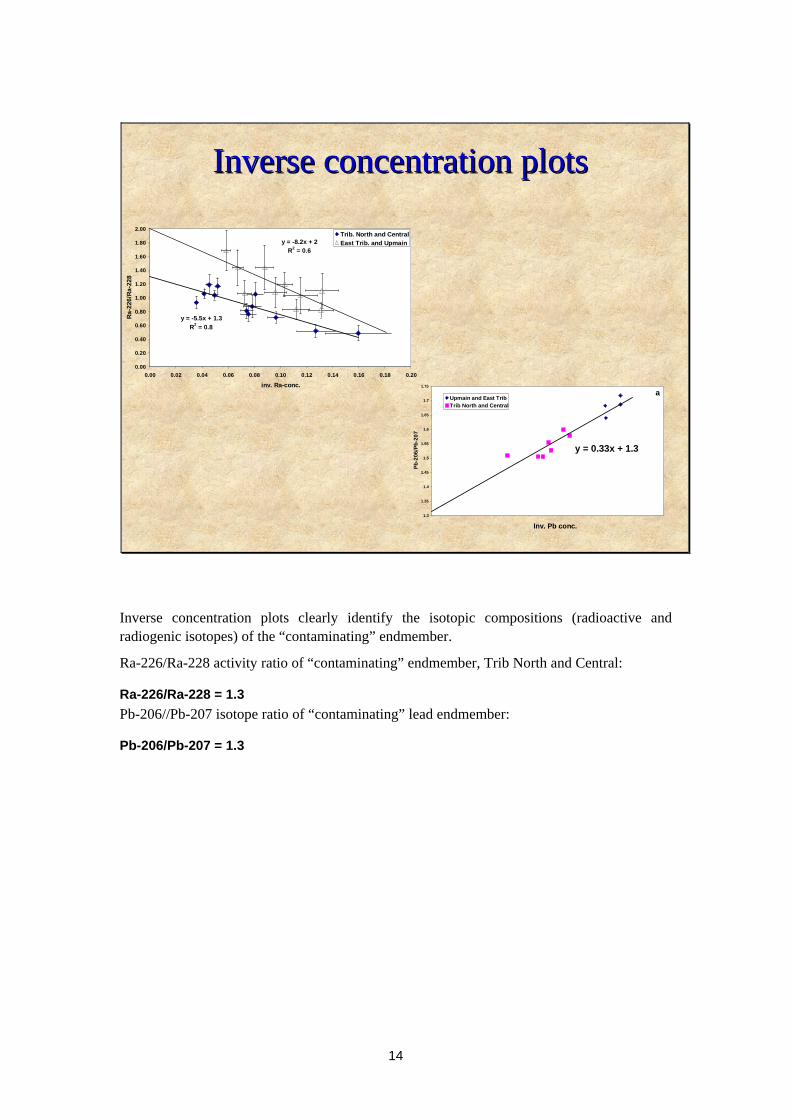
Inverse concentration plots clearly identify the isotopic compositions (radioactive and radiogenic isotopes) of the “contaminating” endmember.
Ra-226/Ra-228 activity ratio of “contaminating” endmember, Trib North and Central:
Ra-226/Ra-228 = 1.3 Pb-206//Pb-207 isotope ratio of “contaminating” lead endmember:
Pb-206/Pb-207 = 1.3
15
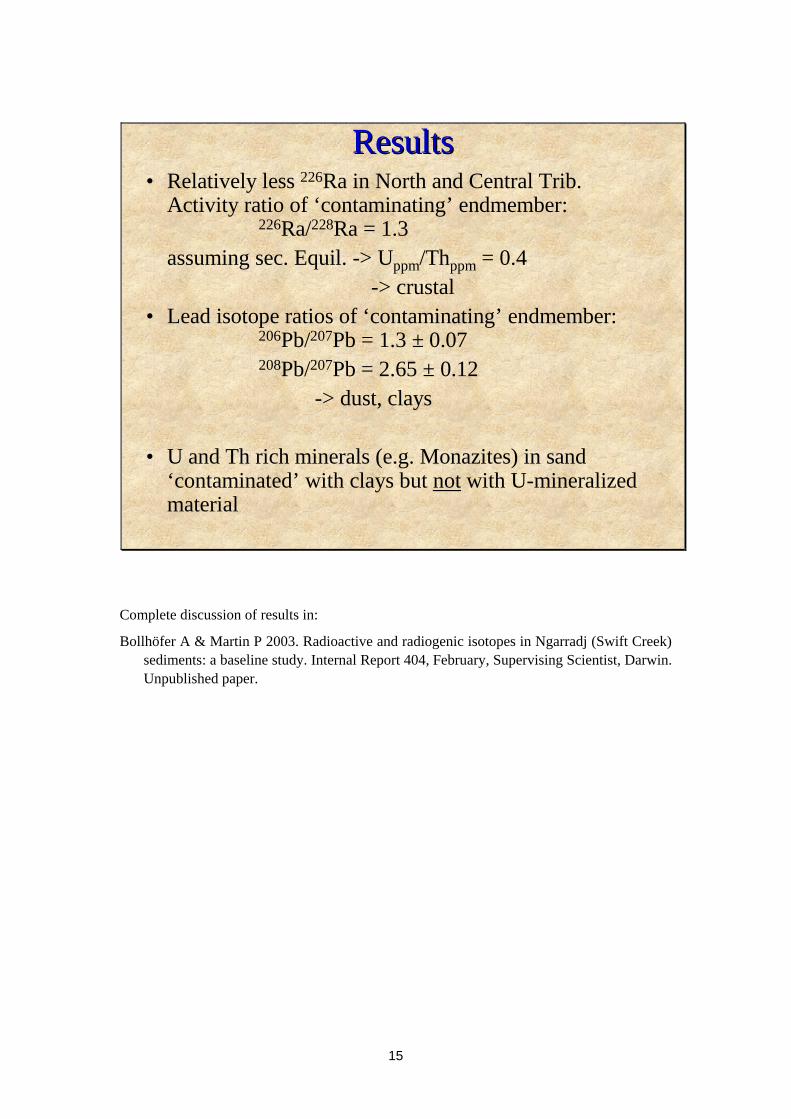
ResultsResults• Relatively less 226Ra in North and Central Trib.
Activity ratio of ‘contaminating’ endmember: 226Ra/228Ra = 1.3
assuming sec. Equil. -> Uppm/Thppm = 0.4 -> crustal
• Lead isotope ratios of ‘contaminating’ endmember:206Pb/207Pb = 1.3 ± 0.07 208Pb/207Pb = 2.65 ± 0.12
-> dust, clays
• U and Th rich minerals (e.g. Monazites) in sand ‘contaminated’ with clays but not with U-mineralized material
Complete discussion of results in:
Bollhöfer A & Martin P 2003. Radioactive and radiogenic isotopes in Ngarradj (Swift Creek) sediments: a baseline study. Internal Report 404, February, Supervising Scientist, Darwin. Unpublished paper.
16
Dust deposition around RangerDust deposition around Ranger
Leaves as dust collectors -> spatial data
Collaborative project with Centre of Excellence in Mass Spectrometry, Curtin University, Perth-> highly precise data
Annual cycle of lead isotope ratios at Jabiru East
17
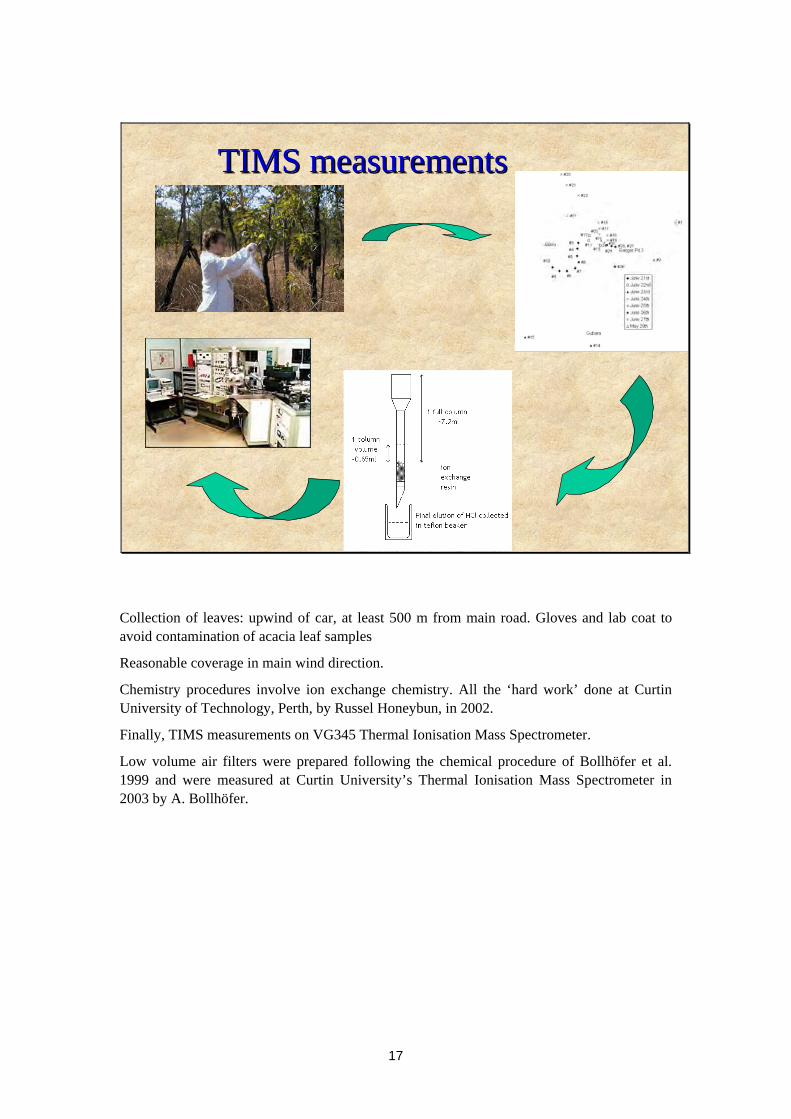
TIMS measurementsTIMS measurements
Collection of leaves: upwind of car, at least 500 m from main road. Gloves and lab coat to avoid contamination of acacia leaf samples
Reasonable coverage in main wind direction.
Chemistry procedures involve ion exchange chemistry. All the ‘hard work’ done at Curtin University of Technology, Perth, by Russel Honeybun, in 2002.
Finally, TIMS measurements on VG345 Thermal Ionisation Mass Spectrometer.
Low volume air filters were prepared following the chemical procedure of Bollhöfer et al. 1999 and were measured at Curtin University’s Thermal Ionisation Mass Spectrometer in 2003 by A. Bollhöfer.
18
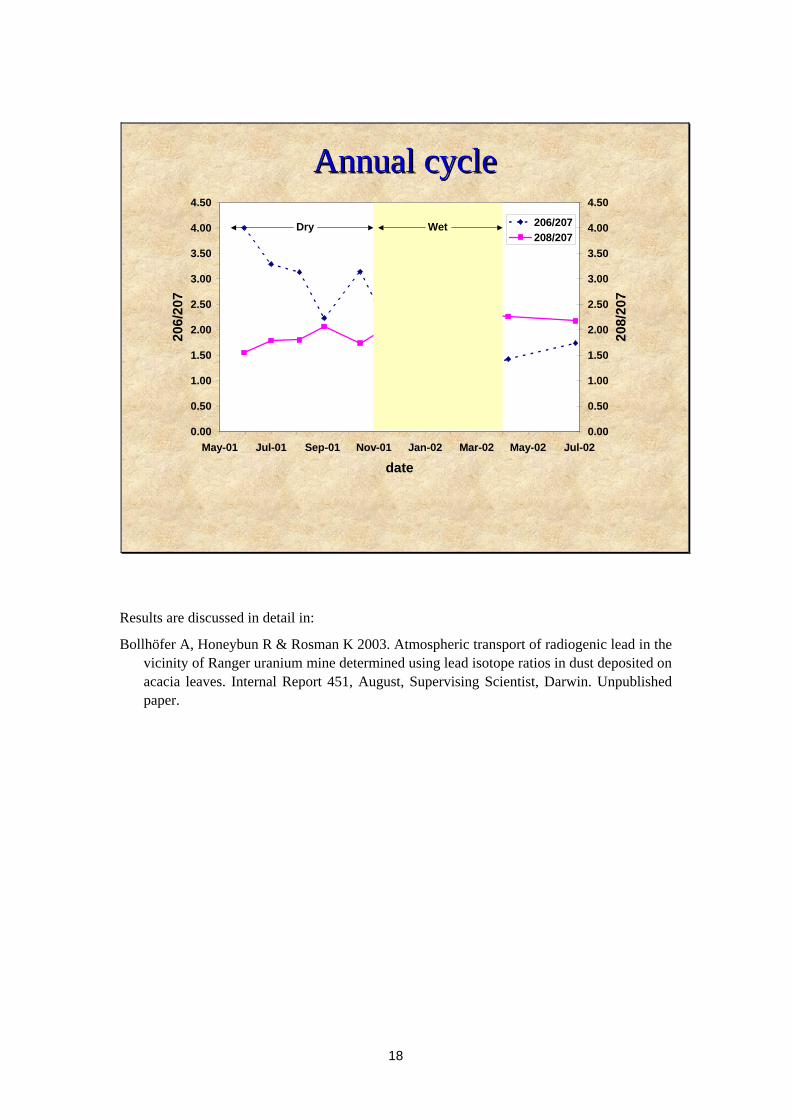
Annual cycleAnnual cycle
0.00
0.50
1.00
1.50
2.00
2.50
3.00
3.50
4.00
4.50
May-01 Jul-01 Sep-01 Nov-01 Jan-02 Mar-02 May-02 Jul-02
date
206/
207
0.00
0.50
1.00
1.50
2.00
2.50
3.00
3.50
4.00
4.50
208/
207
206/207208/207
Dry Wet
Results are discussed in detail in:
Bollhöfer A, Honeybun R & Rosman K 2003. Atmospheric transport of radiogenic lead in the vicinity of Ranger uranium mine determined using lead isotope ratios in dust deposited on acacia leaves. Internal Report 451, August, Supervising Scientist, Darwin. Unpublished paper.
19
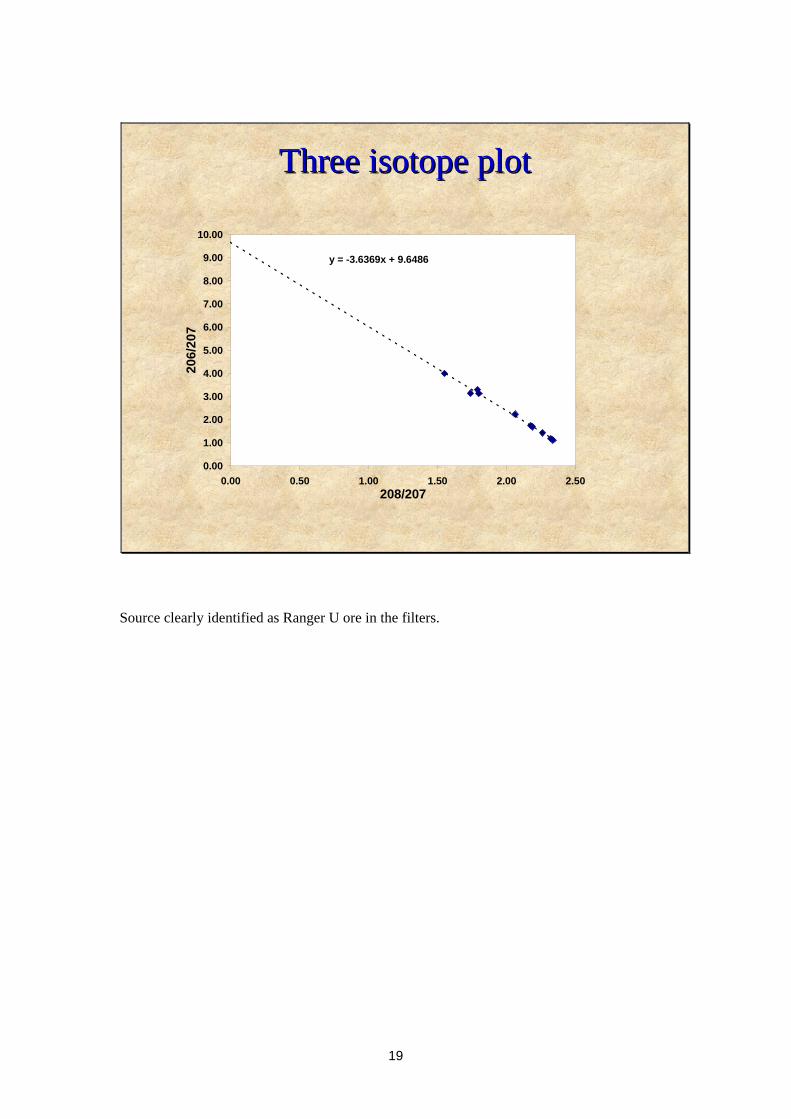
Three isotope plotThree isotope plot
y = -3.6369x + 9.6486
0.00
1.00
2.00
3.00
4.00
5.00
6.00
7.00
8.00
9.00
10.00
0.00 0.50 1.00 1.50 2.00 2.50208/207
206/
207
Source clearly identified as Ranger U ore in the filters.
20
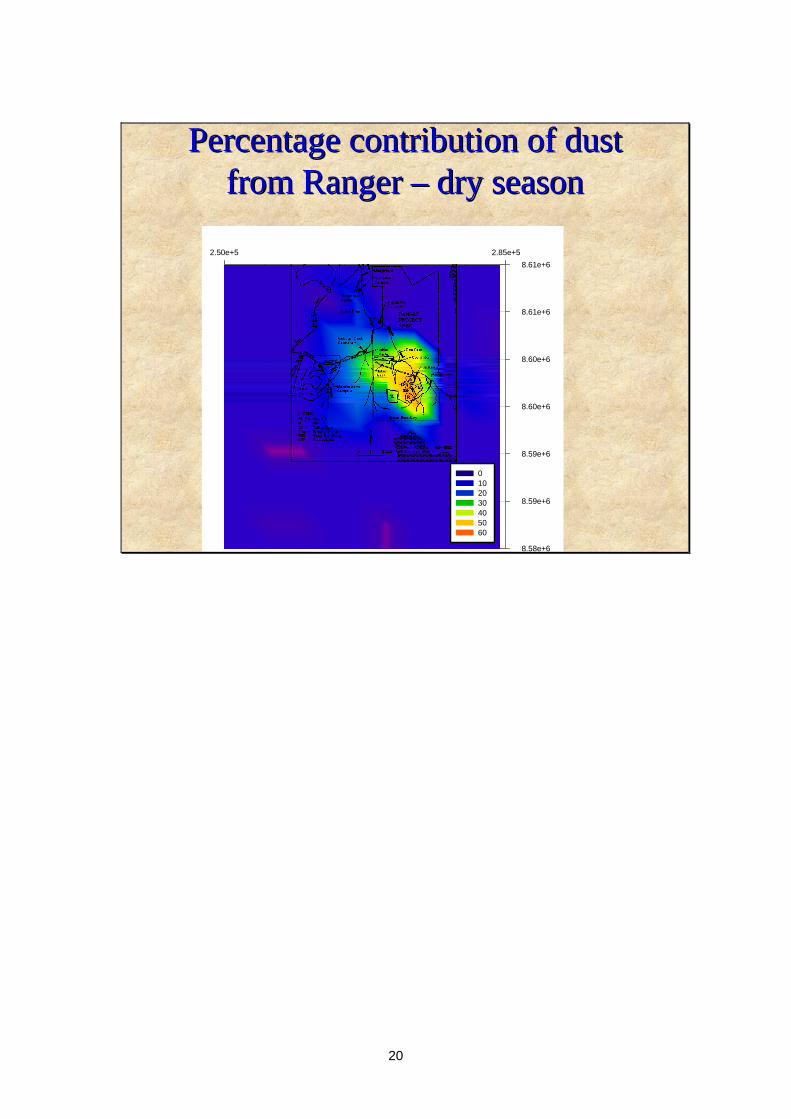
Percentage contribution of dust Percentage contribution of dust from Ranger from Ranger –– dry seasondry season
2.50e+5 2.55e+5 2.60e+5 2.65e+5 2.70e+5 2.75e+5 2.80e+5 2.85e+5
8.58e+6
8.59e+6
8.59e+6
8.60e+6
8.60e+6
8.61e+6
8.61e+6
0 10 20 30 40 50 60
21
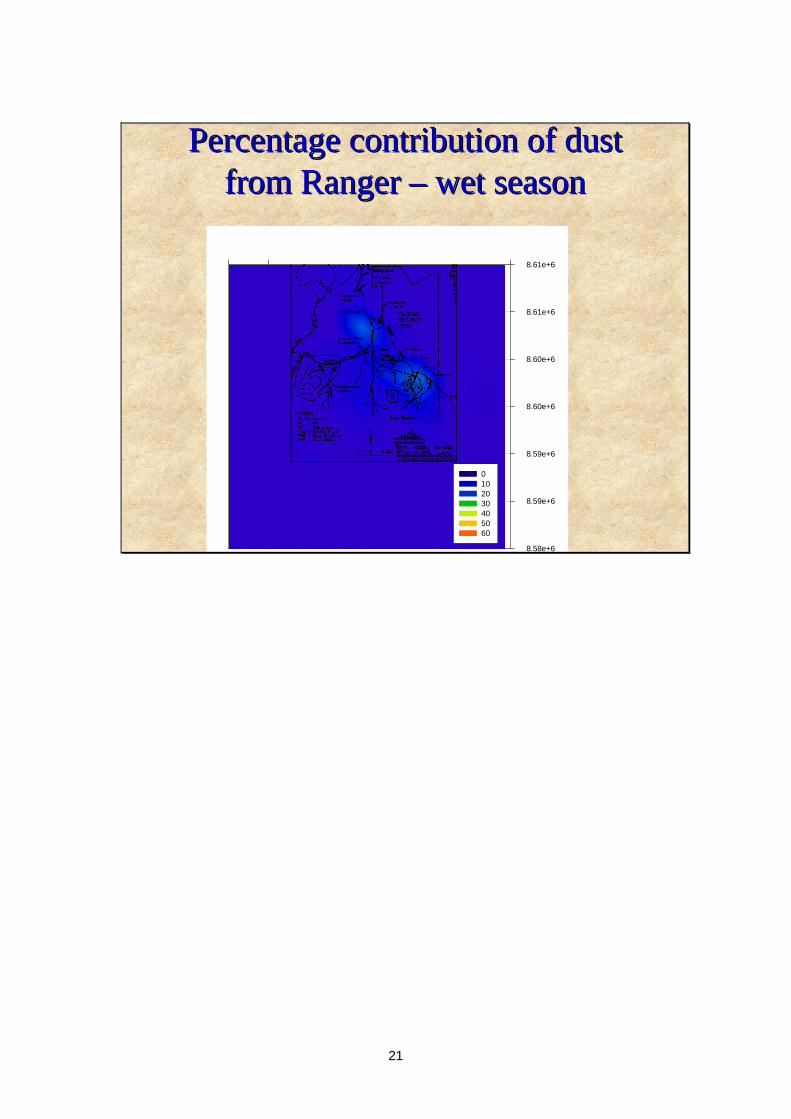
Percentage contribution of dust Percentage contribution of dust from Ranger from Ranger –– wet seasonwet season
8.58e+6
8.59e+6
8.59e+6
8.60e+6
8.60e+6
8.61e+6
8.61e+6
0 10 20 30 40 50 60
22
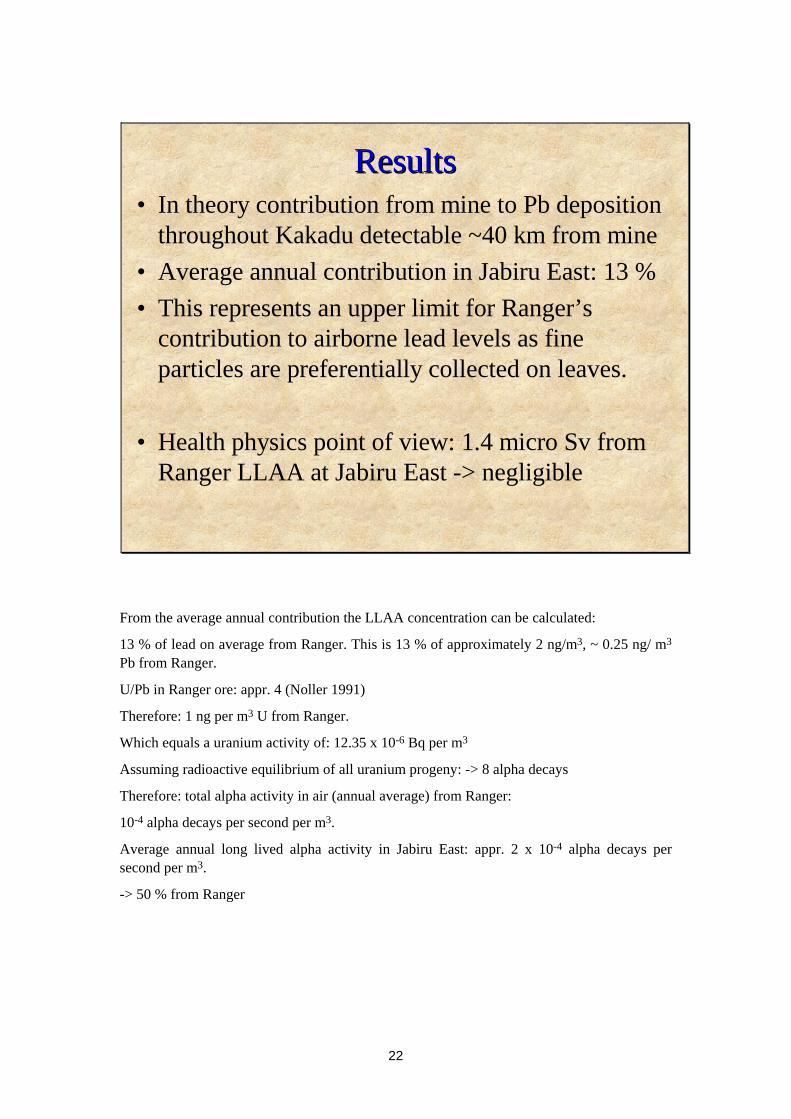
ResultsResults• In theory contribution from mine to Pb deposition
throughout Kakadu detectable ~40 km from mine• Average annual contribution in Jabiru East: 13 %• This represents an upper limit for Ranger’s
contribution to airborne lead levels as fine particles are preferentially collected on leaves.
• Health physics point of view: 1.4 micro Sv from Ranger LLAA at Jabiru East -> negligible
From the average annual contribution the LLAA concentration can be calculated:
13 % of lead on average from Ranger. This is 13 % of approximately 2 ng/m3, ~ 0.25 ng/ m3
Pb from Ranger.
U/Pb in Ranger ore: appr. 4 (Noller 1991)
Therefore: 1 ng per m3 U from Ranger.
Which equals a uranium activity of: 12.35 x 10⁻⁶ Bq per m3
Assuming radioactive equilibrium of all uranium progeny: -> 8 alpha decays
Therefore: total alpha activity in air (annual average) from Ranger:
10-4 alpha decays per second per m3.
Average annual long lived alpha activity in Jabiru East: appr. 2 x 10⁻⁴ alpha decays per second per m3.
-> 50 % from Ranger
23
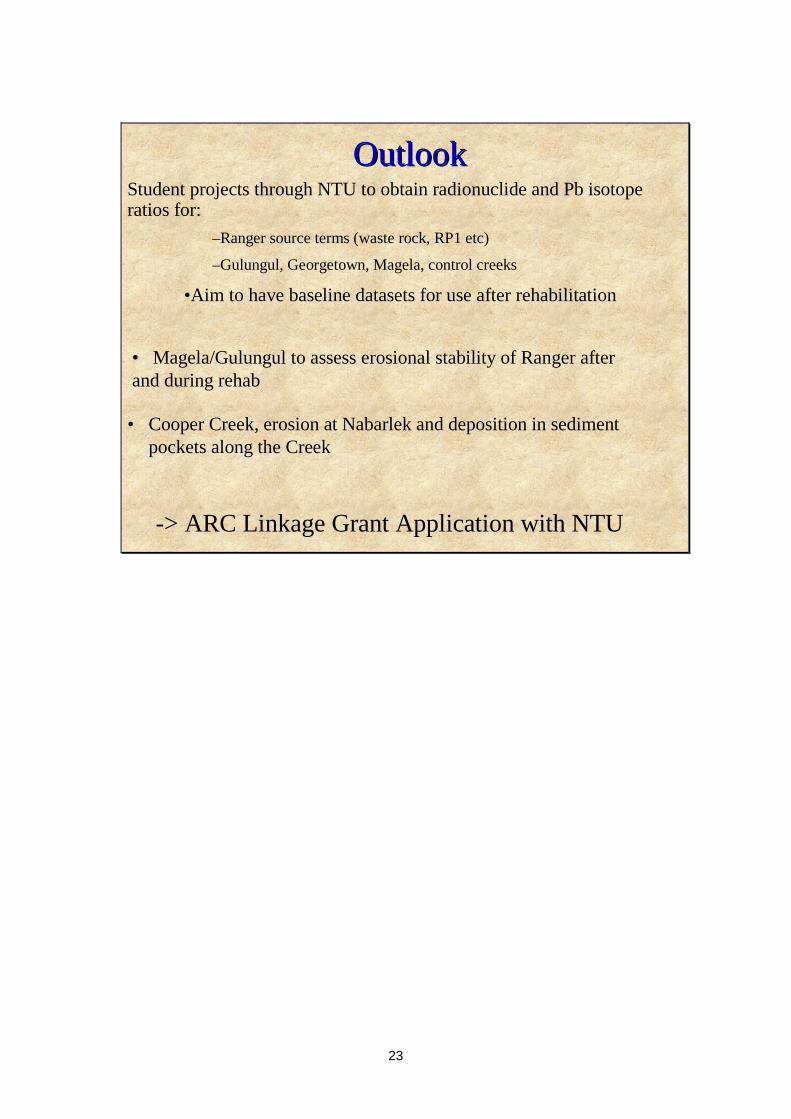
OutlookOutlook
• Cooper Creek, erosion at Nabarlek and deposition in sediment pockets along the Creek
• Magela/Gulungul to assess erosional stability of Ranger after and during rehab
-> ARC Linkage Grant Application with NTU
Student projects through NTU to obtain radionuclide and Pb isotope ratios for:
–Ranger source terms (waste rock, RP1 etc)
–Gulungul, Georgetown, Magela, control creeks
•Aim to have baseline datasets for use after rehabilitation
24
References Bollhöfer A, Chisholm W & Rosman KJR 1999. Sampling aerosols on a global scale. Anal
Chim Acta 390, 227–235.
Bollhöfer A & Rosman KJR 2000. Isotopic source signatures for atmospheric lead: The Southern Hemisphere. Geochim. Cosmochim. Acta 64, 3251–3262.
Bollhöfer A & Rosman KJR 2001. Isotopic source signatures for atmospheric lead: The Northern Hemisphere, Geochim. Cosmochim. Acta 65, 1727–1740.
Bollhöfer A & Martin P 2003. Radioactive and radiogenic isotopes in Ngarradj (Swift Creek) sediments: a baseline study. Internal Report 404, February, Supervising Scientist, Darwin. Unpublished paper.
Bollhöfer A, Honeybun R & Rosman K 2003. Atmospheric transport of radiogenic lead in the vicinity of Ranger uranium mine determined using lead isotope ratios in dust deposited on acacia leaves. Internal Report 451, August, Supervising Scientist, Darwin. Unpublished paper.
Gulson BL, Mizon KJ, Korsch MJ, Carr GR, Eames J & Akber RA 1992. Lead isotope results for waters and particulates as seepage indicators around the Ranger tailings dam: A comparison with the 1984 results. Open file record 95, Supervising Scientist for the Alligator Rivers Region, Canberra. Unpublished paper.
Noller BN 1991. Non-radiological contaminants from uranium mining and milling at Ranger, Jabiru, Northern Territory, Australia. Environmental Monitoring and Assessment 19, 383–400.
Tatsumoto M, Knight RJ & Allegre CJ 1973. Time differences in the formation of meteorites as determined from the ratio of lead-207 to lead-206. Science 180, 1278–1283.