pbpk modeling to unravel nonlinear pharmacokinetics of...
TRANSCRIPT

1521-009X/43/4/631–645$25.00 http://dx.doi.org/10.1124/dmd.114.062265DRUG METABOLISM AND DISPOSITION Drug Metab Dispos 43:631–645, April 2015Copyright ª 2015 by The American Society for Pharmacology and Experimental Therapeutics
Accelerated Communication
PBPK Modeling to Unravel Nonlinear Pharmacokinetics of Verapamilto Estimate the Fractional Clearance for Verapamil N-Demethylation
in the Recirculating Rat Liver Preparation s
Qi Joy Yang, Luqin Si,1 Hui Tang,2 Helle H. Sveigaard, Edwin C. Y. Chow, and K. Sandy Pang
Leslie Dan Faculty of Pharmacy, University of Toronto, Toronto, Ontario, Canada (Q.J.Y., L.S., H.T., H.H.S., E.C.Y.C., K.S.P.);School of Pharmacy, Tongji Medical College, Huazhong University of Science and Technology, Wuhan, Hubei, P.R. China (L.S.);School of Pharmacy, Shihezi University, Shihezi, Xinjiang, P.R. China (H.T.); and Denmark Pharmaceutical University, Copenhagen,
Denmark (H.H.S.)
Received November 20, 2014; accepted February 3, 2015
ABSTRACT
We applied physiologically based pharmacokinetic (PBPK) model-ing to study the dose-dependent metabolism and excretion ofverapamil and its preformed metabolite, norverapamil, to unravelthe kinetics of norverapamil formation via N-demethylation. Variousinitial verapamil (1, 50, and 100 mM) and preformed norverapamil(1.5 and 5 mM) concentrations, perfused at 12 ml/min, were in-vestigated in the perfused rat liver preparation. Perfusate and bilewere collected over 90 minutes, and livers were harvested at the end ofperfusion for high-performance liquid chromatography analysis. Aftercorrection for the adsorption of 10%–25% dose verapamil andnorverapamil onto Tygon tubing and binding to albumin and red bloodcell, fitting of verapamil and formed and preformed norverapamil datawith ADAPT5 revealed nonlinearity for protein binding, N-demethylation(VVER → NOR
max;met1 ¼ 96:6633:4 nmol/min; KVER → NORm;met1 ¼ 10:464:1 mM),
formation of other metabolites (VVER → othersmax;met2 ¼ 288651 nmol/min;
KVER → othersm;met2 ¼ 14:164:9 mM), as well as biliary excretion
(VVERmax;sec ¼ 0:91160:505 nmol/min; KVER
m;sec ¼ 4:756 2:29 mM). Thehepatic clearance of verapamil (CLVER
L ) decreased with the dose(8.16–10.2 ml/min), with values remaining high relative to perfusateblood flow rate among the doses. The hepatic clearance of preformednorverapamil (11 ml/min) remained unchanged for the concentrationsstudied and approximated perfusate blood flow rate, suggesting a highnorverapamil extraction ratio. The fractional formation of norverapamiland biliary excretion of verapamil based on fitted constants were 31.1%and 0.64% of CLVER
L , respectively. Enantiomeric disposition and auto-inhibition of verapamil failed to perturb these estimaties accordingto PBPK modeling, due to the low values of the Michaelis-Mentenconstant, Km, and inhibition parameter, kI.
Introduction
Verapamil, a calcium channel blocker (Fleckenstein, 1977) used forthe treatment of cardiac arrhythmias and hypertension (McTavish andSorkin, 1989), is given as a racemic mixture. Much is known about thestereoselective disposition of the more potent S- versus R-verapamil inhuman and rats (Bhatti and Foster, 1997; Busse et al., 2006). Bindingof verapamil to bovine serum albumin (BSA) revealed that the
unbound plasma fraction of R-verapamil (;0.65) exceeds that ofS-verapamil (;0.55) (Mehvar and Reynolds, 1996). The reverse is truefor binding to human serum albumin and a1-acid glycoprotein (Mehvarand Reynolds, 1996; Hanada et al., 1998), whereas the plasma boundfraction of verapamil in human is concentration independent within thetherapeutic range and unaltered by the presence of norverapamil (Keefeet al., 1981). The distribution of verapamil and norverapamil into redblood cells (RBCs) is also stereoselective [human (S . R) versus rat(R . S)] (Robinson and Mehvar, 1996).Much species difference exists for the metabolism of verapamil.
First-pass removal of verapamil is attributed to both the intestine andliver in rats (Hanada et al., 2008) and man (Fromm et al., 1998), althoughintestinal elimination is lacking in dogs (Lee et al., 2001). At least 25Phase I and 14 Phase II metabolites have been identified in the rat (Walleset al., 2003). First-pass metabolism in rats is saturable and stereo-selective: hepatic bioavailability for R-verapamil is higher than that forS-verapamil, but the opposite was observed for intestinal bioavailability,resulting in a higher systemic bioavailability for R-verapamil followingoral dosing (Hanada et al., 2008). Extensive first-pass removal and liver
L.S. and H.T. were supported by the China Scholarship Council (CSC), andK.S.P. is supported by Canadian Institute of Heath Research (CIHR).
The work was presented in part, at the 2014 AAPS Annual Meeting; San Diego,CA.
Q.J.Y. and L.S. contributed equally to this work.1Current affiliation: School of Pharmacy, Tongji Medical College, Huazhong
University of Science and Technology, Wuhan, Hubei, P.R. China.2Current affiliation: Pharmacy School, Shihezi University, Shihezi City, Xinjiang,
P.R. China.dx.doi.org/10.1124/dmd.114.062265.s This article has supplemental material available at dmd.aspetjournals.org.
ABBREVIATIONS: AIC, Akaike information criterion; AUC, area under the curve; BSA, bovine serum albumin; CL, clearance; Hct, hematocrit;HPLC, high-performance liquid chromatography; KHB, Krebs-Henseleit buffer; PBPK, physiologically based pharmacokinetic; RBC, red blood cell;SSWR, sum of squared weighted residuals.
631
http://dmd.aspetjournals.org/content/suppl/2015/02/03/dmd.114.062265.DC1Supplemental material to this article can be found at:
at ASPE
T Journals on July 13, 2018
dmd.aspetjournals.org
Dow
nloaded from

clearance (CL) have been reported, with verapamil being mostlymetabolized via N- and O-dealkylation (98%) in both rats and humans(Eichelbaum et al., 1979; Woodcock et al., 1981; Choi and Burm,2008), with norverapamil and D617 as major metabolites formed viaN-dealkylation, predominantly by CYP3A4, CYP3A5, CYP2C8, andCYP2E1 (Eichelbaum et al., 1979; Kroemer et al., 1992; Tracy et al.,1999; Sun et al., 2004). Nonlinear metabolism was observed in manfollowing long-term, repeated oral dosing (1–1.6 mg/kg over 1 month),leading to prolongation of half-life and decreased apparent clearance(CL/F, or Dosepo/AUCpo, where AUC denotes area under the curve)(Freedman et al., 1981; Shand et al., 1981). High doses of verapamil (6–19 mg/kg) infused intravenously in man resulted in saturable kineticsand decreased systemic clearance with dose escalation (Toffoli et al.,1997). In addition, verapamil and norverapamil were reported to bemechanism-based inhibitors of cytochrome P450 and P-gp, whichresulted in auto-inhibition upon long-term use clinically (Lemma et al.,2006; Wang et al., 2013). Verapamil and norverapamil were present atsignificantly higher concentrations in human intestine lumen and bilecompared with plasma, suggesting excretion mediated by transporters,probably P-gp (von Richter et al., 2001). Norverapamil is transported byP-gp in Caco-2 cells and P-gp-overexpressing L-MDR1 cells, but toa lesser extent than other verapamil metabolites, D-617 and D-620(Pauli-Magnus et al., 2000).The need for understanding metabolite formation kinetics is
paramount, especially when the metabolite in question is active ortoxic (Baillie et al., 2002; Pang, 2009). The purpose of this inves-tigation is to develop a strategy to study dose-dependent verapamilmetabolism and biliary excretion and describe metabolite forma-tion kinetics on the importance of a given metabolic pathway(N-demethylation) relative to other elimination pathways (metab-olism or biliary excretion) with use of verapamil and its activemetabolite, norverapamil. To this end, Mehvar et al. (1994) es-timated the extent of formation of norverapamil from verapamilin the perfused rat liver preparation and examined removal ofverapamil from plasma. Since the Km value for metabolism rangesfrom 60 to 140 mM (Hanada et al., 2008), we employed initialconcentrations of 1–100 mM verapamil to revisit the problem ofmetabolite kinetics in the recirculating perfused rat liver prepara-tion. Mechanism-based auto-inhibition for verapamil that exists inman (Wang et al., 2004, 2013) was not observed in rat livermicrosomes, hepatocytes, and precision-cut liver slices (Obach,1999; Shibata et al., 2002; Axelsson et al., 2003; Guo et al., 2007),except with gel entrapment after prolonged exposure with verapamil(Yin et al., 2011). Hence, auto-inhibition is not expected to occurwithin the short time frame for liver perfusion studies. We appliedphysiologically based pharmacokinetic (PBPK) modeling, toaccount for tubing adsorption of verapamil and norverapamil andstereoselective vascular binding and saturable metabolism andexcretion.
Materials and Methods
Materials
Verapamil (racemic, R-, and S-; C27H38N2O4) and norverapamil (C26H36N2O4)were purchased from Sigma-Aldrich (Mississauga, Canada). BSA wasobtained from Sigma-Aldrich; dextrose (50%) was purchased from AbbottLaboratories (Montreal, Canada). High-performance liquid chromatography(HPLC) grade acetonitrile, methanol, and ethyl acetate were obtained fromSigma-Aldrich. Male Sprague-Dawley rats (324 6 31.1 g) were supplied byCharles River Laboratories (St. Constant, Canada). [3H]Verapamil, producedvia general tritium exchange (specific activity 1 mCi/ml; .97% radiochem-ical purity by HPLC), was obtained from American Radiolabeled ChemicalsInc. (St. Louis, MO).
Albumin Binding and RBC Partitioning of Verapamil
A mixture of labeled and unlabeled verapamil was used to provide forsensitivity in the binding studies. The total verapamil concentration was givenas the sum of the labeled (from the specific activity) and unlabeled verapamil,and the dpm/ml in plasma was the equivalent of the assayed HPLC con-centration in plasma. Binding of [3H]verapamil to BSA (2%) was measured inequilibrium dialysis half-cells that were separated by a semipermeable mem-brane (molecular cutoff 12,000–14,000; Spectrum Laboratories Inc., RanchoDominguez, CA). Next, 1 ml 2% BSA in Krebs-Henseleit buffer (KHB)(pH 7.4) containing various concentrations of verapamil (0.4–140 mM) wasadded to the protein-side half-cell, and then 1 ml of KHB was introduced to theother (buffer side) half-cell. The cell was incubated at 37�C using rotating waterbath. After 5 hours of equilibration, the time predetermined for equilibration,samples (100 ml) from both sides were removed for protein determination andliquid scintillation counting (using an LS 5801 Counter; Beckman CoulterCanada, Mississauga, Canada). Preservation of protein and water volumes waschecked at the end of the experiment. The dpm values in the protein and buffersides were counted. The plasma unbound fraction of verapamil (fP) was calculatedas the ratio of verapamil concentrations in the buffer side to that in the proteinside, at the plasma concentration determined at the end of the binding study.
The distribution of verapamil into RBCs was studied by mixing[3H]verapamil and unlabeled (1–440 mM) verapamil in 2% BSA plasmaperfusate. Upon mixing this protein solution with an equal volume of bloodperfusate containing 40% washed bovine erythrocytes, RBC (or 2� the normal20% RBC, a kind gift from Ryding-Regency Meat Packers Ltd., Toronto),a blood perfusate of composition identical to that used for perfusion wasobtained. Aliquots of the resultant labeled and unlabeled verapamil concentrationin blood perfusate (CB) (one-half of the concentration of the initial plasmaperfusate), were removed for assay by HPLC, and for incubation at 37�C for5 minutes. Then, 200 ml blood perfusate was removed at 0.25, 0.5, 0.75, 1, 1.5, 2,3, 4, and 5 minutes after incubation, and hematocrit (Hct) was measured at0.25 and 5 minutes. The total verapamil concentration in plasma (CP) wasestimated using liquid scintillation counting; the concentration in RBCs (CRBC)was calculated as CRBC ¼ ½CB 2CPð12HctÞ�=Hct. Data of verapamil bindingto BSA and distribution to RBC were then fitted simultaneously according to thebinding model with one class of binding sites (see Appendix A for the massbalance equations) to furnish constants such as the binding association constant(KA) and modified rate constants for partitioning into (k9pr)and out of (k9rp) RBCsbased on the total drug concentration using ADAPT, version 5 (BiomedicalSimulations Resource, University of Southern California, Los Angeles, CA). Thefraction unbound in plasma (fP) was predicted according to best-fitted bindingparameters.
Recirculating Rat Liver Perfusion and Drug Adsorption
The perfusion apparatus, TWO/TEN Perfuser (MX International, Aurora, CO),was used for recirculation of verapamil and norverapamil at the flow rate of12 ml/min and 37�C. Perfusate consisted of 1% BSA, 0.6% dextrose, and 20%washed bovine erythrocyte in oxygenated (95% O2 and 5% CO2 at 1 l/min) KHB,pH 7.4. The surgical and liver perfusion procedures were identical to thosedescribed previously (Tan and Pang, 2001). Male Sprague-Dawley rats (300–365 g) were anesthetized with a mixture of ketamine (90 mg/kg) and xylazine(10 mg/kg), and recirculating liver perfusion was conducted after cannulationof the bile duct and portal and hepatic veins for the inflow and outflow, re-spectively; the hepatic artery was ligated. Drug-free blank perfusate was firstused to recirculate the liver for 20 minutes for equilibration, followed byperfusion with drug-containing perfusate from a second reservoir (200 ml)consisting of the designated concentration of verapamil (1, 50, or 100 mM,n = 4) or preformed norverapamil (1.5 mM, n = 4, or 5 mM, n = 3) for the next90 minutes. Reservoir perfusate (1 ml) was removed at 2.5, 7.5, 12.5, 17.5,22.5, 27.5, 35, 45, 55, and 70 minutes, and 2 ml was removed at 0 and90 minutes. Bile was sampled at 5 minute intervals between 0 and 30 minutes,or at 10 or 20 minute intervals thereafter. At the end of perfusion (90 minutes),the liver was flushed with 50 ml cold blank KHB to remove any residualblood perfusate, and the liver was weighed, minced, blast frozen with liquidnitrogen, and stored at 280�C until analysis by HPLC.
Since adsorption of verapamil and norverapamil to tubing was found, Tygontubing of constant length (obtained from Saint-Gobain Performance Plastics,
632 Yang et al.
at ASPE
T Journals on July 13, 2018
dmd.aspetjournals.org
Dow
nloaded from

Valley Forge, PA), which exhibited less binding to the compounds, was usedfor perfusion. For characterization of binding, liver perfusion with drug-free (20minutes) and then verapamil- or norverapamil-containing (90 minutes) bloodperfusate was conducted in the absence of the rat liver to characterize for theloss of drug due to binding to tubing.
HPLC
For Measuring CB and Distribution of Verapamil into RBC. A HPLCmethod was used for the separation of verapamil and its internal standard (50 mlof 100 mg/ml diltiazem) at the wavelength of 230 nm (Garcia et al., 1997). TheHPLC system consisted of a Shimadzu 6A UV spectrophotometric detector, LC-6AD liquid chromatograph, SIL-9A autoinjector, CR-4A chromatopac (MandelScientific Company, Guelph, ON), and a Waters 15–20 mm mBondapak C18
reverse column (3.9 � 300 mm, Waters Limited, Mississauga, ON, Canada). Themobile phase [40% 0.04 M ammonium acetate: triethylamine (2:0.04 v/v) + 60%methanol] was delivered at a flow rate of 0.9 ml/min. The typical retention timesfor verapamil and diltiazem were 18 and 23 minutes, respectively. The extractionprocedure of verapamil for blood perfusate samples was as follows: to 1 mlsample in a 12 ml polypropylene tube, 50 ml of 100 mg/ml diltiazem, and 75 mlof 1 M NaOH were added and mixed thoroughly, and then 4 ml of a hexane and2-propanol mixture (2:1 v/v) was added. The content was mixed for 2 minutes,followed by centrifugation at 3000 rpm. After removal and drying of the extractunder N2, the residue was reconstituted in 200 ml acetontrile and water (1:1 v/v)for HPLC injection.
Verapamil and Norverapamil Determination in Tubing Adsorption andLiver Perfusion Studies. In these studies, the Shimadzu 10A HPLC systemwas used to separate verapamil and norverapamil at the detection wavelength of278 nm. The system consisted of a Shimadzu SCL-10A system controller,a SPD-10A UV-visible detector, a SIL-10XL automatic injector, a FCV-10ALsolvent delivery unit and a LD-10AT liquid chromatograph. A 10 mm C18
reverse column (4.6 � 250 mm, Altech Associates, Deerfield, IL) was used toseparate verapamil, norverapamil, and the internal standard (diazepam). Themobile phase consisted of 55% of 0.02 M ammonium acetate buffer (0.4%triethylamine, pH adjusted to 6 with acetic acid) and 45% of acetonitrile, andwas maintained for 30 minutes for each injection at a flow rate of 1 ml/min. Thecalibration curves for verapamil and norverapamil were linear over the rangesof 0.25–60, and 0.125–30 nmol, respectively, in 2 ml perfusate, with correlationcoefficients of ;0.999 (n = 5). The limits of quantitation were 0.25 nmol forverapamil and 0.125 nmol for norverapamil. The typical retention times forverapamil, norverapamil, and diazepam were 15, 12, and 23 minutes, respectively.
Blood perfusate samples (0.25–1.8 ml) were made up to a final volume of2 ml with blank perfusate, mixed with 50 ml internal standard (50 mg/mldiazepam) and 50 ml of 1 M NaOH, and extracted against 6 ml ethyl acetate.
After repeated, 3 minute vigorous mixing, the mixture was centrifuged at 3000rpm for 10 minutes and the supernatant was transferred and dried undernitrogen gas. The dried residue that was reconstituted in the 100 ml mobilephase was centrifuged, and 50 ml was injected. Liver tissue was obtained fromhomogenization in 1.5� volume of ice-cold saline for 30 seconds 3�. Then,0.2 ml was removed, and 1 ml ethyl acetate was added and mixed for3 minutes, followed by centrifugation at 3000 rpm for 10 minutes. The organiclayer was removed and dried under nitrogen gas and the residue wasreconstituted with the 200 ml mobile phase, and 150 ml was injected into theHPLC. Calibration curves were prepared based on a set of standards containingvarying known concentrations of verapamil and norverapamil in perfusateblood or tissue, prepared under identical conditions as the samples.
Bile samples were made up to 60 ml with H2O, 10 ml acetonitrile and 10 mlinternal standard (50 mg/ml diazepam) were added, and then 1 ml ethyl acetatewas extracted. The nitrogen-dried supernatant was reconstituted in the 200 mlmobile phase and 90 ml was injected into the HPLC. For the norverapamilperfusion studies, bile collected during the entire 90 minutes of perfusion waspooled, mixed with 50 ml acetonitrile, 50 ml of 50 mg/ml diazepam, and 50 mlNaOH (1 M), and then extracted with 3 ml ethyl acetate. After the supernatantwas nitrogen dried, the residue was reconstituted in the 200 ml mobile phase,and 50 ml was injected into the HPLC. The concentrations of verapamil andnorverapamil were determined with the use of calibration curves, preparedunder identical conditions.
PBPK Modeling
We applied a PBPK model to fit the perfusate, liver, and bile data ofverapamil and preformed and formed norverapamil simultaneously (Fig. 1).The model was constructed under a number of assumptions and using the massbalance equations given in the Appendices A–C. The tubing adsorption rateconstants, estimated for reservoir for verapamil (kVERR→ t or kVERt→R) and norverapamil(kNORR→ t or kNORt→R) via fitting of the perfusion data in absence of liver (shamexperiments), were viewed to be identical to other perfusion experiments withliver. These tubing adsorption rate constants, along with other physiologicparameters such as liver volume (VL) and hepatic blood perfusate flow (QL), wereassigned for modeling of the liver perfusion data. The recirculating liverpreparation was constructed as two compartments, liver blood (LB) and livertissue (L), which were connected to the reservoir (R) by the hepatic perfusateblood flow (QL). A flow-limited distribution of verapamil and preformed andformed norverapamil was assumed because these drugs are lipophilic compounds(logP ¼ 3:79 and 3.3, respectively), and therefore can diffuse freely across themembrane. The influx clearance (CLVER
in or CLNORin ) and efflux clearance (CLVER
ef
or CLNORef ) were assumed to be the same, and were assigned as 5� the value of
perfusate blood flow (QL) as initial estimates for the influx/efflux clearances in
Fig. 1. PBPK model of verapamil (racemic) and norverapamil inthe recirculating perfused rat liver. Perfusate blood flow rate (QL)interconnects the reservoir with liver blood compartment. Thecompartments are denoted as the reservoir (R), Tygon tubing (t),liver blood (LB), liver tissue (L), and bile. Enzymes (Cyps) andtransporters (P-gp) are considered in the model. Both verapamiland norverapamil are adsorbed onto the Tygon tubing (top), andconcentrations of unbound verapamil and norverapamil in reservoirblood (denoted by f VERB VERLB and f NORB NORLB, respectively)reach liver blood and rapidly diffuse into and out of the liver (viaCLin and CLef, respectively, the transport clearances that equal eachother). Unbound verapamil in liver (of concentration f VERL VERL) ismetabolized to norverapamil via N-demethylation, with the intrinsicclearance, CLVER → NOR
int;met1 . VER is also eliminated in liver to formother metabolites or is excreted into bile, with intrinsic clearances ofCLVER → others
int;met2 and CLVERint;sec, respectively. Similarly, unbound nor-
verapamil (of concentration f NORL NORL), the formed metabolite, isfurther metabolized (CLNOR
int;met) and secreted (CLNORint;sec). Since all these
metabolic and secretory pathways are saturable, the intrinsic clearanceparameters may be expressed in terms of Vmax and Km as well as theunbound liver concentration (see Appendix C for the mass balanceequations). Two transit compartments (of amounts AVER
tr1 and AVERtr2 ;
ANORtr1 and ANOR
tr2 ) were defined in the model to account for the timedelay (t) in biliary secretion.
Nonlinear Metabolite Kinetics of Verapamil 633
at ASPE
T Journals on July 13, 2018
dmd.aspetjournals.org
Dow
nloaded from

the PBPK model. Since only unbound verapamil and norverapamil were able tobe transported or eliminated, the unbound fractions of drug in blood perfusate, fB(measured experimentally and incorporated in the model, see Appendices A–C),and liver (fL; fitted in the model) were considered. Verapamil was metabolized tonorverapamil or other metabolites, with the metabolic intrinsic clearances,CLVER → NOR
int;met1 and CLVER → othersint;met2 [Vmax/Km and Vmax/(CL,u + Km) for linear and
nonlinear conditions, respectively, where CL,u denotes the unbound liverconcentration]. The assumption that stereoselective metabolism of verapamilunder our high concentrations being unimportant was made. Norverapamil wasfurther metabolized with the intrinsic metabolic clearance or CLNOR
int;met (orVNORmax =KNOR
m ). Verapamil and norverapamil were secreted into bile with secretoryintrinsic clearances, CLVER
int;sec (or VVERmax;sec=K
VERm;sec) or CL
NORint;sec (or VNOR
max;sec=KNORm;sec),
respectively. Transit compartments (Atr) containing time delays (represented asthe t function) were incorporated to describe the delayed biliary secretion ofverapamil and norverapamil (see Appendix C for the mass balance equations).
Our strategy was to first consider linearity in the removal processes forverapamil metabolism and excretion, and then consideration of each pathway asnonlinear. Michaelis-Menten equations, with the appropriate maximumvelocity of the enzyme or transporter, Vmax, and Michaelis-Menten constant,Km, terms were used in lieu of CLint for metabolism and biliary secretion: themetabolic intrinsic clearance of the liver, CLint,met, or the excretory intrinsicclearance of the liver, CLint,sec, is equal to Vmax=ðCL;u þ KmÞ, namely, theintrinsic clearance terms under nonlinear conditions were given as Vmax dividedby the sum of the unbound substrate concentration in liver (CL,u) and the Km
term. In parallel, data for preformed norverapamil metabolism and excretionwere fitted, with and without nonlinearity. The final fit consisted ofsimultaneously fitting of both verapamil (1, 50, and 100 mM) and formedand preformed norverapamil (1.5 and 5 mM) data.
The model fitting criterion was evaluated based on the Akaike informationcriteria (AIC) score, or 2k2 2lnðlikelihoodÞ, where k is the number of pa-rameters in the model and likelihood is the maximum value of the likelihoodfunction for the model. The AIC score evaluates the goodness-of-fit withconsideration of the penalty for adding additional parameters to fit the data set;the lower the AIC score, the better is the goodness-of-fit. Also, the correlationbetween predicted and observed concentrations and weighted residuals,calculated as (observations 2 predictions)/observations versus time plots wereused to examine systematic trends and extreme values. The sum of squaredweighted residuals (SSWR) was calculated for each of the candidate models todefine which model was most appropriate to describe the pharmacokinetics ofverapamil and formed and preformed norverapamil.
Statistical Analysis
The estimated parameters were shown as the mean 6 S.D. (CV%). TheCV% was calculated as S.D./mean � 100%. The two-tailed student t test withunequal variance was used to compare the means between two groups, anda P value of less than 0.05 was considered as significant. One-way analysisof variance and the post-hoc Tukey honest significance difference test wereused to evaluate the means in three dosing groups (1, 50, and 100 mM)using SPSS, version 22 (IBM Corp., New York). The F test was used toassess model improvement (Boxenbaum et al., 1974). The error proportional
method was used to calculate uncertainties: DZ ¼ffiffiffiffiffiffiffiffiffiffiffiffiffiffiffiffiffiffiffiffiffiffiffiffiffiffiffiffiffiffiffiffiffiffiffiffiffiffiffiffiffiðDXÞ2 þ ðDYÞ2 þ⋯
qwas used when adding or subtracting two or more values with the S.D.;
DZ=Z ¼ffiffiffiffiffiffiffiffiffiffiffiffiffiffiffiffiffiffiffiffiffiffiffiffiffiffiffiffiffiffiffiffiffiffiffiffiffiffiffiffiffiffiffiffiffiffiffiffiffiffiffiffiðDX=XÞ2 þ ðDY=YÞ2 þ⋯
qwas used when multiplying or dividing
two or more values with the S.D.
Results
Protein Binding and RBC Partitioning. Binding of verapamil(0.4–140 mM) to BSA (2%) in plasma was found to be concentrationdependent, with the unbound fraction in plasma (fP) varying from 0.4to 0.6 within the concentration range studied (Fig. 2A). The ratio ofverapamil concentration in perfusate blood to plasma (CB/CP) wasfound to be concentration dependent, with the value increasing from1.11 6 0.07 to 1.29 6 0.05 (P , 0.001) within the concentrationrange of 1–441 mM examined. An average unbound fraction of
verapamil in blood perfusate (0.45 6 0.09) may be estimated, basedon the average value of fP ( fB = Cp fp/CB) (Pang and Rowland, 1977).The ratio of verapamil concentrations in RBCs and plasma (CRBC/CP)was around 2–3 within the concentration range studied when the Hctwas 0.134 6 0.014, showing that verapamil can distribute into RBCs.Upon fitting the data to the model (Appendix A), the nonlinear proteinbinding and distribution into RBC were adequately described by themodel with one class of binding sites (Fig. 2B), yielding fitted valuesof modified rate constants k9pr (13.2 6 4.4 min21) and k9rp (19.5 6 8.7min21), the number of protein binding sites (n = 0.301 6 0.160), andbinding association constant (KA = 0.00916 0.0057 mM21). Since theturnover time (1=k9pr) of verapamil in red cells was 3.1 seconds—a valuemuch lower than the mean transit time of blood in the liver, or 14–15seconds (Pang et al., 1995)—verapamil in plasma and RBC wouldrapidly achieve equilibrium and will not affect verapamil removal.Nonlinear protein binding due to one single class of binding sites andconcentration-dependent CB/CP were incorporated in the PBPK modeling(Appendices B and C). Protein binding according to two classes ofbinding sites was also considered for fitting, although the fit wassuboptimal (data not shown). Binding would not materially affect theclearance of verapamil since the drug is highly cleared, and the trendwas verified, namely, small changes in fB (with values fluctuating by+0.1 or 20.1), would not materially alter subsequent metabolism orexcretion (simulations not shown).Tubing Adsorption. The adsorption profiles of verapamil and
norverapamil to Tygon tubing are shown in Fig. 3. The rate constantsfor binding (kR→t) to tubing and debinding (kt→R), obtained fromfitting the adsorption data without rat liver, are summarized in Table 1.Although the absolute amounts of drug adsorbed to Tygon tubingincreased with dose, the %dose of verapamil and preformed norverapamiladsorbed decreased with increasing concentrations perfused. The lowestadsorbed amount (50 nmol or 25% dose) occurred for the lowest con-centration (for the initial concentration of 1 mM), whereas about 10%dose (1 or 2 mmol) was adsorbed for higher doses (for initial con-centrations of 50 and 100 mM). Similarly, the amount of norverapamiladsorbed onto the Tygon tubing increased from 0.06 to 0.1 mmol afterperfusion with initial concentrations of 1.5 and 5 mM norverapamil. Therate constants for binding to Tygon tubing (kVERR→ t and kNORR→ t) decreased asthe dose escalated, suggesting that tubing binding sites might be saturatedat higher drug concentrations. There was no change in the return rateconstants (kVERt→R and kNORt→R). The tubing rate constants (Table 1) wereassigned as constants into the PBPK model (see Appendix C for the massbalance equations).Nonlinear Kinetics of Verapamil and Norverapamil. The
physiologic and experimentally derived estimates for the verapamil(Supplemental Table 1; Table 2) and preformed norverapamil(Supplemental Table 2; Table 3) perfusion studies are summarized.Preformed norverapamil was investigated to provide information onthe sequential handling of norverapamil formed from verapamil. Thetemporal profiles of verapamil and its preformed and formed metabolitenorverapamil in perfusate, liver, and biliary secretion are shown inFig. 4. Volume recovery was ;85%, showing small experimental error.In reservoir perfusate, the verapamil concentrations decreased rapidlyfollowing an apparent log-linear decay, and the terminal elimination rateconstant (calculated from the slope of elimination phase, b) was signi-ficantly decreased from 0.05366 0.0008 to 0.03866 0.0075 min21 forthe high-dose groups (50 and 100 mM) compared with the low-dosegroup (1 mM; P = 0.0007), suggesting that the apparent half-life wasprolonged with dose, exhibiting concentration-dependent or nonlinearkinetics. Similarly, the hepatic clearance (CLVER
L ) for verapamildecreased from 10.2 to 8.75 ml/min (P = 0.04), although the valuesremained high and close to the perfusate blood flow rate; EVER
L or the
634 Yang et al.
at ASPE
T Journals on July 13, 2018
dmd.aspetjournals.org
Dow
nloaded from

extraction ratio of verapamil ¼ CLVERL =QL was high (0.8). Concen-
trations of formed norverapamil in perfusate were very low (, 4 mM),and no apparent trend was observed over time. The dose-normalizedAUCVER
‘ and AUCVER → NOR‘ increased with increasing input concen-
trations, suggesting accumulation of drug and metabolite in perfusatewith dose (Supplemental Table 1).Preformed norverapamil decayed rapidly and monoexponentially in
reservoir perfusate (Fig. 5), yielding similar terminal elimination rateconstants (0.0484 6 0.0022 versus 0.0612 6 0.008 min21; P = 0.15)for the 1.5 and 5 mM input concentration groups. Biliary excretionof norverapamil was not remarkable. The estimated extraction ratioof preformed norverapamil (ENOR
L ¼ CLNORL =QL ) was high (0.9). The
fraction of hepatic clearance of verapamil forming norverapamil(hVER → NOR
mi ), based on the assumption of linearity for the lowest verapamilconcentration (1 mM) and the equation comparing the AUC of formedversus preformed norverapamil, normalized to the availability of norve-rapamil, ½ðAUCVER → NOR
i:v: =DoseVERi:v: Þ=ðAUCNORp
i:v: =DoseNORp
i:v: Þ�=FNORp
L ,was 23.2% (Pang and Kwan, 1983). Biliary excretion clearance ofverapamil was 1% of CLVER
L for the lowest input concentration of 1 mM(Table 2); the biliary secretion of preformed norverapamil was only0.3%–0.4% of CLNOR
L .PBPK Modeling. The data for verapamil and formed and pre-
formed norverapamil were fitted simultaneously using ADAPT5
(Biomedical Simulations Resource). The strategy was to first considerall metabolism and excretion as first-order processes; nonlinearity inmetabolism or excretion was then included stepwise into the fittingroutine. Physiologic parameters such as volume of tissue (V) andperfusate blood flow rates (QL) were assigned (see Table 5). Temporalprofiles of fitted verapamil and formed and preformed norverapamil inperfusate, liver, and bile (Figs. 4 and 5) for the best model includednonlinearity in N-demethylation, formation of other verapamilmetabolites, and biliary excretion. Evidence of improvement of fit issummarized in Table 4. According to the F test, incorporation ofnonlinearity in CLVER → NOR
int;met1 , CLVER → othersint;met2 , CLVER
int;sec, and CLNORint;sec to
the base model significantly improved the goodness-of-fit, evidencedby the lowest SSWR and AIC score (Table 4). With the nonlinearpathways, the predicted concentrations matched the measured con-centrations well and fell on the line of identity; the predicted versusobserved and weighted residuals revealed a random distributionaround 0 (Supplemental Figs. 1 and 2).In the final model (Model H) that best fit the data, the CV% was
between 5% and 48% of all parameter estimates (Table 5). The unboundfraction in perfusate blood estimated for norverapamil was 0.44,a value similar to that for verapamil, whereas liver tissue binding toverapamil and norverapamil were high. Reasonable transfer clearances(CLVER
in ¼ CLVERef and CLNOR
in ¼ CLNORef ) as well as the Vmax and Km
Fig. 2. Nonlinear plasma protein binding of verapamil(racemic) to BSA (2%) (A), and distribution ofverapamil into RBCs (B). (A) The unbound fraction ofverapamil in plasma (fP) was plotted against log(CP) toreveal concentration-dependent binding within the rangeof 0.4–140 mM. The sold line represents fP valuespredicted according to one class of binding site (fittedconstants, n = 0.3016 0.160 and KA = 0.00996 0.0057mM21) (Appendix A). (B) Observed (circle) and fitted(line) are CRBC and CP over time (n = 6) in the RBCdistribution study (see Materials and Methods fordetails). After the model was fitted to the data of verapamilin RBC and plasma, the transfer rate constants, k9rp andk9pr, were found to be 19.5 6 8.7 and 13.2 6 4.4 min21,respectively (Appendix A). The numbers next to thefitted curves are the total initial CP (1–441 mM in2% BSA) used for admixture with 40% RBC containingblood perfusate (in 2% BSA).
Nonlinear Metabolite Kinetics of Verapamil 635
at ASPE
T Journals on July 13, 2018
dmd.aspetjournals.org
Dow
nloaded from

parameters with low CV% were obtained. The Km values for thesecretion of verapamil and norverapamil were around 5 mM, whichsuggests that the P-gp pump could be readily saturated. ThehVER → NORmi or fraction of hepatic clearance of verapamil that formsnorverapamil via N-demethylation according to the fitted constants,hVER → NORmi ¼ ðVVER → NOR
max;met1 =KVER → NORm;met1 Þ=½ð VVER → NOR
max;met1 =KVER → NORm;met1 Þþ
ðVVER → othersmax;met2 =KVER → others
m;met2 Þ þ ðVVERmax;sec=K
VERm;sec�, was 0.311 6 0.189, and
68.3% of CLVERL was conducive to formation of other verapamil me-
tabolites; biliary secretion of verapamil was only 0.64% CLVERL . Based
on the ratio of the fitted Vmax and Km, the recalculated hVER → NORmi
(31.1%) was around 10% higher than that based on the lowest doseunder the linear condition (or 23.3%), and was significantly higher thanthat of 12% obtained by Mehvar et al. (1994).PBPK Modeling on Stereoselective Disposition and Auto-
inhibition of Verapamil Metabolism. One limitation of the presentstudy, however, was that stereoselectivity in verapamil and norverapamildisposition has not been fully addressed. In terms of stereoselectivebinding, it has been reported that R-VER has a higher (;1.6�) unboundfraction in plasma (fP) over S-VER at both low and high concentrations(Mehvar et al., 1994; Mehvar and Reynolds, 1995; Robinson andMehvar, 1996), but the CB/CP ratio for R-VER is ;1.5 times that ofS-VER (Hanada et al., 2008). Since the unbound fraction in blood fB =fP � CP/CB, we conclude that the unbound fractions in blood for S-VERand R-VER are similar, as are the blood profiles of (R)- and (S)-verapamil.Therefore, it is reasonable to assume that the fB value for the racemicmixture was the same as those for S-VER and R-VER. We furtherfound that small changes in fB would not materially affect the clearancesof S-VER, R-VER, or racemic VER (simulations not shown). This isreasonable since the compounds are all highly cleared.We had assumed that stereoselectivity in metabolism was not an
important factor under our dosing input concentrations, which werehigh in relation to the Km values (initial concentrations of 50 and100 mM), and stereoselectivity effects in verapamil metabolism couldbe negligible (Mehvar and Reynolds, 1995; Hanada et al., 2008). Asshown in the simulations based on the literature data on the Km valuesfor the R- and S-VER pathways for the other metabolite formation andN-demethylation (see Supplemental Table 3), the S-VER/R-VER Km
ratios were 1.9 and 1.34, respectively. The Km estimates obtained forracemic or (R,S)-VER for the other metabolites or N-demethylationpathways (Table 5) were 10.4 and 14.1 mM, respectively. Theseaveraged Km values for (R,S)-verapamil corresponded to (1.9x + 1x)Km,R-VER/2 and (1.3x + 1x)Km,R-VER/2, respectively, for the other
metabolites and N-demethylation pathways. From our calculations, theKm values for R- and S-VER for N-demethylation are 9.04 and11.8 mM, whereas those for the other metabolites pathways are 9.72and 18.5 mM, respectively (Supplemental Table 3). Simulations withthese Km constants obtained for R-VER and S-VER showed that thedifference in stereoisomeric kinetics was minor (Fig. 6), and existedonly for the early-in-time liver profiles at the lowest concentration.Also, the summed simulated R- and S-VER values taken to representracemic (R,S) profiles were similar to those observed (see Fig. 7).In addition, inhibitory effects of verapamil on its own P-gp-
mediated biliary secretion and metabolite formation, events observedin humans, should be negligible during the short 90 minute perfusion,inasmuch as lack of precedence in rat liver for auto-inhibition (Obach,1999; Shibata et al., 2002; Axelsson et al., 2003; Guo et al., 2007; Yinet al., 2011). Moreover, incorporation of time-dependent inhibitioncomponents (e2kIt, where kI is the in vivo inhibition rate constant,which equals the in vitro inactivation rate constant, kobs) (Wang et al.,2004) to the various verapamil eliminatory processes (or CLint) failedto significantly improve the goodness-of-fit of the models (seeSupplemental Table 4). The fitted kI values for metabolic formation(CLVER → NOR
int;met1 and CLVER → othersint;met2 ) and biliary secretions (CLVER
int;sec)were low, ranging from 0.002 to 0.14 min21 (data not shown). Fittedresults, with and without auto-inhibition, support the notion that time-dependent inactivation of various verapamil elimination pathways wouldnot perturb the pharmacokinetics of verapamil in the perfused rat liver.
Discussion
Verapamil has been considered to be a good candidate to studytransporter-enzyme interplay, due to the fact that it is a substrate of both
Fig. 3. The amounts (percentage of dose) of verapamil (A) and preformed norverapamil (B) adsorbed onto Tygon tubing of the perfusion apparatus. The solid symbolsdenote the measured amounts (percentage of dose), and the solid lines denote the fitted amounts over time (see Appendix C for the mass balance equations). Different coloredsymbols and lines denote the different initial concentrations of verapamil (racemic) and norverapamil (racemic) used for perfusion.
TABLE 1
Binding (kR→t ) and debinding (kt→R) constants for verapamil and norverapmil to thetubing of the perfusion apparatus, obtained by fitting the perfusate data in the
absence of a rat liver in sham-liver perfusion studies (Fig. 1)
Drug Debinding Binding
mM min21 min21
Verapamil (n = 3) kVERt → R kVERR → t1 0.0206 6 0.0161 0.0083 6 0.0012
50 0.0400 6 0.0382 0.0052 6 0.0041100 0.0197 6 0.0171 0.0032 6 0.0023Norverapamil (n = 3) kNORt → R kNORR → t
1.5 0.0156 6 0.0013 0.0044 6 0.00055 0.0047 6 0.0063 0.0024 6 0.0007
636 Yang et al.
at ASPE
T Journals on July 13, 2018
dmd.aspetjournals.org
Dow
nloaded from
CYP450 and P-gp. Under linear kinetic conditions, inhibition or inductionof metabolism versus excretion has been studied, since induction of thecompeting pathway reduces the intracellular substrate concentration for thegiven pathway (Pang et al., 2009). Data in the perfused rat liver preparationnot only revealed nonlinear metabolism and secretion of verapamil (1, 50,and 100 mM) but also a poor extent of biliary excretion (Table 5),suggesting that verapamil is a poor candidate for the examination oftransporter-enzyme interplay between CYP450 and P-gp in the rat liver.Additionally, the fact that fitted Km values for P-gp mediated excretion(4.75 and 5.36 mM) are lower than those for the metabolic pathways,including N-demethylation or formation of other metabolites (10.4 and14.1 mM), suggests that transporter-enzyme interplay kinetics would beextremely complex under these nonlinear conditions. Induction of livermetabolism would not greatly perturb the extent of secretion since biliaryexcretion of verapamil was low, despite that verapamil would serve asa better candidate for the study of transporter-enzyme interplay in theintestine since there is more verapamil secreted (Johnson et al.,2001). However, complexity in data interpretation still applies whennonlinearity metabolism and P-gp-mediated secretion exists, andwhen the secreted substrate can undergo reabsorption (Tam et al.,2003). Under nonlinear conditions, induction of intestinal P-gp thatincreases secretion could result in an increased extent of metabolismupon reabsorption of the secreted drug to furnish a more efficient
metabolic system, as suggested by Pang and colleagues (Tam et al.,2003; Pang et al., 2009; Fan et al., 2010).By contrast, verapamil is ideal for the consideration of metabolite
(norverapamil) kinetics since there are competing metabolic pathways.Thus, we have used this precursor-product pair to develop strategies for theestimation of formation clearances of metabolites under linear andnonlinear conditions, for a drug that is bound to both RBC and plasmaproteins. After consideration of the substantial loss due to tubingadsorption, we found that the extraction ratios of verapamil and preformednorverapamil were both high in the rat liver preparation, and the measuredverapamil (;7%–8% dose) and formed norverapamil (;3%–5% dose)recovered in the liver tissue at the end of perfusion were similar to those inprevious perfusion studies involving a high dose of verapamil administered(Mehvar et al., 1994). However, our reported average unbound fraction ofverapamil in the blood perfusate ( f VERB ) was higher (0.45 for racemic-VERversus 0.12 for S-VER and 0.22 for R-VER) (Mehvar and Reynolds,1996), and the total intrinsic hepatic clearance of verapamil (CLVER
int;tot) waslower (30 ml/min versus about 1475 ml/min for S- and R-VER) comparedwith those reported by Mehvar et al. (1994); the product, f VERB CLVER
int;tot,was also smaller (16 ml/min versus 234 to 491 ml/min) (Pang and Yang,2015). The likely explanation is due to the consideration of verapamilbinding to RBCs and tubing as well as nonlinear metabolism in our study.That verapamil elimination is dose dependent, with AUCVER
‘ increasing
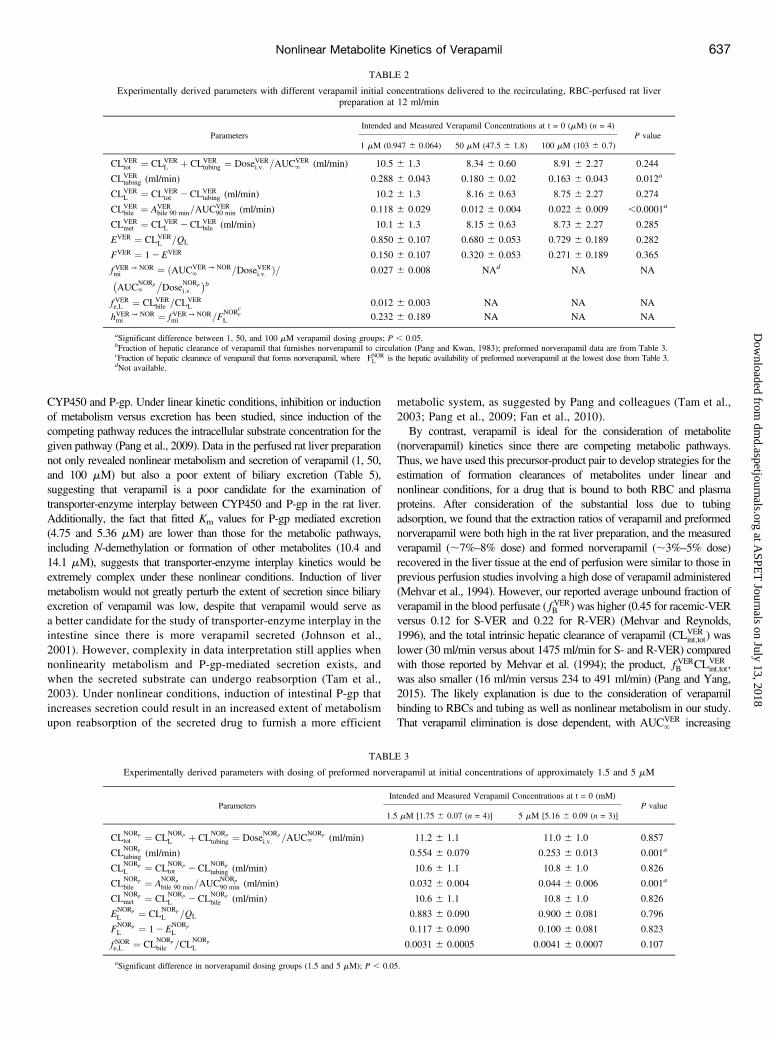
TABLE 2
Experimentally derived parameters with different verapamil initial concentrations delivered to the recirculating, RBC-perfused rat liverpreparation at 12 ml/min
ParametersIntended and Measured Verapamil Concentrations at t = 0 (mM) (n = 4)
P value1 mM (0.947 6 0.064) 50 mM (47.5 6 1.8) 100 mM (103 6 0.7)
CLVERtot ¼ CLVER
L þ CLVERtubing ¼ DoseVERi:v: =AUCVER
‘ (ml/min) 10.5 6 1.3 8.34 6 0.60 8.91 6 2.27 0.244
CLVERtubing (ml/min) 0.288 6 0.043 0.180 6 0.02 0.163 6 0.043 0.012a
CLVERL ¼ CLVER
tot 2CLVERtubing (ml/min) 10.2 6 1.3 8.16 6 0.63 8.75 6 2.27 0.274
CLVERbile ¼ AVER
bile 90 min=AUCVER90 min (ml/min) 0.118 6 0.029 0.012 6 0.004 0.022 6 0.009 ,0.0001a
CLVERmet ¼ CLVER
L 2CLVERbile (ml/min) 10.1 6 1.3 8.15 6 0.63 8.73 6 2.27 0.285
EVER ¼ CLVERL =QL 0.850 6 0.107 0.680 6 0.053 0.729 6 0.189 0.282
FVER ¼ 12EVER 0.150 6 0.107 0.320 6 0.053 0.271 6 0.189 0.365
f VER → NORmi ¼ ðAUCVER → NOR
‘ =DoseVERi:v: Þ=�AUC
NORp‘
�Dose
NORp
i:v:
�b
0.027 6 0.008 NAd NA NA
f VERe;L ¼ CLVERbile =CLVER
L 0.012 6 0.003 NA NA NA
hVER → NORmi ¼ f VER → NOR
mi =FNORp
L
c
0.232 6 0.189 NA NA NA
aSignificant difference between 1, 50, and 100 mM verapamil dosing groups; P , 0.05.bFraction of hepatic clearance of verapamil that furnishes norverapamil to circulation (Pang and Kwan, 1983); preformed norverapamil data are from Table 3.cFraction of hepatic clearance of verapamil that forms norverapamil, where FNORL is the hepatic availability of preformed norverapamil at the lowest dose from Table 3.dNot available.
TABLE 3
Experimentally derived parameters with dosing of preformed norverapamil at initial concentrations of approximately 1.5 and 5 mM
ParametersIntended and Measured Verapamil Concentrations at t = 0 (mM)
P value1.5 mM [1.75 6 0.07 (n = 4)] 5 mM [5.16 6 0.09 (n = 3)]
CLNORptot ¼ CLNORp
L þ CLNORp
tubing ¼ DoseNORp
i:v: =AUCNORp‘ (ml/min) 11.2 6 1.1 11.0 6 1.0 0.857
CLNORp
tubing (ml/min) 0.554 6 0.079 0.253 6 0.013 0.001a
CLNORp
L ¼ CLNORptot 2CLNORp
tubing (ml/min) 10.6 6 1.1 10.8 6 1.0 0.826
CLNORp
bile ¼ ANORp
bile 90 min=AUCNORp
90 min (ml/min) 0.032 6 0.004 0.044 6 0.006 0.001a
CLNORpmet ¼ CLNORp
L 2CLNORp
bile (ml/min) 10.6 6 1.1 10.8 6 1.0 0.826
ENORp
L ¼ CLNORp
L =QL 0.883 6 0.090 0.900 6 0.081 0.796
FNORp
L ¼ 12ENORp
L 0.117 6 0.090 0.100 6 0.081 0.823
f NORe;L ¼ CLNORp
bile =CLNORp
L 0.0031 6 0.0005 0.0041 6 0.0007 0.107
aSignificant difference in norverapamil dosing groups (1.5 and 5 mM); P , 0.05.
Nonlinear Metabolite Kinetics of Verapamil 637
at ASPE
T Journals on July 13, 2018
dmd.aspetjournals.org
Dow
nloaded from

and CLVERL decreasing at higher dosing levels, confirmed nonlinearity in
verapamil disposition, an observation that is in agreement with that inferredfor the clinical pharmacokinetics of verapamil (Freedman et al., 1981;Shand et al., 1981; Anderson et al., 1982; Tartaglione et al., 1983; Toffoliet al., 1997; Maeda et al., 2011).Our strategy to study the kinetics of verapamil in the determination of
whether formation of norverapamil is the major clearance pathway restson capacity-limiting PBPK models, since these models are excellentfor including sequential metabolism and drug- or metabolite-specific
transporters and enzymes, distinguishing between kinetics of formedand preformed metabolites (Pang and Durk, 2010). In this study, weconsidered the nonlinear binding to plasma proteins and distributioninto red cells and accounted for binding to tubing to fit the liverperfusion data of verapamil (1, 50, and 100 mM) and preformed (1.5and 5 mM) and formed norverapamil simultaneously. For this reason,metabolite modeling of formed norverapamil was achieved with greaterassurance. Additionally, the amount of verapamil and norverapamilbinding to Tygon tubing was not negligible (;10%–25% of total dose),
Fig. 4. Temporal profiles of fitted and observed verapamil and formed norverapamil in the perfusate (red), liver (green), and the cumulative secreted amounts in bile (blue) atinitial concentrations of 1, 50, and 100 mM of racemic verapamil (n = 4) in recirculating rat liver preparations. The lines denote predictions according to the final fit with thePBPK model (Model H) describing various nonlinear pathways (CLVER → NOR
int;met1 , CLVER → othersint;met2 , CLVER
int;sec, and CLNORint;sec) (see Appendix C for the mass balance equations). The
solid and open symbols are the observed concentrations or amounts of verapamil and formed norverapamil, respectively, in liver and bile.
638 Yang et al.
at ASPE
T Journals on July 13, 2018
dmd.aspetjournals.org
Dow
nloaded from

suggesting the necessity to account for drug loss due to tubingadsorption to avoid overestimation of hepatic clearance (calculatedfrom CLVER
L ¼ CLVERtot 2CLVER
tubing). We further emphasized that plasmaprotein binding estimated in a test tube must be extended to includethe total plasma space (plasma + Disse space) within the livervasculature to consider the equilibrium of the drug between plasma andRBCs (see Appendix B). Different PBPK models with increasing degreesof nonlinearity were then built to account for linear versus nonlinearmetabolism and biliary excretion by defining intrinsic clearance CLint interms of Vmax and Km, and the best-fitted model was determined accordingto the AIC score, SSWR (F test), and diagnostic plots (prediction versusobservation and weighted residuals versus time plots).Our final PBPK model that showed the most significant im-
provement, with minimum AIC and SSWR, incorporated multiplenonlinear factors describing metabolic and biliary secretion pathwaysof verapamil and norverapamil. PBPK modeling showed that stereo-selective binding, metabolism, and auto-inhibition were unimportantduring our dosing conditions (see Figs. 6 and 7; Supplemental Tables3 and 4). Although PBPK modeling of verapamil and norverapamilthat included nonlinear metabolic clearance and biliary excretion hasbeen previously published (Neuhoff et al., 2013; Wang et al., 2013), toour knowledge, we are the first one to describe sequential metabolismand nonlinear kinetics of verapamil by fitting verapamil and its
preformed and formed metabolite levels in blood perfusate and bilesimultaneously. The fitted results have shown that the rate ofverapamil and formed and preformed norverapamil diffuse into thehepatocytes (CLVER
in and CLNORin ) at rates that are much greater than the
perfusate blood flow (QL), implying that these compounds didequilibrate rapidly between perfusate and liver. This finding isreasonable because verapamil and norverapamil are both lipophiliccompounds. Since the efflux process outcompeted the biliary secretion(CLVER
ef ≫CLVERint;sec; CLNOR
ef ≫CLNORint;sec), verapamil and norverapamil
were expected to accumulate in the reservoir, with limited amountsappearing in bile, events that are consistent with our observations. Ourfitted unbound fraction of verapamil in liver tissue ( f VERL ) matchedliterature values in rats (0.02) (Yamano et al., 2000), but was lowerthan that in healthy subjects (0.09) (Giacomini et al., 1984).The Km values determined in the final model (H) (Table 4) are quite
low relative to perfusate concentration, ranging from 5 to 14 mM,suggesting at the high concentrations (50 and 100 mM), most of theenzymes and P-gp are saturated, and nonlinear kinetics will likelyoccur. The fitted Km values for metabolizing verapamil to norve-rapamil and other metabolites (KVER → NOR
m;met1 and KVER → othersm;met2 , re-
spectively) are in agreement with the literature values (Tracy et al.,1999; Hanada et al., 2008) after adjusting for f VERL or the unboundfraction in liver. The reported Km values for P-gp-mediated biliary
Fig. 5. Temporal profiles of observed (open symbols) and fitted preformed norverapamil in the reservoir perfusate (red), liver (green), and cumulative excreted amounts inbile (blue) at initial norverapamil (racemic) concentrations of 1.5 (A) (n = 4) and 5 (B) (n = 3) mM in recirculating rat liver preparations. The solid lines denote the fittedvalues according to the final PBPK model (Model H) with nonlinear CLNOR
sec (see Appendix C for the mass balance equations).
TABLE 4
F tests comparing various PBPK models (A–H) with different combinations of linear and nonlinear elimination pathways
Model Description df a SSWRb F Scorec Critical F Valued Significancee AIC Valuef
A No nonlinear pathway 189 653 NAg NA NA 3297
B Nonlinear CLVER → NORint;met1 only 188 837 241.3 Fð0:05;1;188Þ ¼ 3:83 No 3370
C Nonlinear CLVER → othersint;met2 only 188 808 236.0 Fð0:05;1;188Þ ¼ 3:83 No 3322
D Nonlinear CLVERint;sec only 188 695 211.4 Fð0:05;1;188Þ ¼ 3:83 No 3293
E Nonlinear CLVERint;sec and CLNOR
int;sec 187 287 119 Fð0:05;2;187Þ ¼ 3:00 Yes 3244
F Nonlinear CLVER → NORint;met1 , CLVER
int;sec, and CLNORint;sec 186 250 100 Fð0:05;3;186Þ ¼ 2:60 Yes 3235
G Nonlinear CLVER → othersint;met1 , CLVER
int;sec, and CLNORint;sec 186 234 111 Fð0:05;3;186Þ ¼ 2:60 Yes 3225
H Nonlinear CLVER → NORint;met1 , CLVER → others
int;met2 , CLVERint;sec, and CLNOR
int;sec 185 71.4 377 Fð0:05;4;185Þ ¼ 2:37 Yes 3214
aThe df is the number of data points (n = 198) used in the model minus the number of parameters being fitted.bThe SSWR was calculated using +n
i¼0½ðobserved valuei 2 fitted valueiÞ=observed valuei �2. The total SSWR for verapamil, preformed, and formed norverapamildata in perfusate, bile, and liver compartments was calculated.
cThe F score was calculated using ½ðSSWRj 2SSWRiÞ=SSWRi� � ½df i=ðdf j 2 df iÞ�, where dfj . dfi.dThe critical F value was obtained from the F table with a numerator of dfj–dfi and denominator of dfi.eThe significance level was a = 0.05; Models E–H showed significant improvement in the goodness-of-fit compared with Model A.f The AIC, a measurement of the goodness-of-fit, is calculated as 2k2 2lnðlikelihoodÞ, where k is the number of parameters fitted in the model, and likelihood is the
maximized value of the likelihood function.gNot available
Nonlinear Metabolite Kinetics of Verapamil 639
at ASPE
T Journals on July 13, 2018
dmd.aspetjournals.org
Dow
nloaded from

secretion of verapamil (KVERm;sec) are similar to that found in a previous
study (Km = 4.1 mM), where the biliary excretion of verapamilmediated by P-gp (;8 mM) was measured using human MDR1reconstituted in liposomes (Kimura et al., 2007).Proper estimation of norverapamil formation was adequately ad-
dressed in the study. With the assumption of linear pharmacokinetics,the fraction (hVER → NOR
mi ) of hepatic clearance (CLVERL ) that forms
norverapamil can be calculated using the formula hVER → NORmi ¼
f VER → NORmi =FNOR
L (Table 2), where f VER → NORmi represents the fraction
of CLVERL that furnishes the formed norverapamil to the circulation,
and FNORL denotes the hepatic availability of norverapamil, since
hVER → NORmi needs to account for the sequential metabolism of locallyformed norverapamil, which never reaches the systemic circulation(Pang and Gillette, 1979; Pang and Kwan, 1983). The hVER → NOR
mivalue (0.19–0.23) from Mehvar et al. (1994) was similar to the valuebased on the lowest dose (0.23) estimated by AUC comparisonsassuming linear kinetics. This value, however, remained an underes-timation due to prevailing nonlinearity in metabolism compared withthe value obtained upon comparison of the formation of intrinsicclearance normalized to the total intrinsic clearance (0.31).In conclusion, our comprehensive analysis with PBPK modeling re-
vealed that the metabolic pathways converting verapamil to norverapamiland to other metabolites as well as the biliary excretion of verapamil andnorverapamil are concentration dependent in verapamil and norverapamilliver perfusion data using PBPK modeling. Stereoselective binding andmetabolism (Figs. 6 and 7) and auto-inhibition (Supplemental Table 4)were unimportant. With the careful consideration of nonlinearity stepwisein PBPK modeling, we are able to unravel which elimination pathways
are nonlinear and demonstrate a strategy to assess the fractional path-way of hepatic clearance responsible for either excretion of drug intobile or in formation of metabolites, after consideration of sequentialmetabolism of the metabolite and nonlinear protein binding of drug.
Appendix A
In Vitro Distribution of Verapamil into RBC and Plasma ProteinBinding
Scheme 1 shows the exchange of verapamil between RBC andplasma and for binding of verapamil to BSA. Here, fRBC is theunbound fraction of drug in RBC and fRBCCRBC is the unbound drugconcentration in RBC; correspondingly, fP is the unbound fraction ofdrug in plasma and fPCP is the unbound drug concentration in plasma.The rates of change of verapamil in RBC and plasma in in vitro redcell distribution studies, where verapamil in plasma (2% BSA) wasincubated with blank blood perfusate (40% RBC and 2% BSA) toresult in a perfusate composition of 20% RBC and 2% BSA, appear inthe equations shown below with rate constants, k9rp (¼ fRBC × krp) andk9pr (¼ fP × kpr), based on total concentrations, since fRBC is unknown
dCRBC
dt¼ k9prCp
ð12HctÞHct
2 k9rpCRBC ðA1Þ
dCP
dt¼ k9rpCRBC
Hctð12HctÞ2 k9prCp ðA2Þ
TABLE 5
Fitted estimates obtained with fitting the final model (Model H) to liver perfusion data (Table 4), with incorporation of nonlinear protein binding and nonlinear metabolismand biliary secretion of verapamil and norverapamil (see Appendix C for the mass balance equations)
Assigned Parameter, Mean 6 S.D. (CV%)
Verapamil (VER, racemic) (mM) (n = 4) 1 mM 50 mM 100 mMVolume of sinusoid, VLB (ml)a 2.79 6 0.23 2.70 6 0.16 2.26 6 0.12Volume of liver tissue, VL (ml)a 8.16 6 0.68 10.6 6 0.6 7.56 6 0.41
Norverapamil (NOR, racemic) (mM) 1.5 mM 5 mMVolume of sinusoid, VLB (ml)a 2.93 6 0.08 (2.73) 2.35 6 0.15 (6.38)Volume of liver tissue, VL (ml)a 8.57 6 0.22 (2.57) 9.23 6 0.59 (6.39)
Fitted Parameterf VERL : unbound fraction of VER in liver tissue 0.0878 6 0.0050 (5.69)
f NORB : unbound fraction of NOR in liver blood perfusate 0.44 6 0.05 (11.3)
f NORL : unbound fraction of NOR in liver tissue 0.00874 6 0.00046 (5.26)
CLVERin ¼ CLVER
ef : influx and efflux clearances of VER (ml/min) 526 6 96 (18.3)
CLNORin and CLNOR
ef : influx and efflux clearances for NOR (ml/min) 482 6 181 (37.6)
CLVER → NORint;met1 ¼ VVER → NOR
max;met1 =KVER → NORm;met1 : intrinsic formation clearance
of NOR from VER under linear conditions (ml/min)
VVER → NORmax;met1 ¼ 96:66 33:4 (34.6) nmol/min
KVER → NORm;met1 ¼ 10:46 4:1 (38.9) mM
CLVER → otherint;met2 ¼ VVER → others
max;met2 =KVER → othersm;met2 : metabolic intrinsic clearance of
VER to form other metabolites under linear conditions (ml/min)VVER → othersmax;met2 ¼ 2886 51 (17.7) nmol/min
KVER → othersm;met2 ¼ 14:16 4:9 (34.7) mM
CLNORint;met: metabolic intrinsic clearance of NOR under linearconditions (ml/min)
36.5 6 18.4 (50.4)
CLVERint;sec ¼ VVER
max;sec=KVERm;sec: biliary intrinsic clearance of VER under
linear conditions (ml/min)VVERmax;sec ¼ 0:9116 0:505 (55.4) nmol/min
KVERm;sec ¼ 4:756 2:29 (48.2) mM
CLNORint;sec ¼ VNOR
max;sec=KNORm;sec: biliary intrinsic clearance of NOR under
inear conditions (ml/min)VNORmax;sec ¼ 0:7766 0:220 (28.4) nmol/min
KNORm;sec ¼ 5:366 1:66 (31.0) mM
t: time delay for biliary secretion (minute) 4.49 6 1.41 (31.4)hVER → NORmi ¼ ðVVER → NOR
max;met1 =KVER → NORm;met1 Þ=½ðVVER → NOR
max;met1 =KVER → NORm;met1 Þþ
ðVVER → others=KVER → othersm;met2 Þ þ ðVVER
max;sec=KVERm;sec�
b0.311 6 0.189
hVER → othersmi ¼ ðVVER → others
max;met2 =KVER → othersm Þ=½ðVVER → NOR
max;met1 =KVER → NORm;met1 Þþ
ðVVER → othersmax;met2 =KVER → others
m;met2 Þ þ ðVVERmax;sec=K
VERm;sec�
0.683 6 0.341
hVERe ¼ ðVVERmax;sec=K
VERm;secÞ=½ðVVER → NOR
max;met1 =KVER → NORm;met1 Þþ
ðVVER → othersmax;met2 =KVER → others
m;met2 Þ þ ðVVERmax;sec=K
VERm;sec� 0.0064 6 0.0051
aThe assigned parameters in the PBPK model for fitting of verapamil, preformed; and formed norverapamil simultaneously; from multiple indicator dilution studies in rat (Pang et al., 1988).bThe ratio of intrinsic clearances is the same as the ratio of the hepatic clearance.
640 Yang et al.
at ASPE
T Journals on July 13, 2018
dmd.aspetjournals.org
Dow
nloaded from

The binding of verapamil to one class of BSA binding site is givenby
ð12 fPÞCP ¼ CP;bound ¼ nKACP;u
1þ KACP;u½Pt� ðA3Þ
where KA is the binding association constant, which equals k1/k2or the ratio of the on- and off-rate constants for protein binding;n is the number of binding sites; [Pt] is the total BSA con-centration; fP is the unbound fraction in plasma; and Cp,u is theunbound concentration of verapamil in plasma. Equations (A1)–(A3) were used simultaneously to fit data obtained in the RBCdistribution and protein binding studies, and the fitted results areshown in Fig. 2.
Appendix B
Incorporation of Verapamil Distribution into RBC and PlasmaProtein Binding for Modeling Liver Perfusion Data
In perfused liver experiments, drug in sinusoidal RBC equilibrateswith drug in the total sucrose space or Vplasma,tot (sinusoidal plasmaand sucrose Disse space). The mass balance equation at equilibrium issummarized as follows:
VB Hct k9rpCRBC ¼ Vplasma;totk9prCP ðB1Þ
Upon substitution, given that Vplasma,tot is (1 + gSuc)VP, where gSucis the interstitial or sucrose Disse space/plasma space,Vp, and
Fig. 6. Simulated concentrations of verapamil enantiomers (S- and R-verapamil) and their corresponding formed metabolites, S- and R-norverapamil, in reservoir perfusate, andamounts in liver and bile at initial concentrations of 0.5 mM (A), 25 mM (B), and 50 mM (C) (one-half of the concentrations of racemic verapamil used experimentally). Stereoselectiveelimination, with the Km values shown in Supplemental Table 3, was considered for the simulations (with the equations shown in Appendix C). The black arrow in (A) shows thatconcentrations of R-VER in liver were slightly lower than those of S-VER at comparable perfusion time, due to the lower Km value for faster metabolism of R-VER at the lowest dose.
Nonlinear Metabolite Kinetics of Verapamil 641
at ASPE
T Journals on July 13, 2018
dmd.aspetjournals.org
Dow
nloaded from

knowing that Vp = VB(1-Hct), we obtain (Pang et al., 1988; Liu et al.,2005)
CRBC
CP¼¼ k9prð1þ gSucÞð12HctÞ
Hct k9rpðB2Þ
From the mass balance, the sinusoidal blood (CB), plasma(CP), and red blood cell (CRBC) concentrations are expressed asfollows:
CBVB ¼ ð12HctÞCpVB þ Hct CRBCVB ðB3Þ
Upon substitution of eq. (B2) into eq. (B3), one obtains
CB
Cp¼ R ¼ Hct
CRBC
Cp
!þ ð12HctÞ
¼ k9prð1þ gSucÞð12HctÞk9rp
þ ð12HctÞ ðB4Þ
Nonlinearity in protein binding will result in a changing CB/CP
ratio, and this could be accommodated by eq. (B4), where gSuc equals0.52 (Pang et al., 1988).
Fig. 7. Simulated, concentrations or amounts of racemic verapamil (S-VER + R-VER) and formed norverapamil (S-NOR + R-NOR) in reservoir perfusate and liver (A, C, and E) andexcreted amounts in bile (B, D, and F) (data from Fig. 6, with consideration of stereoselective elimination; black solid or dotted lines) were presented against experimental (coloredsymbols) and fitted results on racemic verapamil and formed norverapamil from PBPK modeling (colored lines, also shown in Fig. 4), without consideration of stereoselectiveelimination. The observed, fitted (lack of consideration of stereoselective elimination) and simulated data (with consideration of stereoselective elimination) of summed enantiomericverapamil and norverapamil concentrations/amounts were virtually identical, showing that stereoselective elimination was unimportant under the conditions examined.
642 Yang et al.
at ASPE
T Journals on July 13, 2018
dmd.aspetjournals.org
Dow
nloaded from

The fitted k9rp and k9pr were used to calculate the ratio of drugconcentrations in RBCs and plasma (CRBC/Cp) [eq. (B2)] and CB from(CB/Cp) [eq. (B4)], the ratio of drug concentrations in perfusate bloodto plasma. However, for the sake of simplicity, binding of verapamil toliver tissue and norverapamil to liver and plasma proteins was as-sumed to be linear.
Appendix C
PBPK Modeling of Verapamil and Formed and PreformedNorverapamil, with Consideration of Tubing Adsorption in
Perfusion Experiments
In the following equations, superscripts VER, NOR, and NORp
denote the parent drug (verapamil) and its formed and preformedmetabolite (norverapamil), respectively. Here, A and C denote theamount and concentration, respectively; QL, V, and f represent theperfusate blood flow rate, volume, and the unbound fraction,respectively; subscripts t→R, R→t, in, and ef denote transfer fromthe tubing to the reservoir, from the reservoir to the tubing, influx fromliver blood (LB) into liver, and efflux from liver back to liver blood,respectively. Other pharmacokinetic parameters such as metabolicclearance and biliary secretion have been described previously in theMaterials and Methods section.Tubing adsorption was first considered in the model by in-
corporating dose-specific adsorption rate constants for VER andNORp. Then, the influx clearance (CLVER
in or CLNORin ) and efflux
clearance (CLVERef or CLNOR
ef ) were assumed to be the same becauseverapamil and norverapamil are lipophilic drugs (logP ¼ 3:79 and 3.3,respectively) and can diffuse freely across the membrane. Transitcompartments were used to account for the time delay (t) of verapamiland norverapamil biliary secretion, and two transit compartments(Transit 1 and Transit 2, denoted with amounts, Atr1 and Atr2,respectively) best described the bile data (data not shown).Additionally, CLNOR
in , CLNORef , CLNOR
int;met, and CLNORint;sec , and kNORt→R and
kNORR→ t were assigned as the same constants for preformed and formednorverapamil. Data of three input concentrations of verapamil, twoinput concentrations of preformed norverapamil, and the correspond-ing formed norverapamil from verapamil in perfusate, liver, and bilewere fitted simultaneously using the PBPK model (Fig. 1).For rates of change of verapamil in perfusate (B) adsorbed onto
Tygon tubing (t) during verapamil perfusion without liver
dAVERB
dt¼ kVERt→RA
VERtubing2 kVERR→ tA
VERB ðC1Þ
dAVERtubing
dt¼ 2kVERt→RA
VERtubingþ kVERR→ tA
VERB ðC2Þ
For rates of change of norverapamil (both preformed and formed) inperfusate (B) and adsorbed onto Tygon tubing (t) during norverapamilperfusion without liver
dANORB
dt¼ kNORt→RA
NORtubing 2 kNORR→ tA
NORB ðC3Þ
dANORtubing
dt¼ 2kNORt→RA
NORtubing þ kNORR→ tA
NORB ðC4Þ
Fitted values of kVERt→R, kVERR→ t, k
NORt→R, and k
NORR→ t are summarized in Table
1, and these values were fixed for later modeling with verapamil andpreformed and formed norverapamil data in perfused liver preparations.For rates of change of verapamil in reservoir perfusate (B), tubing,
liver blood (LB, whole liver blood; LRBC, liver RBCs; LP, liver plasma),and liver (L) and bile compartments
dAVERB
dt¼ kVERt→RA
VERtubing 2 kVERR→ tA
VERB þ QL
�CVERLB 2CVER
B
�ðC5Þ
dAVERtubing
dt¼ 2kVERt→RA
VERtubing þ kVERR→ tA
VERB ðC6Þ
dAVERLB
dt¼2QLðCVER
LB 2CVERB Þ2 f VERB CVER
LB CLVERin
þ f VERL CVERL CLVER
ef ðC7Þ
dAVERL
dt¼ f VERB CVER
LB CLVERin 2 f VERL CVER
L
�CLVER
ef þ CLVER → NORint;met1
þ CLVER → othersint;met2 þ CLVER
int;sec
�ðC8Þ
For modeling of the perfusion data, the unbound concentration ofverapamil in blood perfusate (CB,u) was assumed to equal CP,u basedon one class of binding sites
CB;u ¼ CP;u¼
"2�1þ n½Pt�KA 2KACp
�þ ffiffiffiffiffiffiffiffiffiffiffiffiffiffiffiffiffiffiffiffiffiffiffiffiffiffiffiffiffiffiffiffiffiffiffiffiffiffiffiffiffiffiffiffiffiffiffiffiffiffiffiffiffiffiffiffiffiffiffiffiffiffiffiffiffiffiffiffiffihð1þ n½Pt�KA 2KACPÞ2 þ 4KACP
ir #
2KA
ðC9ÞWe then converted the CP to CB based on the CB/CP ratio (R) in eq.
(B4) according to the fitted k9rp and k9pr and gSuc values, and express the
unbound concentration in blood perfusate as
f VERB CVERB ¼
"2�1þ n½Pt�KA 2KA
�CLB=R
�þffiffiffiffiffiffiffiffiffiffiffiffiffiffiffiffiffiffiffiffiffiffiffiffiffiffiffiffiffiffiffiffiffiffiffiffiffiffiffiffiffiffiffiffiffiffiffiffiffiffiffiffiffiffiffiffiffiffiffiffiffiffiffiffiffiffiffiffiffiffiffiffiffiffiffiffiffiffiffiffiffiffiffiffiffiffiffiffiffiffiffiffiffiffihh1þ n½Pt�KA2KA
�CLB=R
�i2þ 4KA
�CLB=R
�ir #
2KA
ðC10Þ
The fitted constants obtained from the in vitro binding anddistribution studies for n = 0.301, the binding association constantKA (0.0091 mM21) and [Pt], and the total BSA concentration inplasma (1512 mM) were used (Appendix A).
Scheme 1.
Nonlinear Metabolite Kinetics of Verapamil 643
at ASPE
T Journals on July 13, 2018
dmd.aspetjournals.org
Dow
nloaded from

For biliary excretion
dAVERbile
dt¼ f VERL CVER
L CLVERint;sec ðC11Þ
For the time delay of verapamil biliary secretion
dAVERtr1
dt¼ AVER
bile 2AVERtr1
tðC12Þ
dAVERtr2
dt¼ AVER
tr2 2AVERtr1
tðC13Þ
For the rates of formed norverapamil in the reservoir, tubing, liverblood perfusate, liver, and blood
dANORB
dt¼ kNORt→RA
NORtubing 2 kNORR→ t A
NORB þ QLðCNOR
LB 2CNORB Þ ðC14Þ
dANORtubing
dt¼2 kNORt→RA
NORtubing þ kNORR→ tA
NORB ðC15Þ
dANORLB
dt¼2QLðCNOR
LB 2CNORL Þ2 f NORB CNOR
LB CLNORin
þ f NORL CNORL CLNOR
ef ðC16Þ
dANORL
dt¼ f NORB CNOR
LB CLNORin þ f VERL CVER
L CLVER → NORint;met1 2 f NORL CNOR
L
�ðCLNORef þ CLNOR
int;met þ CLNORint;secÞ
ðC17Þ
dANORbile
dt¼ f NORL CNOR
L CLNORint;sec ðC18Þ
For the time delay of norverapamil biliary secretion
dANORtr1
dt¼ ANOR
bile 2ANORtr1
tðC19Þ
dANORtr2
dt¼ ANOR
tr2 2ANORtr1
tðC20Þ
For saturable N-demethylation, CLVER → NORint;met1 is
CLVER → NORint;met1 ¼ VVER → NOR
max;met1
KVER → NORm;met1 þ f VERL CVER
L
ðC21Þ
For the saturable metabolic pathway, verapamil to other metabo-lites, CLVER → others
met2 is
CLVER → othersint;met2 ¼ VVER → others
max;met2
KVER → othersm;met2 þ f VERL CVER
L
ðC22Þ
For the saturable verapamil and norverapamil biliary excretion,CLVER
int;sec and CLNORint;sec are
CLVERint;sec ¼
VVERmax;sec
KVERm;sec þ f VERL CVER
L
ðC23Þ
CLNORint;sec ¼
VNORmax;sec
KNORm;sec þ f NORL CNOR
L
ðC24Þ
For the rates of change of preformed norverapamil in the perfusate(B), tubing, liver blood (LB), liver (L), and bile compartments
dANOR p
B
dt¼ kNORt→RA
NORp
tubing 2 kNORR→ tANORp
B þ QL
�CNORp
LB 2CNORp
B
�ðC25Þ
dANORp
tubing
dt¼2 kNORt→RA
NORp
tubing þ kNORR→ tANORp
B ðC26Þ
dANORp
LB
dt¼2QL
�CNORp
LB 2CNORp
B
�2 f NORB C
NORp
LB CLNORin
þ f NORL CNORp
L CLNORef ðC27Þ
dANORp
L
dt¼ f NORB C
NORp
LB CLNORin 2 f NORL C
NORp
L
�CLNOR
ef þ CLNORint;met
þ CLNORint;sec
�ðC28Þ
dANORp
bile
dt¼ f NORL C
NORp
L CLNORint;sec ðC29Þ
For the time delay of preformed norverapamil biliary secretion
dANORp
tr1
dt¼ A
NORp
bile 2ANORp
tr1
tðC30Þ
dANORp
tr2
dt¼ A
NORp
tr2 2ANORp
tr1
tðC31Þ
For the nonlinear biliary excretion of norverapamil, CLNORint;sec is
CLNORint;sec ¼
VNORmax;sec
KNORm;sec þ f NORL C
NORp
L
ðC32Þ
where CLNORint;met may also be expressed as
�VNORmax;met=�
KNORm;met þ f NOR
L CNORp
L
��; however, in the preliminary study, incorpo-
ration of this nonlinear term failed to significantly improve the goodness-of-fit when norverapamil data alone was fitted (data not shown), onlyfirst-order conditions were assumed, and nonlinearity was not consideredwhen all data were fitted simultaneously.
Acknowledgments
The authors thank Dr. Jubo Liu for conducting BSA and RBC bindingexperiment. The authors also thank Lundbeck, Denmark, for providing[3H]verapamil for the binding studies.
Authorship ContributionsParticipated in research design: Si, Sveigaard, Pang.Conducted experiments: Si, Yang, Tang, Chow, Sveigaard, Pang.Performed data analysis: Yang, Si, Tang, Pang.Wrote or contributed to the writing of the manuscript: Yang, Si, Pang.
References
Anderson P, Bondesson U, and Sylvén C (1982) Clinical pharmacokinetics of verapamil inpatients with atrial fibrillation. Eur J Clin Pharmacol 23:49–57.
Axelsson H, Granhall C, Floby E, Jaksch Y, Svedling M, and Sohlenius-Sternbeck AK (2003)Rates of metabolism of chlorzoxazone, dextromethorphan, 7-ethoxycoumarin, imipramine,quinidine, testosterone and verapamil by fresh and cryopreserved rat liver slices, and somecomparisons with microsomes. Toxicol In Vitro 17:481–488.
Baillie TA, Cayen MN, Fouda H, Gerson RJ, Green JD, Grossman SJ, Klunk LJ, LeBlanc B,Perkins DG, and Shipley LA (2002) Drug metabolites in safety testing. Toxicol Appl Phar-macol 182:188–196.
Bhatti MM and Foster RT (1997) Pharmacokinetics of the enantiomers of verapamil after in-travenous and oral administration of racemic verapamil in a rat model. Biopharm Drug Dispos18:387–396.
644 Yang et al.
at ASPE
T Journals on July 13, 2018
dmd.aspetjournals.org
Dow
nloaded from

Boxenbaum HG, Riegelman S, and Elashoff RM (1974) Statistical estimations in pharmacoki-netics. J Pharmacokinet Biopharm 2:123–148.
Busse D, Templin S, Mikus G, Schwab M, Hofmann U, Eichelbaum M, and Kivistö KT (2006)Cardiovascular effects of (R)- and (S)-verapamil and racemic verapamil in humans: a placebo-controlled study. Eur J Clin Pharmacol 62:613–619.
Choi JS and Burm JP (2008) Effect of pioglitazone on the pharmacokinetics of verapamil and itsmajor metabolite, norverapamil, in rats. Arch Pharm Res 31:1200–1204.
Eichelbaum M, Ende M, Remberg G, Schomerus M, and Dengler HJ (1979) The metabolism ofDL-[14C]verapamil in man. Drug Metab Dispos 7:145–148.
Fan J, Maeng HJ, and Pang KS (2010) Interplay of transporters and enzymes in the Caco-2 cellmonolayer: I. effect of altered apical secretion. Biopharm Drug Dispos 31:215–227.
Fleckenstein A (1977) Specific pharmacology of calcium in myocardium, cardiac pacemakers,and vascular smooth muscle. Annu Rev Pharmacol Toxicol 17:149–166.
Freedman SB, Richmond DR, Ashley JJ, and Kelly DT (1981) Verapamil kinetics in normalsubjects and patients with coronary artery spasm. Clin Pharmacol Ther 30:644–652.
Fromm MF, Dilger K, Busse D, Kroemer HK, Eichelbaum M, and Klotz U (1998) Gut wallmetabolism of verapamil in older people: effects of rifampicin-mediated enzyme induction. BrJ Clin Pharmacol 45:247–255.
Garcia MA, Aramayona JJ, Bregante MA, Fraile LJ, and Solans C (1997) Simultaneous de-termination of verapamil and norverapamil in biological samples by high-performance liquidchromatography using ultraviolet detection. J Chromatogr B Biomed Sci Appl 693:377–382.
Giacomini KM, Massoud N, Wong FM, and Giacomini JC (1984) Decreased binding of ve-rapamil to plasma proteins in patients with liver disease. J Cardiovasc Pharmacol 6:924–928.
Guo Y, Wang H, and Zhang C (2007) Establishment of rat precision-cut fibrotic liver slice techniqueand its application in verapamil metabolism. Clin Exp Pharmacol Physiol 34:406–413.
Hanada K, Akimoto S, Mitsui K, Mihara K, and Ogata H (1998) Enantioselective tissue distri-bution of the basic drugs disopyramide, flecainide and verapamil in rats: role of plasma proteinand tissue phosphatidylserine binding. Pharm Res 15:1250–1256.
Hanada K, Ikemi Y, Kukita K, Mihara K, and Ogata H (2008) Stereoselective first-pass me-tabolism of verapamil in the small intestine and liver in rats. Drug Metab Dispos 36:2037–2042.
Johnson BM, Charman WN, and Porter CJ (2001) The impact of P-glycoprotein efflux onenterocyte residence time and enterocyte-based metabolism of verapamil. J Pharm Pharmacol53:1611–1619.
Keefe DL, Yee YG, and Kates RE (1981) Verapamil protein binding in patients and in normalsubjects. Clin Pharmacol Ther 29:21–26.
Kimura Y, Kioka N, Kato H, Matsuo M, and Ueda K (2007) Modulation of drug-stimulatedATPase activity of human MDR1/P-glycoprotein by cholesterol. Biochem J 401:597–605.
Kroemer HK, Echizen H, Heidemann H, and Eichelbaum M (1992) Predictability of the in vivometabolism of verapamil from in vitro data: contribution of individual metabolic pathways andstereoselective aspects. J Pharmacol Exp Ther 260:1052–1057.
Lee YH, Perry BA, Lee HS, Kunta JR, Sutyak JP, and Sinko PJ (2001) Differentiation of gut andhepatic first-pass effect of drugs: 1. Studies of verapamil in ported dogs. Pharm Res 18:1721–1728.
Lemma GL, Wang Z, Hamman MA, Zaheer NA, Gorski JC, and Hall SD (2006) The effect ofshort- and long-term administration of verapamil on the disposition of cytochrome P450 3Aand P-glycoprotein substrates. Clin Pharmacol Ther 79:218–230.
Liu L, Mak E, Tirona RG, Tan E, Novikoff PM, Wang P, Wolkoff AW, and Pang KS (2005)Vascular binding, blood flow, transporter, and enzyme interactions on the processing of di-goxin in rat liver. J Pharmacol Exp Ther 315:433–448.
Maeda K, Takano J, Ikeda Y, Fujita T, Oyama Y, Nozawa K, Kumagai Y, and Sugiyama Y(2011) Nonlinear pharmacokinetics of oral quinidine and verapamil in healthy subjects:a clinical microdosing study. Clin Pharmacol Ther 90:263–270.
McTavish D and Sorkin EM (1989) Verapamil. An updated review of its pharmacodynamic andpharmacokinetic properties, and therapeutic use in hypertension. Drugs 38:19–76.
Mehvar R and Reynolds J (1995) Input rate-dependent stereoselective pharmacokinetics. Ex-perimental evidence in verapamil-infused isolated rat livers. Drug Metab Dispos 23:637–641.
Mehvar R and Reynolds J (1996) Reversal of stereoselectivity in the hepatic availability of verapamilin isolated perfused rat livers. Role of protein binding. Drug Metab Dispos 24:1088–1094.
Mehvar R, Reynolds JM, Robinson MA, and Longstreth JA (1994) Enantioselective kinetics ofverapamil and norverapamil in isolated perfused rat livers. Pharm Res 11:1815–1819.
Neuhoff S, Yeo KR, Barter Z, Jamei M, Turner DB, and Rostami-Hodjegan A (2013) Applicationof permeability-limited physiologically-based pharmacokinetic models: part II - prediction ofP-glycoprotein mediated drug-drug interactions with digoxin. J Pharm Sci 102:3161–3173.
Obach RS (1999) Prediction of human clearance of twenty-nine drugs from hepatic microsomalintrinsic clearance data: An examination of in vitro half-life approach and nonspecific bindingto microsomes. Drug Metab Dispos 27:1350–1359.
Pang KS (2009) Safety testing of metabolites: Expectations and outcomes. Chem Biol Interact179:45–59.
Pang KS, Barker F, Simard A, Schwab AJ, and Goresky CA (1995) Sulfation of acetaminophenby the perfused rat liver: the effect of red blood cell carriage. Hepatology 22:267–282.
Pang KS and Durk MR (2010) Physiologically-based pharmacokinetic modeling for absorption,transport, metabolism and excretion. J Pharmacokinet Pharmacodyn 37:591–615.
Pang KS and Gillette JR (1979) Sequential first-pass elimination of a metabolite derived froma precursor. J Pharmacokinet Biopharm 7:275–290.
Pang KS and Kwan KC (1983) A commentary: methods and assumptions in the kinetic estimationof metabolite formation. Drug Metab Dispos 11:79–84.
Pang KS, Lee WF, Cherry WF, Yuen V, Accaputo J, Fayz S, Schwab AJ, and Goresky CA (1988)Effects of perfusate flow rate on measured blood volume, disse space, intracellular water space,and drug extraction in the perfused rat liver preparation: characterization by the multipleindicator dilution technique. J Pharmacokinet Biopharm 16:595–632.
Pang KS, Maeng HJ, and Fan J (2009) Interplay of transporters and enzymes in drug andmetabolite processing. Mol Pharm 6:1734–1755.
Pang KS and Rowland M (1977) Hepatic clearance of drugs. I. Theoretical considerations ofa “well-stirred” model and a “parallel tube” model. Influence of hepatic blood flow, plasma andblood cell binding, and the hepatocellular enzymatic activity on hepatic drug clearance.J Pharmacokinet Biopharm 5:625–653.
Pang KS and Yang QJ (2015) Letter in Response to Rebuttal from Resa Mehvar: Fractionalclearance for Verapamil N-demethylation in the isolated rat liver preparation; published aheadof print May15 2015; DOI:10.1124/dmd.113.052225
Pauli-Magnus C, von Richter O, Burk O, Ziegler A, Mettang T, Eichelbaum M, and Fromm MF(2000) Characterization of the major metabolites of verapamil as substrates and inhibitors ofP-glycoprotein. J Pharmacol Exp Ther 293:376–382.
Robinson MA and Mehvar R (1996) Enantioselective distribution of verapamil and norverapamil intohuman and rat erythrocytes: the role of plasma protein binding. Biopharm Drug Dispos 17:577–587.
Shand DG, Hammill SC, Aanonsen L, and Pritchett EL (1981) Reduced verapamil clearanceduring long-term oral administration. Clin Pharmacol Ther 30:701–706.
Shibata Y, Takahashi H, Chiba M, and Ishii Y (2002) Prediction of hepatic clearance andavailability by cryopreserved human hepatocytes: an application of serum incubation method.Drug Metab Dispos 30:892–896.
Sun L, Zhang SQ, and Zhong DF (2004) In vitro identification of metabolites of verapamil in ratliver microsomes. Acta Pharmacol Sin 25:121–128.
Tam D, Sun H, and Pang KS (2003) Influence of P-glycoprotein, transfer clearances, and drugbinding on intestinal metabolism in Caco-2 cell monolayers or membrane preparations: a the-oretical analysis. Drug Metab Dispos 31:1214–1226.
Tan E and Pang KS (2001) Sulfation is rate limiting in the futile cycling between estrone andestrone sulfate in enriched periportal and perivenous rat hepatocytes.Drug Metab Dispos 29:335–346.
Tartaglione TA, Pieper JA, Lopez LL, and Mehta J (1983) Pharmacokinetics of verapamil andnorverapamil during long-term oral therapy. Res Commun Chem Pathol Pharmacol 40:15–27.
Toffoli G, Robieux I, Fantin D, Gigante M, Frustaci S, Nicolosi GL, De Cicco M, and BoiocchiM (1997) Non-linear pharmacokinetics of high-dose intravenous verapamil. Br J Clin Phar-macol 44:255–260.
Tracy TS, Korzekwa KR, Gonzalez FJ, and Wainer IW (1999) Cytochrome P450 isoformsinvolved in metabolism of the enantiomers of verapamil and norverapamil. Br J Clin Phar-macol 47:545–552.
von Richter O, Greiner B, Fromm MF, Fraser R, Omari T, Barclay ML, Dent J, Somogyi AA,and Eichelbaum M (2001) Determination of in vivo absorption, metabolism, and transport of drugs bythe human intestinal wall and liver with a novel perfusion technique.Clin Pharmacol Ther 70:217–227.
Walles M, Thum T, Levsen K, and Borlak J (2003) Metabolism of verapamil: 24 new phase I andphase II metabolites identified in cell cultures of rat hepatocytes by liquid chromatography-tandem mass spectrometry. J Chromatogr B Analyt Technol Biomed Life Sci 798:265–274.
Wang J, Xia S, Xue W, Wang D, Sai Y, Liu L, and Liu X (2013) A semi-physiologically-basedpharmacokinetic model characterizing mechanism-based auto-inhibition to predict stereo-selective pharmacokinetics of verapamil and its metabolite norverapamil in human. Eur JPharm Sci 50:290–302.
Wang YH, Jones DR, and Hall SD (2004) Prediction of cytochrome P450 3A inhibition byverapamil enantiomers and their metabolites. Drug Metab Dispos 32:259–266.
Woodcock BG, Schulz W, Kober G, and Rietbrock N (1981) Direct determination of hepaticextraction of verapamil in cardiac patients. Clin Pharmacol Ther 30:52–56.
Yamano K, Yamamoto K, Kotaki H, Takedomi S, Matsuo H, Sawada Y, and Iga T (2000)Quantitative prediction of metabolic inhibition of midazolam by erythromycin, diltiazem, andverapamil in rats: implication of concentrative uptake of inhibitors into liver. J Pharmacol ExpTher 292:1118–1126.
Yin J, Meng Q, and Dong X (2011) Auto-inhibition of verapamil metabolism in rat hepatocytes ofgel entrapment culture. Biomed Pharmacother 65:328–333.
Address correspondence to: Dr. K. Sandy Pang, Leslie Dan Faculty ofPharmacy, University of Toronto, 144 College Street, Toronto, Ontario, CanadaM5S 3M2. E-mail: [email protected]
Nonlinear Metabolite Kinetics of Verapamil 645
at ASPE
T Journals on July 13, 2018
dmd.aspetjournals.org
Dow
nloaded from