pca and pipe conversion to stock form annex ii to ... 1376920v2 107883.00010 pca and pipe conversion...
TRANSCRIPT

SL1 1376920v2 107883.00010
PCA and PIPE Conversion to Stock Form
Annex II To Conversion Application Filed with the Pennsylvania Insurance Department:
Valuations of PCA and PIPE
See Attached
003
01
FELDMAN FINANCIAL ADVISORS, INC. 1001 CONNECTICUT AVENUE, NW • SUITE 840 WASHINGTON, DC 20036 202-467-6862 (FAX) 202-467-6963
Professional Casualty Association King of Prussia, Pennsylvania
Conversion Valuation Appraisal Report Valued as of August 11, 2015
Prepared By
Feldman Financial Advisors, Inc. Washington, DC
FELDMAN FINANCIAL ADVISORS, INC. 1001 CONNECTICUT AVENUE, NW • SUITE 840 WASHINGTON, DC 20036 202-467-6862 (FAX) 202-467-6963
August 11, 2015 Board of Directors Professional Casualty Association 1012 West Ninth Avenue, 2nd Floor King of Prussia, Pennsylvania 19406 Members of the Board:
At your request, we have completed and hereby provide an independent appraisal (the "Appraisal") of the estimated pro forma market value of Professional Casualty Association ("PCA") as of August 11, 2015. PCA plans to convert from a Pennsylvania reciprocal insurance exchange to a Pennsylvania stock insurance company (the "Conversion"). In conjunction with the Conversion, PCA will be merged with and into Physicians' Insurance Program Exchange ("PIPE"), as converted to stock form, to form a single insurance company to be also called Professional Casualty Association ("New PCA"), which will become a wholly owned subsidiary of Professional Casualty Holdings, Inc. ("PCH"), a newly created Pennsylvania corporation. Immediately after these series of transactions, Diversus, Inc., a Delaware corporation will be merged with and into PCH with PCH as the survivor. PCH is offering shares of its common stock for sale in an initial public offering (the "Offering") with preference granted in the subscription offering phase to, among others, policyholders and named insureds of PCA and PIPE, and any unsubscribed shares offered to other investors in community or syndicated offerings.
This Appraisal is furnished in accordance with PCA's Plan of Conversion and Title 40 of
the Pennsylvania Statutes ("40 P.S."), Chapter 35 - Medical Professional Liability Reciprocal Exchange-to-Stock Conversion, Sections 3501 to 3517. As specified by the Plan of Conversion and 40 P.S., Chapter 35, Section 3503(a)(d), the estimated pro forma market value of the capital stock of PCA shall be determined by an independent valuation expert and shall represent the estimated pro forma market value of the stock company as successor to the reciprocal insurer. Furthermore, as permitted by Section 3503(a)(d), the pro forma market value may be stated as a range of value and may be that value that is estimated to be necessary to attract full subscription for the shares offered for sale.
Feldman Financial Advisors, Inc. ("Feldman Financial") is a financial consulting and
economic research firm that specializes in financial valuations and analyses of business enterprises and securities in the financial services industries. The background of Feldman Financial is presented in Exhibit I.

FELDMAN FINANCIAL ADVISORS, INC.
Board of Directors Professional Casualty Association August 11, 2015 Page Two
In preparing the Appraisal, we conducted an analysis of PCA that included discussions with PCA's management and an onsite visit to PCA's headquarters. We reviewed the unaudited financial statements of PCA as prepared under generally accepting accounting principles ("GAAP") as of and for the years ended December 31, 2013 and 2014 and unaudited financial statements as of and for the six months ended June 30, 2014 and 2015. PCA had available audited statutory financial statements for December 31, 2013 and 2014, but did not have audited GAAP financial statements for the corresponding periods. The unaudited GAAP financial statements furnished to us by PCA for December 31, 2013 and 2014 were internally prepared based on the audited consolidated GAAP financial statements of Professional Third Party, LP ("PTP"), which serves as the attorney-in-fact for PCA and administers and manages essentially all of the operations of PCA.
In addition, where appropriate, we considered information based on other available
published sources that we believe are reliable; however, we cannot guarantee the accuracy and completeness of such information. We also reviewed and analyzed: (i) financial and operating information with respect to the business, operations, and prospects of PCA as furnished to us PCA; (ii) publicly available information concerning PCA that we believe to be relevant to our analysis; (iii) a comparison of the historical financial results and present financial condition of PCA with those of selected publicly traded insurance companies that we deemed relevant; and (iv) financial performance and market valuation data of certain publicly traded insurance industry aggregates as provided by industry sources.
The Appraisal is based on PCA's representation that the financial data and additional
information materials furnished to us by PCA are truthful, accurate, and complete. We did not independently verify the financial statements and other information provided by PCA, nor did we independently value the assets or liabilities of PCA. The Appraisal considers PCA only as a going concern on a stand-alone basis and should not be considered as an indication of the liquidation value of PCA.
It is our opinion that, as of August 11, 2015 (the "Valuation Date"), the estimated pro
forma market value of PCA was within a range (the "Valuation Range") of $11,900,000 to $16,100,000 with a midpoint of $14,000,000. The Valuation Range was based upon a 15% decrease from the midpoint to determine the minimum and a 15% increase from the midpoint to establish the maximum.
Our Appraisal is not intended, and must not be construed, to be a recommendation of any
kind as to the advisability of purchasing shares of common stock of PCH in the Offering. Moreover, because the Appraisal is necessarily based upon estimates and projections of a number of matters, all of which are subject to change from time to time, no assurance can be given that persons who purchase shares of common stock of PCH in the Offering will thereafter be able to sell such shares at prices related to the foregoing estimate of PCA's pro forma market value.
FELDMAN FINANCIAL ADVISORS, INC.
Board of Directors Professional Casualty Association August 11, 2015 Page Three
The Appraisal reflects only the Valuation Range as of the Valuation Date for the estimated pro forma market value of PCA in connection with the Conversion and does not take into account any trading activity with respect to the purchase and sale of common stock of PCH in the secondary market on the date of issuance of such securities or at any time thereafter following the completion of the Offering. Feldman Financial is not a seller of securities within the meaning of any federal or state securities laws and any report prepared by Feldman Financial shall not be used as an offer or solicitation with respect to the purchase or sale of any securities.
The Valuation Range reported herein will be updated as appropriate. These updates will
consider, among other factors, any developments or changes in PCA's operating performance, financial condition, or management policies, and current conditions in the securities markets for insurance company common stocks. Should any such new developments or changes be material, in our opinion, to the estimated pro forma market value of PCA, appropriate adjustments to the Valuation Range will be made. The reasons for any such adjustments will be explained in detail at that time.
Respectfully submitted, Feldman Financial Advisors, Inc.
____________________ Trent R. Feldman President ____________________ Peter W. L. Williams Principal
FELDMAN FINANCIAL ADVISORS, INC.
i
TABLE OF CONTENTS TAB PAGE
INTRODUCTION .................................................................................................... 1
I. Chapter One – BUSINESS OF PCA General Overview ....................................................................................................... 5 Financial Condition ..................................................................................................... 14 Income and Expense Trends ....................................................................................... 18
II. Chapter Two – INDUSTRY FUNDAMENTALS
Industry Performance and Investment Outlook ........................................................... 24 Financial Strength Ratings by A.M. Best .................................................................... 27
III. Chapter Three – COMPARISONS WITH PUBLICLY TRADED COMPANIES
General Overview ....................................................................................................... 28 Selection Criteria ......................................................................................................... 29 Summary Profiles of the Comparative Group Companies .......................................... 33
Recent Financial Comparisons .................................................................................... 40 IV. Chapter Four – MARKET VALUE ADJUSTMENTS General Overview ....................................................................................................... 45 Earnings Prospects ...................................................................................................... 46 Management ................................................................................................................ 47 Liquidity of the Issue................................................................................................... 48 Subscription Interest ................................................................................................... 49 Stock Market Conditions ............................................................................................. 50 New Issue Discount ..................................................................................................... 52 Adjustments Conclusion ............................................................................................. 53 Valuation Approach .................................................................................................... 53 Valuation Conclusion .................................................................................................. 56 V. Appendix – EXHIBITS I Background of Feldman Financial Advisors, Inc. ......................................... I-1 II Statement of Contingent and Limiting Conditions ........................................ II-1 III-1 Balance Sheets ............................................................................................... III-1 III-2 Income Statements......................................................................................... III-2 III-3 Investment Portfolio (December 31, 2013 and 2014) ................................... III-3 III-4 Investment Portfolio (June 30, 2014 and 2015) ............................................ III-4 III-5 Statutory Financial Data ................................................................................ III-5 IV-1 Financial Performance Data for Public P&C/Multiline Insurance Group ..... IV-1 IV-2 Market Valuation Data for Public P&C/Multiline Insurance Group ............. IV-3 V-1 Pro Forma Assumptions for Conversion Valuation ...................................... V-1 V-2 Pro Forma Conversion Valuation Range ....................................................... V-2

FELDMAN FINANCIAL ADVISORS, INC.
ii
LIST OF TABLES TAB PAGE
I. Chapter One – BUSINESS OF PCA
Table 1 Selected Financial Condition Data ........................................................ 14 Table 2 Selected Operating Performance Data .................................................. 20 Table 3 Underwriting Performance Data ........................................................... 21
III. Chapter Three – COMPARISONS WITH PUBLICLY TRADED COMPANIES
Table 4 General Operating Summary of the Comparative Group ...................... 32 Table 5 Comparative Financial Condition Data ................................................. 42 Table 6 Comparative Operating Performance Data ........................................... 43
IV. Chapter Four – MARKET VALUE ADJUSTMENTS
Table 7 Selected Stock Market Index Performance ........................................... 51 Table 8 Comparative Market Valuation Analysis .............................................. 57
FELDMAN FINANCIAL ADVISORS, INC.
1
INTRODUCTION
As requested, Feldman Financial Advisors, Inc. ("Feldman Financial") has prepared an
independent appraisal (the "Appraisal") of the estimated pro forma market value of Professional
Casualty Association ("PCA") as of August 11, 2015. PCA plans to convert from a
Pennsylvania reciprocal insurance exchange to a Pennsylvania stock insurance company (the
"Conversion"). In conjunction with the Conversion, PCA will be merged with and into
Physicians' Insurance Program Exchange ("PIPE"), as converted to stock form, to form a single
insurance company to be also called Professional Casualty Association ("New PCA"), which will
become a wholly owned subsidiary of Professional Casualty Holdings, Inc. ("PCH"), a newly
created Pennsylvania corporation. Immediately after these transactions, Diversus, Inc.
("Diversus"), a Delaware corporation, will be merged with and into PCH with PCH as the
survivor. PCH is offering shares of its common stock for sale in an initial public offering (the
"Offering") with preference in the subscription phase to, among others, policyholders and named
insureds of PCA and PIPE, and any unsubscribed shares offered to other investors in community
or syndicated offerings.
This Appraisal is furnished in accordance with PCA's Plan of Conversion and Title 40 of
the Pennsylvania Statutes ("40 P.S."), Chapter 35 - Medical Professional Liability Reciprocal
Exchange-to-Stock Conversion, Sections 3501 to 3517. As specified by the Plan of Conversion
and 40 P.S., Chapter 35, Section 3503(a)(d), the estimated pro forma market value of the capital
stock of PCA shall be determined by an independent valuation expert and shall represent the
estimated pro forma market value of the stock company as successor to the reciprocal insurer.
Furthermore, as permitted by Section 3503(a)(d), the pro forma market value may be stated as a
FELDMAN FINANCIAL ADVISORS, INC.
2
range of value and may be that value that is estimated to be necessary to attract full subscription
for the shares offered for sale.
Feldman Financial Advisors, Inc. ("Feldman Financial") is a financial consulting and
economic research firm that specializes in financial valuations and analyses of business
enterprises and securities in the financial services industries. The background of Feldman
Financial is presented in Exhibit I.
In preparing the Appraisal, we conducted an analysis of PCA that included discussions
with PCA's management and an onsite visit to PCA's headquarters. We reviewed the unaudited
financial statements of PCA as prepared under generally accepting accounting principles
("GAAP") as of and for the years ended December 31, 2013 and 2014 and unaudited financial
statements as of and for the six months ended June 30, 2014 and 2015. PCA had available
audited statutory financial statements for December 31, 2013 and 2014, but did not have audited
GAAP financial statements for the corresponding periods. The unaudited GAAP financial
statements furnished to us by PCA for December 31, 2013 and 2014 were internally prepared
based on the audited consolidated GAAP financial statements of Professional Third Party, LP
("PTP"), which serves as the attorney-in-fact for PCA and administers and manages the
insurance operations of PCA. In addition, where appropriate, we considered information based
on other available published sources that we believe are reliable; however, we cannot guarantee
the accuracy and completeness of such information.
In preparing the Appraisal, we also reviewed and analyzed: (i) financial and operating
information with respect to the business, operations, and prospects of PCA as furnished to us
PCA; (ii) publicly available information concerning PCA that we believe to be relevant to our
analysis; (iii) a comparison of the historical financial results and present financial condition of

FELDMAN FINANCIAL ADVISORS, INC.
3
PCA with those of selected publicly traded insurance companies that we deemed relevant; and
(iv) financial performance and market valuation data of certain publicly traded insurance
industry aggregates as provided by industry sources.
The Appraisal is based on PCA's representation that the financial data and additional
information materials furnished to us by PCA are truthful, accurate, and complete. We did not
independently verify the financial statements and other information provided by PCA, nor did we
independently value the assets or liabilities of PCA. The Appraisal considers PCA only as a
going concern on a stand-alone basis and should not be considered as an indication of the
liquidation value of PCA.
Our Appraisal is not intended, and must not be construed, to be a recommendation of any
kind as to the advisability of purchasing shares of common stock of PCH in the Offering.
Moreover, because the Appraisal is necessarily based upon estimates and projections of a
number of matters, all of which are subject to change from time to time, no assurance can be
given that persons who purchase shares of common stock of PCH in the Offering will thereafter
be able to sell such shares at prices related to the foregoing estimate of PCA's pro forma market
value.
The Appraisal reflects only the Valuation Range as of the Valuation Date for the
estimated pro forma market value of PCA in connection with the Conversion and does not take
into account any trading activity with respect to the purchase and sale of common stock of PCH
in the secondary market on the date of issuance of such securities or at any time thereafter
following the completion of the Offering. Feldman Financial is not a seller of securities within
the meaning of any federal or state securities laws and any report prepared by Feldman Financial
shall not be used as an offer or solicitation with respect to the purchase or sale of any securities.
FELDMAN FINANCIAL ADVISORS, INC.
4
The Valuation Range reported herein will be updated as appropriate. These updates will
consider, among other factors, any developments or changes in PCA's operating performance,
financial condition, or management policies, and current conditions in the securities markets for
insurance company common stocks. Should any such new developments or changes be material,
in our opinion, to the estimated pro forma market value of PCA, appropriate adjustments to the
Valuation Range will be made. The reasons for any such adjustments will be explained in detail
at that time.

FELDMAN FINANCIAL ADVISORS, INC.
5
I. BUSINESS OF PCA
General Overview
PCA is a subscriber-based reciprocal insurance exchange domiciled in Pennsylvania.
PCA writes medical professional liability insurance primarily for physicians, physician groups,
and allied healthcare providers such as physician assistants and certified registered nurse
practitioners who are licensed to practice in Pennsylvania. PCA primarily markets its products
through a network of over 25 independent producers in Pennsylvania. PCA expects to be
granted a license to write insurance in Michigan in the third quarter of 2015. PCA is
headquartered in King of Prussia, Pennsylvania.
At June 30, 2015, PCA had total assets of $55.8 million and total subscribers' equity of
$13.1 million. For the six months ended June 30, 2015, PCA reported $7.2 million of direct
premiums written and net income of approximately $880,000. For the year ended December 31,
2014, PCA had $15.3 million in direct premiums written and net income of $239,000. PCA is
subject to examination and comprehensive regulation by the Pennsylvania Insurance
Department. PCA has not been assigned a rating by A.M. Best Company, Inc. ("A.M. Best").
Corporate History and Structure
PCA is an unincorporated reciprocal insurance exchange formed for the purpose of
insuring its subscribers against loss due to the imposition of legal liability. PCA provides
medical professional liability insurance consisting of claims-made, tail occurrence, and
occurrence policies to its subscribers. PCA was organized on April 16, 2003 and commenced
operation as a Pennsylvania licensed carrier on July 1, 2003. PCA assumed the assets, liabilities,
and policyholders of Professional Risk Retention Group, a registered risk retention group that
was domiciled in South Carolina and conducted business in Pennsylvania.

FELDMAN FINANCIAL ADVISORS, INC.
6
PCA is managed by Professional Third Party, LP ("PTP") pursuant to the terms of an
Attorney-in-Fact Agreement between PCA and PTP, effective April 16, 2003. Pursuant to the
terms of the agreement, PTP provides marketing, underwriting, claims administration, and
investment services to PCA and pays certain expenses on behalf of PCA in exchange for
compensation not exceeding 25% of direct premiums written. On June 4, 2014, PTP was
acquired by Diversus, which was formed in 2013 for the purpose of acquiring and consolidating
both fee-based and risk-bearing companies participating in the medical professional liability
("MPL") insurance market.
PTP has the power to direct the activities of PCA that most significantly impact the
economic performance of PCA by acting as the common attorney-in-fact and decision maker for
the subscribers at PCA. All medical professional liability operations are owned by PCA, and
PTP functions solely as the management company. The stockholder of PTP, through the
management fee, is deemed to have a controlling financial interest in PCA; however, it has no
other rights to or obligations arising from the assets and liabilities of PIPE.
Reciprocal Insurance Exchange
A reciprocal insurance exchange involves the organization of two separate entities: the
reciprocal insurance exchange and the attorney-in-fact ("AIF"). The reciprocal insurance
exchange functions as a form of unincorporated association in which subscribers exchange
policies through an AIF in transaction that share or spread the risk. When a subscriber suffers a
loss that is outlined in the exchange's agreement, the pooled premiums are used to pay the claim.
Each member's liability ends according to the cost and terms of their individual policies. The
reciprocal insurer is overseen by a board whose responsibilities typically include general oversight
of the reciprocal, selection and monitoring of the AIF, and approval of vendor relationships.

FELDMAN FINANCIAL ADVISORS, INC.
7
The AIF is a separate legal entity that runs the day-to-day affairs of the reciprocal insurer.
The policyholders of a reciprocal, usually called subscribers, provide a power of attorney to the
AIF, giving the AIF legal authority to act on their behalf in managing and administering the
reciprocal. A formal management contract is entered into between the AIF and the reciprocal.
The AIF may be owned by the reciprocal itself (a proprietary AIF) or by an independent third
party (a non-proprietary AIF) or a combination of both.
Product Lines and Distribution
PCA primarily writes claims-made medical malpractice insurance for healthcare
providers practicing in Pennsylvania, though an occurrence product was introduced in mid-2013.
PCA also issues tail occurrence policies to former claims-made policyholders. PTP administers
and directs essentially all of the insurance operations of PCA under its long-term service
contract. In exchange for these services, PTP receives fee income paid from PCA. PCA
primarily markets its products through a network of over 25 independent producers in
Pennsylvania. Producers are compensated on a fixed commission basis with the commission rate
tiered according to the size of the policy.
PCA continues to work predominantly with producers who specialize in physician
malpractice. In the midst of a marketplace that continues to be relatively soft, PCA seeks to
identify producers that already understand the MPL business and share its philosophy that the
policyholders' interests are always primary. PCA continues to place a high emphasis on business
retention. PCA has expanded its marketing efforts to attract non-traditional targets such as
affinity groups, statewide specialty chapters, medical societies, and purchasing groups.
PCA has a significant relationship with a large publicly traded national hospital group
that owns over 150 hospitals and has over $30 billion in annual revenue. Several of this group's

FELDMAN FINANCIAL ADVISORS, INC.
8
hospitals are located in Pennsylvania, and PCA insures nearly all physicians employed by these
hospitals. PCA estimates that this group's relationship represents approximately 35% of its
written premium.
Claims-made policies provide coverage for claims only when both the alleged incident
and the resulting claim happen during the period the policy is in force. Claims-made policies
provide coverage so long as the insured continues to pay premiums for the initial policy and any
subsequent renewals. Each succeeding year the policy is continuously renewed, the coverage
period is extended. Once premiums stop the coverage stops. Claims made to the insurance
company after the coverage period ends will not be covered, even if the alleged incident occurred
while the policy was in force. A claims-made policy will cover claims after the coverage period
only if the insured purchases extended reporting period or "tail" coverage.
Occurrence policies protect subscribers from any covered incident that "occurs" during
the policy period, regardless of when a claim is filed. An occurrence policy will respond to
claims that come in -- even after the policy has been canceled -- so long as the incident occurred
during the period in which coverage was in force. In effect, an occurrence policy offers
permanent coverage for incidents that occur during the policy period, so long as there is
sufficient aggregate limit available for the alleged event.
If the retroactive date is the beginning of the policy period, the claims-made policy is
relatively inexpensive and is called "first-year" claims-made. However, as the number of years
from the retroactive date increases, the policy "matures," and the premiums increase each year
using "step factors" until reaching the mature level. Each year the policy continuously renews,
the coverage period expands, and the insurance company's exposure to loss increases. Mature
claims-made rates are typically very close to occurrence rates for the same exposure.

FELDMAN FINANCIAL ADVISORS, INC.
9
Claims-made coverage has replaced occurrence coverage as the most common type of
policy offered by MPL insurance companies. A number of factors are behind this evolution,
including the fact that reduced carrier liability under claims-made policies can mean slightly
lower premiums for insureds. In June 2013, PCA introduced an occurrence product for the first
time, supplementing the claims-made offering that had historically been available. In January
2014, PCA introduced a conversion product that allows claims-made policyholders to migrate to
an occurrence form if they are inclined to pursue such a conversion. For the year ended
December 31, 2014, PCA generated $15.3 million in direct premiums written and $12.9 million
or 81.2% was comprised of claims-made policies and $2.4 million or 18.8% was for occurrence
policies. For the year ended December 31, 2013, PCA generated $14.8 million in direct
premiums written and $12.9 million or 87.5% was for claims-made policies and $1.9 million or
12.5% comprised occurrence policies.
Executive Management
Alan Waring serves as President of PCA and is also the President and Chief Executive
Officer of Diversus. Mr. Waring will be the President and Chief Executive Officer of PCH upon
completion of the stock conversions of PCA and PIPE and the merger of Diversus into PCH.
Mr. Waring has been in the (re)insurance industry for over 33 years, as both an underwriter and
broker, operating in the Dublin, London, Bermuda, and U.S. markets. Prior to starting
International Specialty Brokers Limited, Mr. Waring was the President of Crump International
Ltd. from 2004 through 2011, which he established and developed as the international brokerage
operation of Crump Group, one of the largest U.S. wholesale insurance brokers. From 1995
through 2003, he was an Executive Vice President of Arthur J. Gallagher Intermediaries Limited,
where he developed the Bermuda insurance and reinsurance brokerage platform for Arthur J

FELDMAN FINANCIAL ADVISORS, INC.
10
Gallagher & Co., one of the world’s largest retail brokers headquartered in Chicago, Illinois.
During his career, Mr. Waring has operated in all sectors of the (re)insurance industry and has
experience in all major classes of insurance, reinsurance and alternative risk, including captive
insurance and reinsurance companies. Mr. Waring is qualified as an Associate of the Chartered
Insurance Institute and has a postgraduate degree in marketing and management from
Westminster University in London, England.
James Gillespie, Jr. serves as Chief Executive Officer for PCA. He is a graduate of
Hampton Institute and has completed course study at The College of Insurance in New York
City. Mr. Gillespie has over 40 years of underwriting and brokerage experience, having worked
for both Continental and AIG Insurance companies, as well as Johnson & Higgins, Alexander &
Alexander, Aon, and Commerce Insurance Services. In each of his brokerage capacities, he has
either developed and/or managed substantial healthcare practices and overseen responsibility for
production, client service, and program design and marketing.
Sara M. Carpenter serves as Vice President and Treasurer for PCA. She is also Executive
Vice President and Chief Financial Officer ("CFO") of Diversus. For the past 14 years, she has
concurrently served as CFO for PIPE, Alliant Health Plans, and Doctors & Surgeons National
Risk Retention Group. Prior to 1998, she was President of Enterprise Corporate Services,
providing accounting and consulting services to healthcare providers. Ms. Carpenter is a
Certified Public Accountant ("CPA") and holds a Masters degree in Accountancy.
Michele M. Morrison serves as Senior Underwriter for PCA. She is a graduate of
Rosemont College and has more than 28 years of combined underwriting and both retail and
wholesale insurance brokerage experience. The heavy emphasis throughout her career has been
on professional liability lines of coverage.

FELDMAN FINANCIAL ADVISORS, INC.
11
Douglas R. Fahringer, Esq. serves as Director of Claims and Risk Management for PCA.
He is a cum laude graduate of Wilkes College and The Dickinson School of Law. Mr. Fahringer
has ten years of litigation and trial experience with the law firm, O'Brien & Ryan, where he
successfully defended physicians and other healthcare providers in Pennsylvania. Thereafter, as
Claim Supervisor with the Pennsylvania Property & Casualty Insurance Guaranty Association,
he managed the medical claims department and supervised defense counsel handling claims of
insolvent medical malpractice insurance companies. He has 20 years combined experience
specializing in legal, medical, and insurance issues.
Michael F. Grill serves as Controller for PCA. He is a graduate of Philadelphia College
of Textiles and Science and has over 30 years of accounting experience. Mr. Grill worked as an
insurance accountant for 23 years for Penn Treaty American Corporation where he served as
Treasurer and Controller. He has vast experience in investments and money management, filing
the required financial reports, and working with reinsurers.
Reasons for the Conversion
Like most insurance companies, PCA's premium growth and underwriting results have
been, and continue to be, influenced by market conditions. The MPL insurance industry
historically is cyclical in nature, characterized by periods of significant price competition and
excess underwriting capacity (a soft market) followed by periods of high premium rates and
shortages of underwriting capacity (a hard market). The MPL insurance industry is currently
operating under soft market conditions as a result of abundant capacity, with significant
competition and pressure on premium rates following several years of overall favorable claims
trends. During 2008 through 2014, premium rates declined in PCA's core Pennsylvania market,
FELDMAN FINANCIAL ADVISORS, INC.
12
primarily as a result of improved claims frequency, and premium rates have remained relatively
level in 2015.
PCA competes with MPL specialty insurers and alternative risk arrangements, as well as
other large national property and casualty insurance companies that write medical professional
liability insurance. Theses competitors include companies that have substantially greater
financial resources and solid financial strength ratings. PCA also faces competition from other
insurance companies for the services and allegiance of independent agents and brokers, on whose
services PCA depends in marketing its insurance products. PCA seeks to compete based on
quality and speed of service, but does not have the capital to engage in long-term price
competition with some of its competitors. Over-capacity in the MPL market has led many
market participants to seek acquisitions in order to generate revenue growth.
PCA is not currently rated by A.M. Best. Financial strength ratings from A.M. Best are
used by producers and customers as a means of assessing the financial strength and quality of
insurers. To accomplish the goal of generating material growth in premiums written, PCA
recognizes that it must obtain a solid A.M. Best rating. In order to achieve a solid rating, PCA
believes that it needs to enhance its capitalization and operating performance to levels
satisfactory to A.M. Best, as well as satisfy various other rating requirements. Therefore, the
primary purpose of the stock conversion and merger into New PCA is to increase PCA's access
to capital resources and improve the outlook for obtaining a solid financial strength rating.
As a result of the Conversion, PCA will merge with and into New PCA, and PCA will no
longer exist as a separate company. The resulting increase in capitalization should permit New
PCA to (i) increase direct premium volume to the extent competitive conditions permit; (ii)
increase net premium volume by decreasing reliance on reinsurance; and (iii) enhance
FELDMAN FINANCIAL ADVISORS, INC.
13
investment income by increasing New PCA's investment portfolio. Additionally, New PCA
intends to pursue the assignment of a financial strength rating from A.M. Best.
The remainder of Chapter I examines in more detail the trends addressed in this section,
including the impact of changes in PCA's economic and competitive environment, and PCA's
recent financial performance. The discussion is supplemented by the exhibits in the Appendix.
Exhibit III-1 displays PCA's unaudited balance sheets as of December 31, 2013 and 2014 and
June 30, 2015. Exhibit III-2 presents PCA's unaudited income statements for the years ended
December 31, 2013 and 2014 and the six months ended June 30, 2014 and 2015.

FELDMAN FINANCIAL ADVISORS, INC.
14
Financial Condition
Table 1 presents selected data concerning PCA's financial position as of December 31,
2012 to 2014 and June 30, 2015. Exhibit III-1 presents PCA's balance sheets as of December 31,
2013 and 2014 and June 30, 2015. The financial data presentation for PCA in the tables below
and in Exhibits III-1 to III-4 is derived from the GAAP financial statements of PCA. Statutory
financial data for PCA is included in Exhibit III-5 and provides a five-year overview of PCA's
operating trends.
Table 1 Selected Financial Condition Data As of December 31, 2012 to 2014 and June 30, 2015 (Dollars in Thousands)
PCA's total assets decreased by 6.5% from $61.6 million at December 31, 2013 to $57.6
million at December 31, 2014. The $4.0 million decrease in total assets primarily reflected a
$3.9 million decrease in cash and investments from $53.3 million at December 31, 2013 to $49.4
June 30,2015 2014 2013 2012
Balance Sheet DataTotal assets $55,849 $57,608 $61,586 $60,413Total cash and investments 49,720 49,384 53,307 47,337 Reinsurance recoverable 2,228 3,324 3,516 3,350 Total policy reserves (1) 28,560 29,850 32,917 31,908 Unearned premiums 11,439 11,595 10,798 10,747 Total liabilities 42,782 45,156 49,592 48,723 Total equity 13,067 12,452 11,994 11,690
Total equity / total assets 23.40% 21.62% 19.47% 19.35%Cash and investments / total assets 89.03% 85.73% 86.56% 78.36%Policy reserves / total assets 51.14% 51.82% 53.45% 52.82%
(1) Total policy reserves equal losses and loss adjustment expenses.
Source: PCA, unaudited GAAP financial statements.
December 31,

FELDMAN FINANCIAL ADVISORS, INC.
15
million at December 31, 2014. Total policy reserves declined by $3.1 million from $32.9 million
at December 31, 2013 to $29.9 million at December 31, 2014. The decrease in policy reserves
was primarily due to the effort to settle more claims before trial and a reduction of new claims
received in 2014. Total equity increased moderately by 3.8% from $12.0 million at year-end
2013 to $12.5 million at year-end 2014. The ratio of total equity to assets increased from
19.47% at year-end 2013 to 21.62% at year-end 2014.
PCA's aggregate balance of cash and investments amounted to $49.4 million at December
31, 2014 and constituted 85.7% of total assets. PCA's primary sources of cash are premiums,
investment income, and sales and maturities of investment securities. PCA's primary uses of
cash are policy acquisitions costs (primarily commissions), payments on claims, investment
purchases, and general and administrative expenses. Cash, cash equivalents, and short-term
investments amounted to $5.5 million at December 31, 2014 and investment securities totaled
$43.9 million. Exhibit III-3 presents PCA's investment portfolio as of December 31, 2014. All
of PCA's investment securities are classified as available for sale and carried at fair value, with
unrealized gains of losses, net of any income tax effects, included in accumulated other
comprehensive income. PCA's investment objectives include managing a conservative, high
quality securities portfolio. PCA does not have any investments in derivative financial
instruments, mortgage loans, or real estate.
Consistent with its investment policy, PCA's investment portfolio primarily comprises
fixed-income debt securities. As of December 31, 2014, PCA's investments securities totaled
$43.9 million and consisted of $24.1 million (54.9%) of U.S. Treasury and U.S. Government
agency securities, $13.8 million (31.3%) of corporate and industrial bonds, and $6.1 million
(13.8%) of general obligations of states and political subdivisions of states. The weighted
FELDMAN FINANCIAL ADVISORS, INC.
16
average maturity of PCA's debt security investments was approximately 2.8 years as of
December 31, 2014.
Investment security ratings are issued by the National Association of Insurance
Commissioners ("NAIC") and are similar to the rating agency designations for marketable bonds
as prepared by nationally recognized statistical rating organizations such as Standard & Poor's
and Moody's Investors Services. NAIC ratings of 1 and 2 include bonds generally considered
investment grade by such ratings organizations. NAIC ratings of 3 through 6 include bonds
generally considered below investment grade. As of December 31, 2014, all of PCA's bond
investments carried NAIC ratings of 1.
In accordance with insurance industry practice, PCA reinsures a portion of its loss
exposure and pays to the reinsurers a portion of the premiums received on all policies reinsured.
Insurance policies written by PCA are reinsured with other insurance companies principally to:
(i) reduce net liability on individual risks; (ii) mitigate the effect of individual loss occurrences;
(iii) stabilize underwriting results; (iv) decrease leverage; and (v) increase underwriting capacity.
Reinsurance is ceded by PCA on excess of loss basis with PCA's retention of $300,000 per
occurrence for claims related to policy years 2008 through 2014 and $250,000 for policy year
2007. PCA ceded to reinsurers $2.5 million and $2.6 million of written premiums for the years
ended December 31, 2013 and 2014, respectively. As of December 31, 2014, PCA had
reinsurance balances recoverable of $3.3 million from four reinsurers, one of which is domiciled
outside of the United States. The domestic reinsurers have A.M. Best financial strength ratings
of A (Excellent) or better. The foreign reinsurer has deposited funds into a trust account with a
bank in the United States to secure its balance due to PCA.

FELDMAN FINANCIAL ADVISORS, INC.
17
PCA has outstanding surplus notes of $1.6 million at December 31, 2014. The notes
comprised a series of subordinated promissory notes bearing an interest rate of 5.0%. The
amount of outstanding surplus notes was reduced from $2.7 million at December 31, 2013 to
$1.6 million at December 31, 2014. The surplus notes are included as part of subscribers' surplus
for PCA's statutory financial statements, but are excluded from equity capital for purposes of
GAAP.
PCA's total assets declined by 3.1% from $57.6 million at December 31, 2014 to $55.8
million at June 30, 2015. On the asset side of the balance sheet, the $1.8 million reduction in
total assets was largely attributable to a decrease of $1.1 million in reinsurance recoverable. On
the liability side of the balance sheet, total policy reserves decreased by $1.3 million from
December 31, 2014 to June 30, 2015. The aggregate amount of cash and investments was
relatively unchanged at $49.7 million as of June 30, 2015, compared to $49.4 million as of
December 31, 2014. PCA's total equity capital, as measured under GAAP, increased from $12.5
million or 21.6% of total assets at December 31, 2014 to $13.1 million or 23.4% of total assets at
June 30, 2015. The increase in PCA's equity capital during the year-to-date ("YTD") period
ended June 30, 2015 was due to profitable operations registered by PCA.

FELDMAN FINANCIAL ADVISORS, INC.
18
Income and Expense Trends
Table 2 displays PCA's earnings results and selected operating ratios for 2012 to 2014
and the first half of 2015. Exhibit III-2 displays PCA's income statements for 2013 and 2014 and
the first half of 2015. PCA's operating results are influenced by factors affecting the MPL
insurance sector in general. The performance of the MPL insurance sector is subject to
significant variations due to competition, regulation, general economic conditions, claims
reporting and settlement patterns, judicial decisions, impact of healthcare legislation and tort
reform, fluctuations in interest rates, and other factors. PCA's premium growth and underwriting
results are influenced by market conditions. Pricing in the MPL insurance industry historically
has been cyclical with the financial performance of insurers fluctuating from periods of low
premium rates and excess underwriting capacity resulting from increased competition (soft
market), followed by periods of high premium rates and a shortage of underwriting capacity
resulting from decreased competition (hard market).
There has not been a hard market in the MPL arena in almost a decade. Rates have
continued to decline across all healthcare subsectors and capacity has grown substantially as new
players have entered the market. Underwriters are accepting what appears to be a permanent,
competitive landscape. The main reason for the continuing soft market is that the ratio of supply
to demand has never been greater. New carrier entrants to both the primary and excess
marketplace, as well as the supply of ample reinsurance, offer buyers more options than ever.
Overlay the tremendous consolidation among healthcare organizations and the trend toward the
employment of physicians who had once been separately insured, and these forces have led to
more carriers fighting over a shrinking customer base. As a result, pricing has naturally declined
in this macro-economic environment.
FELDMAN FINANCIAL ADVISORS, INC.
19
For the Years Ended December 31, 2014 and 2013
PCA recorded net income of $239,000 in the year ended December 31, 2014, marking a
decrease from net income of $1.0 million in the year ended December 31, 2013. Although direct
premiums written increased from $14.8 million in 2013 to $15.3 million in 2014, net premiums
earned declined from $12.2 million in 2013 to $12.0 million in 2014. Total revenue declined to
$12.6 million in 2014, which was 3.0% less than $12.9 million in 2013 due mainly to decreases
in net premiums earned and net investment income. PCA experienced an underwriting loss in
2014 versus an underwriting profit in 2013, which contributed to the decline in net profits for
2014.
Direct premiums written increased by 3.6% from $14.8 million in 2013 to $15.3 million
in 2014. The ceded rate on direct premiums written was unchanged at 17.0% in both 2013 and
2014. Net premiums earned declined by 2.1% from $12.2 million in 2013 to $12.0 million in
2014. Net investment income decreased from $717,000 in 2013 to $586,000 in 2014. Loss and
loss adjustment expenses increased by 23.1% from $6.4 million in 2013 to $7.8 million in 2014.
General operating expenses declined by 13.6% from $5.0 million in 2013 to $4.4 million in
2014.
A key measurement of the profitability of any insurance company for any period is its
combined ratio, which is equal to the sum of its loss ratio and its expense ratio. However,
investment income, federal income taxes and other non-underwriting income or expense are not
reflected in the combined ratio. The profitability of property and casualty insurance companies
depends on income from underwriting, investment, and service operations. Underwriting results
are considered profitable when the combined ratio is under 100% and unprofitable when the
combined ratio is over 100%.

FELDMAN FINANCIAL ADVISORS, INC.
20
Table 2 Selected Operating Performance Data For the Years Ended December 31, 2012 to 2014
And the Six Months Ended June 30, 2014 and 2015 (Dollars in Thousands)
2015 2014 2014 2013 2012Income Statement DataDirect premiums written 7,199$ 7,839$ 15,324$ 14,788$ 14,538$ Net premiums written 5,928 6,496 12,713 12,274 12,090
Net premiums earned 6,027$ 5,658$ 11,966$ 12,226$ 12,642$ Investment income, net of expenses 408 406 586 717 1,101 Total revenue 6,435 6,063 12,552 12,942 13,744
Losses and loss adjustment expenses 3,014 4,294 7,831 6,362 9,606 General operating expenses 2,088 1,475 4,358 5,046 5,164 Total claims and expenses 5,101 5,769 12,190 11,408 14,770
Income (loss) before income taxes 1,333 295 362 1,534 (1,026) Income tax expense (benefit) 453 100 123 505 (348) Net income (loss) 880$ 195$ 239$ 1,029$ (678)$
Operating RatiosReturn on average assets (1) 3.03% 0.64% 0.39% 1.69% -1.11%Return on average equity (1) 13.96% 3.21% 1.96% 8.69% -5.65%Loss ratio (2) 50.00% 75.90% 65.45% 52.04% 75.98%Expense ratio (3) 34.64% 26.06% 36.42% 41.27% 40.85%Combined ratio (4) 84.65% 101.96% 101.87% 93.31% 116.83%
(1) Annualized ratios for the six-month periods in 2014 and 2015.(2) Losses and loss adjustment expenses divided by net premiums earned.(3) Underwriting expenses divided by net premiums earned.(4) Sum of the loss ratio and the expense ratio.
Source: PCA, unaudited GAAP financial statements.
For the Years EndedDecember 31,June 30,
Six Months Ended

FELDMAN FINANCIAL ADVISORS, INC.
21
Table 3 provides underwriting performance summary data for PCA for the years ended
December 31, 2012 to 2014 and the six months ended June 30, 2014 and 2015.
Table 3 Underwriting Performance Data
For the Years Ended December 31, 2012 to 2014 And the Six Months Ended June 30, 2014 and 2015
(Dollars in Thousands)
As shown in Table 3, PCA's combined ratio increased from 93.3% in 2013 to 101.9% in
2014. The increase in PCA's combined ratio was attributable to the higher loss ratio in 2014,
which primarily reflects the increased level of losses and loss adjustment expenses incurred. The
expansion of the loss ratio from 52.0% in 2013 to 65.4% in 2014 resulted mainly from one claim
that was settled above policy limits and above carried reserves. PCA's expense ratio actually
2015 2014 2014 2013 2012
Net premiums earned 6,027$ 5,658$ 11,966$ 12,226$ 12,642$
Losses and loss adjustment expenses 3,014 4,294 7,831 6,362 9,606 General operating expenses 2,088 1,475 4,358 5,046 5,164 Total claims and expenses 5,101 5,769 12,190 11,408 14,770
Underwriting profit (loss) 925$ (111)$ (224)$ 817$ (2,128)$
Operating RatiosLoss ratio (1) 50.00% 75.90% 65.45% 52.04% 75.98%Expense ratio (2) 34.64% 26.06% 36.42% 41.27% 40.85%Combined ratio (3) 84.65% 101.96% 101.87% 93.31% 116.83%
(1) Losses and loss adjustment expenses divided by net premiums earned.(2) Underwriting expenses divided by net premiums earned.(3) Sum of the loss ratio and the expense ratio.
Source: PCA, unaudited GAAP financial statements.
Six Months Ended For the Years EndedJune 30, December 31,

FELDMAN FINANCIAL ADVISORS, INC.
22
declined from 41.3% in 2013 to 36.4% in 2014. Reflective of the higher combined ratio, PCA's
experienced an underwriting loss of -$224,000 for 2014 as compared to an underwriting profit of
$817,000 in 2013. Previously, in 2012, PCA incurred an underwriting loss of -$2.1 million.
PCA sustained a net loss of -$678,000 for 2012 and then reported positive earnings of
$1.0 million in 2013, supported by a decline in the loss ratio from 76.0% in 2012 to 52.0% in
2013. The decreased loss ratio in 2013 was the result of favorable settlement of claims and the
re-estimation of unpaid losses and loss adjustment expenses related to insured events of the prior
year. The increase in the loss ratio to 65.4% in 2014 had the impact of narrowing earnings to
$239,000 for 2014.
For the Six Months Ended June 30, 2015 and 2014
PCA reported net income of $880,000 for the six months ended June 30, 2015, compared
to earnings of $195,000 for the six months ended June 30, 2014. The increase of $685,000 in
earnings over the corresponding periods was due primarily to an increase of $369,000 in net
premiums earned and a decline of $1.3 million in losses and loss adjustment expenses, which
were partially offset by an increase of $613,000 in general operating expenses. Net investment
income was $406,000 and $408,000 for the six-month periods in 2014 and 2015, respectively.
PCA's loss ratio declined from 75.9% for the six months ended June 30, 2014 to 50.0%
for the six months ended June 30, 2015. Conversely, PCA's expense ratio increased from 26.1%
for the six months ended June 30, 2014 to 34.6% for the six months ended June 30, 2015.
Overall, the combined ratio improved from 102.0% in the YTD 2014 period to 84.7% for the
YTD 2015 period. PCA's annualized return on average assets ("ROA") for the six months ended
June 30, 2015 was 3.03%, representing an increase from the annualized ROA of 0.64% posted
for the six months ended June 30, 2014.

FELDMAN FINANCIAL ADVISORS, INC.
23
Statutory Financial Data Overview
State insurance laws and regulations require PCA to file financial statements with state
insurance departments everywhere it does business, and the operations of PCA are subject to
examination by those departments. PCA prepares statutory financial statements in accordance
with accounting practices and procedures prescribed or permitted by these departments. Certain
accounting standards differ under statutory accounting practices ("SAP") as compared to GAAP.
For example, premium income is recognized on a pro rata basis over the term covered by the
insurance policy, while the related acquisition costs are expensed when incurred under SAP.
Under GAAP, both premium income and the related policy acquisition costs are recognized on a
pro rata basis over the term of the insurance policy. In addition, surplus notes are considered a
part of policyholders' surplus under SAP, but are excluded from equity capital under GAAP.
Therefore, the GAAP operating results and financial data for PCA do not correspond to the SAP
presentation.
Exhibit III-5 presents summary statutory financial data for PCA over the five-year period
for the years ended December 31, 2010 to 2014. As illustrated, PCA's premium volumes
declined from 2010 to 2012 and effectively stagnated from 2012 to 2014 with modest growth
occurring. Concurrently, underwriting profits and net investment income exhibited downward
trends over the five-year period. Reflective of general market conditions, PCA's net yield on
invested assets declined from 2.20% in 2010 to 1.78%, 1.44%, 1.16%, and 1.11% in 2011, 2012,
2013, and 2014, respectively. On a statutory basis, PCA's earnings declined each year during the
2010 to 2014 period, except in 2013 when PCA turned a profit after suffering a net loss in 2012.
PCA's statutory surplus increased from $12.4 million at December 31, 2010 to $14.0 million at
December 31, 2011, but declined steadily thereafter to $12.3 million at December 31, 2014.
FELDMAN FINANCIAL ADVISORS, INC.
24
II. INDUSTRY FUNDAMENTALS
Industry Performance and Outlook
The property and casualty ("P&C") segment of the insurance industry provides protection
from risk into two basic areas. In general, property insurance protects an insured against
financial loss arising out of loss of property or its use caused by an insured peril. Casualty
insurance protects the insured against financial loss arising out of the insured's obligation to
others for loss or damage to persons, including, with respect to workers compensation insurance,
persons who are employees, or property. There are approximately 3,000 companies providing
property and casualty insurance coverage in the United States. About 100 of these companies
provide the majority of the property and casualty coverage.
Historically, the financial performance of the P&C insurance industry has tended to
fluctuate in cyclical periods of aggressive price competition and excess underwriting capacity
(known as a soft market), followed often by periods of high premium rates and shortages of
underwriting capacity (or a hard market). Although an individual insurance company's financial
performance is dependent on its own specific business characteristics, the profitability of most
property and casualty insurance companies tends to follow this cyclical market pattern. During
soft market conditions, premium rates are stable or falling and insurance coverage is readily
available. During periods of hard market conditions, coverage may be more difficult to find and
insurers increase premiums or exit unprofitable areas of business.
Although it comprises just over 2% of annual direct premiums for the U.S. P&C
insurance industry, the MPL insurance sector is integral to the U.S. healthcare system, which
accounts for almost one-fifth of the nation's gross domestic product. The MPL sector has
FELDMAN FINANCIAL ADVISORS, INC.
25
historically been among the most volatile sectors in the insurance industry. The MPL sector has
broadly outperformed the overall P&C sector as a result of strong pricing in the early 2000s,
coupled with substantially reduced claims frequency. However, in the current market,
historically strong operating margins are likely to come under pressure due to intense premium
rate competition and lower fixed-income investment returns. MPL claims have been trending
down since the past decade as a result of favorable judicial decisions, as well as state-level tort
reform measures. As a result, most MPL insurers have reported favorable reserve development
trends and continued profitability.
The year 2014 marked a year of financial stability for the MPL insurance industry,
despite a continued decline in profitability. While the industry's operating ratio remained under
100%, it increased by several percentage points over the prior year as it has done for each year
since 2010. Insurers continued to experience a decline in reserve releases, increased expenses,
and diminished investment income. Despite the decline in profitability, the MPL industry
returned a substantial portion of its income in 2014 as dividends to policyholders. Surplus grew
slightly in 2014, leaving the industry in a financial position roughly consistent with where it has
been since year-end 2011.
Direct premiums written in the MPL sector declined by 1.2% from $9.8 billion in 2013 to
$9.7 billion in 2014, denoting the eighth consecutive years of decreases for the MPL industry.
Premium rates continue to fall for many writers of MPL insurance, as evidenced by the declining
premium volume of the industry as a whole. It is not uncommon for companies to find
themselves forced to choose between writing policies at rates perceived to be inadequate or lose
market share. MPL insurers are also faced with declining market share due to the acquisition of
physician practices by hospitals and healthcare systems, as well as the preference of newly
FELDMAN FINANCIAL ADVISORS, INC.
26
trained physicians to join these larger systems rather than enter into independent practices.
Healthcare reform has only served to accelerate the trend in physician employment that was
already well underway.
As reported by Milliman, Inc., the combined ratio for the MPL industry was 96% in
2014, up from a low of 76% in 2008. The loss ratio for 2014 was 65%, higher than in any year
since 2006 and an increase of 12 percentage points. The increase in the loss ratio has been
driven largely by the decline in reserve releases. The industry's surplus increased slightly by 2%
in 2014. The stabilization of the industry's capitalization level is in part due to the significant
amount policyholder dividends that MPL writers have continued to pay.
Net investment income is an important revenue source for P&C insurers, historically
accounting for 15%-20% of total revenues. For most insurers, cash flows available for
investment have stabilized although persistently low investment yields continue to pressure
investment income results. Net realized investment gains have increased in recent years on the
heels of surging securities market valuations.
Continued reserve releases can be expected to mask deteriorating underwriting results on
current MPL business, thereby prolonging the soft market and increasing the risk that rates may
become inadequate. MPL insurers face other challenges to increasing profits, possible increases
in frequency and severity, threats to the tort system and tort laws in various states, the continued
impact of healthcare reform, and a decline in market size as hospitals continue to acquire
physician practices. In light of the industry's fundamentals, the current soft market is likely to
continue into the near future. The challenge for larger MPL carriers is to seek new sources of
premium growth, and increasingly they seek this growth through acquisition.
FELDMAN FINANCIAL ADVISORS, INC.
27
Financial Strength Ratings by A.M. Best
A.M. Best is a widely recognized rating agency dedicated to the insurance industry.
A.M. Best provides ratings that indicate the financial strength of insurance companies. The
objective of A.M. Best's rating system is to provide an independent opinion of an insurer's
financial strength and its ability to meet ongoing obligations to policyholders. The assigned
financial strength rating is derived from an in-depth evaluation and analysis of a company's
balance sheet strength, operating performance, and business profile. A.M. Best's ratings scale is
comprised of 15 individual ratings grouped into 9 categories (excluding suspended ratings). At
the current time, PCA has not been assigned a financial strength rating by A.M. Best.
FELDMAN FINANCIAL ADVISORS, INC.
28
III. COMPARISONS WITH PUBLICLY TRADED COMPANIES
General Overview
The comparative market approach provides a sound basis for determining estimates of
going-concern valuations where a regular and active market exists for the stocks of peer
institutions. The comparative market approach was utilized in determining the estimated pro
forma market value of PCA because: (i) reliable market and financial data are readily available
for comparable institutions, and (ii) the comparative market method has been widely accepted as
a valuation approach by the applicable regulatory authorities. The generally employed valuation
method in initial public offerings ("IPOs"), where possible, is the comparative market approach,
which also can be relied upon to determine pro forma market value in an insurance company
stock conversion transaction. We considered other valuation approaches such as the asset-based
valuation and income capitalization methods. However, we determined that because PCA is a
going-concern insurance company with highly variable earnings results and the fact that the
Valuation will be utilized pursuant a stock conversion offering structure, the comparative market
approach is the preferred valuation method for this assignment.
The comparative market approach derives valuation benchmarks from the trading
patterns of selected peer institutions that, due to certain factors such as financial performance and
operating strategies, enable the appraiser to estimate the potential value of the subject institution
in a mutual-to-stock conversion offering. In Chapter III, our valuation analysis focuses on the
selection and comparison of PCA with a comparable group of publicly traded insurance
companies (the "Comparative Group"). Chapter IV will detail any additional discounts or
premiums that we believe are appropriate to PCA's pro forma market value.

FELDMAN FINANCIAL ADVISORS, INC.
29
Selection Criteria
Selected market price and financial performance data for insurance companies listed on
the New York and NYSE MKT Stock Exchanges or traded on the NASDAQ Stock Market are
shown in Exhibit IV as compiled from data obtained from SNL Financial LC ("SNL Financial"),
a leading provider of financial and market data focused on financial services industries, including
banks and insurance companies. The insurance underwriting industry is differentiated by SNL
Financial into six market segments: (i) life and health, (ii) managed care, (iii) mortgage and
financial guaranty, (iv) multiline, (v) property and casualty, and (vi) title. For purposes of this
selection screening, we focused primarily on publicly traded insurance companies in the P&C
and multiline segments exclusive of announced acquisition targets ("Public P&C/Multiline
Group"). Several criteria, discussed below, were used to select the individual members of the
Comparative Group from the overall universe of publicly traded insurance companies.
• Operating characteristics – A company's operating characteristics are the most important factors because they affect investors' expected rates of return on a company's stock under various business and economic scenarios, and they influence the market's general perception of the quality and attractiveness of a given company. Operating characteristics, which may vary in importance during the business cycle, include financial variables such as profitability, capitalization, growth, risk exposure, liquidity, and other factors such as lines of business and management strategies.
• Degree of marketability and liquidity – Marketability of a stock reflects the
relative ease and promptness with which a security may be sold when desired, at a representative current price, without material concession in price merely because of the necessity of sale. Marketability also connotes the existence of buying interest as well as selling interest and is usually indicated by trading volumes and the spread between the bid and asked price for a security. Liquidity of the stock issue refers to the organized market exchange process whereby the security can be converted into cash. We attempted to limit our selection to companies that have access to a regular trading market or price quotations. We eliminated from the selection process companies with market prices that were materially influenced by publicly announced or widely rumored acquisitions.
FELDMAN FINANCIAL ADVISORS, INC.
30
In determining the Comparative Group composition, we focused primarily on PCA's size,
market segment, and product lines. Attempting to concentrate on PCA's financial characteristics
and expand the Comparative Group to obtain a meaningful cluster of companies, we broadened
the size range criterion to encompass a statistically significant number of companies. In
addition, due to the ongoing consolidation activity within the insurance industry, we sought to
include a sufficient number of companies in the event that one or several members of the
Comparative Group are subsequently subject to acquisition as we update this Appraisal prior to
completion of PCA's Conversion.
Of the 54 companies composing the Public P&C/Multiline Group, there were only five
companies with total assets less than $200 million and zero companies with assets less than $70
million or PCA's total assets of $55.8 million. The median asset size of the Public
P&C/Multiline Group was $4.6 billion and the average size was even larger at $40.0 billion,
skewed by behemoth companies such as Berkshire Hathaway and American International Group
with total assets each exceeding $500 billion. We applied the following selection criteria and
focused principally on companies concentrated in the lower quartile of the Public P&C/Multiline
Group based on asset size:
• Publicly traded – stock-form insurance company whose shares are traded on New York Stock Exchange, NYSE MKT, or NASDAQ Stock Market.
• Asset size – total assets less than $1.6 billion.
• Market segment – primary focus on market segments of property and casualty, with additional consideration accorded to multiline and life and health.
• Current financial data – publicly reported financial data on a GAAP basis for the last twelve months ("LTM") ended March 31, 2015 or June 30, 2015.
• Insurance product lines – companies providing specialty lines of coverage, particularly including medical malpractice, were granted additional consideration for inclusion.

FELDMAN FINANCIAL ADVISORS, INC.
31
As a result of applying the above criteria, the screening process produced a reliable
representation of publicly traded insurance companies for valuation purposes. Eighteen
companies met the asset size and market segment criterion outlined on the previous page. We
included in the Comparative Group four of the five public P&C insurance companies with assets
under $200 million. Trupanion, Inc., which provides medical insurance plans for cats and dogs
was not included in the Comparative Group. Within the collection of 12 companies comprising
the Public P&C/Multiline Group reporting assets between $200 million and $1.6 billion, we
selected nine seven for inclusion in the Comparative Group.
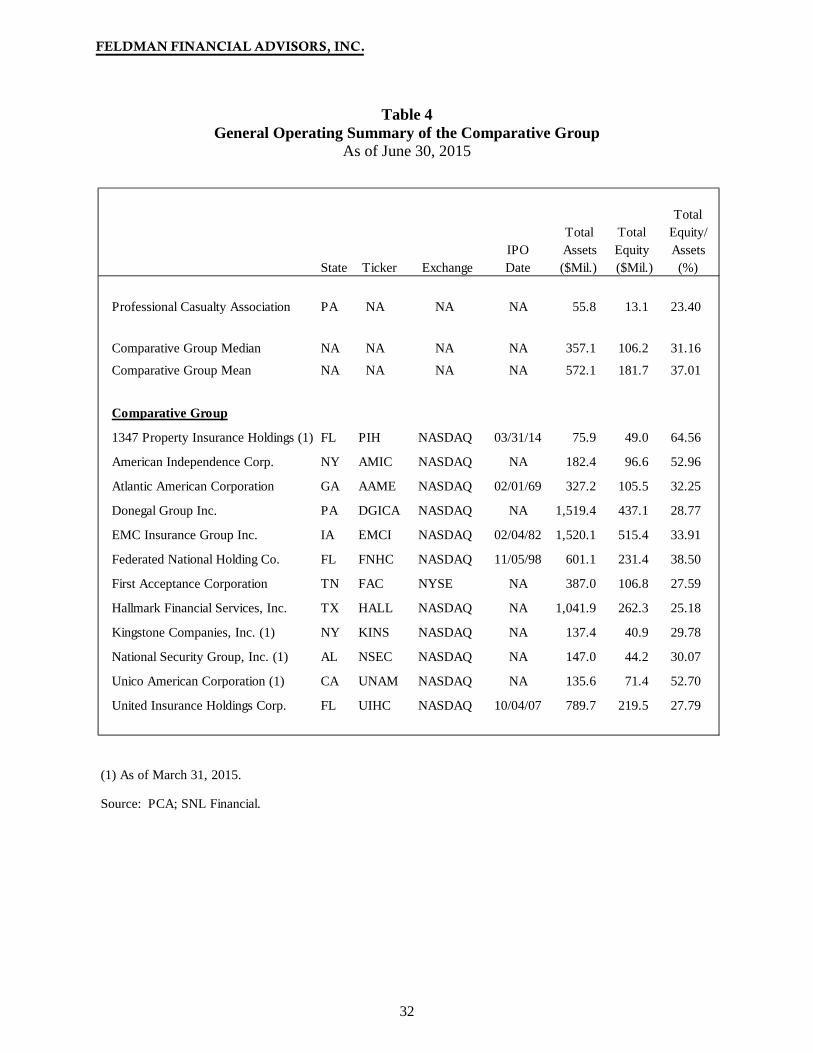
A general operating summary of the 12 companies selected for the Comparative Group is
presented in Table 4. In focusing on smaller publicly traded companies, the Comparative Group
includes seven companies with total assets less than $500 million and five altogether below $200
million (1347 Property Insurance Holdings, American Independence Corp., Kingstone
Companies, National Security Group, and Unico American Corporation). In addition, three of
the Comparative Group companies are headquartered in the Mid-Atlantic region (Donegal Group
in Pennsylvania and American Independence Corp. and Kingstone Companies in New York),
similar to PCA. The overall geographic mix of the companies in the Comparative Group reflects
a wide distribution. One member of the Comparative Group companies completed an IPO
within the past two years, specifically 1347 Property Insurance Holdings in March 2014. While
no single company constitutes a perfect comparable and differences inevitably exist between
PCA and the individual companies, we believe that the chosen Comparative Group on the whole
provides a meaningful basis of financial comparison for valuation purposes. Summary operating
profiles of the publicly traded insurance companies selected for the Comparative Group are
presented in the next section beginning on pages 33 to 39.
FELDMAN FINANCIAL ADVISORS, INC.
32
Table 4 General Operating Summary of the Comparative Group
As of June 30, 2015
Total Total Total Equity/
IPO Assets Equity AssetsState Ticker Exchange Date ($Mil.) ($Mil.) (%)
Professional Casualty Association PA NA NA NA 55.8 13.1 23.40
Comparative Group Median NA NA NA NA 357.1 106.2 31.16
Comparative Group Mean NA NA NA NA 572.1 181.7 37.01
Comparative Group
1347 Property Insurance Holdings (1) FL PIH NASDAQ 03/31/14 75.9 49.0 64.56
American Independence Corp. NY AMIC NASDAQ NA 182.4 96.6 52.96
Atlantic American Corporation GA AAME NASDAQ 02/01/69 327.2 105.5 32.25
Donegal Group Inc. PA DGICA NASDAQ NA 1,519.4 437.1 28.77
EMC Insurance Group Inc. IA EMCI NASDAQ 02/04/82 1,520.1 515.4 33.91
Federated National Holding Co. FL FNHC NASDAQ 11/05/98 601.1 231.4 38.50
First Acceptance Corporation TN FAC NYSE NA 387.0 106.8 27.59
Hallmark Financial Services, Inc. TX HALL NASDAQ NA 1,041.9 262.3 25.18
Kingstone Companies, Inc. (1) NY KINS NASDAQ NA 137.4 40.9 29.78
National Security Group, Inc. (1) AL NSEC NASDAQ NA 147.0 44.2 30.07
Unico American Corporation (1) CA UNAM NASDAQ NA 135.6 71.4 52.70
United Insurance Holdings Corp. FL UIHC NASDAQ 10/04/07 789.7 219.5 27.79
(1) As of March 31, 2015.
Source: PCA; SNL Financial.
FELDMAN FINANCIAL ADVISORS, INC.
33
Summary Profiles of the Comparative Group Companies
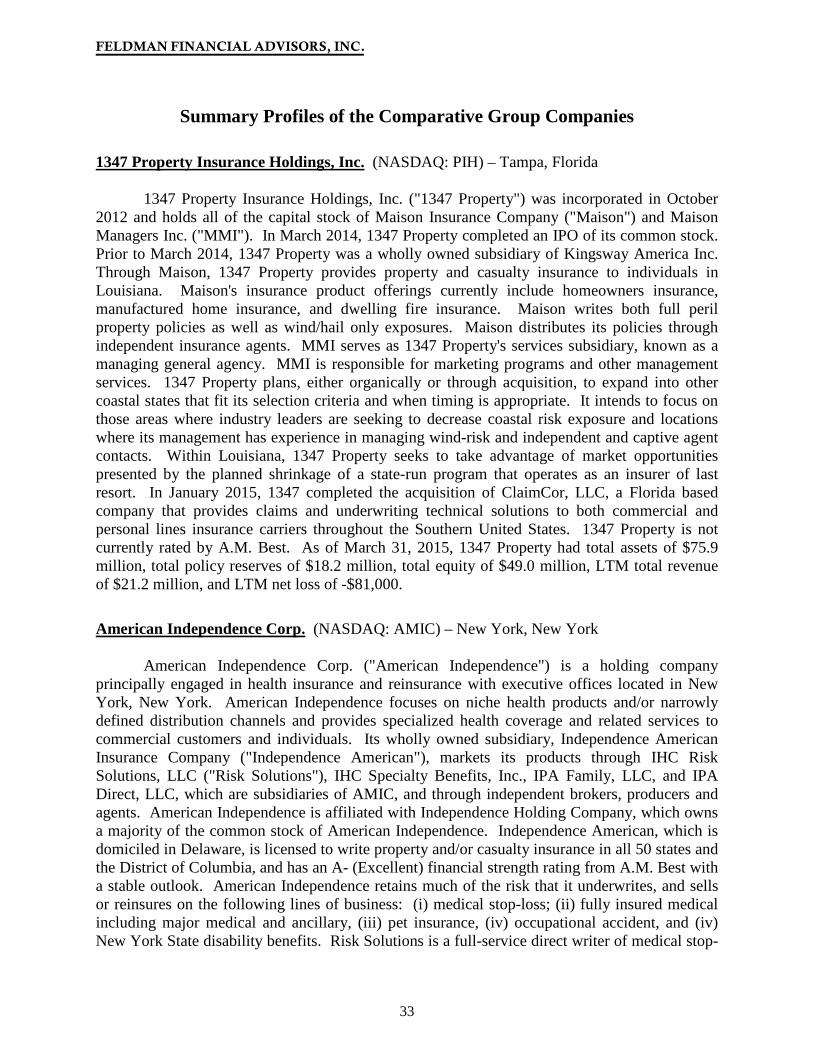
1347 Property Insurance Holdings, Inc. (NASDAQ: PIH) – Tampa, Florida 1347 Property Insurance Holdings, Inc. ("1347 Property") was incorporated in October 2012 and holds all of the capital stock of Maison Insurance Company ("Maison") and Maison Managers Inc. ("MMI"). In March 2014, 1347 Property completed an IPO of its common stock. Prior to March 2014, 1347 Property was a wholly owned subsidiary of Kingsway America Inc. Through Maison, 1347 Property provides property and casualty insurance to individuals in Louisiana. Maison's insurance product offerings currently include homeowners insurance, manufactured home insurance, and dwelling fire insurance. Maison writes both full peril property policies as well as wind/hail only exposures. Maison distributes its policies through independent insurance agents. MMI serves as 1347 Property's services subsidiary, known as a managing general agency. MMI is responsible for marketing programs and other management services. 1347 Property plans, either organically or through acquisition, to expand into other coastal states that fit its selection criteria and when timing is appropriate. It intends to focus on those areas where industry leaders are seeking to decrease coastal risk exposure and locations where its management has experience in managing wind-risk and independent and captive agent contacts. Within Louisiana, 1347 Property seeks to take advantage of market opportunities presented by the planned shrinkage of a state-run program that operates as an insurer of last resort. In January 2015, 1347 completed the acquisition of ClaimCor, LLC, a Florida based company that provides claims and underwriting technical solutions to both commercial and personal lines insurance carriers throughout the Southern United States. 1347 Property is not currently rated by A.M. Best. As of March 31, 2015, 1347 Property had total assets of $75.9 million, total policy reserves of $18.2 million, total equity of $49.0 million, LTM total revenue of $21.2 million, and LTM net loss of -$81,000. American Independence Corp. (NASDAQ: AMIC) – New York, New York American Independence Corp. ("American Independence") is a holding company principally engaged in health insurance and reinsurance with executive offices located in New York, New York. American Independence focuses on niche health products and/or narrowly defined distribution channels and provides specialized health coverage and related services to commercial customers and individuals. Its wholly owned subsidiary, Independence American Insurance Company ("Independence American"), markets its products through IHC Risk Solutions, LLC ("Risk Solutions"), IHC Specialty Benefits, Inc., IPA Family, LLC, and IPA Direct, LLC, which are subsidiaries of AMIC, and through independent brokers, producers and agents. American Independence is affiliated with Independence Holding Company, which owns a majority of the common stock of American Independence. Independence American, which is domiciled in Delaware, is licensed to write property and/or casualty insurance in all 50 states and the District of Columbia, and has an A- (Excellent) financial strength rating from A.M. Best with a stable outlook. American Independence retains much of the risk that it underwrites, and sells or reinsures on the following lines of business: (i) medical stop-loss; (ii) fully insured medical including major medical and ancillary, (iii) pet insurance, (iv) occupational accident, and (iv) New York State disability benefits. Risk Solutions is a full-service direct writer of medical stop-
FELDMAN FINANCIAL ADVISORS, INC.
34
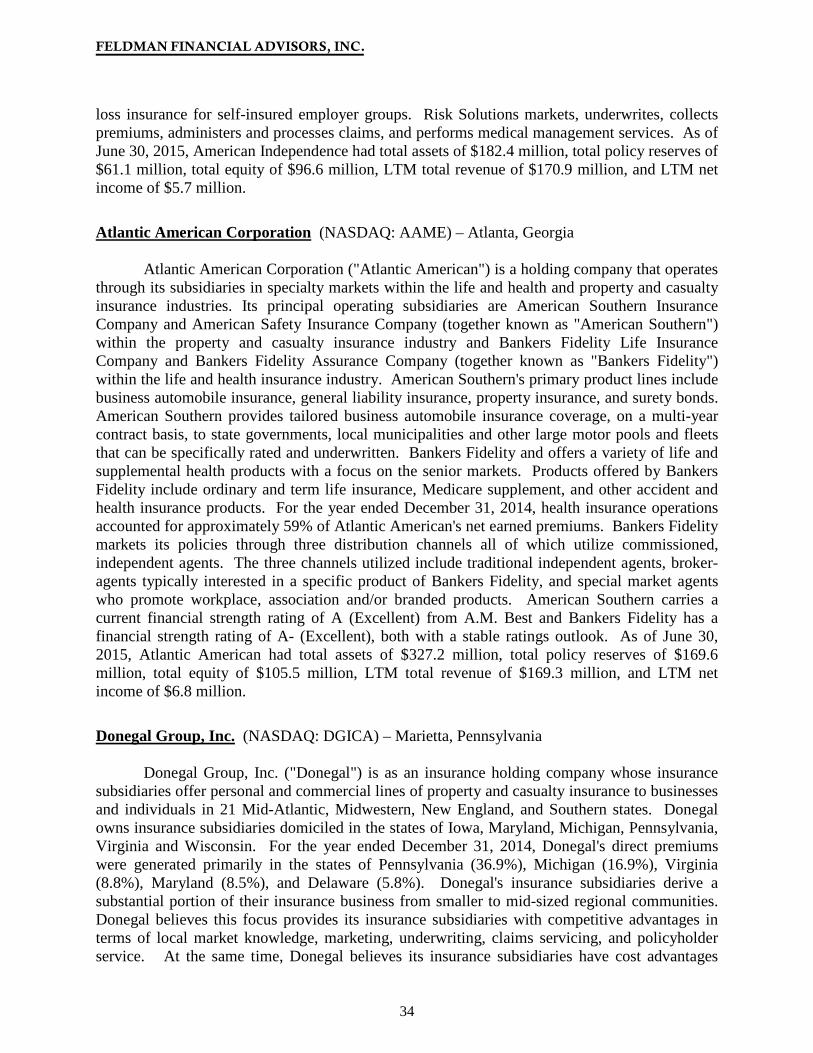
loss insurance for self-insured employer groups. Risk Solutions markets, underwrites, collects premiums, administers and processes claims, and performs medical management services. As of June 30, 2015, American Independence had total assets of $182.4 million, total policy reserves of $61.1 million, total equity of $96.6 million, LTM total revenue of $170.9 million, and LTM net income of $5.7 million.
Atlantic American Corporation (NASDAQ: AAME) – Atlanta, Georgia Atlantic American Corporation ("Atlantic American") is a holding company that operates through its subsidiaries in specialty markets within the life and health and property and casualty insurance industries. Its principal operating subsidiaries are American Southern Insurance Company and American Safety Insurance Company (together known as "American Southern") within the property and casualty insurance industry and Bankers Fidelity Life Insurance Company and Bankers Fidelity Assurance Company (together known as "Bankers Fidelity") within the life and health insurance industry. American Southern's primary product lines include business automobile insurance, general liability insurance, property insurance, and surety bonds. American Southern provides tailored business automobile insurance coverage, on a multi-year contract basis, to state governments, local municipalities and other large motor pools and fleets that can be specifically rated and underwritten. Bankers Fidelity and offers a variety of life and supplemental health products with a focus on the senior markets. Products offered by Bankers Fidelity include ordinary and term life insurance, Medicare supplement, and other accident and health insurance products. For the year ended December 31, 2014, health insurance operations accounted for approximately 59% of Atlantic American's net earned premiums. Bankers Fidelity markets its policies through three distribution channels all of which utilize commissioned, independent agents. The three channels utilized include traditional independent agents, broker-agents typically interested in a specific product of Bankers Fidelity, and special market agents who promote workplace, association and/or branded products. American Southern carries a current financial strength rating of A (Excellent) from A.M. Best and Bankers Fidelity has a financial strength rating of A- (Excellent), both with a stable ratings outlook. As of June 30, 2015, Atlantic American had total assets of $327.2 million, total policy reserves of $169.6 million, total equity of $105.5 million, LTM total revenue of $169.3 million, and LTM net income of $6.8 million.
Donegal Group, Inc. (NASDAQ: DGICA) – Marietta, Pennsylvania Donegal Group, Inc. ("Donegal") is as an insurance holding company whose insurance subsidiaries offer personal and commercial lines of property and casualty insurance to businesses and individuals in 21 Mid-Atlantic, Midwestern, New England, and Southern states. Donegal owns insurance subsidiaries domiciled in the states of Iowa, Maryland, Michigan, Pennsylvania, Virginia and Wisconsin. For the year ended December 31, 2014, Donegal's direct premiums were generated primarily in the states of Pennsylvania (36.9%), Michigan (16.9%), Virginia (8.8%), Maryland (8.5%), and Delaware (5.8%). Donegal's insurance subsidiaries derive a substantial portion of their insurance business from smaller to mid-sized regional communities. Donegal believes this focus provides its insurance subsidiaries with competitive advantages in terms of local market knowledge, marketing, underwriting, claims servicing, and policyholder service. At the same time, Donegal believes its insurance subsidiaries have cost advantages
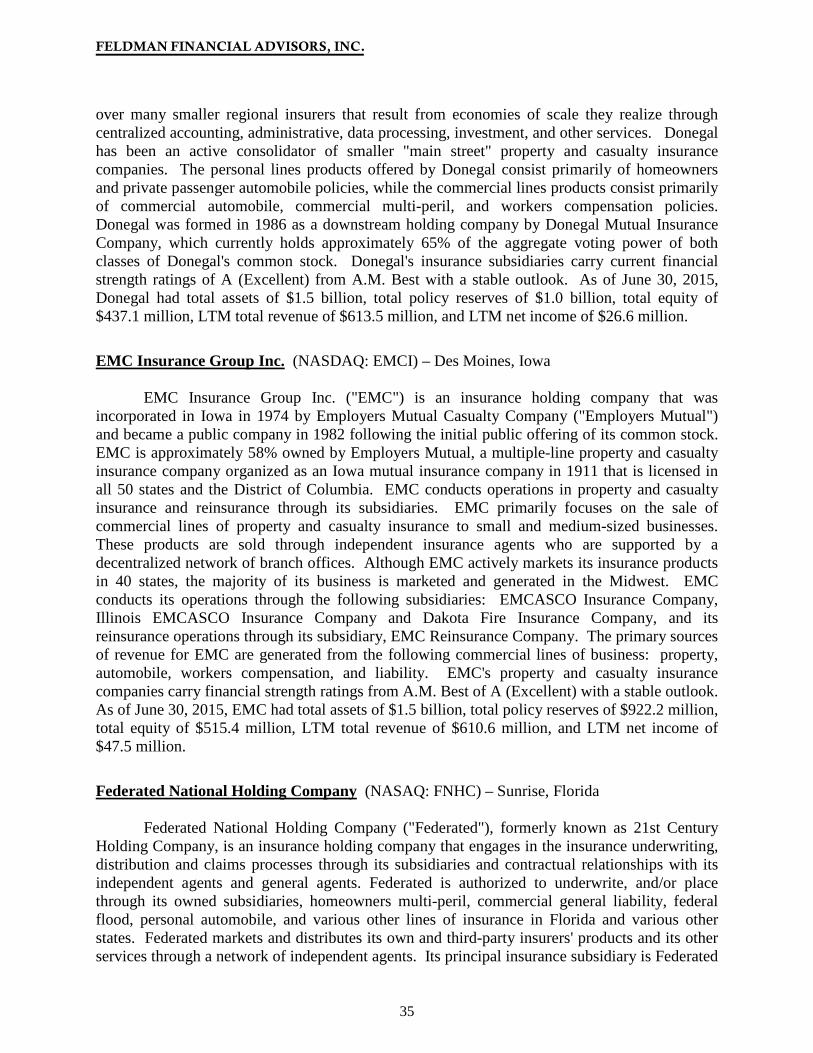
FELDMAN FINANCIAL ADVISORS, INC.
35
over many smaller regional insurers that result from economies of scale they realize through centralized accounting, administrative, data processing, investment, and other services. Donegal has been an active consolidator of smaller "main street" property and casualty insurance companies. The personal lines products offered by Donegal consist primarily of homeowners and private passenger automobile policies, while the commercial lines products consist primarily of commercial automobile, commercial multi-peril, and workers compensation policies. Donegal was formed in 1986 as a downstream holding company by Donegal Mutual Insurance Company, which currently holds approximately 65% of the aggregate voting power of both classes of Donegal's common stock. Donegal's insurance subsidiaries carry current financial strength ratings of A (Excellent) from A.M. Best with a stable outlook. As of June 30, 2015, Donegal had total assets of $1.5 billion, total policy reserves of $1.0 billion, total equity of $437.1 million, LTM total revenue of $613.5 million, and LTM net income of $26.6 million.
EMC Insurance Group Inc. (NASDAQ: EMCI) – Des Moines, Iowa
EMC Insurance Group Inc. ("EMC") is an insurance holding company that was incorporated in Iowa in 1974 by Employers Mutual Casualty Company ("Employers Mutual") and became a public company in 1982 following the initial public offering of its common stock. EMC is approximately 58% owned by Employers Mutual, a multiple-line property and casualty insurance company organized as an Iowa mutual insurance company in 1911 that is licensed in all 50 states and the District of Columbia. EMC conducts operations in property and casualty insurance and reinsurance through its subsidiaries. EMC primarily focuses on the sale of commercial lines of property and casualty insurance to small and medium-sized businesses. These products are sold through independent insurance agents who are supported by a decentralized network of branch offices. Although EMC actively markets its insurance products in 40 states, the majority of its business is marketed and generated in the Midwest. EMC conducts its operations through the following subsidiaries: EMCASCO Insurance Company, Illinois EMCASCO Insurance Company and Dakota Fire Insurance Company, and its reinsurance operations through its subsidiary, EMC Reinsurance Company. The primary sources of revenue for EMC are generated from the following commercial lines of business: property, automobile, workers compensation, and liability. EMC's property and casualty insurance companies carry financial strength ratings from A.M. Best of A (Excellent) with a stable outlook. As of June 30, 2015, EMC had total assets of $1.5 billion, total policy reserves of $922.2 million, total equity of $515.4 million, LTM total revenue of $610.6 million, and LTM net income of $47.5 million. Federated National Holding Company (NASAQ: FNHC) – Sunrise, Florida Federated National Holding Company ("Federated"), formerly known as 21st Century Holding Company, is an insurance holding company that engages in the insurance underwriting, distribution and claims processes through its subsidiaries and contractual relationships with its independent agents and general agents. Federated is authorized to underwrite, and/or place through its owned subsidiaries, homeowners multi-peril, commercial general liability, federal flood, personal automobile, and various other lines of insurance in Florida and various other states. Federated markets and distributes its own and third-party insurers' products and its other services through a network of independent agents. Its principal insurance subsidiary is Federated

FELDMAN FINANCIAL ADVISORS, INC.
36
National Insurance Company ("FNIC"). Through contractual relationships with a network of approximately 3,600 independent agents, of which approximately 1,800 actively sell and service its products, FNIC is authorized to underwrite homeowners, commercial general liability, fire, allied lines, and personal and commercial automobile insurance in Florida. FNIC is licensed as an admitted carrier in Alabama, Louisiana, Georgia, and Texas and underwrites commercial general liability insurance in those states, homeowners insurance in Louisiana and personal automobile insurance in Georgia and Texas. During 2014, 91.4%, 3.3%, 3.3% and 2.0% of the premiums it underwrote were for homeowners, commercial general liability, personal automobile, and federal flood insurance, respectively. Although the homeowners policyholders of FNIC are disbursed throughout Florida, substantially all of them are located in Florida. FNIC is not currently rated by A.M. Best. As of June 30, 2015, Federated had total assets of $601.1 million, total policy reserves of $332.2 million, total equity of $231.4 million, LTM total revenue of $205.7 million, and LTM net income of $37.9 million.
First Acceptance Corporation (NYSE: FAC) – Nashville, Tennessee First Acceptance Corporation ("First Acceptance") is a retailer, servicer, and underwriter of non-standard personal automobile insurance based in Nashville, Tennessee. First Acceptance currently writes non-standard personal automobile insurance in 12 states and is licensed as an insurer in 13 additional states. First Acceptance owns and operates three insurance company subsidiaries: First Acceptance Insurance Company, Inc., First Acceptance Insurance Company of Georgia, Inc., and First Acceptance Insurance Company of Tennessee, Inc. First Acceptance is a vertically integrated business and believes that its business model allows it to identify and satisfy the needs of its target customers and eliminates many of the inefficiencies associated with a non-integrated automobile insurance model. First Acceptance operates over 350 retail locations, staffed with employee-agents. The employee-agents primarily sell non-standard personal automobile insurance products underwritten by First Acceptance as well as certain commissionable ancillary products. In most states, First Acceptance's employee-agents also sell a complementary insurance product providing personal property and liability coverage for renters underwritten by First Acceptance. In addition to its retail locations, First Acceptance is able to complete the entire sales process over the telephone via its call center or through the internet via its consumer-based website or mobile platform. The principal operating subsidiaries of First Acceptance carry current financial strength ratings from A.M. Best of B (Fair) with a stable outlook. As of June 30, 2015, First Acceptance had total assets of $387.0 million, total policy reserves of $191.4 million, total equity of $106.8 million, LTM total revenue of $289.3 million, and LTM net income of $24.9 million. Hallmark Financial Services, Inc. (NASDAQ: HALL) – Fort Worth, Texas
Hallmark Financial Services, Inc. ("Hallmark") is a diversified property and casualty insurance group that serves businesses and individuals in specialty and niche markets. Hallmark offers standard commercial insurance, specialty commercial insurance, and personal insurance in selected market subcategories that are characteristically low-severity and predominately short-tailed risks. Hallmark markets, distributes, underwrites and services property and casualty insurance products primarily through five business units, each of which has a specific focus. The standard commercial P&C business unit primarily handles standard commercial insurance and
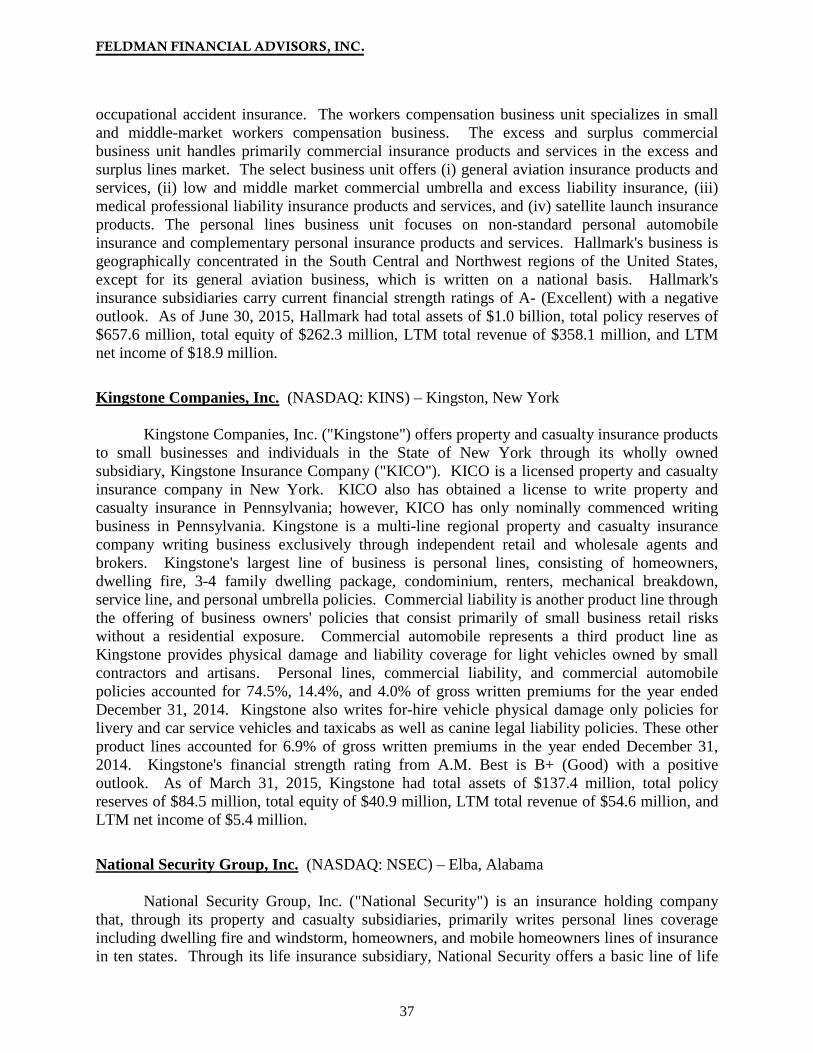
FELDMAN FINANCIAL ADVISORS, INC.
37
occupational accident insurance. The workers compensation business unit specializes in small and middle-market workers compensation business. The excess and surplus commercial business unit handles primarily commercial insurance products and services in the excess and surplus lines market. The select business unit offers (i) general aviation insurance products and services, (ii) low and middle market commercial umbrella and excess liability insurance, (iii) medical professional liability insurance products and services, and (iv) satellite launch insurance products. The personal lines business unit focuses on non-standard personal automobile insurance and complementary personal insurance products and services. Hallmark's business is geographically concentrated in the South Central and Northwest regions of the United States, except for its general aviation business, which is written on a national basis. Hallmark's insurance subsidiaries carry current financial strength ratings of A- (Excellent) with a negative outlook. As of June 30, 2015, Hallmark had total assets of $1.0 billion, total policy reserves of $657.6 million, total equity of $262.3 million, LTM total revenue of $358.1 million, and LTM net income of $18.9 million.
Kingstone Companies, Inc. (NASDAQ: KINS) – Kingston, New York Kingstone Companies, Inc. ("Kingstone") offers property and casualty insurance products to small businesses and individuals in the State of New York through its wholly owned subsidiary, Kingstone Insurance Company ("KICO"). KICO is a licensed property and casualty insurance company in New York. KICO also has obtained a license to write property and casualty insurance in Pennsylvania; however, KICO has only nominally commenced writing business in Pennsylvania. Kingstone is a multi-line regional property and casualty insurance company writing business exclusively through independent retail and wholesale agents and brokers. Kingstone's largest line of business is personal lines, consisting of homeowners, dwelling fire, 3-4 family dwelling package, condominium, renters, mechanical breakdown, service line, and personal umbrella policies. Commercial liability is another product line through the offering of business owners' policies that consist primarily of small business retail risks without a residential exposure. Commercial automobile represents a third product line as Kingstone provides physical damage and liability coverage for light vehicles owned by small contractors and artisans. Personal lines, commercial liability, and commercial automobile policies accounted for 74.5%, 14.4%, and 4.0% of gross written premiums for the year ended December 31, 2014. Kingstone also writes for-hire vehicle physical damage only policies for livery and car service vehicles and taxicabs as well as canine legal liability policies. These other product lines accounted for 6.9% of gross written premiums in the year ended December 31, 2014. Kingstone's financial strength rating from A.M. Best is B+ (Good) with a positive outlook. As of March 31, 2015, Kingstone had total assets of $137.4 million, total policy reserves of $84.5 million, total equity of $40.9 million, LTM total revenue of $54.6 million, and LTM net income of $5.4 million. National Security Group, Inc. (NASDAQ: NSEC) – Elba, Alabama National Security Group, Inc. ("National Security") is an insurance holding company that, through its property and casualty subsidiaries, primarily writes personal lines coverage including dwelling fire and windstorm, homeowners, and mobile homeowners lines of insurance in ten states. Through its life insurance subsidiary, National Security offers a basic line of life

FELDMAN FINANCIAL ADVISORS, INC.
38
and health and accident insurance products in six states. Property and casualty insurance is the most significant segment accounting for 89% of total premium revenues in 2013 and is conducted through National Security Fire & Casualty Company ("NSFC") and Omega One Insurance Company ("Omega"). NSFC is licensed to write insurance in the states of Alabama, Arkansas, Florida, Georgia, Kentucky, Mississippi, Oklahoma, South Carolina, Tennessee and West Virginia. Omega is licensed to write insurance in Alabama and Louisiana. Another subsidiary, National Security Insurance Company, conducts the life insurance business. Dwelling fire and homeowners, collectively referred to as the dwelling property line of business, is the largest segment of property and casualty operations composing 96% of total property and casualty premium revenue. National Security focuses on providing niche insurance products within the markets it serves. National Security ranks in the top twenty dwelling property insurance carriers in its two largest states, Alabama and Mississippi. However, due to the large concentration of business among the top five carriers, its total combined market share in these two states is less than 2%. NSFC and Omega products are marketed through a network of independent agents and brokers, who are independent contractors and generally maintain relationships with one or more competing insurance companies. National Security's property and casualty companies currently carry an A.M. Best group financial strength rating of B++ (Good) with a stable outlook. As of March 31, 2015, National Security had total assets of $147.0 million, total policy reserves of $75.6 million, total equity of $44.2 million, LTM total revenue of $65.7 million, and LTM net income of $7.9 million. Unico American Corporation (NASDAQ: UNAM) – Woodland Hills, California Unico American Corporation ("Unico American") is an insurance holding company that underwrites property and casualty insurance through its insurance company subsidiary; provides property, casualty, and health insurance through its agency subsidiaries; and provides insurance premium financing and membership association services through its other subsidiaries. The insurance company operation is conducted through Crusader Insurance Company ("Crusader"), which is a multiple line P&C insurance company that began transacting business on January 1, 1985. Since 2004, all Crusader business has been written in the state of California. During the year ended December 31, 2014, approximately 98% of Crusader's business was commercial multiple peril policies. Commercial multiple peril policies provide a combination of property and liability coverage for businesses. Commercial property coverage insures against loss or damage to buildings, inventory and equipment from natural disasters, including hurricanes, windstorms, hail, water, explosions, severe winter weather, and other events such as theft and vandalism, fires, storms, and financial loss due to business interruption resulting from covered property damage. However, Crusader does not write earthquake coverage. In addition to commercial multiple peril policies, Crusader also writes separate policies to insure commercial property and commercial liability risks on a mono-line basis. Crusader is domiciled in California and is licensed as an admitted insurance carrier in the states of Arizona, California, Nevada, Oregon, and Washington. Unico American sells its insurance policies through Unifax Insurance Systems, Inc., Crusader's sister corporation and exclusive general agent. All policies are produced by a network of brokers and retail agents. During 2014, Crusader continued to introduce new products as well as product changes such as revised rates, eligibility guidelines, rules and coverage forms. In order to improve service, Crusader is currently customizing and configuring a new policy administration system that is primarily focused upon transacting

FELDMAN FINANCIAL ADVISORS, INC.
39
business through the internet, as well as providing more options to make the brokers' and agents' time more efficient. In November 2014, A.M. Best affirmed the financial strength rating of A- (Excellent) for Crusader with a stable outlook. As of March 31, 2015, Unico American had total assets of $135.6 million, total policy reserves of $60.8 million, total equity of $71.4 million, LTM total revenue of $30.9 million, and LTM net loss of -$142,000. United Insurance Holdings Corp. (NASDAQ: UIHC) – St. Petersburg, Florida Unted Insurance Holdings Corp. ("United Insurance") serves as the holding company for United Property & Casualty Insurance Company and its affiliated companies ("UPC Insurance"). UPC Insurance is primarily engaged in the residential property and casualty insurance business and currently write policies in Florida, Louisiana, Massachusetts, New Jersey, North Carolina, Rhode Island, South Carolina, and Texas. Its target markets consist of areas where the perceived threat of natural catastrophe has caused large national insurance carriers to reduce their concentration of policies. In such areas, United Insurance believes an opportunity exists for UPC Insurance to write profitable business. UPC Insurance has been operating continuously in Florida since 1999, and has managed its business through various hurricanes, tropical storms, and other weather related events. Homeowners policies and related coverage account for the vast majority of the business that it writes. In 2014, homeowners policies produced written premium of $418.1 million and accounted for 96% of total written premium. In addition to homeowners policies, UPC Insurance writes flood policies, which accounted for 3%, and commercial residential policies, which accounted for the remaining 1% of its 2014 written premium. On the flood policies, it earns a commission while retaining no risk of loss, since all such risk is ceded to the federal government via the National Flood Insurance Program. UPC Insurance currently markets and distributes its policies to consumers through over 4,000 independent agencies. Approximately 69% of its policies in-force as of December 31, 2014 were in Florida. United Insurance is not currently rated by A.M. Best. As of June 30, 2015, United Insurance had total assets of $789.7 million, total policy reserves of $339.8 million, total equity of $219.5 million, LTM total revenue of $312.7 million, and LTM net income of $25.5 million.

FELDMAN FINANCIAL ADVISORS, INC.
40
Recent Financial Comparisons
Table 5 summarizes certain key financial comparisons between PCA and the
Comparative Group. Financial data for PCA, the Comparative Group, and the Public P&C/
Multiline Group are shown as of or for the LTM ended June 30, 2015. The Public P&C/
Multiline Group includes all the companies presented in Exhibit IV.
PCA's total assets of $55.8 million as of June 30, 2015 measured below the Comparative
Group median and mean of $357.1 million and $572.1 million, respectively. There are five
companies in the Comparative Group with total assets less than $200 million. Overall, the
Comparative Group includes seven companies with total assets less than $500 million, two
companies with assets of $500 million to $1 billion, and three companies with assets between $1
billion and $1.6 billion. The median asset size of the Public P&C/Multiline Group was much
larger at $4.6 billion based on the latest financial data as of June 30, 2015.
The P&C insurance industry is a highly competitive business in the areas of price,
coverage, and service. The P&C industry includes insurers ranging from large companies
offering a wide variety of products worldwide to smaller, specialized companies in a single state
or region offering only a single product. Smaller insurance companies may find themselves
competing with many insurance companies of substantially greater financial resources, more
advanced technology, larger volumes of business, more diversified insurance coverage, broader
ranges of projects, and higher ratings. Competition centers not only on the sale of products to
customers, but also on the recruitment and retention of qualified agents and producers. Large
national insurers may have certain competitive advantages over smaller regional companies,
including increased name recognition, increased loyalty of their customer base, greater
efficiencies and economies of scale and reduced policy acquisition costs.

FELDMAN FINANCIAL ADVISORS, INC.
41
PCA's ratio of total policy reserves to total equity measured 2.19x, evidencing both its
historical capital position and utilization of underwriting leverage. The Comparative Group
median and mean ratios of policy reserves to equity were 1.66x and 1.55x, respectively. Among
the Comparative Group, Hallmark Financial Services, Donegal Group, and Kingstone
Companies displayed ratios in range of PCA's ratio at 2.51x, 2.29x, and 2.07x, respectively.
Correspondingly, Hallmark, Donegal, and Kingstone also exhibited lower equity capital ratios at
20.53%, 28.46%, and 28.68% of total assets, respectively, similar to PCA's equity capital ratio of
23.28%. Overall, PCA's capital ratios were lower than those of the Comparative Group and
those of the Public P&C/Multiline Group aggregate. As of June 30, 2015, the Comparative
Group median and mean ratios of equity to assets were 31.16% and 37.01%, respectively, while
the Public P&C/Multiline Group median and mean equity capital ratios were slightly lower at
28.14% and 28.78%, respectively.
PCA's ratio of cash and investments to total assets was 89.0% as of June 30, 2015, and
was positioned above the Comparative Group median and mean ratios of 71.2% and 72.1%,
respectively. PCA's higher concentration of invested assets reflected comparatively lower levels
of receivables in the form of reinsurance receivables and premium receivables. PCA's premium
income levels and reinsurance activity have stagnated over the past four years. PCA's total
assets decreased by 4.9% over the LTM period ended June 30, 2015, whereas the Comparative
Group reflected median and mean asset growth rates of 8.8% and 18.6% for the corresponding
period. Most members of the Comparative Group experienced moderate asset growth over the
past year, while a few reported significant asset increases due to a stock offering (1347
Property), business expansion spurred by a corporate acquisition (United Insurance), and
increases in total revenue and net income (Federated and First Acceptance).
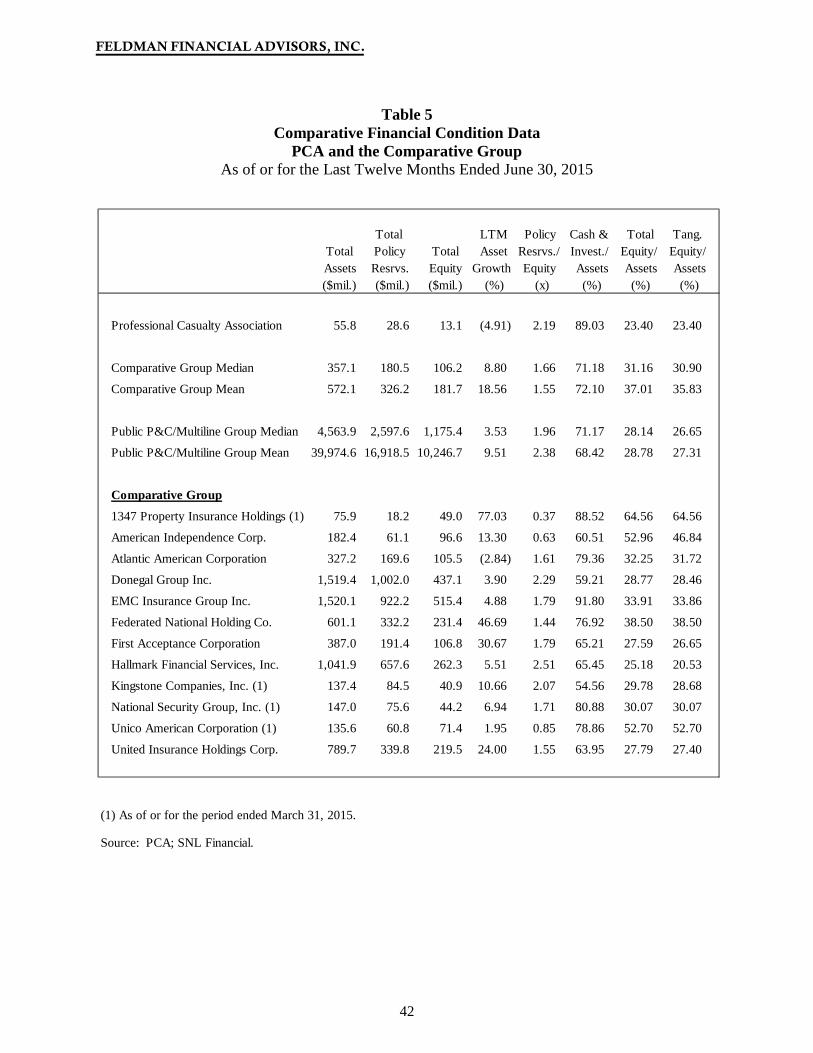
FELDMAN FINANCIAL ADVISORS, INC.
42
Table 5 Comparative Financial Condition Data
PCA and the Comparative Group As of or for the Last Twelve Months Ended June 30, 2015
Total LTM Policy Cash & Total Tang. Total Policy Total Asset Resrvs./ Invest./ Equity/ Equity/Assets Resrvs. Equity Growth Equity Assets Assets Assets($mil.) ($mil.) ($mil.) (%) (x) (%) (%) (%)
Professional Casualty Association 55.8 28.6 13.1 (4.91) 2.19 89.03 23.40 23.40
Comparative Group Median 357.1 180.5 106.2 8.80 1.66 71.18 31.16 30.90
Comparative Group Mean 572.1 326.2 181.7 18.56 1.55 72.10 37.01 35.83
Public P&C/Multiline Group Median 4,563.9 2,597.6 1,175.4 3.53 1.96 71.17 28.14 26.65
Public P&C/Multiline Group Mean 39,974.6 16,918.5 10,246.7 9.51 2.38 68.42 28.78 27.31
Comparative Group
1347 Property Insurance Holdings (1) 75.9 18.2 49.0 77.03 0.37 88.52 64.56 64.56
American Independence Corp. 182.4 61.1 96.6 13.30 0.63 60.51 52.96 46.84
Atlantic American Corporation 327.2 169.6 105.5 (2.84) 1.61 79.36 32.25 31.72
Donegal Group Inc. 1,519.4 1,002.0 437.1 3.90 2.29 59.21 28.77 28.46
EMC Insurance Group Inc. 1,520.1 922.2 515.4 4.88 1.79 91.80 33.91 33.86
Federated National Holding Co. 601.1 332.2 231.4 46.69 1.44 76.92 38.50 38.50
First Acceptance Corporation 387.0 191.4 106.8 30.67 1.79 65.21 27.59 26.65
Hallmark Financial Services, Inc. 1,041.9 657.6 262.3 5.51 2.51 65.45 25.18 20.53
Kingstone Companies, Inc. (1) 137.4 84.5 40.9 10.66 2.07 54.56 29.78 28.68
National Security Group, Inc. (1) 147.0 75.6 44.2 6.94 1.71 80.88 30.07 30.07
Unico American Corporation (1) 135.6 60.8 71.4 1.95 0.85 78.86 52.70 52.70
United Insurance Holdings Corp. 789.7 339.8 219.5 24.00 1.55 63.95 27.79 27.40
(1) As of or for the period ended March 31, 2015.
Source: PCA; SNL Financial.
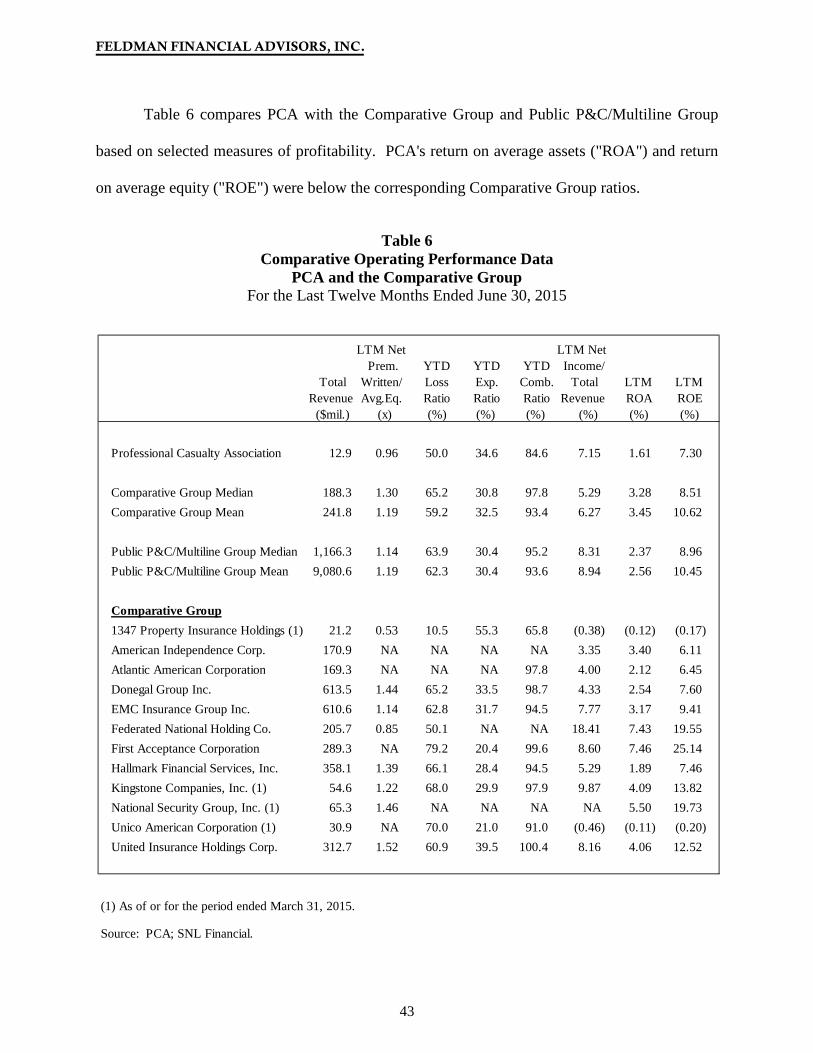
FELDMAN FINANCIAL ADVISORS, INC.
43
Table 6 compares PCA with the Comparative Group and Public P&C/Multiline Group
based on selected measures of profitability. PCA's return on average assets ("ROA") and return
on average equity ("ROE") were below the corresponding Comparative Group ratios.
Table 6 Comparative Operating Performance Data
PCA and the Comparative Group For the Last Twelve Months Ended June 30, 2015
LTM Net LTM NetPrem. YTD YTD YTD Income/
Total Written/ Loss Exp. Comb. Total LTM LTM Revenue Avg.Eq. Ratio Ratio Ratio Revenue ROA ROE ($mil.) (x) (%) (%) (%) (%) (%) (%)
Professional Casualty Association 12.9 0.96 50.0 34.6 84.6 7.15 1.61 7.30
Comparative Group Median 188.3 1.30 65.2 30.8 97.8 5.29 3.28 8.51 Comparative Group Mean 241.8 1.19 59.2 32.5 93.4 6.27 3.45 10.62
Public P&C/Multiline Group Median 1,166.3 1.14 63.9 30.4 95.2 8.31 2.37 8.96 Public P&C/Multiline Group Mean 9,080.6 1.19 62.3 30.4 93.6 8.94 2.56 10.45
Comparative Group1347 Property Insurance Holdings (1) 21.2 0.53 10.5 55.3 65.8 (0.38) (0.12) (0.17) American Independence Corp. 170.9 NA NA NA NA 3.35 3.40 6.11 Atlantic American Corporation 169.3 NA NA NA 97.8 4.00 2.12 6.45 Donegal Group Inc. 613.5 1.44 65.2 33.5 98.7 4.33 2.54 7.60 EMC Insurance Group Inc. 610.6 1.14 62.8 31.7 94.5 7.77 3.17 9.41 Federated National Holding Co. 205.7 0.85 50.1 NA NA 18.41 7.43 19.55 First Acceptance Corporation 289.3 NA 79.2 20.4 99.6 8.60 7.46 25.14 Hallmark Financial Services, Inc. 358.1 1.39 66.1 28.4 94.5 5.29 1.89 7.46 Kingstone Companies, Inc. (1) 54.6 1.22 68.0 29.9 97.9 9.87 4.09 13.82 National Security Group, Inc. (1) 65.3 1.46 NA NA NA NA 5.50 19.73 Unico American Corporation (1) 30.9 NA 70.0 21.0 91.0 (0.46) (0.11) (0.20) United Insurance Holdings Corp. 312.7 1.52 60.9 39.5 100.4 8.16 4.06 12.52
(1) As of or for the period ended March 31, 2015.
Source: PCA; SNL Financial.

FELDMAN FINANCIAL ADVISORS, INC.
44
PCA's ROA for the LTM period ended June 30, 2015 was 1.61% and trailed the
Comparative Group median and mean ROA results of 3.28% and 3.39%, respectively. The
Public P&C/Multiline Group reported median and mean LTM ROA results of 2.37% and 2.56%,
respectively. PCA's ROE for the recent LTM period was 7.30% and lagged the Comparative
Group median and mean ROE results of 8.51% and 10.62%, respectively. PCA's lower
profitability reflects its slim underwriting profits along with an absence of sufficient investment
income or revenue from ancillary business operations to offset the tightening underwriting
margin.
Profitability levels among the Comparative Group companies were led by First
Acceptance, Federated, and National Security with ROA results of 7.46%, 7.43%, and 5.50%,
respectively, and ROE results of 25.14%, 19.55%, and 19.73%, respectively The lower
performers in the Comparative Group based on profitability included 1347 Property and Unico
American net losses and ROA results of -0.12% and -0.11%, respectively. Those companies
reporting positive earnings yet relatively low ROA levels (similar to PCA's profitability)
included Atlantic American, Hallmark, and Donegal with ROA results of 2.12%, 1.89%, and
1.80%, respectively.
PCA's profitability level relative to total revenue compared favorably to the levels
exhibited by the Comparative Group. PCA's 7.15% ratio of net income to total revenue was
positioned slightly ahead of the Comparative Group median and mean of 5.29% and 6.14%,
respectively. However, PCA's written premium generation relative to average equity lagged the
Comparative Group. PCA reported a ratio of 0.96x of net premiums written to average equity
versus the Comparative Group median and mean of 1.30x and 1.19x, respectively. As mentioned
earlier, PCA's net premiums written have not increased over the past five years.

FELDMAN FINANCIAL ADVISORS, INC.
45
IV. MARKET VALUE ADJUSTMENTS
General Overview
This concluding chapter of the Appraisal identifies certain adjustments to PCA's
estimated pro forma market value relative to the Comparative Group. The adjustments discussed
in this chapter are made from the viewpoints of potential investors, which would include
policyholders and other eligible individuals with subscription rights and unrelated parties who
might purchase stock in a community or syndicated offering. It is assumed that these potential
investors are aware of all relevant and necessary facts as they would pertain to the value of PCA
relative to other publicly traded insurance companies and relative to alternative investments.
Our appraised value is predicated on a continuation of the current operating environment
for PCA and insurance companies in general. Changes in PCA's operating performance along
with changes in the regional and national economies, the stock market, interest rates, the
regulatory environment, and other external factors may occur from time to time, often with great
unpredictability, which could impact materially the pro forma market value of PCA or the
trading market values of insurance company stocks in general. Therefore, the Valuation Range
provided herein is subject to a more current re-evaluation prior to the actual completion of the
Conversion.
In addition to the comparative operating fundamentals discussed in prior chapters, it is
important to address additional market value adjustments based on certain financial and other
criteria, which include, among other factors:
(1) Earnings Prospects (2) Management (3) Liquidity of the Issue (4) Subscription Interest

FELDMAN FINANCIAL ADVISORS, INC.
46
(5) Stock Market Conditions (6) New Issue Discount
Earnings Prospects
Earnings prospects are dependent upon the ability to grow revenue and control expenses
and the effectiveness of managing the combined ratio (ratio of loss and operating expenses to net
premiums earned). PCA's revenue is generated primarily from net premiums earned, net
investment income, and net realized investments gains or losses. PCA's expenses mainly
comprise losses and loss adjustment expenses, policy acquisition costs, and other general and
administrative expenses. PCA's revenue growth is affected by various factors, including
competitive pricing, agent relationships, product strategy, business development, customer
service and client retention, reinsurance arrangements, and investment performance. PCA's
operating efficiency affects the degree to which it can profitably leverage its distribution system
and cost infrastructure. Many of the earnings challenges faced by PCA are systemic to smaller
insurers that lack economies of scale, diverse distribution channels, geographic diversity, or
enhanced technological resources.
PCA has experienced stagnating premium growth over the past five years. The MPL
industry is currently operating under soft market conditions both nationally and in Pennsylvania
as a result of abundant capacity, with significant competition and pressure on premium rates
following several years of overall favorable claims trends. During 2008 through 2014, premium
rates declined in PCA's core Pennsylvania market, primarily as a result of improved claims
frequency, and premium rates have remained relatively level in 2015. As discussed earlier, PCA
competes with MPL specialty insurers and alternative risk arrangements, as well as other large
national P&C insurance companies that write MPL insurance. These competitors include
companies that have substantially greater financial resources and a solid A.M. Best financial

FELDMAN FINANCIAL ADVISORS, INC.
47
strength rating that is lacking by PCA. Furthermore, PCA does not have the capital to engage in
long-term price competition with some of its competitors or support aggressive geographic and
product diversification.
The uncertainties surrounding the ultimate success of PCA's recent strategic initiatives to
increase revenue and earnings place PCA at a disadvantage with regard to the Comparative
Group, which overall is reporting substantially higher levels of profitability. We therefore
believe that, given PCA's recent earnings trends and the restrained ability to generate substantial
improvements in its profitability over the near term, a downward adjustment is warranted for
PCA's earnings prospects with respect to the Comparative Group.
Management
Management's principal challenges are to implement strategic objectives, generate
revenue growth, control operating costs, and monitor asset quality and underwriting risks while
PCA competes in the highly competitive P&C insurance industry. The challenges facing PCA in
attempting to generate improvements in profitability and enhance its competitiveness are
paramount because of the inherent competitive disadvantages faced by smaller specialty insurers
in general and specifically, with respect to PCA, companies that have a recent operating history
of capital erosion and negative earnings.
We believe that investors will take into account that PCA is professionally managed by a
team of experienced insurance executives that has focused extensively on and gained a wealth of
knowledge and expertise in PCA's specialty niche market. PCA has emphasized its historical
operating strengths in attempting to cultivate and maintain a loyal client base. We also note that
investors will likely rely upon top-line premium growth and bottom-line earnings results as the

FELDMAN FINANCIAL ADVISORS, INC.
48
means of evaluating the future performance of management. Based on these considerations, we
believe no adjustment is warranted based on management.
Liquidity of the Issue
All of the 12 members of the Comparative Group are traded on major stock exchanges.
Eleven companies are listed on the NASDAQ Global Market and one company (First
Acceptance) is traded on the New York Stock Exchange. As of August 11, 2015, the market
capitalizations of the Comparative Group reflected a median of $104.2 million and ranged from
$35.5 million for National Security Group to $468.8 million for EMC Insurance Group.
Included among the Comparative Group were four companies with a current market
capitalization under $60 million. In contrast, the median market capitalization for the Public
P&C/Multiline Group was $1.6 billion as of August 11, 2015.
The development of a public market having the desirable characteristics of depth,
liquidity, and orderliness depends upon the presence in the marketplace of a sufficient number of
willing buyers and sellers at any given time and the existence of market makers to facilitate stock
trade transactions. Given the estimated range of PCA's pro forma market value, it is highly
uncertain that an active and liquid trading market for its shares could develop or that PCA would
have qualified for and maintained listing requirements on a major stock exchange.
As of August 11, 2015, the lowest market capitalizations reported by a public insurance
company listed on a major exchange were $35.5 million, $48.7 million, $49.0 million, and $56.0
million for National Security, 1347 Property, Unico American, and Kingstone -- all of which are
traded on NASDAQ and included in the Comparative Group. The lowest market capitalization
reported by a public insurance company not listed on a major exchange but instead quoted on the
over-the-counter securities market as of August 11, 2015 was $22.3 million for the life and

FELDMAN FINANCIAL ADVISORS, INC.
49
health insurer, Investors Heritage Capital Corporation (exclusive of companies that had closing
stock prices below $1.00 and have been experiencing severe financial deterioration). We
recognize that companies with lower levels of market capitalization tend to experience restrained
trading volumes and frequent price volatility due to limited shares outstanding and other factors.
Such issues may not have access to a major stock exchange having the desirable characteristics
of depth, liquidity, and orderliness. Therefore, we believe that at the present time a downward
adjustment is necessary to address these collective factors.
Subscription Interest
While mutual-to-stock conversions are commonplace in the savings institution industry,
such conversions and demutualizations are less common in the insurance industry. In recent
years, IPOs of savings institution stocks have attracted a great deal of investor interest and this
speculative fervor continued through 2014 and 2015. In contrast, since 2000 there have only
been a handful of insurance company demutualization transactions utilizing a subscription rights
offering (including stand-alone or sponsor-affiliation transactions).
In connection with the Conversion, policyholders and named insureds of PCA, along with
directors, officers and employees of PTP, will be offered subscription rights to purchase shares
of common stock in the Offering. At the present time, we are not aware of any particular
marketing factors or transaction circumstances that would suggest either an overwhelming or
suppressed level of interest in purchasing shares in the Conversion. Therefore, absent actual
results from the subscription phase of the Offering, we do not believe that any adjustment is
necessary at this juncture.

FELDMAN FINANCIAL ADVISORS, INC.
50
Stock Market Conditions
Table 7 summarizes the recent performance of various insurance stock indexes
maintained by SNL Financial, along with selected industry and broad market indexes. The SNL
Insurance Index of all publicly traded insurance companies increased 20.9% in the past year
through August 11, 2015. The SNL Insurance Index outperformed the broader markets indexes
as reflected by the Dow Jones Industrials Average ("DJIA") increasing 5.0% and the Standard &
Poor's ("S&P") 500 Stock Index advancing 7.6%. Over the past three years ended August 11,
2015, the SNL Insurance Index was up 87.4%, while the DJIA had increased 31.8% and the S&P
500 advanced 48.2%. The SNL P&C Index and the S&P 500 P&C Index also outperformed the
broader indexes, increasing by 63.6% and 70.0%, respectively, over the prior three-year period.
Financial stocks have performed well in the economic recovery and insurance stocks
have participated fully in this sustained market rally. A number of announced acquisitions of
insurance companies have contributed to the sustained performance of insurance stocks thus far
in 2015. In the year-to-date periods, announced acquisition targets such as Cigna Corporation,
Chubb Corporation, Humana Inc., and StanCorp Financial Group have registered notable price
gains. However, as shown in Table 7, smaller insurance companies have not experienced the
robust stock price appreciation as their larger counterparts. Over the past year through August
11, 2015, the SNL Insurance < $250 Million-Assets Index was down 12.2% and the SNL
Insurance Micro Cap (< $250 Million) Index was down 11.7%.
On a YTD basis through August 11, 2015, the SNL Insurance < $250 Million-Assets
Index had advanced 1.8% and the SNL Insurance Micro Cap Index had declined 14.7%.
Through YTD August 11, 2015, the DJIA was down 2.4% and the S&P 500 was up 1.2%, while
the SNL U.S. Insurance Index had advanced 8.0%.

FELDMAN FINANCIAL ADVISORS, INC.
51
Table 7 Selected Stock Market Index Performance
For the Period Ended August 11, 2015
Index Year- One ThreeValue to-Date Year Years
SNL Insurance IndexesSNL U.S. Insurance 767.57 7.98 20.92 87.44 SNL U.S. Insurance Underwriter 758.75 8.32 21.43 88.99 SNL U.S. Insurance Broker 1,176.96 3.37 13.87 67.01 S&P 500 Insurance 320.41 4.36 13.22 70.42 NASDAQ Insurance 7,165.04 5.58 16.99 60.09 S&P 500 Insurance Brokers 489.72 4.03 15.99 82.30 S&P 500 Multiline Insurance 112.84 9.37 14.80 84.92
SNL Sector IndexesSNL U.S. Insurance Property & Casualty 726.43 4.01 15.81 63.60 SNL U.S. Insurance Multiline 175.34 3.04 16.48 104.53 SNL U.S. Insurance Life & Health 842.71 3.01 7.35 76.70 SNL U.S. Reinsurance 1,001.56 11.90 19.84 68.87 SNL U.S. Managed Care 2,049.99 26.21 54.18 164.39 SNL U.S. Title Insurer 1,587.33 14.40 39.84 127.02 SNL U.S. Mortgage & Financial Guaranty 76.22 (2.50) 11.76 112.19 S&P 500 Property & Casualty 392.63 3.07 18.73 70.01 S&P 500 Life & Health 343.93 2.30 6.80 67.40
SNL Asset Size IndexesSNL U.S. Insurance < $250M 659.36 1.75 (12.19) 14.52 SNL U.S. Insurance $250M-$500M 772.61 9.14 (3.96) 84.49 SNL U.S. Insurance $500M-$1B 690.84 (7.92) 21.38 84.49 SNL U.S. Insurance $1B-$2.5B 1,561.88 0.86 14.53 47.71 SNL U.S. Insurance $2.5B-$10B 1,019.53 13.61 32.57 93.40 SNL U.S. Insurance > $10B 718.52 8.14 20.95 89.20 SNL U.S. Insurance > $1B 788.92 8.35 21.47 89.02 SNL U.S. Insurance < $1B 907.20 (1.74) 11.41 90.14
SNL Market Cap IndexesSNL Micro Cap U.S. Insurance 299.05 (14.73) (11.69) 50.73 SNL Small Cap U.S. Insurance 747.27 (8.36) 3.73 52.42 SNL Mid Cap U.S. Insurance 598.52 8.22 23.01 95.04 SNL Large Cap U.S. Insurance 700.05 8.52 21.59 90.46
Broad Market IndexesDow Jones Industrials Average 17,402.84 (2.36) 5.03 31.76 S&P 500 2,084.07 1.22 7.60 48.24 S&P Mid-Cap 1,496.14 3.01 7.97 55.53 S&P Small-Cap 704.68 1.38 7.14 56.02 S&P 500 Financials 338.78 1.64 12.38 68.58 NASDAQ 5,036.79 6.35 14.44 66.73 NASDAQ Financials 3,350.46 6.63 12.92 56.05
Source: MSCI; SNL Financial.
Percent Change (%)

FELDMAN FINANCIAL ADVISORS, INC.
52
Strengthening fundamentals in the overall insurance industry have included fortified
capital positions, improved product pricing, and increased demand for products as consumers
and businesses accumulate additional cash flow in the rebounding economy. Insurance industry
earnings have been challenged by the low interest rate environment, which has restrained the
growth of investment income. Additionally, pricing on policies has been decelerating,
particularly for commercial lines of insurance. The expansion of regulatory reform from the
banking industry to other financial services industries, such as insurance companies and asset
managers has led to increased costs for compliance, controls, and regulatory systems.
While P&C insurers historically have been very volatile due to cyclical market conditions
and catastrophic losses, the stock performance of these issues has evidenced lesser volatility.
The industry's improved capital position provides a solid buffer against catastrophic losses. The
valuation support for many P&C companies will focus on incremental additions to book value
from stable earnings and capital deployment strategies such as leverage, mergers, dividend
payments, and share repurchases to provide price momentum going forward. Viewing the
broader trends, the overall health of the industry, which endured significant pricing pressure and
reduced exposure since the latest recession, has recently improved with the stepped-up macro
economy. While encountering short term resistance to premium rate increases, the industry may
be poised to experience margin expansion. Although a more competitive pricing environment is
expected to impact insurers' ability to raise premium rates, the overall operating climate is
projected to remain stable and therefore we believe no specific adjustment is necessary.
New Issue Discount
A "new issue" discount that reflects investor concerns and investment risks inherent in all
IPOs is a factor to be considered for purposes of valuing companies converting from mutual to

FELDMAN FINANCIAL ADVISORS, INC.
53
stock form. The magnitude of the new issue discount typically expands during periods of
declining stock prices as investors require larger inducements, and narrows during stronger
market conditions. The necessity to build a new issue discount into the stock price of a
converting insurance company continues to prevail in recognition of the uncertainty among
investors as a result of the lack of a seasoned trading history for the converting company, its
operation in an intensely competitive industry, underlying concerns regarding business cycle and
interest rate trends, volatility in the stock market, and intensifying competition and product
marketing in the insurance marketplace. We therefore believe that a new issue discount is
reasonable and necessary in the pricing of PCA's pro forma market value.
Adjustments Conclusion
PCA's pro forma valuation should be discounted relative to the Comparative Group
because of earning prospects, liquidity of the issue, and the new issue discount. Individual
discounts and premiums are not necessarily additive and may, to some extent, offset or overlay
each other. On the whole, we conclude that PCA's pro forma valuation should be discounted
relative to the Comparative Group. It is the role of the appraiser to balance the relative dynamics
of price-to-book and price-to-earnings discounts and premiums. We have concluded that a
discount of approximately 35% to 45% based on the price-to-book valuation metric is reasonable
and appropriate for determining PCA's pro forma Valuation Range relative to the Comparative
Group's trading ratios.
Valuation Approach
In determining the estimated pro forma market value of PCA, we have employed the
comparative market valuation approach and considered the following pricing ratios: price-to-
book value per share ("P/B"), price-to-tangible book value per share ("P/TB"), and price-to-

FELDMAN FINANCIAL ADVISORS, INC.
54
earnings per share ("P/E"). Table 8 displays the trading market price valuation ratios of the
Comparative Group as of August 11, 2015. Exhibit V displays the pro forma assumptions and
calculations utilized in analyzing PCA's valuation ratios. In reaching our conclusions of the
Valuation Range, we evaluated the relationship of PCA's pro forma valuation ratios relative to
the Comparative Group's market valuation data.
Investors continue to make decisions to buy or sell P&C insurance company stocks based
upon consideration of P/E and P/B comparisons. The P/E ratio is an important valuation ratio in
the current insurance stock environment. However, PCA's uneven earnings performance renders
the comparative P/E approach somewhat less emphasis. Thus, the comparative P/B approach
takes on significant meaning as a valuation metric.
As of August 11, 2015, the median P/B ratio for the Comparative Group was 92.0% and
the mean was 102.7%. In comparison, the Public P&C/Multiline Group median and mean P/B
ratios were positioned higher at 129.2% and 154.8%, respectively. In consideration of the
foregoing analysis along with the additional adjustments discussed in this chapter, we have
determined a pro forma midpoint P/B ratio of 54.5% for PCA, which reflects an aggregate
midpoint value of $14.0 million based on the assumptions summarized in Exhibit V. Applying a
range of value of 15% above and below the midpoint, the resulting minimum of $11.9 million
reflects a P/B ratio of 50.5% and the resulting maximum of $16.1 million reflects a P/B ratio of
58.0%. To price a converting company such as PCA at 90% of pro forma book value, because of
the arithmetic of the calculation, would require very large increases in valuations and produce
very marginal returns on equity. This would likely produce price declines in aftermarket trading.
Accordingly, IPOs of converting insurance companies and savings institutions continue to be
priced at substantial discounts to comparable publicly traded companies.
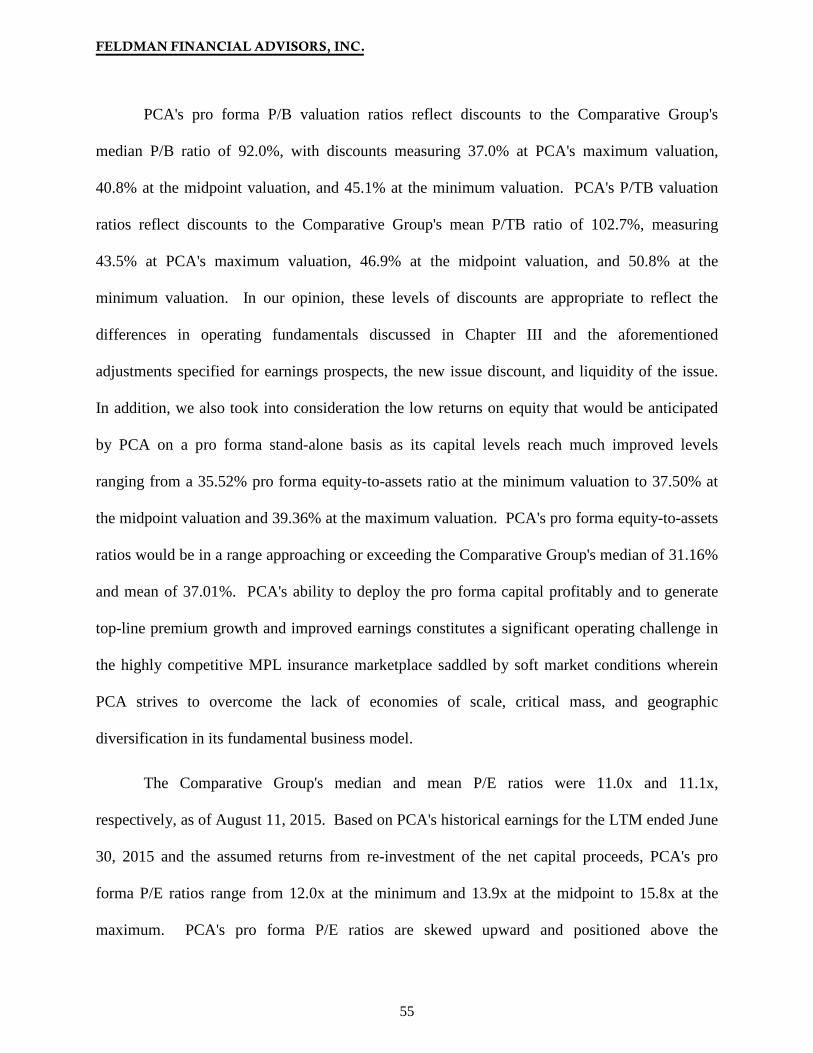
FELDMAN FINANCIAL ADVISORS, INC.
55
PCA's pro forma P/B valuation ratios reflect discounts to the Comparative Group's
median P/B ratio of 92.0%, with discounts measuring 37.0% at PCA's maximum valuation,
40.8% at the midpoint valuation, and 45.1% at the minimum valuation. PCA's P/TB valuation
ratios reflect discounts to the Comparative Group's mean P/TB ratio of 102.7%, measuring
43.5% at PCA's maximum valuation, 46.9% at the midpoint valuation, and 50.8% at the
minimum valuation. In our opinion, these levels of discounts are appropriate to reflect the
differences in operating fundamentals discussed in Chapter III and the aforementioned
adjustments specified for earnings prospects, the new issue discount, and liquidity of the issue.
In addition, we also took into consideration the low returns on equity that would be anticipated
by PCA on a pro forma stand-alone basis as its capital levels reach much improved levels
ranging from a 35.52% pro forma equity-to-assets ratio at the minimum valuation to 37.50% at
the midpoint valuation and 39.36% at the maximum valuation. PCA's pro forma equity-to-assets
ratios would be in a range approaching or exceeding the Comparative Group's median of 31.16%
and mean of 37.01%. PCA's ability to deploy the pro forma capital profitably and to generate
top-line premium growth and improved earnings constitutes a significant operating challenge in
the highly competitive MPL insurance marketplace saddled by soft market conditions wherein
PCA strives to overcome the lack of economies of scale, critical mass, and geographic
diversification in its fundamental business model.
The Comparative Group's median and mean P/E ratios were 11.0x and 11.1x,
respectively, as of August 11, 2015. Based on PCA's historical earnings for the LTM ended June
30, 2015 and the assumed returns from re-investment of the net capital proceeds, PCA's pro
forma P/E ratios range from 12.0x at the minimum and 13.9x at the midpoint to 15.8x at the
maximum. PCA's pro forma P/E ratios are skewed upward and positioned above the

FELDMAN FINANCIAL ADVISORS, INC.
56
Comparative Group's ratios as a result of the much lower earnings level exhibited by PCA. As
discussed earlier, the challenge confronting PCA is to redeploy and leverage the additional
equity capital to produce meaningful increases in earnings.
Based on the price-to-assets ("P/A") measure, PCA's midpoint valuation of $14.0 million
reflects a P/A ratio of 20.45%, ranging from 17.94% at the minimum to 22.82% at the maximum.
In contrast, the Comparative Group exhibited median and mean P/A ratios of 33.93% and
37.12%, respectively. Reviewing another valuation metric, price-to-total revenue, PCA's pro
forma ratios range from 0.91x at the valuation minimum to 1.23x at the valuation maximum with
a midpoint of 1.07x, which is positioned at a premium to the Comparative Group median and
mean ratios of 0.75x and 0.97x, respectively. PCA's valuation discount on the P/A ratio basis is
further reflective of the fundamental performance gap currently existing between PCA and the
overall Comparative Group, while the premium on the price-to-total revenue basis is indicative
of the additional underwriting capacity that would be afforded PCA and the opportunity to
leverage its increased equity to produce growth in revenue and earnings.
Valuation Conclusion
It is our opinion that, as of August 11, 2015, the aggregate estimated pro forma market
value of Professional Casualty Association was within the Valuation Range of $11,900,000 to
$16,100,000 with a midpoint of $14,000,000. The Valuation Range was based upon a 15%
decrease from the midpoint to determine the minimum and a 15% increase to establish the
maximum. Exhibit V displays the assumptions and calculations utilized in determining PCA's
estimated pro forma market value.

FELDMAN FINANCIAL ADVISORS, INC.
57
Table 8Comparative Market Valuation Analysis
Professional Casualty Association and the Comparative GroupMarket Price Data as of August 11, 2015
Closing Total Price/ Price/ Price/ Price/ Price/ Price/ Total Stock Total Market Book Tang. LTM Oper. Total Total Equity/Price Assets Value Value Book EPS EPS Rev. Assets Assets
Company ($) ($mil.) ($mil.) (%) (%) (x) (x) (x) (%) (%) (%)
Professional Casualty Association Pro Forma Minimum 10.00 66.3 11.9 50.5 50.5 12.0 12.3 0.91 17.94 35.52 0.00 Pro Forma Midpoint 10.00 68.4 14.0 54.5 54.5 13.9 14.3 1.07 20.45 37.50 0.00 Pro Forma Maximum 10.00 70.5 16.1 58.0 58.0 15.8 16.2 1.23 22.82 39.36 0.00
Comparative Group Median NA 357.1 104.2 92.0 103.7 11.0 10.7 0.75 33.93 31.16 0.60Comparative Group Mean NA 572.1 188.6 102.7 108.6 10.4 10.8 0.97 37.12 37.01 1.08
Public P&C/Multiline Median NA 4,563.9 1,612.4 129.2 140.4 12.7 14.3 1.07 32.06 28.14 1.73Public P&C/Multiline Mean NA 39,974.6 12,546.4 154.8 166.6 14.6 15.3 1.28 41.80 28.78 1.68
Comparative Group1347 Property Insurance Holdings 7.66 75.9 48.7 99.4 100.0 NM NA 2.30 64.20 64.56 0.00American Independence Corp. 10.61 182.4 85.7 91.7 118.2 14.9 NA 0.50 47.00 52.96 0.00Atlantic American Corporation 3.68 327.2 75.7 74.3 76.2 12.3 NA 0.45 23.13 32.25 0.54Donegal Group Inc. 14.43 1,519.4 443.7 92.4 93.8 15.0 16.0 0.72 29.20 28.77 3.74EMC Insurance Group Inc. 22.68 1,520.1 468.8 90.9 91.1 9.8 10.5 0.77 30.84 33.91 2.94Federated National Holding Co. 24.54 601.1 349.2 157.9 157.9 8.8 9.4 1.70 58.09 38.50 0.65First Acceptance Corporation 2.99 387.0 122.7 114.9 120.6 5.0 NA 0.42 31.71 27.59 0.00Hallmark Financial Services, Inc. 11.24 1,041.9 215.9 82.5 107.4 11.5 13.4 0.60 20.72 25.18 0.00Kingstone Companies, Inc. 7.63 137.4 56.0 136.9 144.4 10.5 10.9 1.03 40.73 29.78 2.62National Security Group, Inc. 14.16 147.0 35.5 80.3 80.3 4.5 4.5 0.54 24.15 30.07 1.13Unico American Corporation 9.18 135.6 49.0 68.6 68.6 NM NM 1.59 36.15 52.70 0.00United Insurance Holdings Corp. 14.50 789.7 312.2 142.2 145.0 11.9 NA 1.00 39.53 27.79 1.38
Source: PCA; SNL Financial; Feldman Financial.
Current Div.
Yield

FELDMAN FINANCIAL ADVISORS, INC.
I-1
Exhibit I Background of Feldman Financial Advisors, Inc.
Overview of Firm
Feldman Financial Advisors provides consulting and advisory services to financial services companies in the areas of corporate valuations, mergers and acquisitions, strategic planning, branch sales and purchases, developing and implementing regulatory business and capital plans, and expert witness testimony and analysis. Our senior staff members have been involved in the mutual to stock conversion process since 1982 and have valued more than 350 converting institutions.
Feldman Financial Advisors was incorporated in February 1996 by a group of consultants who were previously associated with Credit Suisse First Boston and Kaplan Associates. Each of the officers of Feldman Financial Advisors has over 30 years of experience in consulting to financial institutions and financial services companies. Our senior staff collectively has worked with more than 1,000 commercial banks, savings institutions, mortgage companies, and insurance companies nationwide. The firm's office is located in Washington, D.C.
Background of Senior Professional Staff
Trent Feldman - President. Trent is a nationally recognized expert in providing strategic advice to and valuing financial service companies, and advising on mergers and acquisitions. Trent was with Kaplan Associates for 14 years and was one of three founding principals at that firm. Trent also has worked at the Federal Home Loan Bank Board and with the California legislature. Trent holds Bachelors and Masters Degrees from the University of California, Los Angeles.
Peter Williams - Principal. Peter specializes in merger and acquisition analysis, stock and other corporate valuations, strategic business plans, and retail delivery analysis. Peter was with Kaplan Associates for 13 years. Peter also worked as a Corporate Development Analyst with the Wilmington Trust Company in Delaware. Peter holds a BA in Economics from Yale University and an MBA in Finance and Investments from George Washington University.

FELDMAN FINANCIAL ADVISORS, INC.
II-1
Exhibit II Statement of Contingent and Limiting Conditions
This Appraisal is made subject to the following general contingent and limiting conditions:
1. The analyses, opinions, and conclusions presented in this Appraisal apply to this engagement only and may not be used out of the context presented herein. This Appraisal is valid only for the effective date specified herein and only for the purpose specified herein.
2. Neither all nor any part of the contents of this Appraisal is to be referred to or quoted in any registration statement, prospectus, public filing, loan agreement, or other agreement or document without our prior written approval. In addition, our Appraisal and analysis are not intended for general circulation or publication, nor are they to be reproduced or distributed to other third parties without our prior written consent.
3. Neither our Appraisal nor our valuation conclusion is to be construed as a fairness opinion as to the fairness of an actual or proposed transaction, a solvency assessment, or an investment recommendation. For various reasons, the price at which the subject interest might be sold in a specific transaction between specific parties on a specific date might be significantly different from the valuation conclusion expressed herein.
4. Our analysis assumes that as of the effective valuation date, PCA and its assets will continue to operate as a going concern. Furthermore, our analysis is based on the past and present financial condition of PCA and its assets as of the effective valuation date.
5. We assume no responsibility for legal matters including interpretations of the law, contracts, or title considerations. We assume that the subject assets, properties, or business interests are appraised free and clear of any or all liens or encumbrances unless otherwise stated.
6. We assume that there is full compliance with all applicable federal, state, and local regulations and laws unless the lack of compliance is stated, defined, and considered in the Appraisal.
7. We do not express an opinion or any other form of assurance on the reasonableness of management's projections reviewed by us or on the underlying assumptions.
8. We assume responsible ownership and competent management with respect to the subject assets, properties, or business interests.
9. The information furnished by others is believed to be reliable. However, we issue no warranty or other form of assurance regarding its accuracy.

FELDMAN FINANCIAL ADVISORS, INC.
III-1
Exhibit III-1 Professional Casualty Association
Balance Sheets As of December 31, 2013 and 2014 and June 30, 2015
(Dollars in Thousands)
June 30,2015 2014 2013
AssetsCash, cash equivalents, and short-term investments 6,070$ 5,455$ 8,496$ Investment securities 43,651 43,930 44,811 Accrued investment income 213 209 246 Premiums receivable 204 648 571 Reinsurance recoverable 2,228 3,324 3,516 Prepaid reinsurance premiums 844 901 851 Deferred policy acquisition costs 1,940 1,910 1,806 Deferred tax assets 693 739 1,002 Income taxes recoverable - 294 114 Other receivables 6 198 172 Total Assets 55,849$ 57,608$ 61,586$
Liabilities and Subscribers' EquityInsurance reserves: Losses and loss adjustment expenses 28,560$ 29,850$ 32,917$ Unearned premiums 11,439 11,595 10,798 Advance premiums 135 605 879 Deposits and amounts held for others 13 357 378 Reinsurance payable 549 621 520 Accounts payable and accrued expenses 294 477 344 Income taxes payable 105 - - Payable to attorney-in-fact 108 73 1,099 Surplus notes 1,578 1,578 2,656 Total Liabilities 42,782 45,156 49,592
Subscribers' EquityAdditional paid-in capital 2,349 2,349 2,349 Retained earnings 10,695 10,064 9,825 Unrealized gains (losses) 23 38 (181) Total Subscribers' Equity 13,067 12,452 11,994
Total Liabilities and Subscribers' Equity 55,849$ 57,608$ 61,586$
Source: PCA, unaudited GAAP financial statements.
December 31,
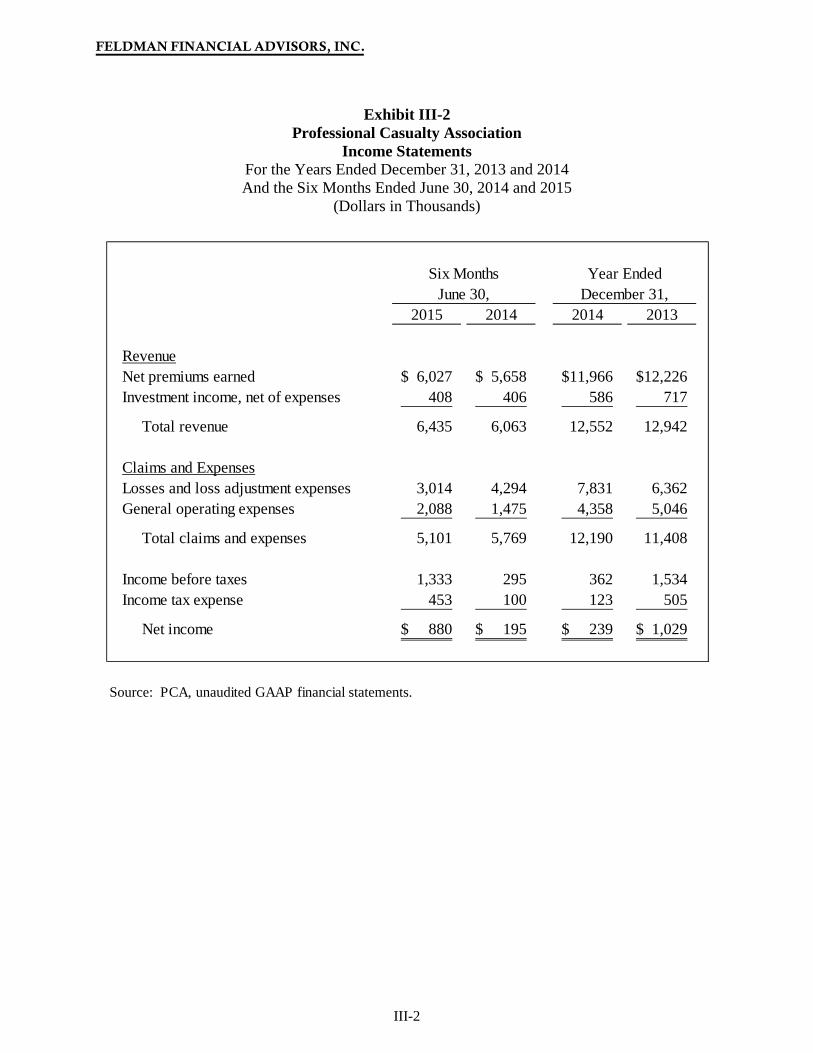
FELDMAN FINANCIAL ADVISORS, INC.
III-2
Exhibit III-2 Professional Casualty Association
Income Statements For the Years Ended December 31, 2013 and 2014 And the Six Months Ended June 30, 2014 and 2015
(Dollars in Thousands)
2015 2014 2014 2013
RevenueNet premiums earned 6,027$ 5,658$ 11,966$ 12,226$ Investment income, net of expenses 408 406 586 717
Total revenue 6,435 6,063 12,552 12,942
Claims and ExpensesLosses and loss adjustment expenses 3,014 4,294 7,831 6,362 General operating expenses 2,088 1,475 4,358 5,046
Total claims and expenses 5,101 5,769 12,190 11,408
Income before taxes 1,333 295 362 1,534 Income tax expense 453 100 123 505
Net income 880$ 195$ 239$ 1,029$
Source: PCA, unaudited GAAP financial statements.
December 31,Year EndedSix Months
June 30,

FELDMAN FINANCIAL ADVISORS, INC.
III-3
Exhibit III-3 Professional Casualty Association
Investment Securities Portfolio As of December 31, 2013 and 2014
(Dollars in Thousands)
Fair Percent Fair PercentValue of Total Value of Total
($000s) (%) ($000s) (%)
Debt securities:U.S. Treasury securities 9,158$ 20.85 10,176$ 22.71 U.S. Government agency obligations 14,964 34.06 14,775 32.97 U.S. Treasury and Govt. agency 24,122 54.91 24,951 55.68
States general obligations 2,031 4.62 2,758 6.16 Political subdivisions of states 4,016 9.14 3,454 7.71 States and political subdivisions 6,047 13.77 6,212 13.86
Corporate and industrial bonds 13,761 31.32 13,648 30.46 Total debt securities 43,930 100.00 44,811 100.00
Equity securities:Common stocks - - - - Preferred stocks - - - -
Total equity securities - - - -
Total investment securities 43,930$ 100.00 44,811$ 100.00
Source: PCA, internal financial data.
December 31, December 31,2014 2013

FELDMAN FINANCIAL ADVISORS, INC.
III-4
Exhibit III-4 Professional Casualty Association
Investment Securities Portfolio As of June 30, 2014 and 2015
(Dollars in Thousands)
Fair Percent Fair PercentValue of Total Value of Total
($000s) (%) ($000s) (%)
Debt securities 41,326$ 94.67 45,669$ 100.00 Common stocks - mutual funds 2,325 5.33 - -
Total investment securities 43,651$ 100.00 45,669$ 100.00
Source: PCA, internal financial data.
2014June 30,
2015June 30,
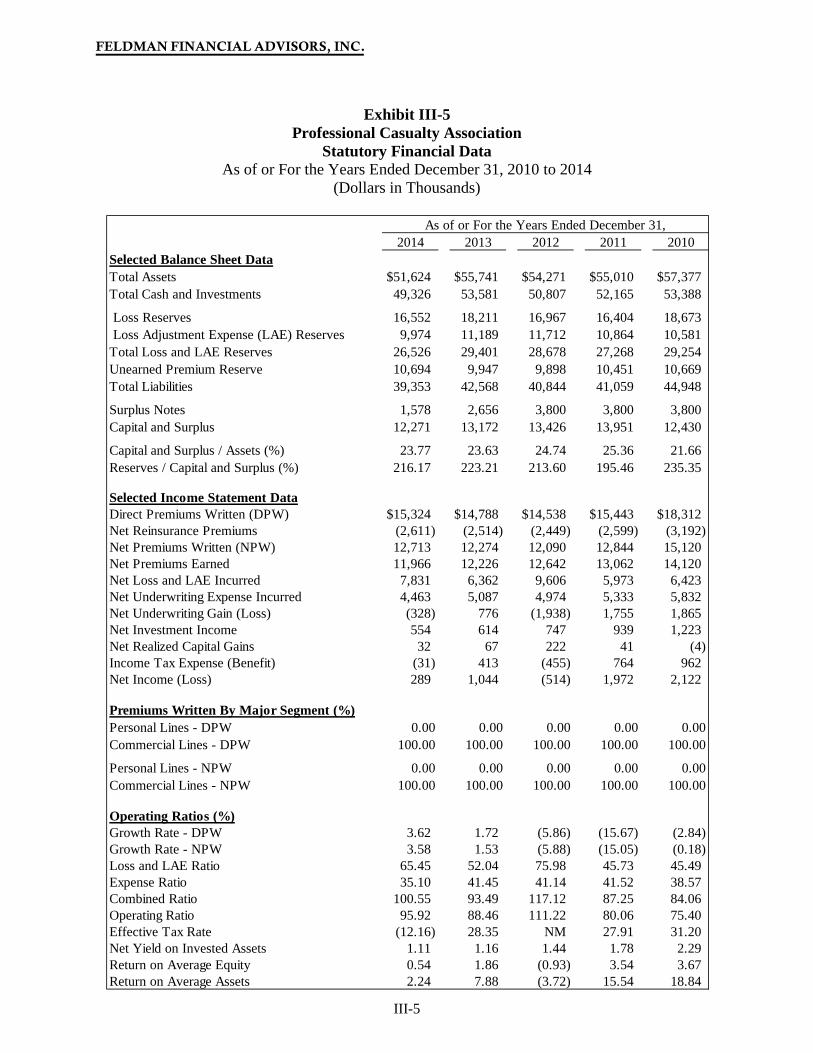
FELDMAN FINANCIAL ADVISORS, INC.
III-5
Exhibit III-5 Professional Casualty Association
Statutory Financial Data As of or For the Years Ended December 31, 2010 to 2014
(Dollars in Thousands)
2014 2013 2012 2011 2010Selected Balance Sheet DataTotal Assets $51,624 $55,741 $54,271 $55,010 $57,377Total Cash and Investments 49,326 53,581 50,807 52,165 53,388 Loss Reserves 16,552 18,211 16,967 16,404 18,673 Loss Adjustment Expense (LAE) Reserves 9,974 11,189 11,712 10,864 10,581 Total Loss and LAE Reserves 26,526 29,401 28,678 27,268 29,254 Unearned Premium Reserve 10,694 9,947 9,898 10,451 10,669 Total Liabilities 39,353 42,568 40,844 41,059 44,948 Surplus Notes 1,578 2,656 3,800 3,800 3,800 Capital and Surplus 12,271 13,172 13,426 13,951 12,430 Capital and Surplus / Assets (%) 23.77 23.63 24.74 25.36 21.66 Reserves / Capital and Surplus (%) 216.17 223.21 213.60 195.46 235.35 Selected Income Statement DataDirect Premiums Written (DPW) $15,324 $14,788 $14,538 $15,443 $18,312Net Reinsurance Premiums (2,611) (2,514) (2,449) (2,599) (3,192)Net Premiums Written (NPW) 12,713 12,274 12,090 12,844 15,120Net Premiums Earned 11,966 12,226 12,642 13,062 14,120Net Loss and LAE Incurred 7,831 6,362 9,606 5,973 6,423Net Underwriting Expense Incurred 4,463 5,087 4,974 5,333 5,832Net Underwriting Gain (Loss) (328) 776 (1,938) 1,755 1,865Net Investment Income 554 614 747 939 1,223Net Realized Capital Gains 32 67 222 41 (4)Income Tax Expense (Benefit) (31) 413 (455) 764 962Net Income (Loss) 289 1,044 (514) 1,972 2,122 Premiums Written By Major Segment (%)Personal Lines - DPW 0.00 0.00 0.00 0.00 0.00Commercial Lines - DPW 100.00 100.00 100.00 100.00 100.00 Personal Lines - NPW 0.00 0.00 0.00 0.00 0.00Commercial Lines - NPW 100.00 100.00 100.00 100.00 100.00 Operating Ratios (%)Growth Rate - DPW 3.62 1.72 (5.86) (15.67) (2.84)Growth Rate - NPW 3.58 1.53 (5.88) (15.05) (0.18)Loss and LAE Ratio 65.45 52.04 75.98 45.73 45.49Expense Ratio 35.10 41.45 41.14 41.52 38.57Combined Ratio 100.55 93.49 117.12 87.25 84.06Operating Ratio 95.92 88.46 111.22 80.06 75.40Effective Tax Rate (12.16) 28.35 NM 27.91 31.20Net Yield on Invested Assets 1.11 1.16 1.44 1.78 2.29Return on Average Equity 0.54 1.86 (0.93) 3.54 3.67Return on Average Assets 2.24 7.88 (3.72) 15.54 18.84
As of or For the Years Ended December 31,
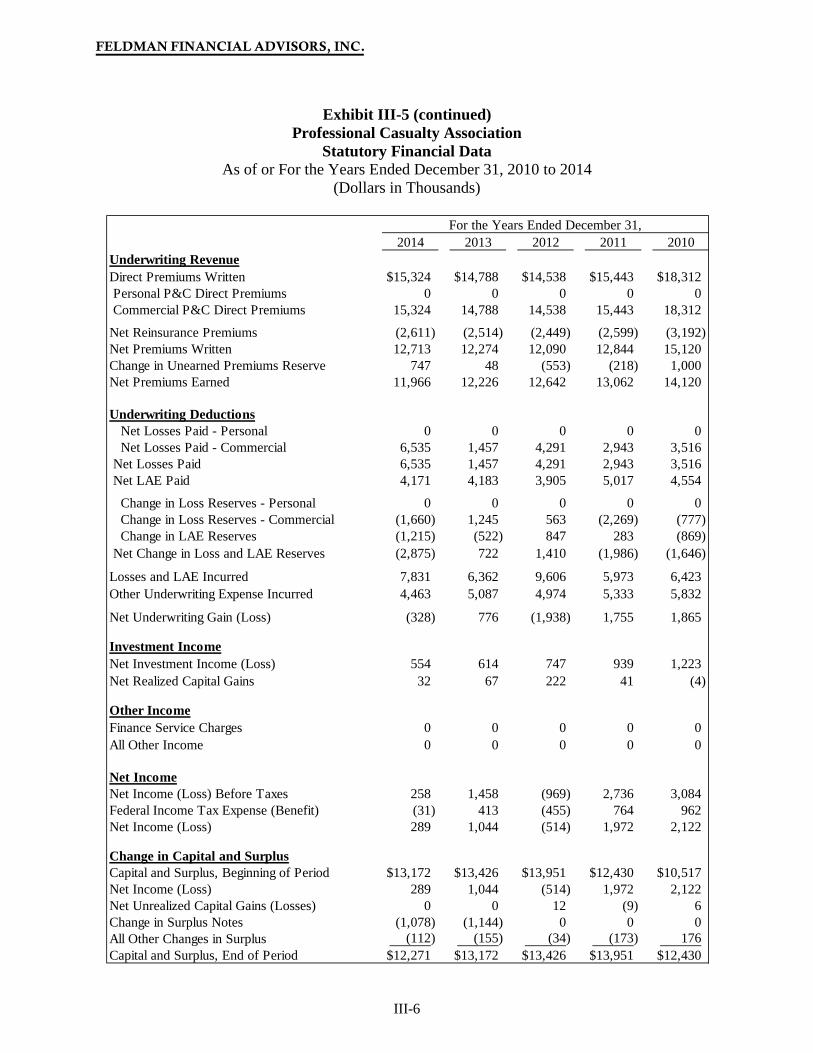
FELDMAN FINANCIAL ADVISORS, INC.
III-6
Exhibit III-5 (continued) Professional Casualty Association
Statutory Financial Data As of or For the Years Ended December 31, 2010 to 2014
(Dollars in Thousands)
2014 2013 2012 2011 2010Underwriting RevenueDirect Premiums Written $15,324 $14,788 $14,538 $15,443 $18,312 Personal P&C Direct Premiums 0 0 0 0 0 Commercial P&C Direct Premiums 15,324 14,788 14,538 15,443 18,312 Net Reinsurance Premiums (2,611) (2,514) (2,449) (2,599) (3,192)Net Premiums Written 12,713 12,274 12,090 12,844 15,120Change in Unearned Premiums Reserve 747 48 (553) (218) 1,000Net Premiums Earned 11,966 12,226 12,642 13,062 14,120 Underwriting Deductions Net Losses Paid - Personal 0 0 0 0 0 Net Losses Paid - Commercial 6,535 1,457 4,291 2,943 3,516 Net Losses Paid 6,535 1,457 4,291 2,943 3,516 Net LAE Paid 4,171 4,183 3,905 5,017 4,554 Change in Loss Reserves - Personal 0 0 0 0 0 Change in Loss Reserves - Commercial (1,660) 1,245 563 (2,269) (777) Change in LAE Reserves (1,215) (522) 847 283 (869) Net Change in Loss and LAE Reserves (2,875) 722 1,410 (1,986) (1,646) Losses and LAE Incurred 7,831 6,362 9,606 5,973 6,423Other Underwriting Expense Incurred 4,463 5,087 4,974 5,333 5,832 Net Underwriting Gain (Loss) (328) 776 (1,938) 1,755 1,865 Investment IncomeNet Investment Income (Loss) 554 614 747 939 1,223Net Realized Capital Gains 32 67 222 41 (4) Other IncomeFinance Service Charges 0 0 0 0 0All Other Income 0 0 0 0 0 Net IncomeNet Income (Loss) Before Taxes 258 1,458 (969) 2,736 3,084Federal Income Tax Expense (Benefit) (31) 413 (455) 764 962Net Income (Loss) 289 1,044 (514) 1,972 2,122 Change in Capital and SurplusCapital and Surplus, Beginning of Period $13,172 $13,426 $13,951 $12,430 $10,517Net Income (Loss) 289 1,044 (514) 1,972 2,122Net Unrealized Capital Gains (Losses) 0 0 12 (9) 6Change in Surplus Notes (1,078) (1,144) 0 0 0All Other Changes in Surplus (112) (155) (34) (173) 176 Capital and Surplus, End of Period $12,271 $13,172 $13,426 $13,951 $12,430
For the Years Ended December 31,
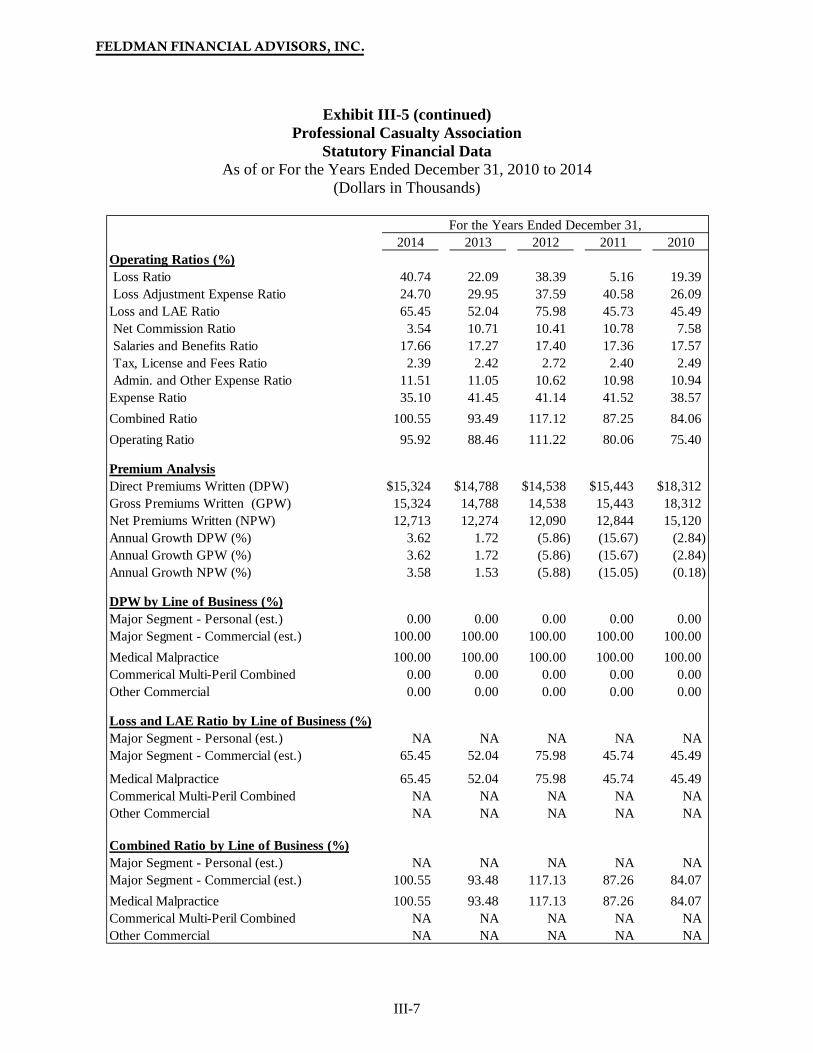
FELDMAN FINANCIAL ADVISORS, INC.
III-7
Exhibit III-5 (continued) Professional Casualty Association
Statutory Financial Data As of or For the Years Ended December 31, 2010 to 2014
(Dollars in Thousands)
2014 2013 2012 2011 2010Operating Ratios (%) Loss Ratio 40.74 22.09 38.39 5.16 19.39 Loss Adjustment Expense Ratio 24.70 29.95 37.59 40.58 26.09Loss and LAE Ratio 65.45 52.04 75.98 45.73 45.49 Net Commission Ratio 3.54 10.71 10.41 10.78 7.58 Salaries and Benefits Ratio 17.66 17.27 17.40 17.36 17.57 Tax, License and Fees Ratio 2.39 2.42 2.72 2.40 2.49 Admin. and Other Expense Ratio 11.51 11.05 10.62 10.98 10.94Expense Ratio 35.10 41.45 41.14 41.52 38.57 Combined Ratio 100.55 93.49 117.12 87.25 84.06 Operating Ratio 95.92 88.46 111.22 80.06 75.40 Premium AnalysisDirect Premiums Written (DPW) $15,324 $14,788 $14,538 $15,443 $18,312Gross Premiums Written (GPW) 15,324 14,788 14,538 15,443 18,312Net Premiums Written (NPW) 12,713 12,274 12,090 12,844 15,120Annual Growth DPW (%) 3.62 1.72 (5.86) (15.67) (2.84) Annual Growth GPW (%) 3.62 1.72 (5.86) (15.67) (2.84) Annual Growth NPW (%) 3.58 1.53 (5.88) (15.05) (0.18) DPW by Line of Business (%)Major Segment - Personal (est.) 0.00 0.00 0.00 0.00 0.00Major Segment - Commercial (est.) 100.00 100.00 100.00 100.00 100.00 Medical Malpractice 100.00 100.00 100.00 100.00 100.00Commerical Multi-Peril Combined 0.00 0.00 0.00 0.00 0.00Other Commercial 0.00 0.00 0.00 0.00 0.00 Loss and LAE Ratio by Line of Business (%)Major Segment - Personal (est.) NA NA NA NA NAMajor Segment - Commercial (est.) 65.45 52.04 75.98 45.74 45.49
Medical Malpractice 65.45 52.04 75.98 45.74 45.49 Commerical Multi-Peril Combined NA NA NA NA NAOther Commercial NA NA NA NA NA Combined Ratio by Line of Business (%)Major Segment - Personal (est.) NA NA NA NA NAMajor Segment - Commercial (est.) 100.55 93.48 117.13 87.26 84.07 Medical Malpractice 100.55 93.48 117.13 87.26 84.07 Commerical Multi-Peril Combined NA NA NA NA NAOther Commercial NA NA NA NA NA
For the Years Ended December 31,

FELDMAN FINANCIAL ADVISORS, INC.
III-8
Exhibit III-5 (continued) Professional Casualty Association
Statutory Financial Data As of or For the Years Ended December 31, 2010 to 2014
(Dollars in Thousands)
2014 2013 2012 2011 2010Investment IncomeNet Investment Income $554 $614 $747 $939 $1,223Realized Capital Gains 32 67 222 41 (4)Unrealized Capital Gains 0 0 12 (9) 6
Investment Portfolio Composition (%)Total Cash and Investments $49,326 $53,581 $50,807 $52,165 53,388 Bonds 88.94 84.14 69.89 90.13 87.64 Preferred Stocks 0.00 0.00 0.00 0.00 0.00 Common Stocks 0.00 0.00 0.00 0.00 0.00 Cash and Short-term Investments 11.06 15.86 21.66 9.87 12.36 Other Investments 0.00 0.00 8.46 0.00 0.00
Investment Yields by Type (%)Net Yield on Invested Assets 1.11 1.16 1.44 1.78 2.29Gross Yield - Bonds 1.66 1.85 2.36 2.55 2.88Gross Yield - Cash and Short-term Investments 0.19 0.16 0.13 0.23 0.34Gross Yield - Other Investments NA 4.59 0.00 NA NA
Bond Portfolio Composition (%)Total Bonds $44,122 $46,211 $37,988 $48,618 47,071 U.S. Government 54.78 57.18 46.27 47.81 39.42 States, Territories and Possessions 4.62 5.94 4.43 6.27 5.07 Political Subdivisions 9.12 7.83 9.19 2.07 0.64 Corporate and Industrial 31.48 29.04 40.12 43.85 54.88
Bond Average Asset Quality (NAIC Ratings #1-6)Total Bonds 1.00 1.07 1.05 1.08 1.08 U.S. Government 1.00 1.00 1.00 1.00 1.00 States, Territories and Possessions 1.00 1.00 1.00 1.00 1.00 Political Subdivisions 1.00 1.00 1.00 1.00 1.00 Corporate and Industrial 1.00 1.22 1.13 1.17 1.14
Bonds Rated 3 - 6 / Total Bonds (%) 0.00 0.00 0.00 0.23 0.27Bonds Rated 3 - 6 / Capital and Surplus (%) 0.00 0.00 0.00 0.80 1.01
Equity InvestmentsTotal Preferred Stock $0 $0 $0 $0 0Total Common Stock 0 0 0 0 0
Other InvestmentsTotal Mortgage Loans $0 $0 $0 $0 0Total Real Estate 0 0 0 0 0
Source: SNL Financial, statutory financial data.
For the Years Ended December 31,

FELDMAN FINANCIAL ADVISORS, INC.
IV-1
Total Policy Total Tang. LTM Net Prem. YTD YTD YTD Total Policy Total Resrvs./ Equity/ Equity/ Total Written/ Loss Exp. Comb. LTM LTM
Assets Reserves Equity Equity Assets Assets Revenue Avg.Eq. Ratio Ratio Ratio ROA ROE Company State ($mil.) ($mil.) ($mil.) (x) (%) (%) ($mil.) (x) (%) (%) (%) (%) (%)
1347 Property Insurance Holdings FL 76 18 49 0.37 64.56 64.56 21 0.53 10.5 55.3 65.8 (0.12) (0.17) Alleghany Corporation NY 23,928 13,443 7,650 1.76 31.97 31.26 5,112 0.58 54.6 33.8 88.4 2.68 8.45 Allstate Corporation IL 107,117 69,755 21,298 3.28 19.88 18.96 35,629 NA 70.6 26.3 96.9 2.43 11.87 American Financial Group, Inc. OH 49,424 37,107 4,984 7.45 10.08 9.62 5,945 0.83 60.9 33.3 94.2 0.82 7.68 American International Group, Inc. NY 509,987 267,370 104,642 2.56 20.52 NA 63,781 NA 64.8 34.6 99.4 1.37 6.63 American National Insurance Co. TX 23,319 16,813 4,495 3.74 19.28 19.28 2,997 NA 72.4 31.6 104.0 1.18 6.20 Ameriprise Financial, Inc. MN 148,806 29,345 8,996 3.26 6.05 4.77 12,381 NA 93.8 15.7 109.5 1.32 21.19 AMERISAFE, Inc. LA 1,534 943 473 1.99 30.82 30.82 409 0.84 61.6 22.6 84.2 4.04 13.20 AmTrust Financial Services, Inc. NY 15,967 10,250 2,632 3.89 16.49 12.35 4,440 1.72 65.3 24.5 89.8 3.45 21.08 Assurant, Inc. NY 30,842 19,930 4,828 4.13 15.65 12.31 10,569 NA NA NA NA 0.88 5.26 Atlantic American Corporation GA 313 156 107 1.45 32.25 31.72 166 NA 65.3 32.5 97.8 2.12 6.45 Atlas Financial Holdings, Inc. IL 383 220 121 1.82 31.58 30.51 125 1.27 57.6 28.0 85.6 6.11 17.47 Baldwin & Lyons, Inc. IN 1,126 541 405 1.34 36.01 NA 289 0.65 59.7 33.3 93.0 2.30 6.48 Berkshire Hathaway Inc. NE 540,774 99,030 249,202 0.40 46.08 37.64 199,470 NA 78.3 18.2 96.5 3.49 7.53 Cincinnati Financial Corporation OH 18,888 9,425 6,497 1.45 34.40 34.40 5,143 0.69 63.9 31.0 94.9 3.50 10.07 CNA Financial Corporation IL 55,022 36,368 12,234 2.97 22.23 22.02 9,468 0.55 64.7 33.9 98.6 1.40 6.14 Donegal Group Inc. PA 1,519 1,002 437 2.29 28.77 28.46 614 1.44 65.2 33.5 98.7 1.80 6.33 EMC Insurance Group Inc. IA 1,520 922 515 1.79 33.91 33.86 611 1.14 62.8 31.7 94.5 3.17 9.41 Employers Holdings, Inc. NV 3,811 2,696 715 3.77 18.75 17.78 753 0.99 63.0 32.7 95.7 2.31 12.83 Erie Indemnity Company PA 18,069 8,807 8,162 1.08 45.17 NA 6,252 NA 71.1 28.7 99.8 3.90 8.69 Federated National Holding Co. FL 601 332 231 1.44 38.50 38.50 206 0.85 50.1 NA NA 7.43 19.55 First Acceptance Corporation TN 387 191 107 1.79 27.59 26.65 289 NA 79.2 20.4 99.6 7.46 25.14 Hallmark Financial Services, Inc. TX 1,042 658 262 2.51 25.18 20.53 358 1.39 66.1 28.4 94.5 1.89 7.46 Hanover Insurance Group, Inc. MA 14,145 9,328 2,909 3.21 20.56 19.51 5,147 1.67 62.8 33.6 96.4 2.30 11.27 Hartford Financial Services Group CT 241,020 78,834 18,227 4.33 7.56 7.37 18,688 NA 68.5 30.4 98.9 0.67 8.75 HCI Group, Inc. FL 702 288 226 1.28 32.17 32.17 293 1.60 25.1 28.5 53.5 12.21 39.53 Heritage Insurance Holdings, Inc. FL 854 328 312 1.05 36.54 36.54 348 1.34 33.8 24.7 58.5 13.64 32.69 Horace Mann Educators Corp. IL 9,970 6,140 1,307 4.70 13.11 12.69 1,073 0.93 70.9 26.1 97.0 1.08 7.95 Infinity Property and Casualty Corp. AL 2,465 1,334 703 1.90 28.50 26.25 1,474 1.99 77.1 18.7 95.8 2.52 8.76 Kemper Corporation IL 8,055 4,793 2,012 2.38 24.98 21.89 2,208 NA 75.1 26.9 102.0 1.43 5.41
Exhibit IV-1Financial Performance Data for Public P&C and Multiline Companies

FELDMAN FINANCIAL ADVISORS, INC.
IV-2
Total Policy Total Tang. LTM Net Prem. YTD YTD YTD Total Policy Total Resrvs./ Equity/ Equity/ Total Written/ Loss Exp. Comb. LTM LTM
Assets Reserves Equity Equity Assets Assets Revenue Avg.Eq. Ratio Ratio Ratio ROA ROE Company State ($mil.) ($mil.) ($mil.) (x) (%) (%) ($mil.) (x) (%) (%) (%) (%) (%)
Kingstone Companies, Inc. NY 137 84 41 2.07 29.78 28.68 55 1.22 68.0 29.9 97.9 4.09 13.82 Loews Corporation NY 78,015 36,368 24,332 1.49 31.19 30.86 13,957 NA 64.7 33.9 98.6 1.09 3.46 Markel Corporation VA 25,366 14,057 7,750 1.81 30.55 25.52 5,242 0.50 51.7 37.9 90.0 1.91 6.40 Mercury General Corporation CA 4,586 2,141 1,848 1.16 40.29 39.27 2,913 1.53 71.3 27.5 98.8 1.00 2.44 National General Holdings Corp. NY 4,708 2,499 1,297 1.93 27.55 21.08 2,123 1.66 62.6 29.9 92.5 2.89 11.16 National Interstate Corporation OH 1,869 1,261 368 3.43 19.67 19.34 605 1.58 78.9 20.5 99.4 1.56 7.56 National Security Group, Inc. AL 147 76 44 1.71 30.07 30.07 65 1.46 NA NA NA 5.50 19.73 Navigators Group, Inc. CT 4,541 2,988 1,054 2.84 23.20 23.08 1,040 0.98 56.9 35.9 92.8 2.13 9.35 Old Republic International Corp. IL 17,277 11,133 3,937 2.83 22.79 NA 5,506 NA 47.7 47.7 95.4 2.07 8.97 ProAssurance Corporation AL 5,001 2,397 2,057 1.17 41.13 37.28 833 0.32 60.2 30.2 90.4 3.28 7.75 Progressive Corporation OH 29,304 16,343 7,360 2.22 25.12 22.47 20,101 2.79 72.3 20.3 92.6 5.02 18.91 RLI Corp. IL 2,815 1,573 868 1.81 30.83 29.01 801 0.80 42.6 42.0 84.6 4.88 15.68 Safety Insurance Group, Inc. MA 1,725 977 646 1.51 37.48 37.48 790 1.07 97.4 28.6 126.0 (0.61) (1.50) Selective Insurance Group, Inc. NJ 6,784 4,713 1,310 3.60 19.31 19.22 2,065 1.54 59.7 34.6 94.3 2.54 13.09 State Auto Financial Corporation OH 2,801 1,655 878 1.89 31.33 31.29 1,259 1.47 66.9 33.4 100.3 3.87 12.06 State National Companies, Inc. TX 2,149 1,744 252 6.93 11.71 11.45 165 0.48 NA NA NA 1.16 10.37 Travelers Companies, Inc. MN 101,664 65,459 24,121 2.71 23.73 20.70 27,001 0.96 58.2 31.7 89.9 3.48 14.43 Trupanion, Inc. WA 75 6 52 0.11 69.22 67.09 131 NA NA NA NA (26.45) (48.93) Unico American Corporation CA 136 61 71 0.85 52.70 52.70 31 NA 70.0 21.0 91.0 (0.11) (0.20) United Fire Group, Inc. IA 3,891 2,820 832 3.39 21.38 20.85 981 1.11 64.1 29.7 93.8 1.92 8.95 United Insurance Holdings Corp. FL 790 340 219 1.55 27.79 27.40 313 1.52 60.9 39.5 100.4 4.06 12.52 Universal Insurance Holdings, Inc. FL 1,047 568 255 2.22 24.38 NA 435 2.47 35.4 NA NA 9.36 42.16 W. R. Berkley Corporation CT 21,690 13,813 4,536 3.04 20.91 20.36 7,159 1.31 60.9 33.1 94.0 2.49 11.65 White Mountains Insurance Group NH 10,429 4,143 4,459 0.93 42.75 40.73 2,523 0.46 53.7 35.2 88.9 1.58 3.88
Overall P&C/Multiline Median 4,564 2,598 1,175 1.96 28.14 26.65 1,166 1.14 64.0 30.7 95.2 2.37 8.96 Overall P&C/Multiline Mean 39,974 16,918 10,247 2.38 28.78 27.31 9,081 1.19 62.4 30.4 93.6 2.56 10.45
Source: SNL Financial.
Financial Performance Data for Public P&C and Multiline Insurance CompaniesExhibit IV-1 (continued)

FELDMAN FINANCIAL ADVISORS, INC.
IV-3
Closing Total Price/ Price/ Price/ Price/ Price/ Price/ Price/ Current One-Yr.Price Market Book Tang. LTM Oper. 2015 LTM Total Div. Price
8/11/15 Value Value Book EPS EPS Est. EPS Rev. Assets Yield Change Company Ticker Exchange State ($) ($mil.) (%) (%) (x) (x) (x) (x) (%) (%) (%)
1347 Property Insurance Holdings PIH NASDAQ FL 7.66 49 99.4 99.4 NM NA NA 2.30 64.20 0.00 (11.03) Alleghany Corporation Y NYSE NY 496.98 7,936 103.9 107.4 12.67 14.95 17.67 1.55 33.17 0.00 18.87 Allstate Corporation ALL NYSE IL 63.47 25,413 130.9 139.6 10.72 12.21 13.29 0.71 23.72 1.89 6.56 American Financial Group, Inc. AFG NYSE OH 71.80 6,285 130.9 138.2 16.06 13.60 13.08 1.06 12.72 1.39 26.45 American International Group, Inc. AIG NYSE NY 63.31 81,916 79.4 NA 12.46 13.27 12.64 1.28 16.06 1.77 19.68 American National Insurance Co. ANAT NASDAQ TX 104.59 2,813 62.7 62.7 10.24 12.18 NA 0.94 12.06 3.06 (4.55) Ameriprise Financial, Inc. AMP NYSE MN 123.42 21,996 280.1 375.3 14.19 13.87 13.10 1.78 14.78 2.17 3.83 AMERISAFE, Inc. AMSF NASDAQ LA 49.87 948 200.5 200.5 15.88 15.49 14.70 2.32 61.80 1.20 31.27 AmTrust Financial Services, Inc. AFSI NASDAQ NY 66.22 5,475 275.4 443.4 11.95 10.75 11.70 1.23 34.29 1.81 50.02 Assurant, Inc. AIZ NYSE NY 79.13 5,287 109.8 145.1 20.88 10.81 11.53 0.50 17.14 1.52 23.95 Atlantic American Corporation AAME NASDAQ GA 3.68 76 74.3 76.2 12.27 NA NA 0.46 23.13 0.54 (13.41) Atlas Financial Holdings, Inc. AFH NASDAQ IL 17.80 211 187.3 197.5 11.56 11.71 14.74 1.68 54.99 0.00 29.74 Baldwin & Lyons, Inc. BWINB NASDAQ IN 22.77 346 84.4 NA 13.09 15.08 12.67 1.20 30.78 4.39 (11.74) Berkshire Hathaway Inc. BRK.A NYSE NE 214,500 352,245 143.3 204.0 19.63 20.95 19.22 1.77 65.14 0.00 8.33 Cincinnati Financial Corporation CINF NASDAQ OH 55.96 9,183 141.3 141.3 14.13 17.71 19.46 1.79 48.62 3.29 18.99 CNA Financial Corporation CNA NYSE IL 39.61 10,705 87.5 88.6 13.71 14.35 13.06 1.13 19.46 2.52 4.87 Donegal Group Inc. DGICA NASDAQ PA 14.43 444 92.4 93.8 14.99 16.03 12.55 0.72 29.20 3.74 (6.84) EMC Insurance Group Inc. EMCI NASDAQ IA 22.68 469 90.9 91.1 9.80 10.45 10.80 0.77 30.84 2.94 11.61 Employers Holdings, Inc. EIG NYSE NV 25.75 825 115.5 123.2 9.50 NA 15.25 1.10 21.64 0.93 20.67 Erie Indemnity Company ERIE NASDAQ PA 86.02 3,973 614.5 NA 26.97 26.97 25.32 0.64 21.99 3.17 15.23 Federated National Holding Co. FNHC NASDAQ FL 24.54 349 157.9 157.9 8.83 9.40 10.81 1.70 58.09 0.65 11.55 First Acceptance Corporation FAC NYSE TN 2.99 123 114.9 120.6 4.98 NA NA 0.42 31.71 0.00 17.72 Hallmark Financial Services, Inc. HALL NASDAQ TX 11.24 216 82.5 107.4 11.47 13.38 14.05 0.60 20.72 0.00 20.09 Hanover Insurance Group, Inc. THG NYSE MA 81.06 3,582 122.3 130.6 11.38 14.32 13.87 0.70 25.33 2.02 31.55 Hartford Financial Services Group HIG NYSE CT 47.84 19,846 109.3 112.3 12.72 12.05 11.98 1.06 8.23 1.76 38.75 HCI Group, Inc. HCI NYSE FL 41.33 450 187.9 187.9 6.20 NA 6.89 1.54 64.10 2.90 2.23 Heritage Insurance Holdings, Inc. HRTG NYSE FL 20.02 601 192.4 192.4 7.05 NA 6.66 1.73 70.33 0.00 35.82 Horace Mann Educators Corp. HMN NYSE IL 34.58 1,424 109.0 113.1 13.83 14.97 15.16 1.33 14.28 2.89 18.47 Infinity Property and Casualty Corp. IPCC NASDAQ AL 77.78 886 126.5 141.7 14.70 15.25 17.74 0.60 35.92 2.21 15.08 Kemper Corporation KMPR NYSE IL 38.40 1,989 98.9 117.4 17.78 23.85 19.13 0.90 24.69 2.50 7.96
Exhibit IV-2Market Valuation Data for Public P&C and Multiline Insurance Companies

FELDMAN FINANCIAL ADVISORS, INC.
IV-4
Closing Total Price/ Price/ Price/ Price/ Price/ Price/ Price/ Current One-Yr.Price Market Book Tang. LTM Oper. 2015 LTM Total Div. Price
8/11/15 Value Value Book EPS EPS Est. EPS Rev. Assets Yield Change Company Ticker Exchange State ($) ($mil.) (%) (%) (x) (x) (x) (x) (%) (%) (%)
Kingstone Companies, Inc. KINS NASDAQ NY 7.63 56 136.9 144.4 10.45 10.90 8.72 1.03 40.73 2.62 13.37 Loews Corporation L NYSE NY 39.03 14,171 75.2 76.7 21.10 22.69 16.59 1.02 18.16 0.64 (7.40) Markel Corporation MKL NYSE VA 870.06 12,140 156.8 201.4 25.93 27.40 24.53 2.32 47.86 0.00 36.95 Mercury General Corporation MCY NYSE CA 54.53 3,008 162.8 169.9 65.70 28.55 23.46 1.03 65.59 4.53 7.30 National General Holdings Corp. NGHC NASDAQ NY 19.80 1,856 173.5 271.6 16.10 13.11 12.07 0.87 39.42 0.40 8.14 National Interstate Corporation NATL NASDAQ OH 26.92 534 145.2 148.3 19.51 21.71 19.23 0.88 28.57 1.93 (2.78) National Security Group, Inc. NSEC NASDAQ AL 14.16 36 80.3 80.3 4.48 4.54 NA 0.54 24.15 1.13 34.47 Navigators Group, Inc. NAVG NASDAQ CT 78.91 1,136 107.8 108.5 12.10 13.58 14.48 1.09 25.02 0.00 26.05 Old Republic International Corp. ORI NYSE IL 16.63 4,346 110.4 NA 13.30 15.12 14.26 0.79 25.15 4.45 15.09 ProAssurance Corporation PRA NYSE AL 48.64 2,610 127.7 150.1 16.32 16.38 18.31 3.13 52.19 2.55 9.03 Progressive Corporation PGR NYSE OH 30.93 18,123 246.2 284.9 13.75 15.09 15.94 0.90 61.84 2.22 30.56 RLI Corp. RLI NYSE IL 55.75 2,410 277.7 302.9 17.70 20.96 22.82 3.01 85.61 1.36 26.30 Safety Insurance Group, Inc. SAFT NASDAQ MA 55.96 845 130.7 130.7 NM NM NA 1.07 48.97 5.00 4.29 Selective Insurance Group, Inc. SIGI NASDAQ NJ 31.54 1,801 137.5 138.3 10.80 12.22 13.14 0.87 26.55 1.78 35.48 State Auto Financial Corporation STFC NASDAQ OH 23.41 965 109.6 109.9 9.29 10.18 15.49 0.77 34.46 1.71 6.65 State National Companies, Inc. SNC NASDAQ TX 10.53 468 186.1 191.0 NA NA 10.86 2.84 21.79 0.38 NATravelers Companies, Inc. TRV NYSE MN 105.89 32,954 136.6 162.8 9.73 9.87 10.93 1.22 32.41 2.30 16.80 Trupanion, Inc. TRUP NYSE WA 8.32 235 454.9 501.7 NM NA NA 1.79 315.09 0.00 (17.95) Unico American Corporation UNAM NASDAQ CA 9.18 49 68.6 68.6 NM NM NA 1.59 36.15 0.00 (26.04) United Fire Group, Inc. UFCS NASDAQ IA 36.90 925 111.1 114.7 12.64 13.09 13.82 0.94 23.76 2.38 27.55 United Insurance Holdings Corp. UIHC NASDAQ FL 14.50 312 142.2 145.0 11.89 NA 17.74 1.00 39.53 1.38 (4.73) Universal Insurance Holdings, Inc. UVE NYSE FL 29.49 1,054 412.4 437.8 11.75 NA 11.52 2.42 100.59 1.63 121.06 W. R. Berkley Corporation WRB NYSE CT 57.23 7,060 155.7 161.1 13.99 16.83 16.65 0.99 32.55 0.84 25.42 White Mountains Insurance Group WTM NYSE NH 730.05 4,351 109.5 120.2 20.89 NA 47.55 1.72 41.72 0.14 14.98
Overall P&C/Multiline Median NA 1,612 129.2 140.4 12.72 14.32 14.15 1.07 32.06 1.73 15.09Overall P&C/Multiline Mean NA 12,546 154.8 166.6 14.63 15.26 15.55 1.28 41.80 1.68 15.89
Source: SNL Financial.
Exhibit IV-2 (continued)Market Valuation Data for Public P&C and Multiline Insurance Companies

FELDMAN FINANCIAL ADVISORS, INC.
V-1
Exhibit V-1 Pro Forma Assumptions for Conversion Valuation
1. The initial offering price is assumed to be $10.00 per share and the number of shares offered
is computed by dividing the estimated pro forma market value by the offering price.
2. The total amount of the net offering proceeds was fully invested at the beginning of the applicable period.
3. The net offering proceeds are invested to yield a return of 1.01%, which represents the yield on a three-year U.S. Treasury bond as of June 30, 2015. The effective income tax rate was assumed to be 34.0%, resulting in a net after-tax yield of 0.67%.
4. Expenses attributable to the stock offering are estimated to total 10.0% of the gross proceeds at the valuation midpoint and approximate $1.4 million.
5. The pro forma earnings calculation is based on the historically reported net income of PCA for the corresponding period.
6. No effect has been given in the pro forma equity calculation for the assumed earnings on the net proceeds.
7. The calculation of tangible equity excludes any intangible assets from total equity.
8. The calculation of operating income excludes the after-tax impact of net realized securities gains (or losses) and any extraordinary items.
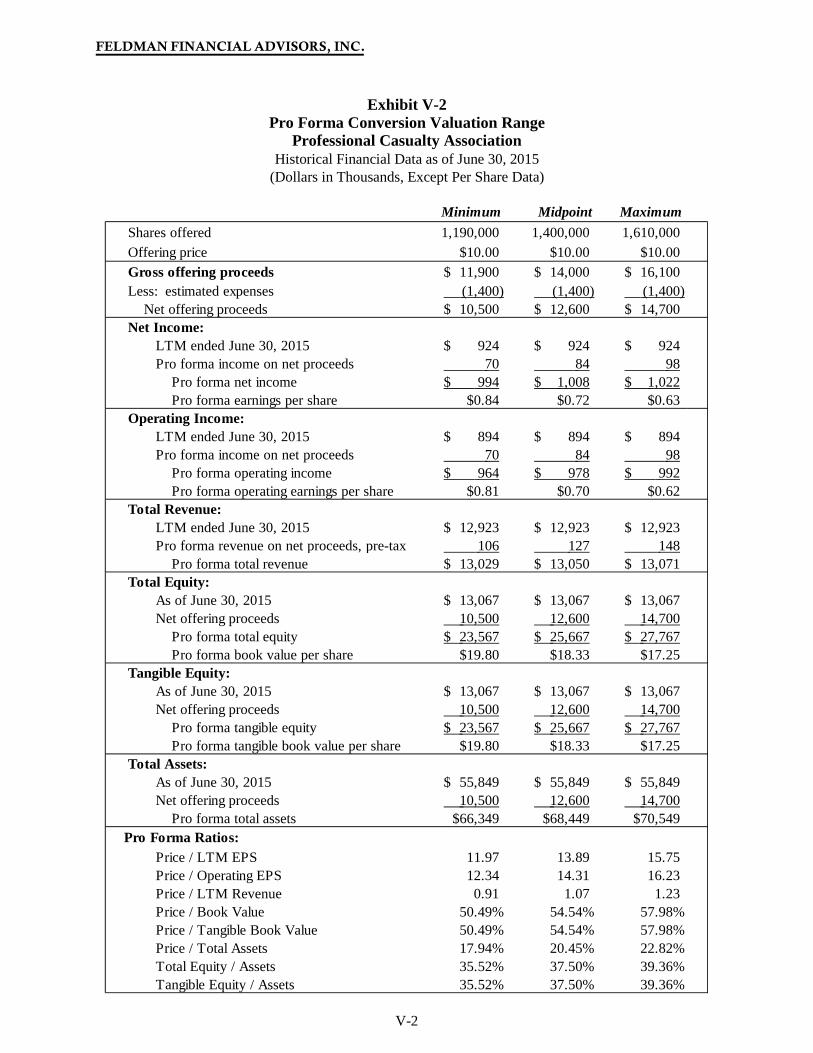
FELDMAN FINANCIAL ADVISORS, INC.
V-2
Exhibit V-2 Pro Forma Conversion Valuation Range
Professional Casualty Association Historical Financial Data as of June 30, 2015
(Dollars in Thousands, Except Per Share Data)
Minimum Midpoint Maximum Shares offered 1,190,000 1,400,000 1,610,000 Offering price $10.00 $10.00 $10.00 Gross offering proceeds 11,900$ 14,000$ 16,100$ Less: estimated expenses (1,400) (1,400) (1,400) Net offering proceeds 10,500$ 12,600$ 14,700$ Net Income:
LTM ended June 30, 2015 924$ 924$ 924$ Pro forma income on net proceeds 70 84 98 Pro forma net income 994$ 1,008$ 1,022$ Pro forma earnings per share $0.84 $0.72 $0.63
Operating Income: LTM ended June 30, 2015 894$ 894$ 894$ Pro forma income on net proceeds 70 84 98 Pro forma operating income 964$ 978$ 992$ Pro forma operating earnings per share $0.81 $0.70 $0.62
Total Revenue:LTM ended June 30, 2015 12,923$ 12,923$ 12,923$ Pro forma revenue on net proceeds, pre-tax 106 127 148 Pro forma total revenue 13,029$ 13,050$ 13,071$
Total Equity:As of June 30, 2015 13,067$ 13,067$ 13,067$ Net offering proceeds 10,500 12,600 14,700 Pro forma total equity 23,567$ 25,667$ 27,767$ Pro forma book value per share $19.80 $18.33 $17.25
Tangible Equity:As of June 30, 2015 13,067$ 13,067$ 13,067$ Net offering proceeds 10,500 12,600 14,700 Pro forma tangible equity 23,567$ 25,667$ 27,767$ Pro forma tangible book value per share $19.80 $18.33 $17.25
Total Assets:As of June 30, 2015 55,849$ 55,849$ 55,849$ Net offering proceeds 10,500 12,600 14,700 Pro forma total assets $66,349 $68,449 $70,549
Pro Forma Ratios:Price / LTM EPS 11.97 13.89 15.75 Price / Operating EPS 12.34 14.31 16.23 Price / LTM Revenue 0.91 1.07 1.23 Price / Book Value 50.49% 54.54% 57.98%Price / Tangible Book Value 50.49% 54.54% 57.98%Price / Total Assets 17.94% 20.45% 22.82%Total Equity / Assets 35.52% 37.50% 39.36%Tangible Equity / Assets 35.52% 37.50% 39.36%


FELDMAN FINANCIAL ADVISORS, INC. 1001 CONNECTICUT AVENUE, NW • SUITE 840 WASHINGTON, DC 20036 202-467-6862 (FAX) 202-467-6963
Physicians' Insurance Program Exchange Upper Gwynedd, Pennsylvania
Conversion Valuation Appraisal Report Valued as of August 11, 2015
Prepared By
Feldman Financial Advisors, Inc. Washington, DC
FELDMAN FINANCIAL ADVISORS, INC. 1001 CONNECTICUT AVENUE, NW • SUITE 840 WASHINGTON, DC 20036 202-467-6862 (FAX) 202-467-6963
August 11, 2015 Board of Directors Physicians' Insurance Program Exchange 311 North Sumneytown Pike, Suite 1B Upper Gwynedd, Pennsylvania 19454 Members of the Board:
At your request, we have completed and hereby provide an independent appraisal (the "Appraisal") of the estimated pro forma market value of Physicians' Insurance Program Exchange ("PIPE") as of August 11, 2015. PIPE plans to convert from a Pennsylvania reciprocal insurance exchange to a Pennsylvania stock insurance company (the "Conversion"). In conjunction with the Conversion, PIPE will be merged with and into Professional Casualty Association ("PCA"), as converted to stock form, to form a single insurance company to be also called Professional Casualty Association, ("New PCA"), which will become a wholly owned subsidiary of Professional Casualty Holdings, Inc. ("PCH"), a newly created Pennsylvania corporation. Immediately after these series of transactions, Diversus, Inc., a Delaware corporation will be merged with and into PCH with PCH as the survivor. PCH is offering shares of its common stock for sale in an initial public offering (the "Offering") with preference granted in the subscription offering phase to, among others, policyholders and named insureds of PIPE and PCA, and any unsubscribed shares offered to other investors in community or syndicated offerings.
This Appraisal is furnished in accordance with PIPE's Plan of Conversion and Title 40 of
the Pennsylvania Statutes ("40 P.S."), Chapter 35 - Medical Professional Liability Reciprocal Exchange-to-Stock Conversion, Sections 3501 to 3517. As specified by the Plan of Conversion and 40 P.S., Chapter 35, Section 3503(a)(d), the estimated pro forma market value of the capital stock of PIPE shall be determined by an independent valuation expert and shall represent the estimated pro forma market value of the stock company as successor to the reciprocal insurer. Furthermore, as permitted by Section 3503(a)(d), the pro forma market value may be stated as a range of value and may be that value that is estimated to be necessary to attract full subscription for the shares offered for sale.
Feldman Financial Advisors, Inc. ("Feldman Financial") is a financial consulting and
economic research firm that specializes in financial valuations and analyses of business enterprises and securities in the financial services industries. The background of Feldman Financial is presented in Exhibit I.
FELDMAN FINANCIAL ADVISORS, INC.
Board of Directors Physicians' Insurance Program Exchange August 11, 2015 Page Two
In preparing the Appraisal, we conducted an analysis of PIPE that included discussions with PIPE's management and an onsite visit to PIPE's headquarters. We reviewed the unaudited financial statements of PIPE as prepared under generally accepting accounting principles ("GAAP") as of and for the years ended December 31, 2013 and 2014 and unaudited financial statements as of and for the six months ended June 30, 2014 and 2015. PIPE had available audited statutory financial statements for December 31, 2013 and 2014, but did not have audited GAAP financial statements for the corresponding periods. The unaudited GAAP financial statements furnished to us by PIPE for December 31, 2013 and 2014 were internally prepared based on the audited consolidated GAAP financial statements of Physicians' Insurance Program Management Company, ("PIPMC"), which serves as the attorney-in-fact for PIPE and administers and manages essentially all of the operations of PIPE.
In addition, where appropriate, we considered information based on other available
published sources that we believe are reliable; however, we cannot guarantee the accuracy and completeness of such information. We also reviewed and analyzed: (i) financial and operating information with respect to the business, operations, and prospects of PIPE as furnished to us PIPE; (ii) publicly available information concerning PIPE that we believe to be relevant to our analysis; (iii) a comparison of the historical financial results and present financial condition of PIPE with those of selected publicly traded insurance companies that we deemed relevant; and (iv) financial performance and market valuation data of certain publicly traded insurance industry aggregates as provided by industry sources.
The Appraisal is based on PIPE's representation that the financial data and additional
information materials furnished to us by PIPE are truthful, accurate, and complete. We did not independently verify the financial statements and other information provided by PIPE, nor did we independently value the assets or liabilities of PIPE. The Appraisal considers PIPE only as a going concern on a stand-alone basis and should not be considered as an indication of the liquidation value of PIPE.
It is our opinion that, as of August 11, 2015 (the "Valuation Date"), the estimated pro
forma market value of PIPE was within a range (the "Valuation Range") of $9,350,000 to $12,650,000 with a midpoint of $11,000,000. The Valuation Range was based upon a 15% decrease from the midpoint to determine the minimum and a 15% increase from the midpoint to establish the maximum.
Our Appraisal is not intended, and must not be construed, to be a recommendation of any
kind as to the advisability of purchasing shares of common stock of PCH in the Offering. Moreover, because the Appraisal is necessarily based upon estimates and projections of a number of matters, all of which are subject to change from time to time, no assurance can be given that persons who purchase shares of common stock of PCH in the Offering will thereafter be able to sell such shares at prices related to the foregoing estimate of PIPE's pro forma market value.

FELDMAN FINANCIAL ADVISORS, INC.
Board of Directors Physicians' Insurance Program Exchange August 11, 2015 Page Three
The Appraisal reflects only the Valuation Range as of the Valuation Date for the estimated pro forma market value of PIPE in connection with the Conversion and does not take into account any trading activity with respect to the purchase and sale of common stock of PCH in the secondary market on the date of issuance of such securities or at any time thereafter following the completion of the Offering. Feldman Financial is not a seller of securities within the meaning of any federal or state securities laws and any report prepared by Feldman Financial shall not be used as an offer or solicitation with respect to the purchase or sale of any securities.
The Valuation Range reported herein will be updated as appropriate. These updates will
consider, among other factors, any developments or changes in PIPE's operating performance, financial condition, or management policies, and current conditions in the securities markets for insurance company common stocks. Should any such new developments or changes be material, in our opinion, to the estimated pro forma market value of PIPE, appropriate adjustments to the Valuation Range will be made. The reasons for any such adjustments will be explained in detail at that time.
Respectfully submitted, Feldman Financial Advisors, Inc.
____________________ Trent R. Feldman President ____________________ Peter W. L. Williams Principal

FELDMAN FINANCIAL ADVISORS, INC.
i
TABLE OF CONTENTS TAB PAGE
INTRODUCTION .................................................................................................... 1
I. Chapter One – BUSINESS OF PIPE General Overview ....................................................................................................... 5 Financial Condition ..................................................................................................... 14 Income and Expense Trends ....................................................................................... 19
II. Chapter Two – INDUSTRY FUNDAMENTALS
Industry Performance and Investment Outlook ........................................................... 25 Financial Strength Ratings by A.M. Best .................................................................... 28
III. Chapter Three – COMPARISONS WITH PUBLICLY TRADED COMPANIES
General Overview ....................................................................................................... 30 Selection Criteria ......................................................................................................... 31 Summary Profiles of the Comparative Group Companies .......................................... 35
Recent Financial Comparisons .................................................................................... 42 IV. Chapter Four – MARKET VALUE ADJUSTMENTS General Overview ....................................................................................................... 48 Earnings Prospects ...................................................................................................... 49 Management ................................................................................................................ 50 Liquidity of the Issue................................................................................................... 51 Subscription Interest ................................................................................................... 52 Stock Market Conditions ............................................................................................. 53 New Issue Discount ..................................................................................................... 56 Adjustments Conclusion ............................................................................................. 56 Valuation Approach .................................................................................................... 57 Valuation Conclusion .................................................................................................. 60 V. Appendix – EXHIBITS I Background of Feldman Financial Advisors, Inc. ......................................... I-1 II Statement of Contingent and Limiting Conditions ........................................ II-1 III-1 Balance Sheets ............................................................................................... III-1 III-2 Income Statements......................................................................................... III-2 III-3 Investment Securities Portfolio (December 31, 2013 and 2014) ................... III-3 III-4 Investment Securities Portfolio (June 30, 2014 and 2015) ............................ III-4 III-5 Statutory Financial Data ................................................................................ III-5 IV-1 Financial Performance Data for Public P&C/Multiline Insurance Group ..... IV-1 IV-2 Market Valuation Data for Public P&C/Multiline Insurance Group ............. IV-3 V-1 Pro Forma Assumptions for Conversion Valuation ...................................... V-1 V-2 Pro Forma Conversion Valuation Range ....................................................... V-2
FELDMAN FINANCIAL ADVISORS, INC.
ii
LIST OF TABLES TAB PAGE
I. Chapter One – BUSINESS OF PIPE
Table 1 Selected Financial Condition Data ........................................................ 14 Table 2 Selected Operating Performance Data .................................................. 21 Table 3 Underwriting Performance Data ........................................................... 22
III. Chapter Three – COMPARISONS WITH PUBLICLY TRADED COMPANIES
Table 4 General Operating Summary of the Comparative Group ...................... 34 Table 5 Comparative Financial Condition Data ................................................. 44 Table 6 Comparative Operating Performance Data ........................................... 45
IV. Chapter Four – MARKET VALUE ADJUSTMENTS
Table 7 Selected Stock Market Index Performance ........................................... 54 Table 8 Comparative Market Valuation Analysis .............................................. 61
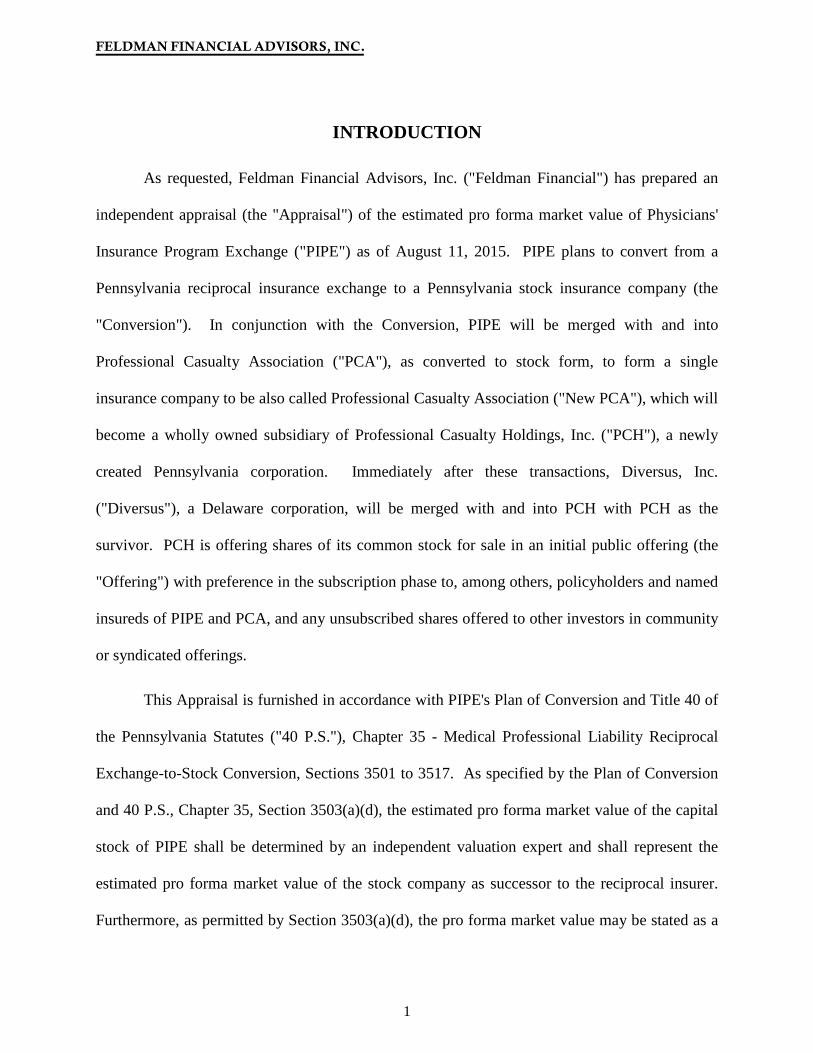
FELDMAN FINANCIAL ADVISORS, INC.
1
INTRODUCTION
As requested, Feldman Financial Advisors, Inc. ("Feldman Financial") has prepared an
independent appraisal (the "Appraisal") of the estimated pro forma market value of Physicians'
Insurance Program Exchange ("PIPE") as of August 11, 2015. PIPE plans to convert from a
Pennsylvania reciprocal insurance exchange to a Pennsylvania stock insurance company (the
"Conversion"). In conjunction with the Conversion, PIPE will be merged with and into
Professional Casualty Association ("PCA"), as converted to stock form, to form a single
insurance company to be also called Professional Casualty Association ("New PCA"), which will
become a wholly owned subsidiary of Professional Casualty Holdings, Inc. ("PCH"), a newly
created Pennsylvania corporation. Immediately after these transactions, Diversus, Inc.
("Diversus"), a Delaware corporation, will be merged with and into PCH with PCH as the
survivor. PCH is offering shares of its common stock for sale in an initial public offering (the
"Offering") with preference in the subscription phase to, among others, policyholders and named
insureds of PIPE and PCA, and any unsubscribed shares offered to other investors in community
or syndicated offerings.
This Appraisal is furnished in accordance with PIPE's Plan of Conversion and Title 40 of
the Pennsylvania Statutes ("40 P.S."), Chapter 35 - Medical Professional Liability Reciprocal
Exchange-to-Stock Conversion, Sections 3501 to 3517. As specified by the Plan of Conversion
and 40 P.S., Chapter 35, Section 3503(a)(d), the estimated pro forma market value of the capital
stock of PIPE shall be determined by an independent valuation expert and shall represent the
estimated pro forma market value of the stock company as successor to the reciprocal insurer.
Furthermore, as permitted by Section 3503(a)(d), the pro forma market value may be stated as a

FELDMAN FINANCIAL ADVISORS, INC.
2
range of value and may be that value that is estimated to be necessary to attract full subscription
for the shares offered for sale.
Feldman Financial Advisors, Inc. ("Feldman Financial") is a financial consulting and
economic research firm that specializes in financial valuations and analyses of business
enterprises and securities in the financial services industries. The background of Feldman
Financial is presented in Exhibit I.
In preparing the Appraisal, we conducted an analysis of PIPE that included discussions
with PIPE's management and an onsite visit to PIPE's headquarters. We reviewed the unaudited
financial statements of PIPE as prepared under generally accepting accounting principles
("GAAP") as of and for the years ended December 31, 2013 and 2014 and unaudited financial
statements as of and for the six months ended June 30, 2014 and 2015. PIPE had available
audited statutory financial statements for December 31, 2013 and 2014, but did not have audited
GAAP financial statements for the corresponding periods. The unaudited GAAP financial
statements furnished to us by PIPE for December 31, 2013 and 2014 were internally prepared
based on the audited GAAP consolidated financial statements of Physicians' Insurance Program
Management Company ("PIPMC"), which serves as the attorney-in-fact for PIPE and
administers and manages the insurance operations of PIPE. In addition, where appropriate, we
considered information based on other available published sources that we believe are reliable;
however, we cannot guarantee the accuracy and completeness of such information.
In preparing the Appraisal, we also reviewed and analyzed: (i) financial and operating
information with respect to the business, operations, and prospects of PIPE as furnished to us
PIPE; (ii) publicly available information concerning PIPE that we believe to be relevant to our
analysis; (iii) a comparison of the historical financial results and present financial condition of
FELDMAN FINANCIAL ADVISORS, INC.
3
PIPE with those of selected publicly traded insurance companies that we deemed relevant; and
(iv) financial performance and market valuation data of certain publicly traded insurance
industry aggregates as provided by industry sources.
The Appraisal is based on PIPE's representation that the financial data and additional
information materials furnished to us by PIPE are truthful, accurate, and complete. We did not
independently verify the financial statements and other information provided by PIPE, nor did
we independently value the assets or liabilities of PIPE. The Appraisal considers PIPE only as a
going concern on a stand-alone basis and should not be considered as an indication of the
liquidation value of PIPE.
Our Appraisal is not intended, and must not be construed, to be a recommendation of any
kind as to the advisability of purchasing shares of common stock of PCH in the Offering.
Moreover, because the Appraisal is necessarily based upon estimates and projections of a
number of matters, all of which are subject to change from time to time, no assurance can be
given that persons who purchase shares of common stock of PCH in the Offering will thereafter
be able to sell such shares at prices related to the foregoing estimate of PIPE's pro forma market
value.
The Appraisal reflects only the Valuation Range as of the Valuation Date for the
estimated pro forma market value of PIPE in connection with the Conversion and does not take
into account any trading activity with respect to the purchase and sale of common stock of PCH
in the secondary market on the date of issuance of such securities or at any time thereafter
following the completion of the Offering. Feldman Financial is not a seller of securities within
the meaning of any federal or state securities laws and any report prepared by Feldman Financial
shall not be used as an offer or solicitation with respect to the purchase or sale of any securities.

FELDMAN FINANCIAL ADVISORS, INC.
4
The Valuation Range reported herein will be updated as appropriate. These updates will
consider, among other factors, any developments or changes in PIPE's operating performance,
financial condition, or management policies, and current conditions in the securities markets for
insurance company common stocks. Should any such new developments or changes be material,
in our opinion, to the estimated pro forma market value of PIPE, appropriate adjustments to the
Valuation Range will be made. The reasons for any such adjustments will be explained in detail
at that time.
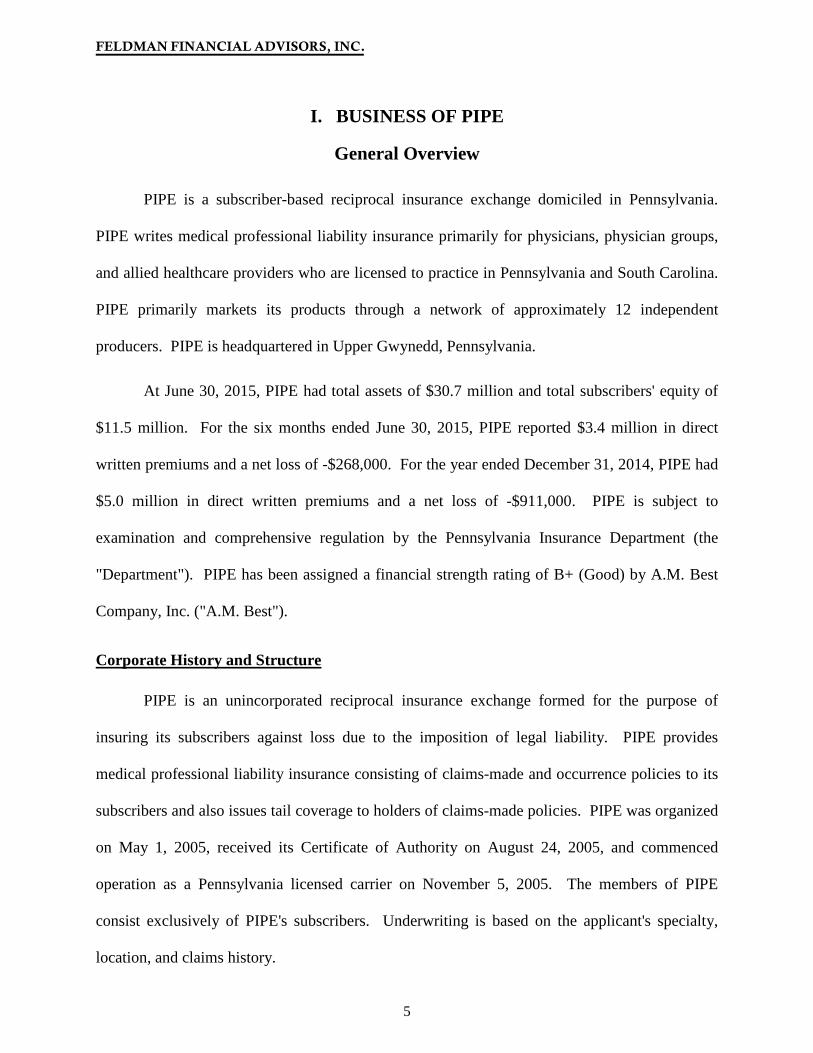
FELDMAN FINANCIAL ADVISORS, INC.
5
I. BUSINESS OF PIPE
General Overview
PIPE is a subscriber-based reciprocal insurance exchange domiciled in Pennsylvania.
PIPE writes medical professional liability insurance primarily for physicians, physician groups,
and allied healthcare providers who are licensed to practice in Pennsylvania and South Carolina.
PIPE primarily markets its products through a network of approximately 12 independent
producers. PIPE is headquartered in Upper Gwynedd, Pennsylvania.
At June 30, 2015, PIPE had total assets of $30.7 million and total subscribers' equity of
$11.5 million. For the six months ended June 30, 2015, PIPE reported $3.4 million in direct
written premiums and a net loss of -$268,000. For the year ended December 31, 2014, PIPE had
$5.0 million in direct written premiums and a net loss of -$911,000. PIPE is subject to
examination and comprehensive regulation by the Pennsylvania Insurance Department (the
"Department"). PIPE has been assigned a financial strength rating of B+ (Good) by A.M. Best
Company, Inc. ("A.M. Best").
Corporate History and Structure
PIPE is an unincorporated reciprocal insurance exchange formed for the purpose of
insuring its subscribers against loss due to the imposition of legal liability. PIPE provides
medical professional liability insurance consisting of claims-made and occurrence policies to its
subscribers and also issues tail coverage to holders of claims-made policies. PIPE was organized
on May 1, 2005, received its Certificate of Authority on August 24, 2005, and commenced
operation as a Pennsylvania licensed carrier on November 5, 2005. The members of PIPE
consist exclusively of PIPE's subscribers. Underwriting is based on the applicant's specialty,
location, and claims history.

FELDMAN FINANCIAL ADVISORS, INC.
6
PIPE is managed by Physicians' Insurance Program Management Company ("PIPMC")
pursuant to the terms of an Attorney-in-Fact Agreement between PIPE and PIPMC, effective
August 24, 2005. Pursuant to the terms of the agreement, PIPMC provides marketing,
underwriting, claims administration, information technology support, administrative and
investment services to PIPE and pays certain expenses on behalf of PIPE (including agents' and
other sales commissions) in exchange for compensation not exceeding 25% of direct premiums
written.
Diversus was formed in 2013 for the purpose of acquiring and consolidating both fee-
based and risk-bearing companies participating in the medical professional liability ("MPL")
insurance market. On June 4, 2014, Diversus acquired the attorney-in-fact and management
company for PCA. On July 7, 2015, Diversus entered into an agreement to acquire all of the
outstanding capital stock of PIPMC and an agreement to acquire the medical professional
liability insurance accounts, including a large number of PIPE insureds, from an insurance
agency affiliate of PIPMC. Diversus expects the closing on the acquisition of PIPMC and the
accounts to occur on or before the effective date of the Conversions of PIPE and PCA and the
merger into PCH.
PIPMC has the power to direct the activities of PIPE that most significantly impact the
economic performance of PIPE by acting as the common attorney-in-fact and decision maker for
the subscribers at PIPE. All medical professional liability operations are owned by PIPE, and
PIPMC functions solely as the management company. The stockholders of PIPMC, through the
management fee, are deemed to have a controlling financial interest in PIPE; however, they have
no other rights to or obligations arising from the assets and liabilities of PIPE.

FELDMAN FINANCIAL ADVISORS, INC.
7
Reciprocal Insurance Exchange
A reciprocal insurance exchange involves the organization of two separate entities: the
reciprocal insurance exchange and the attorney-in-fact ("AIF"). The reciprocal insurance
exchange functions as a form of unincorporated association in which subscribers exchange
policies through an AIF in transaction that share or spread the risk. When a subscriber suffers a
loss that is outlined in the exchange's agreement, the pooled premiums are used to pay the claim.
Each member's liability ends according to the cost and terms of their individual policies. The
reciprocal insurer is overseen by a board whose responsibilities typically include general
oversight of the reciprocal, selection and monitoring of the AIF, and approval of vendor
relationships.
The AIF is a separate legal entity that runs the day-to-day affairs of the reciprocal insurer.
The policyholders of a reciprocal, usually called subscribers, provide a power of attorney to the
AIF, giving the AIF legal authority to act on their behalf in managing and administering the
reciprocal. A formal management contract is entered into between the AIF and the reciprocal.
The AIF may be owned by the reciprocal itself (a proprietary AIF) or by an independent third
party (a non-proprietary AIF) or a combination of both.
Product Lines and Distribution
PIPE primarily writes claims-made and occurrence based medical malpractice insurance
for healthcare providers practicing in Pennsylvania and, to a much lesser extent, South Carolina.
PIPE also issues tail occurrence policies to former claims-made policyholders. PIPMC
administers and directs essentially all of the insurance operations of PIPE. In exchange for these
services, PIPMC receives fee income paid from PIPE. PIPE primarily markets its products

FELDMAN FINANCIAL ADVISORS, INC.
8
through a network of approximately 12 independent producers. Producers are compensated on a
fixed commission rate with the commission rate linked to premium billings received by PIPE.
PIPE offers policy coverage to Pennsylvania physicians up to the statutory limits of
$500,000 per each medical incident, with a $1.5 million annual aggregate. PIPE continues to
work predominantly with producers who specialize in physician malpractice. In the midst of a
marketplace that continues to be relatively soft, PIPE seeks to identify producers that already
understand the MPL business and share its philosophy that the policyholders' interests are always
primary. PIPE continues to place a high emphasis on business retention. In marketing its
products, PIPE emphasizes that it understands that insurance coverage needs to be priced
reasonably and that sound risk management practices help curb medical incidents. PIPE's goal is
to make available the best priced products to its subscribers, as well as provide advice from a
highly qualified team regarding the particular insurance needs of each subscribers.
On October 15, 2013, PIPE received a license to issue casualty policies in South
Carolina. The medical malpractice rates to be offered in South Carolina by PIPE were approved
on January 7, 2014. For the year ended December 31, 2014, PIPE generated $47,000 of direct
premiums written in South Carolina. For the six months ended June 30, 2015, direct written
premiums in South Carolina amounted to $30,000. PIPE plans to continue to expand its product
marketing efforts in South Carolina.
Claims-made policies provide coverage for claims only when both the alleged incident
and the resulting claim happen during the policy period, so long as there is sufficient aggregate
limit available for the alleged event. Claims-made policies provide coverage so long as the
insured continues to pay premiums for the initial policy and any subsequent renewals. Each
succeeding year the policy is continuously renewed, the coverage period is extended. Once

FELDMAN FINANCIAL ADVISORS, INC.
9
premiums stop the coverage stops. Claims made to the insurance company after the coverage
period ends will not be covered, even if the alleged incident occurred while the policy was in
force. A claims-made policy will cover claims after the coverage period only if the insured
purchases extended reporting period or "tail" coverage.
Occurrence policies protect subscribers from any covered incident that "occurs" during
the policy period, regardless of when a claim is filed. An occurrence policy will respond to
claims that come in -- even after the policy has been canceled -- so long as the incident occurred
during the period in which coverage was in force. In effect, an occurrence policy offers
permanent coverage for incidents that occur during the policy period.
If the retroactive date is the beginning of the policy period, the claims-made policy is
relatively inexpensive and is called "first-year" claims-made. However, as the number of years
from the retroactive date increases, the policy "matures," and the premiums increase each year
using "step factors" until reaching the mature level. Each year the policy continuously renews,
the coverage period expands, and the insurance company's exposure to loss increases. Mature
claims-made rates are typically very close occurrence rates for the same exposure.
Claims-made coverage has replaced occurrence coverage as the most common type of
policy offered by MPL insurance companies. A number of factors are behind this evolution,
including the fact that reduced carrier liability under claims-made policies can mean slightly
lower premiums for insureds. PIPE has offered both claim-made and occurrence coverage
policies since its inception in 2005. Approximately 67% its premium written over the past ten
years has been for claims-made policies and the approximately 33% for occurrence products.
For the six months ended June 30, 2015, PIPE generated $3.4 million in direct premiums
written and $2.0 million or 58.2% was comprised of claims-made policies and $1.4 million or

FELDMAN FINANCIAL ADVISORS, INC.
10
41.8% was for occurrence policies. Direct premiums written in South Carolina amounted to
$30,000 or 0.9% of PIPE's overall total for the first half of 2015 with the remainder in
Pennsylvania. For the year ended December 31, 2014, PIPE generated $5.0 million in direct
premiums written and $2.9 million or 58.2% was comprised of claims-made policies and $2.1
million or 41.8% was for occurrence policies. Direct premiums written in South Carolina
amounted to $47,000 or 0.9% of PIPE's overall total in 2014. For the year ended December 31,
2013, PIPE generated $5.8 million in direct premiums written and $3.1 million or 54.6% was for
claims-made policies and $2.6 million or 45.4% comprised occurrence policies.
Executive Management
Eugene Ziemba, Sr. serves as the President and Chief Executive Officer of PIPE and has
over 40 years experience in the medical professional liability field. Most of the years were spent
in Pennsylvania and Massachusetts with the Medical Protective Company. Mr. Ziemba's
experience includes all aspects of the business specializing in claims and underwriting. Mr.
Ziemba is also the liaison for the Police Department and Fire Department in Upper Gwynedd
Township, and active on both the community and the state level. He has a B.S. degree in
Business Administration from King's College.
Daniel Payne, CPA, CFP, is the Chief Financial Officer and Secretary/Treasurer for
PIPE. He is a veteran of the U.S. Air Force and has 20 years experience in the insurance
industry as an agent, external auditor, consultant, and corporate employee. As a prior Partner in a
CPA firm, Mr. Payne has worked in a variety of business environments including governmental,
aviation, banking, insurance, non-profit, manufacturing, wholesale, and retail entities. He also
provided individual, trust, and corporate tax services for clients along with investment
management and insurance services. He remains a licensed investment adviser representative
FELDMAN FINANCIAL ADVISORS, INC.
11
and insurance agent for both property/casualty and life. Mr. Payne has been working with PIPE
since its inception in 2005.
Meredith Ziemba is the Vice President for PIPE. She received her B.S. degree in
Communications from Villanova University. Ms. Ziemba has been involved in the insurance
industry for 15 years, starting her own property and casualty insurance agency in 1998. As a
result of this background, she is experienced in many aspects of the insurance industry. In 2005,
she developed a direct relationship with PIPE, selling her agency in 2010, to take a permanent
position with PIPE.
Reasons for the Conversion
Like most insurance companies, PIPE's premium growth and underwriting results have
been, and continue to be, influenced by market conditions. The MPL insurance industry
historically is cyclical in nature, characterized by periods of significant price competition and
excess underwriting capacity (a soft market) followed by periods of high premium rates and
shortages of underwriting capacity (a hard market). The MPL insurance industry is currently
operating under soft market conditions as a result of abundant capacity, with significant
competition and pressure on premium rates following several years of overall favorable claims
trends. During 2008 through 2014, premium rates declined in PIPE's core Pennsylvania market,
primarily as a result of improved claims frequency, and premium rates have remained relatively
level in 2015.
PIPE competes with MPL specialty insurers and alternative risk arrangements, as well as
other large national property and casualty insurance companies that write medical professional
liability insurance. Theses competitors include companies that have substantially greater
financial resources and solid financial strength ratings. PIPE also faces competition from other
FELDMAN FINANCIAL ADVISORS, INC.
12
insurance companies for the services and allegiance of independent agents and brokers, on whose
services PIPE depends in marketing its insurance products. PIPE seeks to compete based on
quality and speed of service, but does not have the capital to engage in long-term price
competition with some of its competitors. Over-capacity in the MPL market has led many
market participants to seek acquisitions in order to generate revenue growth.
PIPE is currently assigned a financial strength rating of B+ (Good) with a negative
outlook by A.M. Best. Financial strength ratings from A.M. Best are used by producers and
customers as a means of assessing the financial strength and quality of insurers. To accomplish
the goal of generating material growth in premiums written, PIPE recognizes that it must obtain
an increased A.M. Best rating. In order to achieve a more favorable rating, PIPE believes that it
needs to enhance operating performance to levels satisfactory to A.M. Best, as well as satisfy
various other rating requirements. Therefore, the primary purpose of the stock conversion and
merger into New PCA is to increase PIPE's access to capital resources, expand market share
penetration, broaden premium growth opportunities, and improve the outlook for obtaining a
higher financial strength rating.
As a result of the Conversion, PIPE will merge with and into New PCA, and PIPE will no
longer exist as a separate company. The resulting increase in capitalization should permit New
PCA to (i) increase direct premium volume to the extent competitive conditions permit; (ii)
increase net premium volume by decreasing reliance on reinsurance; and (iii) enhance
investment income by increasing New PCA's investment portfolio. Additionally, New PCA
intends to pursue the assignment of a financial strength rating from A.M. Best.
The remainder of Chapter I examines in more detail the trends addressed in this section,
including the impact of changes in PIPE's economic and competitive environment, and PIPE's

FELDMAN FINANCIAL ADVISORS, INC.
13
recent financial performance. The discussion is supplemented by the exhibits in the Appendix.
Exhibit III-1 displays PIPE's unaudited balance sheets as of December 31, 2013 and 2014 and
June 30, 2015. Exhibit III-2 presents PIPE's unaudited income statements for the years ended
December 31, 2013 and 2014 and the six months ended June 30, 2014 and 2015.

FELDMAN FINANCIAL ADVISORS, INC.
14
Financial Condition
Table 1 presents selected data concerning PIPE's financial position as of December 31,
2012 to 2014 and June 30, 2015. Exhibit III-1 presents PIPE's balance sheets as of December
31, 2013 and 2014 and June 30, 2015. The financial data presentation for PIPE in the tables
below and in Exhibits III-1 to III-4 is derived from the GAAP financial statements of PIPE.
Statutory financial data for PIPE is included in Exhibit III-5 and provides a five-year overview of
PIPE's operating trends.
Table 1 Selected Financial Condition Data As of December 31, 2012 to 2014 and June 30, 2015 (Dollars in Thousands)
PIPE's total assets decreased by 2.3% from $32.7 million at December 31, 2013 to $31.9
million at December 31, 2014. The $765,000 million decrease in total assets primarily reflected
a $1.8 million decrease in reinsurance recoverable to zero at year-end 2014 and a $508,000
decrease in prepaid reinsurance premiums to zero at year-end 2014. The reinsurance deposit
June 30,2015 2014 2013 2012
Balance Sheet DataTotal assets $30,691 $31,914 $32,679 $33,120Total cash and investments 26,637 28,485 27,800 28,825 Total policy reserves (1) 15,555 16,262 15,930 16,047 Unearned premiums 2,959 2,121 2,436 2,560 Total liabilities 19,219 20,064 20,181 20,539 Total equity 11,472 11,850 12,497 12,581
Total equity / total assets 37.38% 37.13% 38.24% 37.99%Cash and investments / total assets 86.79% 89.26% 85.07% 87.03%Policy reserves / total assets 50.68% 50.96% 48.75% 48.45%
(1) Total policy reserves equal losses and loss adjustment expenses.
Source: PIPE, unaudited GAAP financial statements.
December 31,
FELDMAN FINANCIAL ADVISORS, INC.
15
increased from zero at year-end 2013 to $1.2 million at year-end 2014. PIPE changed its method
of accounting for its reinsurance contract to the deposit method of accounting in response to a
requirement by the Department following a recent examination. Receipts and disbursements
related to the reinsurance contract are recorded through PIPE's deposit account, which had a
balance of $1.2 million as of December 31, 2014.
The aggregate balance of cash and short-term investments increased by $2.9 million from
$1.7 million at December 31, 2013 to $4.6 million at December 31, 2014 as a result of
reinsurance commutation received on December 31, 2014. Investment securities declined by
$2.2 million from $26.1 million at December 31, 2013 to $23.9 million at December 31, 2014
due to settlement payments from bond maturities. Total cash and investments increased by
$686,000 or $2.5% from $27.8 million at December 31, 2013 to $28.5 million at December 31,
2014. Total cash and investments increased from 85.1% of total assets at year-end 2013 to
89.3% at year-end 2014.
Total policy reserves increased by $332,000 or 2.1% from $15.9 million at December 31,
2013 to $15.8 million at December 31, 2014. Total policy reserves are unpaid losses and loss
expenses, which are estimates of future payments on reported and unreported claims for losses
and related expenses. The increase in policy reserves in 2014 was primarily attributable to an
increase in the estimated unpaid losses for occurrence coverage. Unearned premiums declined
by $315,000 from $2.4 million at December 31, 2013 to $2.1 million at December 31, 2014.
Total equity decreased by $647,000 or 5.2% from $12.5 million at year-end 2013 to $11.9
million at year-end 2014. Accordingly, the ratio of total equity to total assets decreased from
38.2% at December 31, 2013 to 37.1% at December 31, 2014.
FELDMAN FINANCIAL ADVISORS, INC.
16
PIPE's aggregate balance of cash and investments amounted to $28.5 million at
December 31, 2014 and constituted a sizeable concentration (89.3%) of total assets. PIPE's
primary sources of cash are premiums, investment income, and sales and maturities of
investment securities. PIPE's primary uses of cash are policy acquisitions costs (primarily
commissions), payments on claims, investment purchases, and general and administrative
expenses. Cash and short-term investments amounted to $4.6 million at December 31, 2014 and
investment securities totaled $23.9 million. Exhibit III-3 presents PIPE's investment portfolio as
of December 31, 2014. All of PIPE's investment securities are classified as available for sale and
carried at fair value, with unrealized gains of losses, net of any income tax effects, included in
accumulated other comprehensive income. PIPE generally follows a buy-and-hold investment
philosophy in managing its securities portfolio and seeks stable and consistent interest yields.
PIPE does not have any investments in derivative financial instruments, mortgage loans, or real
estate.
Consistent with its investment policy, PIPE's investment portfolio primarily comprises
fixed-income debt securities. As of December 31, 2014, PIPE's investments securities totaled
$23.9 million and consisted of $1.3 million (5.3%) of U.S. Government securities, $2.3 million
(9.8%) of mutual funds holding equity securities and money market investments, $3.4 million
(14.2%) of general obligations of states and political subdivisions of states, $7.1 million (29.8%)
of mortgage-backed securities primarily issued or guaranteed by U.S. Government sponsored
enterprises, and $9.8 million (40.9%) of corporate and industrial bonds. PIPE's net yield on
invested assets was 2.74% for the year ended December 31, 2014, down from 3.50% for the year
ended December 31, 2013.

FELDMAN FINANCIAL ADVISORS, INC.
17
Investment security ratings are issued by the National Association of Insurance
Commissioners ("NAIC") and are similar to the rating agency designations for marketable bonds
as prepared by nationally recognized statistical rating organizations such as Standard & Poor's
and Moody's Investors Services. NAIC ratings of 1 and 2 include bonds that are generally
considered investment grade by such ratings organizations. NAIC ratings of 3 through 6 include
bonds generally considered below investment grade. As of December 31, 2014, PIPE's bonds
carried the following NAIC ratings: NAIC 1 - $14.8 million (70.2%); NAIC 2 - $3.2 million
(15.2%); NAIC 3 - $2.0 million (9.6%); and NAIC 4 - $1.1 million (5.0%).
In accordance with insurance industry practice, PIPE reinsures a portion of its loss
exposure and pays to the reinsurers a portion of the premiums received on all policies reinsured.
Insurance policies written by PIPE are reinsured with other insurance companies principally to:
(i) reduce net liability on individual risks; (ii) mitigate the effect of individual loss occurrences;
(iii) stabilize underwriting results; (iv) decrease leverage; and (v) increase underwriting capacity.
Reinsurance contracts do not relieve PIPE of its obligations to subscribers. PIPE currently has a
reinsurance contract with Wesco Insurance Company ("Wesco"), a wholly owned subsidiary of
AmTrust Financial Services, Inc. PIPE's relationship with Wesco began in 2008 and the current
contract reflects a four-year term from January 1, 2012 to January 1, 2016. Wesco currently has
an A.M. Best financial strength rating of A (Excellent).
The reinsurance coverage provides limits of $400,000 per claim in excess of a retention
of $100,000 per claim in respect of policies issued by PIPE with limits of $500,000 or less (the
overwhelming majority of PIPE insureds) and $800,000 per claim in excess of $200,000 per
claim in respect of policies issued by PIPE with limits of greater than $500,000 per claim.
PIPE ceded to its reinsurer $1.6 million and $508,000 of earned premiums for the years ended

FELDMAN FINANCIAL ADVISORS, INC.
18
December 31, 2013 and 2014, respectively. As mentioned previously, PIPE has a reinsurance
deposit account that had an outstanding balance of $1.2 million as of December 31, 2014.
PIPE's total assets declined by 6.5% from $31.9 million at December 31, 2014 to $30.7
million at June 30, 2015. On the asset side of the balance sheet, the $1.2 million reduction in
total assets was largely attributable to a decrease of $1.8 million in cash and investments. On the
liability side of the balance sheet, total policy reserves decreased by $707,000 and advanced
premiums declined by $896,000 from December 31, 2014 to June 30, 2015. PIPE's total equity
capital, as measured under GAAP, decreased from $11.9 million (37.1% of total assets) at
December 31, 2014 to $11.5 million (37.4% of total assets) at June 30, 2015. The decrease in
PIPE's equity capital was due to unprofitable operations registered by PIPE during the year-to-
date ("YTD") period ended June 30, 2015. In addition, equity capital was also affected by a
decrease in the amount of net unrealized securities gains from $219,000 at December 31, 2014 to
$103,000 at June 30, 2015.

FELDMAN FINANCIAL ADVISORS, INC.
19
Income and Expense Trends
Table 2 displays PIPE's earnings results and selected operating ratios for 2013 and 2014
and the first half of 2015. Exhibit III-2 displays PIPE's income statements for 2013 and 2014
and the first half of 2015. PIPE's operating results are influenced by factors affecting the MPL
insurance sector in general. The performance of the MPL insurance sector is subject to
significant variations due to competition, regulation, general economic conditions, claims
reporting and settlement patterns, judicial decisions, impact of healthcare legislation and tort
reform, fluctuations in interest rates, and other factors. PIPE's premium growth and underwriting
results are influenced by market conditions. Pricing in the MPL insurance industry historically
has been cyclical with the financial performance of insurers fluctuating from periods of low
premium rates and excess underwriting capacity resulting from increased competition (soft
market), followed by periods of high premium rates and a shortage of underwriting capacity
resulting from decreased competition (hard market).
There has not been a hard market in the MPL arena in almost a decade. Rates have
continued to decline across all healthcare subsectors and capacity has grown substantially as new
players have entered the market. Underwriters are accepting what appears to be a permanent,
competitive landscape. The main reason for the continuing soft market is that the ratio of supply
to demand has never been greater. New carrier entrants to both the primary and excess
marketplace, as well as the supply of ample reinsurance, offer buyers more options than ever.
Overlay the tremendous consolidation among healthcare organizations and the trend toward the
employment of physicians who had once been separately insured, and these forces have led to
more carriers fighting over a shrinking customer base. As a result, pricing has naturally declined
in this macro-economic environment.

FELDMAN FINANCIAL ADVISORS, INC.
20
For the Years Ended December 31, 2014 and 2013
PIPE recorded a net loss of -$911,000 for the year ended December 31, 2014, marking a
decrease from net income of $741,000 for the year ended December 31, 2013. Although net
premiums earned increased by $549,000 or $12.8% from $4.3 million in 2013 to $4.8 million in
2014, net investment income declined by $395,000 or 34.2% from $1.2 million in 2013 to
$759,000 in 2014. As a result, total revenue increased moderately by 2.8% from $5.4 million in
2013 to $5.6 million in 2014. PIPE experienced a large underwriting loss in 2014 versus nearly
breakeven underwriting results in 2013, which contributed to the net loss for 2014.
Direct premiums written decreased by 12.9% from $5.8 million in 2013 to $5.0 million in
2014. The ceded rate on direct premiums written declined from 27.6% in 2013 to 0.0% in 2014
as PIPE changed to the deposit method of accounting to record its reinsurance activity. As a
result, net premiums written were equal to direct premiums written in 2014 with a corresponding
result of $5.0 million that was 20.4% higher than net premiums written of $4.2 million in 2013.
Loss and loss adjustment expenses increased by $2.4 million from $2.3 million for the year
ended December 31, 2013 to $4.7 million for the year ended December 31, 2014. General
operating expenses increased by 2.0% to $2.1 million in 2014.
A key measurement of the profitability of any insurance company for any period is its
combined ratio, which is equal to the sum of its loss ratio and its expense ratio. However,
investment income, federal income taxes and other non-underwriting income or expense are not
reflected in the combined ratio. The profitability of property and casualty insurance companies
depends on income from underwriting, investment, and service operations. Underwriting results
are considered profitable when the combined ratio is under 100% and unprofitable when the
combined ratio is over 100%.

FELDMAN FINANCIAL ADVISORS, INC.
21
Table 2 Selected Operating Performance Data For the Years Ended December 31, 2013 and 2014
And the Six Months Ended June 30, 2014 and 2015 (Dollars in Thousands)
2015 2014 2014 2013Income Statement DataDirect premiums written 3,359$ 3,423$ 5,022$ 5,764$ Net premiums written 3,359 2,490 5,022 4,172
Net premiums earned 2,520$ 2,012$ 4,829$ 4,280$ Investment income, net of expenses 269 478 759 1,154 Total revenue 2,788 2,490 5,588 5,434
Losses and loss adjustment expenses 2,377 4,086 4,692 2,322 General operating expenses 907 1,110 2,053 2,012 Total claims and expenses 3,284 5,197 6,745 4,334
Income (loss) before income taxes (496) (2,707) (1,157) 1,100 Income tax expense (benefit) (228) (620) (247) 359 Net income (loss) (268)$ (2,087)$ (911)$ 741$
Operating RatiosReturn on average assets (1) -0.86% -6.55% -2.82% 2.31%Return on average equity (1) -2.25% -17.93% -7.48% 6.20%Loss ratio (2) 94.34% 203.15% 97.18% 54.25%Expense ratio (3) 36.00% 55.20% 42.51% 47.00%Combined ratio (4) 130.34% 258.35% 139.68% 101.25%
(1) Annualized ratios for the six-month periods in 2014 and 2015.(2) Losses and loss adjustment expenses divided by net premiums earned.(3) Underwriting expenses divided by net premiums earned.(4) Sum of the loss ratio and the expense ratio.
Source: PIPE, unaudited GAAP financial statements.
Six Months Ended For the Years EndedJune 30, December 31,

FELDMAN FINANCIAL ADVISORS, INC.
22
Table 3 provides underwriting performance summary data for PIPE for the years ended
December 31, 2013 and 2014 and the six months ended June 30, 2014 and 2015.
Table 3 Underwriting Performance Data
For the Years Ended December 31, 2013 and 2014 And the Six Months Ended June 30, 2014 and 2015
(Dollars in Thousands)
As shown in Table 3, PIPE's combined ratio increased from 101.3% in 2013 to 139.7% in
2014. The increase in PIPE's combined ratio was attributable to the higher loss ratio in 2014,
which primarily reflects the increased level of losses and loss adjustment expenses incurred. The
expansion of the loss ratio from 54.3% in 2013 to 97.2% in 2014 resulted mainly from negative
2015 2014 2014 2013
Net premiums earned 2,520$ 2,012$ 4,829$ 4,280$
Losses and loss adjustment expenses 2,377 4,086 4,692 2,322 General operating expenses 907 1,110 2,053 2,012 Total claims and expenses 3,284 5,197 6,745 4,334
Underwriting profit (loss) (764)$ (3,185)$ (1,916)$ (54)$
Operating RatiosLoss ratio (1) 94.34% 203.15% 97.18% 54.25%Expense ratio (2) 36.00% 55.20% 42.51% 47.00%Combined ratio (3) 130.34% 258.35% 139.68% 101.25%
(1) Losses and loss adjustment expenses divided by net premiums earned.(2) Underwriting expenses divided by net premiums earned.(3) Sum of the loss ratio and the expense ratio.
Source: PIPE, unaudited GAAP financial statements.
Six Months Ended For the Years EndedJune 30, December 31,

FELDMAN FINANCIAL ADVISORS, INC.
23
underwriting results in the 2011 and 2009 occurrence years and an increase in the estimated
unpaid losses for occurrence coverage. PIPE's expense ratio actually declined from 47.0% in
2013 to 42.5% in 2014. Reflective of the higher combined ratio, PIPE's experienced an
underwriting loss of -$1.9 million for 2014 as compared to an underwriting loss of -$54,000 in
2013.
For the Six Months Ended June 30, 2015 and 2014
PIPE reported a net loss of -$268,000 for the six months ended June 30, 2015, compared
to a net loss of -$2.1 million for the six months ended June 30, 2014. The narrowing of the net
loss position was due primarily to a decrease of $1.9 million in losses and loss adjustment
expenses from $4.1 million in the YTD 2014 period to $2.4 million in the YTD 2014 period,
along with an increase of $508,000 in net premiums earned from $2.0 million in the first half of
2014 to $2.5 million for the first half of 2015. Net investment income declined to $269,000 for
the YTD 2015 period, compared to $478,000 for the YTD 2014 period. General operating
expense declined by 18.3% from $1.1 million for the YTD 2014 period to $907,000 for the YTD
2015 period.
PIPE's loss ratio declined from 203.2% for the six months ended June 30, 2014 to 94.3%
for the six months ended June 30, 2015. Similarly, PIPE's expense ratio decreased from 55.2%
for the six months ended June 30, 2014 to 36.0% for the six months ended June 30, 2015.
Overall, the combined ratio decreased from 258.4% in the YTD 2014 period to 130.3% for the
YTD 2015 period, but continued to signify negative underwriting results. PIPE's annualized
return on average assets ("ROA") for the six months ended June 30, 2015 was -0.86% and its
annualized return on average equity ("ROE") was -6.55% for the YTD 2015 period.

FELDMAN FINANCIAL ADVISORS, INC.
24
Statutory Financial Data Overview
State insurance laws and regulations require PIPE to file financial statements with state
insurance departments everywhere it does business, and the operations of PIPE are subject to
examination by those departments. PIPE prepares statutory financial statements in accordance
with accounting practices and procedures prescribed or permitted by these departments. Certain
accounting standards differ under statutory accounting practices ("SAP") as compared to GAAP.
For example, premium income is recognized on a pro rata basis over the term covered by the
insurance policy, while the related acquisition costs are expensed when incurred under SAP.
Under GAAP, both premium income and the related policy acquisition costs are recognized on a
pro rata basis over the term of the insurance policy. In addition, surplus notes are considered a
part of policyholders' surplus under SAP, but are excluded from equity capital under GAAP.
Therefore, the GAAP operating results and financial data for PIPE do not correspond to the SAP
presentation.
Exhibit III-5 presents summary statutory financial data for PIPE over the five-year period
for the years ended December 31, 2010 to 2014. As illustrated, PIPE's direct premiums written
declined by 31.5% from $7.3 million in 2010 to $5.0 million. Concurrently, net underwriting
results varied from breakeven to losses in different years over the five-year period. Reflective of
general market and interest rate conditions, PIPE's net yield on invested assets declined from
4.13% in 2011 to 3.99%, 3.50%, and 2.74% in 2012, 2013, and 2014, respectively. On a
statutory basis, PIPE's earnings remained positive in each year during the 2010 to 2014 period,
supported by the investment returns. However, net underwriting losses contributed to a sharp
downturn in net profits for 2014. PIPE's statutory surplus increased from $8.9 million at
December 31, 2010 to $11.7 million at December 31, 2014.

FELDMAN FINANCIAL ADVISORS, INC.
25
II. INDUSTRY FUNDAMENTALS
Industry Performance and Outlook
The property and casualty ("P&C") segment of the insurance industry provides protection
from risk into two basic areas. In general, property insurance protects an insured against
financial loss arising out of loss of property or its use caused by an insured peril. Casualty
insurance protects the insured against financial loss arising out of the insured's obligation to
others for loss or damage to persons, including, with respect to workers compensation insurance,
persons who are employees, or property. There are approximately 3,000 companies providing
property and casualty insurance coverage in the United States. About 100 of these companies
provide the majority of the property and casualty coverage.
Historically, the financial performance of the P&C insurance industry has tended to
fluctuate in cyclical periods of aggressive price competition and excess underwriting capacity
(known as a soft market), followed often by periods of high premium rates and shortages of
underwriting capacity (or a hard market). Although an individual insurance company's financial
performance is dependent on its own specific business characteristics, the profitability of most
property and casualty insurance companies tends to follow this cyclical market pattern. During
soft market conditions, premium rates are stable or falling and insurance coverage is readily
available. During periods of hard market conditions, coverage may be more difficult to find and
insurers increase premiums or exit unprofitable areas of business.
Although it comprises just over 2% of annual direct premiums for the U.S. P&C
insurance industry, the MPL insurance sector is integral to the U.S. healthcare system, which
accounts for almost one-fifth of the nation's gross domestic product. The MPL sector has

FELDMAN FINANCIAL ADVISORS, INC.
26
historically been among the most volatile sectors in the insurance industry. The MPL sector has
broadly outperformed the overall P&C sector as a result of strong pricing in the early 2000s,
coupled with substantially reduced claims frequency. However, in the current market,
historically strong operating margins are likely to come under pressure due to intense premium
rate competition and lower fixed-income investment returns. MPL claims have been trending
down since the past decade as a result of favorable judicial decisions, as well as state-level tort
reform measures. As a result, most MPL insurers have reported favorable reserve development
trends and continued profitability.
The year 2014 marked a year of financial stability for the MPL insurance industry,
despite a continued decline in profitability. While the industry's operating ratio remained under
100%, it increased by several percentage points over the prior year as it has done for each year
since 2010. Insurers continued to experience a decline in reserve releases, increased expenses,
and diminished investment income. Despite the decline in profitability, the MPL industry
returned a substantial portion of its income in 2014 as dividends to policyholders. Surplus grew
slightly in 2014, leaving the industry in a financial position roughly consistent with where it has
been since year-end 2011.
Direct premiums written in the MPL sector declined by 1.2% from $9.8 billion in 2013 to
$9.7 billion in 2014, denoting the eighth consecutive years of decreases for the MPL industry.
Premium rates continue to fall for many writers of MPL insurance, as evidenced by the declining
premium volume of the industry as a whole. It is not uncommon for companies to find
themselves forced to choose between writing policies at rates perceived to be inadequate or lose
market share. MPL insurers are also faced with declining market share due to the acquisition of
physician practices by hospitals and healthcare systems, as well as the preference of newly

FELDMAN FINANCIAL ADVISORS, INC.
27
trained physicians to join these larger systems rather than enter into independent practices.
Healthcare reform has only served to accelerate the trend in physician employment that was
already well underway.
As reported by Milliman, Inc., the combined ratio for the MPL industry was 96% in
2014, up from a low of 76% in 2008. The loss ratio for 2014 was 65%, higher than in any year
since 2006 and an increase of 12 percentage points. The increase in the loss ratio has been
driven largely by the decline in reserve releases. The industry's surplus increased slightly by 2%
in 2014. The stabilization of the industry's capitalization level is in part due to the significant
amount policyholder dividends that MPL writers have continued to pay.
Net investment income is an important revenue source for P&C insurers, historically
accounting for 15%-20% of total revenues. For most insurers, cash flows available for
investment have stabilized although persistently low investment yields continue to pressure
investment income results. Net realized investment gains have increased in recent years on the
heels of surging securities market valuations.
Continued reserve releases can be expected to mask deteriorating underwriting results on
current MPL business, thereby prolonging the soft market and increasing the risk that rates may
become inadequate. MPL insurers face other challenges to increasing profits, possible increases
in frequency and severity, threats to the tort system and tort laws in various states, the continued
impact of healthcare reform, and a decline in market size as hospitals continue to acquire
physician practices. In light of the industry's fundamentals, the current soft market is likely to
continue into the near future. The challenge for larger MPL carriers is to seek new sources of
premium growth, and increasingly they seek this growth through acquisition.

FELDMAN FINANCIAL ADVISORS, INC.
28
Financial Strength Ratings by A.M. Best
A.M. Best is a widely recognized rating agency dedicated to the insurance industry.
A.M. Best provides ratings that indicate the financial strength of insurance companies. The
objective of A.M. Best's rating system is to provide an independent opinion of an insurer's
financial strength and its ability to meet ongoing obligations to policyholders. The assigned
financial strength rating is derived from an in-depth evaluation and analysis of a company's
balance sheet strength, operating performance, and business profile. A.M. Best's ratings scale is
comprised of 15 individual ratings grouped into 9 categories (excluding suspended ratings).
A.M. Best currently assigns a financial strength rating of B+ (Good) to PIPE, effective
October 2, 2014. This rating is the sixth highest of 15 ratings and the category of "Good"
represents the third highest of nine categories. Insurance companies rated B+ are considered by
A.M. Best to have "a good ability to meet their ongoing obligations to policyholders." The
recent rating for PIPE represented an affirmation of the B+ (Good) financial strength rating that
was assigned initially on August 23, 2013. However, the outlook for the recent rating was
downgraded from stable to negative.
In its recent ratings commentary on PIPE, A.M. Best indicated that the rating results
reflected PIPE's adequate capitalization, historical profitability, and its specialty niche
orientation and expertise in the MPL insurance segment. These positive rating aspects were
offset by the material adverse reserve development reported by PIPE and the corresponding net
operating losses incurred during the first half of 2014, culminating in a contraction in
policyholders' surplus for the period. A.M. Best indicated that the adverse results of 2014
stemmed from, in part, higher than expected claim settlements combined with PIPE's limited
reinsurance program.

FELDMAN FINANCIAL ADVISORS, INC.
29
A.M. Best expressed further concern about PIPE's elevated expense ratio, limited
financial flexibility, and narrow business concentration -- both geographic and product. PIPE
has a concentrated exposure in a volatile long tail line of business predominately in a single state.
The expansion into South Carolina remains in the early stage and A.M. Best cited concern over
the execution strategy given the operational and judicial/regulatory risks. In addition, A.M. Best
noted PIPE's small size and the related susceptibility, the significant uncertainty in its pricing and
reserving due to its relatively short operating history, and continuation of the low interest rate
environment placing pressure on investment returns.
A.M. Best commented favorably on PIPE's balance sheet strength as supported by sound
liquidity, modest underwriting and investment leverage, and better than average investment
returns. A.M. Best also acknowledged the fact that senior management of PIPE has many years
of experience in the MPL insurance sector and, up until recent periods, had produced solid
earnings that had contributed to organic surplus growth. In assigning a negative outlook, A.M.
Best emphasized the current challenges in the MPL industry and noted that it would be
monitoring PIPE's profitability for a return to stable, positive earnings results.

FELDMAN FINANCIAL ADVISORS, INC.
30
III. COMPARISONS WITH PUBLICLY TRADED COMPANIES
General Overview
The comparative market approach provides a sound basis for determining estimates of
going-concern valuations where a regular and active market exists for the stocks of peer
institutions. The comparative market approach was utilized in determining the estimated pro
forma market value of PIPE because: (i) reliable market and financial data are readily available
for comparable institutions, and (ii) the comparative market method has been widely accepted as
a valuation approach by the applicable regulatory authorities. The generally employed valuation
method in initial public offerings ("IPOs"), where possible, is the comparative market approach,
which also can be relied upon to determine pro forma market value in an insurance company
stock conversion transaction. We considered other valuation approaches such as the asset-based
valuation and income capitalization methods. However, we determined that because PIPE is a
going-concern insurance company with highly variable earnings results and the fact that the
Valuation will be utilized pursuant a stock conversion offering structure, the comparative market
approach is the preferred valuation method for this assignment.
The comparative market approach derives valuation benchmarks from the trading
patterns of selected peer institutions that, due to certain factors such as financial performance and
operating strategies, enable the appraiser to estimate the potential value of the subject institution
in a mutual-to-stock conversion offering. In Chapter III, our valuation analysis focuses on the
selection and comparison of PIPE with a comparable group of publicly traded insurance
companies (the "Comparative Group"). Chapter IV will detail any additional discounts or
premiums that we believe are appropriate to PIPE's pro forma market value.

FELDMAN FINANCIAL ADVISORS, INC.
31
Selection Criteria
Selected market price and financial performance data for insurance companies listed on
the New York and NYSE MKT Stock Exchanges or traded on the NASDAQ Stock Market are
shown in Exhibit IV as compiled from data obtained from SNL Financial LC ("SNL Financial"),
a leading provider of financial and market data focused on financial services industries, including
banks and insurance companies. The insurance underwriting industry is differentiated by SNL
Financial into six market segments: (i) life and health, (ii) managed care, (iii) mortgage and
financial guaranty, (iv) multiline, (v) property and casualty, and (vi) title. For purposes of this
selection screening, we focused primarily on publicly traded insurance companies in the P&C
and multiline segments exclusive of announced acquisition targets ("Public P&C/Multiline
Group"). Several criteria, discussed below, were used to select the individual members of the
Comparative Group from the overall universe of publicly traded insurance companies.
• Operating characteristics – A company's operating characteristics are the most important factors because they affect investors' expected rates of return on a company's stock under various business and economic scenarios, and they influence the market's general perception of the quality and attractiveness of a given company. Operating characteristics, which may vary in importance during the business cycle, include financial variables such as profitability, capitalization, growth, risk exposure, liquidity, and other factors such as lines of business and management strategies.
• Degree of marketability and liquidity – Marketability of a stock reflects the
relative ease and promptness with which a security may be sold when desired, at a representative current price, without material concession in price merely because of the necessity of sale. Marketability also connotes the existence of buying interest as well as selling interest and is usually indicated by trading volumes and the spread between the bid and asked price for a security. Liquidity of the stock issue refers to the organized market exchange process whereby the security can be converted into cash. We attempted to limit our selection to companies that have access to a regular trading market or price quotations. We eliminated from the selection process companies with market prices that were materially influenced by publicly announced or widely rumored acquisitions.
FELDMAN FINANCIAL ADVISORS, INC.
32
In determining the Comparative Group composition, we focused primarily on PIPE's size,
market segment, and product lines. Attempting to concentrate on PIPE's financial characteristics
and expand the Comparative Group to obtain a meaningful cluster of companies, we broadened
the size range criterion to encompass a statistically significant number of companies. In
addition, due to the ongoing consolidation activity within the insurance industry, we sought to
include a sufficient number of companies in the event that one or several members of the
Comparative Group are subsequently subject to acquisition as we update this Appraisal prior to
completion of PIPE's Conversion.
Of the 54 companies composing the Public P&C/Multiline Group, there were only five
companies with total assets less than $200 million and zero companies with assets less than $70
million or PIPE's total assets of $30.7 million. The median asset size of the Public
P&C/Multiline Group was $4.6 billion and the average size was even larger at $40.0 billion,
skewed by behemoth companies such as Berkshire Hathaway and American International Group
with total assets each exceeding $500 billion. We applied the following selection criteria and
focused principally on companies concentrated in the lower quartile of the Public P&C/Multiline
Group based on asset size:
• Publicly traded – stock-form insurance company whose shares are traded on New York Stock Exchange, NYSE MKT, or NASDAQ Stock Market.
• Asset size – total assets less than $1.6 billion.
• Market segment – primary focus on market segments of property and casualty, with additional consideration accorded to multiline and life and health.
• Current financial data – publicly reported financial data on a GAAP basis for the last twelve months ("LTM") ended March 31, 2015 or June 30, 2015.
• Insurance product lines – companies providing specialty lines of coverage, particularly including medical malpractice, were granted additional consideration for inclusion.
FELDMAN FINANCIAL ADVISORS, INC.
33
As a result of applying the above criteria, the screening process produced a reliable
representation of publicly traded insurance companies for valuation purposes. Eighteen
companies met the asset size and market segment criterion outlined on the previous page. We
included in the Comparative Group four of the five public P&C insurance companies with assets
under $200 million. Trupanion, Inc., which provides medical insurance plans for cats and dogs
was not included in the Comparative Group. Within the collection of 12 companies comprising
the Public P&C/Multiline Group reporting assets between $200 million and $1.6 billion, we
selected nine seven for inclusion in the Comparative Group.
A general operating summary of the 12 companies selected for the Comparative Group is
presented in Table 4. In focusing on smaller publicly traded companies, the Comparative Group
includes seven companies with total assets less than $500 million and five altogether below $200
million (1347 Property Insurance Holdings, American Independence Corp., Kingstone
Companies, National Security Group, and Unico American Corporation). In addition, three of
the Comparative Group companies are headquartered in the Mid-Atlantic region (Donegal Group
in Pennsylvania and American Independence Corp. and Kingstone Companies in New York),
similar to PIPE. The overall geographic mix of the companies in the Comparative Group reflects
a wide distribution. One member of the Comparative Group companies completed an IPO
within the past two years, specifically 1347 Property Insurance Holdings in March 2014. While
no single company constitutes a perfect comparable and differences inevitably exist between
PIPE and the individual companies, we believe that the chosen Comparative Group on the whole
provides a meaningful basis of financial comparison for valuation purposes. Summary operating
profiles of the publicly traded insurance companies selected for the Comparative Group are
presented in the next section beginning on pages 35 to 41.

FELDMAN FINANCIAL ADVISORS, INC.
34
Table 4 General Operating Summary of the Comparative Group
As of June 30, 2015
Total Total Total Equity/
IPO Assets Equity AssetsState Ticker Exchange Date ($Mil.) ($Mil.) (%)
Physicians' Insurance Program Exchange PA NA NA NA 30.7 11.5 37.38
Comparative Group Median NA NA NA NA 357.1 106.2 31.16
Comparative Group Mean NA NA NA NA 572.1 181.7 37.01
Comparative Group
1347 Property Insurance Holdings (1) FL PIH NASDAQ 03/31/14 75.9 49.0 64.56
American Independence Corp. NY AMIC NASDAQ NA 182.4 96.6 52.96
Atlantic American Corporation GA AAME NASDAQ 02/01/69 327.2 105.5 32.25
Donegal Group Inc. PA DGICA NASDAQ NA 1,519.4 437.1 28.77
EMC Insurance Group Inc. IA EMCI NASDAQ 02/04/82 1,520.1 515.4 33.91
Federated National Holding Co. FL FNHC NASDAQ 11/05/98 601.1 231.4 38.50
First Acceptance Corporation TN FAC NYSE NA 387.0 106.8 27.59
Hallmark Financial Services, Inc. TX HALL NASDAQ NA 1,041.9 262.3 25.18
Kingstone Companies, Inc. (1) NY KINS NASDAQ NA 137.4 40.9 29.78
National Security Group, Inc. (1) AL NSEC NASDAQ NA 147.0 44.2 30.07
Unico American Corporation (1) CA UNAM NASDAQ NA 135.6 71.4 52.70
United Insurance Holdings Corp. FL UIHC NASDAQ 10/04/07 789.7 219.5 27.79
(1) As of March 31, 2015.
Source: PIPE; SNL Financial.

FELDMAN FINANCIAL ADVISORS, INC.
35
Summary Profiles of the Comparative Group Companies
1347 Property Insurance Holdings, Inc. (NASDAQ: PIH) – Tampa, Florida 1347 Property Insurance Holdings, Inc. ("1347 Property") was incorporated in October 2012 and holds all of the capital stock of Maison Insurance Company ("Maison") and Maison Managers Inc. ("MMI"). In March 2014, 1347 Property completed an IPO of its common stock. Prior to March 2014, 1347 Property was a wholly owned subsidiary of Kingsway America Inc. Through Maison, 1347 Property provides property and casualty insurance to individuals in Louisiana. Maison's insurance product offerings currently include homeowners insurance, manufactured home insurance, and dwelling fire insurance. Maison writes both full peril property policies as well as wind/hail only exposures. Maison distributes its policies through independent insurance agents. MMI serves as 1347 Property's services subsidiary, known as a managing general agency. MMI is responsible for marketing programs and other management services. 1347 Property plans, either organically or through acquisition, to expand into other coastal states that fit its selection criteria and when timing is appropriate. It intends to focus on those areas where industry leaders are seeking to decrease coastal risk exposure and locations where its management has experience in managing wind-risk and independent and captive agent contacts. Within Louisiana, 1347 Property seeks to take advantage of market opportunities presented by the planned shrinkage of a state-run program that operates as an insurer of last resort. In January 2015, 1347 completed the acquisition of ClaimCor, LLC, a Florida based company that provides claims and underwriting technical solutions to both commercial and personal lines insurance carriers throughout the Southern United States. 1347 Property is not currently rated by A.M. Best. As of March 31, 2015, 1347 Property had total assets of $75.9 million, total policy reserves of $18.2 million, total equity of $49.0 million, LTM total revenue of $21.2 million, and LTM net loss of -$81,000. American Independence Corp. (NASDAQ: AMIC) – New York, New York American Independence Corp. ("American Independence") is a holding company principally engaged in health insurance and reinsurance with executive offices located in New York, New York. American Independence focuses on niche health products and/or narrowly defined distribution channels and provides specialized health coverage and related services to commercial customers and individuals. Its wholly owned subsidiary, Independence American Insurance Company ("Independence American"), markets its products through IHC Risk Solutions, LLC ("Risk Solutions"), IHC Specialty Benefits, Inc., IPA Family, LLC, and IPA Direct, LLC, which are subsidiaries of AMIC, and through independent brokers, producers and agents. American Independence is affiliated with Independence Holding Company, which owns a majority of the common stock of American Independence. Independence American, which is domiciled in Delaware, is licensed to write property and/or casualty insurance in all 50 states and the District of Columbia, and has an A- (Excellent) financial strength rating from A.M. Best with a stable outlook. American Independence retains much of the risk that it underwrites, and sells or reinsures on the following lines of business: (i) medical stop-loss; (ii) fully insured medical including major medical and ancillary, (iii) pet insurance, (iv) occupational accident, and (iv) New York State disability benefits. Risk Solutions is a full-service direct writer of medical stop-

FELDMAN FINANCIAL ADVISORS, INC.
36
loss insurance for self-insured employer groups. Risk Solutions markets, underwrites, collects premiums, administers and processes claims, and performs medical management services. As of June 30, 2015, American Independence had total assets of $182.4 million, total policy reserves of $61.1 million, total equity of $96.6 million, LTM total revenue of $170.9 million, and LTM net income of $5.7 million.
Atlantic American Corporation (NASDAQ: AAME) – Atlanta, Georgia Atlantic American Corporation ("Atlantic American") is a holding company that operates through its subsidiaries in specialty markets within the life and health and property and casualty insurance industries. Its principal operating subsidiaries are American Southern Insurance Company and American Safety Insurance Company (together known as "American Southern") within the property and casualty insurance industry and Bankers Fidelity Life Insurance Company and Bankers Fidelity Assurance Company (together known as "Bankers Fidelity") within the life and health insurance industry. American Southern's primary product lines include business automobile insurance, general liability insurance, property insurance, and surety bonds. American Southern provides tailored business automobile insurance coverage, on a multi-year contract basis, to state governments, local municipalities and other large motor pools and fleets that can be specifically rated and underwritten. Bankers Fidelity and offers a variety of life and supplemental health products with a focus on the senior markets. Products offered by Bankers Fidelity include ordinary and term life insurance, Medicare supplement, and other accident and health insurance products. For the year ended December 31, 2014, health insurance operations accounted for approximately 59% of Atlantic American's net earned premiums. Bankers Fidelity markets its policies through three distribution channels all of which utilize commissioned, independent agents. The three channels utilized include traditional independent agents, broker-agents typically interested in a specific product of Bankers Fidelity, and special market agents who promote workplace, association and/or branded products. American Southern carries a current financial strength rating of A (Excellent) from A.M. Best and Bankers Fidelity has a financial strength rating of A- (Excellent), both with a stable ratings outlook. As of June 30, 2015, Atlantic American had total assets of $327.2 million, total policy reserves of $169.6 million, total equity of $105.5 million, LTM total revenue of $169.3 million, and LTM net income of $6.8 million.
Donegal Group, Inc. (NASDAQ: DGICA) – Marietta, Pennsylvania Donegal Group, Inc. ("Donegal") is as an insurance holding company whose insurance subsidiaries offer personal and commercial lines of property and casualty insurance to businesses and individuals in 21 Mid-Atlantic, Midwestern, New England, and Southern states. Donegal owns insurance subsidiaries domiciled in the states of Iowa, Maryland, Michigan, Pennsylvania, Virginia and Wisconsin. For the year ended December 31, 2014, Donegal's direct premiums were generated primarily in the states of Pennsylvania (36.9%), Michigan (16.9%), Virginia (8.8%), Maryland (8.5%), and Delaware (5.8%). Donegal's insurance subsidiaries derive a substantial portion of their insurance business from smaller to mid-sized regional communities. Donegal believes this focus provides its insurance subsidiaries with competitive advantages in terms of local market knowledge, marketing, underwriting, claims servicing, and policyholder service. At the same time, Donegal believes its insurance subsidiaries have cost advantages

FELDMAN FINANCIAL ADVISORS, INC.
37
over many smaller regional insurers that result from economies of scale they realize through centralized accounting, administrative, data processing, investment, and other services. Donegal has been an active consolidator of smaller "main street" property and casualty insurance companies. The personal lines products offered by Donegal consist primarily of homeowners and private passenger automobile policies, while the commercial lines products consist primarily of commercial automobile, commercial multi-peril, and workers compensation policies. Donegal was formed in 1986 as a downstream holding company by Donegal Mutual Insurance Company, which currently holds approximately 65% of the aggregate voting power of both classes of Donegal's common stock. Donegal's insurance subsidiaries carry current financial strength ratings of A (Excellent) from A.M. Best with a stable outlook. As of June 30, 2015, Donegal had total assets of $1.5 billion, total policy reserves of $1.0 billion, total equity of $437.1 million, LTM total revenue of $613.5 million, and LTM net income of $26.6 million.
EMC Insurance Group Inc. (NASDAQ: EMCI) – Des Moines, Iowa
EMC Insurance Group Inc. ("EMC") is an insurance holding company that was incorporated in Iowa in 1974 by Employers Mutual Casualty Company ("Employers Mutual") and became a public company in 1982 following the initial public offering of its common stock. EMC is approximately 58% owned by Employers Mutual, a multiple-line property and casualty insurance company organized as an Iowa mutual insurance company in 1911 that is licensed in all 50 states and the District of Columbia. EMC conducts operations in property and casualty insurance and reinsurance through its subsidiaries. EMC primarily focuses on the sale of commercial lines of property and casualty insurance to small and medium-sized businesses. These products are sold through independent insurance agents who are supported by a decentralized network of branch offices. Although EMC actively markets its insurance products in 40 states, the majority of its business is marketed and generated in the Midwest. EMC conducts its operations through the following subsidiaries: EMCASCO Insurance Company, Illinois EMCASCO Insurance Company and Dakota Fire Insurance Company, and its reinsurance operations through its subsidiary, EMC Reinsurance Company. The primary sources of revenue for EMC are generated from the following commercial lines of business: property, automobile, workers compensation, and liability. EMC's property and casualty insurance companies carry financial strength ratings from A.M. Best of A (Excellent) with a stable outlook. As of June 30, 2015, EMC had total assets of $1.5 billion, total policy reserves of $922.2 million, total equity of $515.4 million, LTM total revenue of $610.6 million, and LTM net income of $47.5 million. Federated National Holding Company (NASAQ: FNHC) – Sunrise, Florida Federated National Holding Company ("Federated"), formerly known as 21st Century Holding Company, is an insurance holding company that engages in the insurance underwriting, distribution and claims processes through its subsidiaries and contractual relationships with its independent agents and general agents. Federated is authorized to underwrite, and/or place through its owned subsidiaries, homeowners multi-peril, commercial general liability, federal flood, personal automobile, and various other lines of insurance in Florida and various other states. Federated markets and distributes its own and third-party insurers' products and its other services through a network of independent agents. Its principal insurance subsidiary is Federated

FELDMAN FINANCIAL ADVISORS, INC.
38
National Insurance Company ("FNIC"). Through contractual relationships with a network of approximately 3,600 independent agents, of which approximately 1,800 actively sell and service its products, FNIC is authorized to underwrite homeowners, commercial general liability, fire, allied lines, and personal and commercial automobile insurance in Florida. FNIC is licensed as an admitted carrier in Alabama, Louisiana, Georgia, and Texas and underwrites commercial general liability insurance in those states, homeowners insurance in Louisiana and personal automobile insurance in Georgia and Texas. During 2014, 91.4%, 3.3%, 3.3% and 2.0% of the premiums it underwrote were for homeowners, commercial general liability, personal automobile, and federal flood insurance, respectively. Although the homeowners policyholders of FNIC are disbursed throughout Florida, substantially all of them are located in Florida. FNIC is not currently rated by A.M. Best. As of June 30, 2015, Federated had total assets of $601.1 million, total policy reserves of $332.2 million, total equity of $231.4 million, LTM total revenue of $205.7 million, and LTM net income of $37.9 million.
First Acceptance Corporation (NYSE: FAC) – Nashville, Tennessee First Acceptance Corporation ("First Acceptance") is a retailer, servicer, and underwriter of non-standard personal automobile insurance based in Nashville, Tennessee. First Acceptance currently writes non-standard personal automobile insurance in 12 states and is licensed as an insurer in 13 additional states. First Acceptance owns and operates three insurance company subsidiaries: First Acceptance Insurance Company, Inc., First Acceptance Insurance Company of Georgia, Inc., and First Acceptance Insurance Company of Tennessee, Inc. First Acceptance is a vertically integrated business and believes that its business model allows it to identify and satisfy the needs of its target customers and eliminates many of the inefficiencies associated with a non-integrated automobile insurance model. First Acceptance operates over 350 retail locations, staffed with employee-agents. The employee-agents primarily sell non-standard personal automobile insurance products underwritten by First Acceptance as well as certain commissionable ancillary products. In most states, First Acceptance's employee-agents also sell a complementary insurance product providing personal property and liability coverage for renters underwritten by First Acceptance. In addition to its retail locations, First Acceptance is able to complete the entire sales process over the telephone via its call center or through the internet via its consumer-based website or mobile platform. The principal operating subsidiaries of First Acceptance carry current financial strength ratings from A.M. Best of B (Fair) with a stable outlook. As of June 30, 2015, First Acceptance had total assets of $387.0 million, total policy reserves of $191.4 million, total equity of $106.8 million, LTM total revenue of $289.3 million, and LTM net income of $24.9 million. Hallmark Financial Services, Inc. (NASDAQ: HALL) – Fort Worth, Texas
Hallmark Financial Services, Inc. ("Hallmark") is a diversified property and casualty insurance group that serves businesses and individuals in specialty and niche markets. Hallmark offers standard commercial insurance, specialty commercial insurance, and personal insurance in selected market subcategories that are characteristically low-severity and predominately short-tailed risks. Hallmark markets, distributes, underwrites and services property and casualty insurance products primarily through five business units, each of which has a specific focus. The standard commercial P&C business unit primarily handles standard commercial insurance and

FELDMAN FINANCIAL ADVISORS, INC.
39
occupational accident insurance. The workers compensation business unit specializes in small and middle-market workers compensation business. The excess and surplus commercial business unit handles primarily commercial insurance products and services in the excess and surplus lines market. The select business unit offers (i) general aviation insurance products and services, (ii) low and middle market commercial umbrella and excess liability insurance, (iii) medical professional liability insurance products and services, and (iv) satellite launch insurance products. The personal lines business unit focuses on non-standard personal automobile insurance and complementary personal insurance products and services. Hallmark's business is geographically concentrated in the South Central and Northwest regions of the United States, except for its general aviation business, which is written on a national basis. Hallmark's insurance subsidiaries carry current financial strength ratings of A- (Excellent) with a negative outlook. As of June 30, 2015, Hallmark had total assets of $1.0 billion, total policy reserves of $657.6 million, total equity of $262.3 million, LTM total revenue of $358.1 million, and LTM net income of $18.9 million.
Kingstone Companies, Inc. (NASDAQ: KINS) – Kingston, New York Kingstone Companies, Inc. ("Kingstone") offers property and casualty insurance products to small businesses and individuals in the State of New York through its wholly owned subsidiary, Kingstone Insurance Company ("KICO"). KICO is a licensed property and casualty insurance company in New York. KICO also has obtained a license to write property and casualty insurance in Pennsylvania; however, KICO has only nominally commenced writing business in Pennsylvania. Kingstone is a multi-line regional property and casualty insurance company writing business exclusively through independent retail and wholesale agents and brokers. Kingstone's largest line of business is personal lines, consisting of homeowners, dwelling fire, 3-4 family dwelling package, condominium, renters, mechanical breakdown, service line, and personal umbrella policies. Commercial liability is another product line through the offering of business owners' policies that consist primarily of small business retail risks without a residential exposure. Commercial automobile represents a third product line as Kingstone provides physical damage and liability coverage for light vehicles owned by small contractors and artisans. Personal lines, commercial liability, and commercial automobile policies accounted for 74.5%, 14.4%, and 4.0% of gross written premiums for the year ended December 31, 2014. Kingstone also writes for-hire vehicle physical damage only policies for livery and car service vehicles and taxicabs as well as canine legal liability policies. These other product lines accounted for 6.9% of gross written premiums in the year ended December 31, 2014. Kingstone's financial strength rating from A.M. Best is B+ (Good) with a positive outlook. As of March 31, 2015, Kingstone had total assets of $137.4 million, total policy reserves of $84.5 million, total equity of $40.9 million, LTM total revenue of $54.6 million, and LTM net income of $5.4 million. National Security Group, Inc. (NASDAQ: NSEC) – Elba, Alabama National Security Group, Inc. ("National Security") is an insurance holding company that, through its property and casualty subsidiaries, primarily writes personal lines coverage including dwelling fire and windstorm, homeowners, and mobile homeowners lines of insurance in ten states. Through its life insurance subsidiary, National Security offers a basic line of life
FELDMAN FINANCIAL ADVISORS, INC.
40
and health and accident insurance products in six states. Property and casualty insurance is the most significant segment accounting for 89% of total premium revenues in 2013 and is conducted through National Security Fire & Casualty Company ("NSFC") and Omega One Insurance Company ("Omega"). NSFC is licensed to write insurance in the states of Alabama, Arkansas, Florida, Georgia, Kentucky, Mississippi, Oklahoma, South Carolina, Tennessee and West Virginia. Omega is licensed to write insurance in Alabama and Louisiana. Another subsidiary, National Security Insurance Company, conducts the life insurance business. Dwelling fire and homeowners, collectively referred to as the dwelling property line of business, is the largest segment of property and casualty operations composing 96% of total property and casualty premium revenue. National Security focuses on providing niche insurance products within the markets it serves. National Security ranks in the top twenty dwelling property insurance carriers in its two largest states, Alabama and Mississippi. However, due to the large concentration of business among the top five carriers, its total combined market share in these two states is less than 2%. NSFC and Omega products are marketed through a network of independent agents and brokers, who are independent contractors and generally maintain relationships with one or more competing insurance companies. National Security's property and casualty companies currently carry an A.M. Best group financial strength rating of B++ (Good) with a stable outlook. As of March 31, 2015, National Security had total assets of $147.0 million, total policy reserves of $75.6 million, total equity of $44.2 million, LTM total revenue of $65.7 million, and LTM net income of $7.9 million. Unico American Corporation (NASDAQ: UNAM) – Woodland Hills, California Unico American Corporation ("Unico American") is an insurance holding company that underwrites property and casualty insurance through its insurance company subsidiary; provides property, casualty, and health insurance through its agency subsidiaries; and provides insurance premium financing and membership association services through its other subsidiaries. The insurance company operation is conducted through Crusader Insurance Company ("Crusader"), which is a multiple line P&C insurance company that began transacting business on January 1, 1985. Since 2004, all Crusader business has been written in the state of California. During the year ended December 31, 2014, approximately 98% of Crusader's business was commercial multiple peril policies. Commercial multiple peril policies provide a combination of property and liability coverage for businesses. Commercial property coverage insures against loss or damage to buildings, inventory and equipment from natural disasters, including hurricanes, windstorms, hail, water, explosions, severe winter weather, and other events such as theft and vandalism, fires, storms, and financial loss due to business interruption resulting from covered property damage. However, Crusader does not write earthquake coverage. In addition to commercial multiple peril policies, Crusader also writes separate policies to insure commercial property and commercial liability risks on a mono-line basis. Crusader is domiciled in California and is licensed as an admitted insurance carrier in the states of Arizona, California, Nevada, Oregon, and Washington. Unico American sells its insurance policies through Unifax Insurance Systems, Inc., Crusader's sister corporation and exclusive general agent. All policies are produced by a network of brokers and retail agents. During 2014, Crusader continued to introduce new products as well as product changes such as revised rates, eligibility guidelines, rules and coverage forms. In order to improve service, Crusader is currently customizing and configuring a new policy administration system that is primarily focused upon transacting
FELDMAN FINANCIAL ADVISORS, INC.
41
business through the internet, as well as providing more options to make the brokers' and agents' time more efficient. In November 2014, A.M. Best affirmed the financial strength rating of A- (Excellent) for Crusader with a stable outlook. As of March 31, 2015, Unico American had total assets of $135.6 million, total policy reserves of $60.8 million, total equity of $71.4 million, LTM total revenue of $30.9 million, and LTM net loss of -$142,000. United Insurance Holdings Corp. (NASDAQ: UIHC) – St. Petersburg, Florida Unted Insurance Holdings Corp. ("United Insurance") serves as the holding company for United Property & Casualty Insurance Company and its affiliated companies ("UPC Insurance"). UPC Insurance is primarily engaged in the residential property and casualty insurance business and currently write policies in Florida, Louisiana, Massachusetts, New Jersey, North Carolina, Rhode Island, South Carolina, and Texas. Its target markets consist of areas where the perceived threat of natural catastrophe has caused large national insurance carriers to reduce their concentration of policies. In such areas, United Insurance believes an opportunity exists for UPC Insurance to write profitable business. UPC Insurance has been operating continuously in Florida since 1999, and has managed its business through various hurricanes, tropical storms, and other weather related events. Homeowners policies and related coverage account for the vast majority of the business that it writes. In 2014, homeowners policies produced written premium of $418.1 million and accounted for 96% of total written premium. In addition to homeowners policies, UPC Insurance writes flood policies, which accounted for 3%, and commercial residential policies, which accounted for the remaining 1% of its 2014 written premium. On the flood policies, it earns a commission while retaining no risk of loss, since all such risk is ceded to the federal government via the National Flood Insurance Program. UPC Insurance currently markets and distributes its policies to consumers through over 4,000 independent agencies. Approximately 69% of its policies in-force as of December 31, 2014 were in Florida. United Insurance is not currently rated by A.M. Best. As of June 30, 2015, United Insurance had total assets of $789.7 million, total policy reserves of $339.8 million, total equity of $219.5 million, LTM total revenue of $312.7 million, and LTM net income of $25.5 million.

FELDMAN FINANCIAL ADVISORS, INC.
42
Recent Financial Comparisons
Table 5 summarizes certain key financial comparisons between PIPE and the
Comparative Group. Financial data for PIPE, the Comparative Group, and the Public P&C/
Multiline Group are shown as of or for the LTM ended June 30, 2015. The Public P&C/
Multiline Group includes all the companies presented in Exhibit IV.
PIPE's total assets of $30.7 million as of June 30, 2015 measured below the Comparative
Group median and mean of $357.1 million and $572.1 million, respectively. There are five
companies in the Comparative Group with total assets less than $200 million. Overall, the
Comparative Group includes seven companies with total assets less than $500 million, two
companies with assets of $500 million to $1 billion, and three companies with assets between $1
billion and $1.6 billion. The median asset size of the Public P&C/Multiline Group was much
larger at $4.6 billion based on the latest financial data as of June 30, 2015.
The P&C insurance industry is a highly competitive business in the areas of price,
coverage, and service. The P&C industry includes insurers ranging from large companies
offering a wide variety of products worldwide to smaller, specialized companies in a single state
or region offering only a single product. Smaller insurance companies may find themselves
competing with many insurance companies of substantially greater financial resources, more
advanced technology, larger volumes of business, more diversified insurance coverage, broader
ranges of projects, and higher ratings. Competition centers not only on the sale of products to
customers, but also on the recruitment and retention of qualified agents and producers. Large
national insurers may have certain competitive advantages over smaller regional companies,
including increased name recognition, increased loyalty of their customer base, greater
efficiencies and economies of scale and reduced policy acquisition costs.
FELDMAN FINANCIAL ADVISORS, INC.
43
PIPE's ratio of total policy reserves to total equity measured 1.36x, evidencing both its
historical capital position and lack of growth in recent years. The Comparative Group median
and mean ratios of policy reserves to equity were 1.66x and 1.55x, respectively. Among the
Comparative Group, Federated, United Insurance, and Atlantic American displayed ratios in
range of PIPE's ratio at 1.44x, 1.55x, and 1.61x, respectively. Overall, PIPE's capital ratios were
higher than those of the Comparative Group and those of the Public P&C/Multiline Group
aggregate. PIPE's ratio of equity to assets was 37.38% at June 30, 2015. As of June 30, 2015,
the Comparative Group median and mean ratios of equity to assets were 31.16% and 37.01%,
respectively, while the Public P&C/Multiline Group median and mean equity capital ratios were
slightly lower at 28.14% and 28.78%, respectively. Among the Comparative Group companies,
Federated's equity to assets ratio of 38.50% and EMC's corresponding ratio of 33.91% were
similar to PIPE's ratio of equity to assets.
PIPE's ratio of cash and investments to total assets was 86.8% as of June 30, 2015, and
was positioned above the Comparative Group median and mean ratios of 71.2% and 72.1%,
respectively. PIPE's higher concentration of invested assets reflected comparatively lower levels
of receivables in the form of reinsurance receivables and premium receivables. PIPE's premium
income levels and reinsurance activity have stagnated over the past four years. PIPE's total
assets decreased by 1.3% over the LTM period ended June 30, 2015, whereas the Comparative
Group reflected median and mean asset growth rates of 8.8% and 18.6% for the corresponding
period. Most members of the Comparative Group experienced moderate asset growth over the
past year, while a few reported significant asset increases due to a stock offering (1347
Property), business expansion spurred by a corporate acquisition (United Insurance), and
increases in total revenue and net income (Federated and First Acceptance).
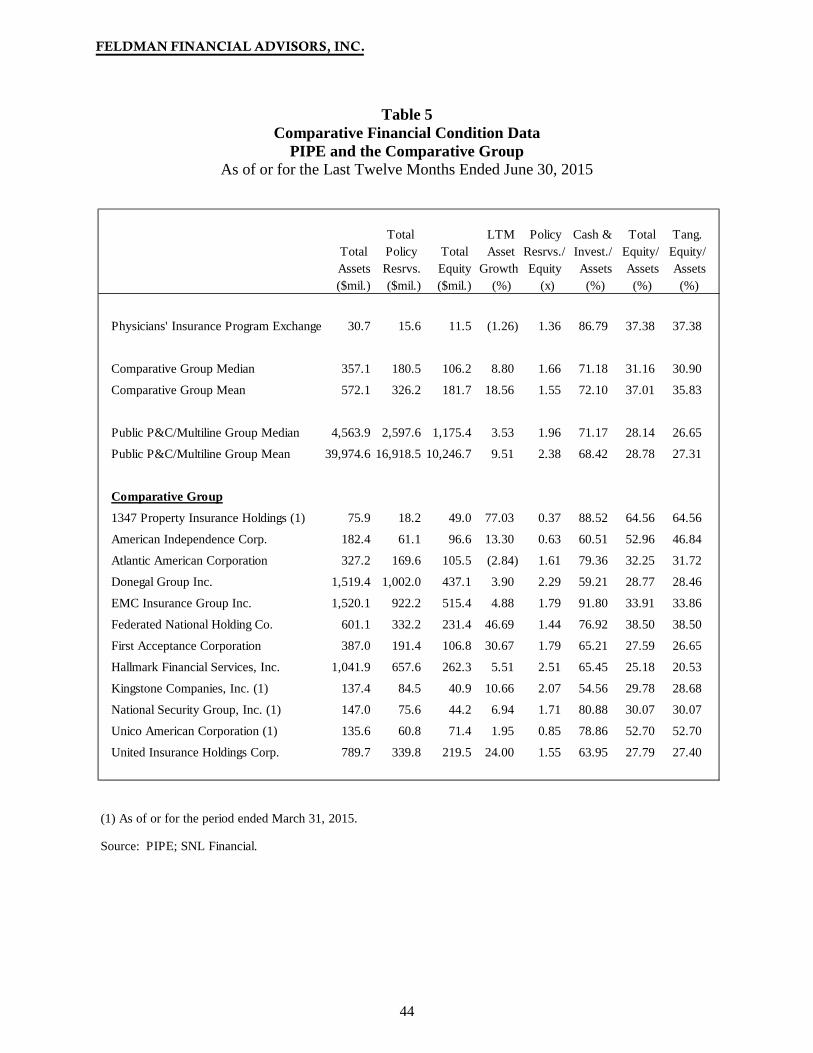
FELDMAN FINANCIAL ADVISORS, INC.
44
Table 5 Comparative Financial Condition Data
PIPE and the Comparative Group As of or for the Last Twelve Months Ended June 30, 2015
Total LTM Policy Cash & Total Tang. Total Policy Total Asset Resrvs./ Invest./ Equity/ Equity/Assets Resrvs. Equity Growth Equity Assets Assets Assets($mil.) ($mil.) ($mil.) (%) (x) (%) (%) (%)
Physicians' Insurance Program Exchange 30.7 15.6 11.5 (1.26) 1.36 86.79 37.38 37.38
Comparative Group Median 357.1 180.5 106.2 8.80 1.66 71.18 31.16 30.90
Comparative Group Mean 572.1 326.2 181.7 18.56 1.55 72.10 37.01 35.83
Public P&C/Multiline Group Median 4,563.9 2,597.6 1,175.4 3.53 1.96 71.17 28.14 26.65
Public P&C/Multiline Group Mean 39,974.6 16,918.5 10,246.7 9.51 2.38 68.42 28.78 27.31
Comparative Group
1347 Property Insurance Holdings (1) 75.9 18.2 49.0 77.03 0.37 88.52 64.56 64.56
American Independence Corp. 182.4 61.1 96.6 13.30 0.63 60.51 52.96 46.84
Atlantic American Corporation 327.2 169.6 105.5 (2.84) 1.61 79.36 32.25 31.72
Donegal Group Inc. 1,519.4 1,002.0 437.1 3.90 2.29 59.21 28.77 28.46
EMC Insurance Group Inc. 1,520.1 922.2 515.4 4.88 1.79 91.80 33.91 33.86
Federated National Holding Co. 601.1 332.2 231.4 46.69 1.44 76.92 38.50 38.50
First Acceptance Corporation 387.0 191.4 106.8 30.67 1.79 65.21 27.59 26.65
Hallmark Financial Services, Inc. 1,041.9 657.6 262.3 5.51 2.51 65.45 25.18 20.53
Kingstone Companies, Inc. (1) 137.4 84.5 40.9 10.66 2.07 54.56 29.78 28.68
National Security Group, Inc. (1) 147.0 75.6 44.2 6.94 1.71 80.88 30.07 30.07
Unico American Corporation (1) 135.6 60.8 71.4 1.95 0.85 78.86 52.70 52.70
United Insurance Holdings Corp. 789.7 339.8 219.5 24.00 1.55 63.95 27.79 27.40
(1) As of or for the period ended March 31, 2015.
Source: PIPE; SNL Financial.

FELDMAN FINANCIAL ADVISORS, INC.
45
Table 6 compares PIPE with the Comparative Group and Public P&C/Multiline Group
based on selected measures of profitability.
Table 6 Comparative Operating Performance Data
PIPE and the Comparative Group For the Last Twelve Months Ended June 30, 2015
LTM Net LTM NetPrem. Income/ YTD
Total Written/ Total LTM LTM Comb. YTD YTD Revenue Avg.Eq. Revenue ROA ROE Ratio ROA ROE ($mil.) (x) (%) (%) (%) (%) (%) (%)
Physicians' Insurance Program Exchange 5.9 0.52 15.44 2.91 7.99 130.3 (0.86) (2.25)
Comparative Group Median 188.3 1.30 5.29 3.28 8.51 97.8 2.13 6.93 Comparative Group Mean 241.8 1.19 6.27 3.45 10.62 95.6 1.89 6.34
Public P&C/Multiline Group Median 1,166.3 1.14 8.31 2.37 8.96 95.2 2.16 8.42 Public P&C/Multiline Group Mean 9,080.6 1.19 8.94 2.56 10.45 93.6 2.20 9.44
Comparative Group1347 Property Insurance Holdings (1) 21.2 0.53 (0.38) (0.12) (0.17) 85.9 (5.61) (8.75) American Independence Corp. 170.9 NA 3.35 3.40 6.11 NA 1.94 3.58 Atlantic American Corporation 169.3 NA 4.00 2.12 6.45 97.8 2.54 7.60 Donegal Group Inc. 613.5 1.44 4.33 2.54 7.60 98.7 1.79 6.25 EMC Insurance Group Inc. 610.6 1.14 7.77 3.17 9.41 94.5 3.85 11.22 Federated National Holding Co. 205.7 0.85 18.41 7.43 19.55 NA 7.46 19.05 First Acceptance Corporation 289.3 NA 8.60 7.46 25.14 99.6 0.45 1.49 Hallmark Financial Services, Inc. 358.1 1.39 5.29 1.89 7.46 94.5 2.31 9.03 Kingstone Companies, Inc. (1) 54.6 1.22 9.87 4.09 13.82 97.9 4.00 13.47 National Security Group, Inc. (1) 65.3 1.46 NA 5.50 19.73 NA 2.64 8.84 Unico American Corporation (1) 30.9 NA (0.46) (0.11) (0.20) 91.0 (0.42) (0.79) United Insurance Holdings Corp. 312.7 1.52 8.16 4.06 12.52 100.4 1.70 5.10
(1) As of or for the period ended March 31, 2015.
Source: PIPE; SNL Financial.

FELDMAN FINANCIAL ADVISORS, INC.
46
PIPE's ROA for the LTM period ended June 30, 2015 was 2.91% and measured above
the Comparative Group median and mean ROA results of 3.28% and 3.45%, respectively. The
Public P&C/Multiline Group reported median and mean LTM ROA results of 2.37% and 2.56%,
respectively. PIPE's ROE for the recent LTM period was 7.99% and below the Comparative
Group median and mean ROE results of 8.51% and 10.62%, respectively. PIPE's higher
profitability reflects its underwriting profit for the LTM period after incurring large underwriting
losses for the prior six-month period in the first half of 2014.
Profitability levels among the Comparative Group companies were led by First
Acceptance, Federated, and National Security with LTM ROA results of 7.46%, 7.43%, and
5.50%, respectively, and LTM ROE results of 25.14%, 19.55%, and 19.73%, respectively The
lower performers in the Comparative Group based on profitability included 1347 Property and
Unico American with net losses and LTM ROA results of -0.12% and -0.11%, respectively.
Those companies reporting positive earnings similar to PIPE's profitability included American
Independence, United Insurance, and Kingstone with ROA results of 3.40%, 4.06%, and 4.09%,
respectively.
On a YTD basis through June 30, 2015, PIPE reported negative earnings and ROA and
ROE results of -0.86% and -2.25%, respectively. The Comparative Group median and mean
YTD ROA were higher at 2.13% and 1.89%, respectively, and its median and mean YTD ROE
were 6.93% and 6.34%, respectively. Contributing to PIPE's negative earnings for the YTD
period was its relatively high combined ratio at 130.3%, compared to the median and mean of
97.8% and 95.6% for the Comparative Group, respectively. Only two members of the
Comparative Group, 1347 Property and Unico American recorded negative earnings for the YTD
period.

FELDMAN FINANCIAL ADVISORS, INC.
47
PIPE's profitability level relative to total revenue was above the median and mean levels
exhibited by the Comparative Group. PIPE's 15.44% ratio of LTM net income to total revenue
exceeded the Comparative Group median and mean of 5.29% and 6.27%, respectively. PIPE's
heightened ratio is reflective of its favorable underwriting results for the LTM period and the
continuing trend of a declining revenue base due to sluggish premium volume and decreasing
investment returns. PIPE's written premium generation relative to average equity considerably
lagged the Comparative Group. PIPE reported a ratio of 0.52x of LTM net premiums written to
average equity versus the Comparative Group median and mean of 1.30x and 1.19x,
respectively. As mentioned earlier, PIPE's net premiums written have not increased over the past
five years.
FELDMAN FINANCIAL ADVISORS, INC.
48
IV. MARKET VALUE ADJUSTMENTS
General Overview
This concluding chapter of the Appraisal identifies certain adjustments to PIPE's
estimated pro forma market value relative to the Comparative Group. The adjustments discussed
in this chapter are made from the viewpoints of potential investors, which would include
policyholders and other eligible individuals with subscription rights and unrelated parties who
might purchase stock in a community or syndicated offering. It is assumed that these potential
investors are aware of all relevant and necessary facts as they would pertain to the value of PIPE
relative to other publicly traded insurance companies and relative to alternative investments.
Our appraised value is predicated on a continuation of the current operating environment
for PIPE and insurance companies in general. Changes in PIPE's operating performance along
with changes in the regional and national economies, the stock market, interest rates, the
regulatory environment, and other external factors may occur from time to time, often with great
unpredictability, which could impact materially the pro forma market value of PIPE or the
trading market values of insurance company stocks in general. Therefore, the Valuation Range
provided herein is subject to a more current re-evaluation prior to the actual completion of the
Conversion.
In addition to the comparative operating fundamentals discussed in prior chapters, it is
important to address additional market value adjustments based on certain financial and other
criteria, which include, among other factors:
(1) Earnings Prospects (2) Management (3) Liquidity of the Issue (4) Subscription Interest

FELDMAN FINANCIAL ADVISORS, INC.
49
(5) Stock Market Conditions (6) New Issue Discount
Earnings Prospects
Earnings prospects are dependent upon the ability to grow revenue and control expenses
and the effectiveness of managing the combined ratio (ratio of loss and operating expenses to net
premiums earned). PIPE's revenue is generated primarily from net premiums earned, net
investment income, and net realized investments gains or losses. PIPE's expenses mainly
comprise losses and loss adjustment expenses, policy acquisition costs, and other general and
administrative expenses. PIPE's revenue growth is affected by various factors, including
competitive pricing, agent relationships, product strategy, business development, customer
service and client retention, reinsurance arrangements, and investment performance. PIPE's
operating efficiency affects the degree to which it can profitably leverage its distribution system
and cost infrastructure. Many of the earnings challenges faced by PIPE are systemic to smaller
insurers that lack economies of scale, diverse distribution channels, geographic diversity, or
enhanced technological resources.
PIPE has experienced stagnant premium growth over the past five years. The MPL
industry is currently operating under soft market conditions both nationally and in Pennsylvania
as a result of abundant capacity, with significant competition and pressure on premium rates
following several years of overall favorable claims trends. During 2008 through 2014, premium
rates declined in PIPE's core Pennsylvania market, primarily as a result of improved claims
frequency, and premium rates have remained relatively level in 2015. As discussed earlier, PIPE
competes with MPL specialty insurers and alternative risk arrangements, as well as other large
national P&C insurance companies that write MPL insurance. These competitors include
companies that have substantially greater financial resources and a solid A.M. Best financial
FELDMAN FINANCIAL ADVISORS, INC.
50
strength rating that is lacking by PIPE. Furthermore, PIPE does not have the capital to engage in
long-term price competition with some of its competitors or support aggressive geographic and
product diversification.
The uncertainties surrounding the ultimate success of PIPE's recent strategic initiatives to
increase revenue and earnings, including its expansion into South Carolina, place PIPE at a
disadvantage with regard to the Comparative Group, which overall is reporting steadier levels of
profitability. PIPE reported a net loss for the year ended December 31, 2015 and a net loss for
the six months ended June 30, 2015. These setbacks raise concerns about future adverse reserve
development and its potential impact on prospective development. We therefore believe that,
given PIPE's recent earnings trends and the restrained ability to generate substantial
improvements in its profitability over the near term, a downward adjustment is warranted for
PIPE's earnings prospects with respect to the Comparative Group.
Management
Management's principal challenges are to implement strategic objectives, generate
revenue growth, control operating costs, and monitor asset quality and underwriting risks while
PIPE competes in the highly competitive P&C insurance industry. The challenges facing PIPE
in attempting to generate improvements in profitability and enhance its competitiveness are
paramount because of the inherent competitive disadvantages faced by smaller specialty insurers
in general and specifically, with respect to PIPE, companies that have a recent operating history
of capital erosion and negative earnings.
We believe that investors will take into account that PIPE is professionally managed by a
team of experienced insurance executives that has focused extensively on and gained a wealth of
knowledge and expertise in PIPE's specialty niche market. PIPE has emphasized its historical
FELDMAN FINANCIAL ADVISORS, INC.
51
operating strengths in attempting to cultivate and maintain a loyal client base. We also note that
investors will likely rely upon top-line premium growth and bottom-line earnings results as the
means of evaluating the future performance of management. Based on these considerations, we
believe no adjustment is warranted based on management.
Liquidity of the Issue
All of the 12 members of the Comparative Group are traded on major stock exchanges.
Eleven companies are listed on the NASDAQ Global Market and one company (First
Acceptance) is traded on the New York Stock Exchange. As of August 11, 2015, the market
capitalizations of the Comparative Group reflected a median of $104.2 million and ranged from
$35.5 million for National Security Group to $468.8 million for EMC Insurance Group.
Included among the Comparative Group were four companies with a current market
capitalization under $60 million. In contrast, the median market capitalization for the Public
P&C/Multiline Group was $1.6 billion as of August 11, 2015.
The development of a public market having the desirable characteristics of depth,
liquidity, and orderliness depends upon the presence in the marketplace of a sufficient number of
willing buyers and sellers at any given time and the existence of market makers to facilitate stock
trade transactions. Given the estimated range of PIPE's pro forma market value, it is highly
uncertain that an active and liquid trading market for its shares could develop or that PIPE would
have qualified for and maintained listing requirements on a major stock exchange.
As of August 11, 2015, the lowest market capitalizations reported by a public insurance
company listed on a major exchange were $35.5 million, $48.7 million, $49.0 million, and $56.0
million for National Security, 1347 Property, Unico American, and Kingstone -- all of which are
traded on NASDAQ and included in the Comparative Group. The lowest market capitalization

FELDMAN FINANCIAL ADVISORS, INC.
52
reported by a public insurance company not listed on a major exchange but instead quoted on the
over-the-counter securities market as of August 11, 2015 was $22.3 million for the life and
health insurer, Investors Heritage Capital Corporation (exclusive of companies that had closing
stock prices below $1.00 and have been experiencing severe financial deterioration). We
recognize that companies with lower levels of market capitalization tend to experience restrained
trading volumes and frequent price volatility due to limited shares outstanding and other factors.
Such issues may not have access to a major stock exchange having the desirable characteristics
of depth, liquidity, and orderliness. Therefore, we believe that at the present time a downward
adjustment is necessary to address these collective factors.
Subscription Interest
While mutual-to-stock conversions are commonplace in the savings institution industry,
such conversions and demutualizations are less common in the insurance industry. In recent
years, IPOs of savings institution stocks have attracted a great deal of investor interest and this
speculative fervor continued through 2014 and 2015. In contrast, since 2000 there have only
been a handful of insurance company demutualization transactions utilizing a subscription rights
offering (including stand-alone or sponsor-affiliation transactions).
In connection with the Conversion, policyholders and named insureds of PIPE, along
with directors, officers and employees of PIPMC, will be offered subscription rights to purchase
shares of common stock in the Offering. At the present time, we are not aware of any particular
marketing factors or transaction circumstances that would suggest either an overwhelming or
suppressed level of interest in purchasing shares in the Conversion. Therefore, absent actual
results from the subscription phase of the Offering, we do not believe that any adjustment is
necessary at this juncture.

FELDMAN FINANCIAL ADVISORS, INC.
53
Stock Market Conditions
Table 7 summarizes the recent performance of various insurance stock indexes
maintained by SNL Financial, along with selected industry and broad market indexes. The SNL
Insurance Index of all publicly traded insurance companies increased 20.9% in the past year
through August 11, 2015. The SNL Insurance Index outperformed the broader markets indexes
as reflected by the Dow Jones Industrials Average ("DJIA") increasing 5.0% and the Standard &
Poor's ("S&P") 500 Stock Index advancing 7.6%. Over the past three years ended August 11,
2015, the SNL Insurance Index was up 87.4%, while the DJIA had increased 31.8% and the S&P
500 advanced 48.2%. The SNL P&C Index and the S&P 500 P&C Index also outperformed the
broader indexes, increasing by 63.6% and 70.0%, respectively, over the prior three-year period.
Financial stocks have performed well in the economic recovery and insurance stocks
have participated fully in this sustained market rally. A number of announced acquisitions of
insurance companies have contributed to the sustained performance of insurance stocks thus far
in 2015. In the year-to-date periods, announced acquisition targets such as Cigna Corporation,
Chubb Corporation, Humana Inc., and StanCorp Financial Group have registered notable price
gains. However, as shown in Table 7, smaller insurance companies have not experienced the
robust stock price appreciation as their larger counterparts. Over the past year through August
11, 2015, the SNL Insurance < $250 Million-Assets Index was down 12.2% and the SNL
Insurance Micro Cap (< $250 Million) Index was down 11.7%.
On a YTD basis through August 11, 2015, the SNL Insurance < $250 Million-Assets
Index had advanced 1.8% and the SNL Insurance Micro Cap Index had declined 14.7%.
Through YTD August 11, 2015, the DJIA was down 2.4% and the S&P 500 was up 1.2%, while
the SNL U.S. Insurance Index had advanced 8.0%.
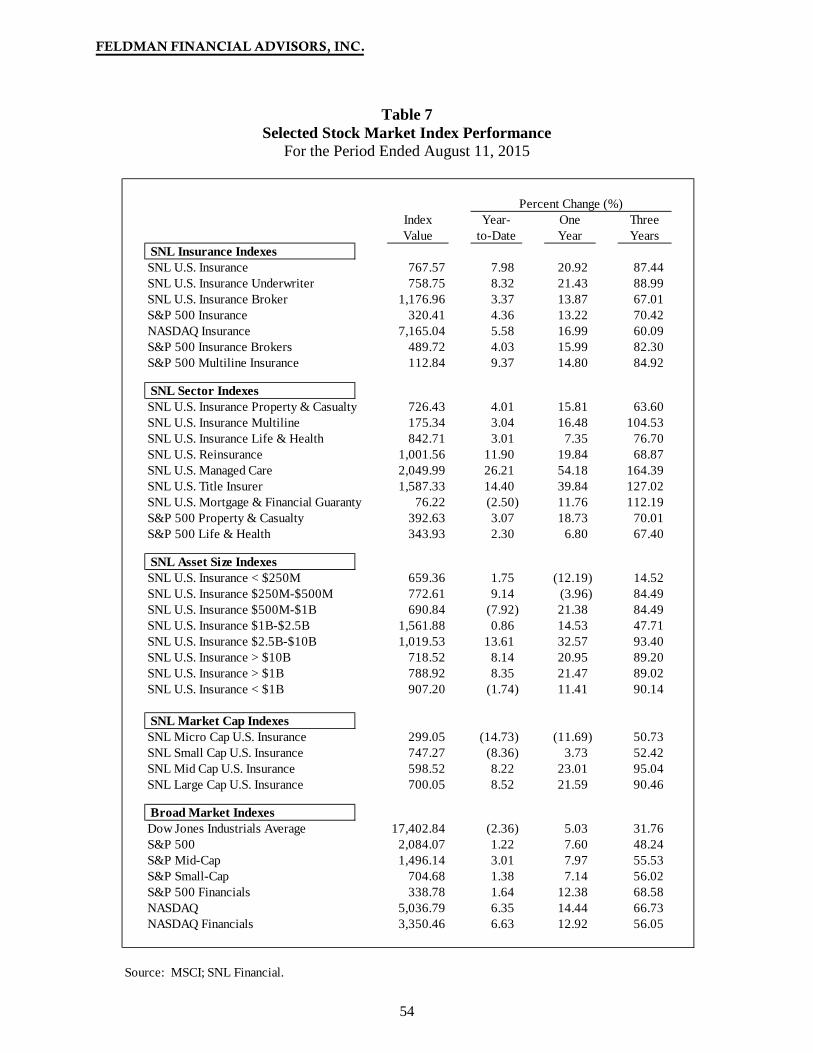
FELDMAN FINANCIAL ADVISORS, INC.
54
Table 7 Selected Stock Market Index Performance
For the Period Ended August 11, 2015
Index Year- One ThreeValue to-Date Year Years
SNL Insurance IndexesSNL U.S. Insurance 767.57 7.98 20.92 87.44 SNL U.S. Insurance Underwriter 758.75 8.32 21.43 88.99 SNL U.S. Insurance Broker 1,176.96 3.37 13.87 67.01 S&P 500 Insurance 320.41 4.36 13.22 70.42 NASDAQ Insurance 7,165.04 5.58 16.99 60.09 S&P 500 Insurance Brokers 489.72 4.03 15.99 82.30 S&P 500 Multiline Insurance 112.84 9.37 14.80 84.92
SNL Sector IndexesSNL U.S. Insurance Property & Casualty 726.43 4.01 15.81 63.60 SNL U.S. Insurance Multiline 175.34 3.04 16.48 104.53 SNL U.S. Insurance Life & Health 842.71 3.01 7.35 76.70 SNL U.S. Reinsurance 1,001.56 11.90 19.84 68.87 SNL U.S. Managed Care 2,049.99 26.21 54.18 164.39 SNL U.S. Title Insurer 1,587.33 14.40 39.84 127.02 SNL U.S. Mortgage & Financial Guaranty 76.22 (2.50) 11.76 112.19 S&P 500 Property & Casualty 392.63 3.07 18.73 70.01 S&P 500 Life & Health 343.93 2.30 6.80 67.40
SNL Asset Size IndexesSNL U.S. Insurance < $250M 659.36 1.75 (12.19) 14.52 SNL U.S. Insurance $250M-$500M 772.61 9.14 (3.96) 84.49 SNL U.S. Insurance $500M-$1B 690.84 (7.92) 21.38 84.49 SNL U.S. Insurance $1B-$2.5B 1,561.88 0.86 14.53 47.71 SNL U.S. Insurance $2.5B-$10B 1,019.53 13.61 32.57 93.40 SNL U.S. Insurance > $10B 718.52 8.14 20.95 89.20 SNL U.S. Insurance > $1B 788.92 8.35 21.47 89.02 SNL U.S. Insurance < $1B 907.20 (1.74) 11.41 90.14
SNL Market Cap IndexesSNL Micro Cap U.S. Insurance 299.05 (14.73) (11.69) 50.73 SNL Small Cap U.S. Insurance 747.27 (8.36) 3.73 52.42 SNL Mid Cap U.S. Insurance 598.52 8.22 23.01 95.04 SNL Large Cap U.S. Insurance 700.05 8.52 21.59 90.46
Broad Market IndexesDow Jones Industrials Average 17,402.84 (2.36) 5.03 31.76 S&P 500 2,084.07 1.22 7.60 48.24 S&P Mid-Cap 1,496.14 3.01 7.97 55.53 S&P Small-Cap 704.68 1.38 7.14 56.02 S&P 500 Financials 338.78 1.64 12.38 68.58 NASDAQ 5,036.79 6.35 14.44 66.73 NASDAQ Financials 3,350.46 6.63 12.92 56.05
Source: MSCI; SNL Financial.
Percent Change (%)

FELDMAN FINANCIAL ADVISORS, INC.
55
Strengthening fundamentals in the overall insurance industry have included fortified
capital positions, improved product pricing, and increased demand for products as consumers
and businesses accumulate additional cash flow in the rebounding economy. Insurance industry
earnings have been challenged by the low interest rate environment, which has restrained the
growth of investment income. Additionally, pricing on policies has been decelerating,
particularly for commercial lines of insurance. The expansion of regulatory reform from the
banking industry to other financial services industries, such as insurance companies and asset
managers has led to increased costs for compliance, controls, and regulatory systems.
While P&C insurers historically have been very volatile due to cyclical market conditions
and catastrophic losses, the stock performance of these issues has evidenced lesser volatility.
The industry's improved capital position provides a solid buffer against catastrophic losses. The
valuation support for many P&C companies will focus on incremental additions to book value
from stable earnings and capital deployment strategies such as leverage, mergers, dividend
payments, and share repurchases to provide price momentum going forward.
Viewing the broader trends, the overall health of the industry, which endured significant
pricing pressure and reduced exposure since the latest recession, has recently improved with the
stepped-up macro economy. While encountering short term resistance to premium rate
increases, the industry may be poised to experience margin expansion. Although a more
competitive pricing environment is expected to impact insurers' ability to raise premium rates,
the overall operating climate is projected to remain stable and therefore we believe no specific
adjustment is necessary.

FELDMAN FINANCIAL ADVISORS, INC.
56
New Issue Discount
A "new issue" discount that reflects investor concerns and investment risks inherent in all
IPOs is a factor to be considered for purposes of valuing companies converting from mutual to
stock form. The magnitude of the new issue discount typically expands during periods of
declining stock prices as investors require larger inducements, and narrows during stronger
market conditions. The necessity to build a new issue discount into the stock price of a
converting insurance company continues to prevail in recognition of the uncertainty among
investors as a result of the lack of a seasoned trading history for the converting company, its
operation in an intensely competitive industry, underlying concerns regarding business cycle and
interest rate trends, volatility in the stock market, and intensifying competition and product
marketing in the insurance marketplace. We therefore believe that a new issue discount is
reasonable and necessary in the pricing of PIPE's pro forma market value.
Adjustments Conclusion
PIPE's pro forma valuation should be discounted relative to the Comparative Group
because of earning prospects, liquidity of the issue, and the new issue discount. Individual
discounts and premiums are not necessarily additive and may, to some extent, offset or overlay
each other. On the whole, we conclude that PIPE's pro forma valuation should be discounted
relative to the Comparative Group. It is the role of the appraiser to balance the relative dynamics
of price-to-book and price-to-earnings discounts and premiums. We have concluded that a
discount of approximately 40% to 50% based on the price-to-book valuation metric is reasonable
and appropriate for determining PIPE's pro forma Valuation Range relative to the Comparative
Group's trading ratios.

FELDMAN FINANCIAL ADVISORS, INC.
57
Valuation Approach
In determining the estimated pro forma market value of PIPE, we have employed the
comparative market valuation approach and considered the following pricing ratios: price-to-
book value per share ("P/B"), price-to-tangible book value per share ("P/TB"), and price-to-
earnings per share ("P/E"). Table 8 displays the trading market price valuation ratios of the
Comparative Group as of August 11, 2015. Exhibit V displays the pro forma assumptions and
calculations utilized in analyzing PIPE's valuation ratios. In reaching our conclusions of the
Valuation Range, we evaluated the relationship of PIPE's pro forma valuation ratios relative to
the Comparative Group's market valuation data.
Investors continue to make decisions to buy or sell P&C insurance company stocks based
upon consideration of P/E and P/B comparisons. The P/E ratio is an important valuation ratio in
the current insurance stock environment. However, PIPE's uneven earnings performance renders
the comparative P/E approach somewhat less emphasis. Thus, the comparative P/B approach
takes on significant meaning as a valuation metric.
As of August 11, 2015, the median P/B ratio for the Comparative Group was 92.0% and
the mean was 102.7%. In comparison, the Public P&C/Multiline Group median and mean P/B
ratios were positioned higher at 129.2% and 154.8%, respectively. In consideration of the
foregoing analysis along with the additional adjustments discussed in this chapter, we have
determined a pro forma midpoint P/B ratio of 52.1% for PIPE, which reflects an aggregate
midpoint value of $11.0 million based on the assumptions summarized in Exhibit V. Applying a
range of value of 15% above and below the midpoint, the resulting minimum of $9.35 million
reflects a P/B ratio of 48.0% and the resulting maximum of $12.65 million reflects a P/B ratio of
55.6%. To price a converting company such as PCA at 90% of pro forma book value, because of

FELDMAN FINANCIAL ADVISORS, INC.
58
the arithmetic of the calculation, would require very large increases in valuations and produce
very marginal returns on equity. This would likely produce price declines in aftermarket trading.
Accordingly, IPOs of converting insurance companies and savings institutions continue to be
priced at substantial discounts to comparable publicly traded companies.
PIPE's pro forma P/B valuation ratios reflect discounts to the Comparative Group's
median P/B ratio of 92.0%, with discounts measuring 39.6% at PIPE's maximum valuation,
43.4% at the midpoint valuation, and 47.8% at the minimum valuation. PIPE's P/TB valuation
ratios reflect discounts to the Comparative Group's mean P/TB ratio of 102.7%, measuring
45.9% at PIPE's maximum valuation, 49.3% at the midpoint valuation, and 53.3% at the
minimum valuation. In our opinion, these levels of discounts are appropriate to reflect the
differences in operating fundamentals discussed in Chapter III and the aforementioned
adjustments specified for earnings prospects, the new issue discount, and liquidity of the issue.
In addition, we also took into consideration the low returns on equity that would be anticipated
by PIPE on a pro forma stand-alone basis as its capital levels reach levels ranging from a 50.3%
pro forma equity-to-assets ratio at the minimum valuation to 52.4% at the midpoint valuation and
54.2% at the maximum valuation. PIPE's pro forma equity-to-assets ratios would considerably
exceed the Comparative Group's median of 31.2% and mean of 37.0%. PIPE's ability to deploy
the pro forma capital profitably and to generate top-line premium growth and improved earnings
constitutes a significant operating challenge in the highly competitive MPL insurance
marketplace saddled by soft market conditions wherein PIPE strives to overcome the lack of
economies of scale, critical mass, and geographic diversification in its fundamental business
model.

FELDMAN FINANCIAL ADVISORS, INC.
59
The Comparative Group's median and mean P/E ratios were 11.0x and 10.4x,
respectively, as of August 11, 2015. Based on PIPE's historical earnings for the LTM ended
June 30, 2015 and the assumed returns from re-investment of the net capital proceeds, PIPE's pro
forma P/E ratios range from 9.7x at the minimum valuation and 11.3x at the midpoint valuation
to 12.9x at the maximum valuation. PIPE's pro forma P/E ratios reflect a discount to the
Comparative Group median of 11.8% at the maximum valuation and premiums of 2.7% at the
midpoint valuation and 17.3% at the maximum valuation. As discussed earlier, the challenge
confronting PIPE would be to redeploy and leverage the additional equity capital to produce
meaningful increases in premium volume and earnings while reducing its reliance on a declining
stream of investment income to generate profitability.
Based on the price-to-assets ("P/A") measure, PIPE's midpoint valuation of $11.0 million
reflects a P/A ratio of 27.3%, ranging from 24.2% at the minimum valuation to 30.1% at the
maximum valuation. In contrast, the Comparative Group exhibited median and mean P/A ratios
of 33.9% and 37.1%, respectively. Reviewing another valuation metric, price-to-total revenue,
PIPE's pro forma ratios range from 1.57x at the minimum valuation to 2.11x at the maximum
valuation with a midpoint of 1.84x, which is positioned at a premium to the Comparative Group
median and mean ratios of 0.75x and 0.97x, respectively. PIPE's valuation premium on the P/A
ratio basis is reflective of its strong capital position on a pro forma basis, while the premium on
the price-to-total revenue basis is indicative of the additional underwriting capacity that would be
afforded PIPE and the opportunity to leverage its increased equity to produce growth in revenue
and earnings.
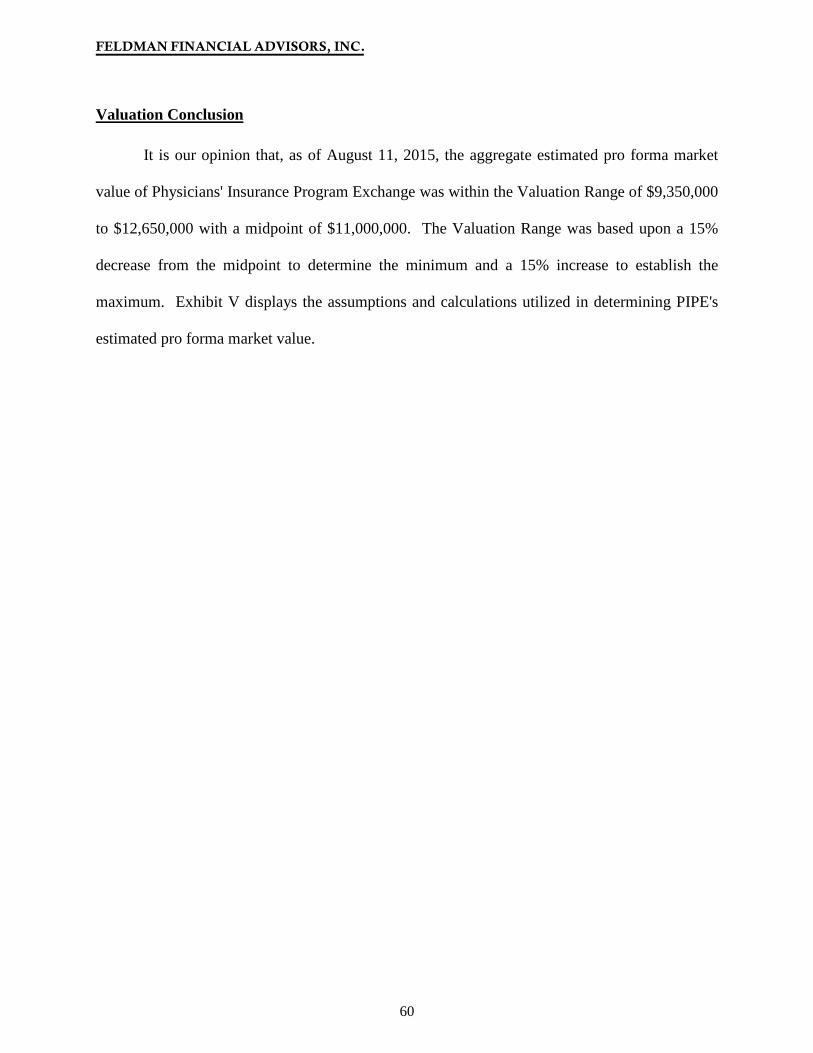
FELDMAN FINANCIAL ADVISORS, INC.
60
Valuation Conclusion
It is our opinion that, as of August 11, 2015, the aggregate estimated pro forma market
value of Physicians' Insurance Program Exchange was within the Valuation Range of $9,350,000
to $12,650,000 with a midpoint of $11,000,000. The Valuation Range was based upon a 15%
decrease from the midpoint to determine the minimum and a 15% increase to establish the
maximum. Exhibit V displays the assumptions and calculations utilized in determining PIPE's
estimated pro forma market value.

FELDMAN FINANCIAL ADVISORS, INC.
61
Table 8Comparative Market Valuation Analysis
Physicians' Insurance Program Exchange and the Comparative GroupMarket Price Data as of August 11, 2015
Closing Total Price/ Price/ Price/ Price/ Price/ Price/ Total Stock Total Market Book Tang. LTM Oper. Total Total Equity/Price Assets Value Value Book EPS EPS Rev. Assets Assets
Company ($) ($mil.) ($mil.) (%) (%) (x) (x) (x) (%) (%) (%)
Physicians' Insurance Program Exchange Pro Forma Minimum 10.00 38.7 9.4 48.0 48.0 9.7 9.7 1.57 24.17 50.33 0.00 Pro Forma Midpoint 10.00 40.3 11.0 52.1 52.1 11.3 11.2 1.84 27.27 52.36 0.00 Pro Forma Maximum 10.00 42.0 12.7 55.6 55.6 12.9 12.8 2.11 30.13 54.23 0.00
Comparative Group Median NA 357.1 104.2 92.0 103.7 11.0 10.7 0.75 33.93 31.16 0.60Comparative Group Mean NA 572.1 188.6 102.7 108.6 10.4 10.8 0.97 37.12 37.01 1.08
Public P&C/Multiline Median NA 4,563.9 1,612.4 129.2 140.4 12.7 14.3 1.07 32.06 28.14 1.73Public P&C/Multiline Mean NA 39,974.6 12,546.4 154.8 166.6 14.6 15.3 1.28 41.80 28.78 1.68
Comparative Group1347 Property Insurance Holdings 7.66 75.9 48.7 99.4 100.0 NM NA 2.30 64.20 64.56 0.00American Independence Corp. 10.61 182.4 85.7 91.7 118.2 14.9 NA 0.50 47.00 52.96 0.00Atlantic American Corporation 3.68 327.2 75.7 74.3 76.2 12.3 NA 0.45 23.13 32.25 0.54Donegal Group Inc. 14.43 1,519.4 443.7 92.4 93.8 15.0 16.0 0.72 29.20 28.77 3.74EMC Insurance Group Inc. 22.68 1,520.1 468.8 90.9 91.1 9.8 10.5 0.77 30.84 33.91 2.94Federated National Holding Co. 24.54 601.1 349.2 157.9 157.9 8.8 9.4 1.70 58.09 38.50 0.65First Acceptance Corporation 2.99 387.0 122.7 114.9 120.6 5.0 NA 0.42 31.71 27.59 0.00Hallmark Financial Services, Inc. 11.24 1,041.9 215.9 82.5 107.4 11.5 13.4 0.60 20.72 25.18 0.00Kingstone Companies, Inc. 7.63 137.4 56.0 136.9 144.4 10.5 10.9 1.03 40.73 29.78 2.62National Security Group, Inc. 14.16 147.0 35.5 80.3 80.3 4.5 4.5 0.54 24.15 30.07 1.13Unico American Corporation 9.18 135.6 49.0 68.6 68.6 NM NM 1.59 36.15 52.70 0.00United Insurance Holdings Corp. 14.50 789.7 312.2 142.2 145.0 11.9 NA 1.00 39.53 27.79 1.38
Source: PIPE; SNL Financial; Feldman Financial.
Current Div.
Yield

FELDMAN FINANCIAL ADVISORS, INC.
I-1
Exhibit I Background of Feldman Financial Advisors, Inc.
Overview of Firm
Feldman Financial Advisors provides consulting and advisory services to financial services companies in the areas of corporate valuations, mergers and acquisitions, strategic planning, branch sales and purchases, developing and implementing regulatory business and capital plans, and expert witness testimony and analysis. Our senior staff members have been involved in the mutual to stock conversion process since 1982 and have valued more than 350 converting institutions.
Feldman Financial Advisors was incorporated in February 1996 by a group of consultants who were previously associated with Credit Suisse First Boston and Kaplan Associates. Each of the officers of Feldman Financial Advisors has over 30 years of experience in consulting to financial institutions and financial services companies. Our senior staff collectively has worked with more than 1,000 commercial banks, savings institutions, mortgage companies, and insurance companies nationwide. The firm's office is located in Washington, D.C.
Background of Senior Professional Staff
Trent Feldman - President. Trent is a nationally recognized expert in providing strategic advice to and valuing financial service companies, and advising on mergers and acquisitions. Trent was with Kaplan Associates for 14 years and was one of three founding principals at that firm. Trent also has worked at the Federal Home Loan Bank Board and with the California legislature. Trent holds Bachelors and Masters Degrees from the University of California, Los Angeles.
Peter Williams - Principal. Peter specializes in merger and acquisition analysis, stock and other corporate valuations, strategic business plans, and retail delivery analysis. Peter was with Kaplan Associates for 13 years. Peter also worked as a Corporate Development Analyst with the Wilmington Trust Company in Delaware. Peter holds a BA in Economics from Yale University and an MBA in Finance and Investments from George Washington University.
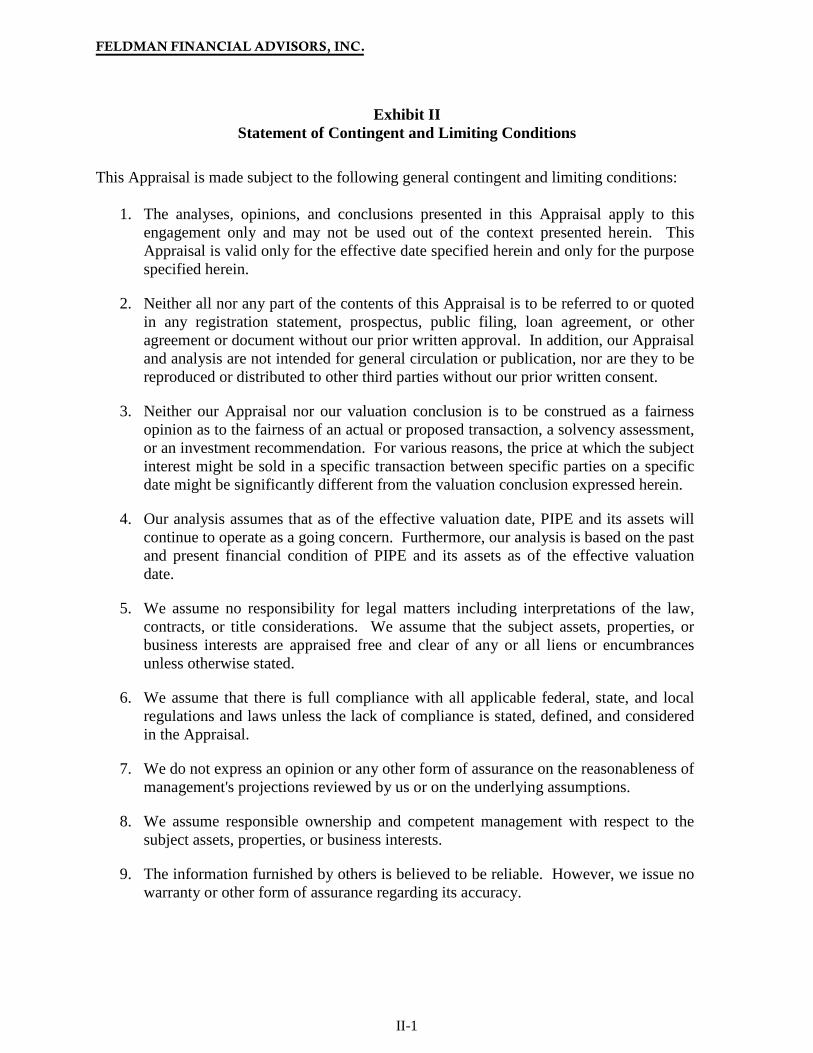
FELDMAN FINANCIAL ADVISORS, INC.
II-1
Exhibit II Statement of Contingent and Limiting Conditions
This Appraisal is made subject to the following general contingent and limiting conditions:
1. The analyses, opinions, and conclusions presented in this Appraisal apply to this engagement only and may not be used out of the context presented herein. This Appraisal is valid only for the effective date specified herein and only for the purpose specified herein.
2. Neither all nor any part of the contents of this Appraisal is to be referred to or quoted in any registration statement, prospectus, public filing, loan agreement, or other agreement or document without our prior written approval. In addition, our Appraisal and analysis are not intended for general circulation or publication, nor are they to be reproduced or distributed to other third parties without our prior written consent.
3. Neither our Appraisal nor our valuation conclusion is to be construed as a fairness opinion as to the fairness of an actual or proposed transaction, a solvency assessment, or an investment recommendation. For various reasons, the price at which the subject interest might be sold in a specific transaction between specific parties on a specific date might be significantly different from the valuation conclusion expressed herein.
4. Our analysis assumes that as of the effective valuation date, PIPE and its assets will continue to operate as a going concern. Furthermore, our analysis is based on the past and present financial condition of PIPE and its assets as of the effective valuation date.
5. We assume no responsibility for legal matters including interpretations of the law, contracts, or title considerations. We assume that the subject assets, properties, or business interests are appraised free and clear of any or all liens or encumbrances unless otherwise stated.
6. We assume that there is full compliance with all applicable federal, state, and local regulations and laws unless the lack of compliance is stated, defined, and considered in the Appraisal.
7. We do not express an opinion or any other form of assurance on the reasonableness of management's projections reviewed by us or on the underlying assumptions.
8. We assume responsible ownership and competent management with respect to the subject assets, properties, or business interests.
9. The information furnished by others is believed to be reliable. However, we issue no warranty or other form of assurance regarding its accuracy.

FELDMAN FINANCIAL ADVISORS, INC.
III-1
Exhibit III-1 Physicians' Insurance Program Exchange
Balance Sheets As of December 31, 2013 and 2014 and June 30, 2015
(Dollars in Thousands)
June 30,2015 2014 2013
AssetsCash, cash equivalents, and short-term investments 2,183$ 4,624$ 1,695$ Investment securities 24,454 23,861 26,104 Accrued investment income 206 186 218 Premiums receivable 251 917 1,212 Reinsurance recoverable - - 1,755 Prepaid reinsurance premiums - - 508 Reinsurance deposit 1,975 1,221 - Deferred policy acquisition costs 740 530 609 Deferred tax assets 93 - 478 Income taxes recoverable 791 575 89 Other assets - 0 11 Total Assets 30,691$ 31,914$ 32,679$
Liabilities and Subscribers' EquityInsurance reserves: Losses and loss adjustment expenses 15,555$ 16,262$ 15,930$ Unearned premiums 2,959 2,121 2,436 Advanced premiums 243 1,139 1,259 Deposits and amounts held for others 17 33 110 Reinsurance payable 164 202 273 Accounts payable and accrued expenses 225 127 24 Deferred tax liability - 29 - Payable to attorney-in-fact 55 151 150 Total Liabilities 19,219 20,064 20,181
Subscribers' EquityMembers' equity 11,369 11,630 12,534 Accumulated other comprehensive income (loss) 103 219 (37) Total Subscribers' Equity 11,472 11,850 12,497
Total Liabilities and Subscribers' Equity 30,691$ 31,914$ 32,679$
Source: PIPE, unaudited GAAP financial statements.
December 31,
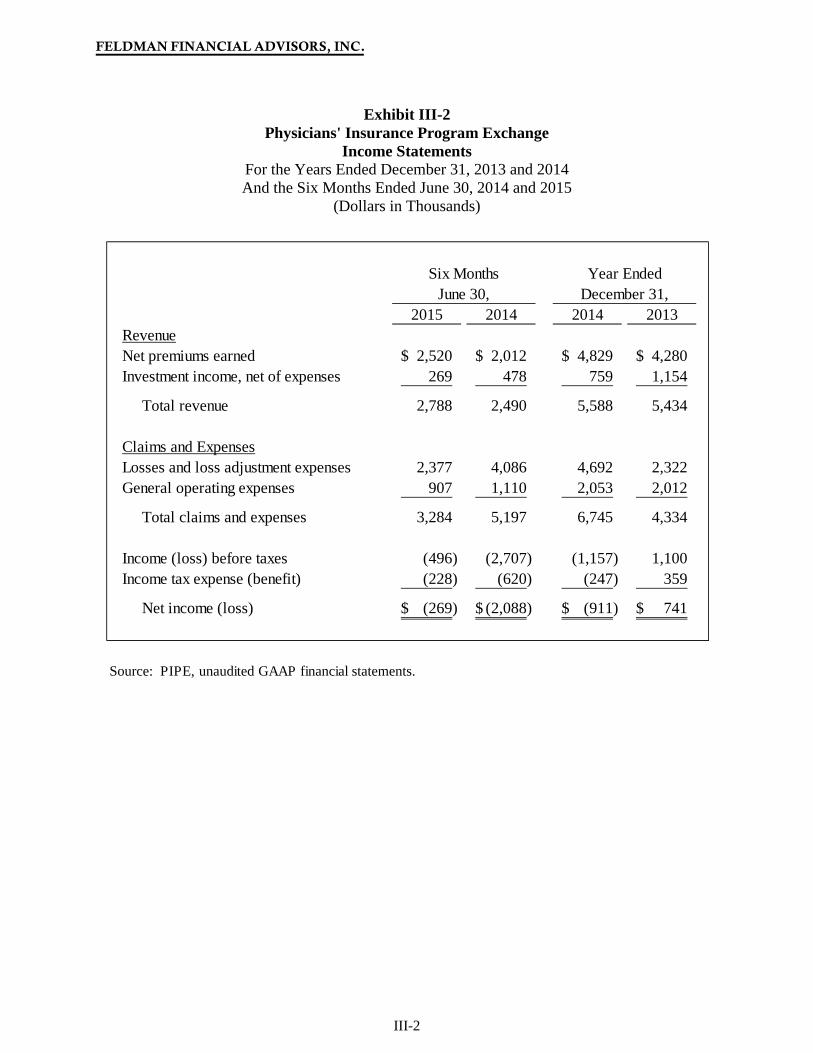
FELDMAN FINANCIAL ADVISORS, INC.
III-2
Exhibit III-2 Physicians' Insurance Program Exchange
Income Statements For the Years Ended December 31, 2013 and 2014 And the Six Months Ended June 30, 2014 and 2015
(Dollars in Thousands)
2015 2014 2014 2013RevenueNet premiums earned 2,520$ 2,012$ 4,829$ 4,280$ Investment income, net of expenses 269 478 759 1,154
Total revenue 2,788 2,490 5,588 5,434
Claims and ExpensesLosses and loss adjustment expenses 2,377 4,086 4,692 2,322 General operating expenses 907 1,110 2,053 2,012
Total claims and expenses 3,284 5,197 6,745 4,334
Income (loss) before taxes (496) (2,707) (1,157) 1,100 Income tax expense (benefit) (228) (620) (247) 359
Net income (loss) (269)$ (2,088)$ (911)$ 741$
Source: PIPE, unaudited GAAP financial statements.
Six Months Year EndedJune 30, December 31,

FELDMAN FINANCIAL ADVISORS, INC.
III-3
Exhibit III-3 Physicians' Insurance Program Exchange
Investment Securities Portfolio As of December 31, 2013 and 2014
(Dollars in Thousands)
Fair Percent Fair PercentValue of Total Value of Total
($000s) (%) ($000s) (%)
Debt securities:U.S. Government securities 1,254$ 5.25 1,987$ 7.61 States and subdivisions obligations 3,383 14.18 3,564 13.65 Mortgage-backed securities 7,111 29.80 8,185 31.36 Corporate and industrial bonds 9,766 40.93 11,309 43.32
Total debt securities 21,514 90.16 25,045 95.94
Equity securities:Common and preferred stocks 2,347 9.84 1,059 4.06
Total investment securities 23,861$ 100.00 26,104$ 100.00
Source: PIPE, financial statement data.
December 31, December 31,2014 2013
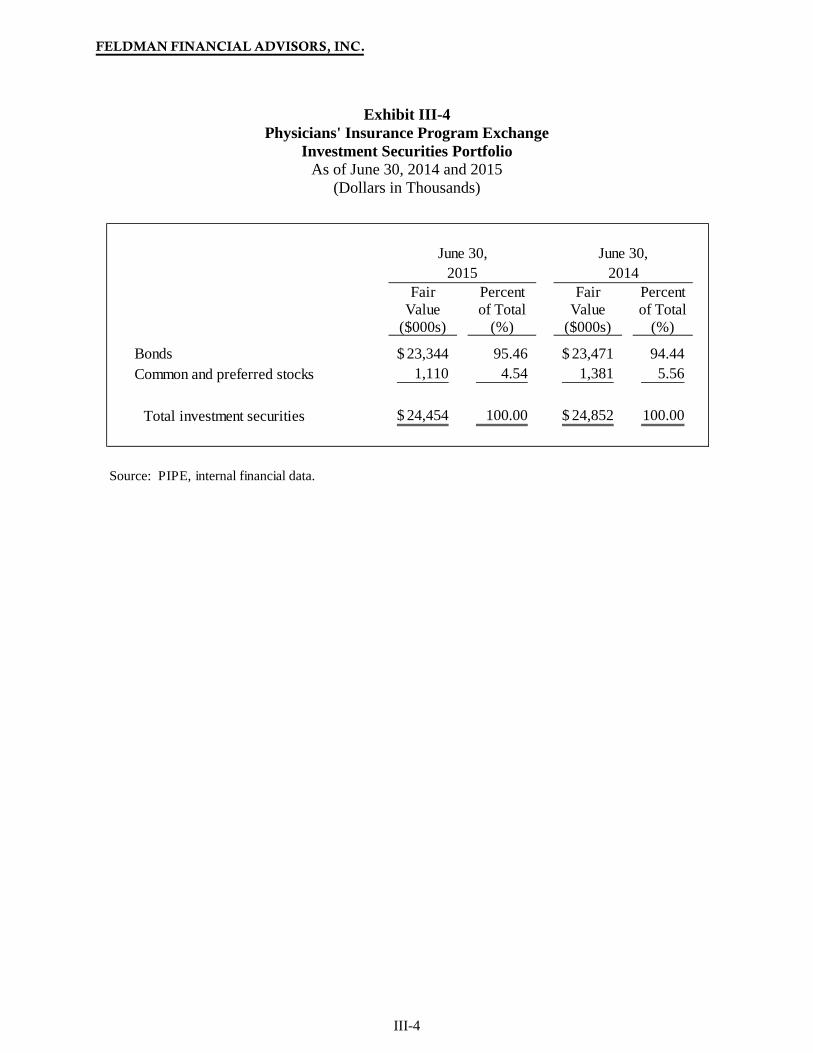
FELDMAN FINANCIAL ADVISORS, INC.
III-4
Exhibit III-4 Physicians' Insurance Program Exchange
Investment Securities Portfolio As of June 30, 2014 and 2015
(Dollars in Thousands)
Fair Percent Fair PercentValue of Total Value of Total
($000s) (%) ($000s) (%)
Bonds 23,344$ 95.46 23,471$ 94.44 Common and preferred stocks 1,110 4.54 1,381 5.56
Total investment securities 24,454$ 100.00 24,852$ 100.00
Source: PIPE, internal financial data.
June 30, June 30,2015 2014

FELDMAN FINANCIAL ADVISORS, INC.
III-5
Exhibit III-5 Physicians' Insurance Program Exchange
Statutory Financial Data As of or For the Years Ended December 31, 2010 to 2014
(Dollars in Thousands)
2014 2013 2012 2011 2010Selected Balance Sheet DataTotal Assets $31,287 $29,829 $29,831 $30,382 $29,628Total Cash and Investments 28,125 27,885 27,757 28,040 26,726 Loss Reserves 11,351 9,801 10,122 10,882 10,080 Loss Adjustment Expense (LAE) Reserves 4,447 3,859 4,707 4,832 4,938 Total Loss and LAE Reserves 15,797 13,661 14,830 15,714 15,019 Unearned Premium Reserve 2,121 1,928 2,036 2,485 2,469 Total Liabilities 19,570 17,918 18,798 20,445 20,777 Surplus Notes 0 0 0 0 0Capital and Surplus 11,717 11,911 11,033 9,938 8,852 Capital and Surplus / Assets (%) 37.45 39.93 36.99 32.71 29.88 Reserves / Capital and Surplus (%) 134.82 114.69 134.41 158.12 169.67 Selected Income Statement DataDirect Premiums Written (DPW) $5,022 $5,764 $6,633 $7,146 $7,328Net Reinsurance Premiums 0 (1,592) (1,900) (1,923) (2,099)Net Premiums Written (NPW) 5,022 4,172 4,733 5,223 5,229Net Premiums Earned 4,829 4,280 5,182 5,208 5,008Net Loss and LAE Incurred 4,227 2,322 3,095 2,937 3,802Net Underwriting Expense Incurred 1,940 1,942 2,052 2,199 2,200Net Underwriting Gain (Loss) (1,339) 16 35 71 (994)Net Investment Income 734 988 1,142 1,145 1,058Net Realized Capital Gains 26 166 180 114 460Income Tax Expense (Benefit) (588) 403 377 448 354Net Income 8 767 981 881 171 Premiums Written By Major Segment (%)Personal Lines - DPW 0.00 0.00 0.00 0.00 0.00Commercial Lines - DPW 100.00 100.00 100.00 100.00 100.00 Personal Lines - NPW 0.00 0.00 0.00 0.00 0.00Commercial Lines - NPW 100.00 100.00 100.00 100.00 100.00 Operating Ratios (%)Growth Rate - DPW (12.87) (13.11) (7.18) (2.48) (2.32)Growth Rate - NPW 20.37 (11.85) (9.39) (0.12) (1.97)Loss and LAE Ratio 87.55 54.25 59.72 56.41 75.92Expense Ratio 38.63 46.55 43.35 42.11 42.06Combined Ratio 126.18 100.80 103.07 98.51 117.98Operating Ratio 110.99 77.71 81.03 76.53 96.86Effective Tax Rate NM 34.46 27.74 33.73 67.42Net Yield on Invested Assets 2.74 3.50 3.99 4.13 4.08Return on Average Equity 0.03 2.58 3.24 2.98 0.62Return on Average Assets 0.08 6.92 9.82 10.03 2.06
As of or For the Years Ended December 31,

FELDMAN FINANCIAL ADVISORS, INC.
III-6
Exhibit III-5 (continued) Physicians' Insurance Program Exchange
Statutory Financial Data As of or For the Years Ended December 31, 2010 to 2014
(Dollars in Thousands)
2014 2013 2012 2011 2010Underwriting RevenueDirect Premiums Written $5,022 $5,764 $6,633 $7,146 $7,328 Personal P&C Direct Premiums 0 0 0 0 0 Commercial P&C Direct Premiums 5,022 5,764 6,633 7,146 7,328 Net Reinsurance Premiums 0 (1,592) (1,900) (1,923) (2,099)Net Premiums Written 5,022 4,172 4,733 5,223 5,229Change in Unearned Premiums Reserve 193 (108) (449) 16 221Net Premiums Earned 4,829 4,280 5,182 5,208 5,008 Underwriting Deductions Net Losses Paid - Personal 0 0 0 0 0 Net Losses Paid - Commercial 293 1,686 2,558 945 926 Net Losses Paid 293 1,686 2,558 945 926 Net LAE Paid 1,798 1,805 1,421 1,297 949 Change in Loss Reserves - Personal 0 0 0 0 0 Change in Loss Reserves - Commercial 1,549 (321) (760) 802 1,144 Change in LAE Reserves 587 (848) (125) (106) 784 Net Change in Loss and LAE Reserves 2,137 (1,169) (885) 696 1,927 Losses and LAE Incurred 4,227 2,322 3,095 2,937 3,802Other Underwriting Expense Incurred 1,940 1,942 2,052 2,199 2,200 Net Underwriting Gain (Loss) (1,339) 16 35 71 (994) Investment IncomeNet Investment Income (Loss) 734 988 1,142 1,145 1,058Net Realized Capital Gains 26 166 180 114 460 Other IncomeFinance Service Charges 0 0 0 0 1All Other Income 0 0 0 0 0 Net IncomeNet Income (Loss) Before Taxes (579) 1,170 1,357 1,330 525Federal Income Tax Expense (Benefit) (588) 403 377 448 354Net Income 8 767 981 881 171 Change in Capital and SurplusCapital and Surplus, Beginning of Period $11,911 $11,033 $9,938 $8,852 $8,187Net Income 8 767 981 881 171Net Unrealized Capital Gains (Losses) (50) 0 76 113 170Change in Surplus Notes 0 0 0 0 0All Other Changes in Surplus (159) 104 (55) (22) 61 Capital and Surplus, End of Period $11,717 $11,911 $11,033 $9,938 $8,852
For the Years Ended December 31,

FELDMAN FINANCIAL ADVISORS, INC.
III-7
Exhibit III-5 (continued) Physicians' Insurance Program Exchange
Statutory Financial Data As of or For the Years Ended December 31, 2010 to 2014
(Dollars in Thousands)
2014 2013 2012 2011 2010Operating Ratios (%) Loss Ratio 38.15 31.89 34.70 33.54 41.32 Loss Adjustment Expense Ratio 49.40 22.36 25.02 22.87 34.60Loss and LAE Ratio 87.55 54.25 59.72 56.41 75.92 Net Commission Ratio 10.01 13.83 14.21 13.93 11.65 Salaries and Benefits Ratio 13.70 19.56 18.13 18.11 0.00 Tax, License and Fees Ratio 3.08 3.01 3.02 2.95 3.03 Admin. and Other Expense Ratio 11.84 10.15 7.99 7.12 27.38Expense Ratio 38.63 46.55 43.35 42.11 42.06 Combined Ratio 126.18 100.80 103.07 98.51 117.98 Operating Ratio 110.99 77.71 81.03 76.53 96.86 Premium AnalysisDirect Premiums Written (DPW) $5,022 $5,764 $6,633 $7,146 $7,328Gross Premiums Written (GPW) 5,022 5,764 6,633 7,146 7,328Net Premiums Written (NPW) 5,022 4,172 4,733 5,223 5,229Annual Growth DPW (%) (12.87) (13.11) (7.18) (2.48) (2.32) Annual Growth GPW (%) (12.87) (13.11) (7.18) (2.48) (2.32) Annual Growth NPW (%) 20.37 (11.85) (9.39) (0.12) (1.97) DPW by Line of Business (%)Major Segment - Personal (est.) 0.00 0.00 0.00 0.00 0.00Major Segment - Commercial (est.) 100.00 100.00 100.00 100.00 100.00 Medical Malpractice 100.00 100.00 100.00 100.00 100.00Commerical Multi-Peril Combined 0.00 0.00 0.00 0.00 0.00Workers Compensation 0.00 0.00 0.00 0.00 0.00Other Commercial 0.00 0.00 0.00 0.00 0.00 Loss and LAE Ratio by Line of Business (%)Major Segment - Personal (est.) NA NA NA NA NAMajor Segment - Commercial (est.) 87.54 54.25 59.71 56.42 75.91
Medical Malpractice 87.54 54.25 59.71 56.42 75.91 Commerical Multi-Peril Combined NA NA NA NA NAWorkers Compensation NA NA NA NA NAOther Commercial NA NA NA NA NA Combined Ratio by Line of Business (%)Major Segment - Personal (est.) NA NA NA NA NAMajor Segment - Commercial (est.) 126.17 100.80 103.07 98.52 117.98 Medical Malpractice 126.17 100.80 103.07 98.52 117.98 Commerical Multi-Peril Combined NA NA NA NA NAWorkers Compensation NA NA NA NA NAOther Commercial NA NA NA NA NA
For the Years Ended December 31,

FELDMAN FINANCIAL ADVISORS, INC.
III-8
Exhibit III-5 (continued) Physicians' Insurance Program Exchange
Statutory Financial Data As of or For the Years Ended December 31, 2010 to 2014
(Dollars in Thousands)
2014 2013 2012 2011 2010Investment IncomeNet Investment Income $734 $988 $1,142 $1,145 $1,058Realized Capital Gains 26 166 180 114 460Unrealized Capital Gains (50) 0 76 113 170
Investment Portfolio Composition (%)Total Cash and Investments $28,125 $27,885 $27,757 $28,040 26,726 Bonds 75.21 90.09 90.30 88.14 86.75 Common Stocks 8.34 3.80 3.98 2.94 0.26 Preferred Stocks 0.00 0.00 1.46 0.00 0.00 Cash and Short-term Investments 16.44 6.08 4.26 8.92 12.98 Other Investments 0.00 0.03 0.00 0.00 0.00
Investment Yields by Type (%)Net Yield on Invested Assets 2.74 3.50 3.99 4.13 4.08Gross Yield - Bonds 3.76 3.99 4.51 4.66 4.68Gross Yield - Cash and Short-term Investments 0.39 0.43 0.42 0.92 1.31Gross Yield - Other Investments 0.00 0.00 16.47 0.00 0.00
Bond Portfolio Composition (%)Total Bonds $21,154 $25,273 $25,065 $24,714 23,184 U.S. Government 16.41 17.37 18.18 0.00 2.24 Foreign Government 0.47 0.00 0.00 0.00 0.00 States, Territories and Possessions 0.95 0.79 2.07 1.29 1.93 Political Subdivisions 9.96 9.90 9.87 11.89 10.26 Special Revenue 25.31 26.43 34.74 54.77 51.36 Industrial 46.90 45.50 35.14 32.06 34.21
Bond Average Asset Quality (NAIC Des# 1-6)Total Bonds 1.49 1.51 1.37 1.23 1.26 U.S. Government 1.00 1.00 1.00 NA 1.00 Foreign Government 1.00 NA NA NA NA States, Territories and Possessions 1.00 1.00 1.00 1.00 1.00 Political Subdivisions 1.00 1.00 1.00 1.00 1.00 Special Revenue 1.05 1.04 1.03 1.01 1.00 Industrial 2.03 2.11 2.03 1.71 1.76
Bonds Rated 3 - 6 / Total Bonds (%) 14.61 14.04 11.36 6.90 8.67Bonds Rated 3 - 6 / Capital and Surplus (%) 26.37 29.80 25.80 17.17 22.72
Equity InvestmentsTotal Common Stock $2,347 $1,059 $1,104 $824 $70Total Preferred Stock 0 0 404 0 0
Other InvestmentsTotal Mortgage Loans $0 $0 $0 $0 0Total Real Estate 0 0 0 0 0
Source: SNL Financial, statutory financial data.
For the Years Ended December 31,

FELDMAN FINANCIAL ADVISORS, INC.
IV-1
Total Policy Total Tang. LTM Net Prem. YTD YTD YTD Total Policy Total Resrvs./ Equity/ Equity/ Total Written/ Loss Exp. Comb. LTM LTM
Assets Reserves Equity Equity Assets Assets Revenue Avg.Eq. Ratio Ratio Ratio ROA ROE Company State ($mil.) ($mil.) ($mil.) (x) (%) (%) ($mil.) (x) (%) (%) (%) (%) (%)
1347 Property Insurance Holdings FL 76 18 49 0.37 64.56 64.56 21 0.53 10.5 55.3 65.8 (0.12) (0.17) Alleghany Corporation NY 23,928 13,443 7,650 1.76 31.97 31.26 5,112 0.58 54.6 33.8 88.4 2.68 8.45 Allstate Corporation IL 107,117 69,755 21,298 3.28 19.88 18.96 35,629 NA 70.6 26.3 96.9 2.43 11.87 American Financial Group, Inc. OH 49,424 37,107 4,984 7.45 10.08 9.62 5,945 0.83 60.9 33.3 94.2 0.82 7.68 American International Group, Inc. NY 509,987 267,370 104,642 2.56 20.52 NA 63,781 NA 64.8 34.6 99.4 1.37 6.63 American National Insurance Co. TX 23,319 16,813 4,495 3.74 19.28 19.28 2,997 NA 72.4 31.6 104.0 1.18 6.20 Ameriprise Financial, Inc. MN 148,806 29,345 8,996 3.26 6.05 4.77 12,381 NA 93.8 15.7 109.5 1.32 21.19 AMERISAFE, Inc. LA 1,534 943 473 1.99 30.82 30.82 409 0.84 61.6 22.6 84.2 4.04 13.20 AmTrust Financial Services, Inc. NY 15,967 10,250 2,632 3.89 16.49 12.35 4,440 1.72 65.3 24.5 89.8 3.45 21.08 Assurant, Inc. NY 30,842 19,930 4,828 4.13 15.65 12.31 10,569 NA NA NA NA 0.88 5.26 Atlantic American Corporation GA 327 156 107 1.45 32.25 31.72 166 NA 65.3 32.5 97.8 2.12 6.45 Atlas Financial Holdings, Inc. IL 383 220 121 1.82 31.58 30.51 125 1.27 57.6 28.0 85.6 6.11 17.47 Baldwin & Lyons, Inc. IN 1,126 541 405 1.34 36.01 NA 289 0.65 59.7 33.3 93.0 2.30 6.48 Berkshire Hathaway Inc. NE 540,774 99,030 249,202 0.40 46.08 37.64 199,470 NA 78.3 18.2 96.5 3.49 7.53 Cincinnati Financial Corporation OH 18,888 9,425 6,497 1.45 34.40 34.40 5,143 0.69 63.9 31.0 94.9 3.50 10.07 CNA Financial Corporation IL 55,022 36,368 12,234 2.97 22.23 22.02 9,468 0.55 64.7 33.9 98.6 1.40 6.14 Donegal Group Inc. PA 1,519 1,002 437 2.29 28.77 28.46 614 1.44 65.2 33.5 98.7 1.80 6.33 EMC Insurance Group Inc. IA 1,520 922 515 1.79 33.91 33.86 611 1.14 62.8 31.7 94.5 3.17 9.41 Employers Holdings, Inc. NV 3,811 2,696 715 3.77 18.75 17.78 753 0.99 63.0 32.7 95.7 2.31 12.83 Erie Indemnity Company PA 18,069 8,807 8,162 1.08 45.17 NA 6,252 NA 71.1 28.7 99.8 3.90 8.69 Federated National Holding Co. FL 601 332 231 1.44 38.50 38.50 206 0.85 50.1 NA NA 7.43 19.55 First Acceptance Corporation TN 387 191 107 1.79 27.59 26.65 289 NA 79.2 20.4 99.6 7.46 25.14 Hallmark Financial Services, Inc. TX 1,042 658 262 2.51 25.18 20.53 358 1.39 66.1 28.4 94.5 1.89 7.46 Hanover Insurance Group, Inc. MA 14,145 9,328 2,909 3.21 20.56 19.51 5,147 1.67 62.8 33.6 96.4 2.30 11.27 Hartford Financial Services Group CT 241,020 78,834 18,227 4.33 7.56 7.37 18,688 NA 68.5 30.4 98.9 0.67 8.75 HCI Group, Inc. FL 702 288 226 1.28 32.17 32.17 293 1.60 25.1 28.5 53.5 12.21 39.53 Heritage Insurance Holdings, Inc. FL 854 328 312 1.05 36.54 36.54 348 1.34 33.8 24.7 58.5 13.64 32.69 Horace Mann Educators Corp. IL 9,970 6,140 1,307 4.70 13.11 12.69 1,073 0.93 70.9 26.1 97.0 1.08 7.95 Infinity Property and Casualty Corp. AL 2,465 1,334 703 1.90 28.50 26.25 1,474 1.99 77.1 18.7 95.8 2.52 8.76 Kemper Corporation IL 8,055 4,793 2,012 2.38 24.98 21.89 2,208 NA 75.1 26.9 102.0 1.43 5.41
Exhibit IV-1Financial Performance Data for Public P&C and Multiline Companies
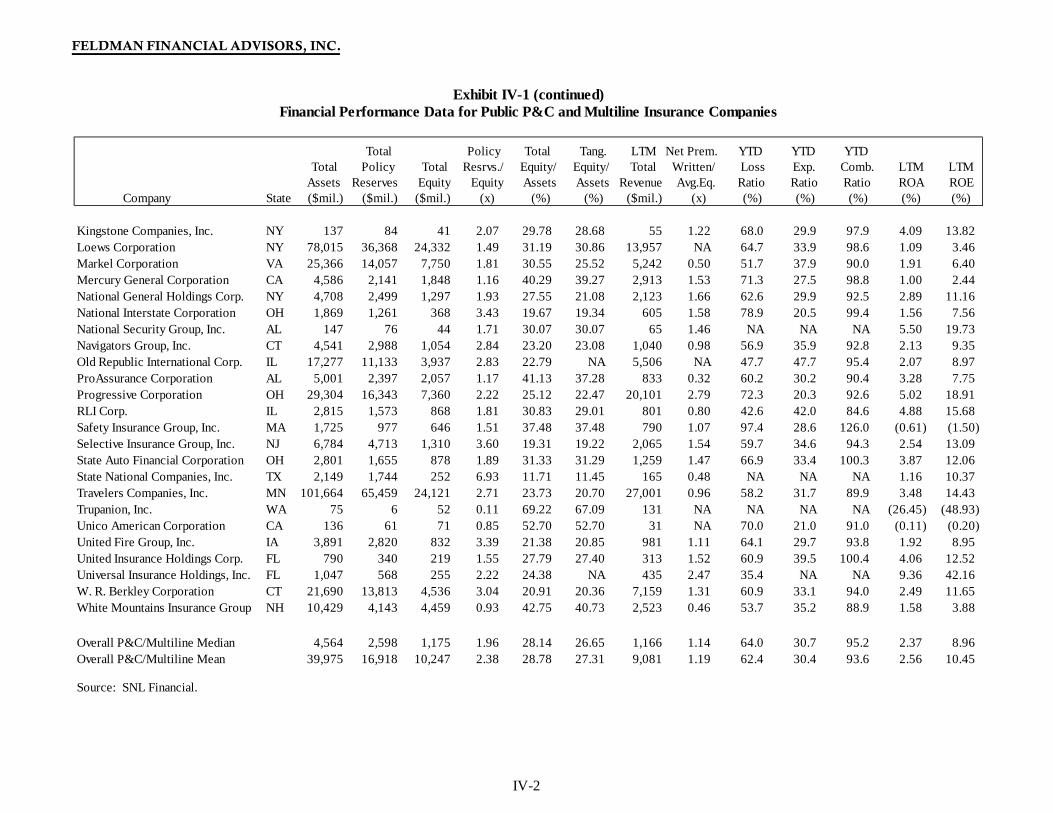
FELDMAN FINANCIAL ADVISORS, INC.
IV-2
Total Policy Total Tang. LTM Net Prem. YTD YTD YTD Total Policy Total Resrvs./ Equity/ Equity/ Total Written/ Loss Exp. Comb. LTM LTM
Assets Reserves Equity Equity Assets Assets Revenue Avg.Eq. Ratio Ratio Ratio ROA ROE Company State ($mil.) ($mil.) ($mil.) (x) (%) (%) ($mil.) (x) (%) (%) (%) (%) (%)
Kingstone Companies, Inc. NY 137 84 41 2.07 29.78 28.68 55 1.22 68.0 29.9 97.9 4.09 13.82 Loews Corporation NY 78,015 36,368 24,332 1.49 31.19 30.86 13,957 NA 64.7 33.9 98.6 1.09 3.46 Markel Corporation VA 25,366 14,057 7,750 1.81 30.55 25.52 5,242 0.50 51.7 37.9 90.0 1.91 6.40 Mercury General Corporation CA 4,586 2,141 1,848 1.16 40.29 39.27 2,913 1.53 71.3 27.5 98.8 1.00 2.44 National General Holdings Corp. NY 4,708 2,499 1,297 1.93 27.55 21.08 2,123 1.66 62.6 29.9 92.5 2.89 11.16 National Interstate Corporation OH 1,869 1,261 368 3.43 19.67 19.34 605 1.58 78.9 20.5 99.4 1.56 7.56 National Security Group, Inc. AL 147 76 44 1.71 30.07 30.07 65 1.46 NA NA NA 5.50 19.73 Navigators Group, Inc. CT 4,541 2,988 1,054 2.84 23.20 23.08 1,040 0.98 56.9 35.9 92.8 2.13 9.35 Old Republic International Corp. IL 17,277 11,133 3,937 2.83 22.79 NA 5,506 NA 47.7 47.7 95.4 2.07 8.97 ProAssurance Corporation AL 5,001 2,397 2,057 1.17 41.13 37.28 833 0.32 60.2 30.2 90.4 3.28 7.75 Progressive Corporation OH 29,304 16,343 7,360 2.22 25.12 22.47 20,101 2.79 72.3 20.3 92.6 5.02 18.91 RLI Corp. IL 2,815 1,573 868 1.81 30.83 29.01 801 0.80 42.6 42.0 84.6 4.88 15.68 Safety Insurance Group, Inc. MA 1,725 977 646 1.51 37.48 37.48 790 1.07 97.4 28.6 126.0 (0.61) (1.50) Selective Insurance Group, Inc. NJ 6,784 4,713 1,310 3.60 19.31 19.22 2,065 1.54 59.7 34.6 94.3 2.54 13.09 State Auto Financial Corporation OH 2,801 1,655 878 1.89 31.33 31.29 1,259 1.47 66.9 33.4 100.3 3.87 12.06 State National Companies, Inc. TX 2,149 1,744 252 6.93 11.71 11.45 165 0.48 NA NA NA 1.16 10.37 Travelers Companies, Inc. MN 101,664 65,459 24,121 2.71 23.73 20.70 27,001 0.96 58.2 31.7 89.9 3.48 14.43 Trupanion, Inc. WA 75 6 52 0.11 69.22 67.09 131 NA NA NA NA (26.45) (48.93) Unico American Corporation CA 136 61 71 0.85 52.70 52.70 31 NA 70.0 21.0 91.0 (0.11) (0.20) United Fire Group, Inc. IA 3,891 2,820 832 3.39 21.38 20.85 981 1.11 64.1 29.7 93.8 1.92 8.95 United Insurance Holdings Corp. FL 790 340 219 1.55 27.79 27.40 313 1.52 60.9 39.5 100.4 4.06 12.52 Universal Insurance Holdings, Inc. FL 1,047 568 255 2.22 24.38 NA 435 2.47 35.4 NA NA 9.36 42.16 W. R. Berkley Corporation CT 21,690 13,813 4,536 3.04 20.91 20.36 7,159 1.31 60.9 33.1 94.0 2.49 11.65 White Mountains Insurance Group NH 10,429 4,143 4,459 0.93 42.75 40.73 2,523 0.46 53.7 35.2 88.9 1.58 3.88
Overall P&C/Multiline Median 4,564 2,598 1,175 1.96 28.14 26.65 1,166 1.14 64.0 30.7 95.2 2.37 8.96 Overall P&C/Multiline Mean 39,975 16,918 10,247 2.38 28.78 27.31 9,081 1.19 62.4 30.4 93.6 2.56 10.45
Source: SNL Financial.
Financial Performance Data for Public P&C and Multiline Insurance CompaniesExhibit IV-1 (continued)
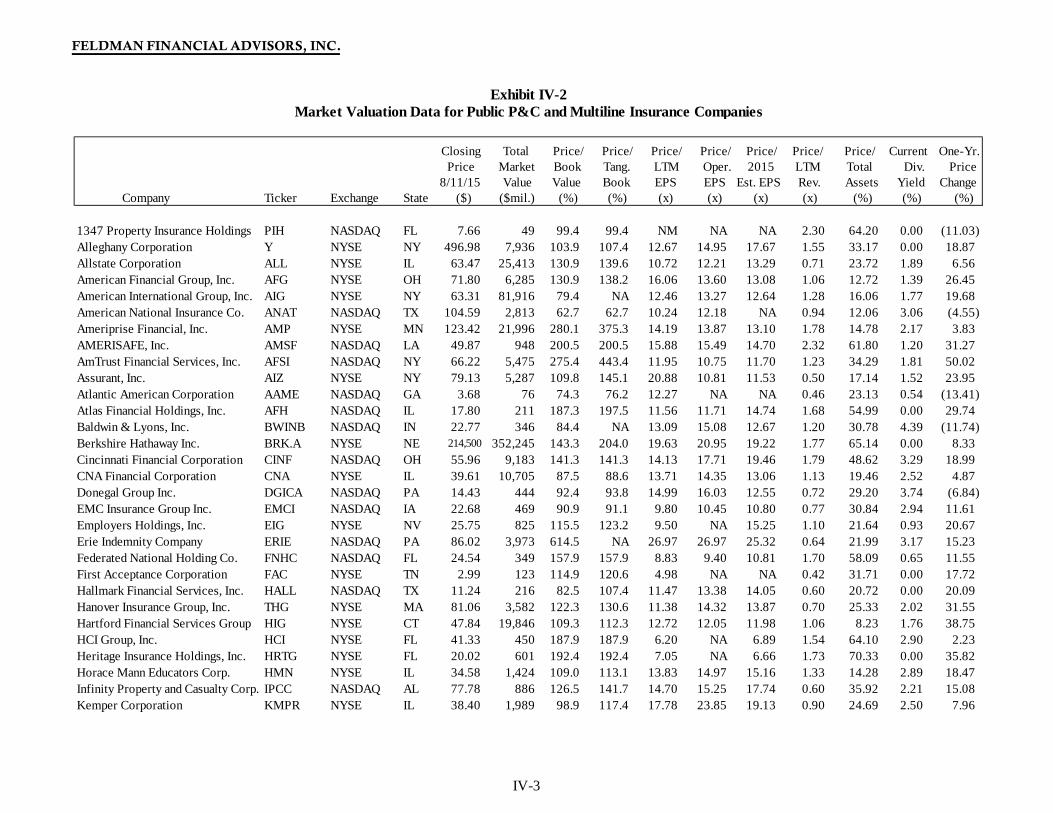
FELDMAN FINANCIAL ADVISORS, INC.
IV-3
Closing Total Price/ Price/ Price/ Price/ Price/ Price/ Price/ Current One-Yr.Price Market Book Tang. LTM Oper. 2015 LTM Total Div. Price
8/11/15 Value Value Book EPS EPS Est. EPS Rev. Assets Yield Change Company Ticker Exchange State ($) ($mil.) (%) (%) (x) (x) (x) (x) (%) (%) (%)
1347 Property Insurance Holdings PIH NASDAQ FL 7.66 49 99.4 99.4 NM NA NA 2.30 64.20 0.00 (11.03) Alleghany Corporation Y NYSE NY 496.98 7,936 103.9 107.4 12.67 14.95 17.67 1.55 33.17 0.00 18.87 Allstate Corporation ALL NYSE IL 63.47 25,413 130.9 139.6 10.72 12.21 13.29 0.71 23.72 1.89 6.56 American Financial Group, Inc. AFG NYSE OH 71.80 6,285 130.9 138.2 16.06 13.60 13.08 1.06 12.72 1.39 26.45 American International Group, Inc. AIG NYSE NY 63.31 81,916 79.4 NA 12.46 13.27 12.64 1.28 16.06 1.77 19.68 American National Insurance Co. ANAT NASDAQ TX 104.59 2,813 62.7 62.7 10.24 12.18 NA 0.94 12.06 3.06 (4.55) Ameriprise Financial, Inc. AMP NYSE MN 123.42 21,996 280.1 375.3 14.19 13.87 13.10 1.78 14.78 2.17 3.83 AMERISAFE, Inc. AMSF NASDAQ LA 49.87 948 200.5 200.5 15.88 15.49 14.70 2.32 61.80 1.20 31.27 AmTrust Financial Services, Inc. AFSI NASDAQ NY 66.22 5,475 275.4 443.4 11.95 10.75 11.70 1.23 34.29 1.81 50.02 Assurant, Inc. AIZ NYSE NY 79.13 5,287 109.8 145.1 20.88 10.81 11.53 0.50 17.14 1.52 23.95 Atlantic American Corporation AAME NASDAQ GA 3.68 76 74.3 76.2 12.27 NA NA 0.46 23.13 0.54 (13.41) Atlas Financial Holdings, Inc. AFH NASDAQ IL 17.80 211 187.3 197.5 11.56 11.71 14.74 1.68 54.99 0.00 29.74 Baldwin & Lyons, Inc. BWINB NASDAQ IN 22.77 346 84.4 NA 13.09 15.08 12.67 1.20 30.78 4.39 (11.74) Berkshire Hathaway Inc. BRK.A NYSE NE 214,500 352,245 143.3 204.0 19.63 20.95 19.22 1.77 65.14 0.00 8.33 Cincinnati Financial Corporation CINF NASDAQ OH 55.96 9,183 141.3 141.3 14.13 17.71 19.46 1.79 48.62 3.29 18.99 CNA Financial Corporation CNA NYSE IL 39.61 10,705 87.5 88.6 13.71 14.35 13.06 1.13 19.46 2.52 4.87 Donegal Group Inc. DGICA NASDAQ PA 14.43 444 92.4 93.8 14.99 16.03 12.55 0.72 29.20 3.74 (6.84) EMC Insurance Group Inc. EMCI NASDAQ IA 22.68 469 90.9 91.1 9.80 10.45 10.80 0.77 30.84 2.94 11.61 Employers Holdings, Inc. EIG NYSE NV 25.75 825 115.5 123.2 9.50 NA 15.25 1.10 21.64 0.93 20.67 Erie Indemnity Company ERIE NASDAQ PA 86.02 3,973 614.5 NA 26.97 26.97 25.32 0.64 21.99 3.17 15.23 Federated National Holding Co. FNHC NASDAQ FL 24.54 349 157.9 157.9 8.83 9.40 10.81 1.70 58.09 0.65 11.55 First Acceptance Corporation FAC NYSE TN 2.99 123 114.9 120.6 4.98 NA NA 0.42 31.71 0.00 17.72 Hallmark Financial Services, Inc. HALL NASDAQ TX 11.24 216 82.5 107.4 11.47 13.38 14.05 0.60 20.72 0.00 20.09 Hanover Insurance Group, Inc. THG NYSE MA 81.06 3,582 122.3 130.6 11.38 14.32 13.87 0.70 25.33 2.02 31.55 Hartford Financial Services Group HIG NYSE CT 47.84 19,846 109.3 112.3 12.72 12.05 11.98 1.06 8.23 1.76 38.75 HCI Group, Inc. HCI NYSE FL 41.33 450 187.9 187.9 6.20 NA 6.89 1.54 64.10 2.90 2.23 Heritage Insurance Holdings, Inc. HRTG NYSE FL 20.02 601 192.4 192.4 7.05 NA 6.66 1.73 70.33 0.00 35.82 Horace Mann Educators Corp. HMN NYSE IL 34.58 1,424 109.0 113.1 13.83 14.97 15.16 1.33 14.28 2.89 18.47 Infinity Property and Casualty Corp. IPCC NASDAQ AL 77.78 886 126.5 141.7 14.70 15.25 17.74 0.60 35.92 2.21 15.08 Kemper Corporation KMPR NYSE IL 38.40 1,989 98.9 117.4 17.78 23.85 19.13 0.90 24.69 2.50 7.96
Exhibit IV-2Market Valuation Data for Public P&C and Multiline Insurance Companies
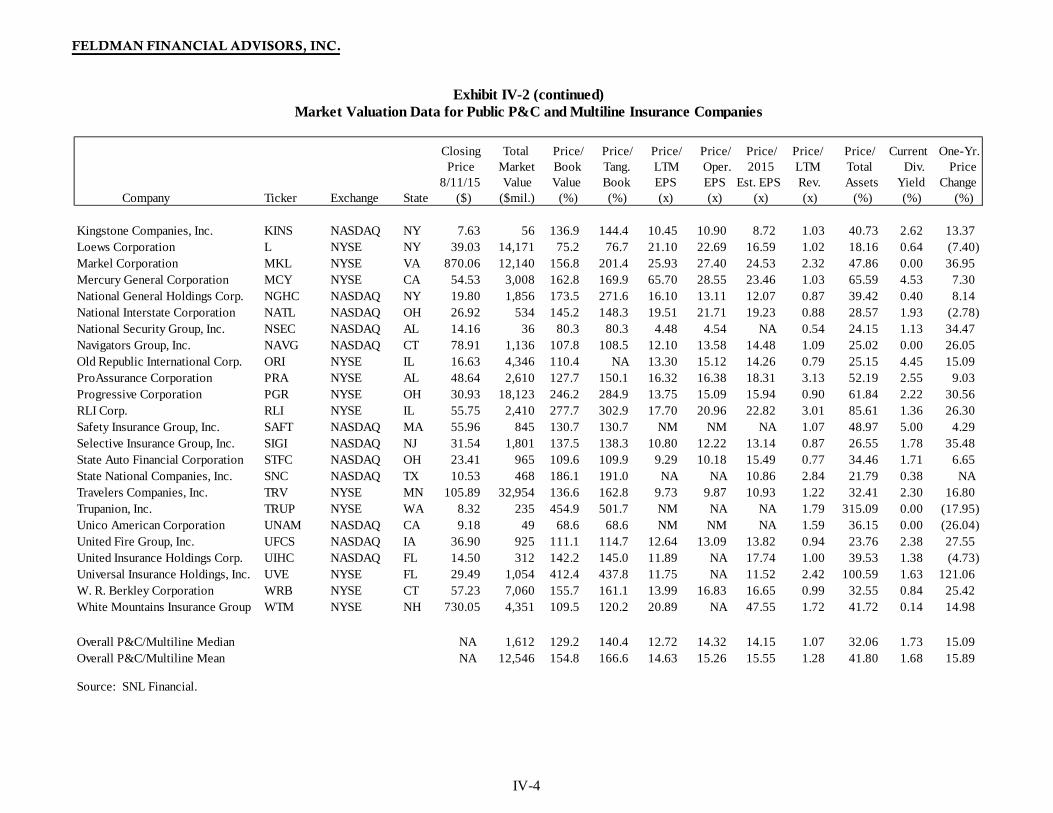
FELDMAN FINANCIAL ADVISORS, INC.
IV-4
Closing Total Price/ Price/ Price/ Price/ Price/ Price/ Price/ Current One-Yr.Price Market Book Tang. LTM Oper. 2015 LTM Total Div. Price
8/11/15 Value Value Book EPS EPS Est. EPS Rev. Assets Yield Change Company Ticker Exchange State ($) ($mil.) (%) (%) (x) (x) (x) (x) (%) (%) (%)
Kingstone Companies, Inc. KINS NASDAQ NY 7.63 56 136.9 144.4 10.45 10.90 8.72 1.03 40.73 2.62 13.37 Loews Corporation L NYSE NY 39.03 14,171 75.2 76.7 21.10 22.69 16.59 1.02 18.16 0.64 (7.40) Markel Corporation MKL NYSE VA 870.06 12,140 156.8 201.4 25.93 27.40 24.53 2.32 47.86 0.00 36.95 Mercury General Corporation MCY NYSE CA 54.53 3,008 162.8 169.9 65.70 28.55 23.46 1.03 65.59 4.53 7.30 National General Holdings Corp. NGHC NASDAQ NY 19.80 1,856 173.5 271.6 16.10 13.11 12.07 0.87 39.42 0.40 8.14 National Interstate Corporation NATL NASDAQ OH 26.92 534 145.2 148.3 19.51 21.71 19.23 0.88 28.57 1.93 (2.78) National Security Group, Inc. NSEC NASDAQ AL 14.16 36 80.3 80.3 4.48 4.54 NA 0.54 24.15 1.13 34.47 Navigators Group, Inc. NAVG NASDAQ CT 78.91 1,136 107.8 108.5 12.10 13.58 14.48 1.09 25.02 0.00 26.05 Old Republic International Corp. ORI NYSE IL 16.63 4,346 110.4 NA 13.30 15.12 14.26 0.79 25.15 4.45 15.09 ProAssurance Corporation PRA NYSE AL 48.64 2,610 127.7 150.1 16.32 16.38 18.31 3.13 52.19 2.55 9.03 Progressive Corporation PGR NYSE OH 30.93 18,123 246.2 284.9 13.75 15.09 15.94 0.90 61.84 2.22 30.56 RLI Corp. RLI NYSE IL 55.75 2,410 277.7 302.9 17.70 20.96 22.82 3.01 85.61 1.36 26.30 Safety Insurance Group, Inc. SAFT NASDAQ MA 55.96 845 130.7 130.7 NM NM NA 1.07 48.97 5.00 4.29 Selective Insurance Group, Inc. SIGI NASDAQ NJ 31.54 1,801 137.5 138.3 10.80 12.22 13.14 0.87 26.55 1.78 35.48 State Auto Financial Corporation STFC NASDAQ OH 23.41 965 109.6 109.9 9.29 10.18 15.49 0.77 34.46 1.71 6.65 State National Companies, Inc. SNC NASDAQ TX 10.53 468 186.1 191.0 NA NA 10.86 2.84 21.79 0.38 NATravelers Companies, Inc. TRV NYSE MN 105.89 32,954 136.6 162.8 9.73 9.87 10.93 1.22 32.41 2.30 16.80 Trupanion, Inc. TRUP NYSE WA 8.32 235 454.9 501.7 NM NA NA 1.79 315.09 0.00 (17.95) Unico American Corporation UNAM NASDAQ CA 9.18 49 68.6 68.6 NM NM NA 1.59 36.15 0.00 (26.04) United Fire Group, Inc. UFCS NASDAQ IA 36.90 925 111.1 114.7 12.64 13.09 13.82 0.94 23.76 2.38 27.55 United Insurance Holdings Corp. UIHC NASDAQ FL 14.50 312 142.2 145.0 11.89 NA 17.74 1.00 39.53 1.38 (4.73) Universal Insurance Holdings, Inc. UVE NYSE FL 29.49 1,054 412.4 437.8 11.75 NA 11.52 2.42 100.59 1.63 121.06 W. R. Berkley Corporation WRB NYSE CT 57.23 7,060 155.7 161.1 13.99 16.83 16.65 0.99 32.55 0.84 25.42 White Mountains Insurance Group WTM NYSE NH 730.05 4,351 109.5 120.2 20.89 NA 47.55 1.72 41.72 0.14 14.98
Overall P&C/Multiline Median NA 1,612 129.2 140.4 12.72 14.32 14.15 1.07 32.06 1.73 15.09Overall P&C/Multiline Mean NA 12,546 154.8 166.6 14.63 15.26 15.55 1.28 41.80 1.68 15.89
Source: SNL Financial.
Exhibit IV-2 (continued)Market Valuation Data for Public P&C and Multiline Insurance Companies
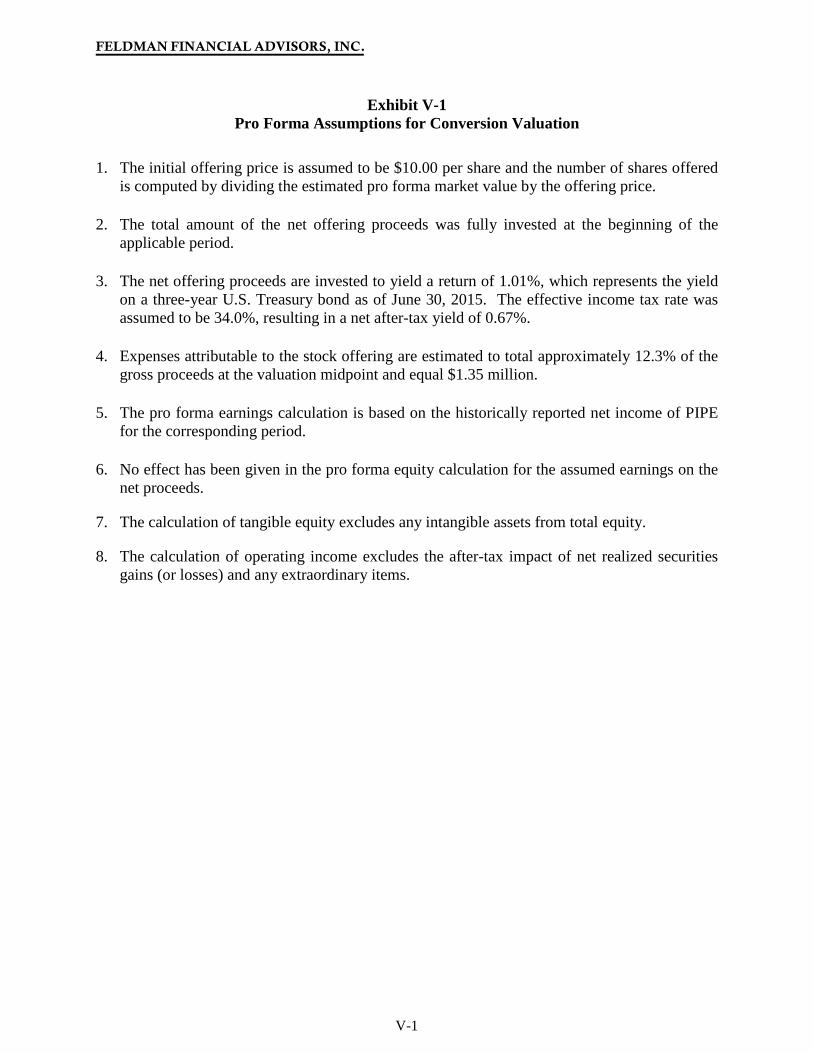
FELDMAN FINANCIAL ADVISORS, INC.
V-1
Exhibit V-1 Pro Forma Assumptions for Conversion Valuation
1. The initial offering price is assumed to be $10.00 per share and the number of shares offered
is computed by dividing the estimated pro forma market value by the offering price.
2. The total amount of the net offering proceeds was fully invested at the beginning of the applicable period.
3. The net offering proceeds are invested to yield a return of 1.01%, which represents the yield on a three-year U.S. Treasury bond as of June 30, 2015. The effective income tax rate was assumed to be 34.0%, resulting in a net after-tax yield of 0.67%.
4. Expenses attributable to the stock offering are estimated to total approximately 12.3% of the gross proceeds at the valuation midpoint and equal $1.35 million.
5. The pro forma earnings calculation is based on the historically reported net income of PIPE for the corresponding period.
6. No effect has been given in the pro forma equity calculation for the assumed earnings on the net proceeds.
7. The calculation of tangible equity excludes any intangible assets from total equity.
8. The calculation of operating income excludes the after-tax impact of net realized securities gains (or losses) and any extraordinary items.

FELDMAN FINANCIAL ADVISORS, INC.
V-2
Exhibit V-2 Pro Forma Conversion Valuation Range
Physicians' Insurance Program Exchange Historical Financial Data as of June 30, 2015
(Dollars in Thousands, Except Per Share Data)
Minimum Midpoint Maximum Shares offered 935,000 1,100,000 1,265,000 Offering price $10.00 $10.00 $10.00 Gross offering proceeds 9,350$ 11,000$ 12,650$ Less: estimated expenses (1,350) (1,350) (1,350) Net offering proceeds 8,000$ 9,650$ 11,300$ Net Income:
LTM ended June 30, 2015 909$ 909$ 909$ Pro forma income on net proceeds 53 64 75 Pro forma net income 962$ 973$ 984$ Pro forma earnings per share $1.03 $0.88 $0.78
Operating Income: LTM ended June 30, 2015 914$ 914$ 914$ Pro forma income on net proceeds 53 64 75 Pro forma operating income 967$ 978$ 989$ Pro forma operating earnings per share $1.03 $0.89 $0.78
Total Revenue:LTM ended June 30, 2015 5,887$ 5,887$ 5,887$ Pro forma revenue on net proceeds, pre-tax 81 97 114 Pro forma total revenue 5,968$ 5,984$ 6,001$
Total Equity:As of June 30, 2015 11,472$ 11,472$ 11,472$ Net offering proceeds 8,000 9,650 11,300 Pro forma total equity 19,472$ 21,122$ 22,772$ Pro forma book value per share $20.83 $19.20 $18.00
Tangible Equity:As of June 30, 2015 11,472$ 11,472$ 11,472$ Net offering proceeds 8,000 9,650 11,300 Pro forma tangible equity 19,472$ 21,122$ 22,772$ Pro forma tangible book value per share $20.83 $19.20 $18.00
Total Assets:As of June 30, 2015 30,691$ 30,691$ 30,691$ Net offering proceeds 8,000 9,650 11,300 Pro forma total assets $38,691 $40,341 $41,991
Pro Forma Ratios:Price / LTM EPS 9.72 11.31 12.86 Price / Operating EPS 9.67 11.25 12.79 Price / LTM Revenue 1.57 1.84 2.11 Price / Book Value 48.02% 52.08% 55.55%Price / Tangible Book Value 48.02% 52.08% 55.55%Price / Total Assets 24.17% 27.27% 30.13%Total Equity / Assets 50.33% 52.36% 54.23%Tangible Equity / Assets 50.33% 52.36% 54.23%