pca of standardized residuals rasch measurement · pca of standardized residuals rasch measurement...
TRANSCRIPT

Rasch Measurement Transactions 23:3 Winter 2009 1215
PCA of Standardized Residuals
RASCH MEASUREMENT
Transactions of the Rasch Measurement SIG
American Educational Research Association
Vol. 23 No. 3 Winter 2009 ISSN 1051-0796
(EQ-5D + VAS) x Rasch = HRQoL MeasureThe EQ-5D questionnaire and the EQ Visual Analogue
Scale (EQ-VAS) were developed by the EuroQol Group
The x-axis shows the
EQ-5D items and the y-axis is the DIF measure by DIF
grouping. (p<0.01).
Table of Contents Critical Eigenvalue Sizes (Linacre, Tennant) .......... 1228
EQ-5D + VAS (Gu, Bond, Craig) ........................... 1215
Netflix Prize (Linacre) ........................................... 1224
Review of Spitzer (Fisher)....................................... 1220
Stimulating Excellence (Fisher) ............................... 1222

1216 Rasch Measurement Transactions 23:3 Winter 2009
Ning Yan Gu, Pharmerit North America, LLC, Bethesda,
Maryland USA
Trevor G. Bond, School of Education, James Cook
University, Townsville, Queensland, Australia
Benjamin M. Craig, Health Outcomes and Behaviors,
Moffitt Cancer Center, Tampa, Florida USA
The EuroQol group (1990) “EuroQol a new
facility for the measurement of health related quality of
life.” Health Policy, 16,199-208.
Based on a poster presented at 26th Plenary meeting of
the EuroQol Group , Paris, France, September 3rd - 5th,
2009
Table 1. Respondents (N = 2,057)
Mean age (SD) 52.05 (16.53)
n % n %
Race Disease
White 1610 78.27 Hypertension 336 23.53
Black 337 16.38 Diabetes 215 15.06
Asian 57 2.77 Arthropathy 170 11.90
Other 53 2.58 Depression 168 11.76
VAS Back Disorder 159 11.13
0-20 49 2.38 Joint Disorder 80 5.60
21-30 50 2.43 Chronic
sinusitis 79 5.53
31-40 75 3.65 Anxiety 74 5.18
41-50 169 8.22 Asthma 74 5.18
51-60 137 6.66 Cholesterol 73 5.11
61-70 244 11.86
71-80 470 22.85 Gender
81-90 515 25.04 Female 119
6 58.14
91-100 348 16.92 Male 861 41.86
RUMM2020 to RUMM2030
An enhanced RUMM application for conducting
Rasch item analyses was released as RUMM2030 in
January 2010.
RUMM2030 offers a further advancement in the
conduct of interactive Rasch analysis within the
Rasch paradigm of measurement. It is available in
two editions: Standard and Licence.
The Standard Edition of RUMM2030 is an upgrade
from RUMM2020 in its functions and presentation. It replaces RUMM2020, which was released in 2003. It
is available as a one-time purchase.
Major additional features of the Standard edition
include:
1. creating data sets with complete data records
only (in the case of random missing data).
2. additional details in test equating.
3. the addition of Person Characteristic Curves and
standard residual plots for improving the
diagnostic feedback on both the fit and response
patterns of individual person responses across items attempted.
4. reference of the cumulative person distribution to
the normal counterpart.
5. formalising the similarity and distinctions
between the traditional reliability index,
determined by Cronbach’s Alpha, and the Person
Separation index, especially in relation to person-
item targeting.
The Licence Edition of RUMM2030 is an expansion
of the Standard edition. These additions are a product
of many years of research. It is available on an
upgrade/maintenance basis and is purchased as a renewable licence for a specified period of time. The
licence will include the latest upgrade with each
renewal. The licence will help research and ensure
that the improvements of RUMM will continue to
enhance the Rasch paradigm of measurement. If the
Licence edition is not renewed, RUMM2030 will
revert back to the Standard edition.
Major additional features of the Licence edition
include:
1. assessment of dimensionality.
2. assessment of local response dependence.
3. conditional test-of-fit for a pair of polytomous
items or a pair of tests.
4. post hoc tailored response analysis, e.g., for
testing the significance of guessing.
5. Facet Analysis for up to a 3-way item response
structure.
For more about RUMM2030:
www.rummlab.com.au

Rasch Measurement Transactions 23:3 Winter 2009 1217
IOMW 2010: The 15th International Objective Measurement Workshop
Wednesday, April 28th and Thursday, April 29, 2010
(Immediately preceding AERA and NCME Conferences, April 30 - May 4, 2010)
Boulder, Colorado, USA
Call for Proposals: Deadline - Feb. 5, 2010
Conference website: www.iomw2010.net
Theme: Using Model Fit to Evaluate Hypotheses about Learning The International Objective Measurement Workshop is a biennial conference devoted to the presentation and discussion
of topics germane to the theory and practice of measurement. This year’s conference theme focuses attention upon the evaluation of model fit as a means of improving our understandings of measurement constructs. The evaluation of fit in
item response theory is often either not well understood or not given sufficient scrutiny. Casual rules of thumb for fit
statistic interpretations are sometimes followed that may mask the presence of unusual—and revealing—response
patterns. Furthermore, fit is often evaluated at the item level without giving equal scrutiny to fit at the person level.
Beyond these problems, even when patterns of “misfit” have been identified, the proper response is often equivocal. The
explanation for misfit could be found in the use of misaligned assessment items, a faulty hypothesis of how growth along
the construct develops, or unusual characteristics in the makeup of the sample of students for whom empirical evidence
has been collected.
One specific context in which rigorous evaluations of model fit are needed is in the measurement of learning
progressions. Learning progressions are descriptions of increasingly sophisticated ways of thinking about or
understanding a topic. One of the more appealing features of learning progressions is their potential use to facilitate diagnostic assessments of student understanding over time. In the context of learning progressions, it is important to
rethink expectations in applying a measurement model to item responses. Modelers are apt to declare success when the
difference between what is predicted and what is observed seems rather small. Yet in the case of assessment tasks that
stem from a learning progression hypothesis, developers should not only be prepared to find considerable evidence of
misfit, they should embrace it and use this as a means to revise and improve their instrumentation. Presentation proposals
to the IOMW conference are encouraged that focus on these sorts of issues.
The conference will be held at the University Memorial Center at the University of Colorado in Boulder, Colorado,
www.colorado.edu, which is approximately a half an hour drive from Denver and the AERA Conference Hotels. For
details on proposal submission and conference registration, please visit www.iomw2010.net
REGISTRATION: $40 (Students $30) [after 2/5/10 registration fee increases by $10]
LODGING: www.iomw2010.net/lodging.html
Journal of Applied Measurement
Volume 10, Number 4. Winter 2009
The Rasch Model and Additive Conjoint Measurement.
Van A. Newby, Gregory R. Conner, Christopher P. Grant,
and C. Victor Bunderson. p. 348-354.
The Construction and Implementation of User-Defined
Fit Tests for Use with Marginal Maximum Likelihood
Estimation and Generalized Item Response Models.
Raymond J. Adams and Margaret L. Wu. p. 355-369.
Development of a Multidimensional Measure of Academic Engagement. Kyra Caspary and Maria
Veronica Santelices. p. 371-393.
Random Parameter Structure and the Testlet Model:
Extension of the Rasch Testlet Model. Insu Paek, Haniza
Yon, Mark Wilson, and Taehoon Kang. p. 394-407.
A Comparative Analysis of the Ratings in Performance
Assessment Using Generalizability Theory and Many-Facet
Rasch Model. Sungsook C. Kim and Mark Wilson. p. 408-
423.
The Family Approach to Assessing Fit in Rasch
Measurement. Richard M. Smith and Christie Plackner. p.
424-437.
Understanding Rasch Measurement: Standard Setting with Dichotomous and Constructed Response Items: Some Rasch
Model Approaches. Robert G. MacCann. p. 438-454.
Richard M. Smith, Editor
JAM web site: www.jampress.org

1218 Rasch Measurement Transactions 23:3 Winter 2009
First International IACAT Conference on
Computerized Adaptive Testing
7-9 June, Arnhem, The Netherlands
Deadline for Submissions of Proposals: February 15, 2010
The International Association for Computerized Adaptive Testing (IACAT) is a nascent organization dedicated to
advancing computerized adaptive testing (CAT) through research and education. IACAT will hold its first annual
conference June 7- 9, 2010. The conference will take place in Arnhem, The Netherlands. The conference, hosted by the
Research Center for Examination and Certification (RCEC: www.rcec.nl ), will take place at the Conference Centre Papendal. (www.papendal.com)
Program The conference will be an international forum for CAT researchers and others interested in CAT to meet and share ideas
and developments on CAT. At the conference, the following well-known scholars will give keynote presentations:
• Cees Glas, University of Twente, The Netherlands
• Mark Reckase, Michigan State University, USA
• Lawrence Rudner, Graduate Management Admission Council, USA
• Wim van der Linden, CTB/McGraw-Hill, USA
• Otto Walter, Institute of Psychology, Aachen University, Germany
• Matthew Finkelman, Tufts University School of Dental Medicine, USA
The conference will include paper and poster presentations for which proposals are welcomed. There will also be time for informal meetings and social activities.
Registration Registration is open now at our website, www.rcec.nl/iacat by filling in the registration forms.
Pre-conference workshops
On June, 7 from 9.00-12.00, workshops are organized on introductory and more advanced topics in CAT.
• Nathan Thompson, Assessment Systems Corporation: Introduction to CAT
• Mark Reckase, Michigan State University: Multidimensional CAT
• Bernard Veldkamp; University of Twente: Item selection in CAT
Proposals
IACAT welcomes proposals for conference presentations at this time. Presentations will be in one of two formats: a 20-
minute session and a traditional poster format. Proposals must include title, authors, and a description of 250 words or less. CAT research generally falls into two categories: (1) theoretical research on algorithms and (2) applications and
implementations of CAT. Both types of research are welcome at the conference; please also specify the category when
submitting. Proposals will be evaluated on technical quality, practical applicability, advancement of knowledge, and
perceived interest to participants.
Proposals can be submitted by filling in the proposal submission form on the conference web site: www.rcec.nl/iacat
The deadline for submission is February 15, 2010. Proposals will be reviewed and notice of acceptance will be given
before April,1, 2010.
Organization The conference is organized by a committee consisting of:
• Clifford Donath, Donath Group, USA
• Theo Eggen, Cito, University of Twente, Netherlands
• Nathan Thompson, Assessment Systems Corporation, USA • Davis Weiss, University of Minnesota, USA
• Birgit Olthof, RCEC, University of Twente, Netherlands
About IACAT Previous CAT conferences were held in 2007 and 2009, sponsored by the Graduate Management Admissions Council.
IACAT was founded at the 2009 conference, and the 2010 conference marks the first official function of the organization.
Come take part in history! To learn more about IACAT or to join, please visit www.iacat.org

Rasch Measurement Transactions 23:3 Winter 2009 1219
Advanced course in
Rasch Measurement of Modern Test Theory The University of Western Australia (UWA) - Graduate School of Education
ONLINE COURSE
Semester 1, 22 February to 18 June 2010
Professor David Andrich and Dr Ida Marais
www.education.uwa.edu.au/ppl/courses
This course is intended as a follow-up to the ‘Introduction to Rasch Measurement of Modern Test
Theory’ course, also available at the University of Western Australia. It can be studied from
anywhere in the world and an online discussion site will operate as part of the course. Students
enrolled obtain (i) the study guide; (ii) a set of lecture materials, which includes a hard copy of all of
the lectures; (iii) details of the assignments; (iv) selected readings and (v) a copy of the RUMM2030
software for the duration of the course.
Topics covered
Theory of social measurement and Rasch models
Revision of Rasch’s model for dichotomous responses and his original work
Multiple choice items and guessing
Understanding the Polytomous Rasch Model
Model fit statistics
Advanced understanding of differential item functioning (DIF): real and artificial DIF
Vertical equating and DIF
Assessing two violations of the assumption of local independence: multidimensionality and
response dependence
Facets analysis and analysis of longitudinal data
Reporting a Rasch analysis
Assignments
Assignments include analyses of real and simulated data sets using RUMM2030 and one assignment
where participants have the option of analyzing their own data.
Prof David Andrich (david.andrich ~at~ uwa.edu.au or +61 8 6488 1085)
Dr Ida Marais (ida.marais ~at~ uwa.edu.au or +61 8 6488 3353)

1220 Rasch Measurement Transactions 23:3 Winter 2009
Review of Spitzer’s Transforming Performance Measurement
Everyone interested in practical measurement applications
needs to read Dean R. Spitzer’s book, Transforming
performance measurement: Rethinking the way we
measure and drive organizational success (New York,
AMACOM, 2007). Spitzer describes how measurement,
properly understood and implemented, can transform
organizational performance by empowering and motivating individuals. Measurement understood in this
way moves beyond quick fixes and fads to sustainable
processes based on a measurement infrastructure that
coordinates decisions and actions uniformly throughout
the organization.
Measurement leadership, Spitzer says, is essential. He
advocates, and many organizations have instituted, the C-
suite (executive) position of Chief Measurement Officer
(Chapter 9). This person is responsible for instituting and
managing the four keys to transformational performance
measurement (Chapters 5-8):
Context sets the tone by presenting the purpose of measurement as either negative (to inspect, control,
report, manipulate) or positive (to give feedback,
learn, improve).
Focus concentrates attention on what’s important,
aligning measures with the mission, strategy, and
with what needs to be managed, relative to the
opportunities, capacities, and skills at hand.
Integration addresses the flow of measured
information throughout the organization so that the
covariations of different measures can be observed
relative to the overall value created.
Interactivity speaks to the inherently social nature of
the purposes of measurement, so that it embodies an
alignment with the business model, strategy, and
operational imperatives.
Spitzer takes a developmental approach to measurement
improvement, providing a Measurement Maturity
Assessment in Chapter 12, and also speaking to the issues
of the “living company” raised by Arie de Geus’ classic
book of that title. Plainly, the transformative potential of
performance measurement is dependent on the
maturational complexity of the context in which it is implemented.
Spitzer clearly outlines the ways in which each of the four
keys and measurement leadership play into or hinder
transformation and maturation. He also provides practical
action plans and detailed guidelines, stresses the essential
need for an experimental attitude toward evaluating
change, speaks directly to the difficulty of measuring
intangible assets like partnership, trust, skills, etc., and
shows appreciation for the value of qualitative data.
Transforming Performance Measurement is not an
academic treatise, though all sources are documented,
with the end-notes and bibliography running to 25 pages.
It was written for executives, managers, and entrepreneurs
who need practical advice expressed in direct, simple
terms. Further, the book does not include any awareness
of the technical capacities of measurement as these have
been realized in numerous commercial applications in
high stakes and licensure/certification testing over the last 50 years. This can hardly be counted as a major criticism,
since no books of this kind have yet to date been able to
incorporate the often highly technical and mathematical
presentations of advanced psychometrics.
That said, the sophistication of Spitzer’s conceptual
framework and recommendations make them remarkably
ready to incorporate insights from measurement theory,
testing practice, developmental psychology, and the
history of science. Doing so will propel the strategies
recommended in this book into widespread adoption and
will be a catalyst for the emerging re-invention of
capitalism. In this coming cultural revolution, intangible forms of capital will be brought to life in common
currencies for the exchange of value that perform the
same function performed by kilowatts, bushels, barrels,
and hours for tangible forms of capital (Fisher, 2009,
2010).
Pretty big claim, you say? Yes, it is. Here’s how it’s going
to work.
First, measurement leadership within organizations
that implements policies and procedures that are
context-sensitive, focused, integrated, and interactive
(i.e., that have Spitzer’s keys in hand) will benefit from instruments calibrated to facilitate:
o meaningful mapping of substantive, additive
amounts of things measured on number lines;
o data volume reductions on the order of 80-95%
and more, with no loss of information;
o organizational and individual learning
trajectories defined by hierarchies of calibrated
items;
o measures that retain their meaning and values
across changes in item content;
o adapting instruments to people and organizations, instead of vice versa;
o estimating the consistency, and the leniency or
harshness, of ratings assigned by judges
evaluating performance quality, with the ability
to remove those effects from the performance
measures made;
o adjusting measurement precision to the needs of
the task at hand, so that time and resources are
not wasted in gathering too much or too little
data; and

Rasch Measurement Transactions 23:3 Winter 2009 1221
o providing the high quality and uniform
information needed for networked collective
thinking able to keep pace with the demand for
innovation.
Second, measurement leadership sensitive to the four
keys across organizations, both within and across industries, will find value in:
o establishing industry-wide metrological
standards defining common metrics for the
expression of the primary human, social, and
natural capital constructs of interest;
o lubricating the flow of human, social, and natural
capital in efficient markets broadly defined so as
to inform competitive pricing of intangible
assets, products, and services; and
o new opportunities for determining returns on
investments in human, community, and
environmental resource management.
Third, living companies need to be able to mature in
a manner akin to human development over the
lifespan. Theories of hierarchical complexity and
developmental stage transitions that inform the
rigorous measurement of cognitive and moral
transformations (Dawson & Gabrielian, 2003) will
increasingly find highly practical applications in
organizational contexts.
Leadership of the kind described by Spitzer is needed not
just to make measurement contextualized, focused,
integrated, and interactive “and so productive at new levels of effectiveness”, but also to apply systematically
the technical, financial, and social resources needed to
realize the rich potentials he describes for the
transformation of organizations and empowerment of
individuals. Spitzer’s program surpasses the usual focus
on centralized statistical analyses and reports to demand
the organization-wide dissemination of calibrated
instruments that measure in common metrics. The
flexibility, convenience, and scientific rigor of
instruments calibrated to measure in units that really add
up fit the bill exactly. Here’s to putting tools that work in the hands of those who know what to do with them!
William P. Fisher, Jr.
Dawson, T. L., & Gabrielian, S. (2003, June). Developing
conceptions of authority and contract across the life-span:
Two perspectives. Developmental Review, 23(2), 162-
218.
Fisher, W. P., Jr. (2009, November). Invariance and
traceability for measures of human, social, and natural
capital: Theory and application. Measurement (Elsevier),
42(9), 1278-1287
Fisher, W. P., Jr. (2010). Additional material available at
www.livingcapitalmetrics.com.
Pacific Rim Objective Measurement
Symposium
PROMS-KL 2010
Kuala Lumpur, Malaysia
29 June - 1 July 2010 (Tues-Thurs)
www.iiu.edu.my/proms/2010
Deadline for submissions: 20 April 2010
28 June 2010 (Mon) - Pre-conference half-day
workshops
2 July 2010 – (Fri) Trip to Melaka (Malacca)
3 - 4 July 2010 (Sat-Sun) two day Rasch workshops
In 2005, the Research Centre of the International
Islamic University Malaysia (IIUM) held the first
Pacific Rim Objective Measurement Symposium
(PROMS). Since then, PROMS has been held in other
regions of the Pacific Rim: Hong Kong (2006),
Taiwan (2007), Tokyo (2008), and again recently in
Hong Kong in 2009. We are pleased to announce that PROMS 2010 has come home to Kuala Lumpur,
Malaysia and is hosted by the Institute of Education,
IIUM.
PROMS 2010 KL, as with the previous PROMS,
focuses on recent advances of objective measurement.
It aims to provide an international forum for discourse
on the latest research in using Rasch measurement as
a tool for scientific progress. It is our pleasure to
invite you to join PROMS panel of distinguished
researchers and other practitioners to share their
expertise and your experiences in objective measurement.
Unlike the other PROMS meetings, PROMS 2010 KL
also invites paper/poster presentations on various
issues utilizing other methodologies and approaches
to measurement. Parallel sessions for these non
Rasch-based papers have been arranged to encourage
greater participation from the academic and research
community.
PROMS 2010 KL is especially beneficial to
postgraduate students and researchers who seek to use
the Rasch Measurement Model in their research as experts from the Pacific Rim, Europe, and the United
States make it a point to convene at PROMS
meetings. Pre-conference and post-conference
workshops on Rasch Measurement software
applications and special topics will also be given by
experts in the field.
More information at www.iiu.edu.my/proms/2010
Dr. Noor Lide Abu Kassim
PROMS-KL 2010 organizer

1222 Rasch Measurement Transactions 23:3 Winter 2009
Stimulating Excellence in Education Comments on: Stimulating Excellence: Unleashing the Power of Innovation in Education
May 2009, The Center for American Progress et al., www.americanprogress.org/issues/2009/05/entrepreneurs_event.html
The report focuses on creating the conditions for
entrepreneurial innovation and reward in education. It
deplores the lack of a quality improvement culture in
education, and the general failure to recognize the vital
importance of measuring performance for active
management. It makes specific recommendations aimed at
drastic improvements in information quality. Excellent so
far! But the report would be far more powerful and
persuasive if it capitalized on two very significant features
of the current situation.
First, only on page 34, in the report’s penultimate
paragraph, do the authors briefly touch on what all educators know is absolutely the most important thing to
understand about teaching and learning: it always starts
from where the student is at, growing out of what is
already known. This is doubly important in the context
of the report’s focus, teaching and learning about how to
institute a new culture of power metrics and innovation.
To try to institute fundamental changes, with little or no
concern for what is already in place, is a sure recipe for
failure.
Second, there is one feature of the educational system as it
currently exists that will be of particular value as we strive to improve the quality of the available information.
That feature concerns tests and measurement. Many of the
report’s recommendations would be quite different if its
authors had integrated their entrepreneurial focus with the
technical capacities of state-of-the-art educational
measurement.
The obvious recommendation with which to start
concerns the reason why public education in the United
States is such a fragmented system: because outcome
standards and product definitions are expressed (almost)
entirely in terms of locally-determined content and expert
opinion. Local content, standards, and opinions are essential, but to be meaningful, comparable, practical, and
scientific they have to be brought into a common scale of
comparison.
The technology for creating such scales is widely
available. For over 40 years, commercial testing agencies,
state departments of education, school districts, licensure
and certification boards, and academic researchers have
been developing and implementing stable metrics that
transcend the local particulars of specific tests. The
authors of the “Stimulating Excellence” report are right to
stress the central importance of comparable measures in creating an entrepreneurial environment in education, but
they did not do enough to identify existing measurement
capabilities and how they could help create that
environment.
For instance, all three of the recommendations made at
the bottom of page 12 and top of page 13 address
capabilities that are already in place in various states and
districts around the country. The examples that come
easiest to mind involve the Lexile Framework for Reading
and Writing, and the Quantile Framework for
Mathematics, developed by MetaMetrics, Inc., of
Durham, NC (www.lexile.com).
The Lexile metric for reading ability and text readability
unifies all major reading tests in a common scale, and is
used to report measures for over 28 million students in all
50 states. Hundreds of publishers routinely obtain Lexile
values for their texts, with over 115,000 books and 80
million articles (most available electronically) Lexiled to date.
Furthermore, though one would never know from reading
the “Stimulating Excellence” report, materials on the
MetaMetrics web site show that the report’s three
recommendations concerning the maximization of data
utility have already been recognized and acted on, since
many standardized assessments are already aligned
with state learning standards,
available products already quickly incorporate
assessment results into the process of teaching and
learning (and a lot more quickly than “a day or two after testing”!), and
several states already have years of demonstrated
commitment to keeping their standards and assessments
relevant to the changing world’s demands on students.
That said, a larger issue concerns the need to create
standards that remain invariant across local specifics. A
national curriculum and national testing standards seem
likely to fall into the trap of either dictating specific
content or fostering continued fragmentation when states
refuse to accept that content. But in the same way that
computer-adaptive testing creates a unique examination for each examinee “without compromising comparability”
so, too, must we invest resources in devising a national
system of educational standards that both takes advantage
of existing technical capabilities and sets the stage for
improved educational outcomes.
That is what the report’s key recommendation ought to
have been. An approximation of it comes on page 35,
with the suggestion that now is the time for investment in
what is referred to as “backbone platforms” like the
Internet. Much more ought to have been said about this,
and it should have been integrated with the previous
recommendations, such as those concerning information quality and power metrics. For instance, on page 27, a
recommendation is made to “build on the open-source
concept.” Upon reading that, my immediate thought was
that the authors were going to make an analogy with

Rasch Measurement Transactions 23:3 Winter 2009 1223
adaptively administered item banks, not literally
recommend actual software implementation processes.
But they took the literal road and missed the analogical
boat. That is, we ought to build on the open-source
concept by creating what might be called crowd-sourced
“wikitests” exams that teachers and researchers everywhere can add to and draw from, with the
qualification that the items work in practice to measure
what they are supposed to measure, according to agreed-
upon data quality and construct validity standards. This
process would integrate local content standards with
global construct standards in a universally uniform metric
not much different from the reference standard units of
comparison we take for granted in measuring time,
temperature, distance, electrical current, or weight.
Michael K. Smith suggests a practical approach to
achieving these objectives in “Why not a national test for
everyone?”, Phi Delta Kappan, 91, 4, Feb. 2010, 54-58.
And this is where the real value of the “backbone
platform” concept comes in. The Internet, like phones and
faxes before it, and like alphabetic, phonetic and
grammatical standards before them, provides the structure
of common reference standards essential to
communication and commerce. What we are evolving
toward is a new level of complexity in the way we create
the common unities of meaning through which we
achieve varying degrees of mutual understanding and
community.
In addition, measurement plays a fundamental role in the
economy as the primary means of determining the relation
of price to value. The never-ending spiral of increasing
costs in education is surely deeply rooted in the lack of
performance metrics and an improvement culture. We
ought to take the global infrastructure of measurement standards as a model for what we need as a “backbone
platform” in education. We ought to take the metaphor of
transparency and the need for “clear metrics” much more
literally. We really do need instruments that we can look
right through, that bring the thing we want to see into
focus, without having to be primarily concerned with
which particular instrument it is we are using.
Decades of research in educational measurement show
that these instruments can be constructed. A great deal
still needs to be done, and the challenges are huge, but
taking them on will enable us to expand the domains in
which we insist on fair dealing, and in which the balance scale applies as a symbol of justice.
When the entrepreneurial vision presented in the
“Stimulating Excellence” report is situated in a context
better informed by what educators are already doing and
what they already know, the stage will be set for a new
culture of performance improvement in education, a
culture that explicitly articulates, tests, and acts on its
educational values. At that point, we can expect great
things!
William P. Fisher, Jr.
Diana Wilmot, Ph.D., Coordinator, Assessment and Accountability, Santa Clara County Office of Education, California
1224 Rasch Measurement Transactions 23:3 Winter 2009
Rasch Lessons from the Netflix® Prize Challenge CompetitionThe Netflix Prize Challenge Competition ran for 34
months from October 2, 2006 until July 26, 2009. Netflix
supplied a “Training” dataset of 100,480,507 ratings
made by 480,189 Netflix clients for 17,770 movies
between October, 1998 and December, 2005. The ratings
were on a rating scale of one star to five stars. The
Training data matrix has 99% missing data. Netflix also
supplied a dataset of 2,817,131 “Qualifying” ratings. For these ratings, the clients and movies are known, but the
actual ratings were known only to Netflix (until the
competition concluded). The Netflix Prize was awarded to
the team most successful at “predicting” those publicly
unknown ratings. Teams were allowed to submit multiple
prediction datasets.
Team “BellKor’s Pragmatic Chaos” won the Prize in a
tie-break based on a 20-minute earlier submission time of
their winning prediction dataset. The runners-up were
team “The Ensemble” (of which I was a member). The
team that had the “dubious honors” (according to Netflix) of the very worst predictions, out of the 44,014 valid
submissions from 5,169 actively participating teams, was
team “Lanterne Rouge” of which I was the leading
member. Of course, these worst predictions were
deliberate!
During the 34 months of the Prize competition, there were
some valuable lessons with general application in Rasch
analysis.
1. Dataset size.
When stored as a rectangular text data-file, the size of the
Training is at least 480,189 * 17,770 bytes =
8,532,958,530 bytes = 8GB. When implemented in Winsteps, this required 8GB of input data file and two
more work files of the same size = 24 GB (at least). But
99% of these 24GB are missing data. So this was highly
inefficient. Simultaneously, Winsteps users were noticing
the same thing for their computer-adaptive-testing (CAT)
and concurrent-test-equating analyses. In contrast, the
same data in Facets (for which missing data do not need
to be stored) have an input dataset size of 1.3GB and a
work file size of 0.6GB. So obvious improvements to
Winsteps were to allow Winsteps to use a Facets-style
input-data-format, and to use a compressed work-file algorithm. This reduced the Winsteps input dataset size to
1.3GB and the work-file sizes reduced to 3.3GB and
0.2GB, a total of 5GB instead of 24GB.
2. Processing time.
The first run of Winsteps on the Training dataset indicated
that the estimation process would take 8 days to come to
convergence. Consequently that first run was cancelled
after 1 day as entirely impractical. The first run in Facets
on the same data required about 24 hours. Again this
suggested improvements could be made to Winsteps.
Reducing the dataset size also reduced the input-output
overhead, so reducing processing time. But inspection of
the computer code also revealed routines which could be
made faster. Consequently Winsteps processing time was
reduced to about 12 hours, and much less if only rough
convergence is required.
3. Rasch Models.
Each time a dataset of predictions was submitted to
Netflix, Netflix responded with a summary statistic on the
accuracy with which the “Quiz” half of the qualifying ratings had been predicted. Competitors did not know
which of the Qualifying ratings comprised the Quiz
dataset. The other half of the Qualifying ratings were
termed the “Test” dataset. The summary statistic for the
Quiz dataset was the root-mean-square-residual (RMSR),
called by Netflix the root-mean-square-error (RMSE),
between the known-to-Netflix values of the ratings and
their competitor-predicted values. The values of the
RMSRs enabled competitors to know which of their
prediction models were more effective. Netflix permitted
submissions to included predictions between categories, such as 3.5674 stars. This improved RMSRs relative to
predicting exact categories.
An immediate finding was that the Rasch-Andrich Rating
Scale model (RSM), applied to the 5 category (1 star to 5
star) Netflix rating scale was more effective (RMSR=
0.9815) than either a Rasch-Masters Partial Credit model
applied to the 17,770 movies (RMSR=0.9867) or to the
480,189 clients (RMSR=0.9907). Less parameters, but
better prediction!
4. Pseudo-Rasch Dichotomous Fractional Model.
As the competition proceeded, it became apparent that the
data were severely multidimensional, and that a unidimensional Rasch analysis was a useful first-stage
leading on to other analyses. But, as implemented in
Winsteps and Facets, the Andrich Rating Scale model
requires the computation of 4 exponentials for each
observation in each estimation iteration as well as the
accumulation of probabilities for the five categories.
Further the threshold estimates need to be brought to
convergence. If this processing load could be lessened,
without severely impacting the utility of the Rasch
measures, then the duration of the first-stage Rasch
analysis would be considerably reduced.
This motivated the “Pseudo-Rasch Dichotomous
Fractional Model” (DFM). In the Rasch dichotomous
model (DM), the observations are “1” (success) and “0”
(failure). In RSM, the Netflix rating scale is modeled to
be 5 qualitatively-ordered categories along the latent
variable. In DFM the 5 categories are modeled to be
predictions of the probability of success on a dichotomous
item. 5 stars = 1.0 probability. 4 stars = 0.75 probability. 3
stars = 0.5 probability. 2 stars = 0.25 probability. 1 star =
0.0 probability. DFM simplifies and speeds up all the
rating-scale computations to be those of the DM. In
JMLE (as implemented in Winsteps and Facets), the

Rasch Measurement Transactions 23:3 Winter 2009 1225
parameter estimation converges when “observed marginal
score ≈ expected marginal score” for all parameters. The
expected marginal score is computed in the usual DM
way. The observed marginal score is the sum of the
prediction-probabilities (based on the Star ratings) for
each parameter. The resulting DFM Pseudo-Rasch measures for movies and clients are effectively collinear
with the RSM measures. The DFM model was
implemented in special-purpose software. It achieved its
objective of speeding up estimation without noticeably
degrading prediction accuracy, relative to RSM.
5. Correction for extreme observations.
Since the Netflix criterion for accuracy of prediction was
the RMSR, incorrectly predicting that an observation
would be 1 or 5 Stars was considerably worse, on
average, than incorrectly predicting that an observation
would be in an intermediate category. The use of the
extreme 1- and 5-Star categories by Netflix clients was somewhat idiosyncratic. An improvement to prediction
resulted when the influence of the extreme categories was
reduced. For the DFM model, experiments revealed that
better inferences were obtained by substituting to 4.75
Stars (in place of 5 Stars) and 1.25 Stars (in place of 1
Star), and adjusting the probabilities accordingly. For the
RSM model (as implemented in Winsteps), this is done by
adjusting observed category frequencies. For 5 Stars, the
observed rating-score was reduced from 5.0 to 4.75, and
the corresponding observed category frequencies were
changed from 1 observation of 5 into 0.75 observations of 5 and 0.25 observations of 4. Similarly for 1 Star.
6. Estimating RSM thresholds.
The estimation of RSM rating-scale thresholds has long
been troublesome. The original JMLE technique,
proposed in “Rating Scale Analysis” (Wright and
Masters, 1982) estimated each threshold using Newton-
Raphson iteration, as though it was an almost separate
parameter. This technique proved too unstable when
category frequencies were very uneven or there were
pernicious patterns of missing-data. So Newton-Raphson
iteration of the threshold estimates was replaced in
Winsteps by “Iterative curve-fitting”, because the relevant functions are known to be smoothly monotonic logistic
ogives.
For the Netflix data, a faster-converging estimation
method for rating-scales was sought. An iterative
approach based on solving simultaneous linear equations
has proved effective. Suppose that Pk is the expected
frequency of category k in the dataset according to RSM.
where Knij = Bn - Di - Fj except that Kni0 = 0. Fj is the
Rasch-Andrich threshold at which categories j-1 and j are
equally probable.
Suppose that a small change δFj in Fj (and similarly for all
the other thresholds) would produce the observed
category frequency Ok:
Then, since e(x-δx) ≈ (1-δx)e
Then ignoring cross-products of the δ terms and since δF0
does not exist:
and similarly for the other categories, k=1,m.
At the end of each iteration, all the numerical values of
the {Ok}, {Pk} and {ΣPnikPnih} terms are known.
Consequently the {Ok} equations become a set of
simultaneous linear equations which can be solved for
{δFj}. Then {Fj+δFj} become the values of {Fj} for the
next iteration after standardization so that Σ Fj = 0. So far, this estimation technique has proved robust and fast.
7. Multidimensionality and Singular-Value
Decomposition (SVD).
Multidimensionality is a serious threat to the validity of
unidimensional Rasch measures. It also degrades the
capability of the measures to predict observations. Single-
parameter fit statistics (such as INFIT, OUTFIT and
point-biserial correlations) are insensitive to pervasive
multidimensionality. PCA of residuals is a useful tool for
investigating multidimensionality, but it loses its power as
the proportion of missing data increases, and the number of variables to be factored increases. With 99% missing
data and 17,770 variables, PCA of residuals is almost
ineffective. It does signal the existence of secondary
dimensions, but not in enough detail to be useful for item
selection or improved prediction.
SVD is mathematical technique that has been used for
decomposing matrices into a bilinear form for over 130
1226 Rasch Measurement Transactions 23:3 Winter 2009
years. It is robust against missing data and the size of the
matrix to be decomposed, so it is ideal for this
application. SVD was the first conspicuously successful
multi-dimensional method used by Netflix competitors.
Most of those applied it using raw-score models.
A first-level SVD model for the Netflix data, with SVD values {Vn} for the clients and {Ui} for the movies, is:
where
for the Andrich Rating-Scale model.
Notice that Rasch residuals are explained, as far as
possible, by two factors (U for movies and V for clients)
which multiply together. The factor products center on
zero, because the residuals sum to zero.
Maximum-Likelihood Estimation: the starting values of
{Ui} and {Vn} are random uniform numbers [-1,1] and
normalization after each iteration through the data is Average(Ui²) = 1.
where k is chosen to prevent the iterative changes
becoming too large.
There are now several options including:
A. The Rasch measures and the SVD values can be used
to predict the Netflix Qualifying dataset. Further, a
second-level SVD analysis can be performed on the
residuals {εni} from the first SVD analysis, and then the
Qualifying dataset again predicted this time from two
levels of SVD. This process can be continued for more
SVD factors. During the Netflix competition, better
prediction was achieved down to about 40 SVD factors.
B. From a Rasch data-analysis perspective, the first-level
SVD conveniently segments the data into quarters:
positive and negative SVD values for the movies, positive
and negative SVD values for the clients. There is also a
central core in which the movie and client SVD values are
too small to be meaningful. They are ratings to which the
first-level SVD “dimensions” do not apply. The 5 data
subsets identified by the first-level SVD can then be used
in 5 more Rasch analyses, and Rasch measures generated
for further prediction. This process can also be continued.
We can also perform this computation for the standardized residuals:
where
which is the model S.D. of the observation around its
expectation for the Andrich Rating-Scale model.
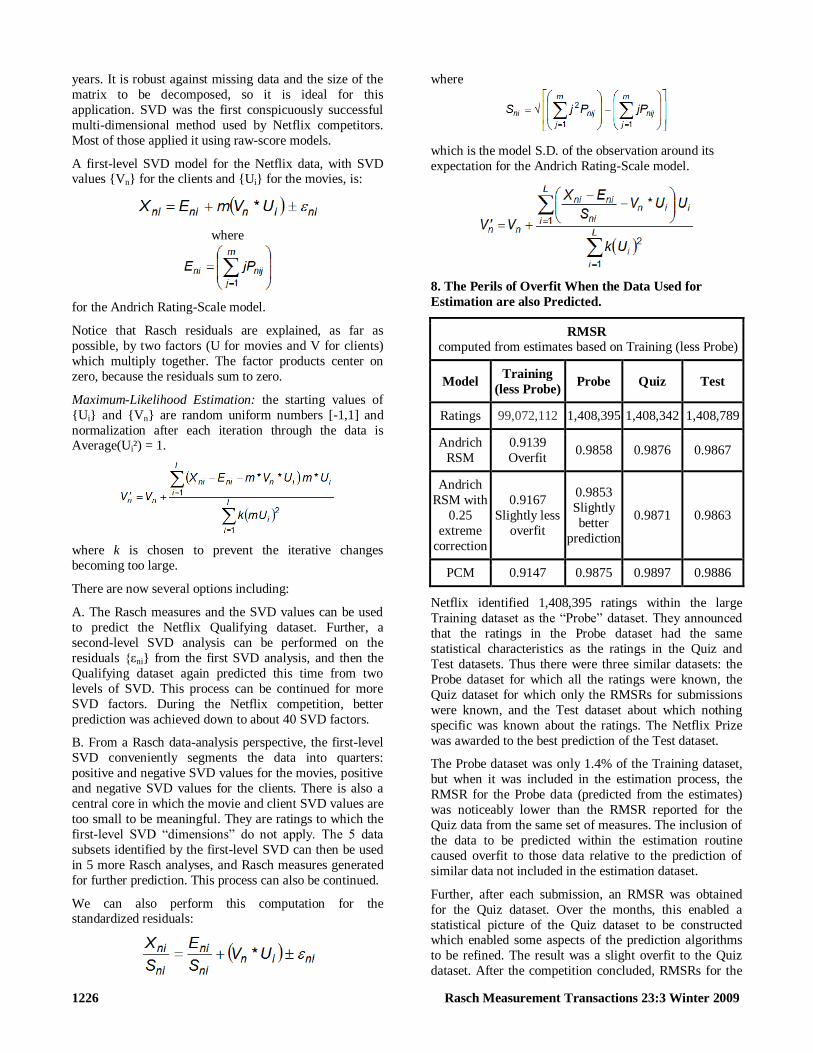
8. The Perils of Overfit When the Data Used for
Estimation are also Predicted.
RMSR
computed from estimates based on Training (less Probe)
Model Training
(less Probe) Probe Quiz Test
Ratings 99,072,112 1,408,395 1,408,342 1,408,789
Andrich
RSM
0.9139
Overfit 0.9858 0.9876 0.9867
Andrich
RSM with
0.25
extreme
correction
0.9167
Slightly less
overfit
0.9853
Slightly
better
prediction
0.9871 0.9863
PCM 0.9147 0.9875 0.9897 0.9886
Netflix identified 1,408,395 ratings within the large
Training dataset as the “Probe” dataset. They announced
that the ratings in the Probe dataset had the same
statistical characteristics as the ratings in the Quiz and
Test datasets. Thus there were three similar datasets: the
Probe dataset for which all the ratings were known, the
Quiz dataset for which only the RMSRs for submissions
were known, and the Test dataset about which nothing
specific was known about the ratings. The Netflix Prize
was awarded to the best prediction of the Test dataset.
The Probe dataset was only 1.4% of the Training dataset,
but when it was included in the estimation process, the
RMSR for the Probe data (predicted from the estimates)
was noticeably lower than the RMSR reported for the
Quiz data from the same set of measures. The inclusion of
the data to be predicted within the estimation routine
caused overfit to those data relative to the prediction of
similar data not included in the estimation dataset.
Further, after each submission, an RMSR was obtained
for the Quiz dataset. Over the months, this enabled a
statistical picture of the Quiz dataset to be constructed which enabled some aspects of the prediction algorithms
to be refined. The result was a slight overfit to the Quiz
dataset. After the competition concluded, RMSRs for the

Rasch Measurement Transactions 23:3 Winter 2009 1227
Test dataset were released. The winner’s RMSR on the
Test dataset was 0.8567, but slightly better, 0.8554, on
the somewhat more public Quiz dataset. The minimal
extra information about the Quiz dataset was enough to
produce slight overfit to the Quiz dataset relative to the
completely unknown Test dataset.
We can speculate about what the winning RMSR would
have been if competitors had only been given the Training
dataset and the list of ratings to be predicted. In this “real
life” situation, competitors would receive no feedback
about the success of their submissions or the statistical
properties of the ratings to be predicted until the
competition concluded. My guess is that the best RMSR
would have been close to 0.90 instead of 0.86.
9. Amazingly Low Variance-Explained.
Analysts are sometimes perturbed to see the low
percentage of the variance in the observations explained
by the Rasch measures. According to RMT 20:1, 1045, www.rasch.org/rmt/rmt201a.htm - the variance-explained
by the Rasch measures is often 50% or less. But can other
models do any better? The S.D. of the Test dataset around
its mean is 1.1291. The winning RMSR is 0.8567, so the
variance explained by the winning submission after 34
months work is (1.1291² - 0.8567²) / 1.1291² = 42%, less
than 50%, despite using the most elaborate statistical
procedures available. In fact, one month after the
competition started, on Nov. 2, 2006, the best RMSR was
around 0.9042, this was (1.1291² - 0.9042²)/1.1291² =
36% variance-explained. In the other 33 months of the competition, only 6% more variance was explained
despite Herculean efforts by an army of computer
scientists equipped with a huge amount of computing
power, all expended in an effort to win the Netflix Prize
of $1 million.
What does this mean in practice? The prize-winning
RMSR was 0.8567. The mean-absolute-deviation is about
0.8*RMSR = 0.8*0.8567 ≈ 0.7. So, if prediction of exact
Star ratings is needed, even the best set of predictions can
be expected to be errant by 1 or more Stars more often
than they are dead on.
John Michael Linacre
Rasch-related Coming Events Feb. 5, 2010, Fri. Proposal deadline: IOMW April 28-29
2010 International Objective Measurement Workshop,
Boulder, CO, USA, www.iomw2010.net/
Feb. 15, 2010, Mon. Deadline for Submission for June 7-9, 2010, Mon.-Wed. International Association for
Computerized Adaptive Testing (IACAT) Conference,
Arnhem, Netherlands, www.rcec.nl/iacat
Feb. 22 - June 18, 2010, Mon.-Fri. Advanced course in
Rasch Measurement online course (D. Andrich, I.
Marais), www.education.uwa.edu.au/ppl/courses
Feb. 23-25, 2010, Tues.-Thurs. Introducción al uso del
Modelo de Rasch en Medición Educativa, Montevideo,
Uruguay (C. Pardo, Spanish), email: Carlos Pardo,
capardo -x- ucatolica.edu.co
March 1-3, 2010, Mon. - Wed. Rubrics and Achievement
levels in education and the use of Rasch Model
(Winsteps), Santiago, Chile (C. Pardo, Spanish),
Universidad Catolica Silva Henriquez, email: Susana
Barrera, sbarrera -x- ucsh.cl
March 5 - April 2, 2010, Fri.-Fri. Rasch - Further Topics
(intermediate) online course (M. Linacre, Winsteps),
www.winsteps.com/courses.htm
March 10-12, 2010, Wed.-Fri. Introduction to Rasch (A.
Tennant, RUMM), Leeds, UK,
www.leeds.ac.uk/medicine/rehabmed/psychometric
Apr. 28-29, 2010, Wed.-Thur. IOMW 2010 International
Objective Measurement Workshop, Boulder, CO, USA, www.iomw2010.net
Apr. 30 - May 4, 2010, Fri.-Tues. AERA Annual Meeting,
Denver, CO, USA, http://www.aera.net
Apr. 30 - May 28, 2010, Fri.-Fri. Rasch - Core Topics
(introductory) online course (M. Linacre, Winsteps),
www.winsteps.com/courses.htm
May 12-14, 2010, Wed.-Fri. Introduction to Rasch (A.
Tennant, RUMM), Leeds, UK,
www.leeds.ac.uk/medicine/rehabmed/psychometric
May 17-19, 2010, Mon.-Wed. Intermediate Rasch (A.
Tennant, RUMM), Leeds, UK,
www.leeds.ac.uk/medicine/rehabmed/psychometric
June 7-9, 2010, Mon.-Wed. International Association for
Computerized Adaptive Testing (IACAT) Conference,
Arnhem, Netherlands, www.rcec.nl/iacat
June 13-16, 2010, Sun.-Wed. International conference on
probabilistic models for measurement in education,
psychology, social science and health, Copenhagen,
Denmark, conference.cbs.dk/index.php/rasch
June 25 - July 23, 2010, Fri.-Fri. Many-Facet Rasch
Measurement (intermediate) online course (M. Linacre,
Facets), www.winsteps.com/courses.htm
June 29 - July 1, 2010, Tue.-Thur. PROMS-KL 2010 Pacific Rim Objective Measurement Symposium Kuala
Lumpur, Malaysia, www.iiu.edu.my/proms/2010
Rasch Measurement Transactions
14525 SW Millikan Way #27615, Beaverton OR 97005
www.rasch.org/rmt
Editor: John Michael Linacre Copyright © 2010 Rasch Measurement SIG
Permission to copy is granted.
SIG Chair: Ed Wolfe
Secretary: Timothy Muckle
Program Chairs: Diana Wilmot and Leigh Harrell
SIG website: www.raschsig.org

1228 Rasch Measurement Transactions 23:3 Winter 2009
Dichotomizing Rating Scales Findings based on rating scales can be difficult to explain to a non-technical audience. If the rating-scale categories
can be bisected by a pass-fail cut-point, such as “agree or
not”, “competent or not”, “impaired or not”, then it can
simplify communication if the rating scale is
dichotomized around the cut-point. Categories above the
cut-point are scored “1”, and categories below the cut-
point are scored “0”.
How do measures based on the dichotomized data relate
to the measures based on the original ratings? The Figure
illustrates the relationship.
The Figure shows a 3-category item, rated 0-1-2. The two
cumulative probability ogives (based on the Rasch partial-
credit model) for that rating scale are shown. The
intersections of the ogives with 0.5 probability are the
Rasch-Thurstone thresholds.
The rating scale can be dichotomized in two ways: 0-1-2
becomes 0-0-1 or 0-1-2 becomes 0-1-1. These two
dichotomizations can be analyzed with the dichotomous
Rasch model. To make comparison simpler, the person
measures are anchored at their rating-scale estimates. The result of the dichotomous analysis is two dichotomous
ogive, one for each of the two dichotomizations. The
Figures indicates that the two dichotomous ogives
approximate the cumulative probability ogives of the
rating-scale analysis. Thus the difficulties of the
dichotomized items approximate the Rasch-Thurstone
cumulative-probability thresholds, not the Rasch-Andrich
equal-adjacent-category-probability thresholds (which are
generally more central).
This result is reassuring because it indicates that
inferences based on the simpler dichotomized data approximate inferences based on the more complex
rating-scale data.
John Michael Linacre
More about Critical Eigenvalue Sizes in
Standardized-Residual Principal
Components Analysis (PCA) Gilles Raîche in RMT 19:1 p. 102 reports eigenvalues in
the range 1.4 to 2.1 for the first component in a PCA of
inter-item correlations of standardized residuals of Rasch-
fitting data. Test lengths were in the range 20 to 60 items.
Here those findings are extended to dichotomous and
polytomous data with test lengths from 3 to 1000 items.
The generating person sample of 1000 persons has a
normal distribution with a mean of 0 logits and a standard
deviation of 2 logits. The generating item distribution is
uniform from -2 to +2 logits. For the 5-category
polytomous data, the generating Rasch-Andrich
thresholds are: -2.53, -0.35, 0.56, 2.32 logits. The Figures shows the eigenvalues sizes of the first components
(contrasts) in a PCA of the standardized-residual item-
correlation matrices.
For the dichotomous simulations, the eigenvalue increases
from 1.3 for 3 items to 4.0 for 1000 items. For 5-category
polytomous items, the eigenvalues have the same range.
John Michael Linacre
“Monte Carlo PCA for Parallel Analysis” is Marley
Watkins’ free software at
www.public.asu.edu/~mwwatkin/Watkins3.html
for performing this type of investigation using simulated
random-normal deviates, which standardized residuals
approximate. For 200 items (variables) and 1000 persons
(subjects), that software reports that the first PCA
component in the random-normal deviates has an
eigenvalue of 2.05 which accords with the findings above.
Alan Tennant