pd-04-181 managing the process, not the alarms at ... · pd-04-181 managing the process, not the...
TRANSCRIPT
Plant Automation and Decision Support Conference September 19-21, 2004 Hyatt Hotel San Antonio, Texas
PD-04-181 Managing the Process, Not the Alarms at ConocoPhillips
Presented By: John Huot Systems Specialist ConocoPhillips Borger, TX
Karim Moti Regional Manager Matrikon International, Inc. Houston, TX
National Petrochemical & Refiners Association 1899 L Street, NW Suite 1000 Washington, DC 20036.3896
202.457.0480 voice 202.429.7726 fax www.npra.org

This paper has been reproduced for the author or authors as a courtesy by the National Petrochemical & Refiners Association. Publication of this paper does not signify that the contents necessarily reflect the opinions of the NPRA, its officers, directors, members, or staff. Requests for authorization to quote or use the contents should be addressed directly to the author(s)

Abstract ConocoPhillips Borger, Texas has an initiative to better manage the process. One way to execute this initiative is to reduce the number of alarms. ConocoPhillips went through the process of Alarm Rationalization and after a few years realized that Alarm Rationalization is a continuous process. ConocoPhillips determined that tools required for continuous assessment and analysis were necessary. ConocoPhillips has used Matrikon's Technology Solution to help manage and put in place a Management of Change (MOC) process for managing alarms. The key to managing the process and not the alarms is “Alarm Management”. Introduction The ConocoPhillips Borger Refinery is 147,000 bbl per day refinery with a Honeywell TDC 3000 system. There are 5 LCNs consisting of 15 consoles. The Borger refinery is located in Borger, Texas, in the Texas Panhandle about 50 miles north of Amarillo. It includes a refinery and NGL fractionation facility, as well as certain Chevron Phillips Chemical Company petrochemical operations. The crude oil processing capacity is 148 MBPD of a medium-sour slate. Crude oil and NGL feed stocks are received through ConocoPhillips’ pipelines from West Texas and the Texas Panhandle. The Borger refinery also can receive foreign crude oil from the Gulf of Mexico and from Cushing, OK. Borger manufactures a full slate of motor fuels and upgrades some streams to higher-value solvents. Pipelines move the refined products from the refinery to West Texas, New Mexico, Arizona, Colorado, Kansas, Nebraska and the Chicago area. Borger produced 89 percent clean products in 2003 fuel from crude oil. Finished petroleum products are shipped by truck, rail and company-owned and common carrier pipelines to markets throughout the mid-continent region. Alarm System The main purpose of an alarm system is to provide an operator with critical process information at the right time. For older plants using panel-mounted instruments, alarms are typically reserved for extreme situations. This results in a “low” number of alarms. However, when an older plant is converted to DCS, the alarms available to the engineer are increased substantially. What was once just a TI (temperature indication), now has the ability to create an alarm. In fact, it can create a multitude of alarms – High, Low, HighHigh, LowLow, Deviation, etc. When ConocoPhillips modernized the plant in 1994 moving from panel boards to a DCS, a number of alarms were added to the system since the panel alarms were expensive and were sparse. During this process, rules of thumb were developed such as level alarms were configured for a Hi alarm at 80% and Lo alarms at 20%. The alarms were not engineered but configured. A DCS has a basket of alarms available for the engineers that will result in a host of new alarms configured on the DCS. When creating an alarm for a point that never had an alarm previously, an engineer will be making their “best guess” at what the alarm values should be for that point. If the DCS point deals with capacity, the alarm might be configured based on maximum production rates. If the point deals with safety, the alarm range might be configured based on safety concerns. Sometimes, an engineer might not know what to base the range on. All of these scenarios typically result in configurations that are too “tight”.
PD-04-181 Page 1

An alarm point configured incorrectly can result in nuisance alarms. Operators begin to ignore the alarm, or worse, suppress it. An alarm system configured incorrectly can result in a “flood” of alarms during a process upset. Operators can receive so many alarms that the true problem with the process hides among the flood. Both of these situations negate the purpose of the alarm system. Alarm Management Life Cycle In 1998, ConocoPhillips Borger, Texas refinery went through an evaluation of initiatives to help the Operations staff. In this effort ConocoPhillips assessed that the operations staff have unnecessary distractions in running the facilities: the operations staff have alarms floods to contend with, insufficient information to assess occurrences or the appropriate corrective actions. By 2000, a plan was developed to help the operator manage the process better. This plan consisted of 5 phases:
I. Rationalization II. Alarm & Event Analysis III. Alarm Management & Tracking IV. Operator Effectiveness / Web Portal V. Automate Alarm Enforcement & MOC Validation
Phase I: Rationalization ConocoPhillips went through a site wide rationalization effort that took 18 months. This effort yielded beneficial results from reduction of alarms, to identification of bad sensors, to DCS configuration issues. There was an overall reduction of alarms that improved the operations staff’s ability to assess events in the various units and execute required actions. The Operations staff was heavily involved in this process. There were many steps in this rationalization process
Step 1: Development of a site wide Alarm Philosophy Step 2: Alarm Response Analysis Step 3: Implementation
In the first step a philosophy template was utilized and revised based on site-specific criteria and discussions with Borger personnel. The central controls group, and employee development groups were involved with this effort. In the second step of this phase, an initial Alarm Response Analysis (ARA) conducted by Operations facilitated by a consultant was carried out. This team consisted of the following unit representatives:
1) Process Engineer 2) I&E Personnel 3) Lead Operations
In the third step, navigational displays were developed on the DCS System. These screens were developed to assist the operator by directing them to the right process graphic in the quickest manner. During an upset, the Operator would see what system in his area was of highest need. The alarms were prioritized based on response time required by the operator. In the older default alarm summary method, an operator would have to assess the alarm by its point description, the criticality, and area. The newer navigational displays help the operator
PD-04-181 Page 2

focus very quickly on the right problem, reducing response time. A new alarm color – Orange was utilized for indication of Journal Priority Alarms. The following display is a sample of the navigational displays developed for the Operators.
Upon completion of the ARA there was a reduction of 54% of the configured alarms. Due to the lack of tools available, it was not possible to measure the alarm load and impact on the operators. Phase II: Alarm & Event Analysis In early 2002, ConocoPhillips set on Phase II - Alarm and Event Analysis. ConocoPhillips initiated an audit to assess the current alarm performance and benchmark metrics. The DCS was not able to assist ConocoPhillips staff to easily benchmark and generate metrics of the alarm and event data in the plant. The key objective was to assess the load imposed on the operator from alarms by evaluating the followings items:
• Key parameters evaluated by Operator (Operator Inventions) • Volume of Alarms & Events seen by the Operator • Response time of the Operators • Benchmark between rationalized values and current DCS alarm configuration
PD-04-181 Page 3

It was difficult to collect and assess this information so ConocoPhillips decided that an Alarm Management Solution was required to historize alarms and events as well as benchmarking various parameters to help the Operators. This Phase was broken down into 4 steps:
Step 1: Implementation of an Alarm & Event historian Step 2: Baseline Analysis Step 3: Alarm Maintenance Step 4: Auditing
After evaluation of a number of vendor products, ConocoPhillips chose Matrikon’s “ProcessGuard” alarm management software. This choice was based on product vision, connectivity to DCS (non-intrusive), functionality, and ease of use. Initially, the software was used to rank alarms by frequency. Step 1: Implementation of an Alarm & Event historian ProcessGuard ProcessGuard is a software package provided by Matrikon, Inc. ProcessGuard receives alarm and event data from the DCS, parses the data based on a set of rules, initiates configured actions, and historizes the data in a database. ProcessGuard allows the study and manipulation of alarm data. ProcessGuard consists of the following components:
• A&E Collector is the point of entry for alarm and event data to the ProcessGuard system. • Rules Builder helps create a set of rules. These rules are used by ProcessGuard to look
at the alarm data and segregate the alarm type, time, value, etc. • A&E Archiver receives the raw alarm data from the A&E Collector then applies the rules
from the Rules Builder. It can then forward the data to the A&E Viewer and store the results in the ProcessGuard historian.
• A&E Viewer is a tool for real-time monitoring of the alarm data. • A&E Analysis is a Microsoft Excel Add-in that pulls data from the database. This lets
you view predefined reports or perform ad hoc queries and statistical manipulation on alarm data in Excel. These reports are based on EEMUA (Engineering Equipment and Materials User Association) guidelines – publication 191.
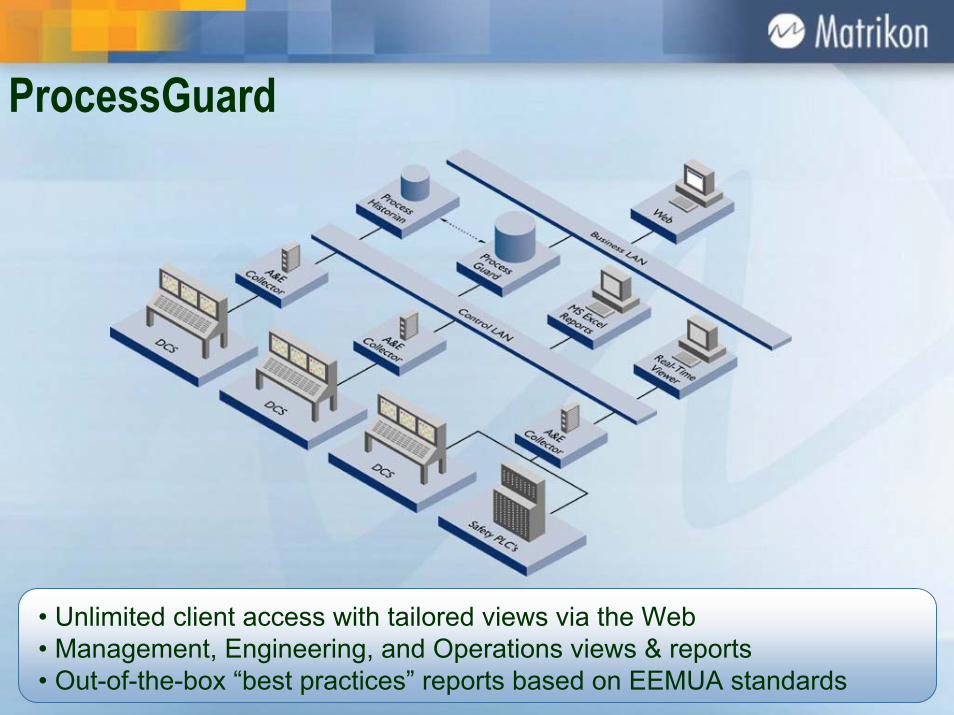
With the use of various pre-defined reports, ad hoc queries, filters, etc, the alarm data is extracted from the historian into an Excel workbook. The reports can be run on a specific DCS console, process area, or by a DCS tag. Once the data is in Excel, it can be manipulated with the functions of Excel. Network Architecture The following diagram outlines the architecture of collecting, storing, and accessing the alarm and event data.
PD-04-181 Page 4

Matrikon installed the A&E Collector, capturing data from the Honeywell TDC3000 GUS stations real-time. In this particular installation, both the A&E Collector and ProcessGuard are installed on a single server. The data collected is stored in ORACLE on the ProcessGuard server. The client applications were installed on various PC’s for data access and analysis. Step 2: Baseline analysis Through the use of ProcessGuard ConcoPhillips was able to determine alarm performance. Various parameters were evaluated to determine the baseline of alarm performance. Step 3: Alarm Maintenance Bad actors are identified on each shift by the operations staff. During the alarm management workflow process infancy, a bi-weekly status review meeting at key management level was held. This team was comprised of the following representatives:
• Instrument & Electrical Team Leader • Operations Production Team Leader • Process Operations Manager • Employee Development lead • Human Resources lead
The DCS technicians and Instrument Technicians received direction from operations management and Instrument and Electrical routinely on what to investigate and modify through a plant MOC procedure.
PD-04-181 Page 5

Currently, each shift reviews the top 20 alarms or bad actors on a daily basis to identify instrument/DCS work direction. Obvious “nuisance” alarms are corrected by changing alarm limits, dead bands, or through instrument repair. Work orders are generated and if changes are required, a MOC is completed. The following chart represents the most frequent alarms during a single shift for a CAT Cracker.
Step 4: Auditing The alarm management champion generates alarm metrics reports on a monthly basis. Based on the results, a corrective action is determined to achieve a goal of 5 alarms per hour average, with a peak alarm rates of 2 alarms per minute, and 15 alarms per hour. Phase III: Alarm Management & MOC tracking The key to managing the process and not the alarms is “Alarm Management”. Determining alarm settings must follow a strict policy. This is done through ensuring that the plant Management of Change procedures are followed when changing any alarm settings as outlined in the Borger – Alarm Management Policy. It was determined that the Borger facility required a centralized alarm database integrated with alarm and event analysis. Phase III is currently in progress and has been broken down into the following steps: Step 1: Review of available software tools Step 2: Access Management Step 3: Enforce
PD-04-181 Page 6
Step1: Review of Available Software Tools The design review of commercially available off-the-shelf products was carried out evaluating 3 vendors. The assessment was based on the best solution; with the best product vision, this was found in Matrikon’s Alarm Management Suite module Alarm MOCca (Management of Change Configuration Assistant). Step 2: Access Management Matrikon’s AlarmMOCca was installed in early part of 2004. The multiple plant ARA databases were imported into the AlarmMOCca which servers as the central alarm repository for the Borger facility. ConocoPhillips has put processes in place to close the loop and ensure Management of Change.
• The DCS alarms settings access levels were changed to engineer’s key lock access only
• The locks on the DCS systems were re-keyed and only certain key personnel were given access
• An enforcement policy was set-up to MOC alarm changes • The MOC system was modified to notify the appropriate site personnel when an alarm
change was requested The following initiatives were carried out in this step:
• An Alarm Management champion was set-up • The alarm philosophy document was enhanced • A Management of Change process was implemented for alarm changes • Alarm requests were captured and integrated from plant reviews • Integrated alarm management into the safety program
Step 3: Enforcement Enforcement is currently performed in an open loop manner. Alarm enforcement is dependant on work processes and plant personnel; at this time, it is not automated. First line managers (shift team leaders) and second line managers (production team leaders) are notified on alarm changes and are required to approve these changes. The second line manager is held accountable for the overall alarm system. In a future release, Matrikon will provide automated enforcement. At this point in time, periodic batch auditing can be performed.
PD-04-181 Page 7

ConocoPhillips runs monthly “Audit Trail Reports” to determine which values in the DCS have been changed without follow-through on MOC procedures outlined in the Alarm Management Policy. These reports are the Discrepancy Summary Reports that outline the mismatches between the DCS and the central alarm database, Alarm MOCca. The report is summarized per area with drill down ability for details.
The following is a drill down example of the Discrepancy Summary Report that illustrates the capability to modify Engineered Values for Auditing/Enforcement purposes.
PD-04-181 Page 8
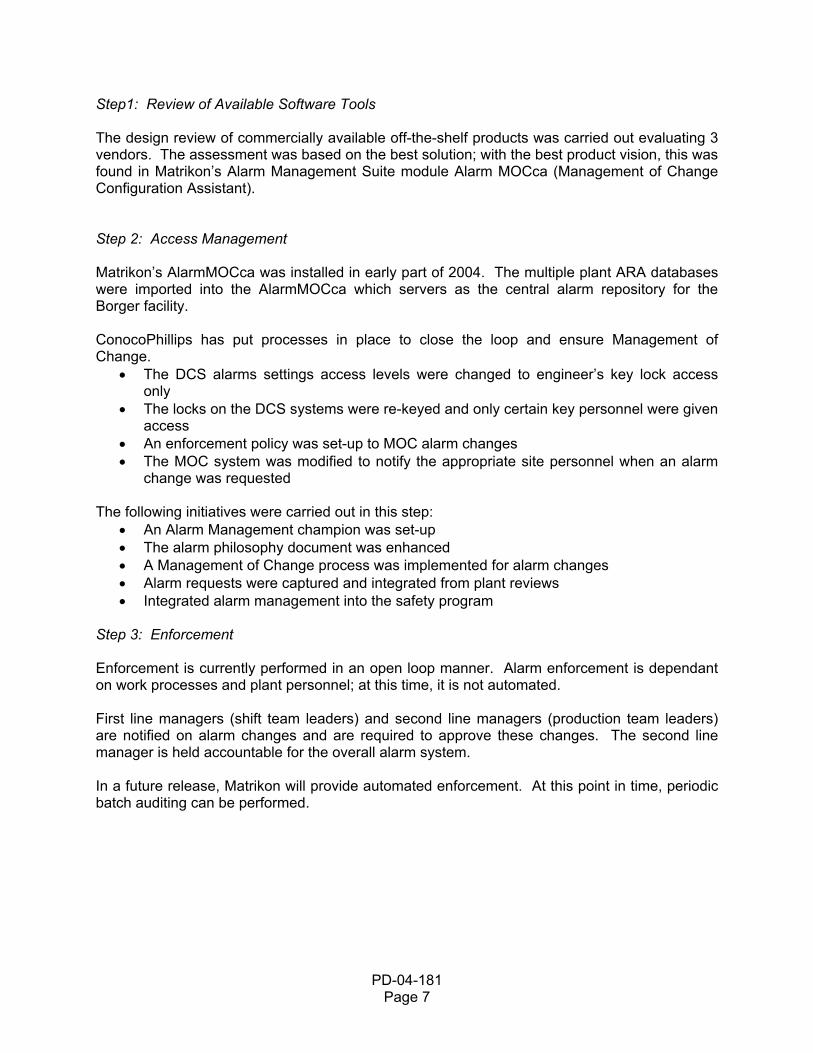
Future Phases: Phase IV: Operator Effectiveness Web Portal It is ConocoPhillips vision to provide their operators a “single click” capability in accessing information. The plan is to Integrate into the consoles applications such as Overview Displays with Hyperlinks to the following:
• Process HAZOP Analysis documentation, • Alarm Management Documentation, • Process Flow Sheets, • P&ID’s, • E-mail • Standard Operating Procedures • Production Plan • Flare video • Work order entry screens • Trends from Data Historian
Phase V: Automated Alarm Enforcement & MOC Validation ConocoPhillips would like to implement a closed loop system that is integrated into all of ConocPhillips information systems:
• Capturing configuration changes on the console (exists today) • Verifying the changes are associated to an MOC • Notification of appropriate site personnel based on changes made not corresponding to
an MOC. • Automatically enforcing the original values
PD-04-181 Page 9

Other objectives are to provide • Dynamic alarming or state based alarming on the DCS consoles • Alarm shelving capabilities for the operators
State based alarming is a feasible scenario on the CAT Cracker for full burn and partial burn modes, switching NGL distillation column service. ConocoPhillips also has a vision to perform model based predictive alarming. This is not part of Phase V but is being investigated as a future phase. Results from implementing a Process for Alarm Management Performance monitoring and metrics will identify a variety of problems. General difficulties, such as incorrect settings, inadequate alarm messages, repeating alarms, instrumentation not capable of generating alarms as once thought, etc is identified in this process. Some techniques that can be used for improving alarm systems are shown below: • Review alarm behavior following all upset incidents to confirm usability • Tune alarm settings (dead band, filter, etc) on nuisance alarms • Eliminate alarms which have no defined operator response • Ensure alarms are allocated an appropriate priority • Review alarm with unclear messages or poorly defined responses • Review historical process data for a period of at least 6 months to ensure that alarm settings
are not within normal operating zones Personnel identified in the Performance Monitoring Reports RACI (Responsible Accountable Consult Inform) chart will monitor the performance of the alarm management system as outlined in this policy. Alarm data will be reviewed for each operating console to analyze metrics and correct on a monthly schedule unless otherwise specified.
PD-04-181 Page 10

The following reports and views of data represent a portion of the Alarm Performance Metrics used at the Borger facility. The following stakeholders within the organization review these reports on a periodic basis as defined in the table above: Production Team Leaders, Manufacturing Specialists, Shift Team Leaders, Operators, DCS technicians, and the I&E Core craft team leader. The following figure shows the overall average alarm rates as well as highest average and lowest average values for 13 consoles for the last 3 months of data. On the right-hand side of the figure, the EEMUA benchmarks1 for average alarm rate for normal operations are presented. An average alarm rate of under 1 alarm per 10 minute period was seen in 9 out of 13 consoles (69%) and would be considered by EEMUA to have an alarm rate performance “very likely acceptable” for effective operator performance. This figure also shows the median Industry alarm rate of 1.77 alarms per 10-minute period. After the rationalization effort, the Borger refinery median is 0.55 alarms per 10-minute period, this means that 12 out of 13 consoles are at “manageable” levels or better for alarm rate performance as defined by EEMUA.
1 EEMUA (1999), Figure 42, p.105
PD-04-181 Page 11

The following figure illustrates the Average Process Alarms per hour-plotted daily over one month. This is for 1 LCN, the Catalyst Cracking unit. This alarm management process is time consuming so the focus has been on the highest value units first i.e. the CAT cracker. On this plot there are 4-process areas: ALKY Unit (22), U25 (Low Sulfur Gas), 29 (CAT), 40 (CAT). The red line represents the performance goal for average alarm rate per hour of 5. The EEMUA guidelines recommend a value of less than 6 per hour. Additional effort needs to be expended on the ALKY and Low Sulfur units.
PD-04-181 Page 12
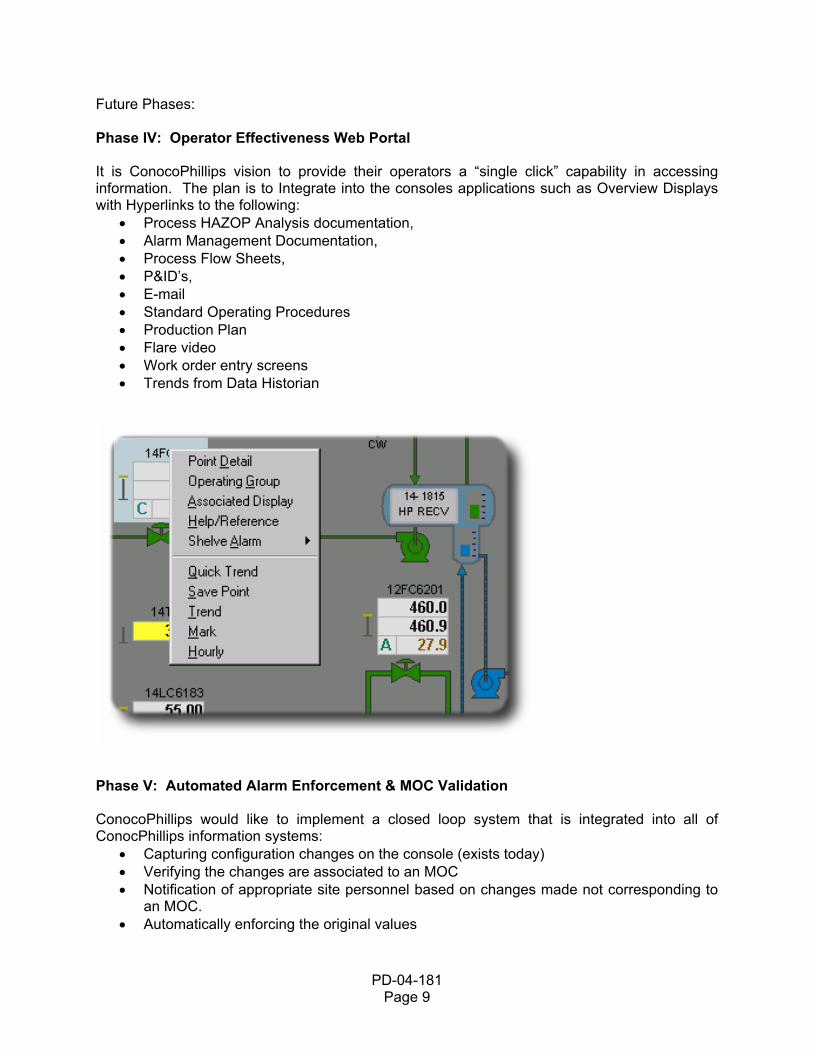
The following figure represents the daily peak alarms per hour for the CAT Cracker LCN over a month, July 2004. The target rate is less than 15 alarms per hour peak. The report is analyzed to determine when the target rate was exceeded. Further analysis is performed to determine if there was a process upset, or nuisance alarm. This is one of the charts that indicate operator loading.
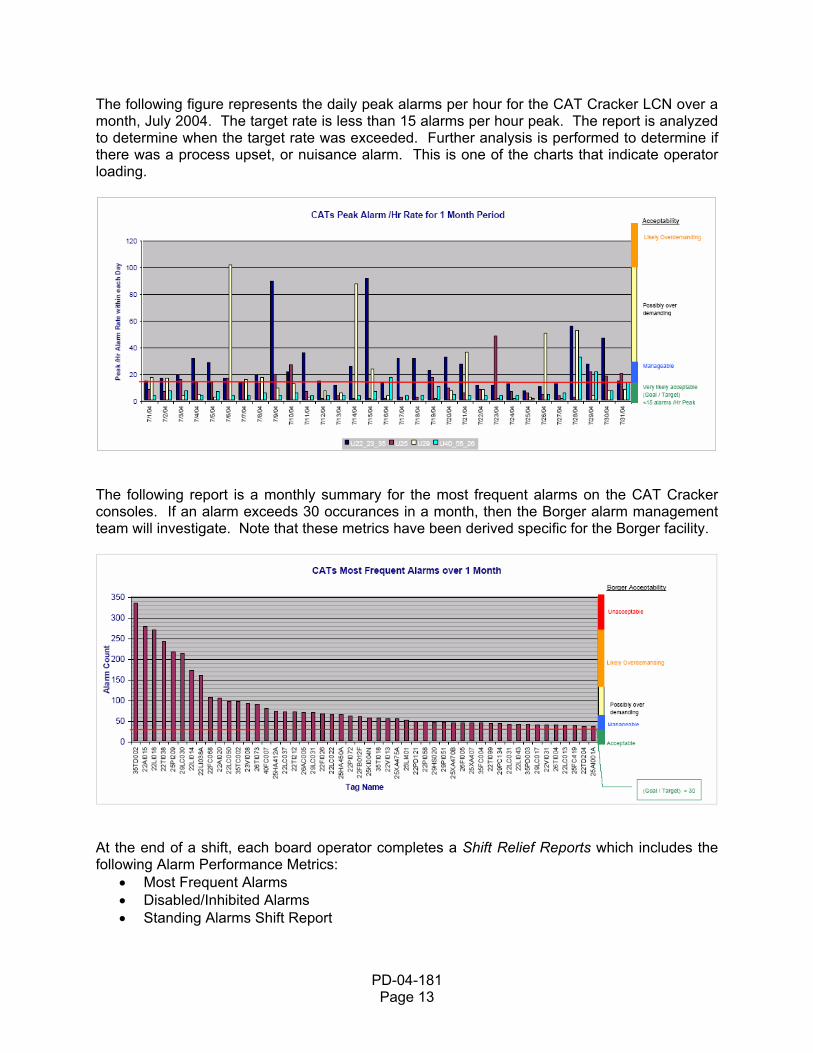
The following report is a monthly summary for the most frequent alarms on the CAT Cracker consoles. If an alarm exceeds 30 occurances in a month, then the Borger alarm management team will investigate. Note that these metrics have been derived specific for the Borger facility.
At the end of a shift, each board operator completes a Shift Relief Reports which includes the following Alarm Performance Metrics:
• Most Frequent Alarms • Disabled/Inhibited Alarms • Standing Alarms Shift Report
PD-04-181 Page 13
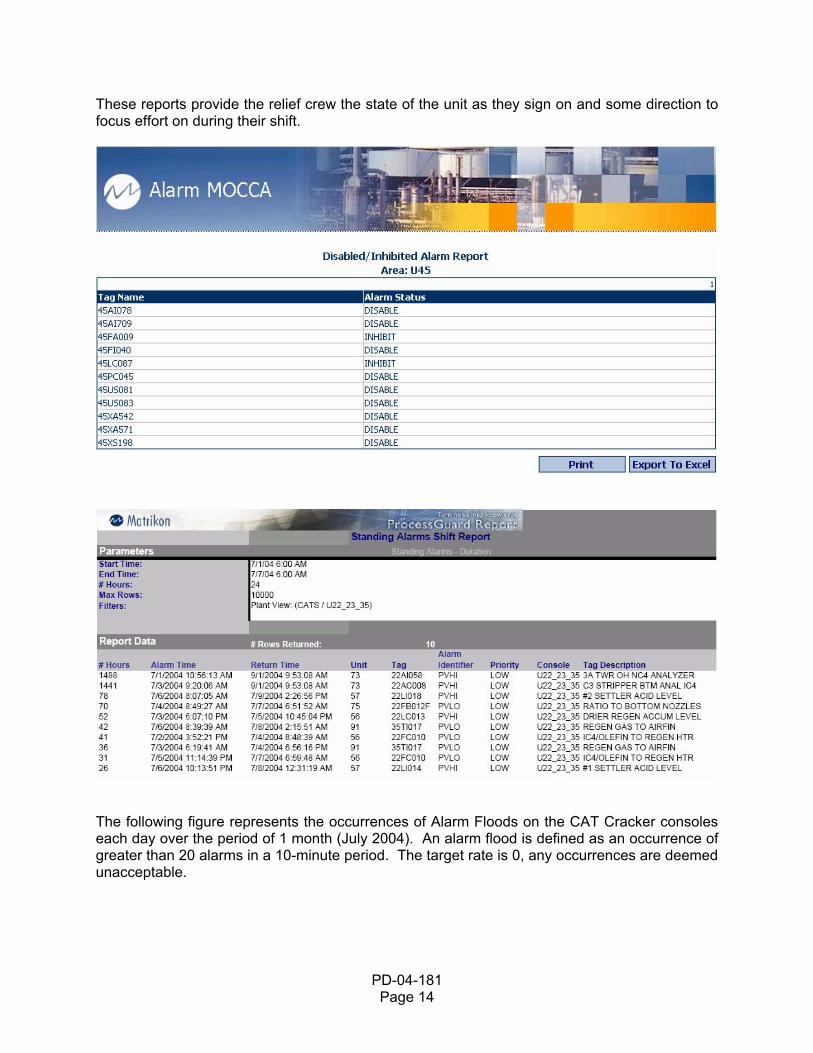
These reports provide the relief crew the state of the unit as they sign on and some direction to focus effort on during their shift.
The following figure represents the occurrences of Alarm Floods on the CAT Cracker consoles each day over the period of 1 month (July 2004). An alarm flood is defined as an occurrence of greater than 20 alarms in a 10-minute period. The target rate is 0, any occurrences are deemed unacceptable.
PD-04-181 Page 14

The following diagrams are a representation of the priortiy distribution of triggered alarms over the month of July 2004 and the current configured alarms distribution. Triggered alarms are alarms received by the operators, collected through ProcessGuard.
PD-04-181 Page 15

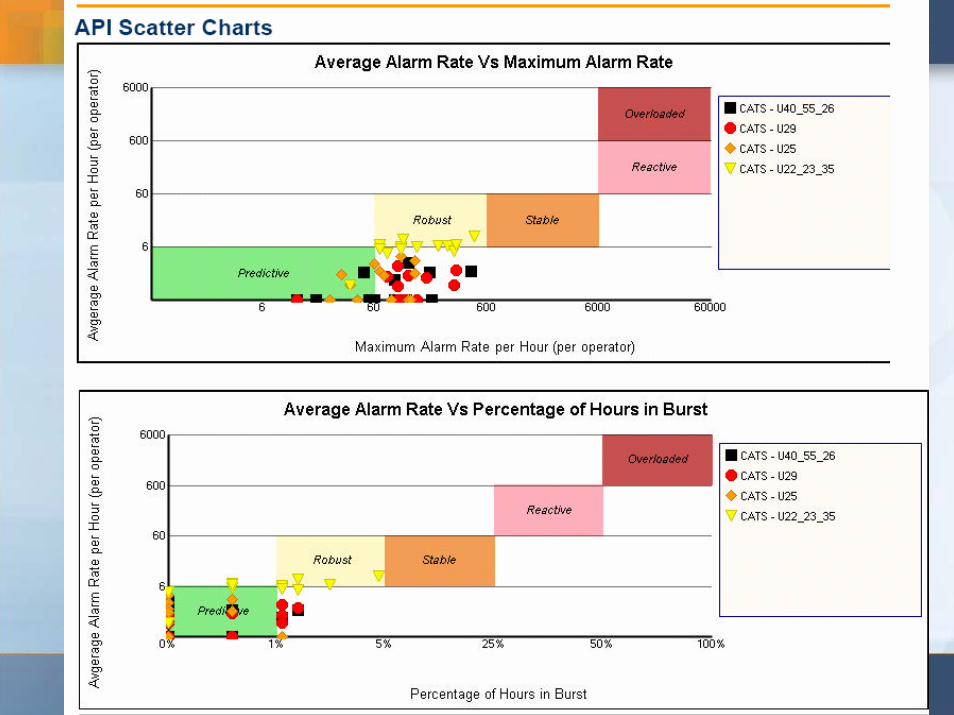
The following Alarm Performance Indicator reports provide a summary at a glance based on an Alarm Load Rating. The X-Y plots show an evaluation of the Borger facilities alarm loading for the CAT Crackers. The CAT crackers have been an area of focus over a 3 month period, which has yeilded the following assessment. These charts show a direct benefit to managing the process.
PD-04-181 Page 16
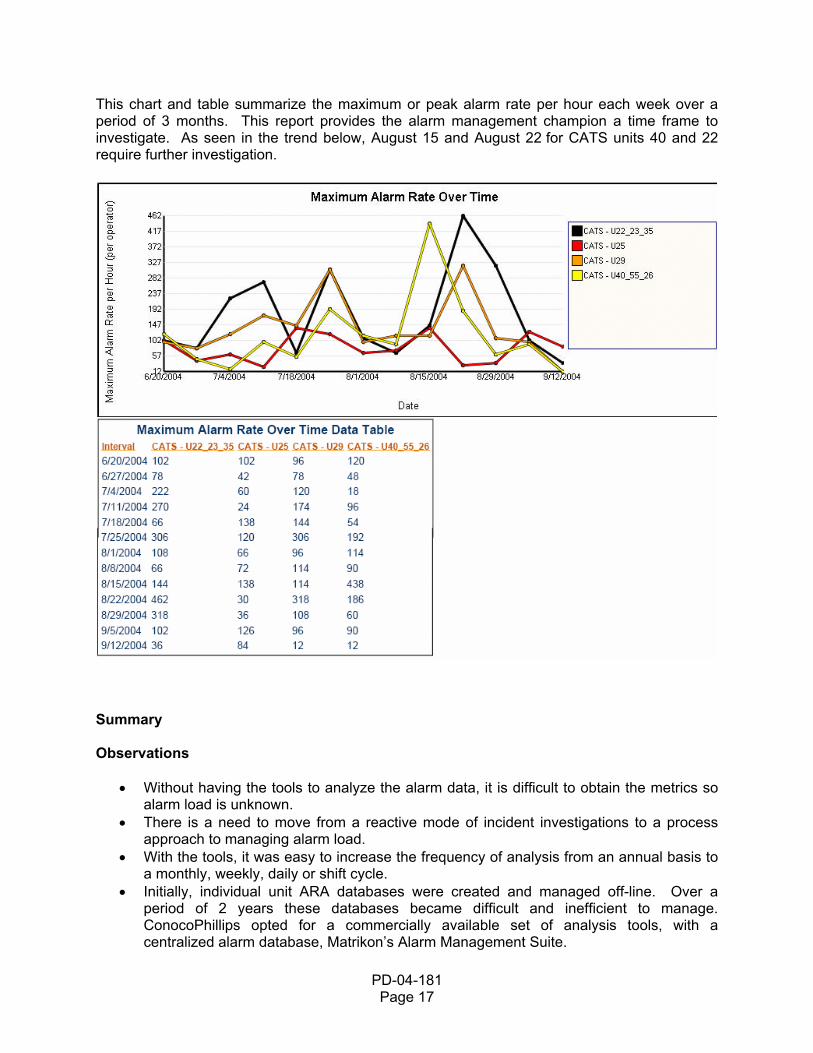
This chart and table summarize the maximum or peak alarm rate per hour each week over a period of 3 months. This report provides the alarm management champion a time frame to investigate. As seen in the trend below, August 15 and August 22 for CATS units 40 and 22 require further investigation.
Summary Observations
• Without having the tools to analyze the alarm data, it is difficult to obtain the metrics so alarm load is unknown.
• There is a need to move from a reactive mode of incident investigations to a process approach to managing alarm load.
• With the tools, it was easy to increase the frequency of analysis from an annual basis to a monthly, weekly, daily or shift cycle.
• Initially, individual unit ARA databases were created and managed off-line. Over a period of 2 years these databases became difficult and inefficient to manage. ConocoPhillips opted for a commercially available set of analysis tools, with a centralized alarm database, Matrikon’s Alarm Management Suite.
PD-04-181 Page 17
• When the initial ARA study was performed only common alarms such as PVHI and PVHIHI were rationalized. The new tool set includes all alarm types.
• The implemented solution needed to be consistent and easy to use otherwise the process broke, i.e. a single click for report generation. The focus needed to be on the analysis of data and not on the execution of the tool.
Improvements for the Alarm Management Process Lessons learned during the Process of Managing Alarms at ConocoPhillips – Borger. 1) Assembly of All Alarm Data
• In preparation for ARA rationalization meetings, a minimum of 3 months of data is required.
• ProcessGuard can reduce time by 80% in data extraction and preparation for the Alarm Rationalization meetings
• Shutdown logic diagrams and descriptions need to be reviewed • Many of the status alarms that were deleted during ARA should have remained as a
journal entry not an audible alarms 2) Alarm System Redesign
• Continuous house-keeping on alarm changes • Action items identified in the ARA reviews require followed-up
3) Control of Access Levels
• The DCS alarm setting access levels were changed to engineer’s key lock access only
• The DCS system was re-keyed and key personnel were issued access • Individual GUS UserID’s were created and were provided to authorized personnel
only 4) Maintenance
• Continual review and cleanup of graphics, navigational displays, DCS point mismatches and ARA databases.
• Iterative passes with unit stillman acting as champion and owner of the alarm systems is crucial
5) Manage or Update Changes
• Ensure an easy processes to manage the alarm system • Access to the ARA database are essential on the operators’ desktops • Incorporation of the tool into work flow is essential for alarm management
PD-04-181 Page 18

About the Speakers Name: John Huot Company: ConocoPhillips Bio: John Huot is a Systems Specialist for ConocoPhillips located in Borger Texas. Currently performing duties such as TPS GUS network administrator supporting DCS systems, Microsoft Domain Infrastructure, Networking, Modernization & Automation Projects, Plant maintenance, and Plant IT as needed. Primarily focusing on level 2 and 3 systems with integration to level 1systems such as alarm management. Mr. Huot has worked at the ConocoPhillips refinery since 1994 as a Honeywell contractor until joining ConocoPhillips in 2000. John’s career with Honeywell spanned 14 years working with Honeywell North American Projects, Network Services, and Field Service Organizations completing automation projects. E-Mail: [email protected] Phone: 806-275-2527 Name: Karim Moti Company: Matrikon International, Inc. Bio: Karim Moti is the Regional Manager for Matrikon's office in the Gulf Coast, and has over 10 years of experience in Process Optimization and Improvement through Information Management. Working for Matrikon for the past 6 years, Mr. Moti has become an expert in Alarm Management, Information Management, and KPI's for business. Karim Moti has performed optimization studies at more than 200 industrial facilities world wide, and is a graduate from the University of Alberta with a degree in Bachelor Chemical Engineering and specialization in Computer Process Control. E-mail: [email protected] Phone: 713.963.4677
PD-04-181 Page 19
PD-04-181 Page 20
References: EEMUA Publication No. 191 (1999) Alarm Systems: A Guide to Design, Management and Procurement. The Engineering Equipment and Materials User Association. ISBN 0 85931076-0. ASM Consortium Guidelines 2004: Effective Alarm Management Practices Version 4.02. Horses for Courses – A vision for Alarm Management. Donald Campell Brown, BP Inc.
Managing the Process, not the Alarms at ConocoPhillipsHelping the Operator
2004 NPRA Plant Automation and Decision Support Conference
AGENDA1. Introduction2. Alarm Management Life Cycle
Phases I – V3. Techniques for Improving Alarm Systems4. Alarm System Goals5. How Borger Looks at Data6. Improvements for Alarm Management Process7. Observations

IntroductionConocoPhillips – Borger, Tx• 147,000 bbl per day• Honeywell TDC 3000• 5 LCN’s• 14 Consoles
• The key to managing the process and not the alarms is “Alarm Management”

Alarm Management Life Cycle• Alarm Management began in 1998• Plan Developed from 1998-2000Phases:
I RationalizationII Alarm & Event AnalysisIII Alarm Management & TrackingIV Operator Effectiveness/Web PortalV Enforcement and MOC Validation

Phase I: Rationalization1) Develop site-wide Alarm Philosophy
• Corporate involvement
2) Alarm Response Analysis (ARA) • Facilitator• Process Engineer• I&E Lead• Operations Lead
3) Implementation• Advanced Navigational display

JournalizedAlarms - Orange
All counts are summedup and displayed on theLower navigational area
of ARA
Primary on bottomSubsystems on Right
Hand Side
ARA GUS Navigation

Phase II: Alarm & Event Analysis1) Implementation of Matrikon’s ProcessGuard
* historize Alarms & Events and* generate reports based on Industry Practices
• Collect data from any DCS, HMI, Safety PLC, BMS, Fire System, etc.• Connect to multiple control systems simultaneously• Supports Foxboro, Honeywell, ABB, Bailey, Emerson, and all others
• Alarm and Event collectors … • “Store and Forward” capability preserves data during network problems• Supports serial, TCP/IP, files, ODBC, Network Printers, and OPC
• Specialized database for alarm and event storage • Central repository for easy access & analysis enterprise-wide• 55 million+ records online
• Integrate A&E data with process data for fast incident reviews• Supports all major historians (PI, IP.21, CIM.21) • Connectivity to CMMS for automated work orders (Maximo)
• Use MS Excel for detailed analysis• Automatically generate scheduled reports• Real-Time Viewer lets you monitor operations from anywhere• Eliminate alarm printers and piles of paper• Instantly search & review sequence of events, trips, faults, and alarms
• Unlimited client access with tailored views via the Web • Management, Engineering, and Operations views & reports• Out-of-the-box “best practices” reports based on EEMUA standards
ProcessGuard

Phase II: Alarm & Event Analysis1) Implementation of Matrikon’s ProcessGuard
* to historize Alarms and Events and * generate reports based on Industry Practices
2) Baseline Analysis

165
187
139
46
0
336
169
29
0
543
56
0
556
471
0
365
148
13
165
1987
559
89
0%
10%
20%
30%
40%
50%
60%
70%
80%
90%
100%
OFFNRMPR PVHHPR PVHIPR PVLOPR PVLLPR SummaryTOTALS
U40 Alarm Priority Distribution by Condition Before ARA
EMERGENCYHIGHLOWJOURNAL
382
87
192
39
78
1
21
58
188
65
3
2
203
46
12
0
89
12
481
645
13240
0%
10%
20%
30%
40%
50%
60%
70%
80%
90%
100%
OFFNRMPR PVHHPR PVHIPR PVLOPR PVLLPR SummaryTOTALS
U40 Alarm Priority Distribution by Condition After ARA
EMERGENCYHIGHLOWJOURNAL
OFFNRMPR PVHHPR PVHIPR PVLOPR PVLLPRSummaryTOTALS
EMERGNCY 46 29 1 13 89HIGH 139 169 56 47 148 559JOURNAL 165 0 0 0 0 165LOW 187 336 543 556 365 1987
Total 2800
Configuration Before ARA
OFFNRMPR PVHHPR PVHIPR PVLOPR PVLLPRSummaryTOTALS
EMERGNCY 2 21 3 12 2 40 5%HIGH 19 1 65 46 1 132 16%JOURNAL 382 39 58 2 0 481LOW 87 78 188 203 89 645 79%
Total 129854% Reduction
Configuration After ARA
ASM consortium Idustry Average:Emergency 5%High 15%Low 80%
Post ARA - the alarm configuration matches industry recommended standards

Phase II: Alarm & Event Analysis1) Implementation of Matrikon’s ProcessGuard
* to historize Alarms and Events and* generate reports based on on Industry Practices
2) Baseline Analysis3) Alarm Maintenance
Analysis of events, cleanup of nuisance alarms, reviewed most frequently received alarmsAM Process Review Team (Bi-weekly meetings)• I&E Team Leader• Production Team Leader• Operations Manager• Employee Development• H.R.

Phase III: Alarm Management & MOC Tracking1) Review
• Review of commercial off-the-shelf products• Selected Matrikon’s AlarmMOCca
2) Manage • Install & use AlarmMOCca• Import plant ARA database developed in Phase I• Put processes in place to close loop on MOC
3) Enforce• Open loop enforcement through notification to 1st line managers on
Alarm changes• Automate real-time solution with Matrikon that also included periodic
batch auditing
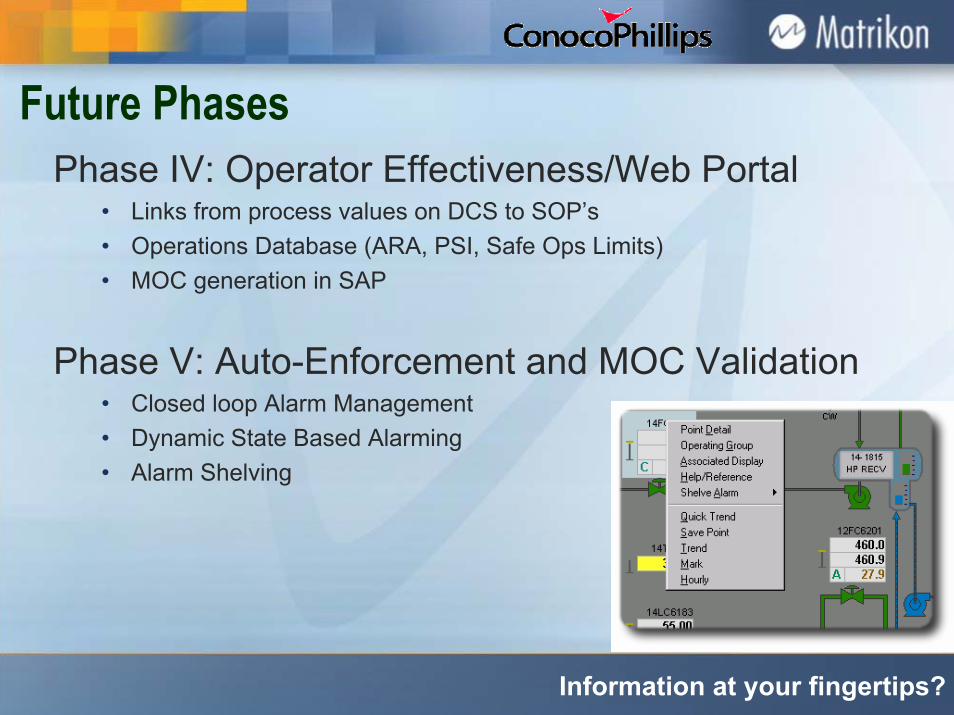
Future PhasesPhase IV: Operator Effectiveness/Web Portal
• Links from process values on DCS to SOP’s• Operations Database (ARA, PSI, Safe Ops Limits)• MOC generation in SAP
Phase V: Auto-Enforcement and MOC Validation• Closed loop Alarm Management• Dynamic State Based Alarming• Alarm Shelving
Information at your fingertips?
Techniques for Improving Alarm Systems• Review alarm behavior after upset incidents to confirm
usability• Tune alarm settings (dead band, filter, etc) on nuisance
alarms• Eliminate alarms without defined operator response• Ensure correct alarm priority• Review alarms with unclear messages or poorly defined
response• Review 6 months of process data to ensure alarm setting
is not in normal zone

Alarm System Performance GoalsBorgerBorger BorgerBorger
0%
0
0
2.5:1
0
5
1
2
55-80%14-35%5-10%
15
Average Alarmsper Hour
Average Alarms/10 Minute Interval
Peak Alarmsper Minute
Peak AlarmsPer Hour
Distribution %(Low/Med/High)
% of time aboveAve Alarm Rate
Average Stale Alarms
Discrepancies/Mismatches
Disabled / InhibitedAlarms
Alarms ConfiguredTo controller count
What are your facilities Goals?


Shift Relief Reports

Improvements for Alarm Management Process1) Assemble all data
• 3 months of data• ProcessGuard reduces time• Status Alarms should be Journaled
2) Alarm System Redesign• Operator drive process and not have alarms drive operator
3) Access Level Control4) Maintenance5) Manage or Update Changes

Observations• Software tools to analyze alarm data is key
(ProcessGuard, AlarmMOCca)• With the tools, increase analysis from annually to
monthly, weekly, daily or shift cycles. • Move from a reactive mode of investigation to proactive• Commercially available tools are better than custom• Solution to be consistent and easy to use• The focus on the analysis of data and not on extraction• Management commitment required to push this effort• Alarm Management is a continuous process, much has
been done but more is required

Conclusion
The key is managing the process of alarm management and not the alarms
Workflow changes are key to the success of Alarm Management
• people need to incorporate the tools and metrics into day to day workflow