p&d gis map how-to-guide thomas fire / january 9, 2018 ... interactive map.pdf · p&d...
TRANSCRIPT

P&D GIS Map How-To-Guide
Thomas Fire / January 9, 2018 Debris Flow
The interactive GIS web-based map is available here.
Once you have accessed the map, type in your address in the field on the top right corner and click
on the magnifying glass icon, as shown below:
After you click on the magnifying glass, the map will zoom in to your parcel. Click on the red,
yellow, or green square. A small box will pop-up (as shown below) which includes specific
information about your property. Notice that you can scroll up and down within the pop-up box.

P&D Interactive Map How-To-Guide
Thomas Fire / January 9, 2018 Debris Flow
Page 2
Some properties have multiple pages within the pop-up box. You can switch between pages by
clicking on the arrow on the top right corner. Each page gives information regarding a damaged or
destroyed structure on the property.
The pop-up box will include links to the following:
Permit History
Citizen Access (Accela), our active case records
Digital Archive (Valise), our microfiche system
Assessor’s Parcel Map
PERMIT HISTORY: Clicking on this link will provide you with a report that outlines the permit
history for your parcel, including parcel geographical data, special districts the parcel is associated
with (e.g. fire, schools, water), and prior Planning and Building case information.
CITIZEN ACCESS: By clicking on this link, you can review information regarding Building and
Planning permits that are currently being processed for your property. Click on either “Building” or
“Planning” at the bottom of the webpage. Not all fields need to be completed. For example, if all
you have available is your permit number, that is all you need to enter into the Citizen’s Access
portal in order to obtain information about that specific permit, as shown below:

P&D Interactive Map How-To-Guide
Thomas Fire / January 9, 2018 Debris Flow
Page 3
DIGITAL ARCHIVE: By clicking this link, you can review past Building and Planning permits
that were approved and/or issued for your property. Once you have accessed the webpage, press
“APN-Permit System” and enter your APN Number without using dashes, as shown below:

P&D Interactive Map How-To-Guide
Thomas Fire / January 9, 2018 Debris Flow
Page 4
Once you have pressed “Search”, you will be taken to a webpage where you can access available
files by clicking on the document icons on the very left, as shown below:
A user guide for the archival website is available here. Some microfiche planning permit files may
still be in the process of being converted and will be added as soon as they become available.
If you would like to review hard-copy microfiche at the Planning and Development Department
offices, you can do so during our Building, Planning, and Zoning Counter hours, which are
Monday, Tuesday, Wednesday, and Friday from 9:00 am – 12:00 pm and 1:30 pm – 4:00 pm and
Thursday from 10:00 am – 12:00 pm and 1:30 pm – 4:00 pm. Our Building, Planning, and Zoning
Counter is located on the second floor at 123 East Anapamu Street, Santa Barbara, CA 93101.
ASSESSOR’S PARCEL MAP: Clicking on this link will provide you with the Assessor’s Parcel
Map for your parcel.
ADDITIONAL MAP FEATURES: See below for explanations on how to use different basemaps,
layers, and the swipe-feature.
BASEMAP GALLERY: The map consists of different basemaps. To access the drop-down list of
available basemaps, click on the “squares” icon (third from the left) on the top right corner of the
map, as shown below. To use a specific basemap, click on the desired map icon. Blue text under a
map icon indicates that that basemap is the one being used.

P&D Interactive Map How-To-Guide
Thomas Fire / January 9, 2018 Debris Flow
Page 5
LAYER LIST: The map consists of various layers that can be switched on or off. Layers include
zoning designations, 100-year flood hazard areas, and pre- and post- disaster aerial imagery. To
access the drop-down list of available layers, click on the “layer” icon (second icon from the left) on
the top right corner of the map, as shown below. To turn a layer on, click on the checkbox next to
the layer’s name. A blue checkbox indicates that a layer is turned on and being shown on the map.
The map below shows the Coastal Zone Boundary in blue and the current postings for affected
structures based on Building and Safety Division inspections (i.e. red, yellow, or green placards).
This next map shows the debris flow risk areas in red and yellow, the declared disaster zone in
Montecito in dark red, and the existing 100-year flood hazard area in blue. An additional flood
hazard area layer will be added to this map when the advisory FEMA recovery mapping comes out
in June 2018.
P&D Interactive Map How-To-Guide
Thomas Fire / January 9, 2018 Debris Flow
Page 6
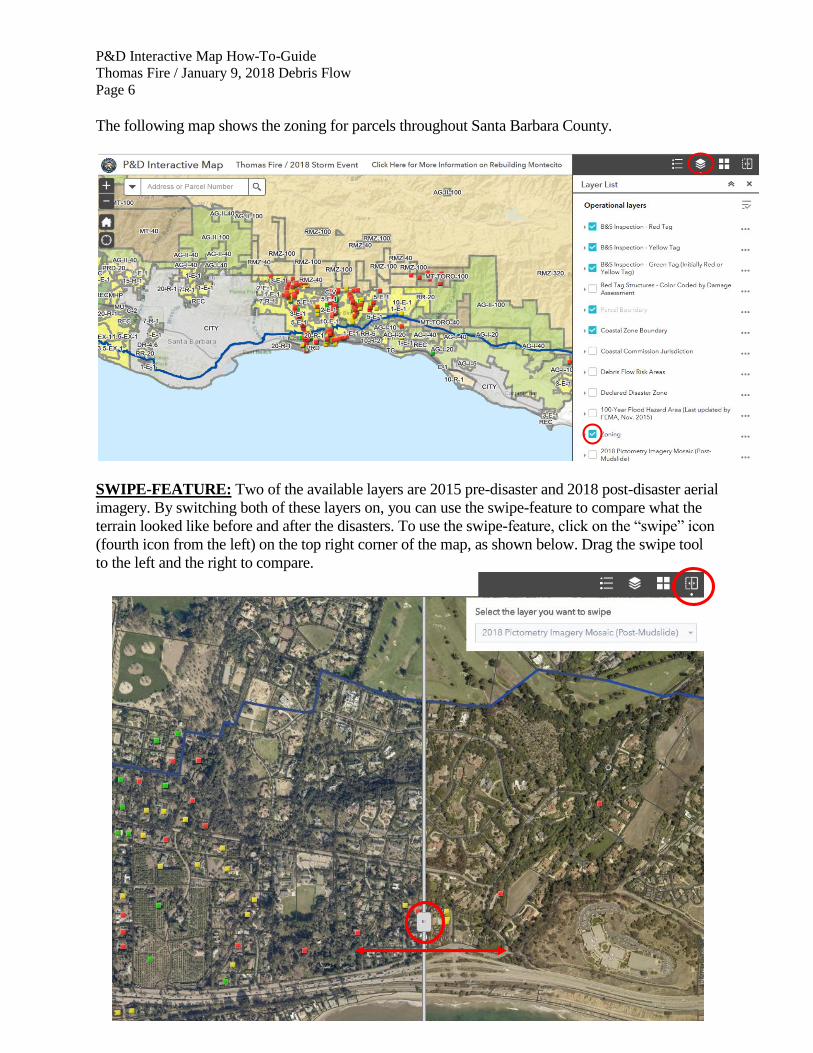
The following map shows the zoning for parcels throughout Santa Barbara County.
SWIPE-FEATURE: Two of the available layers are 2015 pre-disaster and 2018 post-disaster aerial
imagery. By switching both of these layers on, you can use the swipe-feature to compare what the
terrain looked like before and after the disasters. To use the swipe-feature, click on the “swipe” icon
(fourth icon from the left) on the top right corner of the map, as shown below. Drag the swipe tool
to the left and the right to compare.