pdf document - menssana research inc
TRANSCRIPT

Detection of an Extended Human Volatome withComprehensive Two-Dimensional Gas ChromatographyTime-of-Flight Mass SpectrometryMichael Phillips1,2*, Renee N. Cataneo1, Anirudh Chaturvedi1, Peter D. Kaplan1, Mark Libardoni3, MayurMundada1, Urvish Patel1, Xiang Zhang4
1 Breath Research Laboratory, Menssana Research Inc, Newark, New Jersey, United States of America, 2 Department of Medicine, New York Medical College,Valhalla, New York, United States of America, 3 Southwest Research Institute, San Antonio, Texas, United States of America, 4 Department of Chemistry,University of Louisville, Louisville, Kentucky, United States of America
Abstract
Background: Comprehensive two-dimensional gas chromatography coupled with time-of-flight mass spectrometry(GCxGC-TOF MS) has been proposed as a powerful new tool for multidimensional analysis of complex chemicalmixtures. We investigated GCxGC-TOF MS as a new method for identifying volatile organic compounds (VOCs) innormal human breath.Methods: Samples of alveolar breath VOCs and ambient room air VOC were collected with a breath collectionapparatus (BCA) onto separate sorbent traps from 34 normal healthy volunteers (mean age = 40 yr, SD = 17 yr,male/female = 19/15). VOCs were separated on two serial capillary columns separated by a cryogenic modulator,and detected with TOF MS. The first and second dimension columns were non-polar and polar respectively.Results: BCA collection combined with GC×GC-TOF MS analysis identified approximately 2000 different VOCs insamples of human breath, many of which have not been previously reported. The 50 VOCs with the highest alveolargradients (abundance in breath minus abundance in ambient room air) mostly comprised benzene derivatives,acetone, methylated derivatives of alkanes, and isoprene.Conclusions: Collection and analysis of breath VOCs with the BCA-GC×GC-TOF MS system extended the size ofthe detectable human volatile metabolome, the volatome, by an order of magnitude compared to previous reportsemploying one-dimensional GC-MS. The size of the human volatome has been under-estimated in the past due tocoelution of VOCs in one-dimensional GC analytical systems.
Citation: Phillips M, Cataneo RN, Chaturvedi A, Kaplan PD, Libardoni M, et al. (2013) Detection of an Extended Human Volatome with ComprehensiveTwo-Dimensional Gas Chromatography Time-of-Flight Mass Spectrometry. PLoS ONE 8(9): e75274. doi:10.1371/journal.pone.0075274
Editor: Richard C. Willson, University of Houston, United States of America
Received May 14, 2013; Accepted August 14, 2013; Published September 25, 2013
Copyright: © 2013 Phillips et al. This is an open-access article distributed under the terms of the Creative Commons Attribution License, which permitsunrestricted use, distribution, and reproduction in any medium, provided the original author and source are credited.
Funding: This research was funded internally and performed by Menssana Research, Inc. The lease of the analytical system was subsidized by LECOCorporation, who had no role in study design, data collection and analysis, decision to publish, or preparation of the manuscript.
Competing interests: Michael Phillips is President and CEO of Menssana Research, Inc. LECO Corporation subsidized the lease of the system toMenssana Research. ML performed this work while employed by LECO.
* E-mail: [email protected]
Introduction
In 1971, Linus Pauling reported a new technique formicroanalysis of breath that revealed an unexpected finding:normal humans exhale a large number of volatile organiccompounds (VOCs) in low concentrations [1]. VOC products ofmetabolism have subsequently been observed in animal breath[2], plants [3] and microorganisms [4], and the sum of all of theVOC products of metabolism has been termed the volatome[5]. Since Pauling’s discovery, microanalysis of human breathVOCs has led to improved understanding of physiologicprocesses [6] such as oxidative stress [7] and detection of new
biomarkers of diseases including lung cancer [8], breast cancer[9], gastric cancer [10], uremia [11], and pulmonarytuberculosis [12].
Pauling’s human subjects exhaled through a tube chilled withdry ice in isopropyl alcohol, and the cryogenically concentratedbreath VOC samples were analyzed with gas chromatography(GC). Similar techniques usually reveal around 70 differentVOCs in a sample of breath [13]. However, methods forcollecting, concentrating, separating and identifying breathVOCs have progressively improved during the past 40 years,and with these improvements, an increasingly complex pictureof the composition of breath VOCs has emerged [6,14,15]. By
PLOS ONE | www.plosone.org 1 September 2013 | Volume 8 | Issue 9 | e75274

the late 1990’s, one-dimensional GC and mass spectrometry(GC-MS) routinely detected approximately 200 different VOCsin a sample of concentrated human breath, mostly innanomolar or picomolar concentrations [16]. More recently,comprehensive two-dimensional gas chromatography coupledwith time-of-flight mass spectrometry (GC×GC-TOF MS) hasbeen proposed as a powerful new tool for multidimensionalanalysis of complex samples with the potential to identify aneven greater number of VOCs in normal human breath as wellas biomarkers of diseases including asthma [17-19]. Weemployed GC×GC-TOF MS to explore the range of breathVOCs that could be detected in a group of healthy normalhuman subjects.
Materials and Methods
Human subjectsBreath samples were collected from a group of 34 normal
healthy volunteers (mean age = 40 yr, SD = 17 yr, male/female= 19/15). All were non-smokers, and all gave written informedconsent to participate in the research which was approved bythe Institutional Review Board of St. Michael’s Medical Center,Newark, NJ.
Breath VOC sample collectionThe method has been described previously [20]. In
summary, subjects respired normally for 2.0 min through adisposable valved mouthpiece and a bacterial filter into thebreath reservoir of a portable breath collection apparatus(BCA) (Menssana Research, Inc., Fort Lee, NJ 07024). VOCsin 1.0 L alveolar breath and 1.0 L room air were captured onto
Figure 1. Chromatogram displaying analysis of breath VOCs in a typical normal human subject. The x-axis (horizontal)displays retention time (sec) on the non-polar primary column, and the z-axis (front to rear) displays retention time (sec) on thesecondary polar column. The y-axis (vertical) represents the intensity of the peak and varies with the abundance of a VOC and themolecule specific (but not currently described) sensitivity of the method to each analyte.Panel 1: Zero rotation about x-axis. In this view, the z-axis is not visible, and the chromatogram resembles a conventional 1D GCMS chromatogram displaying approximately 150-200 peaks.Panels 2 and 3: 30 and 60 degrees rotation about x-axis. As the chromatogram rotates, peaks that appeared apparently single onthe x-axis in Panel 1 are resolved into several subsidiary peaks on the z-axis.Panel 4: 90 degrees rotation about x-axis. Each dot represents an individual VOC in the chromatogram. TOF-MS identifiedapproximately 2,000 different VOC peaks in this chromatogram. This provides a more sensitive depiction of the chromatographicdata because it displays VOCs whose peaks are too small to be visible in the other panels. Several different categories of chemicalspecies were observed, including terpenes, alcohols, ketones, alkanes, alkenes, esters, aldehydes, furans, benzene derivatives,and sulfides. Contour plot displays of GC×GC peaks can potentially separate breath VOCs into “chemical islands”. For example,alkanes constitute the majority of the VOCs in the oval areas outlined in the figure. Groups of similar VOCs, differing by a methylgroup for example, are resolved by this technique.doi: 10.1371/journal.pone.0075274.g001
Breath Test for Human Volatome
PLOS ONE | www.plosone.org 2 September 2013 | Volume 8 | Issue 9 | e75274
separate sorbent traps containing graphitized carbon black(Supelco, Inc, Bellefonte, PA 16823).
Sample analysis with GCxGC TOF-MSA Unity 2 thermal desorber (Markes International Inc., DE
19807, USA) was used to purge water vapor from the sorbenttraps with helium and then thermally desorb VOCs onto a coldtrap for re-concentration. VOCs were desorbed from the coldtrap onto the head of the primary column of a Pegasus 4DGC×GC-TOF MS system equipped with an Agilent 6890 gaschromatograph, a LECO two-stage cryogenic modulator and asecondary oven (LECO Corp, St. Joseph, MI 49085). A 30 m ×0.25 mm i.d. × 0.25 µm df Rtx-5 column (Restek Corp.,Bellefonte, PA) was connected to a 2 m × 0.18 mm i.d. × 0.18µm df Rxi-17 column (Restek Corp., Bellefonte, PA) in seriesand separated by the cryogenic modulator so that the non-polar primary column separated VOCs according to theirboiling point and the polar secondary column in the secondaryoven separated VOCs according to their polarity. VOCs elutingfrom the secondary column were detected with TOF MS.Helium was used as the carrier gas at 2.0 mL/min controlledvia automated pressure ramp. The back inlet was set toSplitless Mode with a temperature of 200 °C for the duration ofthe run. We used multiple temperature ramps from 35 °C to250 °C, during which the first and the second column haveidentical temperature ramp rate with the secondary oventemperature program +20 °C relative to the primary GC oven.The thermal modulator offset was +40 °C relative to theprimary oven temperature. The modulation period was 5seconds. The MS range of mass-to-charge ratio (m/z) was35-400 and 200 mass spectra were acquired per second. Theion source chamber was held at 200 °C. The detector voltagewas 1650 V with electron energy of 70 eV. The sensitivity ofthe system was monitored using an internal standardcomprising 2 ppm of 1-bromo-4-fluoro-benzene (BFB)
(Supelco, Inc, Bellefonte, PA 16823) injected on each sampletube prior to desorption.
Determination of system repeatabilityLaboratory control tubes were prepared using a mixture of
acetone, anthracene, benzaldehyde, cyclohexane, limonene,toluene and n-alkanes (C5-C31) spiked onto sorbent traps.During the analysis of a large set of breath samples (notreported here), 84 of these laboratory control tubes were run,two at the beginning and two at the end of each daysoperation. The retention times and peak area information ofeach spiked-in compound are used to investigate the variationsdue to the analytical platform and data analysis.
Analysis of comparison samples with 1-dimensionalGC-MS
Two sequential samples were collected from the samesubject and analyzed on two different instruments, GCxGCTOF-MS as described above, and 1-D GC-MS employing apreviously reported method [20].
Data analysisLECO’s ChromaTOF software was employed to reduce the
raw GC×GC-TOF MS instrument data into a list of metabolites,first by detecting peaks and then identifying VOCs by matchingtheir mass spectral signatures to a library of mass spectra(NIST 2.0, Gaithersburg, MD 20899-1070). Peak lists obtainedin different chromatograms were filtered based on retentionindex matching [21] and then aligned by an improved version ofDISCO algorithm [22]. Low quality peaks were filtered andmultiple peak entries were merged using the default valuesspecified in DISCO. Spectral similarity was calculated using themethod of Kim et al [23].
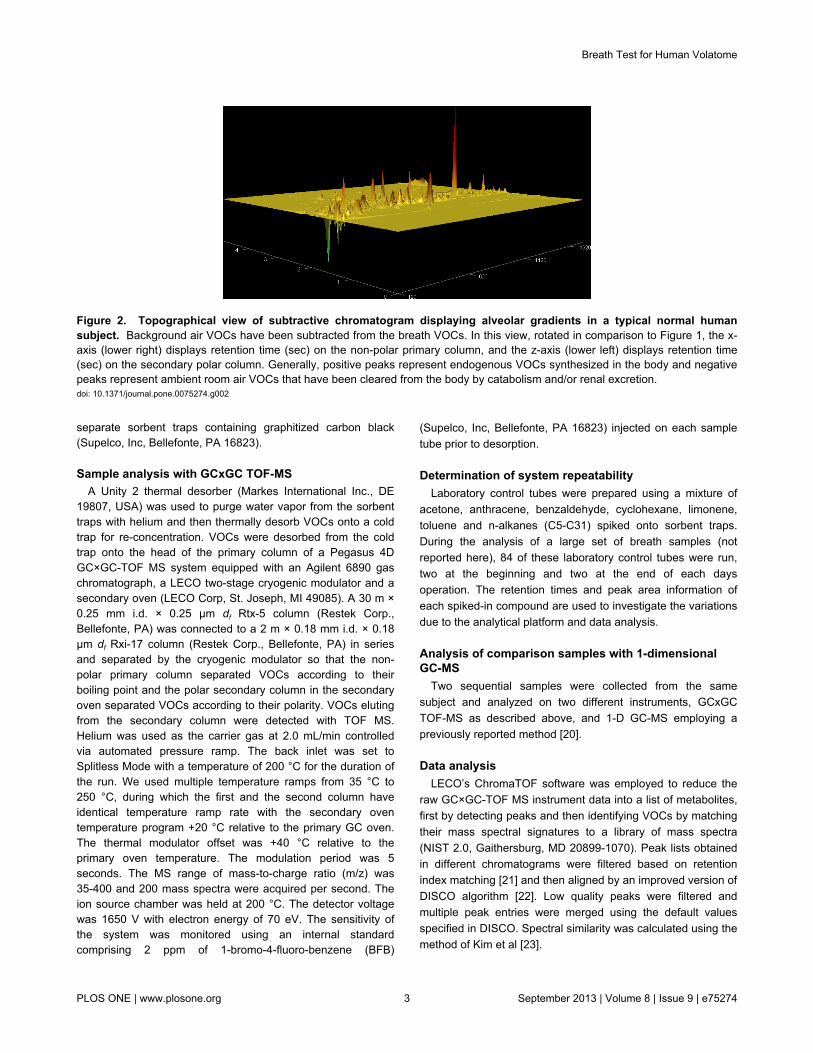
Figure 2. Topographical view of subtractive chromatogram displaying alveolar gradients in a typical normal humansubject. Background air VOCs have been subtracted from the breath VOCs. In this view, rotated in comparison to Figure 1, the x-axis (lower right) displays retention time (sec) on the non-polar primary column, and the z-axis (lower left) displays retention time(sec) on the secondary polar column. Generally, positive peaks represent endogenous VOCs synthesized in the body and negativepeaks represent ambient room air VOCs that have been cleared from the body by catabolism and/or renal excretion.doi: 10.1371/journal.pone.0075274.g002
Breath Test for Human Volatome
PLOS ONE | www.plosone.org 3 September 2013 | Volume 8 | Issue 9 | e75274

Determination of alveolar gradientsFor each breath VOC, the value of the alveolar gradient was
determined as Vb/Ib -Va/Ia, where Vb= area under curve of thechromatographic peak of the VOC in breath, Ib = area undercurve of the internal standard (i.e., BFB) peak in the samechromatogram, and Va and Ia denote the corresponding valuesin the associated room air sample, respectively [20].
Results
Human subjectsNone reported any adverse effects of donating a breath
sample.
ChromatogramsFigure 1 displays a chromatogram of breath VOCs in a
typical normal human subject. The x-axis (horizontal) displaysretention time (sec) on the non-polar primary column, and thez-axis (front to rear) displays retention time (sec) on thesecondary polar column. The y-axis (vertical) represents theintensity of the peak and varies with the abundance of a VOCand the molecule specific (but not currently described)sensitivity of the method to each analyte.
Panels 1, 2, 3 and 4 display zero, 30, 60, and 90 degreesrotation about x-axis.
Figure 2 displays a topographical view of subtractivechromatogram of alveolar gradients in a typical normal humansubject.
Figure 3. Heat maps of breath VOCs. The abundance of VOCs with an alveolar gradient greater than zero is shown in fourrandomly selected subjects (Figure 3). Color coding indicates the number of standard deviations by which the abundance of a VOCin an individual differs from the mean abundance in all subjects.doi: 10.1371/journal.pone.0075274.g003
Breath Test for Human Volatome
PLOS ONE | www.plosone.org 4 September 2013 | Volume 8 | Issue 9 | e75274

Heat mapsThe mean abundance of all peaks was determined. The
abundance of VOCs with an alveolar gradient greater than zerois shown in four randomly selected subjects (Figure 3).
Analysis of comparison samples (Figure 4)The 1-dimensional chromatogram resolved 200 peaks while
the two-dimensional chromatogram (not pictured) resolved1,016 peaks. 1-D GC-MS identified hexane at a retention timeof 7.23 minutes (peak a), while 2-D GCxGC TOF-MS identifiedhexane at a retention time of 2.3 minutes (peak g). However,GCxGC TOF-MS identified additional peaks with the same first
retention time as hexane with second retention times rangingfrom 1.06-1.69 seconds (peaks b-h).
Identification of breath VOCsTable 1 displays the most abundant VOCs observed in
human breath samples ranked according to their alveolargradient (abundance in breath minus abundance in room air)[24]. Compounds present in >90% of the normal breathsamples were employed to identify the VOCs with the highestalveolar gradients.
Figure 4. Comparison of 1D and 2D chromatograms containing hexane. The bottom panel shows the 1D chromatogram ofbreath VOCs in a single subject (inset) with detail around the hexane peak at 7.23 minutes (peak a). The ion fragmentationspectrum of the peak is displayed on the right in red. The top panel shows six peaks (b-h) in the 2D chromatogram that coelutedwith hexane (c) on the non-polar column but with different retention times on the polar column. These peaks were identified byChroma-TOF and the NIST library as (b) 1,3-pentadiene (c) hexane, (d) dimethyl selenide, (e) 4H-pyrazole, 3-tert-butylsulfanyl-4,4-bistrifluoromethyl- (f) butanal, (g) methyl vinyl ketone and (h) 3,5-dihydroxybenzamide. The ion fragmentation spectrum of eachpeak is displayed on the right. All intensities in this figure are plotted on a logarithmic scale.doi: 10.1371/journal.pone.0075274.g004
Breath Test for Human Volatome
PLOS ONE | www.plosone.org 5 September 2013 | Volume 8 | Issue 9 | e75274

Determination of system repeatabilityVariation in retention times in the two GC dimensions were
small, indicating high stability of the GCxGC separationsystem. Specifically, 95% of all compounds had a coefficient ofvariation (CV) (standard deviation/mean) of less than 3% in the
Table 1. VOCs most prevalent in human breath.
Name CASToluene 108-88-3p-Xylene 106-42-3Benzene 71-43-2Ethylbenzene 100-41-4Acetone 67-64-1Decane 124-18-5Undecane, 2,6-dimethyl- 17301-23-4Undecane 1120-21-4Styrene 100-42-5Tetradecane 629-59-4Nonane, 2-methyl- 871-83-0Nonane, 3-methyl- 5911-04-6Decane, 5-methyl- 13151-35-4Octane, 4-methyl- 2216-34-4Cyclopropane, ethylidene- 18631-83-9Decane, 3,7-dimethyl- 17312-54-8Propanoic acid, anhydride 123-62-61-Hexanol, 2-ethyl- 104-76-7Dodecane 112-40-31-Propene, 1-(methylthio)-, (E)- (isoprene) 42848-06-6Furan, 2-methyl- 534-22-5Cyclohexane 110-82-7Tridecane 629-50-5Hexane 110-54-3Nonane, 2,6-dimethyl- 17302-28-22,4-Dimethyl-1-heptene 19549-87-2Methyl vinyl ketone 78-94-4Cyclohexene, 1-methyl-4-(1-methylethenyl)-, (S)- 5989-54-8Heptane, 2,2,4,6,6-pentamethyl- 13475-82-6Decane, 2,2,8-trimethyl- 62238-01-1Hexane, 2,2-dimethyl- 590-73-8Benzene, 1-methyl-2-(1-methylethyl)- 527-84-4Cyclopentane, 1,2-dimethyl-, cis- 1192-18-3Cyclooctane, 1,4-dimethyl-, cis- 13151-99-0Decane, 4-methyl- 2847-72-5Octane, 6-ethyl-2-methyl- 62016-19-71,3-Pentadiene, (Z)- (isoprene) 1574-41-0Hexane, 3-methyl- 589-34-41,3,5-Trioxane 110-88-3Benzene, 1-ethyl-3-methyl- 620-14-4Heptane, 2-methyl- 592-27-8Bicyclo[3.1.1]hept-2-ene, 2,6,6-trimethyl-, (ñ)- 2437-95-8Heptane 142-82-52,2'-Bifuran, octahydro- 1592-33-2Pentane, 2,3,3-trimethyl- 560-21-4Propane, 1-(methylthio)- 3877-15-41-Octanol, 2-butyl- 3913-02-8Dodecane, 2,7,10-trimethyl- 74645-98-0
first dimension retention time and about 2% in the seconddimension retention time. Variation in the peak area of thespiked-in compounds was larger; the range of CVs forindividual components was 0.6-0.8.
Discussion
The main new finding of this study was that GCxGC-TOF MSanalysis of samples of normal human breath detected manymore VOCs than have been previously reported using MSwithout separation [6] or one-dimensional GC MS [6,16][25,26]. The extended size of the detectable human volatomemay have resulted from improved separation of VOCs with 2-dimensional GC compared to one-dimensional GC, and thegreater sensitivity of TOF-MS compared to quadrupole MS.
To illustrate the effects of coelution, we focused on thecompounds that coelute with hexane (Figure 4). Where 1D GCMS identified a single peak consistent with hexane, GCxGC-TOF MS identified seven separate peaks on the seconddimension, consistent with hexane and six other compounds. Itis apparent that there were many ion fragments observed with1D GC MS that did not contribute to identification of the peakas hexane. However, it would have been difficult todeconvolute these peaks into separate compounds without theaid of the polar column on the GCxGC TOF-MS. Thesefindings support the conclusion that the size of the humanvolatome has been under-estimated in the past, due tocoelution of VOCs in one-dimensional GC analytical systems
There are several potential applications for analysis of thehuman volatome with this technology, including discovery ofdisease biomarkers, improved detection of exposure toenvironmental toxins [27], and improved identification ofhereditary and acquired abnormalities of metabolism. Previousstudies of breath VOCs employing 1D GC MS have identifiedbiomarkers of diseases including lung cancer [8], breast cancer[9], and pulmonary tuberculosis [12], and the application ofGCxGC-TOF MS in these and other diseases offers anopportunity for improved detection of biomarkers by minimizingerrors that may have been previously introduced by coelutionof VOCs.
The increased size of the detectable human volatome raisesa number of practical challenges for future breath researchincluding the need for sophisticated alignment methods and forstatistical tools to identify the statistically significant biomarkersof abnormal metabolism. As an example of this challenge, wenote that of the 2,000 compounds identified, only 95 VOCs
Table 1 (continued).
VOCs in breath and air were quantified according to the ratio of their abundance toan internal standard, and ranked according to their alveolar gradient (abundance inbreath minus abundance in ambient room air). Alveolar gradient varies with rate ofsynthesis minus rate of clearance, so that VOCs with a positive alveolar gradientgenerally represent products of metabolism, though they can also arise fromrecently ingested foodstuffs and toxins. VOCs with a negative alveolar gradientgenerally represent degradation of VOCs ingested from ambient room air.doi: 10.1371/journal.pone.0075274.t001
Breath Test for Human Volatome
PLOS ONE | www.plosone.org 6 September 2013 | Volume 8 | Issue 9 | e75274
were detected in the breath of more than 90% of our healthysubjects and approximately 1,000 were detected in the breathof 50% or more of our subjects. These qualitative andquantitative differences between the VOCs detected in normalhuman samples may have resulted from inter-individualbiological variation, as well as from differences in diet and inenvironmental exposures.
The key VOCs observed in this study were generally similarto those reported in previous studies, including acetone,isoprene and methylated derivatives of alkanes and benzene[25,26]. However, there were also notable qualitativedifferences that may have been due to the improved chemicalresolution of the analytic tool and differences in techniques ofbreath VOC collection and assay which vary widely betweendifferent laboratories. Investigators are compelled to choosebetween several alternative options at every step in theprocess, including the selection of human subjects, the breathVOC collection method, the VOC trapping material, and thetechniques of thermal desorption, chromatographic separation,and detection. All of these choices have the potential to biasthe selection towards or away from different classes ofmolecules. The differences between the relative abundance ofbreath VOCs reported in this study and in other reports may bedue to differential sensitivity, differences in ionizationmechanisms amongst other causes. For example, the use ofcarbon black for VOC capture may have biased the samplecollections in favor of relatively non-polar compounds, and the
electron ionization employed in TOF MS may have yieldeddifferent patterns of fragmentation from those observed withsoft ionization MS.
This highly sensitive and selective assay for breath VOCscould provide a new tool for environmental toxicology anddetection of exposure to potentially hazardous volatile toxins.Also, detection of an extended human volatome may haveseveral applications in medicine and in basic science. Previousstudies of the human metabolome have focused mainly onlarger molecules, and the human metabolome database withfully annotated metabolite entries had grown to more than 6800by 2009 [28]. Detection of an extended human volatome withGC×GC-TOF MS extends the known metabolome and couldprovide a powerful new tool for metabolomic research andelucidation of normal and abnormal metabolic pathways. Inaddition, studies of the human volatome could potentiallyidentify new volatile biomarkers of disease with greatersensitivity and selectivity, and lead to improved diagnostictechnology.
Author Contributions
Conceived and designed the experiments: MP RNC ML AC.Performed the experiments: RNC AC MM. Analyzed the data:XZ PDK UP MM. Wrote the manuscript: MP RNC PDK MM UPXZ. Developed the methods: RNC MM ML.
References
1. Pauling L, Robinson AB, Teranishi R, Cary P (1971) Quantitativeanalysis of urine vapor and breath by gas-liquid partitionchromatography. Proc Natl Acad Sci U S A 68: 2374-2376. doi:10.1073/pnas.68.10.2374. PubMed: 5289873.
2. Vautz W, Nolte J, Bufe A, Baumbach JI, Peters M (2010) Analyses ofmouse breath with ion mobility spectrometry: a feasibility study. J ApplPhysiol 108: 697-704. doi:10.1152/japplphysiol.00658.2009. PubMed:20075263.
3. Batten JH, Stutte GW, Wheeler RM (1995) Effect of crop developmenton biogenic emissions from plant populations grown in closed plantgrowth chambers. Phytochemistry 39: 1351-1357. doi:10.1016/0031-9422(95)00126-R. PubMed: 7669278.
4. Schöller C, Molin S, Wilkins K (1997) Volatile metabolites from somegram-negative bacteria. Chemosphere 35: 1487-1495. doi:10.1016/S0045-6535(97)00209-9. PubMed: 9314189.
5. D’Alessandro M (2006) Assessing the importance of specific volatileorganic compounds in multitrophic interactions. Neuchâtel: University ofNeuchâtel.
6. Sinues PM-L, Kohler M, Zenobi R (2013) Human Breath Analysis MaySupport the Existence of Individual Metabolic Phenotypes. PLOS ONE8: e59909. doi:10.1371/journal.pone.0059909. PubMed: 23573221.
7. Aghdassi E, Allard JP (2000) Breath alkanes as a marker of oxidativestress in different clinical conditions. Free Radic Biol Med 28: 880-886.doi:10.1016/S0891-5849(00)00189-1. PubMed: 10802218.
8. Phillips M, Altorki N, Austin JH, Cameron RB, Cataneo RN et al. (2007)Prediction of lung cancer using volatile biomarkers in breath. CancerBiomark 3: 95-109. PubMed: 17522431.
9. Phillips M, Cataneo RN, Saunders C, Hope P, Schmitt P et al. (2010)Volatile biomarkers in the breath of women with breast cancer. J BreathRes 4: 026003. doi:10.1088/1752-7155/4/2/026003. PubMed:21383471.
10. Xu ZQ, Broza YY, Ionsecu R, Tisch U, Ding L et al. (2013) Ananomaterial-based breath test for distinguishing gastric cancer frombenign gastric conditions. Br J Cancer 108: 941-950. doi:10.1038/bjc.2013.44. PubMed: 23462808.
11. Pagonas N, Vautz W, Seifert L, Slodzinski R, Jankowski J et al. (2012)Volatile organic compounds in uremia. PLOS ONE 7: e46258. doi:10.1371/journal.pone.0046258. PubMed: 23049998.
12. Phillips M, Basa-Dalay V, Bothamley G, Cataneo RN, Lam PK et al.(2010) Breath biomarkers of active pulmonary tuberculosis.Tuberculosis 90: 145-151. doi:10.1016/j.tube.2010.01.003. PubMed:20189456.
13. Phillips M (1992) Breath tests in medicine. Scientific American 267:74-79. PubMed: 1502511
14. Amann A, Spanĕl P, Smith D (2007) Breath analysis: the approachtowards clinical applications. Mini Rev Med Chem 7: 115-129. doi:10.2174/138955707779802606. PubMed: 17305586.
15. Amann A (2010) Breath 2009: International Dortmund, Germany:Conference on Breath and Breath Odor Research. Journal of breathresearch 4: 010201
16. Phillips M (1997) Method for the collection and assay of volatile organiccompounds in breath. Anal Biochem 247: 272-278. doi:10.1006/abio.1997.2069. PubMed: 9177688.
17. Pierce KM, Hoggard JC, Mohler RE, Synovec RE (2008) Recentadvancements in comprehensive two-dimensional separations withchemometrics. J Chromatogr A 1184: 341-352. doi:10.1016/j.chroma.2007.07.059. PubMed: 17697686.
18. Libardoni M, Stevens PT, Waite JH, Sacks R (2006) Analysis of humanbreath samples with a multi-bed sorption trap and comprehensive two-dimensional gas chromatography (GCxGC). J Chromatogr B AnalTechnol Biomed Life Sci 842: 13-21. doi:10.1016/j.jchromb.2006.05.008. PubMed: 16765110.
19. Caldeira M, Perestrelo R, Barros AS, Bilelo MJ, Morête A et al. (2012)Allergic asthma exhaled breath metabolome: a challenge forcomprehensive two-dimensional gas chromatography. J Chromatogr A1254: 87-97. doi:10.1016/j.chroma.2012.07.023. PubMed: 22835687.
20. Phillips M, Cataneo RN, Cummin AR, Gagliardi AJ, Gleeson K et al.(2003) Detection of lung cancer with volatile markers in the breath.Chest 123: 2115-2123. doi:10.1378/chest.123.6.2115. PubMed:12796197.
21. Zhang J, Fang AQ, Wang B, Kim SH, Bogdanov B et al. (2011) iMatch:A retention index tool for analysis of gas chromatography-massspectrometry data. J Chromatogr A 1218: 6522-6530. doi:10.1016/j.chroma.2011.07.039. PubMed: 21813131.
22. Wang B, Fang A, Heim J, Bogdanov B, Pugh S et al. (2010) DISCO:distance and spectrum correlation optimization alignment for two-dimensional gas chromatography time-of-flight mass spectrometry-
Breath Test for Human Volatome
PLOS ONE | www.plosone.org 7 September 2013 | Volume 8 | Issue 9 | e75274

based metabolomics. Anal Chem 82: 5069-5081. doi:10.1021/ac100064b. PubMed: 20476746.
23. Kim S, Koo I, Wei X, Zhang X (2012) A method of finding optimalweight factors for compound identification in gas chromatography-massspectrometry. Bioinformatics 28: 1158-1163. doi:10.1093/bioinformatics/bts083. PubMed: 22333245.
24. Phillips M, Greenberg J, Sabas M (1994) Alveolar gradient of pentanein normal human breath. Free Radic Res 20: 333-337. doi:10.3109/10715769409145633. PubMed: 8069391.
25. Phillips M, Herrera J, Krishnan S, Zain M, Greenberg J et al. (1999)Variation in volatile organic compounds in the breath of normal
humans. J Chromatogr B Biomed Sci Appl 729: 75-88. doi:10.1016/S0378-4347(99)00127-9. PubMed: 10410929.
26. Ligor M, Ligor T, Bajtarevic A, Ager C, Pienz M et al. (2009)Determination of volatile organic compounds in exhaled breath ofpatients with lung cancer using solid phase microextraction and gaschromatography mass spectrometry. Clinical Chem Laboratory MedCCLM/FESCC 47: 550-560. PubMed: 19397483.
27. Wallace L, Buckley T, Pellizzari E, Gordon S (1996) Breathmeasurements as volatile organic compound biomarkers. EnvironHealth Perspect 104: 861–869. doi:10.1289/ehp.96104s5861. PubMed:8933027.
28. Wishart DS, Knox C, Guo AC, Eisner R, Young N et al. (2009) HMDB:a knowledgebase for the human metabolome. Nucleic Acids Res 37:D603-D610. doi:10.1093/nar/gkn810. PubMed: 18953024.
Breath Test for Human Volatome
PLOS ONE | www.plosone.org 8 September 2013 | Volume 8 | Issue 9 | e75274