pdf word 2000 - repositório aberto · the rup and the uml 2. remote experimentation and the pearl...
TRANSCRIPT

Dissertation
Home Dissertation Bibliography Annexes Software installers Sources PEARL deliverables
DissertationThe dissertation is provided in HTML format on this page. Alternatively, it can be accessed in Portable Document Format or in Word 2000
format, by clicking on the links below.
PDF Word 2000
Table of contents
Cover
Abstract
resumo
Acknowledgements
List of figures
List of tables
List of acronyms
1. Introduction
file:///D|/dissertation.htm (1 of 160) [03-06-2005 14:50:51]

Dissertation
1.1. Structure of this document
1.2. The RUP and the UML
2. Remote experimentation and the PEARL project
2.1. Remote experimentation
2.1.1. Definition of domain
2.1.2. Pedagogical aspects
2.1.3. Technological aspects
2.2. The PEARL project
2.2.1. Introduction
2.2.2. Project objectives
2.2.3. The partners
2.2.4. Work plan
2.2.5. The PEARL system
2.2.6. The remote experiments
2.3. Summary
3. Requirements and analysis
3.1. Requirements
file:///D|/dissertation.htm (2 of 160) [03-06-2005 14:50:52]

Dissertation
3.1.1. Overview of experiments
3.1.2. Minimum functional requirements
3.1.3. Optional functional requirements
3.1.4. Non-functional requirements
3.1.5. Use cases
3.2. Analysis
3.3. Technological architecture
3.4. Summary
4. Design
4.1. Overall design
4.1.1. Basic operations
4.1.2. Experiment-control operations
4.2. Hardware-access server
4.2.1. Overall design
4.2.2. Valve-switching mechanism
4.3. Control server
4.4. Video transmitter
file:///D|/dissertation.htm (3 of 160) [03-06-2005 14:50:52]

Dissertation
4.4.1. Overall design
4.4.2. Video-transmission chain package
4.5. Client
4.5.1. Overall design
4.5.2. Video-connection mechanism
4.5.3. Video-reception chain
4.5.4. Graphical user interface
4.6. Summary
5. Deployment and Implementation
5.1. Deployment
5.1.1. Distribution
5.1.2. Installation
5.1.3. Help on installation and usage
5.2. Implementation
5.2.1. Hardware-access server
5.2.2. Control server
5.2.3. Video transmitter
file:///D|/dissertation.htm (4 of 160) [03-06-2005 14:50:52]

Dissertation
5.2.4. Client
5.3. Accessibility features
5.3.1. Overview
5.3.2. Keyboard users
5.3.3. Blind users
5.3.4. Partially sighted users
5.3.5. Compatibility with assistive software
5.4. Partial testing of the system
5.4.1. Remote-control chain
5.4.2. Video transmission
5.5. Summary
6. Tests and results
6.1. Technical validation
6.1.1. Use cases
6.1.2. Network bandwidth
6.1.3. Results
6.2. Student trials
file:///D|/dissertation.htm (5 of 160) [03-06-2005 14:50:52]

Dissertation
6.2.1. Accessibility
6.2.2. Usability
6.3. Summary
7. Conclusion
7.1. Extent of implementation
7.1.1. Functional requirements
7.1.2. Non-functional requirements
7.2. Further development directions
7.2.1. Client interfaces
7.2.2. Video connection
7.2.3. Video broadcasting
7.2.4. Frame control
7.2.5. Complexity of further developments
Faculdade de Engenharia da Universidade do Porto
Remote control and visualisationfor light spectra and wet chemistry experiments
Telmo Pedro Gomes Amaralfile:///D|/dissertation.htm (6 of 160) [03-06-2005 14:50:52]

Dissertation
Licenciado em Engenharia Electrotécnica e de Computadores pela Faculdade de Engenharia da Universidade do Porto
Dissertação submetida para satisfação parcial dos requisitos do grau de mestre emEngenharia Electrotécnica e de Computadores
(Área de especialização de Sistemas Digitais e Informática Industrial)
Dissertação realizada sob a supervisão de
José Manuel Martins Ferreira,
Professor Associado com Agregação
Departamento de Engenharia Electrotécnica e de Computadores
Faculdade de Engenharia da Universidade do Porto
e
Martyn Cooper,
Senior Research Fellow,
Head: Accessible Educational Media
Institute of Educational Technology
Open University
Porto, Janeiro de 2005
To Joseph Swan and Thomas Edison,who invented not only the incandescent light bulb
but also the light switch.
Top
file:///D|/dissertation.htm (7 of 160) [03-06-2005 14:50:52]

Dissertation
Abstract
Experimental work is a vital component of teaching in science and engineering. Emerging multimedia and “virtual science” platforms have much to offer in terms of conveying theoretical principles, but do not focus on teaching the process of scientific enquiry or engineering practice. Remote experimentation systems present an opportunity to widen access to real experiments that might otherwise only be offered to those able to get to a suitably equipped laboratory. Access to laboratory equipment might be restricted for such reasons as disability, geographical location, resource restrictions in an institution, inflexible scheduling, or because it is judged impossible to offer the facility to students in a safe way. This dissertation begins with an overview of remote experimentation and the European project PEARL (Practical Experimentation by Accessible Remote Learning). It then addresses the development of a software framework to enable remote control and monitoring of equipment used in light spectra and wet chemistry experiments. The proposed framework was developed in the context of the PEARL project, and was designed to assist foundation science students in their Summer School component at the Open University. The capture and analysis of the system’s requirements was followed by the production of a detailed design model. The components of the system were then implemented and deployed. Several tests were carried out, which led to some design changes and ultimately to the technical validation of the system. Student trials were also carried out, to evaluate the system’s usability.
Keywords: remote experimentation, remote laboratories, distance learning.
Top
Resumo
O trabalho experimental é uma componente essencial do ensino em ciência e em engenharia. Plataformas emergentes de multimédia e de “ciência virtual” têm muito para oferecer em termos do ensino de conceitos teóricos, mas não se centram no ensino do processo de questionamento científico ou dos aspectos práticos da engenharia. Os sistemas de experimentação remota apresentam uma oportunidade de alargamento do acesso a experiências reais, que de outro modo estariam disponíveis apenas para aqueles que podem aceder a um laboratório devidamente equipado. O acesso a equipamento laboratorial pode ser restringido por razões tais como deficiência, localização geográfica, restrições de recursos numa instituição, horários inflexíveis ou impossibilidade de oferecer acesso a alunos de um modo seguro. Esta dissertação começa
file:///D|/dissertation.htm (8 of 160) [03-06-2005 14:50:52]

Dissertation
com uma visão geral da experimentação remota e do projecto europeu PEARL (Practical Experimentation by Accessible Remote Learning). Aborda depois o desenvolvimento de um conjunto de programas informáticos que possibilitou a monitorização e o controlo remotos de equipamento utilizado em experiências com o espectro luminoso e de química analítica. A infra-estrutura proposta foi desenvolvida no âmbito do projecto PEARL e foi projectada para apoiar alunos de ciências básicas na sua componente de escola de Verão da Open University. A captura e a análise dos requisitos do sistema precedeu a criação de um modelo de projecto detalhado. Os diversos componentes do sistema foram então implementados e distribuídos. Testes foram levados a cabo, conduzindo a algumas modificações de projecto e, por fim, à validação técnica do sistema. Testes com estudantes foram também conduzidos, por forma a avaliar a usabilidade do sistema.
Palavras-chave: experimentação remota, laboratórios remotos, ensino à distância.
Top
Acknowledgements
Devo aqui agradecer a um conjunto de pessoas cuja contribuição foi fundamental para a realização deste trabalho.
A José Manuel Martins Ferreira, pelo entusiasmo transmitido e pelo meticuloso trabalho de orientação e revisão da escrita desta dissertação.
To Martyn Cooper, for the attentive technical management of the undertaken development work.
To Chetz Colwell, for the opportunity of excellent teamwork throughout the whole development stage.
Ao António Cardoso, pelo empenho em ajudar sempre que necessário na configuração dos computadores e programas informáticos utilizados neste trabalho, bem como na comunicação com o Centro de Informática da FEUP.
À Inês Cambeiro, pelo apoio prestado em questões administrativas.
Aos restantes elementos do grupo de Projecto e Teste de Sistemas Electrónicos, por contribuírem para um ambiente de trabalho excelente, sempre aberto à discussão informal e construtiva: o Ricardo Costa, o Miguel Silva, o Domingos Santos, o
file:///D|/dissertation.htm (9 of 160) [03-06-2005 14:50:52]

Dissertation
Gustavo Alves, o Manuel Gericota e o Carlos Felgueiras.
Ao Filipe Alvelos, pela motivação transmitida e pela companhia proporcionada em muitas sessões de trabalho.
Aos meus restantes amigos e à minha família, pelo apoio prestado e pela compreensão demonstrada em momentos de menor disponibilidade.
Top
List of figures
Figure 1 – The core workflows of the RUP
Figure 2 – The DERIVE user interface
Figure 3 – The Moodle interface
Figure 4 – A client-side interface to the Flash Communications Server
Figure 5 – Client interface of the digital electronics bench experiment
Figure 6 – Client interface of the cellular biology experiment
Figure 7 – Client interface of the visual inspection experiment
Figure 8 – Apparatus for light spectra experiments
Figure 9 – Diagram of spectrometer device
Figure 10 – Diagram of bubbler and Bunsen burner
file:///D|/dissertation.htm (10 of 160) [03-06-2005 14:50:52]

Dissertation
Figure 11 – Layout of area for wet chemistry experiments
Figure 12 – Scorbot manipulator and apparatus for wet chemistry experiments
Figure 13 – Detail of the apparatus for wet chemistry experiments
Figure 14 – Use case diagram of the overall system
Figure 15 – Sequence diagram of the main use cases
Figure 16 – Use case diagram of the light spectra experiment
Figure 17 – Use case diagram of the wet chemistry reagent test experiment
Figure 18 – Use case diagram of the wet chemistry colorimeter test experiment
Figure 19 – Analysis class diagram of the system
Figure 20 – Design-level class diagram of the system
Figure 21 – Sequence diagram of the connection use case
Figure 22 – Activity diagram of the client’s operations for relative rotation of the telescope
Figure 23 – Design class diagram of the hardware server
Figure 24 – Activity diagram of the hardware server’s operation for valve switching
Figure 25 – Design class diagram of the control server
Figure 26 – Design class diagram of the video transmitter
file:///D|/dissertation.htm (11 of 160) [03-06-2005 14:50:52]

Dissertation
Figure 27 – State diagram of the video transmitter
Figure 28 – Design class diagram of the video-transmission chain package
Figure 29 – Design class diagram of the client
Figure 30 – Collaboration diagram of the video connection
Figure 31 – Design class diagram of the video-reception chain package
Figure 32 – Deployment diagram of the system
Figure 33 – Component diagram of the hardware server
Figure 34 – GUI of the spectrometer hardware server in hardware-access mode
Figure 35 – GUI of the spectrometer hardware server in simulation mode
Figure 36 – GUI of the wet chemistry hardware server in hardware-access mode
Figure 37 – GUI of the wet chemistry hardware server in monitoring mode
Figure 38 – Component diagram of the control server
Figure 39 – GUI of the spectrometer control server
Figure 40 – Connections tab in the Configuration dialog of the spectrometer control server
Figure 41 – Tuning tab in the Configuration dialog of the spectrometer control server
Figure 42 – Low-level Access Test-bed dialog of the spectrometer control server file:///D|/dissertation.htm (12 of 160) [03-06-2005 14:50:52]

Dissertation
Figure 43 – GUI of the wet chemistry control server
Figure 44 – Tuning tab in the Configuration dialog of the wet chemistry control server
Figure 45 – Component diagram of the video transmitter
Figure 46 – GUI of the video transmitter
Figure 47 – Capture tab of the Configuration dialog of the transmitter
Figure 48 – Processing tab of the Configuration dialog of the video transmitter
Figure 49 – Transmission tab of the Configuration dialog of the video transmitter
Figure 50 – Component diagram of the client
Figure 51 – GUI of the wet chemistry client
Figure 52 – GUI of the spectrometer client
Figure 53 – GUI of the spectrometer client, using the “High Contrast #1 large” Windows appearance scheme
Figure 54 – Remote-control chain, and parts of the system that were tested individually
Figure 55 – Deployment diagram of the network bandwidth test within an LAN
Figure 56 – Client-side connections with public and private IP addresses
Figure 57 – Deployment diagram of the system with video broadcasting
file:///D|/dissertation.htm (13 of 160) [03-06-2005 14:50:52]

Dissertation
Figure 58 – Activity diagram of telescope rotation with frame control
Top
List of tables
Table 1 – Use of UML diagrams in RUP workflows
Table 2 – Operations of the system’s components
Table 3 – Mapping of operations for the light spectra experiment
Table 4 – Mapping of operations for the reagent test experiment
Table 5 – Mapping of operations for the colorimeter test experiment
Table 6 – Tested values of parameter labels for the light spectra experiment
Table 7 – Tested values of parameter labels for the wet chemistry experiment
Top
List of acronyms
API Application Programming InterfaceAWT Abstract Window ToolkitCAD Computer-Aided DesignCAN Controller Area NetworkCORBA Common Object Request Broker ArchitectureDLL Dynamic Link LibraryDMZ DeMilitarised Zone
file:///D|/dissertation.htm (14 of 160) [03-06-2005 14:50:52]

Dissertation
DNS Domain Name SystemFPGA Field-Programmable Gate Arrayfps frames per secondGUI Graphical User InterfaceGDI Graphical Device InterfaceHTTP HyperText Transfer ProtocolIIOP Internet Inter-ORB ProtocolIP Internet ProtocolISP Internet Service ProviderIT Information TechnologyJAB Java Access BridgeJFC Java Foundation ClassesJMF Java Media FrameworkJPEG Joint Photographic Experts GroupJVM Java Virtual MachineLAN Local Area NetworkLED Light-Emitting DiodeMFC Microsoft Foundation ClassesNAT Network Address TranslationORB Object Request BrokerOS Operating SystemOMG Object Management GroupPC Personal ComputerPCB Printed-Circuit BoardPCI Peripheral Component InterconnectPXI PCI eXtensions for InstrumentationRAM Random-Access MemoryRTP Real-Time Transport ProtocolRTCP Real Time Control Protocol
file:///D|/dissertation.htm (15 of 160) [03-06-2005 14:50:52]

Dissertation
RUP Rational Unified ProcessUDP User Datagram ProtocolUML Unified Modelling LanguageVFW Video For WindowsXML eXtensible Markup Language
Most of the acronym definitions above were found in [TechTarget ] and [Jupitermedia ].
Top
1. Introduction
This dissertation reports on the development of a software framework to enable remote control and monitoring of light spectra and wet chemistry equipment, undertaken in the context of the European project PEARL. The following section introduces the structure of the document, whereas section 1.2 provides a brief overview of the Rational Unified Process and the Unified Modelling Language, on which the document’s organisation is freely based.
Top
1.1. Structure of this document
The body of this document is structured into six chapters, as follows.
Chapter 2 presents an overview of remote experimentation and the PEARL project. Firstly, the domain of remote experimentation is defined, and an outline of both pedagogical and technological aspects is provided. Then, the PEARL project and its involved partners are introduced, and the project’s objectives, work plan, and developed experiments are described.
Chapter 3 describes the workflows for capture and analysis of the project’s requirements. The chapter begins with a thorough specification of the system’s requirements and the analysis model of the system. Then, the choice of technologies
file:///D|/dissertation.htm (16 of 160) [03-06-2005 14:50:52]

Dissertation
that served as a basis for the system’s design and implementation is described.
Chapter 4 presents the design model of the system, developed during the design workflow of the project. Firstly, a design model of the overall system is provided. After that, design models are presented for the system’s individual components, namely the hardware-access server, the control server, the video transmitter and the client.
Chapter 5 describes the deployment and implementation workflows of the project. Firstly, the system’s deployment model is presented. Then, the implementation models of the various components of the system are defined. Several features implemented in the graphical user interface (GUI) of the light spectra client component, to improve its accessibility, are described in detail. Finally, a number of partial tests of the system, carried out at the implementation stage, are presented.
Chapter 6 describes the tests that were carried out, integrating all the system’s components. The chapter begins with the technical validation stage, which allowed determining to what extent the developed software met its functional requirements. Then, the student trials that took place at the OU are addressed. These focused on some of the system’s non-functional requirements.
Chapter 7 concludes this dissertation. It first summarises the extent of implementation of the requirements initially defined. Then, a number of further development directions that could be followed in addition to this work are presented.
The concluding chapter is followed by a list of bibliographic and electronic references. Then, annex A contains the specification produced by Zenon SA for the light spectra experiment’s ActiveX control. Five additional annexes are provided in electronic format in the CD-ROM that accompanies this document. Annex A.2 contains the specification of Zenon’s ActiveX control for the wet chemistry experiment. Annex B holds the specification of the steps that should be followed by the students, to carry out each of the experiments. Annex C contains the user’s documentation produced throughout this work. Annex D provides a detailed description of the test initially carried out with a Common Object Request Broker Architecture (CORBA) bridge across the Internet. Annexes E and F contain, respectively, the labscript and interview schedules that formed the basis for the student trials at the OU.
Top
file:///D|/dissertation.htm (17 of 160) [03-06-2005 14:50:52]

Dissertation
1.2. The RUP and the UML
Chapters 3 to 6 , respectively on requirements and analysis, design, deployment and implementation, and tests and results, are named after some of the so-called “workflows” of the Rational Unified Process (RUP). The RUP is a software engineering process developed and maintained by IBM’s Rational Software, which provides a disciplined approach to assigning tasks and responsibilities within a development organization [Gornik 01 , What is the RUP?]. Throughout the development of the software here documented, there was no intention of strictly following the RUP, which is mainly designed to enhance the productivity of software development teams, not individual work. The core workflows of the RUP were simply considered a suitable basis for the structure of the documentation here presented, as they ensure some consistency and thoroughness in the coverage of the various aspects of software development. Workflows are sequences of activities that produce results of observable value. The term “workflow” is more realistic than “stage”, as it reflects the fact that activities such as design, implementation, and testing inevitably overlap and interrelate throughout development of software. This is clear in Figure 1 [Gornik 01 , Core workflows], which shows the typical levels of activity for each workflow.
file:///D|/dissertation.htm (18 of 160) [03-06-2005 14:50:52]

Dissertation
Figure 1 – The core workflows of the RUP
The RUP helped not only structure this document, but also decide on which types of diagrams to present in each chapter. In fact, the RUP works as a guide for how to effectively use the Unified Modelling Language (UML). The process shows how to visually model software to capture the structure and behaviour of architectures and components. This allows developers to hide the details using “graphical building blocks.” Visual abstractions help at several levels, namely: communicate static and dynamic aspects of the software; see how the elements of the system fit together; make sure that the designed building blocks are consistent with the implemented code; and promote unambiguous communication. The UML is an industry-standard language, considered a foundation for successful visual modelling. The UML was created originally by Rational Software, and is now maintained by the standards organization Object Management Group (OMG). [Gornik 01 , What is the RUP?]
Guidelines on which UML diagrams to use in each workflow can be found in [Jacobson 99 ], and are summarised in Table 1 file:///D|/dissertation.htm (19 of 160) [03-06-2005 14:50:52]

Dissertation
. These diagrams can be classified in two main groups. Static diagrams model essentially the structural aspects of a system, defining what parts constitute it. Dynamic diagrams model the behavioural features of a system, such as the ways it behaves in response to certain events or actions.
UML Diagrams
RUP workflows / models
Use case Analysis Design Deployment Implementation
Static Use case X
Class/Object X X
Component X
Deployment X
Dynamic Sequence X x X X XCollaboration X x x x
State-chart x x X
Activity x x X
X – important; x - secondary
Table 1 – Use of UML diagrams in RUP workflows
Top
2. Remote experimentation and the PEARL project
This chapter presents an overview of remote experimentation and the PEARL project. Section 2.1 defines the domain of remote experimentation and provides an outline of both pedagogical and technological aspects. Section 2.2 introduces the PEARL project and the involved partners, and describes the project’s objectives, work plan, and developed experiments.
Top
file:///D|/dissertation.htm (20 of 160) [03-06-2005 14:50:52]
Dissertation
2.1. Remote experimentation
This section provides an overview of remote experimentation, based on the contents of [Ferreira 04 and 04b ]. Section 2.1.1 concisely defines the domain and addresses its main advantages, scenarios and taxonomy. Section 2.1.2 focuses on pedagogical aspects of remote experimentation, namely its impact on learning and teaching, and presents an appropriate teaching model. Finally, section 2.1.3 outlines the main technological aspects of remote systems, such as the automation of laboratory equipment and the support for distribution of learning contents.
Top
2.1.1. Definition of domain
Concept of remote experimentation
Remote experimentation may be defined as an activity where an individual (alone or as part of a team) uses a communication network to carry out a laboratory work assignment.
This activity relies on a system (comprising software and hardware) that allows carrying out a laboratorial experiment, involving real components. Like simulation, remote experimentation complements traditional laboratorial practice, rather than replacing it. Section 2.2 will provide examples of remote experimentation systems, namely those developed within the PEARL project by partners other than the OU.
Although the addressed experiments often support teaching in sciences and engineering, remote experimentation is not restricted to academia and can be offered as a service on a commercial basis, to either schools or the industry.
Top
Mixed-reality environments
Most of the technical and pedagogical concepts involved in remote experimentation are in fact applicable to the wide file:///D|/dissertation.htm (21 of 160) [03-06-2005 14:50:52]

Dissertation
spectrum that reaches from purely remote to purely virtual experimentation. The latter can be included in the field of simulation.
Mixed-reality systems lie between remote and virtual experimentation, combining real and virtual components. Typically, the real components are remote, whereas the virtual ones are local. The versatility of mixed reality can be pedagogically advantageous, as it brings together the best aspects of two worlds: remote experimentation and simulation.
Mixed-reality systems have been addressed in previous projects managed by the ARTEC (Research Center for Sustainability Studies, a unit of the Bremen University), such as the DERIVE project (Distributed Real and Virtual Learning Environment for Mechatronics and Tele-Service). This project developed a new type of learning environment, where on-site and remote components of a technical system merge into a cooperative learning process. The learning environment supports bridges between the real and virtual world with integrated simulations. The system allows to work together with complex real and virtual mechatronic systems, consisting of parts that may be distributed all over the world. Mechatronic hardware equipment can be connected to the virtual environment via a special sensor-actor coupling. The system may be distributed, having a set of real parts at one place and the virtual counterparts at remote places. This coupling is realised by Internet links. [Bendit ]
Figure 2 shows an aspect of the DERIVE user interface. [Derive 02 , Final product]
file:///D|/dissertation.htm (22 of 160) [03-06-2005 14:50:52]

Dissertation
Figure 2 – The DERIVE user interface
Top
Main advantages
A main advantage of remote experimentation is flexibility, in that it facilitates the management of schedules and renders unnecessary the physical presence of students in laboratorial sessions. The latter can be important for users with disabilities, in particular with mobility problems.
file:///D|/dissertation.htm (23 of 160) [03-06-2005 14:50:52]

Dissertation
Furthermore, remote systems increase the availability of existing resources. In relation to traditional laboratories, more users can access the same equipment. This can be important in the case of expensive resources (e.g. an electron microscope). In many situations, equipment can be available during night-time, so that users in other countries may access it during their daytime. Networks of remote laboratories can facilitate the optimisation of resources.
In the case of equipment both expensive and delicate, remote operation can also represent a safer solution (again, an electron microscope is a good example). In most cases, it should be easy to design the remote interfaces in a way that prevents users from taking any damaging action.
Pedagogical advantages also arise from remote experimentation, such as an increased motivation of students (allowing a better consolidation of theoretical knowledge) and an easier formative assessment.
Top
Main scenarios and task sharing
Various scenarios are possible in remote experimentation, depending on the location of students and equipment. Some of the students can be in a laboratory, and others scattered across different locations. The equipment itself can be placed in one or more locations. Students and equipment can even be in the same location: if at least part of the equipment is accessed through a communications network, this is technically a remote experimentation scenario.
The division of tasks between students can assume two main forms: cooperative or collaborative. If the experimentation has pedagogical objectives, it can be considered a collaborative activity. Synchronous communication tools then become of key importance, and must ensure an effective communication between the participants.
Top
Taxonomy of remote experimentation
Establishing a taxonomy in this domain is a complex task, given the instability of the criteria and the dependency on Internet technologies. The area of application is a possible criterion: access via the web to remote equipment can address many fields
file:///D|/dissertation.htm (24 of 160) [03-06-2005 14:50:52]

Dissertation
of science and technology. Other criteria may include: the duration of experiments (experiments can last from days to less than one second); the level of interactivity (real-time or deferred processing); reusability (repeatability) and autonomy of experiments; the nature of captured information; and user-side requirements (e.g. thin client or thick client).
Top
2.1.2. Pedagogical aspects
Remote experimentation in the learning chain
The concept of remote experimentation is more recent than that of simulation. Nevertheless, remote experimentation has a place in the learning chain. It increases the motivation of students and widens the range of options available to consolidate theoretical knowledge, which traditionally begins with simulation and ends with laboratory practice.
Top
Support to teachers and technicians
Besides scientific and pedagogical competence, teachers and technicians should need only general knowledge of computing, in order to create and manage remote / mixed experiments.
The capture of information about the actions of students can be valuable to formative assessment (for example, the calibration of an instrument can be very informative about a student’s knowledge).
Top
Teaching and learning model
A pedagogical framework should be offered together with the remote experiment. Two characteristics of remote experimentation deserve special attention, namely: it is a collaborative activity; and it promotes learning by action. These two aspects indicate that social-constructivist methods constitute the most appropriate model.
file:///D|/dissertation.htm (25 of 160) [03-06-2005 14:50:52]
Dissertation
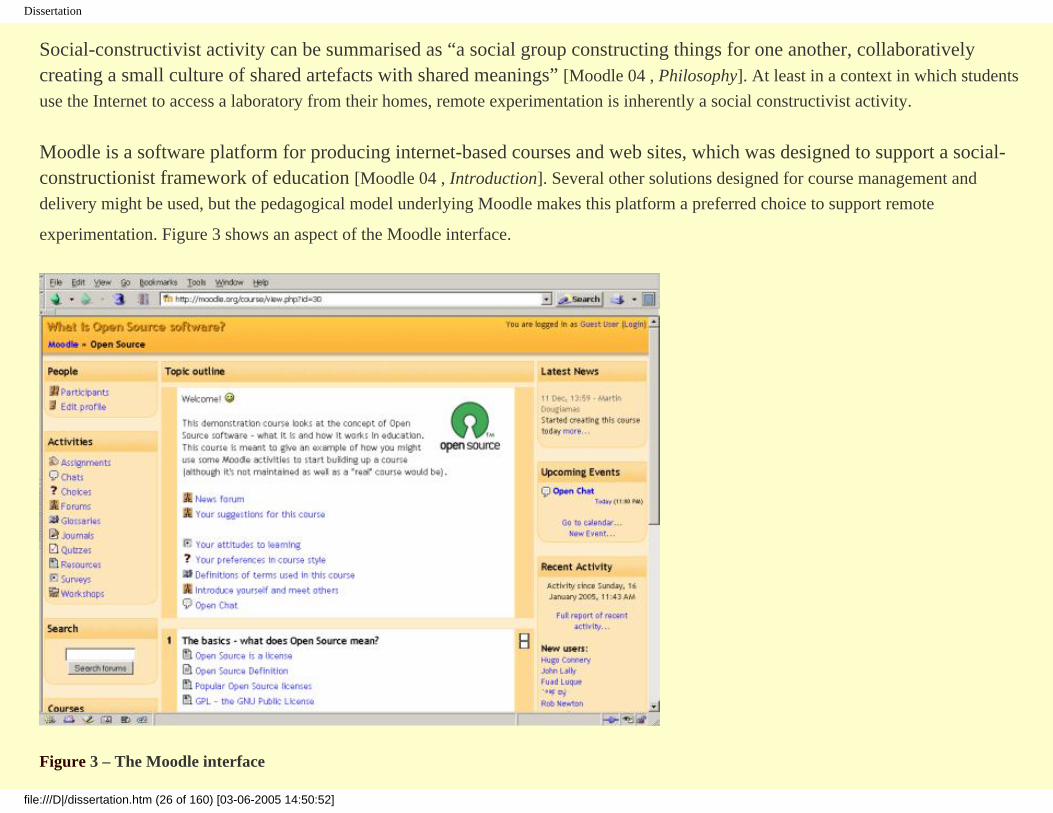
Social-constructivist activity can be summarised as “a social group constructing things for one another, collaboratively creating a small culture of shared artefacts with shared meanings” [Moodle 04 , Philosophy]. At least in a context in which students use the Internet to access a laboratory from their homes, remote experimentation is inherently a social constructivist activity.
Moodle is a software platform for producing internet-based courses and web sites, which was designed to support a social-constructionist framework of education [Moodle 04 , Introduction]. Several other solutions designed for course management and delivery might be used, but the pedagogical model underlying Moodle makes this platform a preferred choice to support remote
experimentation. Figure 3 shows an aspect of the Moodle interface.
Figure 3 – The Moodle interface
file:///D|/dissertation.htm (26 of 160) [03-06-2005 14:50:52]

Dissertation
Top
Open questions
What is the added value of remote experimentation in relation to simulation? In fact, the argument that it is better to deal with “real things” is fallacious. The advantages and the limitations of both approaches appear to be almost the same, namely the increase in flexibility, availability of resources, and motivation of students.
Moreover, should the user interfaces for remote / mixed experimentation merely replicate reality? The design of the interfaces dictates how the students perceive the experiments, and an environment similar to the laboratory workbench can indeed facilitate acceptance. However, this can also limit the pedagogical benefits: to use an analogy, it would be unreasonable to create an e-book that could merely reproduce the experience of reading a printed book.
Would it be acceptable to capture data for formative assessment? This might include actions such as noting down the time taken to do basic actions, keeping a record of evident mistakes, recording the communications flow, etc.
Top
2.1.3. Technological aspects
Building blocks
The main building blocks of a remote experimentation system are the software and hardware that automate the laboratory, and the interfaces that allow accessing the equipment remotely. However, a complete system must comprise other blocks, such as a framework for the distribution of learning contents, access-management tools, a lab script to define the experiment goals, and synchronous communication tools to support group work.
Top
Automation of laboratories
file:///D|/dissertation.htm (27 of 160) [03-06-2005 14:50:52]

Dissertation
All equipments on the server side must be addressable, so they can be interconnected. The choice of a physical communication network depends on the experiment being carried out. The options range from a simple Ethernet infrastructure to instrumentation buses (e.g. PXI) and industrial buses (e.g. CAN or Profibus).
Top
User interfaces
The interfaces on the client side consist mainly of instrumentation panels to access the remote equipment. In many cases, there are already recommended solutions (e.g. a combination of PXI hardware with LabVIEW interfaces accessible via an Internet browser).
The design should take into account that each piece of equipment may be controlled only by one user at a time. Some functionality can be visible and some other invisible, but the user should be aware of all functionality. For example, if a remotely controlled oscilloscope has its trigger rigidly set to detect the rising edge of signals, it is important that the user be aware of this fact.
The interface should also allow easy consultation of a labscript, defining the goals of the experiment being carried out.
Top
Distribution of learning contents
The system should allow interaction with an e-learning platform, to distribute learning content that supports the underlying theoretical concepts. Common e-learning platforms do not meet some of the requirements of remote / mixed experimentation, since they were optimised for theoretical contents. As explained previously under section 2.1.2 , the adopted platform should support methods that are appropriate for learning by experimentation, and the Moodle framework seems to be one of the best available solutions.
Top
file:///D|/dissertation.htm (28 of 160) [03-06-2005 14:50:52]
Dissertation
Access-management tools
Management tools should mainly allow the registration of new users and the reservation of experimental sessions. In both cases, validation can be done via username and password control, and the requests can be processed either automatically or manually (by the laboratory’s administrator).
The process of booking a session may require the user to define whether they will be controlling the experiment or merely observing it. Alternatively, when appropriate, the user interface itself can allow students to switch the controlling role between them, or even to control the equipment collaboratively (one at a time, or performing functions that do not conflict with each other).
Top
Synchronous communication tools
Communication tools should be present, to ensure that students who are not physically next to each other can exchange all the information needed for the collaborative accomplishment of the experiment’s goals. These tools should also ensure communication between the student and their tutors, as well as the technicians supporting the experiments.
Synchronous communication can range from simple text-based chat to audio, or audio and video links. Whatever the tool being used, the latency of communication can be a problem, in case the network conditions are poor. In particular, audio and video connections in point-to-point mode (relying on applications such as Microsoft’s Netmeeting or Messenger) are found inappropriate, as they require a link to be established between each pair of students, leading to very high bandwidth requirements.
The Flash Communications Server from Macromedia is considered a suitable solution, in that each student merely establishes one connection with a server. Figure 4 shows a client-side interface that sets up audio and video links via the Flash Server, used within the MARVEL EU project (Virtual Laboratory in Mechatronics: Access to Remote and Virtual e-Learning).
file:///D|/dissertation.htm (29 of 160) [03-06-2005 14:50:52]

Dissertation
Figure 4 – A client-side interface to the Flash Communications Server
Top
Conclusions
Laboratory workbenches have changed irreversibly. Remote / mixed experimentation is not a replacement for on-lab file:///D|/dissertation.htm (30 of 160) [03-06-2005 14:50:52]

Dissertation
experimentation or for simulation. Rather, it complements real experimentation, which will remain necessary, both in learning and in professional certification.
There are pros and cons in remote experimentation (as in all other approaches), but its pedagogical potential is huge, in terms of both learning and assessment. There is space for remote experimentation in the learning chain, and the goal should be to provide learning activities with embedded remote experiments, not just remote experiments by themselves.
Networks of remote labs are able to provide a rich multi-cultural environment and widen the resources offered by each university to its students.
Some areas exist where further work is necessary. Namely, authoring tools for instructors are required to facilitate the task of designing the experiment interface panels, as well as to support the production of scripts.
There is also a need for automatic assessment tools that are widely accepted by students and instructors, as well as tools to support the management of interactive resources.
Remote experimentation systems should increasingly address the requirements of users with special needs. This is an area where the remote experience can clearly surpass the on-lab experience.
Finally, the support for formative assessment should be improved, and methods that permit summative assessment should be conceived.
Top
2.2. The PEARL project
This section presents an overview of the PEARL project (Practical Experimentation by Accessible Remote Learning), based on [PEARL 02 , Project summary] and [PEARL ]. Section 2.2.1 describes the motivation behind the project, whereas section 2.2.2 focuses on the project’s objectives. Sections 2.2.3 and 2.2.4 introduce the project’s partners and work plan, respectively. Finally, sections
2.2.5 and 2.2.6 provide an overview of the envisaged system and the four addressed remote experiments.
file:///D|/dissertation.htm (31 of 160) [03-06-2005 14:50:52]

Dissertation
Top
2.2.1. Introduction
Experimental work is a vital component of science and engineering teaching at all levels. The increasing use of multimedia packages or 'virtual science' has much to offer in terms of teaching scientific facts and principles, but does not generally focus on teaching the process of scientific enquiry or engineering practice.
The system developed in the PEARL project delivers practical experimentation where students work together over the Internet (or Campus Intranet), much as they would in a teaching laboratory. They are able to interact with the remote experiment, change parameters and in some cases modify and design experiments. They can discuss their actions and what they anticipate will happen, as well as observe the results and analyse them. The process is real and so has an authenticity and unpredictability that simulations or descriptions can hardly replicate.
PEARL presents an opportunity to widen access to real experiments that might otherwise only be offered to those able to get to a suitably equipped laboratory. Access to laboratory equipment might be restricted for such reasons as disability, geographical location, resource restrictions in an institution, inflexible scheduling, or because it is judged impossible to offer the facility to students in a safe way. The provision of the practical elements of science and engineering courses for students with disabilities is frequently inadequate, and this means that their participation in practical work is often passive or that they are excluded altogether.
The PEARL project (IST-1999-12550) started on March 2000 and was funded by the European Commission for three years, under the Information Society Technology (IST) programme.
Top
2.2.2. Project objectives
The educational and technological objectives of the project are listed below.
file:///D|/dissertation.htm (32 of 160) [03-06-2005 14:50:52]

Dissertation
Top
Educational Objectives
1. To give high quality learning experiences in science / engineering education based on contemporary accounts of science learning.
2. To provide flexibility for studying in terms of time, location, or special needs by bringing the teaching lab to the students.
3. To give students access to expensive and safety critical experimental facilities.4. To extend Internet course delivery to accommodate practical experimentation.5. To provide Internet-based solutions that allow students to collaborate at a distance while conducting experiments.6. To facilitate the learning of science as a process using Computer Based Learning (CBL) systems.
Top
Technological Objectives
1. The system should facilitate collaborative interaction between students.2. The system should facilitate the remote control, observation and measurement of teaching experiments.3. The remote laboratory should have a common control and communications channel for all components and
experimental elements.4. The remote laboratory should have standard (generic) modules from which much of a particular installation /
experiment will be constructed.5. The system should be able to rapidly integrate new items of equipment.6. All features of the system should be made available through the students' and tutors' personal computers (PCs) and
should be accessible to students with special needs.7. The project's educational software should be readily integrated into Web-based courses (with Instructional
Management Systems compliance).
Top
file:///D|/dissertation.htm (33 of 160) [03-06-2005 14:50:52]

Dissertation
2.2.3. The partners
The Open University (UK) led the Project, via their Institute of Educational Technology, Knowledge Media Institute and Faculty of Science. They contributed expertise in the areas of pedagogy and evaluation of educational technology, and the development of educational software and user interfaces to support effective learning.
The Department of Applied Computing at the University of Dundee (Scotland) co-ordinated the system developments and the user interface design in the project. They had prime responsibility for the server architecture and the integration of the collaborative learning environment. The Department of Biochemistry hosted the cellular biology experiment that was implemented in the project.
The Computer Science Department at Trinity College Dublin (Ireland) had a key role in the system development within the project and in the integration of the remotely controlled modules into the laboratory servers. They led the overall specification work, developed the client software, and played a key role in the user interface design.
The Department of Electrical and Computer Engineering, Faculdade de Engenharia da Universidade do Porto (Portugal) had prime responsibility for developing the remote laboratory infrastructure and integrating the chosen control and instrumentation protocols. They implemented the remote digital electronics facility.
Zenon, SA. Robotics and Informatics (Greece) is the industrial automation company that was responsible for the development of two of the remote laboratories. They worked directly with the OU and the UD in developing the mechanical and control engineering aspects of their experimental jigs.
Open University Worldwide (UK) has its expertise in marketing innovative distance learning materials to both the general public and professionals in the fields of education and training. Their role was to lead the market analysis and exploitation work. This aimed at ensuring that the project's developments were commercially focussed from the outset and at planning their subsequent exploitation.
Top
file:///D|/dissertation.htm (34 of 160) [03-06-2005 14:50:52]

Dissertation
2.2.4. Work plan
The PEARL project was organised in three stages. Firstly extensive background research enabled a detailed specification from the pedagogic, user’s needs, market and technical perspectives. The development stage was interactive, with successive mock-ups and prototypes being tested with small groups of students and tutors. The final stage of the project involved validation in various educational contexts, where direct comparisons were made between students undertaking the experimental activity in the traditional way, and students accessing the experiments remotely using the PEARL system
Top.
2.2.5. The PEARL system
Each version of the developed system was implemented on a network of student and tutor PCs connected over the Internet or Intranet to a server located in a remote laboratory. Each server in turn was connected to the control and instrumentation buses, which linked to the experimental apparatus and associated monitoring and measurement equipment.
Templates and guidelines were produced so that tutors could produce the educational software associated with each PEARL experiment. The resulting software was readily integrated into web-based courses and the wider Information Technology (IT) infrastructures of the involved institutions. The approach here was to seek compliance with the Instructional Management Systems (IMS) standards [IMS 05 ].
Each version of the system has an integrated collaborative learning environment, which supports communications between students, and between the students and their tutors and the technicians supporting the experiments.
All the features of the experiments are made available to students and tutors through their PCs. Ease of use of the interactive software is key to the acceptance of the PEARL approach. The project specifically sought to meet the needs of students with disabilities in flexible ways.
The PEARL approach was to create a meta-information layer for all communication between the system and the user. How this information is presented to the user should be dependent on their preferences, abilities and whether they are using any assistive technology with their computer.
file:///D|/dissertation.htm (35 of 160) [03-06-2005 14:50:52]

Dissertation
Top
2.2.6. The remote experiments
Digital Electronics Bench
The University of Porto hosts an experiment in electronic engineering where students are able to construct and test a range of digital circuits on a remote digital electronics bench. The remote laboratory provides a PCI eXtensions for Instrumentation (PXI) system and a hardware module based on field-programmable gate-arrays devices (FPGAs). Figure 5 shows the client interface of the digital electronics bench.
file:///D|/dissertation.htm (36 of 160) [03-06-2005 14:50:52]

Dissertation
Figure 5 – Client interface of the digital electronics bench experiment
Another experiment supported at FEUP consists of programming an 80C51 8-bit microcontroller board in order to carry out a specific task (e.g. to build a simple waveform generator using a D/A converter and a table of digital patterns stored in the microcontroller data memory). Following the design and validation phase, the students are able to upload and run the object code, using the remote oscilloscope to visualize the waveform at the D/A converter output. [PEARL 03b , FEUP labscript].
Top
Cellular Biologyfile:///D|/dissertation.htm (37 of 160) [03-06-2005 14:50:52]

Dissertation
The Department of Biochemistry at Dundee hosts an experiment in cellular biology that uses computer-controlled electron microscopes to conduct cytology studies. The experiments are designed for final year Biochemistry undergraduates. The remote lab has a sample-mounting system and a range of prepared samples ready to view. The students submit some of these samples, whereas others are reference samples. The technician mounts specific samples into the respective microscopes. In a traditional situation, students spend about an hour in the lab being shown samples, but the remote access facility should allow for extended access available over several days and more opportunity for discussion. Figure 6 shows the client interface of the cellular biology experiment [PEARL 03 , The UD experiment].
file:///D|/dissertation.htm (38 of 160) [03-06-2005 14:50:52]

Dissertation
Figure 6 – Client interface of the cellular biology experiment
Top
Visual Inspection
Trinity College Dublin hosts an experiment in Manufacturing Engineering designed to facilitate the training of engineering undergraduates and Line Engineers in remote locations. Visual inspections are conducted on specialised equipment and students are able to manipulate computer-aided design (CAD) data, adjust test conditions, and test PCBs against CAD data.
In the remote laboratory, there is an XY table, flexible lighting heads and platforms, cameras, automatic lenses, computer vision systems and a range of PCBs. The technician needs to set up and configure the experiment in the lab, and is responsible for changing lighting heads, installing CAD files and PCBs and for general maintenance of all the equipment. As part of an eight-week course, the experiment is scheduled to run for three hours per week for each group of students with some additional access negotiated beyond normal hours. Figure 7 shows the client interface of the visual inspection experiment [PEARL 03 , The TCD experiment].
file:///D|/dissertation.htm (39 of 160) [03-06-2005 14:50:52]

Dissertation
Figure 7 – Client interface of the visual inspection experiment
Top
file:///D|/dissertation.htm (40 of 160) [03-06-2005 14:50:52]

Dissertation
Environmental Analysis
The Open University currently provides a series of experiments at the residential schools for its popular foundation science course (S103). From the Summer of 2001 this course had a separate Summer School component (SXR103). The PEARL Project implemented two of the activities from this Summer School remotely. One of the activities uses a spectrometer to provide students with an insight into light spectra. This includes the development of a remote lab system where a wire is dipped into particular chemicals and then inserted in a Bunsen burner. The other activity is more chemistry-orientated, allowing students the opportunity to analyse a number of salts using a range of chemical solutions. This activity also provides an opportunity for students to use a colorimeter.
The development of control and visualisation software for PEARL’s environmental analysis experiments is the subject of this dissertation.
Top
2.3. Summary
This chapter presented an overview of remote experimentation and the PEARL project. The domain of remote experimentation was defined, and its main advantages, scenarios and taxonomy addressed. An outline of pedagogical aspects was provided, addressing the impact on teaching and learning, and a teaching model was suggested. Technological aspects were also covered, such as the automation of laboratory equipment and the support for distribution of contents and synchronous communication. The motivation behind the PEARL project was explained and its partners introduced. The project’s objectives, work plan, and developed experiments were also presented.
The following chapter will provide a specification of the system’s requirements, eliciting the functionality and constraints required for the system and identifying actors, use cases and the relationships between them. The goal of this specification is to describe what the system should do, and to allow the developers and the end-users to agree on that description. Because use cases were developed according to the actors’ needs, the system will be more likely to be relevant to the users. The analysis model of the system will also be presented, that is, a conceptual model of the system’s requirements. The analysis model will be provided as a class diagram, modelling the vocabulary of the system from the point of view of the user and the
file:///D|/dissertation.htm (41 of 160) [03-06-2005 14:50:52]

Dissertation
problem. The aim of this model is obtain a precise understanding of the requirements and to discover classes that model elements in the problem domain. The analysis model will serve as a first approach to a design model. The technological choices made before design and implementation will also be addressed.
Top
3. Requirements and analysis
This chapter describes the workflows for capture and analysis of the project’s requirements. The technological architecture of the system is also introduced. Section 3.1 provides a specification of the system’s requirements and section 3.2 presents the analysis model of the system. Finally, section 3.3 describes the choice of technologies that served as a basis for the system’s design and implementation.
Top
3.1. Requirements
This section provides a specification of the system’s requirements. The goal of the requirements workflow is to describe what the system should do and allow the developers and the end-users to agree on that description. To achieve this, the functionality and constraints required for the system should be elicited, organised and documented. Actors are identified, representing the users (or any other system that may interact with the system being developed), and use cases are identified, representing the behaviour of the system. Because use cases are developed according to the actors’ needs, the system is more likely to be relevant to the users. [Gornik 01 , Core workflows]
Section 3.1.1 presents an overview of the experiments that should be made accessible via the Internet. Sections 3.1.2 to 3.1.4 specify the functional and non-functional requirements of the system. Finally, section 3.1.5 presents the use-case model of the system.
Top
file:///D|/dissertation.htm (42 of 160) [03-06-2005 14:50:52]

Dissertation
3.1.1. Overview of experiments
This section presents an overview of the experiments that should be made accessible via the Internet, mostly based on [PEARL 03 , The OU experiment, pp. 33–36]. Both the light spectra and the wet chemistry experiments are addressed.
Top
Light spectra experiments
In these experiments, the students are first required to set up the light spectrometer. Then, they should examine the spectral signature of sodium, using a sodium lamp as the light source. They should also examine the spectral signature of various metal salts, using as light source the flame of a Bunsen burner, fed partially by a gas jet and partially by one of several bubblers containing metal-salt solutions (or by air, with no bubbler). [Colwell 01 ]
Figure 8 shows the automated apparatus used for light spectra experiments. The central piece is a manual spectrometer (similar to the one used in the Open University courses), comprising a rotating telescope, a refraction device, a Vernier scale and a collimator. This set is placed on a movable platform, so that its collimator may be aligned with different light sources. For the purpose of the experiments, Zenon SA automated this equipment. The system was based on the GALIL DMC-1842, 4-axis, 32-bit motion controller.
file:///D|/dissertation.htm (43 of 160) [03-06-2005 14:50:52]

Dissertation
Figure 8 – Apparatus for light spectra experiments
Figure 9 shows a diagram of the spectrometer device. The light captured by the collimator is diffracted by a grating, so that the observer can rotate the telescope to search for characteristic spectral lines. Figure 10 shows a diagram of the type of device that can be used as a light source (apart from a sodium lamp). The spectrum of the flame produced by the Bunsen burner is determined by the metal salt placed inside a bubbler.
file:///D|/dissertation.htm (44 of 160) [03-06-2005 14:50:52]

Dissertation
Figure 9 – Diagram of spectrometer device
Figure 10 – Diagram of bubbler and Bunsen burner
The following functions were implemented:
a) rotation of the telescope, via motorisation;
b) adjustment of the collimator’s focus, via motorisation;
c) adjustment of the width of the collimator’s slit, via motorisation;
file:///D|/dissertation.htm (45 of 160) [03-06-2005 14:50:52]

Dissertation
d) horizontal positioning of the spectrometer, via motorisation of the movable platform it is placed on; and
e) selection of a metal-salt solution bubbler, via control of gas-supply valves.
In addition to the above-described hardware, Zenon SA have also developed a software control component, namely a Windows ActiveX control. This control serves as an application-programming interface (API) to support the development of software for higher-level control of the spectrometer equipment and its specification is provided in annex A .
Top
Wet chemistry experiments
In the reagent test experiment, the students are first required to observe the reactions between each one of six metal-salt solutions and each one of four reagents. Then, the students should observe the reactions between an unknown (randomly chosen) metal-salt solution and each one of the four reagents, in order to identify the solution.
In the colorimeter test experiment, the students are first required to calibrate a colorimeter device. This involves loading the colorimeter firstly with a cuvette containing deionised water and then with a cuvette containing an aluminium solution of known concentration. Finally, the students should repeat these steps to measure the concentration of an unknown (randomly chosen) aluminium solution. [Colwell 02 ]
Figure 11 shows the layout of the area used for the wet chemistry experiments. Zenon SA developed the apparatus needed for this experiment. The central piece is an Eshed Scorbot ER V+ robotic manipulator. In the case of the selected experiments, this manipulator has been programmed to:
file:///D|/dissertation.htm (46 of 160) [03-06-2005 14:50:52]

Dissertation
Figure 11 – Layout of area for wet chemistry experiments
a) load new trays and cuvettes from their respective source containers to the work area;
b) dispose used trays and cuvettes to the disposal container;
c) shake trays and cuvettes;
d) load and unload the colorimeter with cuvettes from the work area;
e) operate functions of the colorimeter; and
file:///D|/dissertation.htm (47 of 160) [03-06-2005 14:50:52]

Dissertation
f) operate automated pipettes, to dispense chemicals from their source containers into the tray’s wells and cuvettes.
Figure 12 and Figure 13 show the apparatus for wet chemistry, namely: the Scorbot manipulator; the experiment’s entire frame (the manipulator’s controlling hardware can be seen under the work area); and a detail with the automated pipettes in the foreground.
Figure 12 – Scorbot manipulator and apparatus for wet chemistry experiments
file:///D|/dissertation.htm (48 of 160) [03-06-2005 14:50:52]

Dissertation
Figure 13 – Detail of the apparatus for wet chemistry experiments
In addition to the above-described apparatus, Zenon SA also developed a Windows ActiveX control, to be used as an API. The specification of this control is provided in annex A .
Top
3.1.2. Minimum functional requirements
This section specifies the minimum functional requirements that the system should meet. Functional requirements are statements about services that the system should provide, how the system should react to particular inputs, and behave in particular situations [Sommerville 00 , Software requirements].
file:///D|/dissertation.htm (49 of 160) [03-06-2005 14:50:52]

Dissertation
This section specifies the minimum functional requirements that the system should meet. Firstly, two general requirements regarding the remote users are defined. Then, the requirements specific to the execution of the remote experiments are addressed. This covers the light spectra experiment and the two wet chemistry sub-experiments, namely the reagent test and the colorimeter test. Finally, the requirements related with the laboratory technician’s tasks are presented.
Top
Remote users
a) The users shall be able to control the automated laboratory equipment across the Internet; and
b) the users shall be able to monitor the experiment being carried out across the Internet; this shall be achieved via up to three video streaming channels.
Top
Light spectra experiment
The users shall be able to perform all the actions necessary to set up the spectrometer, and to examine the spectral signatures of sodium and of an unknown metal salt. These actions are described in detail in the electronic annex B.1, and involve aligning the collimator with the appropriate light source, aligning the telescope with the collimator, adjusting the collimator’s focus and slit width, rotating the telescope, and selecting the appropriate bubbler.
Top
Wet chemistry reagent test experiment
The users shall be able to perform all the actions necessary to observe all possible chemical reactions and identify an unknown metal. These actions are described in detail in the electronic annex B.2, and involve loading a tray to the work area, dispensing metal salt solutions (chosen or random) and reagents into the wells of the tray, shaking the tray, observing changes in the solutions, and disposing of the loaded tray.
file:///D|/dissertation.htm (50 of 160) [03-06-2005 14:50:52]

Dissertation
Top
Wet chemistry colorimeter experiment
The users shall be able to perform all the actions necessary to calibrate the colorimeter and measure an unknown aluminium concentration. These actions are described in detail in the electronic annex B.3, and involve loading cuvettes to the work area, dispensing deionised water, aluminium solutions or reagents into the cuvettes, loading and unloading a cuvette into / from the colorimeter, pressing the colorimeter’s Test or Reference button, observing the reading on the colorimeter, shaking a cuvette, and disposing of loaded cuvettes.
Top
Laboratory technician
The laboratory technician shall be able to:
a) configure the control service offered via the Internet, namely its control and connection parameters; the control parameters shall allow fine-tuning of the control actions requested by the users (e.g. how many millimetres the collimator’s focus shall shift when a user requests a
“coarse” adjustment);
b) operate the server-side software, namely initialise the experiment’s hardware and start and stop the control service;
c) configure the video transmission, namely its capture, processing and connection parameters; and
d) operate the video transmission, namely start it and stop it.
Top
3.1.3. Optional functional requirements
file:///D|/dissertation.htm (51 of 160) [03-06-2005 14:50:52]

Dissertation
This section presents a number of functional requirements that are not considered essential in the scope of this work, but may be implemented to widen the functionality made available to the users. Namely:
a) the client-side software should be able to work both as a stand-alone application and as an applet within a web browser – this would free the users from installing an application on the client side;
b) the connections between the client-side and the server-side software should require little or none client-side network configuration, such as opening of specific ports in firewall machines – ideally, remote users located e.g. at an university’s Local Area Network (LAN)
should not be required to contact the institution’s IT services; and
c) in case the network conditions cause the loss of video frames, the light spectra version of the system should ensure that the student will not miss any spectral lines, while executing rotations of the telescope – this would ensure that poor network conditions would interfere as
little as possible with the experiment being carried out.
Top
3.1.4. Non-functional requirements
This section specifies the non-functional requirements that the system should meet. These are constraints on the functional requirements specified previously under sections 3.1.1 and 3.1.2 , namely services or functions offered by the system. [Sommerville 00 , Software requirements]
Several product requirements are presented, namely related with accessibility, performance, portability, reusability and documentation. Then, organisational requirements related with the software implementation are defined. Finally, an interoperability requirement is addressed.
Top
Product’s usability and accessibility
file:///D|/dissertation.htm (52 of 160) [03-06-2005 14:50:52]

Dissertation
A number of features should be present in the client application’s GUI to support access by students with disabilities. The following account is based on [PEARL 03 , The OU experiment, pp. 17–19].
For all users requiring specific display settings (including partially-sighted users), under the MS Windows operating system (OS), the GUI should inherit the display settings pre-set by the user.
For partially sighted users:
a) it should be possible to increase the video feeds to a specific size and reset them to the original size, to enable the user to see more detail if required; and
b) progress bars should be provided next to every button (rather than using just one bar for all buttons), to provide an indication of the status of each control request; thus, users of screen-magnification software (who may have only a small area of the screen magnified) will
not have to spend time searching for the progress bar.
For keyboard users (including blind users):
a) keyboard shortcuts should be provided for all controls, to allow full operation the interface exclusively via the keyboard; and
b) users should be informed of the shortcut keys by the text labels on the control buttons themselves, e.g. by including it in parenthesis.
For blind users:
a) text labels accessible to screen-reading software (including information on shortcut keys) should be provided for all controls; this should be compatible at least with Java-enabled screen-readers for the MS Windows OS, such as Freedom Scientific JAWS and Ai Squared
ZoomText Xtra;
b) access to a status field should be provided via a keyboard shortcut; this field should contain information on the status of the last control request (e.g. “requested” or “completed”) and readable by screen-reading software;
c) a facility for reading the angle of the telescope should be provided, which should also be accessible via a keyboard shortcut and file:///D|/dissertation.htm (53 of 160) [03-06-2005 14:50:52]

Dissertation
readable by screen-reading software (in the same way as the status field); and
d) auditory feedback should be provided as an equivalent to the progress bars, e.g. by using ‘beeps’ with different tones for each status.
Top
Product’s efficiency and performance
The video streaming connection between the client-side and the server-side software should not imply unrealistic bandwidth requirements. Broadband connections at 512 kilobits per second provided by Internet Service Providers (ISPs) should allow good video quality, in terms of both resolution (160×240 pixels or more) and frame-rate (5 frames per second or more).
Top
Product’s portability
As far as possible, the software components of the system should be able to run on different OSs, like MS Windows, Apple Mac OS X, Linux distributions and other Unix-based systems. The effort to meet this requirement shall consist of using the Sun’s Java programming language whenever possible, as stated by the implementation requirement defined below.
Top
Product’s reusability
The developed software components should be easily reusable to suit other experiments that may need to be made accessible via the Internet. This requirement should be met by programming the software in an object-oriented fashion. In particular, the software developed for light spectra experiments should be, as far as possible, reused in the development of the software for wet chemistry experiments.
Top
file:///D|/dissertation.htm (54 of 160) [03-06-2005 14:50:52]

Dissertation
Product’s documentation
The developed software should be delivered with an accompanying user’s guide, describing all the necessary steps for installation, configuration and operation of the various components.
Top
Implementation
The software components of the system should be developed in Sun’s Java programming language, except when usage of another language (e.g. C/C++) proves to be absolutely required; and
the remote control of the experiments’ equipment shall be achieved via a CORBA bridge across the Internet.
Top
Interoperability
The system shall make use of the low-level access software developed by Zenon SA, to allow control of automated laboratory equipment that suits light spectra and wet chemistry experiments. This software consists of two ActiveX controls.
Top
3.1.5. Use cases
This section presents a number of Unified Modelling Language (UML) use-case diagrams that capture the functional requirements of the system, specified previously under sections 3.1.2 and 3.1.3. More specifically, these diagrams model the functionality of the system as seen by the users, specifying the context of the system: whom it interacts with and for which purposes. They show actors (types of users), use cases (depicted as ellipses) and relationships between actors and use cases, in order to show what the system is used for, ignoring the way it is organised internally. Relationships may also exist between use cases, such as generalisations and inclusions (shown as arrows). Generalisations have the same meaning as in
file:///D|/dissertation.htm (55 of 160) [03-06-2005 14:50:52]

Dissertation
class diagrams, whereas an inclusion relationship means that a given use case inevitably implies another use case. [Faria 01 , Diagramas de casos de uso]
Firstly, a use-case diagram of the overall system is presented, along with a sequence diagram specifying the normal succession of the main use cases. Then, specific use-case diagrams are provided, respectively, for the light spectra, reagent test and colorimeter test experiments.
Top
Remote users and laboratory technician
Figure 14 shows the use-case diagram of the overall system.
file:///D|/dissertation.htm (56 of 160) [03-06-2005 14:50:52]

Dissertation
Figure 14 – Use case diagram of the overall system
The use cases depicted in this diagram model the functional requirements specified previously under section 3.1.2 both for remote users and for the laboratory technician.
The laboratory technician can configure and operate both the video transmission and the control service available to the remote users. Operating either the video transmission or the control service requires prior configuration. Configuration of the video transmission applies to: the image capture from the video camera; the processing of the captured image to create a video stream; and the transmission of that stream. Operation of the video transmission consists of starting and stopping it. Configuration of the control service applies to the control parameters and to the connection parameters. Operation of the control service consists of initialising the hardware and starting and stopping the service. In addition, the laboratory technician can do everything that a remote user can do.
A remote user can connect to the server-side software, in order to receive video and control the experiment’s equipment. The actual control of equipment is represented as a hierarchy of use-case packages, which will contain different use cases for light spectra and for wet chemistry experiments, as described in the next three sections.
file:///D|/dissertation.htm (57 of 160) [03-06-2005 14:50:52]

Dissertation
Figure 15 shows an UML sequence diagram that specifies the normal temporal sequence of the main use cases. UML sequence diagrams show the interaction (that is, the sequence of messages exchanged) between different objects in a given context, such as a use case or an individual operation. This type of diagram emphasises communication and passing of control between objects over time (as opposed to collaboration diagrams, which emphasise the organisational structure of objects). [Faria 01 , Diagramas de sequência]
Figure 15 – Sequence diagram of the main use cases
file:///D|/dissertation.htm (58 of 160) [03-06-2005 14:50:52]

Dissertation
The laboratory technician must first configure both the control service and the video transmission (these steps need not be carried out at all times, but only when any parameters need to be changed). Then, the technician should start both the control service and the transmission of video. At this point, one or more remote users can connect to the server-side software, to start receiving video and controlling the experiment’s equipment. When the server-side software is no longer needed, the technician can stop it fully.
Top
Light spectra experiments
Figure 16 shows the use-case diagram for the use-case package of the light spectra experiment.
file:///D|/dissertation.htm (59 of 160) [03-06-2005 14:50:52]

Dissertation
Figure 16 – Use case diagram of the light spectra experiment
Following the functional requirements described previously under section 3.1.2 , the remote user can select a light source, file:///D|/dissertation.htm (60 of 160) [03-06-2005 14:50:52]

Dissertation
namely the sodium lamp or the Bunsen burner. If the burner has been selected, the user can select one of three different bubblers or no bubbler (air). The user can adjust the collimator’s slit width to be narrower or wider. The user can adjust the collimator’s focus or rotate the telescope, in both directions, in coarse, medium or fine steps. In addition, the user can rotate the telescope to its home position or provide a customised value in degrees to perform a relative rotation.
Top
Wet chemistry reagent test experiment
Figure 17 shows the use-case diagram for the use-case package of the reagent test experiment.
file:///D|/dissertation.htm (61 of 160) [03-06-2005 14:50:52]

Dissertation
Figure 17 – Use case diagram of the wet chemistry reagent test experiment
Following the functional requirements described previously under section 3.1.2 , the remote user can control a tray, namely load it to the work area, shake it and dispose of it. The user can also dispense chemicals to the wells of the tray loaded to the work area, namely: all metal salts, one into each well; a randomly chosen metal salt into four wells; and ammonia solution, sodium iodide, dilute sulphuric acid or chromazurol S, either into all six wells or respectively into wells #1, #2, #3 and #4.
Top
Wet chemistry colorimeter test experiment
Figure 18 shows the use-case diagram for the use-case package of the colorimeter test experiment.
file:///D|/dissertation.htm (62 of 160) [03-06-2005 14:50:52]

Dissertation
file:///D|/dissertation.htm (63 of 160) [03-06-2005 14:50:52]

Dissertation
Figure 18 – Use case diagram of the wet chemistry colorimeter test experiment
Following the functional requirements described previously under section 3.1.2, the remote user can control test cuvettes, namely load a test and a reference cuvette to the work area, shake the test cuvette of both cuvettes and dispose of the test cuvette or both cuvettes. The user can dispense chemicals, namely: chromazurol S into both cuvettes or the test cuvette; aluminium solution (of any one of five different concentrations or of a randomly chosen concentration) into the test cuvette; and deionised water into the reference cuvette. The user can also control the colorimeter, namely load it with either one of the cuvettes placed on the work area, perform reference and test measurements and unload the cuvette being tested back to the work area.
Top
3.2. Analysis
This section presents the analysis model of the system, which is part of its logical architecture. This is a conceptual model (independent of implementation and technology) of the system’s requirements. The aim is to obtain a precise understanding of the requirements and the focus is on discovering classes that model elements in the problem domain. The analysis model serves as a first approach to a design model. [Jacobson 99b , A use-case-driven process]
The analysis model is presented in Figure 19 as a class diagram. An analysis class diagram models the vocabulary of the system, from the point of view of the user and the problem (as opposed to the point of view of the developer and the solution, which is relevant only in the design workflow). Classes are descriptors for sets of objects that share the same properties (attributes, operations, relationships, etc.), and are depicted by rectangles. Each class is described by its name and by optional lists of attributes and operations. Public or private operations are preceded with a plus or minus sign, respectively. Different types of relationships can exist between the classes, namely association, aggregation, composition and generalization. Relationships have associated multiplicities, which define the number of objects that can be instantiated on each side of the relationship. [Faria 01 , Diagramas de classes]
file:///D|/dissertation.htm (64 of 160) [03-06-2005 14:50:52]

Dissertation
Figure 19 – Analysis class diagram of the system
This diagram represents the first, simplest level of design of the internal structure of the system, pointing out the main classes of software components that will be needed. The use cases described previously under section 3.1.5 are now divided into groups, as operations of classes. To simplify the diagram, only the main use cases are represented (e.g. +select light source()) and the more specific ones are left out (e.g. the “sodium lamp” and “Bunsen burner” options for light source selection).
Thus, the hierarchy of use-case packages associated with the remote user becomes the collection of operations in a hierarchy of client classes, represented by generalization relationships. This reflects the fact that different operations are needed in different experiments; only the connection and video-reception operations are common to all experiments. The use cases
file:///D|/dissertation.htm (65 of 160) [03-06-2005 14:50:52]

Dissertation
associated with the laboratory technician become operations of a control server class and of a video transmitter class. The multiplicities of the associations between the client and the server-side classes indicate that one or more instances of the client can be connected to one particular instance of the control server. In addition, each instance of the client can be connected to up to three instances of the video transmitter.
Top
3.3. Technological architecture
The analysis workflow addressed in the previous section led to a conceptual, technology-independent model of the system. This section describes the choice of technologies that served as a basis for the system’s design and implementation (addressed in the next two chapters).
It was decided to develop part of the control server as a Microsoft’s Visual C++ application, namely the functionality responsible for embedding each of the ActiveX controls provided by Zenon SA. The methodology for embedding ActiveX controls in C++ code, using the Microsoft Foundation Classes (MFC) library, is well documented in [Microsoft ].
Sun’s Java was chosen as the implementation language for all the remaining functionality of the system, to meet the system’s implementation and portability requirements. This included the higher-level functions of the control server, and the complete video transmitter and client components.
The CORBA was chosen as the underlying technology for all the control connections between the system’s main components, in order to meet the system’s implementation requirements. The CORBA is a vendor-independent architecture and infrastructure specified by the OMG, which computer applications can use to work together over networks. Using the standard Internet Inter-
ORB Protocol (IIOP), a CORBA-based program from any developer, on almost any computer, operating system, programming language,
and network, can interoperate with a CORBA-based program from the same or another developer, on almost any other computer, operating
system, programming language, and network [OMG ]. The ORBacus API from IONA Technologies was chosen to support the coding of all
the necessary CORBA bridges. ORBacus is an implementation of the CORBA standard that can be used with both C++ and Java.
file:///D|/dissertation.htm (66 of 160) [03-06-2005 14:50:52]

Dissertation
Finally, the Java Media Framework (JMF) API from Sun was chosen for the coding of the video-transmission functionality of the system. This includes the capture, processing, and transmission of video done by the video transmitter, as well as the reception and displaying of video on the client side. The JMF is an optional package, which enables audio, video and other time-based media to be added to applications and applets built on Java technology. JMF’s components can capture, playback, stream, and transcode multiple media formats, providing a powerful toolkit to develop scalable, cross-platform technology [Sun 99 ].
Top
3.4. Summary
This chapter provided a specification of the system’s requirements, eliciting the functionality and constraints required for the system and identifying actors, use cases and the relationships between them. The goal of this specification was to describe what the system should do, and to allow the developers and the end-users to agree on that description. Because use cases were developed according to the actors’ needs, the system is more likely to be relevant to the users. This chapter also presented the analysis model of the system, which is a conceptual model of the system’s requirements. The analysis model was provided as a class diagram, modelling the vocabulary of the system from the point of view of the user and the problem. The aim of this model was to obtain a precise understanding of the requirements and to discover classes that model elements in the problem domain. The analysis model serves as a first approach to a design model. Finally, the technological choices made prior to design and implementation were addressed.
The following chapter will present the design model of the system, developed during the design workflow of the project. In conjunction with the analysis workflow, the aim of the design workflow is to model a system that fulfils all its requirements, and is structured to be robust. The design model will act as a 'blueprint' of how the source code should be structured and written, and will show how the system should be realized in the implementation workflow. The overall design model of the system will be described, as well as the design models of the system’s individual components, namely the hardware server, the control server, the video transmitter and the client.
Top
file:///D|/dissertation.htm (67 of 160) [03-06-2005 14:50:52]

Dissertation
4. Design
This chapter presents the design model of the system, developed during the design workflow of the project. In conjunction with the analysis model presented previously under section 3.2, the design model is part of the logical architecture, which defines how the system should be realised in the implementation workflow (in turn, the implementation model addressed in chapter 5 constitutes the system’s physical architecture). The aim is to model a system that: fulfils all its requirements, in particular performing (in a specific implementation environment) the tasks and functions specified in the use-case descriptions (presented previously under section 3.1); and is structured to be robust (easy to change if and when its functional requirements change). The design model serves as an abstraction of the source code; that is, the design model acts as a 'blueprint' of how the source code is structured and written. The design model consists of design classes, which may be structured into design packages and design subsystems, representing what will become components in the implementation. The model also contains descriptions of how objects of these design classes collaborate to perform use cases. [Gornik 01 , Core workflows]
Section 4.1 describes the overall design model of the system. Sections 4.2 to 4.5 describe the design models of the individual components, namely the hardware-access server, the control server, the video transmitter and the client.
For simplicity, the hardware-access server component will hereafter be referred to as the “hardware server”. However, it should be noted that this component does not implement the functions that directly access the hardware, which are part of the ActiveX controls developed by Zenon.
Top
4.1. Overall design
This section describes the design model of the overall system. Section 4.1.1 presents the design class diagram of the system, and describes its basic operations (that is, those operations involved in configuring and initialising the system). A dynamic diagram that models the connection use case is provided. Section 4.1.2 describes the experiment-control operations of the system (that is, those operations involved in remotely controlling the hardware of the light spectra and wet chemistry
file:///D|/dissertation.htm (68 of 160) [03-06-2005 14:50:52]

Dissertation
experiments), providing a dynamic diagram that models the behaviour of control operations.
Top
4.1.1. Basic operations
Figure 20 shows the design-level class diagram of the system. This diagram defines vocabulary of the system from the developer’s perspective [Faria 01 , Diagramas de classes].
Figure 20 – Design-level class diagram of the system
An important difference in relation to the analysis-level diagram shown in Figure 19 (page 37 ) is the division of the so-called control server into a control server and a hardware server. This design follows Zenon’s recommendations and allows greater flexibility and security, as the servers (being separate components at the highest level of abstraction) may run as separate applications on separate computers. That is, the computer connected to the Internet is not necessarily the same as the computer connected to the hardware.
file:///D|/dissertation.htm (69 of 160) [03-06-2005 14:50:52]

Dissertation
Another main difference in relation to the analysis model is that not only the client, but also the control server and the hardware server are divided into subclasses. This shows how the need for distinct control actions for different types of experiments (light spectra and wet chemistry) must not only affect the client application, but also propagate to the other components of the system.
Finally, the control server and the video transmitter are now associated by a control connection. This reflects the need for the server to retrieve information on video port numbers from the video transmitter, to be provided to the connecting clients, as will be described in detail under section 4.1.1.
The client, the video transmitter and the control server components will be developed (that is, designed and implemented) in Java language. The hardware server component will be developed in C++ language, in order to be able to embed the hardware-access ActiveX controls provided by Zenon SA. All the control connections represented in the diagram will be developed as CORBA bridges (between components programmed in either the same or different languages). Moreover, the video connection between the client and video transmitter instances will be based on the JMF optional package from Sun. Table 2 defines the basic operations that must be supported by the classes of the system.
component operationsGUI control
video transmitter +configure capture()+configure processing()+configure transmission()+start / stop transmission()
+connect / disconnect VT()+connect video()
client generic -init()
spectra *
chemistry *
control server generic +configure connection()+connect / disconnect VTs()+connect / disconnect HAS()+start / stop service()
+connect control()
file:///D|/dissertation.htm (70 of 160) [03-06-2005 14:50:52]

Dissertation
spectra +configure control()+home hardware()
*
chemistry +configure control()+select experiment()+abort & clear()+reset experiment setup()
*
hardwareserver
generic +emergency stop() +connect / disconnect HAS()spectra +select mode() +home hardware()
*chemistry +select mode() +abort & clear()
+reset experiment setup()*
Table 2 – Operations of the system’s components
The content of this table represents an expansion and a refinement of the set of analysis-level operations defined in Figure 19 . For all components, the operations are divided into GUI operations (which are manually triggered by the user via the component’s GUI) and control operations (which are triggered either internally – that is, programmatically – or by another component of the system). For each component, a distinction is made between generic operations, and operations that are specific to either the light spectra or the wet chemistry experiment.
The +configure control() operation of the control server is now specific of the type of experiment (light spectra or wet chemistry), as different sets of configurable parameters are involved (as will be described in the next section).
A +select experiment() operation is defined for the chemistry control server, to allow selection of the appropriate wet chemistry test (reagent test or colorimeter test).
The +connect / disconnect VTs() operation should be triggered by the laboratory technician and allows the control server to determine which video transmitter instances are actually running and to retrieve information from them about video port numbers, to be later provided to the connecting clients. This operation simply invokes an individual operation with the same name, on each video transmitter. Alternatively, the technician may choose to run the server deliberately disconnected from any video transmitter instances, in which case the client is still able to control the experiment’s hardware (even though no
file:///D|/dissertation.htm (71 of 160) [03-06-2005 14:50:52]

Dissertation
video feeds will be available). This mechanism allows some flexibility, in that the technician will be able to run a client locally while keeping the video cameras and transmitters switched off, for example to control the hardware while the control parameters of the server are being tuned.
Similarly, the +connect / disconnect HAS() operation allows the laboratory technician to connect and disconnect the control server and the hardware server. This operation simply invokes an operation with the same name, on the hardware server. This mechanism also allows some flexibility and security, as the technician may, if needed, temporarily block the hardware control from the clients while allowing them to stay connected to the control server.
The +initialise hardware() operation is now represented by the +home hardware() operation of the spectra control server, and by the +abort & clear() and +reset experiment setup() operations of the chemistry control server. These operations simply invoke operations with the same name, on the hardware server.
The +select mode() operation of the hardware server is specific of the type of experiment. It allows the technician to switch the hardware server to a test mode of operation. In this mode, the server does not actually control the hardware; instead, its GUI displays the simulated statuses of the controlled parts of the apparatus (like the positions of motorised parts, the statuses of controlled gas valves, etc.). The delays inherent to execution of the control operations are also simulated.
The +emergency stop() operation of the hardware server allows the laboratory technician to stop all mechanical activity of the experiment’s apparatus, in an emergency situation. However, the recommended method to achieve such an emergency stop is to use the physical emergency button provided for that purpose on each experiment’s apparatus. In fact, the +emergency stop() operation simply provides a programmatic way to achieve a stop, therefore it relies on proper functioning of the hardware-access drivers. In contrast, the emergency button is directly connected the hardware, therefore being less prone to failure.
The +connect() and +receive video() operations, previously defined (at the analysis level) for the client component, are now represented by the client’s -init() operation. This operation is automatically executed upon initialisation, and invokes the +connect control() and +connect video() operations defined, respectively, for the video transmitter and the control server.
The asterisks on the table represent the experiment-control operations of the system, which are specific of the type of experiment and are described in detail in the next section.
file:///D|/dissertation.htm (72 of 160) [03-06-2005 14:50:52]

Dissertation
Figure 21 shows a sequence diagram of the connection use case of the system. This type of diagram is similar to the one shown in Figure 15 (page 32 ), but more detailed. Different types of arrows can be used to represent distinct types of messages, for example synchronous messages (in which the emitter waits for a response from the receiver), synchronous responses, asynchronous messages and data messages. [Faria 01 , Diagramas de sequência]
The diagram in Figure 21 represents the normal sequence of calls to basic operations that establish the connections between the various components of the system (that is, between the instances of the classes defined in Figure 20, page 42 ). Once the represented sequence is completed, the system is ready to process experiment-control operations requested by the client, as described in the next section.
file:///D|/dissertation.htm (73 of 160) [03-06-2005 14:50:52]

Dissertation
Figure 21 – Sequence diagram of the connection use case
First, the laboratory technician connects the control server both to the video transmitter instances and to the hardware server. The video-transmission port numbers are retrieved from the transmitters and stored in the control server. For simplicity, only one video transmitter is depicted in the diagram. Then, the technician issues a command from the control server to initialise the hardware. In the represented case, the +home hardware() operation (specific of the light spectra experiment) is called. At this point, the server-side components (control server and video transmitter) are ready to accept connections from client instances. For simplicity, only one client connection is depicted in the diagram.
Upon initialisation, the client automatically connects to the control server, thus providing its address (which the server adds to a list displaying all the currently connected clients), and receiving in return the Internet Protocol (IP) addresses and port numbers of the video transmitters instances. The client then sends an asynchronous message to each video transmitter, containing its address and the appropriate video-reception port numbers. At this point, the client starts to listen (wait) for the incoming video streams. Upon reception of the client request, each video receiver starts to transmit a video stream to the client. The establishment of the video connection will be described in greater detail under section 4.5.2, once the internal structures of both the video transmitter and the client have been described.
As explained, only one instance of the client component and one instance of the video transmitter component are represented in the diagram, although an arbitrary number of clients, and up to three transmitters, may be involved. This is the reason why the action of listening for / receiving the video stream (on the client) and the action of transmitting the video stream (on the transmitter) are represented in execution threads separate from each component’s main thread. Indeed, each given client can receive up to three video streams (and thus need up to three receiving threads) and, similarly, each given transmitter can transmit an arbitrary number of streams (each from a separate thread).
Top
file:///D|/dissertation.htm (74 of 160) [03-06-2005 14:50:52]

Dissertation
4.1.2. Experiment-control operations
The client’s GUI provides a number of buttons that allow the user to remotely control the experiment hardware. The operations that handle the clicking of these buttons (called button-handlers) correspond to a high level of abstraction, easy to understand by the user. For example, a button can allow to perform a coarse rotation of the spectrometer’s telescope to the left. Each one of these operations is translated inside the client into a remote invocation of one of the control server’s operations, which are accessible across the Internet. Each remote invocation passes appropriate values as parameters. For example, the coarse rotation button-handlers may invoke a certain server operation with a parameter value corresponding to ten degrees, while the fine rotation button-handlers may use a value of only one degree. Furthermore, the control server’s operations are translated inside the server into invocations of one or more of the hardware server’s operations, which that are accessible across the server-side local network. For example, an operation to dispense several salt solutions into a number of containers may cause the control server to call several times the same low-level operation on the hardware server, using different low-level parameters.
The following three tables show the mapping of operations across the client and the two servers, respectively for the light spectra experiment and the two sub-types of wet chemistry experiments. The need for three different tables reflects the fact that the experiment-control operations provided in the client and servers are experiment-specific. The names of the button-handler operations simply identify the various client GUI’s buttons. In turn, the control server’s operations are defined as Java language method prototypes, and the hardware server’s operations are defined as C++ method prototypes.
Table 3 shows the mapping of operations for the light spectra experiment. [Colwell 01 ]
file:///D|/dissertation.htm (75 of 160) [03-06-2005 14:50:52]

Dissertation
Table 3 – Mapping of operations for the light spectra experiment
As would be expected, the button-handler operations shown here (that is, the operations available to the user) bear a direct relation with the hierarchy of use cases presented in Figure 16 (page 33 ).
It can be seen that most of the control server’s methods accept certain labels (listed in the parameter-value labels column) as their parameter values. Inside the server, these labels are evaluated to actual values that can be configured. Thus, for example, the telescope rotate left coarse button on the client triggers a remote call of the telescope_rotate_relative(rotation)
file:///D|/dissertation.htm (76 of 160) [03-06-2005 14:50:52]

Dissertation
method on the control server, using the LEFT_COARSE label as the rotation parameter value. Then, on the server, this label is evaluated to whatever value has been configured for it (e.g. 10.0 degrees). It should be noted that the control server’s methods also accept explicit values, not just configurable labels, to allow greater flexibility of the developed software. For example, the telescope rotate relative angle button on the client also triggers a remote call of the telescope_rotate_relative(rotation) method on the control server, but explicitly uses whatever value has been provided by the user as the rotation parameter value (e.g. 25.0 degrees). In fact, the configurable labels are simply Java constants corresponding to predefined values that lie outside the normal range accepted by each operation, so as to be easily distinguished by the control server and thus properly evaluated.
Figure 22 shows an activity diagram of the client’s operations for relative rotation of the telescope, in the context of the light spectra experiment. Activity diagrams are essentially flow-charts that support concurrence. An activity diagram breaks up an activity into sub-activities (that is, lower-level activities), and the control flow between those sub-activities may be either sequential or concurrent. The activity being described may be a use case, a group of related use cases, an operation of a class, or a part of a higher-level activity. An activity diagram may be divided into vertical swim-lanes, each one containing the sub-activities undertaken by a given object. Activity diagrams are more powerful than sequence diagrams, as they allow representing alternative control flows and cycles. [Faria 01 , Diagramas de actividade]
file:///D|/dissertation.htm (77 of 160) [03-06-2005 14:50:52]

Dissertation
Figure 22 – Activity diagram of the client’s operations for relative rotation of the telescope
Clicking a relative-rotation button on the client’s GUI triggers a remote call to the +telescope_relative_rotation() operation file:///D|/dissertation.htm (78 of 160) [03-06-2005 14:50:52]

Dissertation
of the control server. This diagram applies to any one of the six relative-rotation buttons (left and right; coarse, medium and fine), as these merely correspond to different values of the rotation parameter of the server’s operation (for example, a left coarse rotation may correspond to a rotation value of -10.0 degrees). The control server then checks whether the passed rotation value is a parameter-value label (that is, a predefined value that lies outside the normal range of rotations) or an explicit value (a value inside the normal range of rotations). If the value is a label (e.g. -1000.0), the server evaluates it by consulting the appropriate configuration data (where the label -1000.0 is associated e.g. to an actual value of -10.0 degrees). If the value is explicit (e.g. -10.0 degrees), the server dispenses with the evaluation and directly calls the +AngRelMov() operation of the hardware server, across the laboratory’s local network. The hardware server executes the +AngRelMov() operation – the one that actually causes the telescope motor to be operated – and returns a code to the control server. The control server analyses the returned code. If an error occurred, the code is converted (evaluated) to a meaningful description, which is returned to the client, to be displayed on the GUI; if no error occurred, the control server calls the +AngRelMov() operation of the hardware server, which returns the current position of the telescope. The control server finally returns the position value to the client, which displays it on the GUI. This mechanism allows the user to confirm that the control operation was executed as expected, since the final status of the apparatus (in this example, the final position of the telescope) is read from the hardware before the operation returns.
It should be noted that basically all the operations of the hardware server correspond to direct calls to the public methods of the hardware-access ActiveX control, provided by Zenon SA for the light spectra experiment, having exactly the same names and sets of parameters. The only exception to this is the ValvesSwitchTo() operation, which will be described in detail under section 4.2.1. The hardware server embeds Zenon’s ActiveX control, which (from the point of view of the software developed in this project) constitutes the component that is closest to the hardware. The specifications of all the public methods of this ActiveX control (including the meanings and value ranges of their parameters) are provided for reference in annex A .
The remaining operations of the light spectra client involve both sub-activities and control flow that are, in essence, identical to the ones depicted in Figure 22 . Table 4 and Table 5 show the mapping of operations for the two wet chemistry tests, namely the reagent test and the colorimeter test. [Colwell 02 ]
file:///D|/dissertation.htm (79 of 160) [03-06-2005 14:50:52]

Dissertation
Table 4 – Mapping of operations for the reagent test experiment
file:///D|/dissertation.htm (80 of 160) [03-06-2005 14:50:52]

Dissertation
Table 5 – Mapping of operations for the colorimeter test experiment
The button-handler operations shown in the two previous tables bear a direct relation with the hierarchies of use cases presented in Figure 17 (page 34 ) and Figure 18 (page 35 ), respectively for the reagent test and the colorimeter test.
All the operations of the wet chemistry client involve sub-activities and control flow that are, in essence, identical to the
file:///D|/dissertation.htm (81 of 160) [03-06-2005 14:50:52]

Dissertation
ones depicted in Figure 22 for a light spectra operation. Most of the control server’s methods accept parameter-value labels, which are evaluated inside the server, by the mechanism already described for the light spectra experiment.
It can be seen that almost all control server’s operations again perform a direct call to a hardware-server’s operation with the same name and parameters. The exceptions are the control server’s operations prefixed with HL (which stands for high-level). These higher-level operations perform several calls to a given operation of the hardware server, in order to condense in a single operation some of the use cases defined previously under section 3.1.5. For example, the HL_Dispense_Salts_Tray() operation performs six calls to the Dispense() operation of the hardware server, each time using a different set of parameters, in order to model the use case dispense chemical - all metal salts - one into each well defined in Figure 17 (page 34 ). In turn, this use case models the requirement dispense all six metal salt solutions, one into each well of the tray, defined section 3.1.5.
All the operations of the hardware server correspond to direct calls of the public methods of the hardware-access ActiveX control, provided by Zenon SA for the wet chemistry experiment. This ActiveX control is embedded in the hardware server, and all its public methods are specified in annex A .
The following four sections (4.2 to 4.5) describe the design model at the hierarchical level below the one described in this section. Thus, for each one of the four main components of the system depicted in Figure 20 (page 42 ), a class diagram is provided showing the internal composition of the component.
It should be reminded that, in accordance with Figure 20 , the hardware server, the control server and the client components of the system have different designs for the light spectra and for the wet chemistry experiments. However, in the following sections, only one internal diagram is presented for each component, because, even at this more detailed level of design, the organisation of internal classes is still similar for both experiments (in all cases). In fact, only at the code level some of the internal classes need to be implemented differently for each experiment – more precisely, those internal classes that deal with the sets of control operations that are specific to each experiment.
Top
4.2. Hardware-access serverfile:///D|/dissertation.htm (82 of 160) [03-06-2005 14:50:52]

Dissertation
This section describes the design model of the hardware server component. Section 4.2.1 describes the overall design of the component, presenting its internal class diagram. Section 4.2.2 describes in detail the valve-switching mechanism needed for the wet chemistry experiment, presenting an activity diagram of the valve-switching operation.
Top
4.2.1. Overall design
Figure 23 shows the design-level class diagram of the hardware server component.
Figure 23 – Design class diagram of the hardware server
The hardware server comprises a GUI, a CORBA server and a CORBA servant. In turn, the GUI contains two test ActiveX controls: one developed for simulation purposes, and one other provided by Zenon SA for hardware access.
The CORBA server receives operation calls from the control server, across the laboratory’s local network. The server operations are implemented in the CORBA servant, which calls operations either from the test ActiveX control, or from
file:///D|/dissertation.htm (83 of 160) [03-06-2005 14:50:52]

Dissertation
Zenon’s ActiveX control (depending on the selected mode of operation).
Top
4.2.2. Valve-switching mechanism
Figure 24 shows the activity diagram the hardware server’s ValvesSwitchTo() operation.
file:///D|/dissertation.htm (84 of 160) [03-06-2005 14:50:52]

Dissertation
Figure 24 – Activity diagram of the hardware server’s operation for valve switching
As explained previously under section 4.1.2, this is the only operation of the hardware server that does not correspond to a direct call of a public method of Zenon’s ActiveX control. This is necessary, because the timing associated with switching from one gas valve to another must be accurate. It would be difficult to achieve the necessary accuracy by issuing two consecutive calls from the control server (for example, one call to close a valve and one other to open a different valve), as the timing would then depend on the condition of the local network.
When the hardware server’s ValveSwitchTo() operation is called, the current statuses of the valves are read from the ActiveX control. Then, depending on whether the desired time gap is positive (an actual gap) or negative (an overlap), different actions are taken. If the time gap is positive, the current valve is closed, the necessary pause is made and the new valve is open; if the time gap is negative, the new valve is open while keeping the current valve open, the pause is made and the current valve is closed.
It should be noted that the method of Zenon’s ActiveX control that controls the valves (ValveWr()) takes an eight-bit binary number as its only parameter, each bit corresponding the status of a given valve, as described in annex A . Therefore, for example, the overlap described above is achieved by determining the logic OR of the binary numbers that correspond to: opening only the current valve; and opening only the new valve.
Top
4.3. Control server
This section describes the design-level class diagram of the control server component. Figure 25 shows the internal class diagram of the control server.
file:///D|/dissertation.htm (85 of 160) [03-06-2005 14:50:52]

Dissertation
Figure 25 – Design class diagram of the control server
The control server comprises a GUI, a configuration object, a CORBA server, a CORBA servant and two CORBA client instances (one for communication with the video-transmitter, and the other one for communication with the hardware server). In turn, the GUI features a content pane (the application’s main window), a low-level test dialog (which allows direct requests for the low-level operations of the hardware server), and a configuration dialog.
The CORBA server receives operation calls from the connected clients, across the Internet (specifically, +connect control() and experiment-control operations calls). The control server’s operations are implemented in the CORBA servant, which calls operations from the hardware server, via the corresponding CORBA client. The other CORBA client is used to find out which video transmitter instances are running, and to retrieve from them information on video port numbers (to be provided to connecting clients). The configuration dialog allows the laboratory technician to modify the values of all the parameters labels, stored in the configuration object.
Top
4.4. Video transmitter
This section describes the design model of the video transmitter component. Section 4.4.1 describes the overall design of the component, presenting its internal class diagram, as well as an internal state diagram. Section 4.4.2 describes in detail the
file:///D|/dissertation.htm (86 of 160) [03-06-2005 14:50:52]

Dissertation
composition of an internal package of classes of the transmitter, namely the video-transmission chain, based on the JMF. This is done by means of an additional class diagram.
4.4.1. Overall design
Figure 26 shows the design-level class diagram of the video transmitter component.
Figure 26 – Design class diagram of the video transmitter
The video transmitter comprises a GUI, a configuration object, a CORBA server, a CORBA servant, a video-transmission chain (represented as a package of objects), and a Real-Time Transport Protocol (RTP) socket adapter object. In turn, the GUI features a content pane (the application’s main window) and a configuration dialog.
The CORBA server receives operation calls from the control server, across the laboratory’s local network, namely calls to the +connect VT() operation, used to determine if the transmitter is running and to retrieve its transmission port numbers. This operation is implemented in the CORBA servant. The objects contained in the video-transmission chain package are responsible for processing and transmitting the video image captured by a video camera. The RTP socket adapter receives
file:///D|/dissertation.htm (87 of 160) [03-06-2005 14:50:52]

Dissertation
and processes connection request received from the connected clients, as will be described under section 4.5.2. The configuration dialog allows the laboratory technician to modify the values of all the configurable parameters, stored in the configuration object.
Figure 27 shows a state diagram of the video transmitter. A state diagram specifies a state machine, with states (having an associated duration and in finite number) and instantaneous transitions between states caused by instantaneous events. It can also specify actions (which are instantaneous) carried out in response to events, or activities (which have an associated duration) during the permanence in a given state. State diagrams can be used to model the life cycle of objects within a class or, more generally, to model the dynamic behaviour of a system or object whose state evolves by jumps (instantaneous transitions) in response to events. [Faria 01 , Diagramas de Estados]
Figure 27 – State diagram of the video transmitter
file:///D|/dissertation.htm (88 of 160) [03-06-2005 14:50:52]

Dissertation
The video transmitter has four distinct states, namely: stopped, configuring, started, and paused. The transmitter starts up in the stopped state, with no connected clients and a non-existing video-transmission chain. When the transmitter is in the stopped state, the user may select the GUI’s configure menu command, which causes a transition to the configuring state and brings up a configuration dialog. The user can bring the transmitter back to the stopped state by clicking, on the dialog, either a cancel button (which discards any changes made in the settings) or an OK button (which causes the modified settings to be stored). Clicking the play button on the GUI brings the transmitter to the started state, causing the video-transmission chain to be created and started. In the started state, the transmitter is able to receive and process connection requests from clients. The user can pause a started transmitter by clicking the pause button on the GUI, which brings the transmitter to the paused state and stops the transmission chain. The user can click the play button again, to resume the started state. This re-entrance into the started state doesn’t imply a new creation of the transmission chain, as it has not been destroyed; the chain is simply restarted. From either the started or the paused state, clicking the stop button on the GUI causes the transmitter to go back to the stopped state. This disconnects all the clients, and stops and destroys the transmission chain. The transmitter can be destroyed at any state by closing the application’s main window, which first causes a programmatic transition to the stopped state (in case that is not already the current state).
Top
4.4.2. Video-transmission chain package
The class diagram in Figure 28 specifies the contents of the video-transmission package shown in Figure 26 .
file:///D|/dissertation.htm (89 of 160) [03-06-2005 14:50:52]

Dissertation
Figure 28 – Design class diagram of the video-transmission chain package
The data source object is directly associated with the camera driver, and delivers the input media stream to the processor. The content descriptor object is associated with the processor and sets its output content type, in this case “raw RTP” type (that is, the media is contained in individual buffers and carries “packetised” data formats supported by RTP). The video-processing format object is also associated with the processor and directs it to use the processing format configured by the user. The processor outputs media data through a data output object. The RTP manager is used to create a send stream, which takes the media provided by the data output and handles its transmission over the Internet. The RTP manager object is then used to create, maintain and close RTP sessions, that is, video-transmission connections between the transmitter and one or more clients. The mechanism by which a video connection is established will be described in greater detail in one of the sections dedicated to the client component (section 4.5.2).
file:///D|/dissertation.htm (90 of 160) [03-06-2005 14:50:52]

Dissertation
The concepts addressed above are discussed in detail in [Sun 99 , Understanding the JMF RTP API and Transmitting RTP Media Streams]. The usage of the RTP manager class can be better understood by studying the example provided in [Sun b ]. Detailed specifications of all the JMF classes can be found in [Sun 01b ].
The pre-access “codec” object is used to generate random video noise, to be transmitted for a few seconds upon the connection of each client. This is necessary, to work around a known issue with the JMF, in that the video format of a stream may be wrongly determined by the receiver if the image being transmitted contains a large proportion of black colour (which is exactly the case of the image captured by the camera attached to the light spectrometer’s telescope).
The create VT chain action in the transmitter’s started state (Figure 27, page 59 ) corresponds to the instantiation and initialisation of all the classes in this chain. The start VT chain action corresponds to starting the send stream and the processor objects. The stop VT chain action in the paused and stopped states corresponds to stopping the processor object. Finally, the destroy VT chain action in the stopped state corresponds to destroying all the objects in the transmission chain.
Top
4.5. Client
This section presents the design model of the client component. Section 4.5.1 describes the overall design of the component, providing its internal class diagram. Section 4.5.2 describes in detail the mechanism by which a video connection is established between the client and a video transmitter instance. This is done by means of a collaboration diagram. Section 4.5.3 describes in detail the composition of an internal package of classes of the client, namely the video-reception chain, based on the JMF. This is done by means of an additional class diagram. Section 4.5.4 describes the mechanism by which the client’s GUI is created upon initialisation.
Top
4.5.1. Overall design
file:///D|/dissertation.htm (91 of 160) [03-06-2005 14:50:52]

Dissertation
Figure 29 shows the class diagram of the client component.
Figure 29 – Design class diagram of the client
The client comprises a GUI and its associated GUI builder, a CORBA client, a CORBA call-back servant, and a video receiver. In turn, the GUI features a content pane (the application’s main window). The video receiver comprises up to three video-reception chains (represented as a package of objects) and the corresponding RTP socket adapters.
The GUI builder builds the GUI using layout and accessibility information stored in a file. The CORBA client invokes the connect control() and all the experiment-control operations on the control server, across the Internet. The CORBA call-back servant provides the client with the capability of handling CORBA call-backs, although this is not used in the present version of the software. Call-backs are a mechanism by which the server may asynchronously send information to the client, that is, at any time, as opposed to when returning from an operation. Therefore, this mechanism allows a temporary inversion of the client and server roles, which can be very useful to implement asynchronous notifications on the client GUI. [Iona 01 , ORB and Object Adapter Initialization]
The RTP socket adapters serve to send connection requests to each one of the transmitters, as will be described in detail in file:///D|/dissertation.htm (92 of 160) [03-06-2005 14:50:52]

Dissertation
the next section. The objects contained in each video-reception chain are responsible for displaying the video image being streamed across the Internet from one of the video transmitters, as will be described in detail under section 4.5.3.
Top
4.5.2. Video-connection mechanism
Figure 30 shows a collaboration diagram of the video connection sequence. Like sequence diagrams, UML collaboration diagrams show a pattern of interaction between different objects, with messages being exchanged in a specific order, in a given context (for example a use case or an operation). However, unlike sequence diagrams, collaboration diagrams emphasise the organisational structure of the objects exchanging messages, rather than the temporal order of the messages. Nevertheless, the messages are numbered, so that the sequence of interaction may be followed by the reader. A collaboration diagram can be seen as an object diagram (that is, an instance of a class diagram) that also contains information on dynamic behaviour. [Faria 01 , Diagramas de Colaboração]
Figure 30 – Collaboration diagram of the video connectionfile:///D|/dissertation.htm (93 of 160) [03-06-2005 14:50:52]

Dissertation
The illustrated mechanism works as a custom protocol working over the User Datagram Protocol (UDP), which allows a receiver to inform a “multi-unicast” transmitter that it wants to start receiving a stream. First, the client’s RTP socket adapter object gets some information from the CORBA client object, namely the video transmitter IP address and transmission port numbers (previously retrieved from the control server). Three ports numbers are necessary: RTP, RTCP (Real Time Control Protocol) and a custom port. Then, the client’s socket adapter sends a connection request to the transmitter’s socket adapter, namely a number of custom RTP packets, containing the client’s own address and reception port numbers. The custom packets are sent from the client’s custom port to the transmitter’s custom port – indeed, these custom ports are used only at this stage and then closed. At the same time, the socket adapter prompts the video-reception chain to start listening for an incoming video stream. On the transmitter’s side, as soon as the socket adapter receives the custom RTP packets, the video-transmission chain is prompted to start sending a stream to the expectant client.
The main advantage of this mechanism is that, as long as the client knows the address and port numbers of any given video transmitter, the video connection process is fully independent from the control connection process. This is a more reusable solution than forcing the client to make the transmission request via the control server (which, in turn, would prompt the transmitter). In fact, the implemented connection mechanism could be reused without difficulty to implement a stand-alone receiver, which would connect to the implemented type of transmitter using the same transport protocol that is used by the video streaming itself (UDP), without any usage of CORBA (as long as the receiver would know the address and port number of the transmitter).
Top
4.5.3. Video-reception chain
Figure 31 shows the design class diagram of the video-reception chain package.
file:///D|/dissertation.htm (94 of 160) [03-06-2005 14:50:52]

Dissertation
Figure 31 – Design class diagram of the video-reception chain package
Once the socket adapter object has sent a connection request, an RTP manager object and a receive-stream listener are created and associated with each other. When a video stream arrives, it triggers an event that is detected by the receive-stream listener. The stream’s data source is then taken as input to a player object. This player provides the visual and the control panel components to be placed on the client’s GUI. The usage of the RTP manager class is based on the example provided in [Sun b ]
A JMF player is a component that processes an input stream of media data, and renders it at a precise time and rate. A data source is always used to deliver the input media-stream to the player. The rendering destination depends on the type of media being presented. In the case of a video stream, the rendering destination is the client machine’s display driver. Unlike
file:///D|/dissertation.htm (95 of 160) [03-06-2005 14:50:52]

Dissertation
a processor (used e.g. in the implemented video transmitter), a player does not provide any control over the processing that it performs or how it renders the media data. These concepts are discussed in detail in [Sun 99 , Understanding the JMF RTP API and Receiving and Presenting RTP Media Streams]
Top
4.5.4. Graphical user interface
The GUI builder component is a standard Extensible Markup Language (XML) parser associated with a custom XML content-handler, which allows the parser to properly process a custom XML description. These concepts are discussed in detail in the tutorial provided in [Sun 01 ]
The GUI is built based on the contents of two files, namely a custom XML description of the GUI, and a file containing accessibility information for each graphical component. The parser goes through the description file and, each time a new XML element is found, the content-handler is called to create the corresponding GUI component and place it on the GUI.
The XML description file provides the content-handler with basic layout information, namely the hierarchical organisation of components (for example, panel components may contain button components), and the order in which components at the same hierarchical level are placed on the GUI. For each button component, the description file also identifies the control action that the button is expected to trigger on the remote server. Additionally, the description file provides the name and port number of the control server machine. The accessibility information file provides the accessible names and descriptions for each component, and identifies the shortcut key that should be associated with each focusable component.
This mechanism allows some flexibility, in that editing the description file is sufficient to modify the graphical organisation of components and the control actions associated with buttons, without the need to recompile any code. Similarly, the accessibility information file provides an easy way to modify the accessibility characteristics of each component (for example, their associated keyboard shortcuts).
The building of the GUI should take place only after the initialisation of the video chain, so that the JMF graphical components will be available for placement on the interface. These are the visual components (that display the video being received), and the control panel components (that allow a certain degree of control of the video rendering process for each
file:///D|/dissertation.htm (96 of 160) [03-06-2005 14:50:52]

Dissertation
feed).
Top
4.6. Summary
This chapter presented the design model of the system, developed during the design workflow of the project. In conjunction with the analysis workflow, the aim of the design workflow is to model a system that fulfils all its requirements, and is structured to be robust. The design model acts as a 'blueprint' of how the source code is structured and written, and shows how the system will be realized in the implementation phase. This chapter described the overall design model of the system, as well as the design models of the system’s individual components, namely the hardware server, the control server, the video transmitter and the client.
The following chapter will present the deployment and implementation models of the system. The purpose of the deployment workflow is to successfully generate product releases, and deliver the software to its end users. The deployment model will be presented first, because it provides a clear picture of how the software is to be distributed across different machines, which will facilitate the understanding of the implementation model. The goal of implementation workflow is to define the organization of the code, implement the code, and test the developed components as units. This chapter will also describe features that were implemented in the GUI of the light spectra client component, to improve its accessibility. Finally, a number of partial tests of the system, which were carried out at the implementation stage, will be addressed.
Top
5. Deployment and Implementation
This chapter describes the deployment and implementation workflows of the project. The purpose of the deployment workflow is to successfully generate product releases, and deliver the software to its end users. It includes such activities as packaging, distributing and installing the software, as well as providing help and assistance to users [Gornik 01 , Core workflows]. Most of the deployment activities take place mostly after the implementation and test. However, it was decided
file:///D|/dissertation.htm (97 of 160) [03-06-2005 14:50:52]

Dissertation
to address the system’s deployment first, because this provides a clear picture of how the software is to be distributed across different machines, thus facilitating the understanding of the implementation model.
The purpose of the implementation workflow is to define the organisation of the code, implement classes and objects in terms of components (source files, binaries, executables, and others), and test the developed components as units. In short, the system is realised through implementation of components [Gornik 01 , Core workflows]. The analysis and design models presented previously under section 3.2 and chapter 4 , respectively, define the logical architecture of the system, whereas the deployment and implementation models presented in this chapter define its physical architecture.
Section 5.1 defines the deployment model of the system. Section 5.2 defines the implementation models of the various system’s components. Section 5.3 describes in detail several features that were implemented in the GUI of the light spectra client component, to improve its accessibility. Finally, section 5.4 describes a number of partial tests of the system that were carried out at the implementation stage.
Top
5.1. Deployment
This section describes the deployment workflow of the project. Section 5.1.1 presents the deployment model of the system, as a deployment diagram. Sections 5.1.2 and 5.1.3 briefly describe, respectively, the installer applications created for the system’s components, and the documentation produced to help users with installation and usage issues.
Top
5.1.1. Distribution
Figure 32 presents the deployment model of the system, by means of a UML deployment diagram. UML deployment diagrams capture the hardware topology on which the software components are executed. They specify the distribution of components and help identify performance bottle-necks. The elements of these diagrams are hardware nodes and connections between nodes. [Faria 01 , Diagramas de distribuição]
file:///D|/dissertation.htm (98 of 160) [03-06-2005 14:50:52]

Dissertation
Figure 32 – Deployment diagram of the system
In our case, the nodes of the system are: the computers on which the software is expected to execute; the experiment’s hardware; and the video cameras. These nodes are represented as classes (as opposed to instances), that is, with associated multiplicities. The software components deployed in each computer node are represented inside the node. The stereotypes associated with the connections between computers indicate the protocols used, whereas those associated with the connections to the experiment’s hardware and the video cameras indicate the type of physical connection used.
Each remote user interacts with a client computer, which runs an instance of the client component. Multiple instances of the client computer may exist. Each client computer connects both to the server and to each instance of the video transmitter computer. Each transmitter computer typically executes only one instance of the video transmitter component – therefore, up to three instances of the transmitter computer may exist. Each transmitter computer connects to the control server computer.
file:///D|/dissertation.htm (99 of 160) [03-06-2005 14:50:52]

Dissertation
It should be noted that a given transmitter computer can execute more than one instance of the transmitter, depending on the ability of the computer to handle the connection of more than one video camera and the transmission of all the necessary video streams. That would reduce the number of transmitter computers, while keeping the number of transmitter components.
Top
5.1.2. Installation
Setup applications (installers) were created for all the components of the system, but only for MS Windows platforms. The installers for those components developed in Java (control server, video-transmitter and client) were created using InstallAnywhere Now from Zero G, whereas the installer for the only component developed in C++ (the hardware server) was created using InstallShield for Microsoft Visual Studio.
These installers for the developed Java applications also install the appropriate versions of the Java Virtual Machine (JVM) and all the necessary third-party libraries, in the relative locations where the executables will expect them to be. This makes the setup process simpler, in that the system administrator will not have to install the JVM, the Java Access Bridge (JAB), the JMF, or the Orbacus and Xerces libraries separately from the developed software. In addition, this approach also ensures that the versions of the JVM and libraries used for execution of the applications are the same as used for their development, therefore minimising the chances of future problems with backward compatibility.
Top
5.1.3. Help on installation and usage
Draft user documentation was produced, which can be found in the electronic annex C. This documentation starts with a brief overview of how the various applications work together. Then, for each application, a specification of the system’s requirements is provided, and a detailed description is given of the installation, configuration and usage steps. Finally, a section describing a number of known issues and software bugs is presented.
file:///D|/dissertation.htm (100 of 160) [03-06-2005 14:50:52]

Dissertation
Top
5.2. Implementation
This section presents the implementation model of the system, as a series of UML component diagrams.
UML component diagrams contain components, possibly interfaces, and relationships between components, to capture the physical structure of the implementation. They help organise the source code and serve as a basis for the production of executable releases. Each component represents a physical packaging (such as an executable, a library, a configuration file, etc.) of one or more elements that are logically related (usually classes). Relationships between components typically represent dependencies, indicating that a given component can only execute properly when in the presence of some other component(s). [Faria 01 , Diagramas de componentes]
The component diagrams presented in this chapter simply show the dependency relationships between: the executable components developed within the scope of this project (filled in grey colour); the libraries developed by Zenon SA; and the third-party libraries used. This was considered sufficient, since the design-level class diagrams already presented for each software application (in the previous chapter) implicitly define a further level of organisation of the source code. In fact, each class depicted in those class diagrams necessarily corresponds either to a Java class file (.class extension), or to a pair or C++ class header (.h) and class body (.cpp) files.
For each component of the system, a description of its GUI is provided as well.
Top
5.2.1. Hardware-access server
Components
Figure 33 shows the component diagram of the hardware server, for both the spectrometer experiment and the wet chemistry experiment.
file:///D|/dissertation.htm (101 of 160) [03-06-2005 14:50:52]

Dissertation
Figure 33 – Component diagram of the hardware server
The hardware server executable (compiled from C++ source code) uses the Orbacus for C++ third-party library, the hardware-access ActiveX control developed by Zenon SA, and a second ActiveX control developed for test purposes. Zenon’s ActiveX control needs to read a configuration file, in order to properly initialise. The test control is forced to read the same configuration file as Zenon’s control, so that the absence of the configuration file can be noticed and reported even if Zenon’s control is not actually being used.
In the case of the spectrometer experiment, the implemented test ActiveX control is a simulation control. This means that the +select mode() experiment-specific operation (as defined previously under section 4.1.1) allows the technician to switch the hardware server to a simulated mode of operation. In this mode, the server does not actually control the hardware; instead, its GUI displays the simulated positions of the motorised parts of the apparatus, as well as the statuses of the controlled gas valves. The delays inherent to execution of the control operations are also simulated.
In the case of the wet chemistry experiment, the implemented test control is merely a monitoring control, therefore the +select mode() operation allows the technician to switch the server to a monitoring mode. In this mode, again, the hardware is not accessed, however there are no simulated delays, nor simulated data to display. The GUI simply displays the names of the control operations being invoked.
file:///D|/dissertation.htm (102 of 160) [03-06-2005 14:50:52]

Dissertation
The hardware server is platform-dependent: it can only be executed on Windows operating systems, as it uses an ActiveX control.
Top
GUI
Figure 34 and Figure 35 show the GUI of the spectrometer hardware server, respectively in hardware-access (normal) mode and in simulation mode.
Figure 34 – GUI of the spectrometer hardware server in hardware-access mode
file:///D|/dissertation.htm (103 of 160) [03-06-2005 14:50:53]

Dissertation
Figure 35 – GUI of the spectrometer hardware server in simulation mode
In normal mode, the only relevant control on the GUI is a Stop button (which stops all activity of motors and valves, but should not be used in real emergency situations, as the stop is achieved via software). In simulation mode, a list-box identifies the invoked methods, while a number of text areas display the simulated statuses of the valves, the focus and slit controls, etc. As far as possible, the simulated methods follow Zenon’s specification of the methods implemented in their ActiveX control. In addition, a number of radio-buttons allow simulation of error conditions, also specified by Zenon.
Figure 36 and Figure 37 show the GUI of the wet chemistry hardware server, respectively in hardware-access (normal) mode and in monitoring mode.
file:///D|/dissertation.htm (104 of 160) [03-06-2005 14:50:53]

Dissertation
Figure 36 – GUI of the wet chemistry hardware server in hardware-access mode
file:///D|/dissertation.htm (105 of 160) [03-06-2005 14:50:53]

Dissertation
Figure 37 – GUI of the wet chemistry hardware server in monitoring mode
In normal mode, again, the GUI simply provides a Stop button. In monitoring mode, the invoked methods are identified on a list-box, and a mechanism is provided to simulate error conditions.
Top
5.2.2. Control server
Components
Figure 38 shows the component diagram of the control server, for both the spectrometer experiment and the wet chemistry experiment.
file:///D|/dissertation.htm (106 of 160) [03-06-2005 14:50:53]

Dissertation
Figure 38 – Component diagram of the control server
The control server executable (compiled from Java code) uses a custom configuration file. This file stores all the settings used at the last time that the server was executed. The control server also uses the ORBacus for Java third-party library. The execution of Java classes, for both the control server and the ORBacus library, naturally depends on the presence of the JVM.
The control server is platform-independent (at the execution level), as no platform-specific libraries are used. Its code needs to be compiled only once and is then executable on any platform supported by Sun’s JVM, namely the Solaris Operating Environment, MS Windows, Linux, and Apple’s Mac OS X [Sun e ] [Apple ].
Top
GUI
Figure 39 shows the GUI of the control server for the spectrometer experiment.
file:///D|/dissertation.htm (107 of 160) [03-06-2005 14:50:53]

Dissertation
Figure 39 – GUI of the spectrometer control server
As required, the interface includes buttons to toggle the connections with the video transmitter instances (to determine which of them are running and retrieve the transmission port numbers), and with the hardware server, as well as a button to start / stop the CORBA server (that is, to allow / disallow client connections). When the CORBA server is started, a button is enabled to allow the homing of the hardware. The names or IP addresses of connected clients are displayed on a list-box, and a status bar provides information on the status of the server.
Figure 40 shows the Connections tab in the Configuration dialog of the spectrometer control server.
file:///D|/dissertation.htm (108 of 160) [03-06-2005 14:50:53]

Dissertation
Figure 40 – Connections tab in the Configuration dialog of the spectrometer control server
This allows setting the CORBA port numbers, and the names (or IP addresses) of both the video transmitter computers and the hardware-access computer.
Figure 41 shows the Tuning tab in the same dialog.
file:///D|/dissertation.htm (109 of 160) [03-06-2005 14:50:53]

Dissertation
Figure 41 – Tuning tab in the Configuration dialog of the spectrometer control server
This tab allows setting the values of configurable parameters, as explained previously under section 4.1.2. It is also possible to set a few other server-side options, like the transposition of the focus and slit adjustments, and the time gap associated with valve switching
(explained previously under section 4.2.2). In addition, this dialog provides a full set of buttons for the same control actions as the remote
client. This can be used either to test the values of the configurable parameters being tuned, or to control the jig locally, without using a
client connection.
For test purposes, the GUI of the spectrometer control server also includes a Low-level Access Test-bed dialog, shown in Figure 42 .
file:///D|/dissertation.htm (110 of 160) [03-06-2005 14:50:53]

Dissertation
Figure 42 – Low-level Access Test-bed dialog of the spectrometer control server
This dialog provides direct access to the low-level methods exposed by Zenon’s ActiveX control.
Figure 43 shows the GUI of the control server for the wet chemistry experiment.
file:///D|/dissertation.htm (111 of 160) [03-06-2005 14:50:53]

Dissertation
Figure 43 – GUI of the wet chemistry control server
In place of the Home Hardware button present in the spectrometer version, this GUI provides a pair of radio buttons to select the wet chemistry test (reagent or colorimeter test), along with two buttons that invoke the Abort_Clear() and the Reset_Experiment_Setup() methods from Zenon’s ActiveX control. The Connections tab in the Configuration dialog for this version of the server is identical to that in the spectrometer server. In turn, the Tuning tab merely allows setting the values of configurable parameters, as shown in Figure 44 .
file:///D|/dissertation.htm (112 of 160) [03-06-2005 14:50:53]

Dissertation
Figure 44 – Tuning tab in the Configuration dialog of the wet chemistry control server
The GUI of this version of the control server does not include a Low-level Access Test-bed dialog, like the spectrometer version.
Top
5.2.3. Video transmitter
Components
file:///D|/dissertation.htm (113 of 160) [03-06-2005 14:50:53]

Dissertation
Figure 45 shows the component diagram of the video transmitter.
Figure 45 – Component diagram of the video transmitter
The video transmitter executable (compiled from Java code) uses a custom configuration file. This file stores all the settings used at the last time that the transmitter was executed. The video transmitter also uses the ORBacus for Java third-party library and the JMF for Windows library. The execution of Java classes, for both the video transmitter and the used libraries, depends on the presence of the JVM.
The version of the JMF library being used must match the OS on which the transmitter executes, because the third-party driver for any video camera will inevitably be platform-dependent (the driver being the software component that acts as a bridge to the hardware). In addition, the JMF’s support for certain media types and formats is platform-specific. In summary, the video transmitter is platform-independent only at the compilation level, in the sense that its code can be recompiled using different platform-specific versions of the JMF library. JMF versions exist for the MS Windows, Linux and Solaris SPARC platforms. [Sun d ]
Top
file:///D|/dissertation.htm (114 of 160) [03-06-2005 14:50:53]

Dissertation
GUI
Figure 46 shows the GUI of the video transmitter.
Figure 46 – GUI of the video transmitter
Three buttons contain standard symbols for play, pause and stop operations, and allow the laboratory technician to control the transmitter. The image being captured can be monitored on the top portion of the interface.
Figure 47 shows the Capture tab of the Configuration dialog of the transmitter.
file:///D|/dissertation.htm (115 of 160) [03-06-2005 14:50:53]

Dissertation
Figure 47 – Capture tab of the Configuration dialog of the transmitter
This tab allows the technician to select the desired capture device, as well as the format in which the image should be captured, namely the type of encoding, the size, the frame-rate, and the colour-depth (number of bits per pixel).
Figure 48 shows the Processing tab of the Configuration dialog.
file:///D|/dissertation.htm (116 of 160) [03-06-2005 14:50:53]

Dissertation
Figure 48 – Processing tab of the Configuration dialog of the video transmitter
Using this dialog, the technician can select the format in which the captured video should be transmitted, namely the type of encoding, the size, and the frame-rate. Usually, the video size and frame-rate will be the same as those selected for video capture.
Figure 49 shows the Transmission tab of the Configuration dialog.
Figure 49 – Transmission tab of the Configuration dialog of the video transmitter
The only relevant parameter in this dialog is the transmission port number for RTP. The transmitter needs as well an RTCP port, but this will be automatically set as the RTP port number plus 1.
Top
5.2.4. Client
Componentsfile:///D|/dissertation.htm (117 of 160) [03-06-2005 14:50:53]

Dissertation
Figure 50 shows the component diagram of the client application.
Figure 50 – Component diagram of the client
As described previously under section 4.5.4, upon initialisation the client executable parses two files, in order to build the application’s GUI. The first file contains an XML description of the GUI, whereas the second file contains accessibility information associated with the elements of the GUI.
The executable uses the JMF library from Sun, as well as the ORBacus for Java and the Xerces third-party libraries. To enable some of the accessibility features of the spectrometer user interface, Sun’s JAB library is needed as well, although not for compilation (only for execution). The execution of Java classes, for both the client and the used libraries, depends on the presence of the JVM.
A wide variety of media types and formats can be decoded and presented using a simple, platform-independent version of the JMF [Sun d ]. This is the case with the media type and format chosen for testing (JPEG video and RTP, respectively). However, as regards Sun’s JAB, the only existing version at the time of writing is for the MS Windows platform. As a result, the client can be considered as platform-independent (at the execution level) only if the accessibility features that
file:///D|/dissertation.htm (118 of 160) [03-06-2005 14:50:53]

Dissertation
depend on the JAB are not found necessary; otherwise, the client must be executed on a Windows platform.
The XML-based mechanism for generation of the GUI, as well as the accessibility features described in detail later (under section 5.3), were implemented only in the spectrometer client, not in the wet chemistry client.
Top
GUI
The GUI of the spectrometer client will be presented in the next section, where its accessibility features are described in detail. Figure 51 shows the GUI of the wet chemistry client.
file:///D|/dissertation.htm (119 of 160) [03-06-2005 14:50:53]

Dissertation
Figure 51 – GUI of the wet chemistry client
Three video feeds are available, but with no radio buttons for resizing. The two available tabs correspond to groups of controls for the two available tests, namely the reagent test and the colorimeter test. The groups of controls consist merely of a collection of vertically aligned buttons, with no progress bars to indicate the statuses of requests. A status bar is available, to indicate the status of the current request. [PEARL 03 , The OU experiment]
file:///D|/dissertation.htm (120 of 160) [03-06-2005 14:50:53]

Dissertation
Top
5.3. Accessibility features
This section describes a number of features that were implemented in the GUI of the spectrometer client component, to improve its accessibility. Section 5.3.1 provides a detailed overview of the client’s GUI. Section 5.3.2 focuses on features aimed at users who operate a keyboard as the sole input device. Section 5.3.3 describes features implemented as help to blind users. Section 5.3.4 focuses on features aimed at partially sighted users. Finally, section 5.3.5 explains the extent to which the developed GUI is compatible with existing assistive software, namely screen-readers and magnifiers. These sections are based on [PEARL 03 , The OU experiment, pp. 13–28].
Top
5.3.1. Overview
Figure 52 shows the appearance of the client user interface for the spectrometer jig.
file:///D|/dissertation.htm (121 of 160) [03-06-2005 14:50:53]

Dissertation
Figure 52 – GUI of the spectrometer client
On the left side of the interface, the three video feeds are aligned vertically. Below each video feed, a radio button allows choosing between two display sizes, namely 160×120 and 320×240 pixels. Upon a change in the video feed display sizes, the overall interface resizes itself to accommodate the resized feeds.
On the central part of the interface, four tabs are aligned vertically, namely Telescope rotation, Collimator adjustment, Light file:///D|/dissertation.htm (122 of 160) [03-06-2005 14:50:53]

Dissertation
sources and Chemical solutions. These tabs contain groups of controls.
On the right side of the interface, the content of the selected tab is made available (the image displays the content of the Telescope rotation tab). Below each button, a progress bar indicates the current status of the corresponding request. By default, the progress bar is at 100%; upon the issuing of a request, it progresses to 50%; upon the response from the Server, it goes back to 100%.
At the bottom of the interface, two information bars are displayed. The Angle bar displays the current position of the telescope in degrees, after rotation-control actions are executed. The Status bar starts by displaying a “Client initialised” message, and will then display the status of the current request for a control operation (consistent with the control’s own progress bar). The possible statuses are “Operation requested” and “Operation complete”.
A number of features were added to improve the accessibility of the user interface for users in general, and to support access by students with disabilities in particular.
Top
5.3.2. Keyboard users
It is possible to operate all the controls exclusively via the keyboard. This can be done by using the Up- and Down-Arrow keys to move the input focus between tabs, the Tab and Shift+Tab keys to move back and forth through the controls within a tab, and the Enter key or the Space bar to operate a control. Alternatively, keyboard shortcuts are provided for all tabs and controls.
The keyboard shortcuts never require the simultaneous pressing of more than one key. Moreover, a mechanism of “composite shortcuts” was devised, so that the same set of keys (C, M and F) can be used to achieve both left and right rotation of the telescope. The user first presses the L or the R key to select left or right rotation; then, the C, M or F key can be used to request a coarse, medium or fine rotation, respectively. For example, to perform a left coarse rotation, the user should press L followed by C; to perform a further left medium rotation, it would be sufficient to press the M key (as the left group of buttons will already be selected). This mechanism makes it much easier to memorise the shortcut keys than would be the case if different sets of keys were used for left and right rotations.
file:///D|/dissertation.htm (123 of 160) [03-06-2005 14:50:53]

Dissertation
Sighted users are informed of the keyboard shortcuts by the text labels placed on the tabs, on groups of buttons, and on the controls themselves. These text labels include the shortcut key in parenthesis.
Top
5.3.3. Blind users
For blind users, the ability to operate the interface via the keyboard (described in the previous section) is essential.
In addition, accessible names are provided for all controls, which are accessible to Java-compatible screen-reading applications. An accessible name is a short, concise description of the control [Dunn 00 , Nuts and bolts]. In our case, each accessible name includes the shortcut key for the control, so that it will also be spoken by a screen-reading application. For example, the accessible name for the Coarse button displayed on the left is spoken by screen-reading software as “left coarse, c”.
Accessible descriptions are provided for all controls. These consist of explanations of the controls slightly more descriptive than the accessible names (typically, specifying the context in that the control is used), which can also be accessed by some screen-reading applications [Dunn 00 , Nuts and bolts]. For example, the accessible name for the Coarse button on the left is “telescope rotation, left coarse”. For sighted users, these descriptions are also available as tool-tips, which pop-up when the mouse pointer hangs over a control.
Access to the Status field is provided via a keyboard shortcut. Pressing this shortcut key temporarily moves the input focus to the status field, for sufficient time for the screen-reading software to read the status, and then returns the focus to the control that was last used. This means that a blind user does not have to navigate through all the other controls using the Tab key, in order to read the status.
Access to the Angle field is provided via a keyboard shortcut, in the same way as the status field.
Auditory feedback was provided as an equivalent to the progress bars. Two different ‘beeps’ are used for the two progress bar stages. This is useful mostly when executing control operations that are carried out quickly by the experiment’s
file:///D|/dissertation.htm (124 of 160) [03-06-2005 14:50:53]

Dissertation
hardware. For lengthy operations, the Status field is a better way to confirm whether the operation is already completed or not, in case of doubt.
Top
5.3.4. Partially sighted users
For partially sighted users, several of the features described in the two previous sections can be useful, namely: the ability to operate the interface via the keyboard; the accessible names and descriptions; the shortcut access to the Status and Angle fields; and the auditory feedback.
In particular, the access via a keyboard shortcut to the Status and Angle fields can prove helpful when magnifying software is being used. The temporary deviation of the input focus will cause the magnifier to automatically move the magnified area of the screen, to include the desired field, and then go back to the control that was last used.
In case no magnifying software is being used, the size of the video feeds can be increased from 160×120 to 320×240 pixels. For normally sighted users, this may also allow to see more detail, if necessary.
In addition, when running under an MS Windows OS, the user interface adopts the Windows fonts and colours settings. This is possible because the user interface was developed using the Java Foundation Classes (JFC) / Swing library [Sun ]. It becomes possible, for example, to use very large font sizes, or adopt a high-contrast colour scheme. Figure 53 shows the appearance of the user interface using the “High Contrast #1 large” Windows appearance scheme.
file:///D|/dissertation.htm (125 of 160) [03-06-2005 14:50:53]

Dissertation
Figure 53 – GUI of the spectrometer client, using the “High Contrast #1 large” Windows appearance scheme
The user interface automatically resizes itself to accommodate changes in the size of its components, which can happen because of resizing the video feeds, or changing the Windows display settings. This automatic resizing is achieved by using a structure of nested Java layout manager components [Sun 04 , Using Layout Managers].
Progress bars are provided below every button, rather than using just one bar for all buttons. Thus, partially sighted users, who may have only a small area of the screen magnified, do not have to spend time searching for the progress bar.
Top
file:///D|/dissertation.htm (126 of 160) [03-06-2005 14:50:53]

Dissertation
5.3.5. Compatibility with assistive software
Only Java-compatible screen-reading and magnifying software can be used with the client, since it was developed in the Java language. At the time of writing, only two such applications are known, namely: the screen-reader Jaws for Windows from Freedom Scientific; and the combined screen-reader and magnifier ZoomText Xtra for Windows from AiSquared.
These applications make use of the JAB for Windows library, in order to retrieve accessibility information such as the accessible names and descriptions of the controls. The JAB must be installed along with the JVM on the client computer. In fact, assistive applications that are natively compiled for a specific OS can easily retrieve accessibility information from other applications that are also natively compiled. However, the client was programmed in Java language, which means that it does not run directly on the OS, but rather on a virtual machine. Thus, assistive applications must make use of a bridging library to retrieve the necessary information – that is the purpose of the JAB. [Sun c ]
Top
5.4. Partial testing of the system
During the implementation stage, several mechanisms were used to test the operation of limited parts of the system. This was necessary to ensure the proper operation of the components as units, as well as the correct operation of individual connections between components, before integrating all the components as a single, overall system.
This section describes a number of partial tests of the system that were carried out. Section 5.4.1 focuses on the testing of the remote-control chain, that is, those parts of the system that convey the requests for control operations, from the client on one end of the system to the experiment’s hardware on the other end. Finally, section 5.4.2 focuses on the testing of the video-transmission subsystem.
Top
5.4.1. Remote-control chain
file:///D|/dissertation.htm (127 of 160) [03-06-2005 14:50:53]

Dissertation
The class diagram in Figure 54 shows the components that constitute the system’s remote-control chain, as well as the scope of the partial test parts that were performed.
Figure 54 – Remote-control chain, and parts of the system that were tested individually
file:///D|/dissertation.htm (128 of 160) [03-06-2005 14:50:53]

Dissertation
The client contains a CORBA client component that invokes requests for (high-level) operations of the control server. In turn, the control server contains: a CORBA server component that receives requests from the client; a CORBA servant that translates requests from the client into requests for (low-level) operations of the hardware server; and a hardware-access CORBA client that actually invokes requests for operations of the hardware server. Finally, the hardware server contains: a CORBA server component that receives requests from the control server; a CORBA servant that translates requests from the control server into calls to ActiveX control methods; a test ActiveX control component developed for test purposes; and an ActiveX component developed by Zenon SA for actual hardware control. The internal compositions of the client, control server, and hardware server components were described in detail under sections 4.5, 4.3 , and 4.2.
Zenon SA provided a test HTML page containing their ActiveX control, which allowed testing individually the connection between the ActiveX control and the hardware. In Figure 54 , this first partial test is marked as “1”.
On the opposite end of the control chain, the operation of a CORBA client and a CORBA server, as well as the connection between them, were initially tested between the FEUP and the TCD. This test is described for reference in the electronic annex D, and involved command-line versions of both the client and the server, which allowed to control a Light-Emitting Diode (LED) over the Internet. Later, debug output statements were included in the code of the control server’s CORBA server. These statements can output debug information either to the command-line or to a log file, and allow confirming that the requests invoked by the client are being correctly received. Similarly, debug output statements were included in the code of the control server’s CORBA servant, which allow confirming that the requests from the client are being properly translated into requests for operations of the hardware server. In Figure 54 , the scopes of these tests are marked as “2” and “3”.
Apart from the inclusion of debug output statements in the code, three permanent mechanisms were implemented, which allowed a number of partial tests. A set of test buttons were included in the Tuning tab of the control server’s Configuration dialog (as explained previously under section 5.2.2), which allow to directly call the (high-level) operations of the control server, as opposed to invoking requests from a connected client. A low-level test dialog was included as well in the control server’s GUI, which allows to directly invoke requests for (low-level) operations of the hardware server. Finally, the already mentioned test ActiveX, included in the hardware server, allows monitoring the operations being requested by the control server.
file:///D|/dissertation.htm (129 of 160) [03-06-2005 14:50:53]

Dissertation
By using the low-level test dialog and the test ActiveX control simultaneously, it was possible to test the correct operation of a number of components, namely: the control server’s hardware-access CORBA client; and the hardware server’s CORBA server and CORBA servant. It should be noted that the test ActiveX control allows the simulation of the error conditions that Zenon’s ActiveX control may run into. This made it easier to test how the control server reacted to such errors (some of which can only occur upon hardware failure). In Figure 54 , the scope of this test is marked as “4”.
By replacing the test ActiveX control with the ActiveX control provided by Zenon (which can be done simply by switching a radio-button on the hardware server’s GUI), it was possible to extend this test to include actual control of the experiment’s hardware. In Figure 54 , this is marked as “5”.
By using the control server’s high-level test buttons on its Configuration dialog, instead of the low-level test dialog, it was possible to extend the tests described in the previous two paragraphs to include the operation of the CORBA servant component. In Figure 54 , this is marked as “6” and “7”.
At a later stage, the test ActiveX control also made it possible to test the integrated operation of the client, control server and hardware server components, without controlling the experiment’s hardware. In Figure 54 , the scope of this test is marked as “8”. As explained previously under section 5.2.1, the test ActiveX control developed for the light spectra experiment allows a degree of simulation of the hardware’s operation (as opposed to merely monitoring the invocation of operations). This was particularly useful at the implementation stage, since most of the software development work was undertaken at a different location from that where the light spectra apparatus was installed.
Top
5.4.2. Video transmission
As explained previously under section 4.1.1, the connections between the video transmitters and the control server are only needed to retrieve the video transmission port numbers, and the connection between the client and the control server is then used to retrieve the video transmitter computer names and port numbers. Thus, through a simple modification in the client’s code (hard-coding the names and ports of the video transmitters), it was possible to carry out tests of the video-transmission subsystem without the need to run the control server.
file:///D|/dissertation.htm (130 of 160) [03-06-2005 14:50:53]

Dissertation
The video-transmission subsystem comprises the video transmitter application and the video-reception chain within the client application (that is, those parts of the system that are independent of the type of experiment). The performed tests involved a client connected to one or more instances of the video transmitter, and addressed the sequence of operations that are depicted in Figure 21 (page 46 ) right after the initialisation of the client. The video transmission was tested using only the Joint Photographic Experts Group (JPEG) format.
Finally, it should be reminded that the control server’s GUI allows to: start and stop its internal CORBA server (that is, allow or disallow remote client connections); establish and close the connections to video transmitter instances; and establish and close the connection to the hardware server. These built-in possibilities often helped isolate and solve problems that would arise during the integration of the system’s components.
Top
5.5. Summary
This chapter presented the deployment and implementation models of the system. The purpose of the deployment workflow is to successfully generate product releases, and deliver the software to its end users. The deployment model was presented first, because it provides a clear picture of how the software is to be distributed across different machines, which facilitates the understanding of the implementation model. The purpose of the implementation workflow is to define the organization of the code, implement the code, and test the developed components as units. This chapter also described features that were implemented in the GUI of the light spectra client component, to improve its accessibility. Finally, a number of partial tests of the system, which were carried out at the implementation stage, are addressed.
The next chapter will describe the tests that involved the overall system. Firstly, a description of the technical validation stage will be presented, which will allow determining to what extent the software meets the defined functional requirements. The technical validation involved the testing of use cases, and the measurement of the effective bandwidth requirements of the video transmission system. Conclusions drawn from the technical tests will be presented, and modifications found necessary to the system’s design will be described. Then, an account of the OU student trials will be given, focusing on the evaluation of the client application’s accessibility features and other aspects of its usability.
file:///D|/dissertation.htm (131 of 160) [03-06-2005 14:50:53]

Dissertation
Top
6. Tests and results
This chapter describes the tests that were carried out, integrating all the system’s components, namely: one instance of the hardware server; one instance of the control server; up to three instances of the video transmitter; and one or more instances of the client.
Section 6.1 describes the technical validation stage, which allowed determining to what extent the developed software met the functional requirements defined previously under section 3.1.2. Section 6.2 focuses on the student trials that took place at the OU, which addressed some of the non-functional requirements defined previously under section 3.1.4.
Top
6.1. Technical validation
The technical validation has three main aims. Firstly, to ensure that the technologies that will be integrated into the system perform the functions assigned to them. Secondly, to ensure that, collectively, these technologies integrate into a functioning system. Finally, the technical validation also serves as an opportunity to monitor the interaction of the various technological components and their impact on network resources and technologies. [PEARL 03b , Technical validation]
Section 6.1.1 addresses the tests that allowed verifying the correct implementation of all the defined use cases. Section 6.1.2 describes a test carried out to determine the effective bandwidth requirements of the system, in particular its video transmission subsystem. Section 6.1.3 presents the conclusions drawn from the technical tests, and describes some modifications of the system’s design that were found necessary upon the detection of problems.
Top
6.1.1. Use cases
file:///D|/dissertation.htm (132 of 160) [03-06-2005 14:50:53]

Dissertation
This stage of the technical validation allowed testing the use cases depicted in Figure 14, Figure 16, Figure 17, and Figure 18 (pages 31 to 35 ), which in turn model the functional requirements specified previously under section 3.1.2).
The testing of the light spectra system allowed testing the use cases that are common to both experiments, as well as those specific to the light spectra experiment. The first group includes all of the use cases specified for the laboratory technician, and the connect and receive video use cases specified for remote users; whereas the second group stands for the light spectra version of the control equipment use-case package for remote users.
The testing of the wet chemistry system allowed testing the use cases that are specific to the wet chemistry experiment (reagent and colorimeter tests), that is, the wet chemistry version of the control equipment use-case package for remote users.
Top
Light spectra experiment
The software for the light spectra experiment was tested more than once, between the FEUP’s LAN in Porto and the OU’s LAN in Milton Keynes (UK). These tests involved: one or more instances of the client running at the FEUP; and the control server, the hardware server, and one or two instances of the video transmitter running at the OU. The computers running the control server and the video transmitters were located at a Demilitarised Zone (DMZ) of the OU’s LAN, which means that they were not subject to any firewall restrictions. All use cases were thoroughly tested.
Eventually, it was no longer possible to carry out tests involving the transmission of video, because an upgrade in the FEUP’s firewall software blocked the unconditional acceptance of inbound UDP/IP traffic. It might have been possible to overcome this problem by contacting the FEUP’s IT services, asking for special permissions regarding the computers used to run the instances of the client. However, this was found unnecessary, as the tests completed to date had already yielded satisfactory results.
The role played by Virtual Network Computing (VNC) in these tests should be noted. VNC is remote control software that allows viewing and interacting with one computer (the “server”) using a simple program (the “viewer”) on another computer
file:///D|/dissertation.htm (133 of 160) [03-06-2005 14:50:53]

Dissertation
anywhere on the Internet [RealVNC ]. Thus, it was possible to connect via VNC from a computer at the FEUP to the computers running the control and hardware servers, as well as the video transmitters, at the OU, in order to configure and start the applications. In other words, it was possible to partially play the role of the laboratory technician without being physically close to the server-side computers. However, during all tests that involved actual control of the spectrometer apparatus, the presence of someone in the OU’s laboratory was required, for safety reasons (and also to ignite the Bunsen Burner, when necessary).
The software was tested more than once within the OU’s LAN. These tests were part of the Interim Validations stage of the PEARL project. They involved the same software components as the tests between the FEUP and the OU, although at times three video transmitters were used. Figure 52 (page 84 ) shows the appearance of the spectrometer client’s GUI during a test with three video feeds. Again, all use cases were tested. The feed at the top shows the spectrometer’s Vernier scale; the central feed shows an overall image of the apparatus; and the feed at the bottom shows the view through the spectrometer’s telescope, with a spectral line near the centre of the cross-hair.
The software was tested once between the LAN of the Trinity College of Dublin (TCD) and the OU’s LAN. This test involved: only one instance of the client (it’s GUI being projected on a screen) running at the TCD; and the control server, the hardware server, and three instances of the video transmitter running at the OU. Only a few of the control use cases were tested, mainly for demonstration purposes.
For reference, Table 6 shows the values of parameter labels that were configured on the light spectra control server. The mechanism involving these configurable labels was described under section 4.1.2.
parameter name value unitFocus Adjust - Coarse 5.0 mmFocus Adjust - Medium 1.0 mmFocus Adjust - Fine 0.1 mmLight Source Align - Bunsen Burner 275.0 mm
Light Source Align - Sodium Lamp 125.0 mm
Slit Adjust - Coarse 10.0 (%)
file:///D|/dissertation.htm (134 of 160) [03-06-2005 14:50:53]

Dissertation
Slit Adjust - Medium 1.0 (%)Slit Adjust - Fine 0.1 (%)Telescope Align - Collimator 0.0 (degrees)Telescope Rotate - Coarse 10.0 (degrees)Telescope Rotate - Medium 1.0 (degrees)Telescope Rotate - Fine 0.1 (degrees)Valve for No Solution 1 (n/a)Valve for Solution One 2 (n/a)Valve for Solution Two 3 (n/a)Valve for Solution Three 4 (n/a)Valve for Solution Four 5 (n/a)Valve for Solution Five 6 (n/a)Valve for Solution Six 7 (n/a)Valve for Solution Seven 8 (n/a)
Table 6 – Tested values of parameter labels for the light spectra experiment
The video capture was tested using: RGB encoding; video sizes of 160×120 and 320×240 pixels; a frame-rate of 15 frames per second (fps); and a colour-depth of 24 bits per pixel. This high colour-depth is a requirement for the telescope video feed, since it is
important that the students easily distinguish the colours of spectral lines. The video processing was tested using JPEG/RTP encoding, and
the same video sizes and frame-rate as used in capture. It should be noted that, when video is being captured and processed at the 160×120
pixels size, enlarging the video feed on the client’s GUI to 320×240 pixels does not increase the resolution. Nevertheless, for partially
sighted users, such and enlargement without increase of resolution can still prove useful.
Top
Wet chemistry experiment
The wet chemistry version of the software was tested at the premises of Zenon SA in Athens. One test was carried out, within Zenon’s LAN, involving one instance of the client, the control server and the hardware server (connected to the experiment’s hardware). All control use cases were tested. Video transmission was not tried, given that no cameras were
file:///D|/dissertation.htm (135 of 160) [03-06-2005 14:50:53]

Dissertation
actually attached to the experiment’s apparatus. However, this did not represent a problem. In fact, the video-transmission subsystem is independent of the type of experiment, and had already been properly tested as part of the light spectra software.
For reference, Table 7 shows values of parameter labels that were configured on the wet chemistry control server.
parameter name value (container number)
Aluminium Nitrate 16 Calcium Nitrate 15 Copper Nitrate 14 Iron Nitrate 13 Lead Nitrate 12 Zinc Nitrate 11 Chromazurol S 2 Ammonia Solution 3 Sodium Iodide 5 Dilute Sulphuric Acid 6 Aluminium Sol. - Concentration 1 10
Aluminium Sol. - Concentration 2 9
Aluminium Sol. - Concentration 3 8
Aluminium Sol. - Concentration 4 7
Aluminium Sol. - Concentration 5 4
Deionised Water 1
Table 7 – Tested values of parameter labels for the wet chemistry experiment
The values shown in this table correspond to the numbers of the containers for chemicals, as specified in annex A .file:///D|/dissertation.htm (136 of 160) [03-06-2005 14:50:53]

Dissertation
Top
Hardware and platforms used
All the computers used to test the developed software components were IBM-compatible machines that exceeded the minimum requirements in terms of processor, speed, and amounts of available physical random-access memory (RAM) and hard-disk space. For each component, these system requirements are specified in the user’s documentation provided in the electronic annex C.
Several capture devices were tested, namely: the WebCam and WebCam Plus USB cameras from Creative Labs; the QuickCam Pro 3000 USB camera from Logitech; and the WinTV Go PCI (model 190) video board from Hauppauge. The latter is a relatively cheap board compatible with JMF, featuring an analog input to which a wide range of analog cameras can be connected. All these devices are compatible with the JMF, since Video For Windows (VFW) drivers are provided for them [Sun d ]. For the tests carried out during the project’s Interim Trials and the Final Review, an SLC-VL10P analog camera from Sony was connected to a WinTV board and attached to the spectrometer’s telescope.
The control server, video transmitter and client components can run on platforms other than MS Windows, under certain conditions, as explained previously under section 5.2. However, all the components were tested only on the MS Windows 2000 Professional OS. Consequently, all the components developed in Java (control server, video transmitter and client) were tested using the Windows version 1.4.x of Sun’s JVM. In addition, both the video transmitter and the client were compiled using the Windows version 2.1.1 of the JMF.
Top
6.1.2. Network bandwidth
A test was carried out within the OU LAN, to help determine the effective bandwidth requirements of the system, as described in [PEARL 03b , Technical validation, pp. 54–55]. The results from this test were then compared with the efficiency / performance requirement stated previously under section 3.1.4.
file:///D|/dissertation.htm (137 of 160) [03-06-2005 14:50:53]

Dissertation
This test involved the light spectra version of the software. Only the video transmission subsystem has a significant impact on the consumed bandwidth, and it is independent of the type of experiment.
Figure 55 shows the deployment diagram corresponding to this test. This diagram is similar to the one shown in Figure 32 (page 68 ), however the represented nodes are now objects, rather than classes with associated multiplicities. In other words, the present diagram represents a particular instance of the system’s configuration.
Figure 55 – Deployment diagram of the network bandwidth test within an LAN
All the machines involved in this test were connected to the OU Fast Ethernet (100 Mbps) LAN. The control machine executed not only the control server, but also two instances of the video transmitter. An additional machine was used to execute a third instance of the transmitter. All the transmitters were set to use a video processing size of 320×240 pixels. Two client machines were used, each executing one instance of the client.
file:///D|/dissertation.htm (138 of 160) [03-06-2005 14:50:53]

Dissertation
Bandwidth values in Kpbs are associated with the connections between each client machine and the server-side machines. These values correspond to the total traffic (inbound and outbound) detected between the involved machines, and were determined using the EtherPeek network analyser software, from WildPackets, Inc.
Top
6.1.3. Results
Control use cases
The tests of use cases allowed the detection of a number of problems with control operations. These problems were mainly due to occasional misinterpretation of the specifications provided by Zenon, regarding the operation of their ActiveX controls. A few minor errors were also detected in those specifications, which provided useful feedback to Zenon and led to a revised version of their documentation.
The one test carried out with the wet-chemistry software, at Zenon’s premises, allowed detecting a non-implemented control use case. The software was corrected accordingly.
In the end, the whole range of specified control use cases was tested successfully, for both experiments.
Top
Firewall issues
The tests featuring video transmission confirmed a number of expected issues regarding the existence of client-side firewalls. Figure 56 illustrates connections between a server machine and two clients: one having a public IP address; and another one having a private IP address, that is, located behind a firewall that performs Network Address Translation (NAT). Apart from NAT, this firewall may or may not block specific types of incoming traffic. The server machine can represent a machine executing either the control server or an instance of the video transmitter; therefore, the connections can represent either control connections or video connections.
file:///D|/dissertation.htm (139 of 160) [03-06-2005 14:50:53]

Dissertation
Figure 56 – Client-side connections with public and private IP addresses
Ideally, the client machine should have a public IP address and should not be located behind a firewall (as typically happens when the Internet connection is established via an ISP, e.g. using an ASDL modem or a cable modem). In this case, once the connection is established, the control or video packets can be sent from the server machine to the client in a straightforward fashion.
When the client machine has a private address (in other words, is subject to NAT), control connections are not affected, as they are based on TCP/IP. The connection-request TCP packets sent by the client are “re-packed” in the NAT router, to carry the router’s public address and port numbers. Thus, the control server will be able to establish a connection with the router, which in turn redirects the connection to the client.
In contrast, client private addresses affect video connections, as these are based on UDP/IP. The connection-request UDP packets sent by the client are not “re-packed” in the NAT router. Consequently, the transmitter will not be aware of the router’s public address and ports, and will try to establish a connection directly with the client’s private address and ports. Since private addresses are unknown to Domain Name System (DNS) servers across the Internet, the connection will fail.
A mechanism was implemented to overcome this problem. The video transmitter code was modified, so that the NAT router’s public address and ports could be extracted from the IP header of the connection-request packets. In other words, since the necessary information is not available in the headers of the UDP packets themselves, it is extracted from the headers of the underlying IP protocol. The connection can thus be normally established, since the transmitter will direct the
file:///D|/dissertation.htm (140 of 160) [03-06-2005 14:50:53]

Dissertation
video stream at the NAT router’s address and ports, and the router will perform a reverse mapping, which redirects the stream to the client’s private address and ports.
Nonetheless, many LANs are separated from the Internet by means of firewalls that not only perform NAT routing, but also block all incoming UDP/IP traffic. In other words, the video streams being transmitted to the NAT router will not be redirected to the client machine. This restriction inevitably defeats the establishment of video connections by the developed system.
Firewalls that are more restrictive may also block certain types of TCP/IP traffic. For example, some firewalls are configured to allow exclusively HyperText Transfer Protocol (HTTP) traffic over TCP/IP, and block everything else. This type of restriction may prevent the establishment of control connections, as the CORBA control packets are a specific type of TCP/IP traffic.
In these situations, the client-side IT services must be contacted. UDP/IP traffic, as well as CORBA TCP/IP packets, should be explicitly allowed to reach the necessary client machines. Alternatively (and preferably), public IP addresses should be assigned to them.
In summary, when the client machines have private addresses, it is worth trying the system. If the client-side firewall performs only NAT, then control connections will not be affected, and the implemented NAT-detection mechanism will ensure that video connections are established as well. If the firewall is more restrictive, and one or more connections fail, then it is necessary to obtain special permissions or public addresses from the client-side IT services.
The control machine and the video transmitter machine, when connected to the Internet, also need public IP addresses and specific open ports. However, this should not be regarded as a limitation. All types of server machines typically need special privileges. Moreover, such privileges can easily be kept under control, since they apply to only a small number of machines at a fixed location (unlike client machines).
Top
Java Media Framework issues
file:///D|/dissertation.htm (141 of 160) [03-06-2005 14:50:53]

Dissertation
The testing of the video transmission revealed an issue with the JMF, in that the video format of a stream can be wrongly determined by the receiver if the image being transmitted contains a large proportion of black colour (which is exactly the case with the image captured by the camera attached to the spectrometer’s telescope). This led to a modification in the design of the video transmitter, in which a pre-access “codec” component was included to transmit a few seconds of random video noise upon the connection of each client, as explained previously under section 4.4.2.
These tests revealed another JMF issue, related with the selection of the type of video rendering. JMF-based receivers support three types of rendering, namely: DirectDraw, Graphical Device Interface (GDI), and Abstract Window Toolkit (AWT). Video rendering is the process used to represent graphical objects (in this case the video frames) and send them to the appropriate output device (the video monitor). Not all video cards support all types of video rendering. To ensure maximum compatibility, it was decided to manually set the client application to use the simplest form of rendering, that is, AWT.
Unfortunately, the only method available to manually set the type of rendering used by a JMF-based receiver is the deletion (or renaming) or certain Dynamic Link Library (DLL) files. Upon initialisation, the video-reception chain selects the type of rendering based on the DLL files that are found in the system. [Yamasani 98 ]
It was determined that previous installations of the JMF on the client machines might cause undesired DLL files to exist in the Windows system folders, which would force a type of video rendering that might not be supported by the machine. Hence, the installations instructions for the client were updated, to require that all previous installations of the JMF be removed from client machines, prior to the installation of the client application.
Top
Camera driver issue
The tests involving more than one instance of the video transmitter revealed an unexpected limitation. It was impossible to run two instances of the transmitter on the same machine when two cameras of the same model were being used.
This does not reflect a problem of the developed software, but rather a limitation of the drivers provided by the camera’s manufacturer. Apparently, the third-party drivers provided with simple web-cams are never designed in a way that allows
file:///D|/dissertation.htm (142 of 160) [03-06-2005 14:50:53]

Dissertation
multiple instances of the driver to run in parallel, associated with multiple physical cameras.
Top
Network bandwidth and video performance
The values represented in Figure 55 (page 98 ) correspond almost exclusively to the bandwidth required by the video transmission subsystem. In fact, when compared with the streaming of video, the bandwidth required by the control operations is negligible.
Each client machine required a total bandwidth of about 1300 Kbps. However, it should be noted that these results were obtained within a Fast Ethernet (100 Mbps) LAN, that is, without effective bandwidth limitations. This allowed all the video streams to reach the maximum set frame-rate, of 15 fps.
Since the required bandwidth is directly proportional to the frame-rate, it can be determined that a bandwidth of 1300 / 3 = 433 Kbps would be sufficient to convey three video streams at a frame-rate of 15 / 3 = 5 fps. This indicates that the system meets the performance requirement stated in 3.1.4 , according to which a 512 Kbps broadband connection on a client machine should be sufficient to ensure good video quality, in terms of both resolution and frame-rate.
However, in such a broadband connection, little bandwidth is left available to be used by other software. This can be a problem, if the student using the client needs to use other software with relevant bandwidth requirements, for example for video-conferencing purposes.
The usage of the JPEG video processing format is responsible for the high data rates identified in the bandwidth test. In fact, this format is not ideal when low bandwidth usage is a requirement, the H263 format being more appropriate [Patalano 02 ]. JPEG was chosen to test the system, because it is the only format fully supported by all versions of the JMF, including the cross-platform version. This would allow for example a client running on the Mac OS X operating system to receive video.
The tests carried out between the FEUP LAN and the OU LAN, as well as the test between the TCD LAN and the OU LAN, also led to satisfactory frame-rates, of 5 fps or more. This is not surprising, since connections over the Internet between two LANs can easily provide the high bandwidth required by the system.
file:///D|/dissertation.htm (143 of 160) [03-06-2005 14:50:53]

Dissertation
Top
6.2. Student trials
Student trials were carried out at the OU, using the light spectra version of the developed system. These trials are described in detail in [PEARL 03b , Findings from the student trials, pp. 8–28], and addressed a range of issues relevant to the PEARL project, namely: students’ past experience of practical work; motivation for remote experimentation; learning through remote experimentation; management of the proposed tasks; and usability of the user interface. Naturally, apart from these issues, during these trials all the light spectra use cases were implicitly re-tested.
However, this section focuses only on the evaluation of usability. Section 6.2.1 addresses specifically the accessibility features of the client user interface. These features were defined as usability requirements under section 3.1.4, and their implementation was described under section 5.3. Section 6.2.2 discusses other general aspects of the client’s usability.
The trials involved two groups of students: twelve residential school students in a traditional laboratory situation (that is, not using the developed software); and six PEARL students in a remote laboratory situation (that is, controlling the spectrometer apparatus via the client application).
Of the six PEARL students, three were disabled: two had disabilities that affected their mobility and therefore did not have any particular impact on their use of the computer, whereas the third student was hearing impaired. For the trials, the disabled students were paired with non-disabled students to carry out the activity and were interviewed afterwards.
The students were asked to follow a labscript for the light spectra experiment. This script is provided for reference in the
electronic annex E. On completion of the activity, the students were interviewed. The interview schedules that were followed are provided for
reference in the electronic annex F.
While usability was not the main focus of these main trials some data on this aspect was collected from the trials with the disabled students, and to a lesser extent the non-disabled students. The evaluators observed the six PEARL students while they carried out the proposed tasks, and made notes of events when the students appeared to have difficulty with usability
file:///D|/dissertation.htm (144 of 160) [03-06-2005 14:50:53]

Dissertation
aspects of the interface. The three disabled students were then asked the same questions as the three non-disabled students, except for seven alternative questions on the accessibility and usability of the user interface, and the use of remote experiments by disabled students.
The findings presented in the following two sections are based on the evaluator’s observations and notes regarding the six PEARL students, and on the interviews of the three disabled students. These results did not lead to changes in the design and implementation of the system, as they were carried out near the end of the project.
Top
6.2.1. Accessibility
General
The students were asked: Are there any improvements that you would suggest for supporting you in controlling the spectrometer? One student made a suggestion for the improvement of the user interface: that sliders could be used instead of buttons, and that these could be operated using a mouse wheel if available.
Indeed, sliders could be included as an alternative form of control for the telescope, focus and slit. However, buttons should be kept, as they allow different degrees of adjustment (e.g. coarse, medium and fine, in the case of the telescope angle). The “steps” of a mouse wheel controlling a slider might correspond to fine adjustments, whereas the user would click on the slider and drag it to obtain coarser adjustments.
The students were asked: As a student with a disability, what is your opinion of the use of this type of system to provide access to practical work for disabled students? One student said that, when using the spectrometer in a lab, the person would move their body as they moved the telescope and that this would give them more of an impression of the angle. The student felt this was lost by using the spectrometer remotely.
This suggests that it could be useful to improve the client interface with a simple animation, to provide a clear notion of the relative positions of the spectrometer’s collimator and telescope.
file:///D|/dissertation.htm (145 of 160) [03-06-2005 14:50:53]

Dissertation
Top
Inheritance of Windows settings
The inheritance of Windows settings was tested to some extent during the development workflow, and minor problems were detected with the inheritance of font colours. Specifically, at the time of testing, Java labels, text fields, and titles of tabbed panes did not track the Windows "Message Box" font colour settings. Similarly, button captions did not track the "Menu" settings, and tool-tips did not track the "ToolTip" settings. However, the Java tool-tips erroneously tracked the “Message Box” settings. This was presumably due to software bugs in the used version of the JFC/Swing, which may have been eliminated in recent releases.
Top
Resizing of video feeds
The ability to change the size of the video feeds was intended to support all students as well as visually impaired students. All six of the students were observed to use this facility. The feed showing the Vernier scale was often enlarged when the students wanted to take a reading from the scale. The students were not specifically asked about this facility in the interviews, but one of the disabled students commented that feed number 2 (the overview feed) was not clear, and that enlarging it did not improve the clarity.
This suggests that this video feed was erroneously set by the laboratory technician to be processed and transmitted at a size of 160×120 pixels. As a result, no additional detail could be displayed when the image was enlarged to 320×240 pixels on the client.
Top
Auditory and visual feedback
The students were asked: Did you find the auditory feedback useful when controlling the spectrometer? The two mobility-impaired students replied ‘Yes’. One of them commented that it was useful because it meant he did not have to watch the screen all the time when waiting for something to happen in the lab.
file:///D|/dissertation.htm (146 of 160) [03-06-2005 14:50:53]

Dissertation
The hearing impaired student was asked an alternative question, on his opinion of the visual feedback provided (that is, the progress bars placed under the buttons). This student said he would prefer to receive feedback on the current position of the focus or slit on a continuum between their extremes, e.g., how open the slit was.
As explained previously under section 5.3.1, the progress bars placed on the user interface are merely a visual indication of whether a command is still being executed or is already completed. As to the possibility of continuous feedback on the position of the motorised parts, it would be difficult to provide visual feedback on the position of the telescope, focus, or slit during the execution of a command. The use of sliders as an alternative form of control (discussed earlier in this section) might provide a clear notion of the positions of the controlled elements, but these sliders would only be updated after the execution of each command.
Top
Keyboard shortcuts
None of the students used the available keyboard shortcuts. One student said he would have used them only once he was more familiar with the application. This suggests that, as long as a mouse is available, the keyboard shortcuts may only be needed by visually impaired students.
However, a member of the OU staff who is blind has informally tested the user interface, and confirmed that he was able to navigate to and operate all the controls.
Top
Compatibility with assistive technologies
None of the students with disabilities who volunteered for these trials were users of screen-reader or magnifier software, so the compatibility with such assistive software has not been validated with a student.
However, the author and the designer of the client user interface (Chetz Colwell) have extensively tested the interface with file:///D|/dissertation.htm (147 of 160) [03-06-2005 14:50:53]

Dissertation
the two Java-compatible applications known to date, namely the screen-reader Jaws for Windows from Freedom Scientific, and the combined screen-reader and magnifier ZoomText Xtra for Windows from AiSquared.
It was determined that the application’s interface is read in the way intended. Specifically, each time that any control is focused (by using the corresponding shortcut key, or by navigating to it using the Tab key), the accessible name of the control is properly read. The mechanism that allows reading the Angle and the Status bars was also successfully tested. Finally, when the user switches between open applications (by using the Alt+Tab keys), the screen-readers correctly read the title-bar of the newly focused application. This is relevant if other software is being used along with the client, for example for video-conferencing purposes.
The magnifying capabilities of ZoomText Xtra were tested by the author. It was confirmed that the application follows the input focus. For example, as the user navigates through the controls using the Tab key, the magnified area automatically moves the strictly necessary amount to include each newly focused control.
Additionally, the blind person who informally tested the interface’s keyboard shortcuts also tested the user interface with the Jaws screen-reader, and confirmed that he was able to get feedback on the names of focused controls and the progress of commands.
The interface designer has tested the UI with one voice recognition package, namely Dragon Naturally Speaking Pro from ScanSoft. This application is not Java-compatible; however, since the client interface is fully controllable via keyboard shortcuts, it is possible to operate it using voice equivalents of the shortcuts. For example, it is possible to trigger a Left Coarse movement by saying “L, C”. One disabled student who uses Dragon did volunteer for the trials, but he was unable to attend due to illness, so the compatibility of the application with Dragon has not been validated by a student.
Top
6.2.2. Usability
General
When asked whether the controls were easy to use, the three disabled students answered positively.file:///D|/dissertation.htm (148 of 160) [03-06-2005 14:50:53]

Dissertation
Top
Sharing control of the experiment
An issue that was raised several times during the project, relating to collaborative working, is that of the importance of students knowing what their partners are doing. Currently, an instance of the client interface being used by one student does not indicate which buttons are being pressed on another instance being used by another student.
This issue is particularly problematic in relation to the buttons that are used to select from a set of options (that is, the radio buttons for choosing between light sources and between chemical solutions). Radio buttons serve two functions: to select an option, and to see which is the currently selected option. In this case, when a student selects a radio button, the button changes in appearance to indicate that it has been selected. However, this indication only appears on the user interface of the student who made the selection; the other students’ interfaces will still indicate the previous state.
To compensate for such problems, the students are encouraged to collaborate, for example by means of video-conferencing software. The student who is currently operating the jig has to keep their partners informed of what they are doing. However, one student was heard to say to her partner “I wish I could see what you are doing”. Another student said they would like to have an indication on the interface as to which student was currently in control of the apparatus.
This problem could be solved by CORBA call-backs, which are a mechanism by which the server can asynchronously send information to the connected clients. As explained previously under section 4.5.1, although the system does not currently make use of call-backs, it was designed and implemented in a way that supports that mechanism.
Specifically, each time that a control is operated on one instance of the client, a call-back might be sent from the server to all the connected client instances. This would inform all clients of the new status of the system, to be reflected on the user interfaces. The call-back might also include information on which user issued the last executed command, again to be displayed on the interfaces.
Top
file:///D|/dissertation.htm (149 of 160) [03-06-2005 14:50:53]

Dissertation
Further potential improvements to usability
In addition to the comments made directly by the students, some observations made by the evaluators suggest some changes that could be made to the user interface, to improve its usability.
The labels on the buttons for changing the size of the video feeds (‘160×120’ and ‘320×240’) could be simplified to ‘larger’ and ‘smaller’, as the students do not necessarily need to know what the video resolution is.
When two video feeds are enlarged at the same time, the bottom of the client window goes beyond the bottom of the screen. Changing the alignment of the video feeds from vertical to horizontal would not solve this problem, as the screen width is equally limited. The provision of vertical scroll-bars on the client interface would allow the users to scroll the video feeds as desired, but this might prove to be an uncomfortable solution, and keyboard shortcuts for scrolling would have to be provided as well. Therefore, this problem should be seen simply as a limitation of the chosen screen resolution, and not as a problem of the user interface. A sufficiently high screen resolution should be chosen, to accommodate the entire client interface with more than one enlarged video feed.
One (non-disabled) student initially thought that the auditory feedback beeps were error beeps. The beeps could be changed to be more ‘positive’ sounding.
Currently, there is no visual indication when the focus and slit reach their fully open or closed states. It has been suggested several times that the UI could display the current position of the focus and slit on a continuum, but the designer has rejected the idea of cluttering the screen with more feedback. An alternative simple solution would be to replace the buttons with sliding controls, as suggested previously under section 6.2.1.
One of the disabled students suggested that the user interface could include an animated diagram of the spectrometer that responded to the student’s use of the controls, for example as the telescope in the lab moved this could be mirrored in the diagram. The possibility of improving the interface with this type of animation was also addressed under section 6.2.1.
Top
file:///D|/dissertation.htm (150 of 160) [03-06-2005 14:50:53]

Dissertation
6.3. Summary
This chapter described the tests that involved the overall system. First, a description of the technical validation stage was presented, which allowed determining to what extent the software met the defined functional requirements. The technical validation involved the testing of use cases, and the measurement of the effective bandwidth requirements of the video transmission system. All the specified use cases were tested successfully. Conclusions drawn from the technical tests were presented, and modifications found necessary to the system’s design were described. Then, an account of the OU student trials was given, focusing on the evaluation of the client application’s accessibility features and other aspects of its usability. The application was found accessible and generally usable, and some suggestions for improvements were gathered.
The following chapter will conclude this dissertation. Firstly, it will summarise the extent of implementation of the requirements initially defined, focusing on both functional and non-functional requirements. Then, some further development directions that could be followed in addition to this work will be presented, namely regarding the client user interface and video transmission subsystem.
Top
7. Conclusion
This chapter summarises, under section 7.1, the extent of implementation of the requirements that were initially defined. Then, section 7.2 presents some further development directions that could be followed in addition to this work.
Top
7.1. Extent of implementation
This section reviews the extent of implementation of the defined requirements. Section 7.1.1 focuses on the system’s functional requirements (initially specified under section 3.1.2), and section 7.1.2 addresses its non-functional requirements (specified under section 3.1.4).
file:///D|/dissertation.htm (151 of 160) [03-06-2005 14:50:53]

Dissertation
Top
7.1.1. Functional requirements
The implemented system meets the minimum functional requirements specified for both experiments. The students are able to control the automated laboratory equipment across the Internet, and to monitor the experiments being carried out, via a number of video channels. For the light spectra experiment, the implemented control use cases allow setting up the apparatus and examining spectral signatures, of sodium and several metal salts. For the wet chemistry experiment, the use cases allow observing all possible reactions, identifying unknown metals, calibrating the colorimeter, and measuring unknown concentrations of aluminium solutions. For both experiments, the laboratory technician is able to configure the control services offered via the Internet, operate the server-side software, and configure and operate the video transmission.
The specified optional functional requirements were considered and met whenever possible. An experimental version of the light spectra client was implemented as an applet, to work within an Internet browser. However, it was found that the characteristics of the client make it inappropriate for execution as an applet, and this approach was dropped. In fact, the operation of the client depends on a number of external libraries, namely ORBacus, Xerces, and the JMF. These libraries amount to several megabytes of data, which had to be transferred from the Web server to the browser at least once, upon the first use of the client applet. Moreover, the client requires access to the machine’s hard-drive, in order to read the XML description of the user interface and the corresponding accessibility data. This required the client applet to be digitally signed.
As to the requirement that little or none network configuration should be necessary on the client side, it is only met under certain conditions, as explained in detail under section 6.1.3. In other cases, it may be necessary to contact the client-side IT services, to obtain public addresses for the client machines.
No mechanism was implemented to prevent the loss of relevant video frames, under unfavourable network conditions. One such mechanism will be considered under section 7.2.4.
A mechanism was implemented to ensure an accurate timing of the switching between gas valves, in the light spectra version of the hardware server. This was described under section 4.2.2, and was implemented in addition to the specified
file:///D|/dissertation.htm (152 of 160) [03-06-2005 14:50:53]

Dissertation
requirements.
Top
7.1.2. Non-functional requirements
The specified accessibility requirements were met for the light spectra version of the client. The client interface implements features that support access by keyboard users and by users with disabilities, namely partially sighted and blind users. The interface also inherits the Windows display settings, which can be useful for any user.
In theory, the system meets the specified video performance requirement. A 512 Kbps broadband connection provided by an ISP is enough to ensure good video quality for three channels, in terms of both resolution and frame-rate.
Three of the system’s components were developed in Java language, to meet the specified portability requirement. The degree of portability of each of these components was described under section 5.2. In summary: the control server can be executed on any platform supported by Sun’s JVM (it is platform-independent); the video transmitter can be recompiled using different platform-specific versions of the JMF library; and the client is platform-independent if the accessibility features that depend on the JAB are not found necessary; otherwise, the client must be executed on a Windows platform.
The hardware server is inevitably platform-dependent, as it makes use of the Windows ActiveX controls developed by Zenon. This was an interoperability requirement.
The system was designed and implemented in an object-oriented fashion, to meet the specified reusability requirement. A large portion of the code developed for the light spectra version of the system was easily reused to implement the wet chemistry version. In particular, the code that forms the video transmission subsystem is common to both versions.
As required, the control connection for both experiments is based on a CORBA bridge across the Internet. In addition, local CORBA bridges are used between the control server, the video transmitter instances, and the hardware server.
The deployed software was accompanied by a user’s guide, to meet the specified documentation requirements. This guide is provided for reference in the electronic annex C and describes all the necessary steps for installation, configuration and
file:///D|/dissertation.htm (153 of 160) [03-06-2005 14:50:53]

Dissertation
operation of the system’s components.
Top
7.2. Further development directions
This section addresses development directions that could be followed in addition this work. Sections 7.2.1 to 7.2.4 focus, respectively, on the client user interfaces, the video-connection mechanism, an alternative video-transmission subsystem, and an additional frame-control mechanism. Section 7.2.5 discusses the complexity of such developments.
Top
7.2.1. Client interfaces
The results from the student trials described under section 6.2 provide ideas for improvements in the client user interfaces. Namely, the possibility of controlling the spectrometer using sliders, aside from buttons, and the inclusion of an animation to illustrate the relative positions of the collimator and telescope. For both experiments, CORBA call-backs could be used to ensure that the interfaces of all the connected clients would always reflect the same (current) status of the system.
In addition, the client interfaces might include keyboard shortcuts to toggle the input focus between the video feeds and the last used control. This would help users of magnifying software, as the change in the input focus would cause the magnified area of the screen to move automatically, as needed.
Currently, the accessibility information for the controls on the client interface (accessible names, tool-tips, etc.) is stored in a dedicated file. A simpler, more manageable solution would be to include this data in the XML file that contains a description of the interface’s layout.
The light spectra client might be improved with an image analysis component, capable of analising the telescope’s image to detect the presence of a spectral line (and perhaps also its colour). Such a mechanism would render the experiment fully accessible to blind users, without the need for any assistance. This would represent an advantage of the remote
file:///D|/dissertation.htm (154 of 160) [03-06-2005 14:50:53]

Dissertation
experimentation approach, in relation to the traditional laboratory situation.
Top
7.2.2. Video connection
As explained previously under section 4.4.2, the video transmitter’s code includes a pre-access “codec” that generates random video noise. This noise is transmitted for a few seconds upon the connection of each client, to work around a known limitation of the JMF. However, this noise is transmitted to all clients, which may be undesirable if a new client connects while an experiment is being carried out. A simple alternative would be to modify the existing codec to transmit only one line of video noise (e.g. at the bottom of the image). Ideally, this mechanism should be replaced by a post-access codec, which would affect only the video stream being transmitted to the newly connected client.
Top
7.2.3. Video broadcasting
The deployment diagram in Figure 32 (page 68 ) shows that each instance of the client must establish a control connection with the control server, plus a video connection with each video transmitter machine. This means that a client may need to establish connections with up to four separate server-side machines. As illustrated in Figure 21 (page 46 ), the client only needs to be aware of the control machine’s address, which in turn will provide the addresses and ports of the video transmitter machines. Nevertheless, this solution implies that many machines must be connected to the Internet and act as servers, rendering the system heavier, less flexible and less secure than would be desirable. The deployment diagram in Figure 57 illustrates a better solution.
file:///D|/dissertation.htm (155 of 160) [03-06-2005 14:50:53]

Dissertation
Figure 57 – Deployment diagram of the system with video broadcasting
The video transmitter machines executing instances of the transmitter are replaced by video-capture machines executing instances of JMStudio, which is a sample application distributed with the JMF. Among other functions, JMStudio can easily capture video from a camera and transmit it across an LAN. In this solution, up to three instances of JMStudio are used to capture video and stream it locally to a video broadcaster application running on the control server. In turn, this broadcaster is able to transmit the necessary video streams to all the connected clients.
Technically, this approach replaces a “multi-unicast” solution by a broadcast solution. The system becomes lighter, since no mechanism is needed to retrieve the addresses and port numbers of the video machines. Instead, all the necessary
file:///D|/dissertation.htm (156 of 160) [03-06-2005 14:50:53]

Dissertation
connections are directly established between each client and a single machine. The system is also more flexible, since any changes in the organisation of the video-capture machines (that is, which machines capture video from which cameras) do not require any server-side reconfiguration (opening of ports to the Internet, etc.). Since only one server exists, the system is also more secure.
Top
7.2.4. Frame control
During the tests that were carried out, the network conditions were always sufficiently good to prevent any relevant loss of video frames. Therefore, the students using the light spectra version of the system did not miss any spectral lines, while executing rotations of the telescope. Nevertheless, it is conceivable that unfavourable network conditions might represent a problem, since the image captured by the camera attached to the spectrometer’s telescope covers only a few degrees of rotation (the exact value varying with the type of camera being used). The activity diagram in Figure 58 illustrates a possible solution.
file:///D|/dissertation.htm (157 of 160) [03-06-2005 14:50:53]

Dissertation
Figure 58 – Activity diagram of telescope rotation with frame control
The client divides the required complete rotation by a small rotation step. This step should ensure that the captured image shifts less than its width. The complete rotation is thus broken into a sequence of small rotations. At the end of each small
file:///D|/dissertation.htm (158 of 160) [03-06-2005 14:50:53]

Dissertation
rotation, the control server returns the current time (as a time-stamp). The client receives this data and waits until it starts receiving video frames that are stamped as older than the received time-stamp. Only then, the client issues a request for the next rotational step. Once all the steps have been performed, one last small rotation must be executed, to allow for the rest of the integer division.
Top
7.2.5. Complexity of further developments
It is worth commenting upon the complexity of the further development directions that were considered in the previous sections.
It would be relatively easy to implement a mechanism based on CORBA call-backs, to ensure visual synchronisation of the user interfaces. As described previously under section 4.5.1, the implemented client is already provided with the capability of receiving call-backs from the server. A single call-back method would be sufficient to pass a data structure from the server to the client, containing updated information on the status of the experimental apparatus. A new component within the client should then be implemented, to interpret the received data structure and update the user interface accordingly.
The implementation of keyboard shortcuts to toggle the input focus between the video feeds and the last used control would be trivial, and quite similar to the already implemented mechanism that deviates the input focus to the Angle and Status bars.
As to the inclusion of the interface’s accessibility data in the XML file that defines the interface’s layout, it would represent a small amount of work. The code that currently interprets the accessibility data would merely have to be incorporated into the XML-parsing code.
The implementation of an image-analysis component to detect the presence of a spectral line on the image rendered by the client, although perfectly feasible, would probably represent a considerable amount of development work. An appropriate image analysis technique would have to be selected. Moreover, the developed code would have to be thoroughly tested with both types of light sources (sodium lamp and Bunsen burner), and with all possible colours of spectral lines.
Regarding the video connection mechanism, it would be relatively easy to modify the current noise generator, to file:///D|/dissertation.htm (159 of 160) [03-06-2005 14:50:53]

Dissertation
superimpose a single line of video noise on the image being transmitted. Instead of replacing the entire transmitted frames with noise frames (as happens currently), the code would have to access the transmitted frames and replace only one line of video with noise.
The code developed for the video transmitter could be easily adapted to implement the envisaged broadcaster application. Instead of capturing video directly from one camera, the application should be capable of receiving up to three streams across the local network, from the local JMStudio transmitters. These streams would then be retransmitted to each connected client, using the transmitter functionality that is already implemented.
Finally, the addressed frame-control mechanism would be relatively easy to implement, although implying the modification of several applications. The requests for telescope rotations would have to be broken into sub-requests on the client. Upon the completion of each sub-rotation, the control server would have to retrieve from the video transmitter the time-stamp of the last sent frame, and send it to the client. Then, the time-stamps of video frames being received by the client would have to be extracted and compared with the one received from the server.
The further development directions referred in the previous paragraphs will of course require financial support. The PEARL project has now ended, but any new initiative that builds upon the PEARL results will be able to refine the technical solutions that were presented in this document.
Top
file:///D|/dissertation.htm (160 of 160) [03-06-2005 14:50:53]