11. gas discharge displays - fh-muenster.de. gas discharge displays content 11.1 technologies for...
TRANSCRIPT

Chapter Gas Discharge Displays
Slide 1
Incoherent light sources
Prof. Dr. T. Jüstel
11. Gas Discharge Displays
Content
11.1 Technologies for Flat Displays
11.2 Construction of Gas Discharge Displays
11.3 Manufacturing Process
11.4 Light Generation in Plasma Displays
11.5 Operation of the Gas Discharge
11.6 Selection Criteria for Display Phosphors
11.7 Phosphors in CRTs and PDPs
11.8 Red PDP Phosphors
11.9 Green PDP Phosphors
11.10 Blue PDP Phosphors
11.11 Status and Outlook

Chapter Gas Discharge Displays
Slide 2
Incoherent light sources
Prof. Dr. T. Jüstel
11.1 Technologies for Flat Displays
Technology Efficiency Max. size Areas of application
Organic EL 2 lm/W 10„„ Automobiles, mobile phones
Inorg. EL 1 lm/W 17„„ Instrument displays
FED 5 lm/W 17„„
LCD 4 lm/W 65„„ Laptops, monitors, LCD TV
PALC 4 lm/W 40 - 50„„ -
LED Array 8 - 10 lm/W > 100„„ Billboards
Projection TV 5 lm/W 50 - 60„„ TV
PDP 5 lm/W ~ 152„„ TV, scoreboards
CRT 3 lm/W 36„„ TV, monitors
Remark: Theoretical limit for white light ~ 300 lm/Wopt.
Energy efficiency of displays ~ 1 - 5%

Chapter Gas Discharge Displays
Slide 3
Incoherent light sources
Prof. Dr. T. Jüstel
11.1 Technologies for Flat Displays
Properties
Flat and large
(32 - 300 inch)
Thin ~ 100 mm
Lightweight
~ 20 - 30 kg for 42-inch
Large viewing angle
~ 170°
No distortion
Unaffected by external
magnetic fields
Gas Discharge Displays
152" HDTV-PDP

Chapter Gas Discharge Displays
Slide 4
Incoherent light sources
Prof. Dr. T. Jüstel
11.1 Technologies for Flat Displays
Emissive Display Types
Technology CRT PDP
Excitation source Electron beam Gas discharge
Excitation energy 20 - 30 keV 6 - 10 eV
Gas pressure < 10-3 mbar 200 - 300 mbar Xe/Ne
Phosphors Sulfides Oxides
Viewing angle > 160° > 160°
Resolution EDTV UHTV
720 x 480 pixel 3840 x 2160 pixel (4K)

Chapter Gas Discharge Displays
Slide 5
Incoherent light sources
Prof. Dr. T. Jüstel
11.1 Technologien für flache Bildschirme 11.1 Technologies for Flat Displays
Plasma displays 1929

Chapter Gas Discharge Displays
Slide 6
Incoherent light sources
Prof. Dr. T. Jüstel
11.2 Construction of Gas Discharge Displays
Rear
glass plate (PD200)
Address electrodes (Ag)
RGB phosphor
Bus electrode (ITO)
Front glass plate
R G B
Dielectric
MgO protective layer
Dielectric
Gas filling ~ 500 Torr Ne with 3 - 5 % Xe
Simplified layer structure

Chapter Gas Discharge Displays
Slide 7
Incoherent light sources
Prof. Dr. T. Jüstel
11.2 Construction of Gas Discharge Displays
Conical structure
U-shaped structure
Structure of a plasma cell
Glass back panel
Structuring by barrier ribs
TiO2-film as a reflector
Phosphor layer (with
additives)
Chapter Gas Discharge Displays
Slide 8
Incoherent light sources
Prof. Dr. T. Jüstel
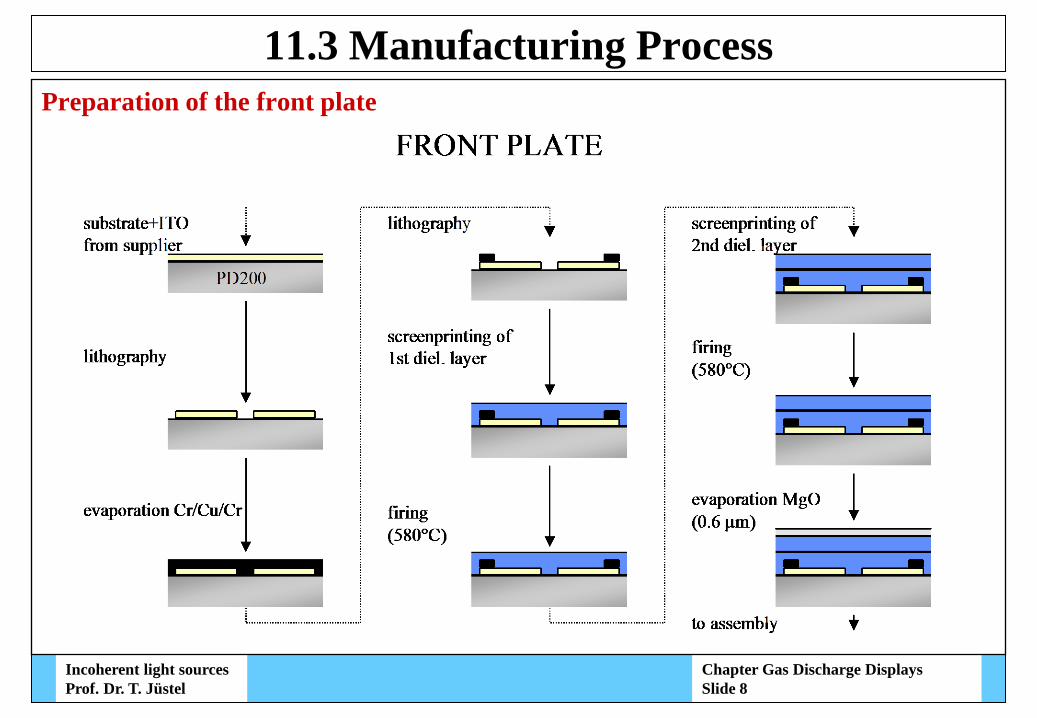
11.3 Manufacturing Process
Preparation of the front plate

Chapter Gas Discharge Displays
Slide 9
Incoherent light sources
Prof. Dr. T. Jüstel
11.3 Manufacturing Process
Preparation of the back plate

Chapter Gas Discharge Displays
Slide 10
Incoherent light sources
Prof. Dr. T. Jüstel
11.4 Light Generation in Plasma Displays
Front glass plate
Gas discharge
VUV VUV
Visible
light
Rear glass plate
~ 200 µm
Noble gas discharge
VUV light
Phosphor
Visible light
Functional principle

Chapter Gas Discharge Displays
Slide 11
Incoherent light sources
Prof. Dr. T. Jüstel
PDP-cell Xe2 * - lamp Hg - lamp
h Plasma 24 % 70 % 75 %
h UV 40 % 90 % 98 %
h Phosphor
20 % 25 % 44 %
h Coupling out 50 % 90 % 98 %
h Display 1.0 % 14 % 30 %
Typ. light output 3 lm/W 40 lm/W 90 lm/W
11.4 Light Generation in Plasma Displays
Efficiency of light generation
hdisplay = hdischarge . hUV
. hphosphor . h out-coupling

Chapter Gas Discharge Displays
Slide 12
Incoherent light sources
Prof. Dr. T. Jüstel
11.4 Light Generation in Plasma Displays
400 500 600 700 800
0,0
0,2
0,4
0,6
0,8
1,0
Em
issio
n in
ten
sity [
a.u
.]
Wavelength [nm]
Light generation in Ne discharges
Ne + e- Ne* + e-
Ne* Ne + h(74 nm + vis.)
Ne* + Ar Ne + Ar+ + e-
Ne* + Xe Ne + Xe+ + e-
(Penning ionization)
- Monochrome PDPs
- Neon discharge lamps
- Hg-discharge lamps with Ne-filling "neon lamps"
Gas mixtures of Ne/Ar or Ne/Xe thus cause a reduction of the ignition voltage by
the so-called “Penning effect”
Chapter Gas Discharge Displays
Slide 13
Incoherent light sources
Prof. Dr. T. Jüstel
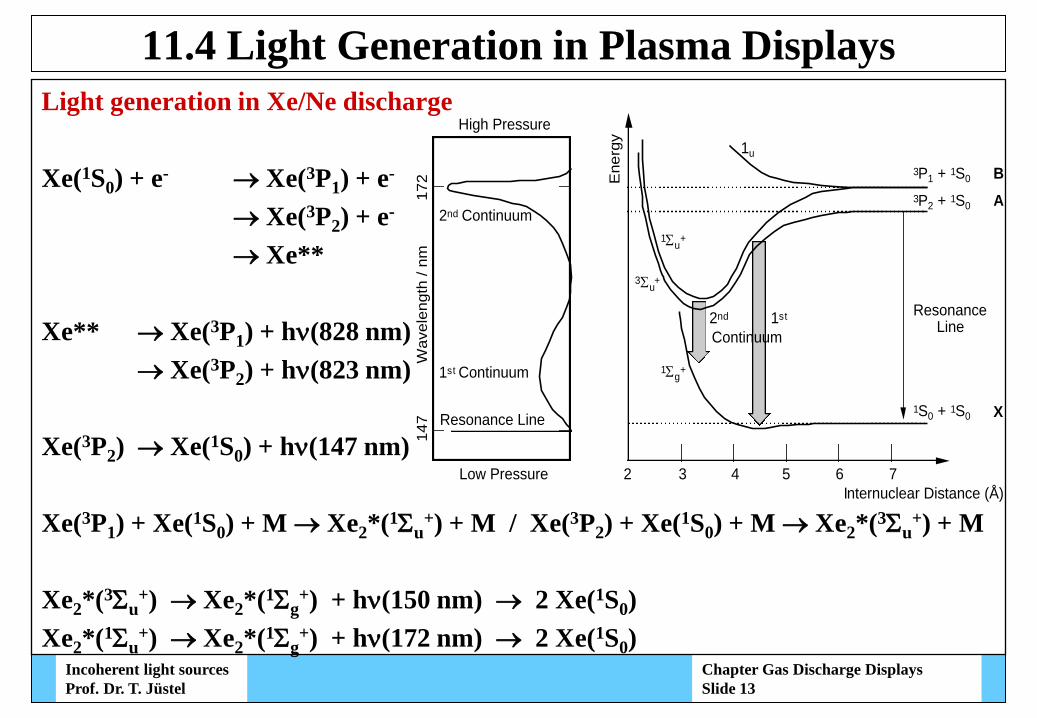
11.4 Light Generation in Plasma Displays
Light generation in Xe/Ne discharge
Xe(1S0) + e- Xe(3P1) + e-
Xe(3P2) + e-
Xe**
Xe** Xe(3P1) + h(828 nm)
Xe(3P2) + h(823 nm)
Xe(3P2) Xe(1S0) + h(147 nm)
Xe(3P1) + Xe(1S0) + M Xe2*(1u+) + M / Xe(3P2) + Xe(1S0) + M Xe2*(3u
+) + M
Xe2*(3u+) Xe2*(1g
+) + h(150 nm) 2 Xe(1S0)
Xe2*(1u+) Xe2*(1g
+) + h(172 nm) 2 Xe(1S0)
Internuclear Distance (Å)
2 3 4 5 6 7
Ene
rgy
Resonance Line
1st2nd
Continuum
1u
3P1 + 1S0
3P2 + 1S0
B
A
1S0 + 1S0 X
3u+
1u+
1g+
Wa
ve
len
gth
/ n
m147
172
Resonance Line
Low Pressure
High Pressure
2nd Continuum
1st Continuum

Chapter Gas Discharge Displays
Slide 14
Incoherent light sources
Prof. Dr. T. Jüstel
11.4 Light Generation in Plasma Displays
50% Xe2*-excimer and 50% Xe* resonance emission at 25 mbar Xe partial pressure
PDPs 2005: Xe percentage at 10 - 15% and 300 mbar total pressure, i.e., Xe2*-excimer
radiation predominates
0,001
0,010
0,100
1,000
0 50 100 150 200
Re
lati
ve
pro
po
rtio
n o
f ra
dia
tio
n
Xenon partial pressure / mbar
150 nm
147 nm
172 nm
140 150 160 170 180 190
0,0
0,2
0,4
0,6
0,8
1,0
10% Xe
20% Xe
1% Xe
Em
issio
n in
ten
sity [
a.u
.]
Wavelength [nm]
Light generation in Xe/Ne discharge

Chapter Gas Discharge Displays
Slide 15
Incoherent light sources
Prof. Dr. T. Jüstel
With the Xe pressure the efficiency and the ignition voltage increases
11.4 Light Generation in Plasma Displays
Influence of Xe partial pressure
0
100
200
300
400
500
600
0 5 10 15 20
Xe-content (%)
Su
sta
invo
ltag
e (
V)
Vsm
Vf
660 mbar, 500 V, 50 kHz
0
1000
2000
3000
4000
0 5 10 15 20
Xe-content (%)
Lu
min
an
ce (
cd/m
2)
0
1
2
3
4
5
6
Effi
cacy
(lm
/W)

Chapter Gas Discharge Displays
Slide 16
Incoherent light sources
Prof. Dr. T. Jüstel
100% Ne Ne/Xe 100% Xe
High ignition voltage
~ 2 kV
No visible emission
(color is defined by the
phosphor)
VUV emission
147, 150, 172 nm
Low ignition voltage
~ 300 V
Visible emissions
580 - 720 nm
(Monochrome red)
VUV emission
74 nm
11.4 Light Generation in Plasma Displays
Dependence on the Xe/Ne partial pressure

Chapter Gas Discharge Displays
Slide 17
Incoherent light sources
Prof. Dr. T. Jüstel
11.5 Operation of the Gas Discharge
0
V
0
I
t
Dielectric barrier discharges
Schematic operation of a PDP-cell Course of voltage and current
V 0
Dielectric
negative glow
negative glow

Chapter Gas Discharge Displays
Slide 18
Incoherent light sources
Prof. Dr. T. Jüstel
11.5 Operation of the Gas Discharge
Addressing the pixel
Each pixel has 2n brightness levels
By 8-bit addressing one obtains 28 = 256 brightness levels
In a RGB-display there is therefore 2563 = 16.7 million colors available
1 2 4 8 16 32
1 Frame: Will be specified by the refresh rate (100 Hz)
erasing/priming addressing sustaining

Chapter Gas Discharge Displays
Slide 19
Incoherent light sources
Prof. Dr. T. Jüstel
11.5 Operation of the Gas Discharge
Influence of the surface on the plasma ignition by ion induced emission of
secondary electrons
i =
MgO is the material with the highest Ne ~ 0.5
Number of emitted electrons
Number of ions on the surface
Plasma MgO
Front glass
2
2
)1/1ln(ln
i
f
dpC
dpDV

Chapter Gas Discharge Displays
Slide 20
Incoherent light sources
Prof. Dr. T. Jüstel
11.5 Operation of the Gas Discharge
MgO protective layer causes
• a protection against sputtering
• a reduction of the ignition voltage
0 10 20 30
100
150
200
250
300
350
400
450
Glas, i = 0.06
MgO, i = 0.5
Ne
Ign
itio
n v
olta
ge
(V
)
p x d (Torr cm)
10 10010
-2
10-1
100
Ne
MgO; i = 0.5
Glas; i = 0.06
Eff
ective
s g
am
ma
E / p (V Torr-1 cm
-1)
Tasks of the MgO protective layer

Chapter Gas Discharge Displays
Slide 21
Incoherent light sources
Prof. Dr. T. Jüstel
11.6 Selection Criteria for Display Phosphors Stability
Temperature stability Sensitivity to oxidation
Stability in suspension Solubility, surface potential
Plasma stability Resistance to sputtering
Color point stability Photo-oxidation, reduction
Light output
Linearity Saturation
Efficiency Quantum yield QA, absorption A
Image quality
Image artifacts Decay time
Color space Color point x, y
Environmental compatibility
Energy efficiency Quantum yield QA, absorption A
Toxicity Chemical composition

Chapter Gas Discharge Displays
Slide 22
Incoherent light sources
Prof. Dr. T. Jüstel
11.6 Selection Criteria for Display Phosphors
Plasma Display
• High absorption A under VUV excitation, i.e., band gap EG ~ 6 – 8 eV
• High quantum yield QY under VUV excitation, i.e., Eu2+, Tb3+, Mn2+, Eu3+
• High light output LO = QY*A
• VUV stability
1 µm
VUV (PDPs) or electrons (CRTs) Visible light
Chapter Gas Discharge Displays
Slide 23
Incoherent light sources
Prof. Dr. T. Jüstel
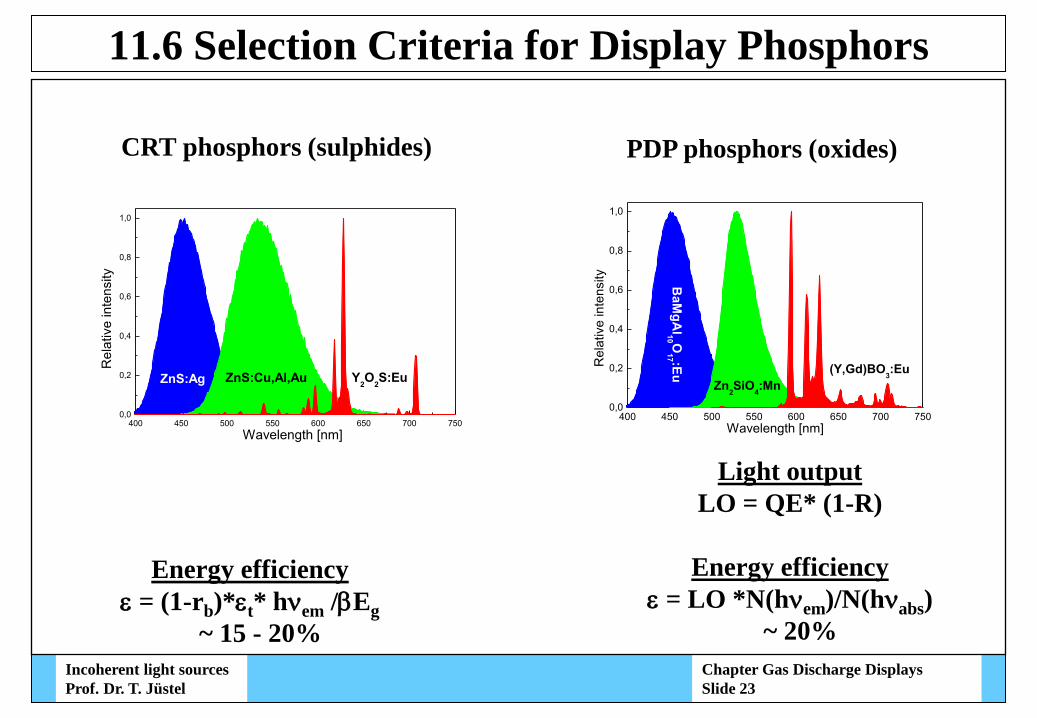
11.6 Selection Criteria for Display Phosphors
Light output
LO = QE* (1-R)
Energy efficiency
= LO *N(hem)/N(habs)
~ 20%
400 450 500 550 600 650 700 7500,0
0,2
0,4
0,6
0,8
1,0
Re
lative
in
ten
sity
(Y,Gd)BO3:Eu
Zn2SiO
4:Mn
BaMgAl10 O
17 :Eu
Wavelength [nm]
Energy efficiency
= (1-rb)*t* hem /Eg
~ 15 - 20%
PDP phosphors (oxides) CRT phosphors (sulphides)
400 450 500 550 600 650 700 7500,0
0,2
0,4
0,6
0,8
1,0
Re
lative
in
ten
sity
Wavelength [nm]
Y2O2S:EuZnS:Cu,Al,AuZnS:Ag

Chapter Gas Discharge Displays
Slide 24
Incoherent light sources
Prof. Dr. T. Jüstel
11.7 Phosphors in CRTs and PDPs
Commercial CRT and PDP phosphors
Color Chemical composition x y Problem areas
Blue ZnS:Ag 0.15 0.08
Green ZnS:Cu 0.29 0.61
Y3(Al,Ga)5O12:Tb 0.37 0.55
Y2SiO5:Tb 0.33 0.58
Gd2O2S:Tb 0.36 0.57
Red YVO4:Eu 0.66 0.33
Y2O2S:Eu 0.66 0.33
Blue (Y,Gd)(V,P)O4 0.16 0.13 Burn-in
BaMgAl10O17:Eu 0.15 0.06 (stability)
Green Zn2SiO4:Mn 0.25 0.70 Motion artifacts
BaMgAl10O17:Eu,Mn 0.15 0.72 (decay time)
BaAl12O19:Mn 0.19 0.73
(Y,Gd)BO3:Tb 0.34 0.62
Red (Y,Gd)BO3:Eu 0.64 0.35 Color gamut
(Y,Gd)2O3:Eu 0.65 0.34 (color point)
(Y,Gd)(V,P)O4:Eu 0.66 0.33
CRT
PDP

Chapter Gas Discharge Displays
Slide 25
Incoherent light sources
Prof. Dr. T. Jüstel
11.7 Phosphors in CRTs and PDPs
Cathode ray tube (CRTs)
Color space is defined by the color points
of the phosphor
x y
ZnS:Ag 0.15 0.08
ZnS:Cu,Al, Au 0.29 0.61
Y2O2S:Eu 0.66 0.33
Plasma displays (PDPs)
Gas filling: Ne, 3 - 15% Xe
Red neon lines reduce color purity of
blue and green phosphor
x y
BaMgAl10O17:Eu 0.15 0.06
Zn2SiO4:Mn 0.25 0.70
(Y,Gd)BO3:Eu 0.65 0.35
Color space

Chapter Gas Discharge Displays
Slide 26
Incoherent light sources
Prof. Dr. T. Jüstel
11.8 Red PDP Phosphors
Eu2+ phosphors
Transition: 4f65d1 4f7 (bands)
Position depends on the crystal field
~ 1 µs
Eu3+ phosphors
Transition: 5D0 7FJ (lines)
Inversion symmetry (S6, D3d)
Magnetic dipole transition 5D0 - 7F1
J = 0, ± 1 (J = 0 J = 0 forbidden)
MeBO3:Eu (calcite, vaterite)
~ 8 - 16 ms
No inversion symmetry
Electric dipole transition 5D0 -7F2,4
J 6 (Jbeginning = 0 J = 2, 4, 6)
Y2O3:Eu (bixbyite), Y(V,P)O4:Eu (xenotime)
~ 2 - 5 ms

Chapter Gas Discharge Displays
Slide 27
Incoherent light sources
Prof. Dr. T. Jüstel
Color saturation: Y2O2S:Eu > YVO4:Eu > Y2O3:Eu > (Y,Gd)BO3:Eu
600 650 700 750
5D
0 -
7F
3
5D
0 -
7F
4
5D
0 -
7F
2
5D
0 -
7F
1
(Y,Gd)BO3:Eu
Y2O
3:Eu
YVO4:Eu
Y2O
2S:Eu
Inte
nsity
Wavelength [nm]
Phopshor Color point x, y (Y,Gd)BO3:Eu 0.640 0.360 Y2O3:Eu 0.641 0.344 YVO4:Eu 0.645 0.343 Y2O2S:Eu 0.650 0.342
11.8 Red PDP Phosphors
Emission spectra and color points

Chapter Gas Discharge Displays
Slide 28
Incoherent light sources
Prof. Dr. T. Jüstel
Phosphor (Y,Gd)BO3:Eu Y2O3:Eu YVO4:Eu Y2O2S:Eu
Band gap EG 7.5 eV 5.6 eV 5.0 eV 4.4 eV
150 200 250 300
0,0
0,2
0,4
0,6
0,8
1,0
1,2
1,4
(Y,Gd)BO3:Eu
YVO4:Eu
Y2O
3:Eu
Y2O
2S:Eu
Lig
ht outp
ut
Wavelength [nm]
Phosphor Light output LO
147 nm 172 nm
(Y,Gd)BO3:Eu 0.78 0.75 Y2O3:Eu 0.60 0.69 YVO4:Eu 0.41 0.50 Y2O2S:Eu 0.26 0.32
11.8 Red PDP Phosphors
Efficiency
Excitation spectra and VUV light output of Eu3+-phosphors
Chapter Gas Discharge Displays
Slide 29
Incoherent light sources
Prof. Dr. T. Jüstel
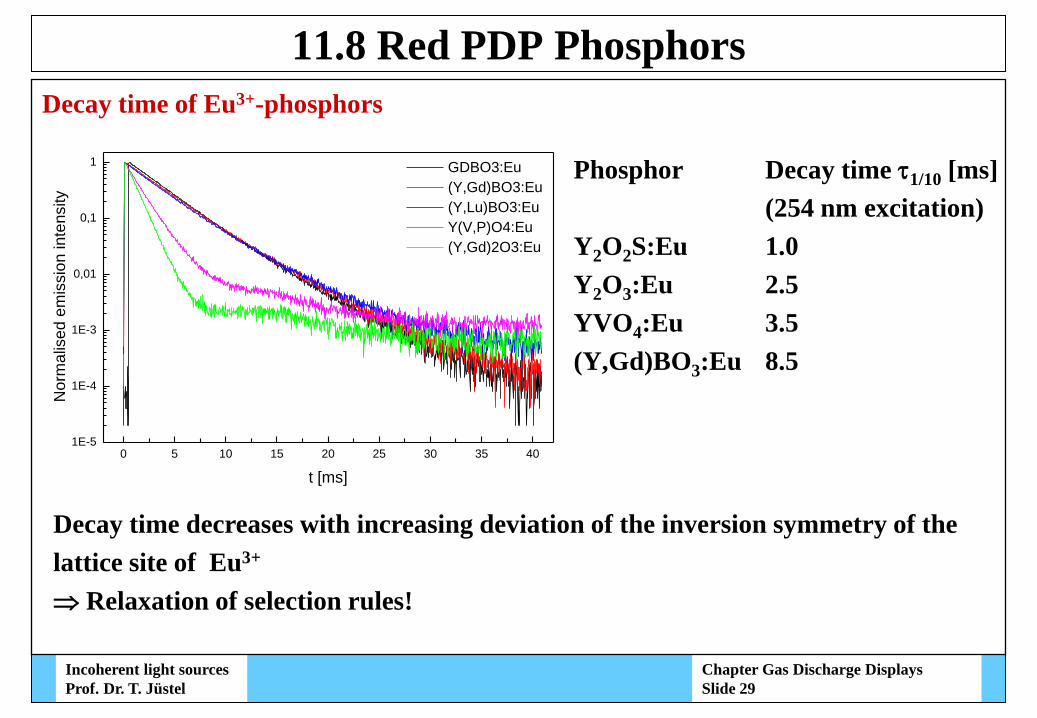
11.8 Red PDP Phosphors
Phosphor Decay time 1/10 [ms]
(254 nm excitation)
Y2O2S:Eu 1.0
Y2O3:Eu 2.5
YVO4:Eu 3.5
(Y,Gd)BO3:Eu 8.5
0 5 10 15 20 25 30 35 401E-5
1E-4
1E-3
0,01
0,1
1 GDBO3:Eu
(Y,Gd)BO3:Eu
(Y,Lu)BO3:Eu
Y(V,P)O4:Eu
(Y,Gd)2O3:Eu
No
rma
lise
d e
mis
sio
n inte
nsity
t [ms]
Decay time decreases with increasing deviation of the inversion symmetry of the
lattice site of Eu3+
Relaxation of selection rules!
Decay time of Eu3+-phosphors

Chapter Gas Discharge Displays
Slide 30
Incoherent light sources
Prof. Dr. T. Jüstel
11.8 Red PDP Phosphors
(J. Solid State Chem. 128 (1997) 261-266)
• Location A: Slight deviation from the S6 symmetry (C3)
• Location B: Strong deviation from the S6 symmetry ( (C3)
5D0 - 7F2,4 emission is observed due to the deviation of the S6 symmetry
Local symmetry of Y3+ and Eu3+ in YBO3 (vaterite)
Platz A Platz B

Chapter Gas Discharge Displays
Slide 31
Incoherent light sources
Prof. Dr. T. Jüstel
11.8 Red PDP Phosphors
Color point shifts from orange to red in the series Gd3+, Y3+, Lu3+
Distortion depends on r[(Eu3+) - r(Me3+)]
550 600 650 700 7500,0
0,2
0,4
0,6
0,8
1,0
GdBO3:Eu
YBO3:Eu
LuBO3:Eu
Em
issio
n in
ten
sity [
a.u
.]
Wavelength [nm]
585 nm 5D0 - 7F0
594 nm 5D0 - 7F1
612, 627 nm 5D0 - 7F2
650 - 680 nm 5D0 - 7F3
690 - 720 nm 5D0 - 7F4
Cation Radius* [Å]
Lu 1.00
Y 1.04
Gd 1.08
Eu 1.09
*for CN= 6
Emission spectra of LnBO3:Eu (vaterite)

Chapter Gas Discharge Displays
Slide 32
Incoherent light sources
Prof. Dr. T. Jüstel
11.8 Red PDP Phosphors
Color point as a function of excitation energy
• Charge-transfer excitation 254 nm x = 0.638, y = 0.360
• Band excitation 147 nm x = 0.646, y = 0.349
Feldman equation:
R = 0.046*U5/3/ [µm]
(Y,Gd)BO3:Eu = 5.2 g/cm3
10 kV R~ 500 nm
2 kV R ~ 30 nm
0,60 0,61 0,62 0,63 0,64 0,65 0,66
0,32
0,33
0,34
0,35
0,36
0,37
254 nm
172 nm
147 nm
10 kV
2 kVy
x
Color point of (Y,Gd)BO3:Eu3+

Chapter Gas Discharge Displays
Slide 33
Incoherent light sources
Prof. Dr. T. Jüstel
11.8 Red PDP Phosphors
Small excitation volume
PDP phosphors are highly charged:
• Saturation
• Strong aging
• Surface layer of the particles must be pure phase and highly crystalline
254 nm corresponds ~ 10 kV
147 nm corresponds ~ 1 kV
R ~ 1.5 µm
R < 0.1 µm
Penetration depth of VUV radiation in matter

Chapter Gas Discharge Displays
Slide 34
Incoherent light sources
Prof. Dr. T. Jüstel
11.8 Red PDP Phosphors
Emission spectrum = f(excitation energy)
Photoluminescence Cathodoluminescence
500 600 7000,0
0,5
1,0 2 kV
10 kV
Inte
nsitä
t
Wellenlänge [nm]
500 600 7000,0
0,5
1,0 254 nm
172 nm
147 nm
Inte
nsitä
t
Wellenlänge [nm]
Emission spectra of (Y,Gd)BO3:Eu

Chapter Gas Discharge Displays
Slide 35
Incoherent light sources
Prof. Dr. T. Jüstel
11.8 Red PDP Phosphors
Trigonal, D3d symmetry
x = 0.61, y = 0.38
Cubic, Oh symmetry
Cation vacancies
x = 0.64 , y = 0.33
CaO:Eu LuBO3:Eu
200 300 400 500 600 700 8000,0
0,2
0,4
0,6
0,8
1,0
7F
2
7F
4
Em
issio
n in
ten
sity [
a.u
.]Wavelength [nm]
200 300 400 500 600 700 8000,0
0,2
0,4
0,6
0,8
1,0
7F
2
7F
4
7F
1
Em
issio
n in
ten
sity [
a.u
.]
Wavelength [nm]
Color points of Eu3+-phosphors

Chapter Gas Discharge Displays
Slide 36
Incoherent light sources
Prof. Dr. T. Jüstel
11.9 Green PDP Phosphors
Host lattice 1/10 [ms]
LaPO4 5.5
CeMgAl11O19 7.0
YBO3 8.5
1/10 = f(host lattice)
400 450 500 550 600 650 7000,0
0,2
0,4
0,6
0,8
1,0
Wavelength [nm]
BaAl12
O19
:Mn x = 0.204, y = 0.717
Zn2SiO
4:Mn x = 0.249, y = 0.700
Em
issio
n inte
nsity [
a.u
.]
Mn2+-phosphors
0,0
0,2
0,4
0,6
0,8
1,0
YBO3:Tb x = 0.338, y = 0.615
LaPO4:Tb x = 0.352, y = 0.580
Em
issio
n inte
nsity [
a.u
.]
Host lattice 1/10 [ms]
Zn2SiO4 5 - 40
BaAl12O19 5 - 40
BaMgAl10O17 5 - 40
1/10 = f(Mn2+-concentration)
Tb3+-phosphors
Emission spectra and decay times of Mn2+- and Tb3+-phosphors

Chapter Gas Discharge Displays
Slide 37
Incoherent light sources
Prof. Dr. T. Jüstel
11.9 Green PDP Phosphors
Color saturation
Mn2+-phosphors
y- coordinate: 0.69 - 0.73
Tb3+-phosphors
y- coordinate : 0.58 - 0.62
Tb3+ has emission-line
multiplets at 590 and 620 nm
Zn2SiO4:Mn
YBO3:Tb

Chapter Gas Discharge Displays
Slide 38
Incoherent light sources
Prof. Dr. T. Jüstel
11.9 Green PDP Phosphors
Zn2SiO4:Mn CIE1931 color point x, y
• as a powder 0.25, 0.70
• in PDP 10% Xe 0.23, 0.69
• in PDP 3.5% Xe 0.34, 0.62 similar to CRT
400 500 600 700 8000,0
0,2
0,4
0,6
0,8
1,0
File: ColourPoints of green PDPs
P116 3.5% Xe, ZSM
x=0.338, y=0.619
Em
issio
n inte
nsity [
a.u
.]
Wavelength [nm]
400 500 600 700 8000,0
0,2
0,4
0,6
0,8
1,0
File: ColourPoints of green PDPs
P183 10 % Xe, ZSM
x=0.233, y=0.686
Em
issio
n inte
nsity [
a.u
.]
Wavelength [nm]
3.5% Xe 10% Xe
Spectra of the green PDP-pixels with Zn2SiO4:Mn

Chapter Gas Discharge Displays
Slide 39
Incoherent light sources
Prof. Dr. T. Jüstel
3.5 % Xe 10 % Xe
11.9 Green PDP Phosphors
(Y,Gd)BO3:Tb CIE 1931 color point x. y
• as a powder 0.34, 0.62
• in PDP 10% Xe 0.35, 0.60 similar to CRT
• in PDP 3.5% Xe 0.39, 0.53
400 500 600 700 8000,0
0,2
0,4
0,6
0,8
1,0
File: ColourPoints of green PDPs
P249 10% Xe, YGBT
x=0.346 , y=0.595
Em
issio
n inte
nsity [
a.u
.]
Wavelength [nm]
400 500 600 700 8000,0
0,2
0,4
0,6
0,8
1,0 P206 3.5% Xe, YBT
x=0.391 , y=0.534
Em
issio
n in
ten
sity [
a.u
.]
Wavelength [nm]
Spectra of the green PDP-pixels with (Y,Gd)BO3:Tb

Chapter Gas Discharge Displays
Slide 40
Incoherent light sources
Prof. Dr. T. Jüstel
11.10 Blue PDP Phosphors
Me = Ba (1.34 Å) BAM
• BaMgAl10O17 -alumina
• BaMg3Al14O25 -alumina
Me = Sr (1.12 Å) SAM
• SrMgAl10O17 -alumina
• Sr2MgAl22O36 = SrMgAl10O17 + SrAl12O19
(-alumina + magnetoplumbite)
Me = Ca (0.99 Å) CAM
• CaMgAl14O23 magnetoplumbite
• CaMg2Al16O27 magnetoplumbite
• CaMgAl10O17 -alumina
(unstable magnetoplumbite)
magnetoplumbite -alumina
Construction of the intermediate layer
Phosphors in the system MeO-MgO-Al2O3
Chapter Gas Discharge Displays
Slide 41
Incoherent light sources
Prof. Dr. T. Jüstel
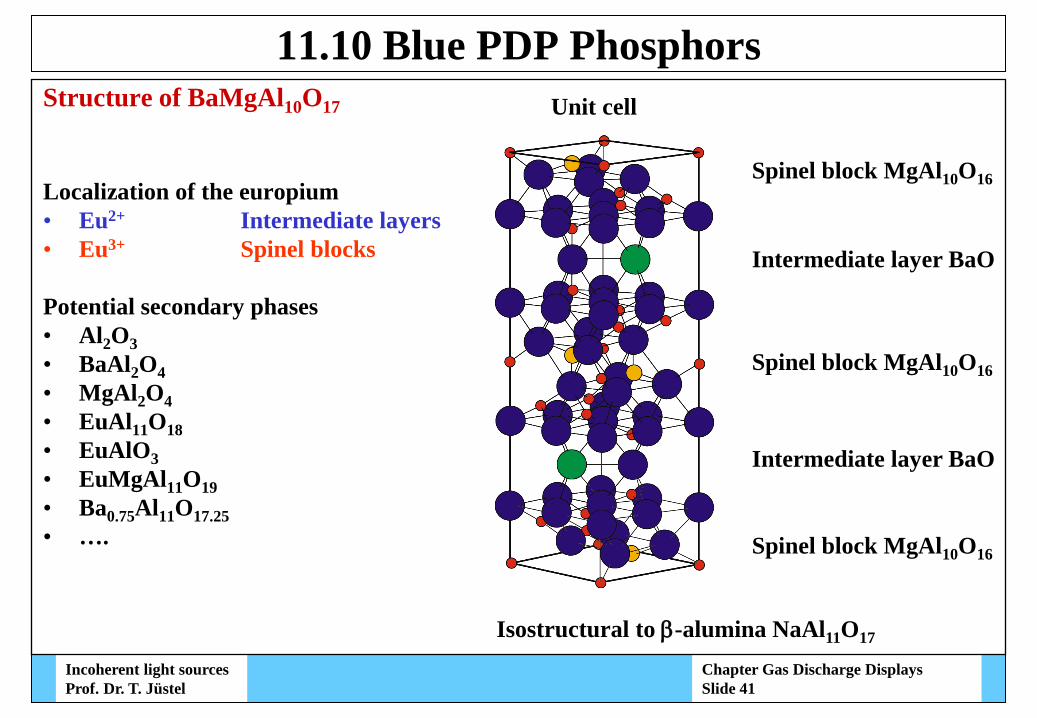
11.10 Blue PDP Phosphors Structure of BaMgAl10O17
Localization of the europium
• Eu2+ Intermediate layers
• Eu3+ Spinel blocks
Potential secondary phases
• Al2O3
• BaAl2O4
• MgAl2O4
• EuAl11O18
• EuAlO3
• EuMgAl11O19
• Ba0.75Al11O17.25
• ….
Isostructural to -alumina NaAl11O17
Spinel block MgAl10O16
Intermediate layer BaO
Spinel block MgAl10O16
Intermediate layer BaO
Spinel block MgAl10O16
Unit cell

Chapter Gas Discharge Displays
Slide 42
Incoherent light sources
Prof. Dr. T. Jüstel
11.10 Blue PDP Phosphors
Ba2+(Eu2+) is nine-coordinate (tri-capped trigonal prism D3h)
Relative small crystal field splitting Blue emission band
Ba2+ environment Layer structure
Structure of BaMgAl10O17

Chapter Gas Discharge Displays
Slide 43
Incoherent light sources
Prof. Dr. T. Jüstel
11.10 Blue PDP Phosphors
Stability limit of -alumina phase lies at M12k > 4.6 Å
Eu2+ (r9 = 1.17 Å) is smaller than Sr2+ (r9 = 1.26 Å)
Thus: Eu2+-ion incorporation destabilizes the ß-alumina phase
Incorporation of large cations stabilizes the ß-alumina phase (Rb+, K+)
Structural influence of the cations
in the interlayer
1,1 1,2 1,3 1,4 1,5 1,6
4,3
4,4
4,5
4,6
4,7
4,8
4,9
NdCa
La
Sr
Pb
Rb
K
Ba
AgNa
Co
nd
uctio
n la
ye
r th
ickn
ess M
12k
Ionic radius [A]
ß-alumina
magnetoplumbite
Thermodynamic stability of -alumina

Chapter Gas Discharge Displays
Slide 44
Incoherent light sources
Prof. Dr. T. Jüstel
11.10 Blue PDP Phosphors
150 200 250 3000,0
0,2
0,4
0,6
0,8
1,0
Quantum yield QE
Light output LO = QE(1-R)
Reflection R
Wavelength [nm]
400 450 500 5500,0
0,2
0,4
0,6
0,8
1,0
E
mis
sio
n in
ten
sity
Excitation at 172 nm
Excitation at 254 nm
Excitation at 147 nm
Wavelength [nm]
VUV absorption and high quantum yield close to 100 %
Half-width of the emission band increases with the excitation energy
Luminescence spectra of BaMgAl10O17:Eu2+
Efficiency and reflection Emission spectra as a
function of excitation energy

Chapter Gas Discharge Displays
Slide 45
Incoherent light sources
Prof. Dr. T. Jüstel
11.10 Blue PDP Phosphors
Color point: Influence of the Eu2+-concentration
Cation Radius [Å]
• Ba2+ 1.34
• Sr2+ 1.12
• Ca2+ 0.99
• Eu2+ 1.09
BAM:x%Eu2+ x, y
• 1% 0.152, 0.052
• 10% 0.151, 0.060
• 15% 0.151, 0.067
• 50% 0.144, 0.111
Green shift of the color point by increasing the Eu2+ concentration Incorporation of Eu2+
destabilizes the BAM phase and leads to the formation of BaAl2O4:Eu
0,14 0,15 0,160,05
0,06
0,07
0,08
0,09
0,10
0,11
0,12
BAM:50% Eu
BAM:15% Eu
BAM:1% Eu
BAM:10% Eu
y
x
Color coordinates

Chapter Gas Discharge Displays
Slide 46
Incoherent light sources
Prof. Dr. T. Jüstel
11.10 Blue PDP Phosphors
254 nm exc. x = 0.146, y = 0.068 ~ 10 kV electron (400 nm)
Activator excitation high penetration depth
147 nm exc. x = 0.140, y = 0.098 ~ 2 kV electron (30 nm)
Band excitation low penetration depth
Feldman equation
R = 0.046*U5/3/ [µm]
0,14 0,15 0,160,05
0,06
0,07
0,08
0,09
0,10
147 nm
172 nm
254 nm
10 kV
2 kVy
x
Color point: Influence of the excitation energy

Chapter Gas Discharge Displays
Slide 47
Incoherent light sources
Prof. Dr. T. Jüstel
2 kV excitation (surface) 10 kV excitation (volume)
The secondary phase BaAl2O4:Eu makes itself noticeable in the emission spectrum
400 500 6000,0
0,2
0,4
0,6
0,8
1,0
Ba0.75
Al11
O17.25
:Eu2+
Wavelength [nm]400 500 600
0,0
0,2
0,4
0,6
0,8
1,0
BaAl2O
4:Eu
2+
Wavelength [nm]
11.10 Blue PDP Phosphors
Cathodoluminescence of BaMgAl10O17:Eu2+

Chapter Gas Discharge Displays
Slide 48
Incoherent light sources
Prof. Dr. T. Jüstel
11.10 Blue PDP Phosphors
400 500 6000,0
0,2
0,4
0,6
0,8
1,0
BaAl2O
4:Eu
2+
Wavelength [nm]
400 500 6000,0
0,2
0,4
0,6
0,8
1,0
BaAl2O
4:Eu
2+
Wavelength [nm]
147 nm excitation (surface) 254 nm excitation (volume)
Photoluminescence of BaMgAl10O17:Eu2+

Chapter Gas Discharge Displays
Slide 49
Incoherent light sources
Prof. Dr. T. Jüstel
11.10 Blue PDP Phosphors
150 200 250 300 3500,0
0,2
0,4
0,6
0,8
1,0
BAM uncoated, 2h 500°C, air
uncoated
Lig
ht
ou
tpu
t L
O =
QE
*(1
-R)
Wavelength [nm]
Particle coating consists of an inert material that acts as a barrier for
a) Oxygen No thermal degradation
b) 74 nm (147 nm) radiation Reduced photodegradation
Materials: Al2O3, AlPO4, Ca2P2O7, SiO2, MgO
150 200 250 300 3500,0
0,2
0,4
0,6
0,8
1,0
Lig
ht
ou
tpu
t L
O =
QE
*(1
-R) BAM coated
BAM coated, 2h 500°C, air
Wavelength [nm]
BaMgAl10O17:Eu2+: Stability enhancement by particle coating
Excitation spectra of
uncoated powderer
Excitation spectra of
coated powder

Chapter Gas Discharge Displays
Slide 50
Incoherent light sources
Prof. Dr. T. Jüstel
11.11 Status and Outlook
Comparison of CRTs and PDPs (Stand 2008)
PDP-TV CRT-TV
Display diagonal 80 cm - 750 cm
(32" - 300")
max. 90 cm
(max. 36")
Luminance
(1% white display)
100 - 150 Cd/m2 100 - 130 Cd/m2
Peak luminance
(white display)
1000 Cd/m 2 500 Cd/m 2
Efficiency 3 – 5 lm/W 2 - 3 lm/W
Power consumption in typical TV operation
150 - 300 W 200 - 300 W
Lifetime > 30000 h > 30000 h
Weight 20 - 30 kg (42‟‟) 80 kg (36")
Thickness < 10 cm 60 cm (36")

Chapter Gas Discharge Displays
Slide 51
Incoherent light sources
Prof. Dr. T. Jüstel
11.11 Status and Outlook
Future measures to improve the image quality of PDPs
Gas discharge
• Higher Xe partial pressure (higher driving voltage)
• Optimization of the surfaces (materials with a high -coefficient)
Cell geometry and optics
• Improving the conversion of generated VUV photons
• Improving the light out-coupling to the front plate (reflector layers)
• Increasing the contrast: doping of screen‟s glass, color filters, black matrix
Phosphors
• Improving the photostability of the blue phosphors
• Shortening of the decay of the green phosphors
• Improvement of the color point and shortening of the decay of the red phosphor
• Increasing the contrast of colored phosphors