7klvhohfwurqlfwkhvlvru … selection (c) direction (indicated by the red arrows). d) color-coded...
TRANSCRIPT

This electronic thesis or dissertation has been
downloaded from the King’s Research Portal at
https://kclpure.kcl.ac.uk/portal/
The copyright of this thesis rests with the author and no quotation from it or information derived from it
may be published without proper acknowledgement.
Take down policy
If you believe that this document breaches copyright please contact [email protected] providing
details, and we will remove access to the work immediately and investigate your claim.
END USER LICENCE AGREEMENT
This work is licensed under a Creative Commons Attribution-NonCommercial-NoDerivatives 4.0
International licence. https://creativecommons.org/licenses/by-nc-nd/4.0/
You are free to:
Share: to copy, distribute and transmit the work Under the following conditions:
Attribution: You must attribute the work in the manner specified by the author (but not in any way that suggests that they endorse you or your use of the work).
Non Commercial: You may not use this work for commercial purposes.
No Derivative Works - You may not alter, transform, or build upon this work.
Any of these conditions can be waived if you receive permission from the author. Your fair dealings and
other rights are in no way affected by the above.
Towards Reliable Diffusion MRI of the In Vivo Human Heart
Von Deuster, Constantin Karl Viktor
Awarding institution:King's College London
Download date: 11. May. 2018

Towards Reliable Diffusion MRI of the
In Vivo Human Heart
Constantin von Deuster
A dissertation submitted for the degree of
Doctor of Philosophy
of the
University of London
Division of Imaging Sciences and Biomedical Engineering
King’s College London, School of Medicine
2
Abstract
In vivo cardiac diffusion tensor imaging (DTI) is a non-invasive method to map the
complex, three-dimensional fibre architecture of the beating heart. It allows the
assessment and characterisation of the myocardium and has been employed successfully
to image myocardial tissue alterations in a number of relevant diseases. Cardiac diffusion
imaging has been primarily performed using stimulated echo based pulse sequences. With
recent developments in magnetic resonance hardware and pulse sequence design, spin
echo based approaches have become attractive alternatives.
The following work presents a comprehensive comparison of stimulated echo and spin
echo based cardiac diffusion imaging approaches. Signal-to-noise ratio (SNR) and diffusion
metrics in phantoms and in the in vivo human heart are analysed and a modification to
previous diffusion encoding schemes is proposed.
In vivo cardiac DTI is implemented and applied to study dynamic fibre reorientation
between heart phases in a patient population with dilated cardiomyopathy. Diffusion
tensor metrics are compared relative to a healthy control group and correlated to cardiac
motion parameters. To address long acquisition times, dual-slice excitation and dedicated
image reconstruction are proposed and implemented in a separate study of healthy
volunteers.
The impact of microvascular perfusion on the diffusion-weighted signal is investigated in a
porcine model of myocardial infarction. The intravoxel incoherent motion (IVIM) model is
employed to obtain perfusion metrics which are correlated to dynamic contrast enhanced
perfusion measurements. A validation of the IVIM model is performed by comparing in
vivo IVIM parameters relative to post mortem reference measurements without motion
and perfusion effects. Additionally, Bayesian inference is proposed to reduce variability of
diffusion and perfusion parameter estimation.
Keywords: myocardial fiber architecture, cardiac diffusion tensor imaging, stimulated echo
acquisition mode, spin echo, motion compensation, signal-to-noise ratio, intravoxel-
incoherent motion, simultaneous multi-slice imaging, Bayesian inference, myocardial
infarction, dilated cardiomyopathy

3
Table of Contents
Abstract ............................................................................................................................ 2
List of Figures ......................................................................................................................... 6
List of Tables ........................................................................................................................ 13
Chapter 1 Introduction ...................................................................................................... 14
1.1 Motivation ............................................................................................................ 14
1.2 Outline................................................................................................................... 17
1.3 Contribution of the Thesis ................................................................................... 17
Chapter 2 Cardiac Anatomy .............................................................................................. 19
2.1 Macro- and Microscopic Anatomy of the Heart ................................................. 19
2.2 Relationship between Cardiac Function and Structure ...................................... 21
2.3 Cardiac Pathologies .............................................................................................. 23
2.4 Cardiac Models ..................................................................................................... 24
Chapter 3 Diffusion Imaging ............................................................................................. 25
3.1 The Molecular Diffusion Process ......................................................................... 25
3.2 The Stejskal-Tanner Sequence ............................................................................. 26
3.3 The Diffusion Tensor Model................................................................................. 28
3.4 Non-Gaussian Diffusion Models .......................................................................... 31
Chapter 4 Cardiac Diffusion Imaging ................................................................................ 36
4.1 Systematic Challenges .......................................................................................... 36
4.1.1 Magnetic Field Imperfections .......................................................................... 37
4.1.2 Eddy Currents ................................................................................................... 39
4.1.3 Concomitant Fields ........................................................................................... 40
4.1.4 Fat Suppression................................................................................................. 41

4
4.1.5 Signal-to-Noise Ratio (SNR) .............................................................................. 42
4.2 Physiological Challenges ...................................................................................... 45
4.2.1 Respiratory and Bulk Motion ........................................................................... 45
4.2.2 Cardiac Motion ................................................................................................. 48
4.2.2.1 Spin Echo based diffusion imaging ........................................................... 49
4.2.2.2 STEAM based diffusion imaging ............................................................... 51
Chapter 5 Spin Echo versus Stimulated Echo Diffusion Tensor Imaging of the In Vivo
Human Heart ........................................................................................................................ 56
5.1 Introduction .......................................................................................................... 56
5.2 Methods ................................................................................................................ 58
5.3 Results ................................................................................................................... 66
5.4 Discussion ............................................................................................................. 71
5.5 Conclusion ............................................................................................................. 73
5.6 Appendix ............................................................................................................... 73
Chapter 6 Studying Dynamic Myofibre Reorientation in Dilated Cardiomyopathy using
In Vivo Magnetic Resonance Diffusion Tensor Imaging ..................................................... 77
6.1 Introduction .......................................................................................................... 77
6.2 Methods ................................................................................................................ 79
6.3 Results ................................................................................................................... 84
6.4 Discussion ............................................................................................................. 92
6.5 Conclusion ............................................................................................................. 95
6.6 Appendix ............................................................................................................... 95
Chapter 7 Simultaneous Multi-Slice Diffusion Tensor Imaging of the In Vivo Human
Heart ........................................................................................................................ 100
7.1 Introduction ........................................................................................................ 100
7.2 Methods .............................................................................................................. 101
7.3 Results ................................................................................................................. 105

5
7.4 Discussion ........................................................................................................... 109
7.5 Conclusion ........................................................................................................... 111
Chapter 8 Verification of the Intra-Voxel Incoherent Motion (IVIM) Model in the
Porcine Heart ..................................................................................................................... 112
8.1 Introduction ........................................................................................................ 112
8.2 Methods .............................................................................................................. 114
8.3 Results ................................................................................................................. 118
8.4 Discussion ........................................................................................................... 123
8.5 Conclusion ........................................................................................................... 126
Chapter 9 Bayesian Intravoxel Incoherent Motion Imaging to Map Perfusion in the
Human Heart ...................................................................................................................... 127
9.1 Introduction ........................................................................................................ 127
9.2 Methods .............................................................................................................. 128
9.3 Results ................................................................................................................. 130
9.4 Discussion ........................................................................................................... 133
9.5 Conclusion ........................................................................................................... 133
Chapter 10 Discussion and Outlook ................................................................................. 134
10.1 Discussion ........................................................................................................... 134
10.2 Outlook ............................................................................................................... 136
Abbreviations ..................................................................................................................... 139
Bibliography ....................................................................................................................... 141
List of Publications ............................................................................................................. 157
Acknowledgements ........................................................................................................... 165
Curriculum Vitae ................................................................................................................ 166
6
List of Figures
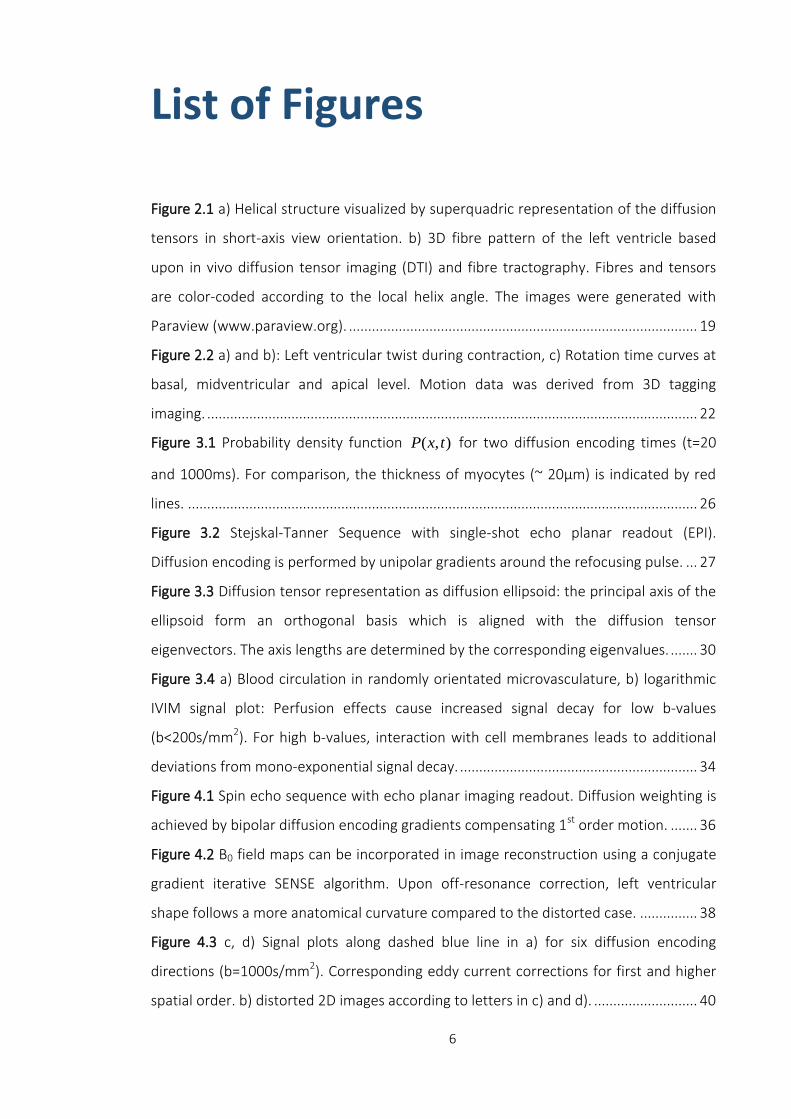
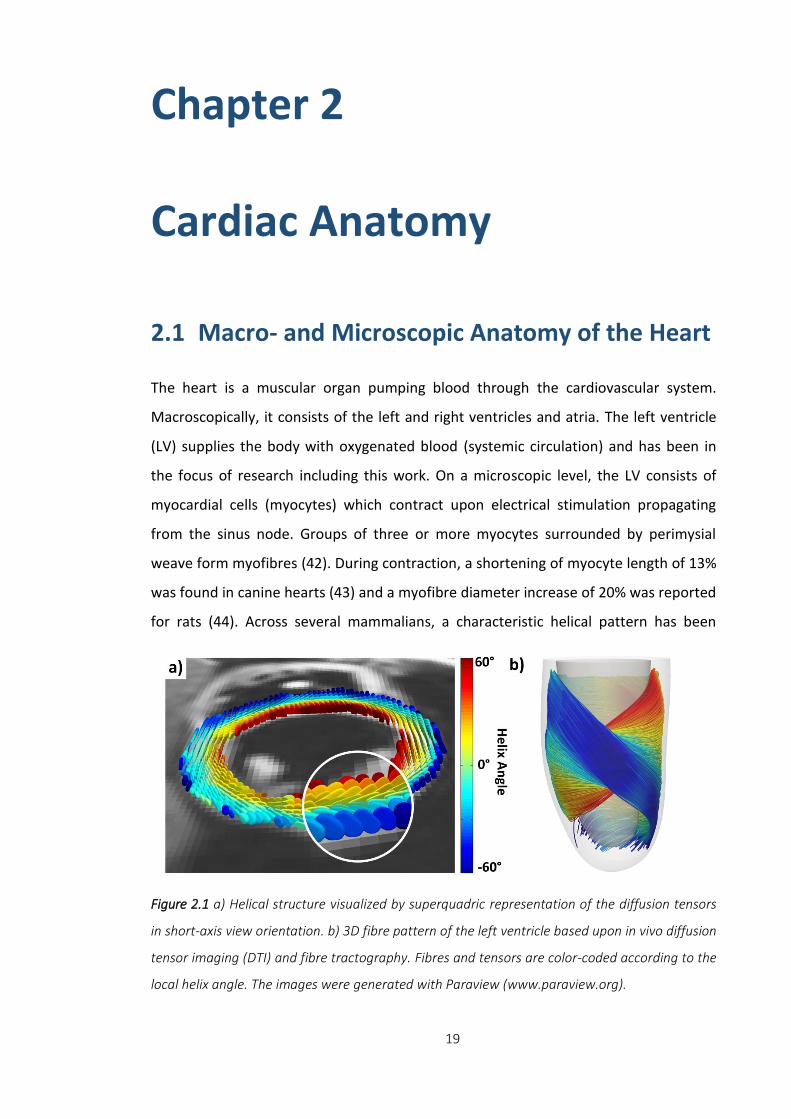
Figure 2.1 a) Helical structure visualized by superquadric representation of the diffusion
tensors in short-axis view orientation. b) 3D fibre pattern of the left ventricle based
upon in vivo diffusion tensor imaging (DTI) and fibre tractography. Fibres and tensors
are color-coded according to the local helix angle. The images were generated with
Paraview (www.paraview.org). ........................................................................................... 19
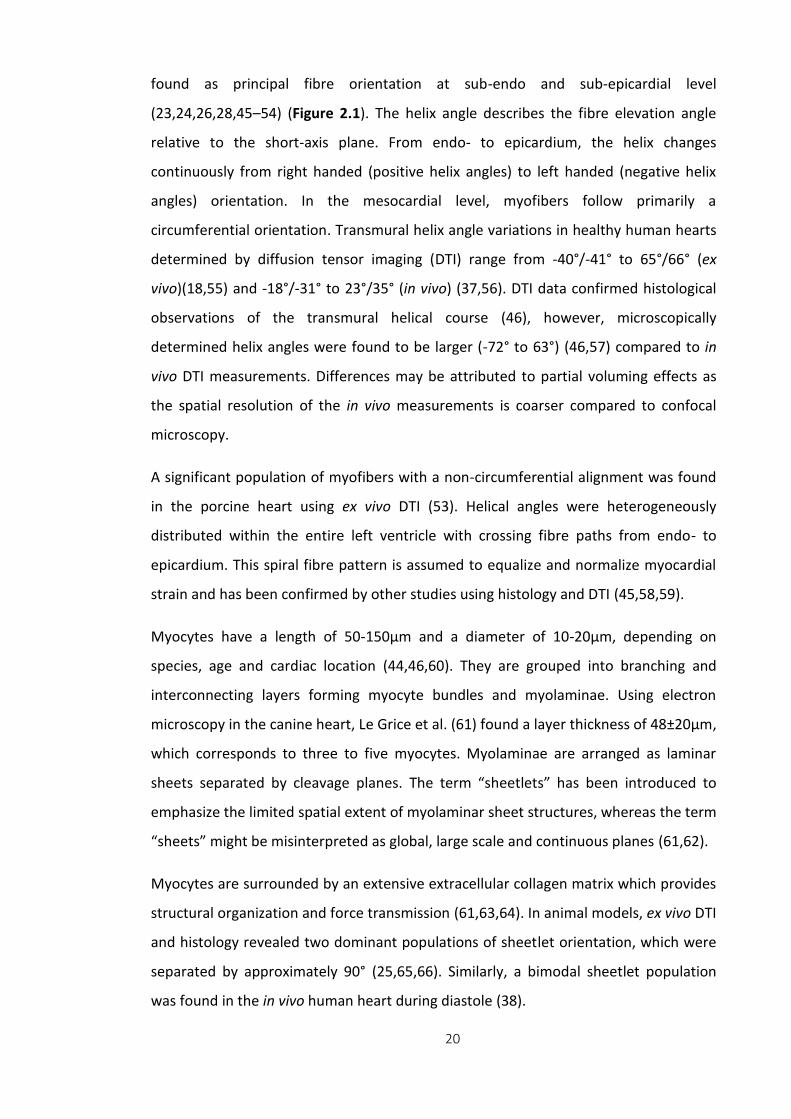
Figure 2.2 a) and b): Left ventricular twist during contraction, c) Rotation time curves at
basal, midventricular and apical level. Motion data was derived from 3D tagging
imaging. ................................................................................................................................ 22
Figure 3.1 Probability density function ( , )P x t for two diffusion encoding times (t=20
and 1000ms). For comparison, the thickness of myocytes (~ 20μm) is indicated by red
lines. ..................................................................................................................................... 26
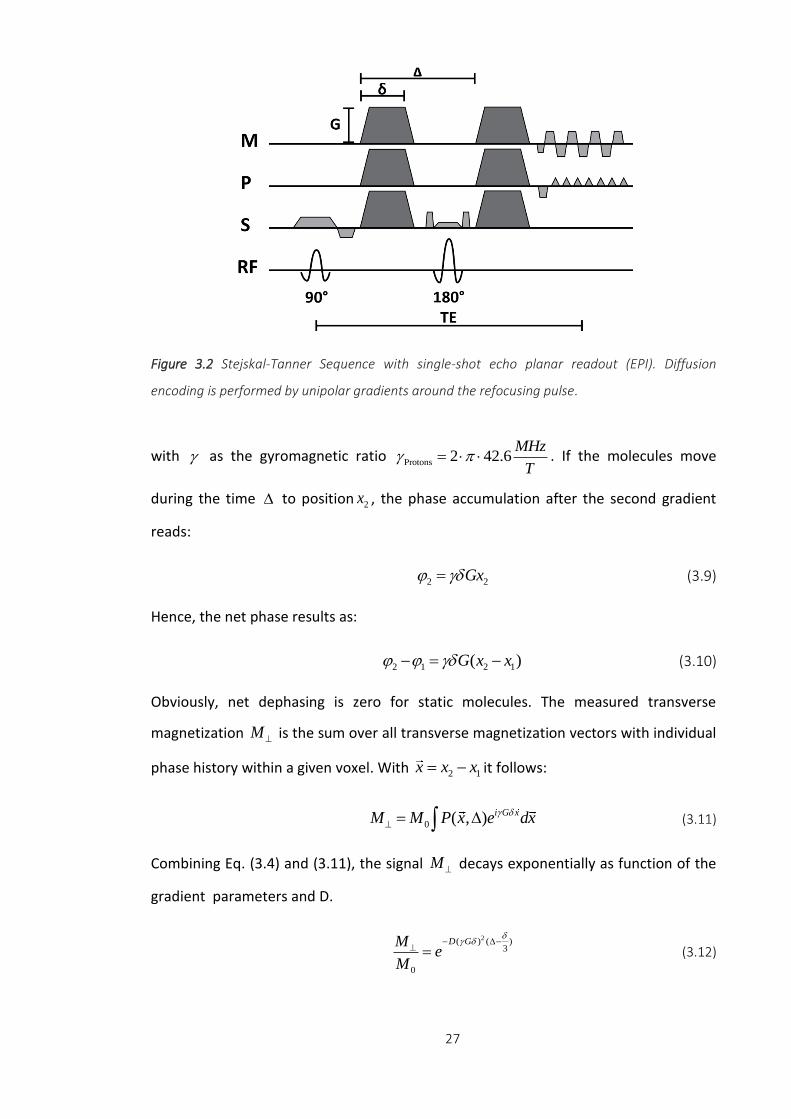
Figure 3.2 Stejskal-Tanner Sequence with single-shot echo planar readout (EPI).
Diffusion encoding is performed by unipolar gradients around the refocusing pulse. ... 27
Figure 3.3 Diffusion tensor representation as diffusion ellipsoid: the principal axis of the
ellipsoid form an orthogonal basis which is aligned with the diffusion tensor
eigenvectors. The axis lengths are determined by the corresponding eigenvalues. ....... 30
Figure 3.4 a) Blood circulation in randomly orientated microvasculature, b) logarithmic
IVIM signal plot: Perfusion effects cause increased signal decay for low b-values
(b<200s/mm2). For high b-values, interaction with cell membranes leads to additional
deviations from mono-exponential signal decay. .............................................................. 34
Figure 4.1 Spin echo sequence with echo planar imaging readout. Diffusion weighting is
achieved by bipolar diffusion encoding gradients compensating 1st order motion. ....... 36
Figure 4.2 B0 field maps can be incorporated in image reconstruction using a conjugate
gradient iterative SENSE algorithm. Upon off-resonance correction, left ventricular
shape follows a more anatomical curvature compared to the distorted case. ............... 38
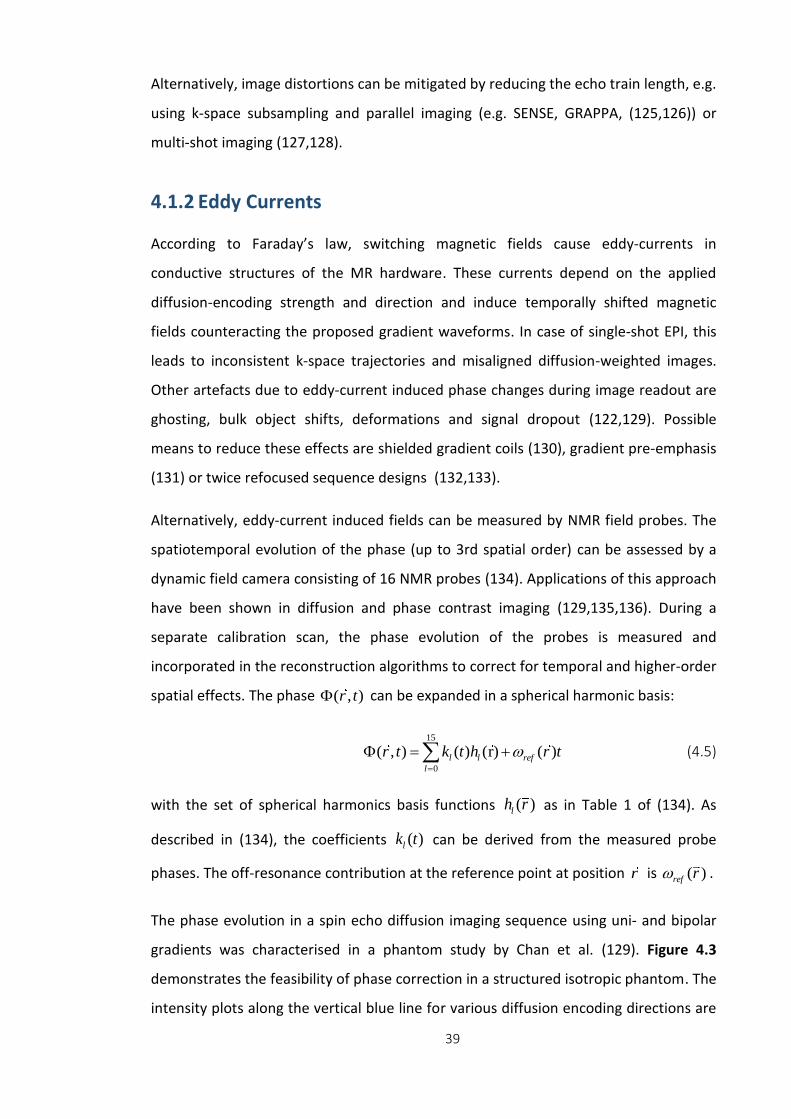
Figure 4.3 c, d) Signal plots along dashed blue line in a) for six diffusion encoding
directions (b=1000s/mm2). Corresponding eddy current corrections for first and higher
spatial order. b) distorted 2D images according to letters in c) and d). ........................... 40

7
Figure 4.4 SE based diffusion acquisition without fat suppression (a) and spectral spatial
excitation pulse (b). The red arrows indicate the phase encoding direction. .................. 42
Figure 4.5 a, b) SNR efficiencies for 1.5 and 3T, respectively. SNRt with SE is increased
relative to STEAM. For increasing heart rate, SNRt of SE reduces and increases in the
STEAM case. c) Increasing the main field strength from 1.5 to 3.0 T, leads to an increase
in SNRt of 29%/30% (60/80 bpm) for SE and 80%/75% (60/80 bpm) for STEAM. ........... 44
Figure 4.6 Respiratory navigator gating by a pencil beam navigator placed on the right
hemi diaphragm. Images are accepted, if the navigator is within the acceptance window
indicated by the blue lines. ................................................................................................. 46
Figure 4.7 Misalignment of diffusion-weighted images due to bulk and respiratory
motion can be corrected for by image based registration. Upon affine registration,
intensity profiles (dashed red line) are well aligned. ......................................................... 47
Figure 4.8 Misalignment causes inconsistent diffusion tensors, particularly at the endo-
and epicardial boundaries. This results in increased transverse angles and erroneous
helix angle estimation.......................................................................................................... 47
Figure 4.9 First- (a) and second- (b) order motion-compensated diffusion sequences
with single-shot EPI readout. .............................................................................................. 50
Figure 4.10 Example data of second-order motion-compensated diffusion-weighted
imaging (b=450s/mm2). Diffusion encoding is along phase (a), measurement (b) and
slice selection (c) direction (indicated by the red arrows). d) color-coded orientation of
the first diffusion tensor eigenvector. ................................................................................ 51
Figure 4.11 STEAM sequence spanning over two consecutive heartbeats with unipolar
diffusion encoding and single-shot EPI readout. ............................................................... 52
Figure 4.12 Strain correction pipeline: Diffusion and tagging data are registered prior to
tensor calculation and displacement field computation. Using non-rigid registration, left
ventricular shapes of tagging and diffusion data are mapped onto each other followed
by diffusion tensor strain correction on a pixel-by-pixel basis. ......................................... 53
Figure 4.13 Uncorrected diffusion tensors are incoherent in the RV/LV intersection
leading to increased transverse angles. Upon strain correction, first eigenvectors follow
the circumferential contour more coherently. .................................................................. 54
8
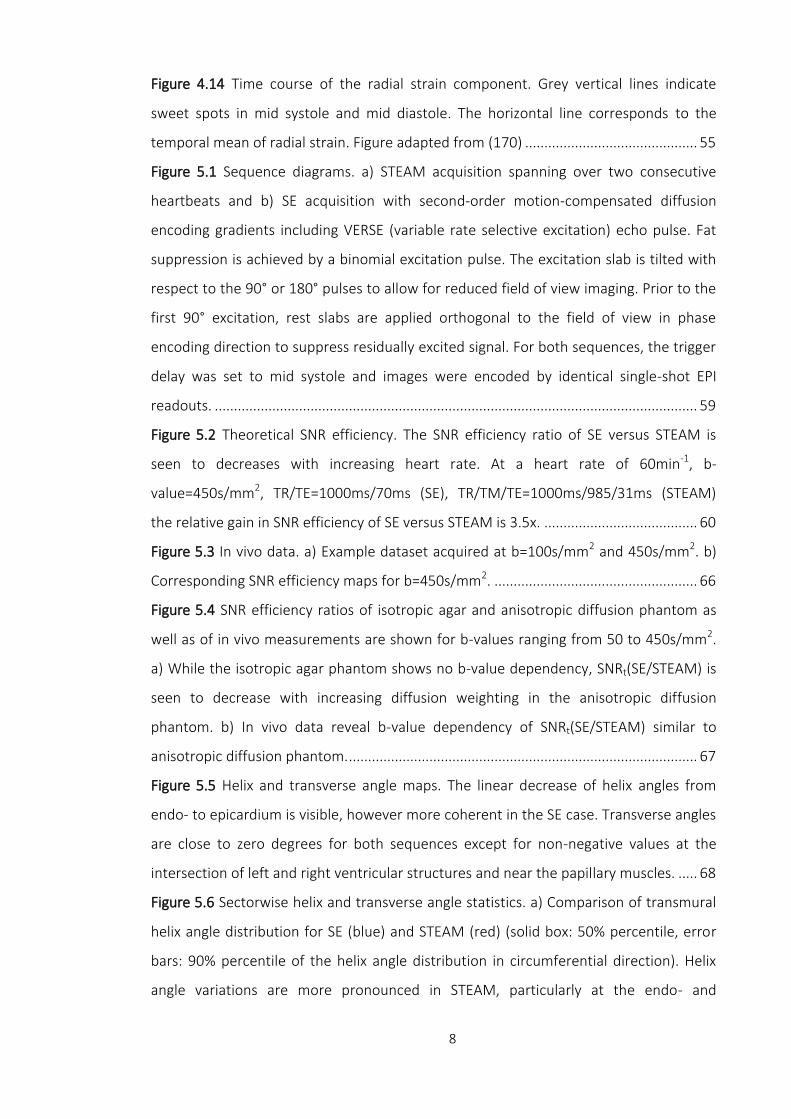
Figure 4.14 Time course of the radial strain component. Grey vertical lines indicate
sweet spots in mid systole and mid diastole. The horizontal line corresponds to the
temporal mean of radial strain. Figure adapted from (170) ............................................. 55
Figure 5.1 Sequence diagrams. a) STEAM acquisition spanning over two consecutive
heartbeats and b) SE acquisition with second-order motion-compensated diffusion
encoding gradients including VERSE (variable rate selective excitation) echo pulse. Fat
suppression is achieved by a binomial excitation pulse. The excitation slab is tilted with
respect to the 90° or 180° pulses to allow for reduced field of view imaging. Prior to the
first 90° excitation, rest slabs are applied orthogonal to the field of view in phase
encoding direction to suppress residually excited signal. For both sequences, the trigger
delay was set to mid systole and images were encoded by identical single-shot EPI
readouts. .............................................................................................................................. 59
Figure 5.2 Theoretical SNR efficiency. The SNR efficiency ratio of SE versus STEAM is
seen to decreases with increasing heart rate. At a heart rate of 60min-1, b-
value=450s/mm2, TR/TE=1000ms/70ms (SE), TR/TM/TE=1000ms/985/31ms (STEAM)
the relative gain in SNR efficiency of SE versus STEAM is 3.5x. ........................................ 60
Figure 5.3 In vivo data. a) Example dataset acquired at b=100s/mm2 and 450s/mm2. b)
Corresponding SNR efficiency maps for b=450s/mm2. ..................................................... 66
Figure 5.4 SNR efficiency ratios of isotropic agar and anisotropic diffusion phantom as
well as of in vivo measurements are shown for b-values ranging from 50 to 450s/mm2.
a) While the isotropic agar phantom shows no b-value dependency, SNRt(SE/STEAM) is
seen to decrease with increasing diffusion weighting in the anisotropic diffusion
phantom. b) In vivo data reveal b-value dependency of SNRt(SE/STEAM) similar to
anisotropic diffusion phantom. ........................................................................................... 67
Figure 5.5 Helix and transverse angle maps. The linear decrease of helix angles from
endo- to epicardium is visible, however more coherent in the SE case. Transverse angles
are close to zero degrees for both sequences except for non-negative values at the
intersection of left and right ventricular structures and near the papillary muscles. ..... 68
Figure 5.6 Sectorwise helix and transverse angle statistics. a) Comparison of transmural
helix angle distribution for SE (blue) and STEAM (red) (solid box: 50% percentile, error
bars: 90% percentile of the helix angle distribution in circumferential direction). Helix
angle variations are more pronounced in STEAM, particularly at the endo- and

9
epicardial region. b) Histograms of transverse angles show reduced dispersion of
transverse angle for SE. ....................................................................................................... 69
Figure 5.7 Bland-Altman and line plots of MD (a) and FA (b) representing intra subject
reproducibility of SE versus STEAM. No statistical differences were observed between
repeat measurements for MD and FA for both SE and STEAM. Significant differences
were found for MD and FA between both sequences. ..................................................... 70
Figure 5.8 Eigenvalue analysis. Diffusion tensor eigenvalue (e1, e2, e3) histograms for SE
(solid line) and STEAM (dashed line). SE eigenvalues show a distinct and dense
distribution, while STEAM eigenvalue histograms are broadened. .................................. 70
Figure 5.9 Free breathing acquisition: a) Helix and transverse angle maps. Similar to the
breath hold case, the decrease of helix angles from endo- to epicardium is more
coherent for SE. Transverse angles are close to zero degrees. b) Helix and transverse
angle statistics: Comparison of transmural helix angle distribution for SE (blue) and
STEAM (red) (solid box: 50% percentile, error bars: 90% percentile of the helix angle
distribution in circumferential direction). .......................................................................... 74
Figure 6.1 a) Defintion of helix angle (α): The angle between the projection of the first
eigen-vector onto the epicardial surface and the transmural plane. b) Corresponding
linear fit of the transmural course of the helix angles. ...................................................... 82
Figure 6.2 Comparison of helix angle maps acquired in diastole and systole from control
versus DCM patient. A linear transition from positive to negative helix angles as a
function of transmural depth is seen. While endo- and epicardial helix angles become
steeper during systole in the healthy control, no explicit change between diastole and
systole is found in the DCM case. ....................................................................................... 86
Figure 6.3 Histograms of diastolic and systolic helix angles for controls (a) and DCM
patients (b). While a shift towards steeper helix angles is seen in the systolic healthy
heart, systolic and diastolic distributions are similar in the DCM case............................. 87
Figure 6.4 a) Comparison of transmural helix angle slopes in diastole versus systole for
the control and DCM groups. b) Diastolic and systolic helix angles for control and DCM
modelling as compared to the data. ................................................................................... 87
Figure 6.5 a) Histograms of diastolic and systolic E2A sheet angles for controls and DCM
patients. The sheet angle distribution is broader in the systolic healthy heart compared
to diastole, whereas systolic and diastolic distributions are similar in the DCM case. .... 88

10
Figure 6.6 Time course of myocardial torsion for DCM and control. In DCM patients,
torsion is reduced relative to the healthy controls............................................................ 89
Figure 6.7 Peak torsion (a), left-ventricular ejection fraction (LVEF) (b) and longitudinal
strain (c) as a function of normalized helix angle (HA) slope. A trend towards lower
torsion (a), LVEF (b) and longitudinal strain (c) with increasing helix angle slope is seen in
the DCM group. ................................................................................................................... 90
Figure 6.8 Change in helix angle slope caused by passive inflation of the control LV
model to DCM model cavity volume as compared to measured difference in control and
DCM helix angle slopes. Volume change alone does not explain observed differences
between the two cohorts. ................................................................................................... 91
Figure 7.1 ECG-gated diffusion-weighted multi-band sequence with single-shot EPI
readout. Dual-band RF pulses and CAIPIRINHA blips are shown in red.......................... 102
Figure 7.2 Measured (dotted line) and simulated (solid line) slice profiles of the multi-
band pulse. ......................................................................................................................... 105
Figure 7.3 Left: Aliased raw data prior to image reconstruction. Right: Unfolded images
show good correspondence with reference data obtained by sequential single-slice
imaging. BH: breath hold. .................................................................................................. 106
Figure 7.4 g-factor maps for dual-band image reconstruction with and without FOV/2
shift. g-factors are reduced when using controlled aliasing. .......................................... 106
Figure 7.5 Left: Slice locations in the left ventricle. Right: Diffusion tensor representation
(1st Eigenvector) of reconstructed CAIPI and reference DTI data. BH: breath hold. ...... 107
Figure 7.6 Helix angle plots along 4 transmural layers and 4 sectors for CAIPI and
reference DTI data. Reported values are mean and standard deviation across the study
population. BH: breath hold. ............................................................................................. 108
Figure 7.7 Linear transmural course of HA. Solid and dashed lines represent mean and
standard deviation of HA across all subjects. ................................................................... 108
Figure 8.1 Second-order motion-compensated diffusion-weighted imaging sequence.
Dashed lines indicate the variation of gradients to achieve different diffusion encoding
strengths (b-values) whilst keeping the duration of the gradients constant. Fat
suppression is achieved by a binomial excitation pulse. The trigger delay (TD) was set to
mid systole. ........................................................................................................................ 115

11
Figure 8.2 a) Slice locations of apical and midventricular slice with corresponding short-
axis views (b). Apparent blood sedimentation can be seen post mortem. .................... 116
Figure 8.3 A selection of in vivo and post mortem trace images at apical and mid-
ventricular level. Signal hyper intensity is observed in the septum of the apical slice (red
arrow). Post mortem signal intensities are significantly increased for high b-values
(b>450 s/mm2) compared to corresponding in vivo signal levels. .................................. 119
Figure 8.4 Logarithmic signal decay curves for in vivo and post mortem diffusion
imaging. In vivo and post mortem signals follow a bi- and mono-exponential decay,
respectively. Signal slopes are comparable between both measurements for high b-
values (b>450 s/mm2)........................................................................................................ 120
Figure 8.5 a) Dynamic contrast enhanced (DCE) first pass perfusion imaging showing
infarcted area in septum. DCE signal time curves for two ROIs in infarcted (ROI 1) and
healthy (ROI 2) regions show baseline level and signal increase upon bolus injection,
respectively. No infarcted area can be seen in the midventricular slice. The dashed grey
line indicates the time point of the DCE images. b) In vivo and post mortem IVIM
parameter maps at apical and midventricular level: The infarcted area correlates with a
reduced perfusion fraction (f) and pseudodiffusion (D*). f reduces close to zero from in
vivo to post mortem measurements. No significant change can be observed for D
between pre and post mortem imaging. Post mortem D* maps show increased
variabilty compared to in vivo D* maps. .......................................................................... 122
Figure 8.6 a) Infarct classification map for six sectors of the apical slice: the numbers
indicate the fraction of infarcted sectors across all pigs (N=5). The septal area was found
to be infarcted in all animals, whereas the lateral region was classified as healthy.
Perfusion fraction in the septal region was reduced by more than 50% relative to the
healthy myocardium. The results for f are reported as mean (top) and standard
deviation (below) across all animals. b) The differences in f between infarcted and
healthy sectors were found to be statistically significant (p<0.01). ............................... 123
Figure 9.1 Second-order motion-compensated diffusion-weighted imaging sequence.
Dashed lines indicate the variation of gradients to achieve different diffusion encoding
strengths (b-values) whilst keeping the duration of the gradients constant. Fat
suppression is achieved by a binomial excitation pulse. The trigger delay (TD) was set to
mid systole. ........................................................................................................................ 128

12
Figure 9.2 Selection of trace images obtained for an apical and mid-ventricular slice. 131
Figure 9.3 Example IVIM parameter maps comparing least squares (LSQ) and Bayesian
Shrinkage Prior (BSP) based results. Variability in IVIM parameters is considerably
reduced for BSP relative to LSQ. ....................................................................................... 132
13
List of Tables
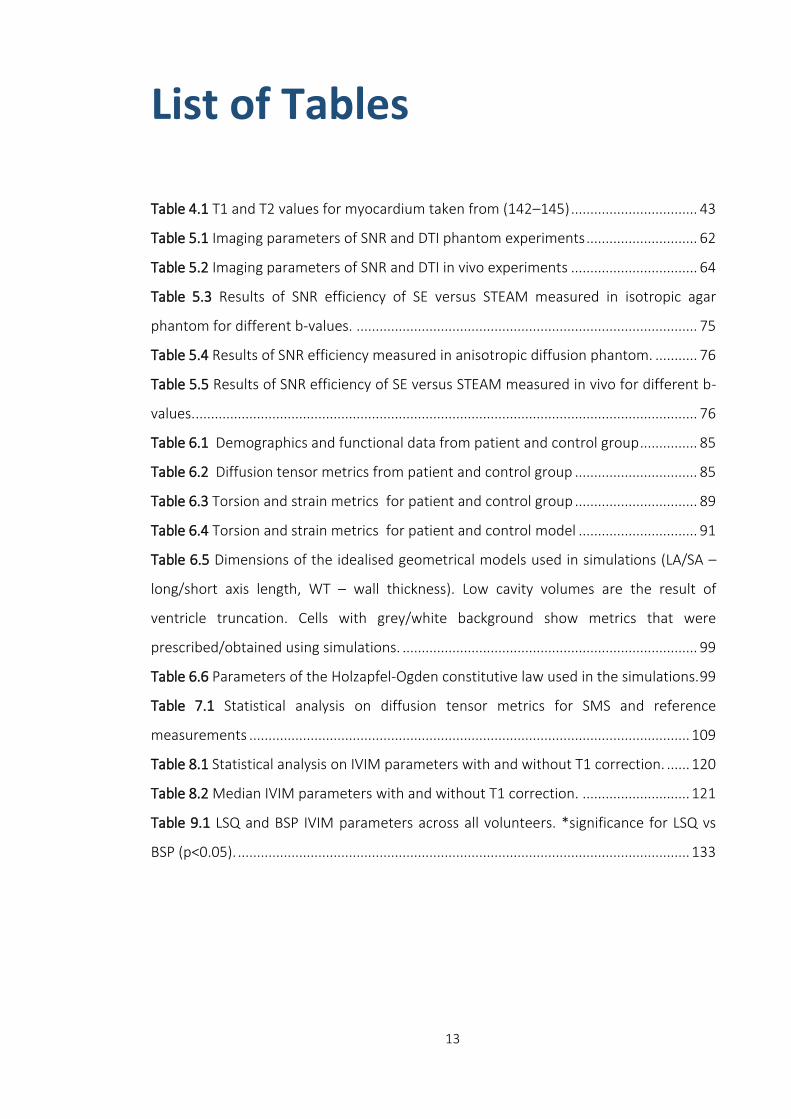
Table 4.1 T1 and T2 values for myocardium taken from (142–145) ................................. 43
Table 5.1 Imaging parameters of SNR and DTI phantom experiments ............................. 62
Table 5.2 Imaging parameters of SNR and DTI in vivo experiments ................................. 64
Table 5.3 Results of SNR efficiency of SE versus STEAM measured in isotropic agar
phantom for different b-values. ......................................................................................... 75
Table 5.4 Results of SNR efficiency measured in anisotropic diffusion phantom. ........... 76
Table 5.5 Results of SNR efficiency of SE versus STEAM measured in vivo for different b-
values. ................................................................................................................................... 76
Table 6.1 Demographics and functional data from patient and control group ............... 85
Table 6.2 Diffusion tensor metrics from patient and control group ................................ 85
Table 6.3 Torsion and strain metrics for patient and control group ................................ 89
Table 6.4 Torsion and strain metrics for patient and control model ............................... 91
Table 6.5 Dimensions of the idealised geometrical models used in simulations (LA/SA –
long/short axis length, WT – wall thickness). Low cavity volumes are the result of
ventricle truncation. Cells with grey/white background show metrics that were
prescribed/obtained using simulations. ............................................................................. 99
Table 6.6 Parameters of the Holzapfel-Ogden constitutive law used in the simulations. 99
Table 7.1 Statistical analysis on diffusion tensor metrics for SMS and reference
measurements ................................................................................................................... 109
Table 8.1 Statistical analysis on IVIM parameters with and without T1 correction. ...... 120
Table 8.2 Median IVIM parameters with and without T1 correction. ............................ 121
Table 9.1 LSQ and BSP IVIM parameters across all volunteers. *significance for LSQ vs
BSP (p<0.05). ...................................................................................................................... 133

14
Chapter 1 Introduction
1.1 Motivation
According to the World Health Organization (WHO), more than 17 million people died
from cardiovascular disease (CVD) in 2012 (1,2). With three in every ten deaths, CVDs
are the primary cause of mortality and morbidity in the world which translates into an
enormous financial burden to health care services (3). CVDs include diseases of the
heart, the vasculature of the brain and the blood vessels. Ischemic heart disease and
coronary artery disease were cause of 7.4 million deaths and cerebrovascular disease
(e.g. stroke) was responsible for 6.7 million deaths in 2012 (2). Among cardiovascular
diseases, the main causes are ischemia, non-ischemic cardiomyopathies and valvular
diseases (4). Risk factors promoting the processes related to CVDs are smoking,
physical inactivity, unhealthy diet, alcohol, hypertension, diabetes, elevated
cholesterol levels, obesity, psychological factors (e.g. stress, depression),
chemotherapy, and other risk factors (1).
The WHO report suggests three areas which have to be improved to address CVDs:
surveillance and monitoring of epidemics of CVDs, the prevention by reducing risk
factors and improved disease management by early detection and treatment (1).
Imaging methods such as echocardiography or magnetic resonance imaging (MRI) can
be employed for disease surveillance and management. Echocardiography is a non-
invasive technique to assess cardiac function, such as ejection fraction, wall motion,
flow dynamics and valvular pathology (5). It is widely used in clinical routine, due to its
examination time efficiency, portability and low cost. The technique is, however,
limited by acoustic window restrictions and operator dependency.

15
Because of its excellent soft-tissue contrast, MRI is particularly suited for medical
imaging of cardiovascular morphology and function. The gold standard for functional
imaging of the heart are multi-slice cine images to determine left and right ventricular
muscle masses, volumes and ejection fractions. In clinical routine, the structural
integrity of myocardial tissue can be characterised by late gadolinium enhancement
(LGE) imaging. LGE has been used as a robust qualitative tool to map fibrotic or
necrotic tissue -both hallmarks of heart disease- in cardiomyopathies and myocardial
infarction. LGE, however, does not provide a parametric characterisation of tissue
properties. This shortcoming can be addressed by extra cellular volume (ECV) imaging.
ECV measurements use T1 mapping (6) pre- and post- contrast agent administration
and a hematocrit depended scaling factor. A good spatial correlation between ECV
imaging and myocardial fibrosis or edema was found (7).
However, one out of three patients with CVDs suffers from renal insufficiency requiring
a contrast-free alternative for myocardial tissue characterisation (8). Hence, imaging
techniques relying on endogenous contrasts are being developed and are receiving
increasing attention. Promising contrast-free imaging modalities are native T1 (6,9,10),
T1rho (11–13), T2 (14,15) mapping and diffusion-weighted imaging (16–19) (DWI).
DWI relies on the signal attenuation due to self-diffusion of water molecules.
Successful in vivo measurements in the human heart were first reported by Edelman et
al. in 1994 (20). The sequence proposed was an adaption of the Stejskal-Tanner
diffusion sequence (21) using the stimulated echo acquisition mode (STEAM) method.
Diffusion imaging allows determination of myocardial diffusion parameters including
the apparent diffusion coefficient (ADC) and fractional anisotropy (FA) of tissue. A
good spatial correlation between increased ADC values and fibrotic tissue identified by
LGE was recently shown by Nguyen et al. (16). If diffusion encoding is performed along
six or more non-collinear directions, the mean orientation of myofibres per voxel can
be determined by diffusion tensor reconstruction. This approach is based on the
assumption that the principal eigenvector of the diffusion tensor, i.e. the main
diffusion direction, is aligned with the mean fibre orientation. The diffusion tensor
model has been validated by a number of studies comparing myocardial fibre
architecture derived by DTI and histology (22–26).

16
By means of cardiac DTI, microstructural remodelling in cardiomyopathies and
myocardial infarction was observed: Structural degeneration of myocardium was
accompanied with an increase in mean diffusivity and reduction in diffusion anisotropy
(27–32). As in vivo cardiac DTI allows the non-invasive mapping of three-dimensional
cardiac fibre architecture, it has the unique potential to monitor cardiac disease
progression and gauge myocardial therapy on a microstructural level. In particular,
novel treatment approaches such as stem cell therapy could benefit from in vivo
cardiac diffusion imaging.
Two sequence designs for in vivo cardiac DTI have been established: The primary
method is the STEAM technique which spans over two consecutive R-R-intervals with
single-shot echo-planar imaging (EPI) readout (20). Alternatively, spin echo (SE) based
imaging can be performed if motion-compensated diffusion encoding gradients are
employed to address cardiac motion induced signal phase variations. Gamper et al.
showed the feasibility of in vivo cardiac DTI using velocity-compensated diffusion
gradient waveforms (33). Gradient moment nulling up to second and third order were
shown thereafter by Stoeck et al. and Welsh et al. (34,35). The image readout is mainly
performed by single-shot EPI or balanced steady state free precession imaging (36) in
conjunction with diffusion-weighted pre-pulses.
Respiratory and cardiac motion is several magnitudes larger compared to the
displacement of diffusing water molecules rendering the diffusion acquisition process
very challenging. Hence, breath holding or dedicated navigator gating are necessary
for STEAM imaging (37) whereas single-shot SE based DTI can be applied during free
breathing. Myocardial strain during diffusion encoding can bias diffusion tensor
metrics in STEAM or can cause signal cancellation in SE based imaging. These effects
can be mitigated by dedicated myocardial strain correction (38), careful sequence
timing (39) or the use of motion-compensated gradient waveforms in combination
with high performance gradient systems (34,35). Alternatively, motion induced signal
loss can be reduced by multiple signal sampling at different trigger delays and
subsequent temporal maximum intensity projection filtering (40). Besides the motion
sensitivity, the intrinsic low signal-to-noise ratio (SNR) of in vivo cardiac DTI is a major
challenge which results in relatively long scan times.

17
The objectives of the present work are to advance and employ cardiac DTI to study
diffusion and perfusion parameters in healthy and diseased hearts. Methods to
accelerate image acquisition and to improve diffusion and perfusion parameter
estimation are proposed.
1.2 Outline
Chapter 2 provides an introduction of cardiac anatomy, function and dysfunction. The
concept of diffusion imaging is given in Chapter 3 including Gaussian and non-Gaussian
diffusion models. Systematic challenges of cardiac diffusion imaging are presented in
Chapter 4. Potential means to address the limitations of echo planar imaging as
imaging readout are outlined. Cardiac diffusion-weighted imaging methods are
presented including higher-order motion-compensated SE imaging and the STEAM
approach. Chapter 5 compares SNR and diffusion metrics obtained in phantoms and in
vivo using stimulated and spin echoes. STEAM based diffusion imaging is performed in
DCM patients (Chapter 6) and in healthy humans in combination with simultaneous-
multi-slice image acceleration (Chapter 7). Perfusion and diffusion parameters are
presented for infarcted pig and healthy human hearts, respectively (Chapter 8 & 9).
Chapter 10 concludes with a summary of this work and an outlook.
1.3 Contribution of the Thesis
In a first part, SNR and diffusion metrics are compared between STEAM and second-
order motion-compensated SE in phantoms and in the in vivo human heart. To reduce
the effect of microvascular perfusion (41) on diffusion metrics, a new diffusion
encoding sampling scheme with optimized use of available gradient strength is
proposed. The scan efficiency of free breathing STEAM and SE based acquisition is
investigated (Chapter 5).
The second part of the thesis demonstrates an application of the STEAM sequence:
Dynamic fibre reorientation between heart phases is presented in a study of dilated
cardiomyopathy (DCM) patients. Additional motion parameters including strain and

18
torsion are reported and correlated to DTI results. Structural and functional metrics
are compared to age matched controls (Chapter 6). Acceleration of in vivo cardiac DTI
by a factor of two using simultaneous multi-slice imaging is shown in a volunteer study
in Chapter 7.
The third part of this work is attributed to the SE sequence: The impact of perfusion on
the diffusion-weighted signal is evaluated in a pig model of myocardial infarction.
Results are compared to dynamic contrast enhanced imaging and post mortem
reference measurements without motion and perfusion effects (Chapter 8). Least
squares fitting for diffusion and perfusion parameter estimation is compared to
Bayesian inference in a volunteer study (Chapter 9).
19
Chapter 2 Cardiac Anatomy
2.1 Macro- and Microscopic Anatomy of the Heart
The heart is a muscular organ pumping blood through the cardiovascular system.
Macroscopically, it consists of the left and right ventricles and atria. The left ventricle
(LV) supplies the body with oxygenated blood (systemic circulation) and has been in
the focus of research including this work. On a microscopic level, the LV consists of
myocardial cells (myocytes) which contract upon electrical stimulation propagating
from the sinus node. Groups of three or more myocytes surrounded by perimysial
weave form myofibres (42). During contraction, a shortening of myocyte length of 13%
was found in canine hearts (43) and a myofibre diameter increase of 20% was reported
for rats (44). Across several mammalians, a characteristic helical pattern has been
Figure 2.1 a) Helical structure visualized by superquadric representation of the diffusion tensors
in short-axis view orientation. b) 3D fibre pattern of the left ventricle based upon in vivo diffusion
tensor imaging (DTI) and fibre tractography. Fibres and tensors are color-coded according to the
local helix angle. The images were generated with Paraview (www.paraview.org).
20
found as principal fibre orientation at sub-endo and sub-epicardial level
(23,24,26,28,45–54) (Figure 2.1). The helix angle describes the fibre elevation angle
relative to the short-axis plane. From endo- to epicardium, the helix changes
continuously from right handed (positive helix angles) to left handed (negative helix
angles) orientation. In the mesocardial level, myofibers follow primarily a
circumferential orientation. Transmural helix angle variations in healthy human hearts
determined by diffusion tensor imaging (DTI) range from -40°/-41° to 65°/66° (ex
vivo)(18,55) and -18°/-31° to 23°/35° (in vivo) (37,56). DTI data confirmed histological
observations of the transmural helical course (46), however, microscopically
determined helix angles were found to be larger (-72° to 63°) (46,57) compared to in
vivo DTI measurements. Differences may be attributed to partial voluming effects as
the spatial resolution of the in vivo measurements is coarser compared to confocal
microscopy.
A significant population of myofibers with a non-circumferential alignment was found
in the porcine heart using ex vivo DTI (53). Helical angles were heterogeneously
distributed within the entire left ventricle with crossing fibre paths from endo- to
epicardium. This spiral fibre pattern is assumed to equalize and normalize myocardial
strain and has been confirmed by other studies using histology and DTI (45,58,59).
Myocytes have a length of 50-150μm and a diameter of 10-20μm, depending on
species, age and cardiac location (44,46,60). They are grouped into branching and
interconnecting layers forming myocyte bundles and myolaminae. Using electron
microscopy in the canine heart, Le Grice et al. (61) found a layer thickness of 48±20μm,
which corresponds to three to five myocytes. Myolaminae are arranged as laminar
sheets separated by cleavage planes. The term “sheetlets” has been introduced to
emphasize the limited spatial extent of myolaminar sheet structures, whereas the term
“sheets” might be misinterpreted as global, large scale and continuous planes (61,62).
Myocytes are surrounded by an extensive extracellular collagen matrix which provides
structural organization and force transmission (61,63,64). In animal models, ex vivo DTI
and histology revealed two dominant populations of sheetlet orientation, which were
separated by approximately 90° (25,65,66). Similarly, a bimodal sheetlet population
was found in the in vivo human heart during diastole (38).
21
2.2 Relationship between Cardiac Function and
Structure
During embryonic development, the myocardium progresses from an isotropic, non-
coordinated organization of myocytes towards a structured, anisotropic tissue.
Myocytes gradually elongate and align themselves resulting in coherent fibre tracts
which have been studied by ex vivo DTI (67). According to Mekkaoui et al., the
development of fibre paths in the human heart is relatively late – approximately 2-3
months upon onset of cardiac contraction (67). Adaption of cardiac microstructure on
mechanical load has been shown in chicken embryos: the formation of the
characteristic helical fibre pattern is accelerated in case of increased LV pressure load
produced by conotruncal banding. Similarly, reduced pressure load results in delayed
structural maturation (68). These observations indicate a strong relationship between
myocardial structure and the electromechanical function of the heart.
During cardiac contraction, myocardial wall thickens by 30 to 86% (69–71), however
less than 50% of it can be explained by an increase in myocyte diameter (72) – the
myocyte shortening in canine hearts was found to be only 13% (43). This discrepancy
can be explained by sliding and shearing of myolaminae along each other. According to
Le Grice et al., cellular rearrangement along myolaminar cleavage planes can account
for more than 50% of systolic wall thickening (44,61,72–74). In the in vivo human
heart, diastolic sheetlet orientation was found to be more longitudinally orientated
compared to systole (38).
Besides systolic wall thickening, the left ventricle follows a torsional motion during one
cardiac cycle (Figure 2.2 a), b)). As viewed from apex to base, the basal slice rotates
clockwise and the apex counter-clockwise leading to twist (75) (Figure 2.2 c)).
Mathematical models have shown that global myofibre orientation with continuous
transmural helix angle change results in smooth shortening of myocytes and warrants
ventricular torsion (76). This torsion results in shear stress, which tends to “unwind the
helix” (77). As a consequence of the ventricular torsion and contraction, the heart
shortens by 15-20 % in longitudinal and circumferential direction (69). In the healthy
human heart, left ventricular volume shrinks from approximately 142±21ml in diastole
22
to 47±10ml in systole (78). The fraction of ejected left ventricular blood per heart beat
(ejection fraction) is hence approximately 67±4.6% (78).
Myocardial fibre distribution was found to change during the cardiac cycle. Several
studies reported on a longitudinal fibre alignment during cardiac contraction, which is
assumed to optimize cardiac pumping efficiency (38,46,79–81). Similarly, radial
reorientation of sheets from diastole to systole was observed, providing a potential
explanation for the magnitude of radial strain measured in vivo (25,74).
During diastole, the left ventricular wall is untwisted by a rapid torsional recoil
occurring at the early relaxation phase (82). Stretching along epicardial myofibres and
sheet shortening and shear in the endocardial layers have been reported by Ashikaga
et al using biplane cineangiography (82). It is assumed that primarily epicardial
myofibres and sheet structures between myofibres are the source of restoring forces
driving torsional recoil and support early ventricular filling.
Cardiac fibre organization is also a key determinant of cardiac electrophysiology.
Directional differences of electrical signal propagation velocities were found in canine
myocytes: conduction velocity along fibre direction was found to be up to four times
faster than in perpendicular direction (83). Hence, the propagation of excitation waves
is aligned with the actual cardiac fibre orientation. In a sheep model of cardiac
infarction, the degree of fibre disarray correlated well with a reduction in activation
potential (84).
Figure 2.2 a) and b): Left ventricular twist during contraction, c) Rotation time curves at basal,
midventricular and apical level. Motion data was derived from 3D tagging imaging.
23
2.3 Cardiac Pathologies
A number of cardiovascular diseases can result in myocardial remodelling. This
potentially translates into impaired contractility and hence reduced pumping
efficiency, e.g. reduced ejection fraction or cardiac output. In vivo cardiac DTI allows
for non-invasive assessment of myocardial integrity, while ex vivo cardiac DTI is non-
destructive in contrast to histological procedures.
In animal models of dilated cardiomyopathy (DCM), an increase in mean diffusivity
(MD) and decrease in fractional anisotropy (FA) was found (27). Histological
assessment confirmed an increase in extracellular space which poses less restrictions
on water diffusion and the degeneration of an organized myofibre structure results in
reduced diffusion anisotropy (27,28). Macroscopically, a reduction in circumferential
contraction and left ventricular torsion has been found in dilated cardiomyopathy
(85,86).
Similarly, disordered fibre patterns have been detected in the in vivo human heart with
hypertrophic cardiomyopathy (HCM). The degenerate structure was found to correlate
with abnormalities in passive and active myocardial function (87), including reduced
myocardial strain. The loss of myocardial integrity was quantified by reduced FA,
increased MD and increased longitudinal fibre orientation in the septal region (87).
According to Ferreira et al., dynamic sheet reorientation between cardiac phases is
impaired in hypertrophic regions of the human heart (30). Characteristic systolic sheet
orientation was found in regions with hypercontraction in systole and lack of
relaxation during diastole (30). In contrast to (87), a comparable helix configuration of
HCM relative to healthy controls was measured. Good reproducibly of DTI based
results in HCM patients was shown by McGill et al. (29).
Fibrotic tissue, which is a key indicator for heart failure, is clinically evaluated by late
gadolinium enhanced (LGE) imaging. Recent studies showed that it can also be
characterised and delineated by diffusion-weighted imaging (DWI) in HCM (16) but
without requiring the use of contrast agents as in LGE. The diffusion constant of
myocardial fibrosis was found to be significantly higher compared to healthy tissue.
Apparent diffusion coefficient (ADC) mapping revealed a good spatial correlation with

24
LGE imaging and extracellular volume (ECV) imaging. ECV in fibrotic region was
significantly increased (>30%) compare to non-fibrotic region (ECV: 26±2%) (16)
indicating structural remodelling and degeneration of cardiomyocytes (16).
DTI in animal and human subjects (47,48,50,51,54,87) showed that acute ischemia is
accompanied by increased MD in myocardial infarction, whereas FA was found to
decrease (18,31,51,54). According to Chen et al. reduced diffusion anisotropy in an
infarcted rat model correlates well with regions of microscopic fibre disarray (51).
Perturbed fibre architecture with nodes of orthogonal myofiber intersection in
infarcted hearts was measured using diffusion spectrum imaging (DSI) (48). Regarding
chronic infarction, structural remodelling has also been found in the infarct-adjacent
and remote zones. Myofibre reorientation towards increased helix angles, i.e. more
right handed helix, was observed in humans and sheeps with septal infarcts (31,32,47).
2.4 Cardiac Models
Models describing cardiac architecture remain controversial. For example, the model
of a helical ventricular myocardial band (HVMB) which assumes the RV and LV to be
formed of a single dissectible muscular band has been debated (88,89). Advances in
mathematical cardiac modelling and imaging, however, have meanwhile improved the
understanding of cardiac fibre function and architecture. As a result, it has been
agreed that the helical band model is not appropriate to describe cardiac anatomy
(65,90). It cannot explain the smooth change in ventricular fibre orientation across the
myocardium and the discontinuity of myolaminae branching and interconnecting
several times between endo- and epicardium (65). Hence, the incomplete and simple
idea of HVMB has to be replaced by a concept of myocardium which is organized as
continuous and homogeneous three-dimensional myocardial mesh without discrete
anatomical and mechanical subcomponents, like tracts or bands (90).
In vivo cardiac DTI is a powerful tool to enhance the understanding of cardiac
microstructure. In contrast to histological studies, in vivo imaging is non-invasive and
depicts cardiac structure under in vivo conditions. Additionally, a potential bias in fibre
and sheet orientation metrics due to tissue damage by dissection can be avoided.

25
Chapter 3 Diffusion Imaging
3.1 The Molecular Diffusion Process
The process of free diffusion of water molecules can be modelled as random walk. The
probability of finding a particle at position x at time t is described by the probability
density function ( , )P x t . It satisfies the diffusion equation described by Fick (91):
2( , )( , )
P x tD P x t
t
(3.1)
with the diffusion constant D. A solution to this partial differential equation with the
boundary conditions
( ,0) ( )P x x (initial condition) (3.2)
and
( , ) 1dVP x t (normalization condition) (3.3)
was derived by Einstein (92):
2
41
( , )4
x
DtP x t eDt
(3.4)
The root mean squared displacement from the origin to position x at time t ( ( )rmsx t ) is
the standard deviation of ( )x t :
2
2
0
( ) ( , ) ( , )rmsx t P x t x dx P x t xdx
(3.5)

26
From eq. (3.5) and (3.4) it follows:
( ) 6rmsx t Dt (3D) (3.6)
( ) 2rmsx t Dt (1D) (3.7)
Figure 3.1 depicts ( , )P x t for D=1.4x10⁻³mm2/s and t=20 and 1000ms in one dimension.
The red vertical lines represent the thickness of myocytes (approximately 20μm)
(44,60), indicating sizes of potential barriers for freely diffusing water molecules. The
probability distribution broadens with diffusion time and the assumption for free
diffusion in cardiac tissue is only valid for very short diffusion times t.
3.2 The Stejskal-Tanner Sequence
In 1954, Carr and Purcell demonstrated that the signal intensity in NMR experiments is
attenuated by water self-diffusion in the presence of diffusion encoding gradients (93).
Based on this work, Stejskal and Tanner extended a spin echo based imaging sequence
with pulsed gradients straddling the echo pulse (21) (Figure 3.2).
Assuming gradient pulses with gradient strength G and duration , the transverse
magnetization of water molecules at position 1x accrues a phase 1 during the first
gradient pulse:
1 1Gx (3.8)
Figure 3.1 Probability density function ( , )P x t for two diffusion encoding times (t=20 and
1000ms). For comparison, the thickness of myocytes (~ 20μm) is indicated by red lines.
27
with as the gyromagnetic ratio Protons 2 42.6
MHz
T . If the molecules move
during the time to position 2x , the phase accumulation after the second gradient
reads:
2 2Gx (3.9)
Hence, the net phase results as:
2 1 2 1( )G x x (3.10)
Obviously, net dephasing is zero for static molecules. The measured transverse
magnetization M is the sum over all transverse magnetization vectors with individual
phase history within a given voxel. With 2 1x x x it follows:
0 ( , ) i G xM M P x e dx
(3.11)
Combining Eq. (3.4) and (3.11), the signal M decays exponentially as function of the
gradient parameters and D.
2( ) ( )
3
0
D GMe
M
(3.12)
Figure 3.2 Stejskal-Tanner Sequence with single-shot echo planar readout (EPI). Diffusion
encoding is performed by unipolar gradients around the refocusing pulse.

28
3.3 The Diffusion Tensor Model
The dynamics of the nuclear magnetization M in the presence of magnetic field B is
described by the Bloch equations (94). The formula was extended with a diffusion term
in 1956 by Torrey (95):
2
0
10 0
01
0 0 0 D
11
0 0
T2
MM B M M M
t T2
T1T1
(3.13)
T1 and T2 are the longitudinal and transversal relaxation times, respectively and 0M
the equilibrium magnetization. In the case of diffusion anisotropy, diffusivity needs to
be described by a rank 2 tensor D . For the Stejskal-Tanner experiment, the solution for
the transverse magnetization ( )M t reads (41):
0
( ') D ( ') '
0( ) e
t
Tk t k t dt
M t M
(3.14)
with the 0th moment of the diffusion gradient
'
0
( ') ( )
t
k t G u du (3.15)
In case of isotropic media, ( )M t at echo formation simplifies to:
0( ) e bDM TE M
(3.16)
with the gradient waveform dependent diffusion weighting factor b
' '
2
0 0 0 0
( ') ( ') ' ( ) ( ) '
TE TE t t
Tb k t k t dt G u du G u du dt
(3.17)
Assuming instantaneous gradient strength, i.e. zero rise time, and neglecting the effect
of imaging gradients, the b-value for the pulsed gradient experiment can be calculated
as:
29
2( ) ( )3
b G
(3.18)
For anisotropic media, eq. (3.14) can be recast to:
3 3
1 1
( )ln( )
(0)ij ij
i j
S bb D
S
(3.19)
with the diffusion-weighted signal ( )S b at TE and the corresponding reference signal
without diffusion weighting (0)S .ijb and
ijD are the components of the b-matrix and
diffusion tensor D , respectively. D is represented by a real, symmetric positive
definite matrix:
xx xy xz
xy yy yz
xz yz zz
D D D
D D D D
D D D
(3.20)
The diagonal terms of D correspond to diffusion along the x, y, z axis of the laboratory
frame, whereas off-diagonal terms describe the correlation between molecular
displacements along orthogonal directions (96).
To calculate the diffusion tensor, at least six diffusion-weighted measurements along
non-collinear encoding directions are necessary and one additional (0)S reference
image. If more than six directions are encoded, least squares fitting algorithms can be
employed to derive D (96). Several studies have investigated optimal gradient
direction sampling schemes with the conclusion that uniform sampling along three
dimensions minimizes the condition number and improves diffusion tensor accuracy
(97–100).
The diffusion tensor can be transformed into its eigensystem 1 2 3(e ,e ,e ) with diagonal
representation. It can be visualized by a diffusion ellipsoid with the main axis aligned
with the orthonormal basis of its eigenvectors (Figure 3.3). The boundaries of the
ellipsoid are determined by the corresponding eigenvalues 1 2 3( , , ) and represent
diffusion coefficients along the eigenvectors of D .

30
For isotropic diffusion 1 2 3( ) , the diffusion ellipsoid becomes a sphere, whereas
for 1 2 3( ) the ellipsoid has a cigar shape orientated along its principal
eigenvector. In the case of crossing fibers within one voxel, the principal fibre
orientations cannot be resolved with a tensor model. In this case, the tensor has a
planar shape 1 2 3( ) . Besides the diffusion ellipsoid, superquadric glyphs have
been proposed for diffusion tensor representation (101) (Figure 2.1). They facilitate
visualisation of anisotropic tensor data by enhancing glyph edges, potentially
improving diffusion data interpretation.
In case of restricted diffusion, the diffusion constant D is named apparent diffusion
constant (ADC). According to eq. (3.16) it can be computed by at least two images with
different b-values.
1 2
2 1
log(M( ) / M( ))b bADC
b b
(3.21)
For anisotropic diffusion, the ADC depends on the diffusion encoding direction. In this
case, the average diffusion constant (“Mean Diffusivity”, MD) can be computed by the
mean of the eigenvalues 1 2 3( , , ) of the diffusion tensor D :
1 2 3 ( )
3 3
tr DMD
(3.22)
Figure 3.3 Diffusion tensor representation as diffusion ellipsoid: the principal axis of the ellipsoid
form an orthogonal basis which is aligned with the diffusion tensor eigenvectors. The axis
lengths are determined by the corresponding eigenvalues.

31
As the trace of a matrix is independent of the choice of basis, any matrix
representation of D can be used to derive MD. Hence, the MD can be calculated by
measuring the ADC along three orthogonal directions (97).
The standard deviation of the diffusion tensor eigenvalues is measured by the
fractional anisotropy ( FA ). It is normalized such that the values of FA range between
0 and 1:
32
1
32
1
( )3
2
i
i
i
i
MD
FA
(3.23)
In the isotropic case, FA is zero, whereas values above zero indicate diffusion
anisotropy, e.g. due to diffusion restrictions.
3.4 Non-Gaussian Diffusion Models
Assuming that the principal fibre orientation is aligned with the first eigenvector, the
diffusion tensor model has been established as the most common method to
determine fibre orientations in biological tissues. The model, however, fails in regions
with multiple fibre orientations, like crossing or bending fibres as only a single fibre
orientation can be inferred per imaging voxel. Furthermore, the assumption of a
Gaussian diffusion probability density distribution is not fulfilled in the presence of
molecular and cellular boundaries, which restrict free diffusion of water molecules. To
address these limitations, diffusion encoding schemes with high angular resolution
have been developed in combination with fibre orientation reconstruction methods
which are independent of diffusion models.
Eq. (3.11) can be rewritten as signal equation ( )S q in vector form using a Fourier
integral:
0( ) ( , ) iq xS q S P x e dx (3.24)
with the reciprocal wave vector q :
32
( )q G t dt
(3.25)
Hence, the diffusion distribution function ( , )P x can be obtained by Cartesian
sampling of the q-space and Fourier transformation:
0
( )( , ) iq xS q
P x e dqS
(3.26)
Q-space imaging or diffusion spectrum imaging (DSI)(102) is a six-dimensional
acquisition method with three spatial and three q-space dimensions (103).
As the angular fibre orientation is of main interest, the radial information can be
integrated via a spherical projection to obtain the diffusion orientation distribution
function ( )ODF u with unit vector u (102):
2
0
( ) ( , )ODF u P ru r dr
(3.27)
Finally, principal fibre orientations for each voxel can be derived from the local maxima
of the ODF.
DSI, however, suffers from two practical shortcomings: long acquisition time due to
three-dimensional sampling in q-space and the need for strong diffusion encoding
gradients to satisfy the Nyquist condition for diffusion in the tissue of interest.
Consequently, DSI data quality is limited by low SNR due to long TE.
Instead of sampling the whole q-space, acquisition time can be reduced by sampling on
a sphere with high angular resolution (q-ball imaging, HARDI) (104,105). The
orientation density function can be approximated via the Funk-Radon transformation
as proposed by Tuch et al. (105):
0
( )( )
q u
S qODF u dq
S (3.28)
The diffusion probability along a particular direction can be obtained by integration of
the diffusion signal along an equator around this direction.
33
The concept of spherical deconvolution was proposed by Tournier et al. (106) to
separate multiple fibre orientations within one voxel. Assuming similar diffusion
characteristics for individual fibre bundles, the diffusion signal ( , )S can be written
as a convolution
( , ) ( , ) ( )S ODF R (3.29)
The axially symmetric response function ( )R describes the signal attenuation for a
single fibre bundle and is weighted by the fibre orientation density function. The ODF
can be derived by deconvolving the signal with the response function, which can be
approximated from a region with high FA (106). Besides DSI and q-ball imaging, multi-
compartment diffusion models have been proposed:
A bi-exponential diffusion tensor model allows imaging of multiple diffusion
components, like rapidly and slowly diffusing fractions in intracellular and extracellular
spaces (107,108). According to Assaf et al., fiber orientation estimation can be further
improved compared to single or dual diffusion tensor imaging, if the diffusion model
takes hindrance and restriction effects into account (CHARMED) (109,110).
Diffusion Kurtosis Imaging (DKI) has been proposed to quantify the degree of non-
Gaussian water diffusion (111,112). It is described by a rank 4 tensor and can be seen
as an extension to the rank 2 diffusion tensor model: the signal equation can be
expanded up to 3rd order in b:
23 3 3 3 3 3 3
2 3
1 1 1 1 1 1 1
( ) 1 1ln ( )
(0) 6 3i j ij ii i j k l ijkl
i j i i j k l
S bb n n D b D n n n n W O b
S
(3.30)
with the diffusion and kurtosis tensors ijD and ijklW , respectively. in is the ith
component along the direction n . As the kurtosis tensor is fully symmetric with
respect to exchanging indices, 15 components are independent. A useful scalar metric
describing diffusional heterogeneity is the diffusional kurtosis ( )K t :
23
3 3 3 31
23 3 1 1 1 1
1 1
1( )
3( ) ( )
( )
ii
i
i j k l ijkl
i j k l
i j ij
i j
D t
K t n n n nW t
n n D t
(3.31)
34
In case of a pure Gaussian diffusion distribution, ( )K t vanishes. For a distribution
broader than Gaussian, ( )K t becomes negative, for a more sharply peaked distribution
( )K t is positive. Primary applications to DKI have been neurological studies (111,113),
however deviations from Gaussian diffusion distributions have been found in ex vivo
cardiac tissue recently (114).
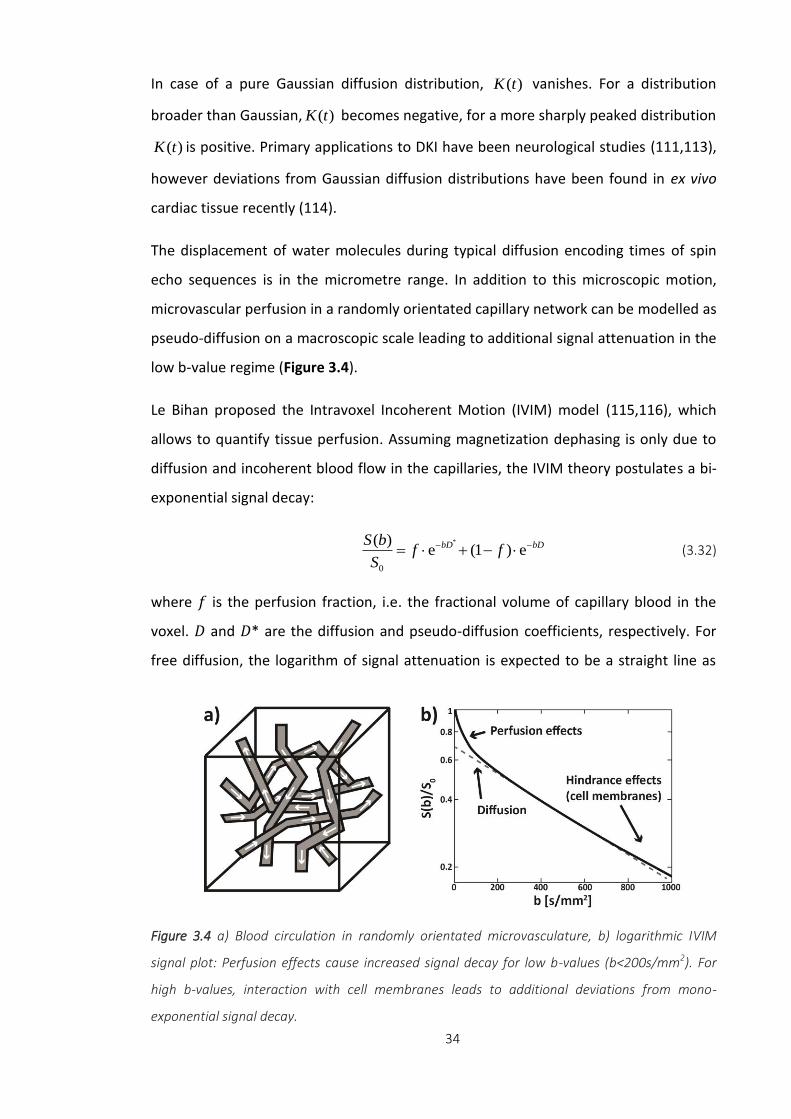
The displacement of water molecules during typical diffusion encoding times of spin
echo sequences is in the micrometre range. In addition to this microscopic motion,
microvascular perfusion in a randomly orientated capillary network can be modelled as
pseudo-diffusion on a macroscopic scale leading to additional signal attenuation in the
low b-value regime (Figure 3.4).
Le Bihan proposed the Intravoxel Incoherent Motion (IVIM) model (115,116), which
allows to quantify tissue perfusion. Assuming magnetization dephasing is only due to
diffusion and incoherent blood flow in the capillaries, the IVIM theory postulates a bi-
exponential signal decay:
*
0
( )e (1 ) ebD bDS b
f fS
(3.32)
where 𝑓 is the perfusion fraction, i.e. the fractional volume of capillary blood in the
voxel. 𝐷 and 𝐷* are the diffusion and pseudo-diffusion coefficients, respectively. For
free diffusion, the logarithm of signal attenuation is expected to be a straight line as
Figure 3.4 a) Blood circulation in randomly orientated microvasculature, b) logarithmic IVIM
signal plot: Perfusion effects cause increased signal decay for low b-values (b<200s/mm2). For
high b-values, interaction with cell membranes leads to additional deviations from mono-
exponential signal decay.

35
shown in Figure 3.4 b). For small b-values (below 200s/mm2) perfusion effects cause
deviations such that the diffusion coefficient appears to be larger if a b=0s/mm2 is
taken as reference. Towards b values of 1000s/mm2 interactions with cell membranes
result in non-Gaussian diffusion (117). To account for different relaxation rates of
blood and tissue, T1 and T2 relaxation terms can be incorporated in eq. (3.32) as
proposed by Lemke at al. (118).
Recently, Moulin et al. (119) and Delattre et al. (120) derived diffusion and perfusion
parameters of the in vivo human heart using diffusion-weighted imaging. Motion
induced signal loss was mitigated by multiple acquisitions during diastole and Principal
Component Analysis with Temporal Maximum Intensity Projection PCATMIP (40).
Perfusion fraction f was found to be 12±1%, diffusion and pseudo-diffusion constant D
and D* were determined to be 1.4±0.1x10⁻³mm2/s and 44±9x10⁻³mm2/s, respectively
(119).

36
Chapter 4 Cardiac Diffusion Imaging
4.1 Systematic Challenges
The primary method for image acquisition in diffusion-weighted imaging is single-shot
echo planar imaging (EPI) (Figure 4.1). The sequence is one of the fastest MRI
sequences, making it particularly suited for cardiac diffusion imaging.
Figure 4.1 Spin echo sequence with echo planar imaging readout. Diffusion weighting is achieved
by bipolar diffusion encoding gradients compensating 1st order motion.
As seen in Figure 4.1, the global signal envelope follows a T2 decay. EPI suffers from
several shortcomings: Due to the echo train, TE is relatively long which leads to low
signal-to-noise ratio (SNR) and spatial resolution.
37
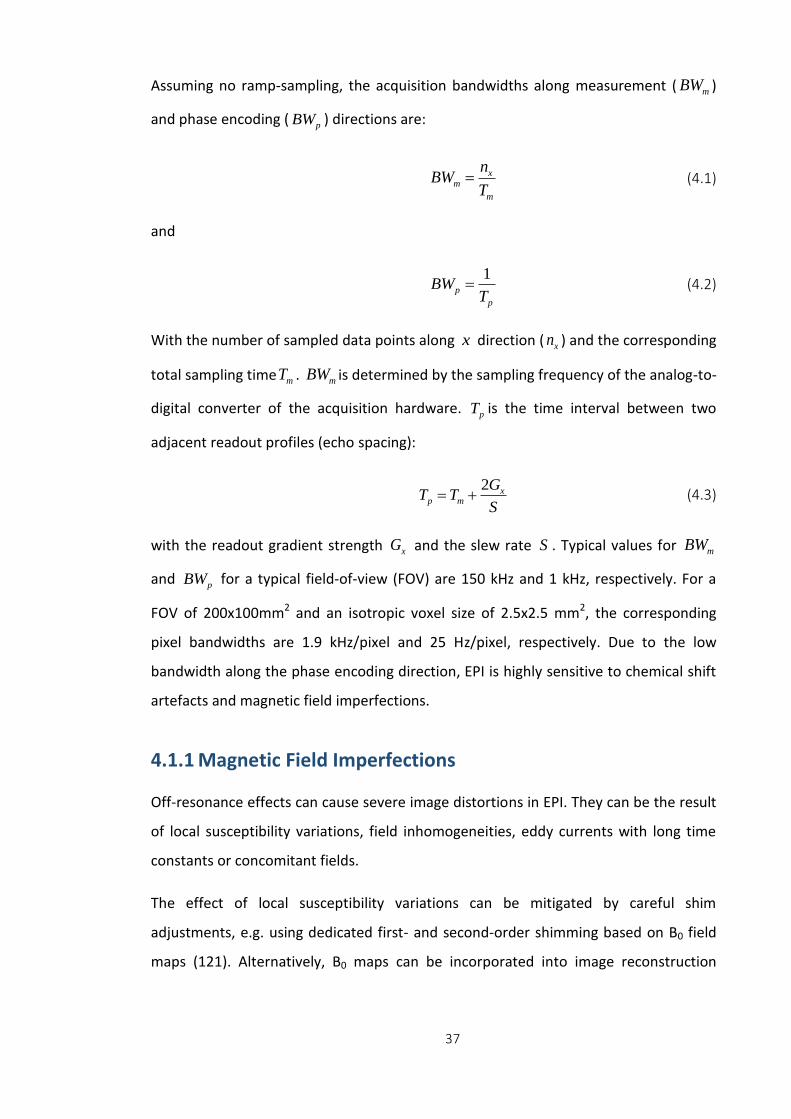
Assuming no ramp-sampling, the acquisition bandwidths along measurement ( mBW )
and phase encoding (pBW ) directions are:
xm
m
nBW
T (4.1)
and
1
p
p
BWT
(4.2)
With the number of sampled data points along x direction ( xn ) and the corresponding
total sampling time mT . mBW is determined by the sampling frequency of the analog-to-
digital converter of the acquisition hardware. pT is the time interval between two
adjacent readout profiles (echo spacing):
2 x
p m
GT T
S (4.3)
with the readout gradient strength xG and the slew rate S . Typical values for mBW
and pBW for a typical field-of-view (FOV) are 150 kHz and 1 kHz, respectively. For a
FOV of 200x100mm2 and an isotropic voxel size of 2.5x2.5 mm2, the corresponding
pixel bandwidths are 1.9 kHz/pixel and 25 Hz/pixel, respectively. Due to the low
bandwidth along the phase encoding direction, EPI is highly sensitive to chemical shift
artefacts and magnetic field imperfections.
4.1.1 Magnetic Field Imperfections
Off-resonance effects can cause severe image distortions in EPI. They can be the result
of local susceptibility variations, field inhomogeneities, eddy currents with long time
constants or concomitant fields.
The effect of local susceptibility variations can be mitigated by careful shim
adjustments, e.g. using dedicated first- and second-order shimming based on B0 field
maps (121). Alternatively, B0 maps can be incorporated into image reconstruction
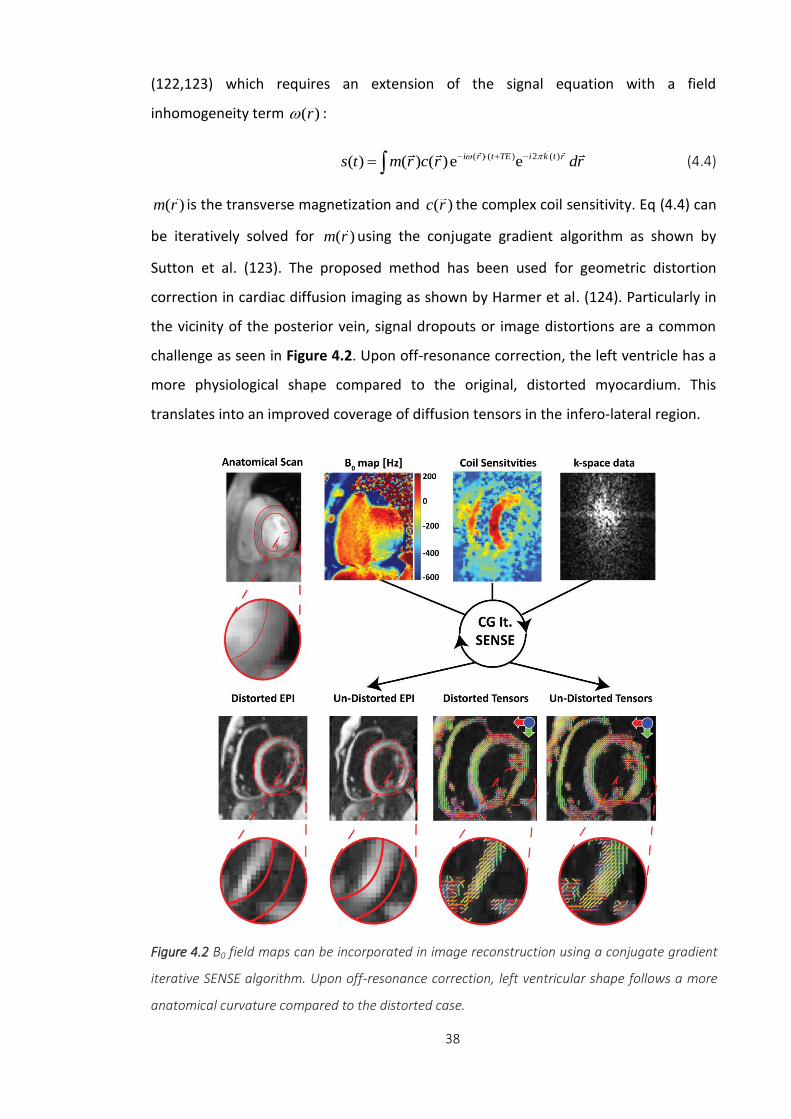
38
(122,123) which requires an extension of the signal equation with a field
inhomogeneity term ( )r :
( ) ( ) 2 ( )( ) ( ) ( )e ei r t TE i k t rs t m r c r dr (4.4)
( )m r is the transverse magnetization and ( )c r the complex coil sensitivity. Eq (4.4) can
be iteratively solved for ( )m r using the conjugate gradient algorithm as shown by
Sutton et al. (123). The proposed method has been used for geometric distortion
correction in cardiac diffusion imaging as shown by Harmer et al. (124). Particularly in
the vicinity of the posterior vein, signal dropouts or image distortions are a common
challenge as seen in Figure 4.2. Upon off-resonance correction, the left ventricle has a
more physiological shape compared to the original, distorted myocardium. This
translates into an improved coverage of diffusion tensors in the infero-lateral region.
Figure 4.2 B0 field maps can be incorporated in image reconstruction using a conjugate gradient
iterative SENSE algorithm. Upon off-resonance correction, left ventricular shape follows a more
anatomical curvature compared to the distorted case.
39
Alternatively, image distortions can be mitigated by reducing the echo train length, e.g.
using k-space subsampling and parallel imaging (e.g. SENSE, GRAPPA, (125,126)) or
multi-shot imaging (127,128).
4.1.2 Eddy Currents
According to Faraday’s law, switching magnetic fields cause eddy-currents in
conductive structures of the MR hardware. These currents depend on the applied
diffusion-encoding strength and direction and induce temporally shifted magnetic
fields counteracting the proposed gradient waveforms. In case of single-shot EPI, this
leads to inconsistent k-space trajectories and misaligned diffusion-weighted images.
Other artefacts due to eddy-current induced phase changes during image readout are
ghosting, bulk object shifts, deformations and signal dropout (122,129). Possible
means to reduce these effects are shielded gradient coils (130), gradient pre-emphasis
(131) or twice refocused sequence designs (132,133).
Alternatively, eddy-current induced fields can be measured by NMR field probes. The
spatiotemporal evolution of the phase (up to 3rd spatial order) can be assessed by a
dynamic field camera consisting of 16 NMR probes (134). Applications of this approach
have been shown in diffusion and phase contrast imaging (129,135,136). During a
separate calibration scan, the phase evolution of the probes is measured and
incorporated in the reconstruction algorithms to correct for temporal and higher-order
spatial effects. The phase ( , )r t can be expanded in a spherical harmonic basis:
15
0
( , ) ( ) (r) ( )l l ref
l
r t k t h r t
(4.5)
with the set of spherical harmonics basis functions ( )lh r as in Table 1 of (134). As
described in (134), the coefficients ( )lk t can be derived from the measured probe
phases. The off-resonance contribution at the reference point at position r is ( )ref r .
The phase evolution in a spin echo diffusion imaging sequence using uni- and bipolar
gradients was characterised in a phantom study by Chan et al. (129). Figure 4.3
demonstrates the feasibility of phase correction in a structured isotropic phantom. The
intensity plots along the vertical blue line for various diffusion encoding directions are
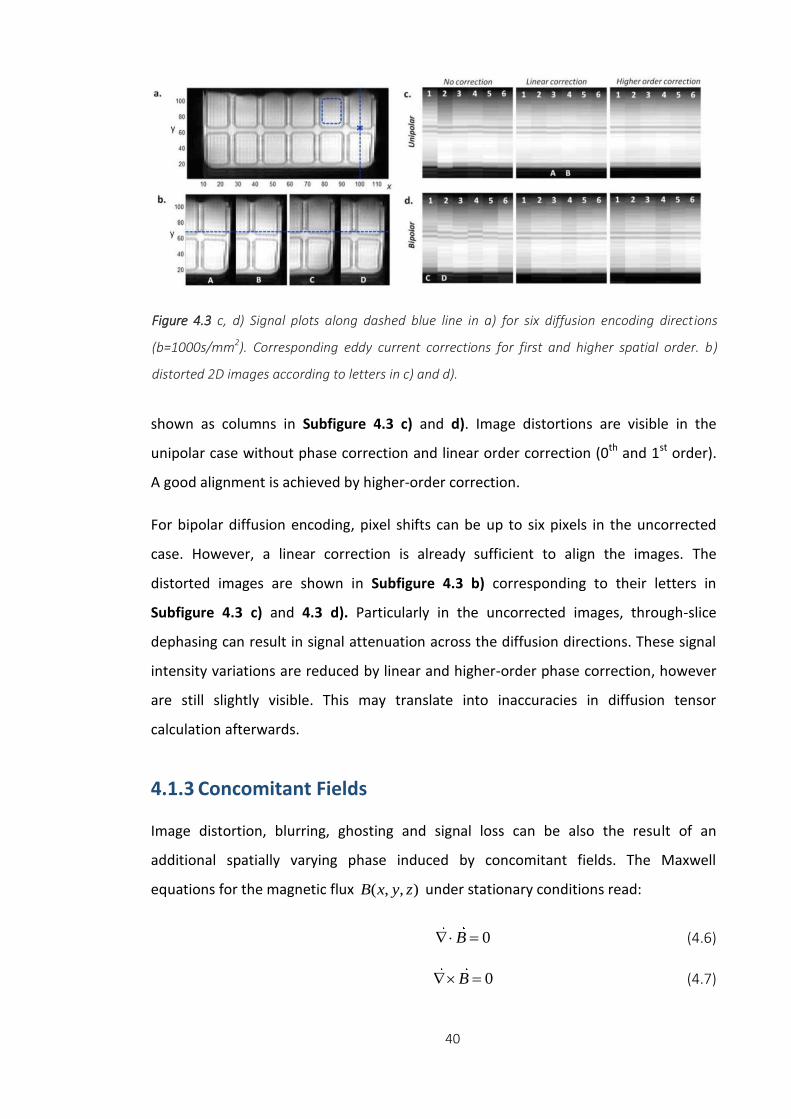
40
shown as columns in Subfigure 4.3 c) and d). Image distortions are visible in the
unipolar case without phase correction and linear order correction (0th and 1st order).
A good alignment is achieved by higher-order correction.
For bipolar diffusion encoding, pixel shifts can be up to six pixels in the uncorrected
case. However, a linear correction is already sufficient to align the images. The
distorted images are shown in Subfigure 4.3 b) corresponding to their letters in
Subfigure 4.3 c) and 4.3 d). Particularly in the uncorrected images, through-slice
dephasing can result in signal attenuation across the diffusion directions. These signal
intensity variations are reduced by linear and higher-order phase correction, however
are still slightly visible. This may translate into inaccuracies in diffusion tensor
calculation afterwards.
4.1.3 Concomitant Fields
Image distortion, blurring, ghosting and signal loss can be also the result of an
additional spatially varying phase induced by concomitant fields. The Maxwell
equations for the magnetic flux ( , , )B x y z under stationary conditions read:
0B (4.6)
0B (4.7)
Figure 4.3 c, d) Signal plots along dashed blue line in a) for six diffusion encoding directions
(b=1000s/mm2). Corresponding eddy current corrections for first and higher spatial order. b)
distorted 2D images according to letters in c) and d).
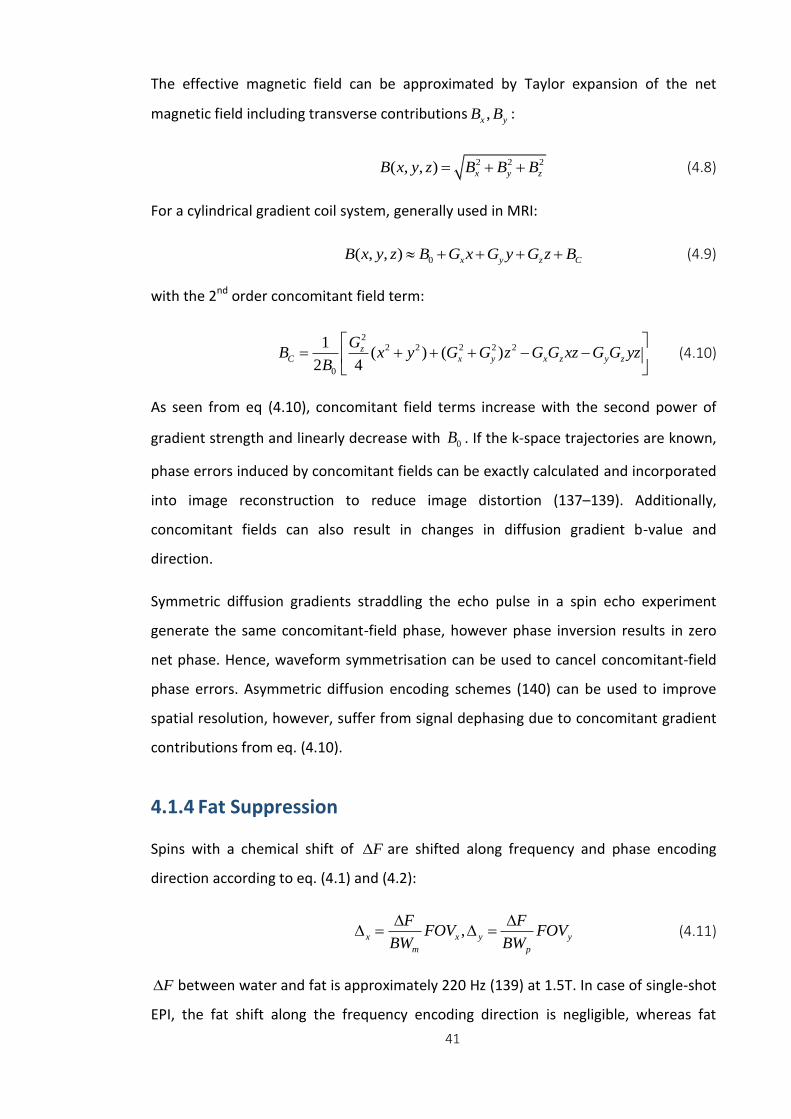
41
The effective magnetic field can be approximated by Taylor expansion of the net
magnetic field including transverse contributions ,x yB B :
2 2 2( , , ) x y zB x y z B B B (4.8)
For a cylindrical gradient coil system, generally used in MRI:
0( , , ) x y z CB x y z B G x G y G z B (4.9)
with the 2nd order concomitant field term:
2
2 2 2 2 2
0
1( ) ( )
2 4
zC x y x z y z
GB x y G G z G G xz G G yz
B
(4.10)
As seen from eq (4.10), concomitant field terms increase with the second power of
gradient strength and linearly decrease with 0B . If the k-space trajectories are known,
phase errors induced by concomitant fields can be exactly calculated and incorporated
into image reconstruction to reduce image distortion (137–139). Additionally,
concomitant fields can also result in changes in diffusion gradient b-value and
direction.
Symmetric diffusion gradients straddling the echo pulse in a spin echo experiment
generate the same concomitant-field phase, however phase inversion results in zero
net phase. Hence, waveform symmetrisation can be used to cancel concomitant-field
phase errors. Asymmetric diffusion encoding schemes (140) can be used to improve
spatial resolution, however, suffer from signal dephasing due to concomitant gradient
contributions from eq. (4.10).
4.1.4 Fat Suppression
Spins with a chemical shift of F are shifted along frequency and phase encoding
direction according to eq. (4.1) and (4.2):
,x x y y
m p
F FFOV FOV
BW BW
(4.11)
F between water and fat is approximately 220 Hz (139) at 1.5T. In case of single-shot
EPI, the fat shift along the frequency encoding direction is negligible, whereas fat
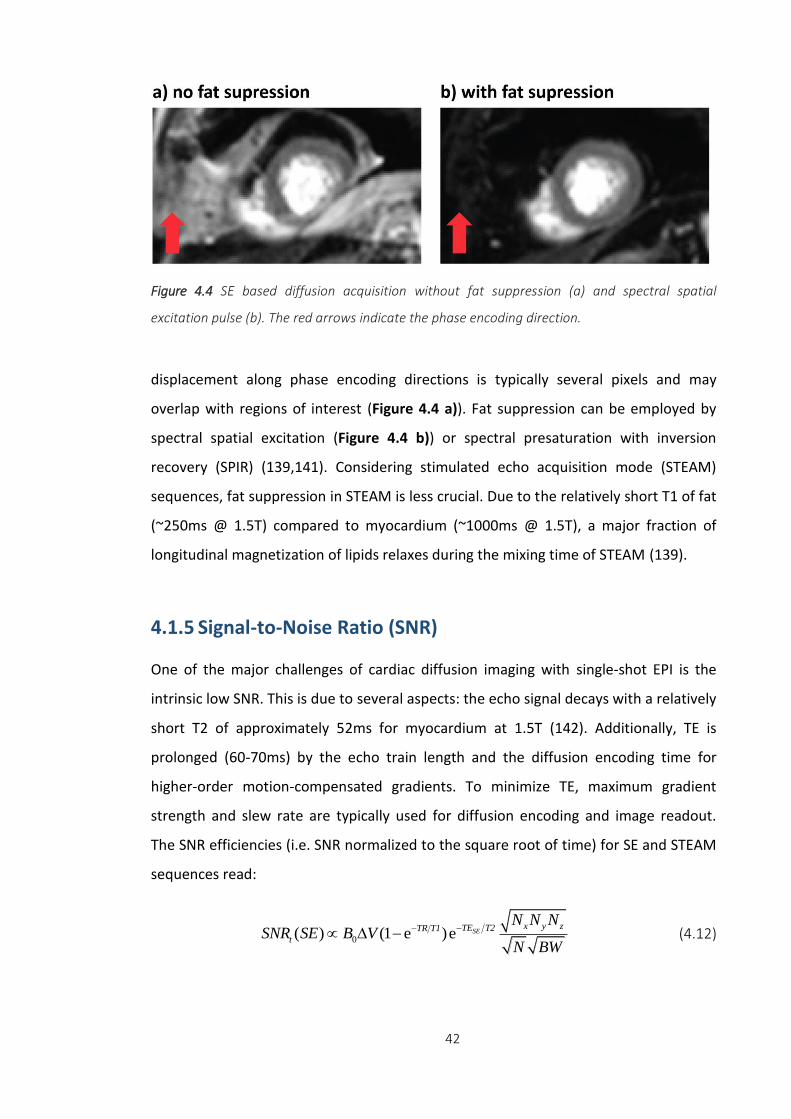
42
displacement along phase encoding directions is typically several pixels and may
overlap with regions of interest (Figure 4.4 a)). Fat suppression can be employed by
spectral spatial excitation (Figure 4.4 b)) or spectral presaturation with inversion
recovery (SPIR) (139,141). Considering stimulated echo acquisition mode (STEAM)
sequences, fat suppression in STEAM is less crucial. Due to the relatively short T1 of fat
(~250ms @ 1.5T) compared to myocardium (~1000ms @ 1.5T), a major fraction of
longitudinal magnetization of lipids relaxes during the mixing time of STEAM (139).
4.1.5 Signal-to-Noise Ratio (SNR)
One of the major challenges of cardiac diffusion imaging with single-shot EPI is the
intrinsic low SNR. This is due to several aspects: the echo signal decays with a relatively
short T2 of approximately 52ms for myocardium at 1.5T (142). Additionally, TE is
prolonged (60-70ms) by the echo train length and the diffusion encoding time for
higher-order motion-compensated gradients. To minimize TE, maximum gradient
strength and slew rate are typically used for diffusion encoding and image readout.
The SNR efficiencies (i.e. SNR normalized to the square root of time) for SE and STEAM
sequences read:
0( ) (1 e )e SEx y zTE T2TR T1
t
N N NSNR SE B V
N BW
(4.12)
Figure 4.4 SE based diffusion acquisition without fat suppression (a) and spectral spatial
excitation pulse (b). The red arrows indicate the phase encoding direction.

43
0
1 1( ) (1 e )e e
2 2
STEAMx y zTE T2TR T1 TM T1
t
N N NSNR STEAM B V
N BW
(4.13)
1
1
60 min1000 ,
[min ] 2
STEAMTETR ms TM TR
HR
(4.14)
with the main magnetic field 0B , the voxel volume V x y z , N as the number of
signal averages and , ,x y zN the number of data samples along , ,x y z direction. The
factors 1/2 and 1/√2 in eq. (4.13) account for the inherent signal loss in STEAM and
the need for two cardiac cycles in stimulated echo formation. According to eq (4.12)
and (4.13), spatial resolution is on the order of mm assuming relevant scan time and
SNR. SNR can be improved by increasing 0B , increase of the voxel size and the number
of signal averages. If multiple 2D slices are acquired, SNR can be enhanced by pro-
longing TR using slice cycling. Figure 4.5 compares the SNRt for SE and STEAM at 1.5T
and 3T. The corresponding T1 and T2 values of myocardium were taken from Table 4.1.
1.5T 3.0T
T1 [ms] 1030±39 1341±42
T2 [ms] 52±3 42±4
Table 4.1 T1 and T2 values for myocardium taken from (142–145)
Relevant values for TE were taken from the literature (146) assuming second-order
motion-compensated gradients for SE based imaging: SETE : 70ms, STEAMTE : 31ms. All
values for SNRt are normalized to SNRt of the first signal average in the SE case at 1.5T
(marked with the cross in Figure 4.5 a). Partial signal saturation along multiple signal
averages can be seen in all cases. Cardiac diffusion imaging using spin echoes is clearly
favourable with respect to SNR at both field strengths. For a heart rate of 60
beats/minute the ratio of SNRt(SE) vs. SNRt(STEAM) is approximately 3.5 and 2.4, at
1.5T and 3T, respectively.
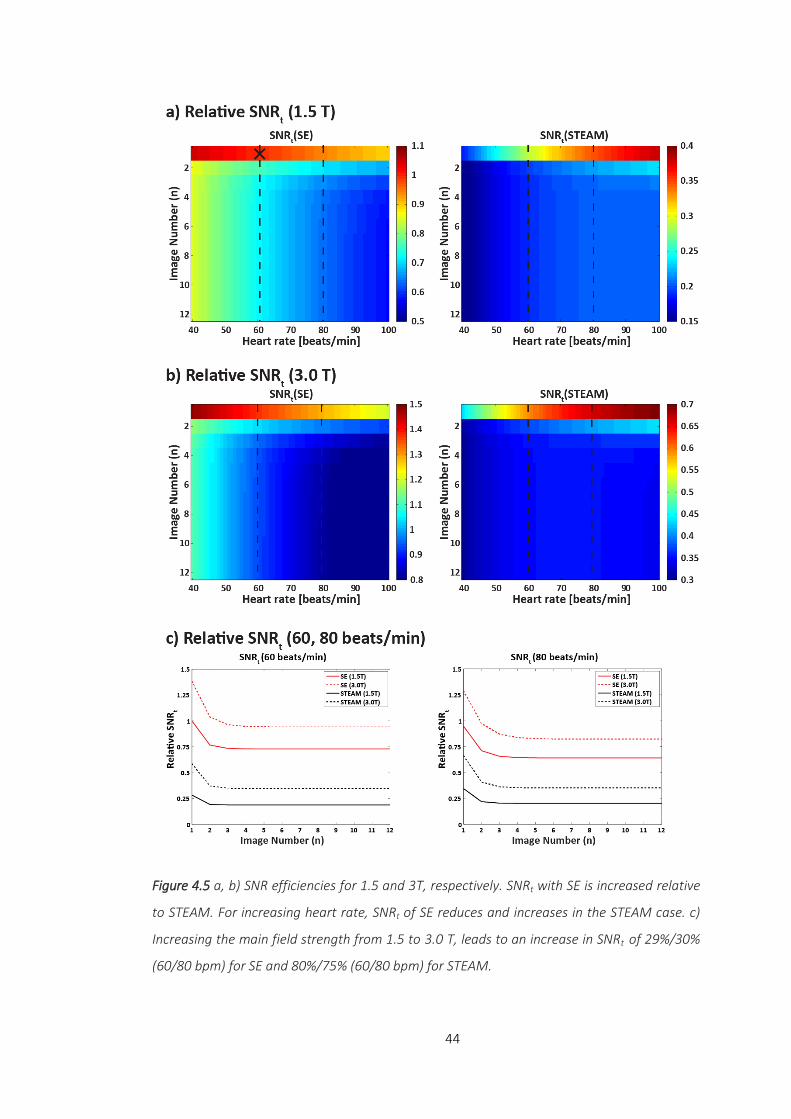
44
Figure 4.5 a, b) SNR efficiencies for 1.5 and 3T, respectively. SNRt with SE is increased relative
to STEAM. For increasing heart rate, SNRt of SE reduces and increases in the STEAM case. c)
Increasing the main field strength from 1.5 to 3.0 T, leads to an increase in SNRt of 29%/30%
(60/80 bpm) for SE and 80%/75% (60/80 bpm) for STEAM.
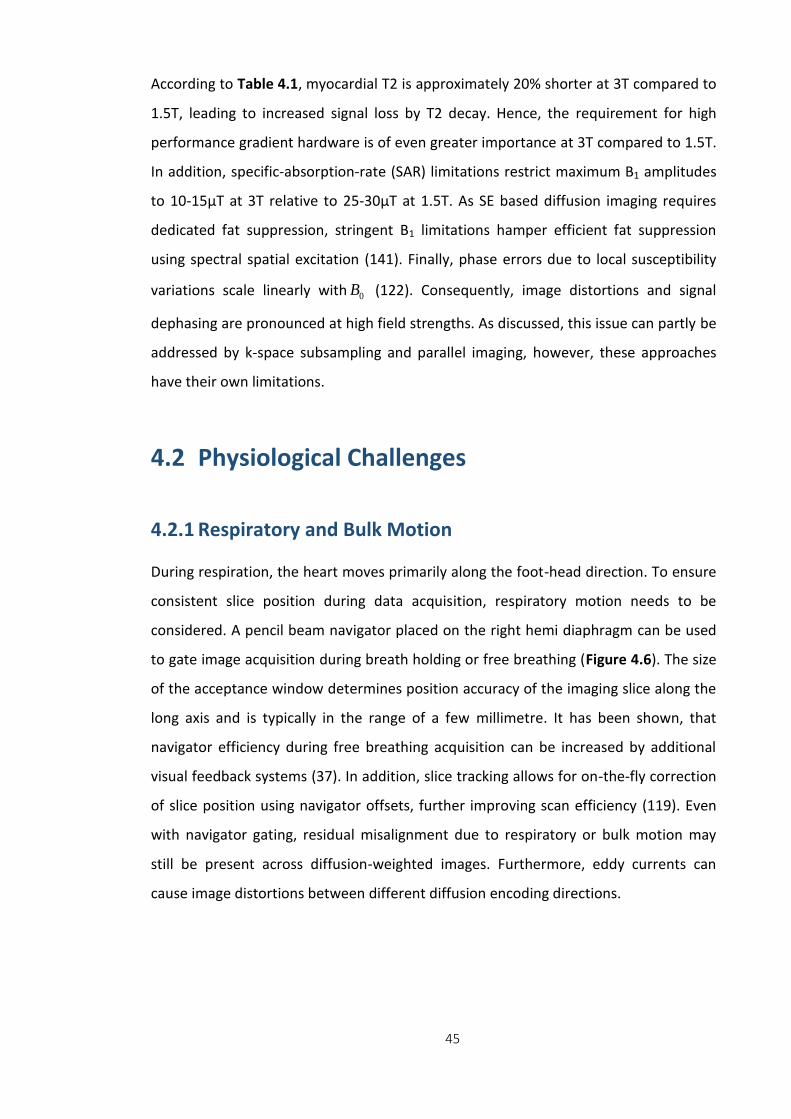
45
According to Table 4.1, myocardial T2 is approximately 20% shorter at 3T compared to
1.5T, leading to increased signal loss by T2 decay. Hence, the requirement for high
performance gradient hardware is of even greater importance at 3T compared to 1.5T.
In addition, specific-absorption-rate (SAR) limitations restrict maximum B1 amplitudes
to 10-15μT at 3T relative to 25-30μT at 1.5T. As SE based diffusion imaging requires
dedicated fat suppression, stringent B1 limitations hamper efficient fat suppression
using spectral spatial excitation (141). Finally, phase errors due to local susceptibility
variations scale linearly with 0B (122). Consequently, image distortions and signal
dephasing are pronounced at high field strengths. As discussed, this issue can partly be
addressed by k-space subsampling and parallel imaging, however, these approaches
have their own limitations.
4.2 Physiological Challenges
4.2.1 Respiratory and Bulk Motion
During respiration, the heart moves primarily along the foot-head direction. To ensure
consistent slice position during data acquisition, respiratory motion needs to be
considered. A pencil beam navigator placed on the right hemi diaphragm can be used
to gate image acquisition during breath holding or free breathing (Figure 4.6). The size
of the acceptance window determines position accuracy of the imaging slice along the
long axis and is typically in the range of a few millimetre. It has been shown, that
navigator efficiency during free breathing acquisition can be increased by additional
visual feedback systems (37). In addition, slice tracking allows for on-the-fly correction
of slice position using navigator offsets, further improving scan efficiency (119). Even
with navigator gating, residual misalignment due to respiratory or bulk motion may
still be present across diffusion-weighted images. Furthermore, eddy currents can
cause image distortions between different diffusion encoding directions.
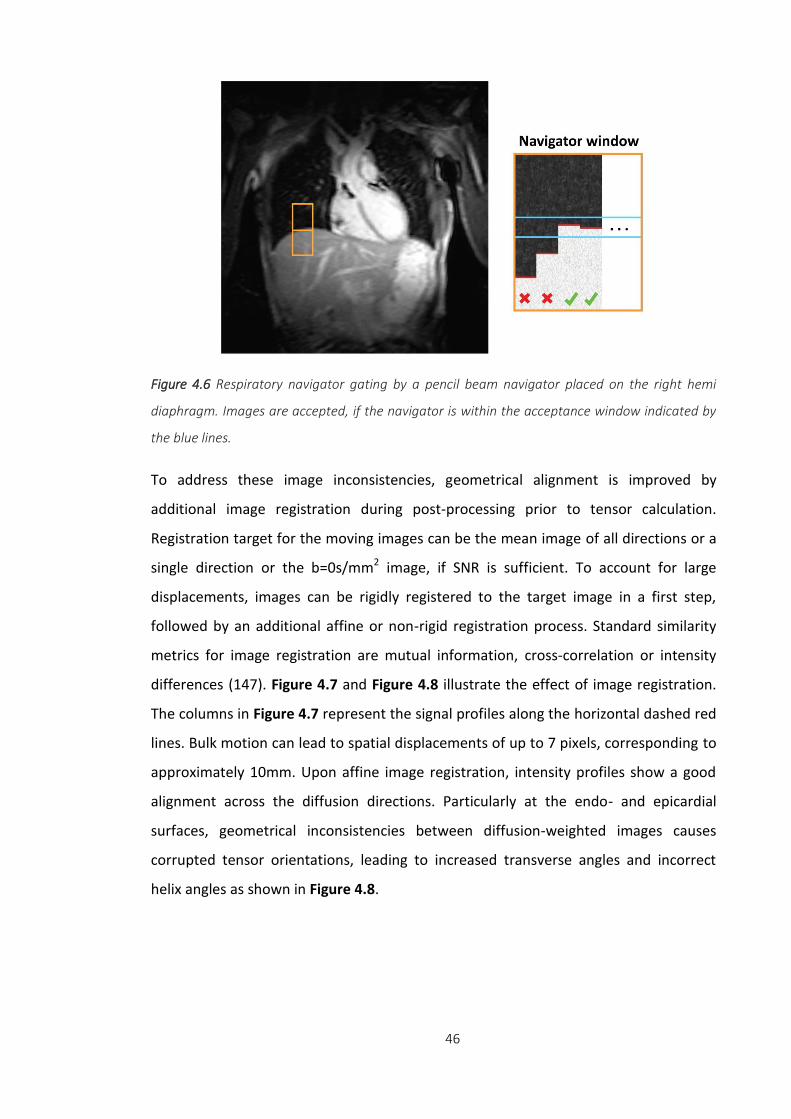
46
To address these image inconsistencies, geometrical alignment is improved by
additional image registration during post-processing prior to tensor calculation.
Registration target for the moving images can be the mean image of all directions or a
single direction or the b=0s/mm2 image, if SNR is sufficient. To account for large
displacements, images can be rigidly registered to the target image in a first step,
followed by an additional affine or non-rigid registration process. Standard similarity
metrics for image registration are mutual information, cross-correlation or intensity
differences (147). Figure 4.7 and Figure 4.8 illustrate the effect of image registration.
The columns in Figure 4.7 represent the signal profiles along the horizontal dashed red
lines. Bulk motion can lead to spatial displacements of up to 7 pixels, corresponding to
approximately 10mm. Upon affine image registration, intensity profiles show a good
alignment across the diffusion directions. Particularly at the endo- and epicardial
surfaces, geometrical inconsistencies between diffusion-weighted images causes
corrupted tensor orientations, leading to increased transverse angles and incorrect
helix angles as shown in Figure 4.8.
Figure 4.6 Respiratory navigator gating by a pencil beam navigator placed on the right hemi
diaphragm. Images are accepted, if the navigator is within the acceptance window indicated by
the blue lines.
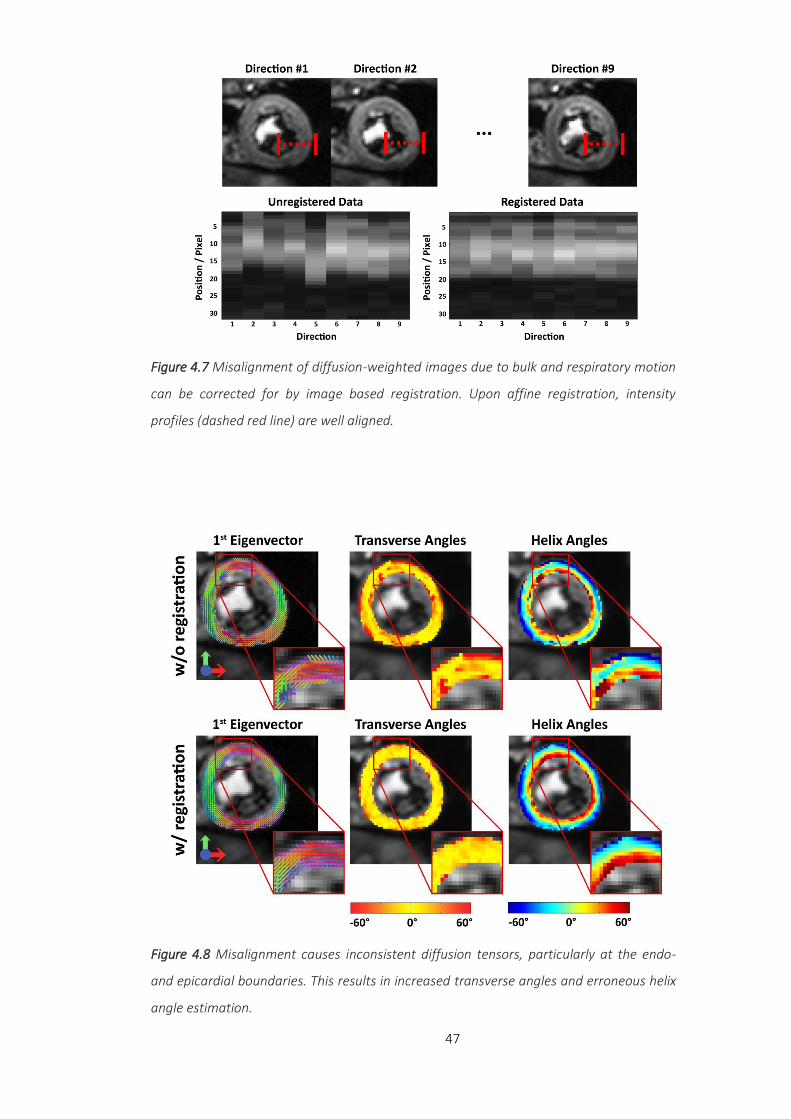
47
Figure 4.7 Misalignment of diffusion-weighted images due to bulk and respiratory motion
can be corrected for by image based registration. Upon affine registration, intensity
profiles (dashed red line) are well aligned.
Figure 4.8 Misalignment causes inconsistent diffusion tensors, particularly at the endo-
and epicardial boundaries. This results in increased transverse angles and erroneous helix
angle estimation.
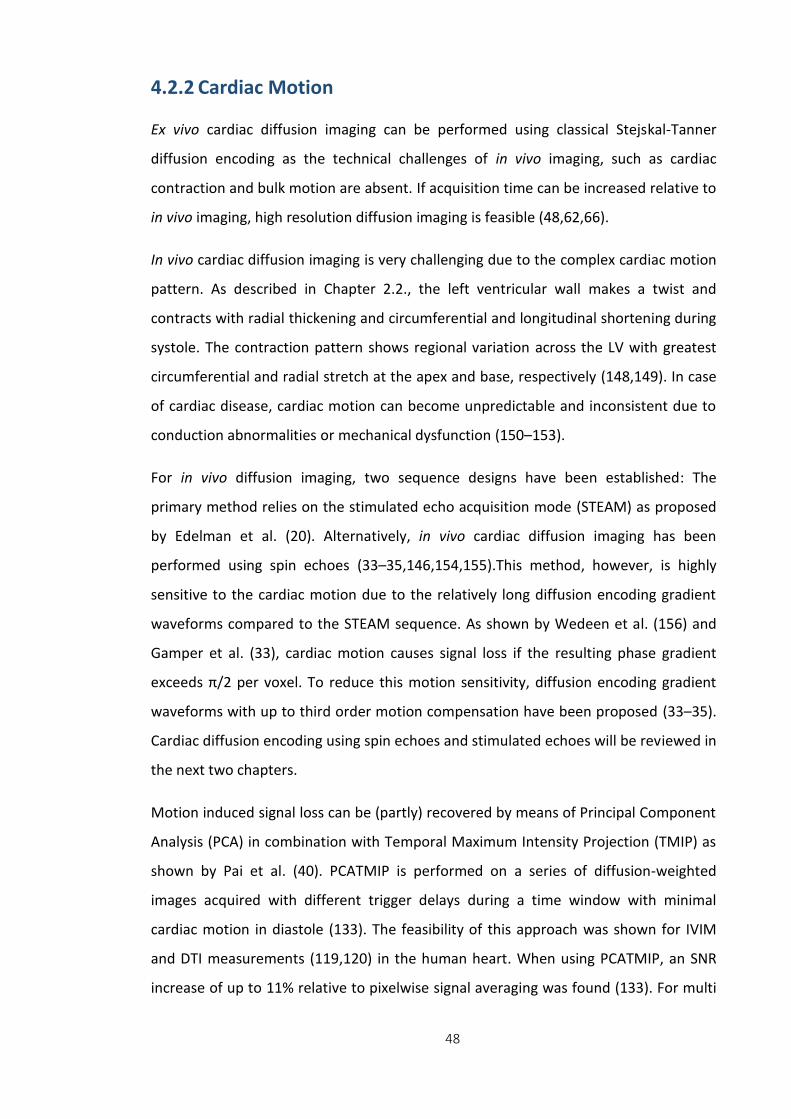
48
4.2.2 Cardiac Motion
Ex vivo cardiac diffusion imaging can be performed using classical Stejskal-Tanner
diffusion encoding as the technical challenges of in vivo imaging, such as cardiac
contraction and bulk motion are absent. If acquisition time can be increased relative to
in vivo imaging, high resolution diffusion imaging is feasible (48,62,66).
In vivo cardiac diffusion imaging is very challenging due to the complex cardiac motion
pattern. As described in Chapter 2.2., the left ventricular wall makes a twist and
contracts with radial thickening and circumferential and longitudinal shortening during
systole. The contraction pattern shows regional variation across the LV with greatest
circumferential and radial stretch at the apex and base, respectively (148,149). In case
of cardiac disease, cardiac motion can become unpredictable and inconsistent due to
conduction abnormalities or mechanical dysfunction (150–153).
For in vivo diffusion imaging, two sequence designs have been established: The
primary method relies on the stimulated echo acquisition mode (STEAM) as proposed
by Edelman et al. (20). Alternatively, in vivo cardiac diffusion imaging has been
performed using spin echoes (33–35,146,154,155).This method, however, is highly
sensitive to the cardiac motion due to the relatively long diffusion encoding gradient
waveforms compared to the STEAM sequence. As shown by Wedeen et al. (156) and
Gamper et al. (33), cardiac motion causes signal loss if the resulting phase gradient
exceeds π/2 per voxel. To reduce this motion sensitivity, diffusion encoding gradient
waveforms with up to third order motion compensation have been proposed (33–35).
Cardiac diffusion encoding using spin echoes and stimulated echoes will be reviewed in
the next two chapters.
Motion induced signal loss can be (partly) recovered by means of Principal Component
Analysis (PCA) in combination with Temporal Maximum Intensity Projection (TMIP) as
shown by Pai et al. (40). PCATMIP is performed on a series of diffusion-weighted
images acquired with different trigger delays during a time window with minimal
cardiac motion in diastole (133). The feasibility of this approach was shown for IVIM
and DTI measurements (119,120) in the human heart. When using PCATMIP, an SNR
increase of up to 11% relative to pixelwise signal averaging was found (133). For multi
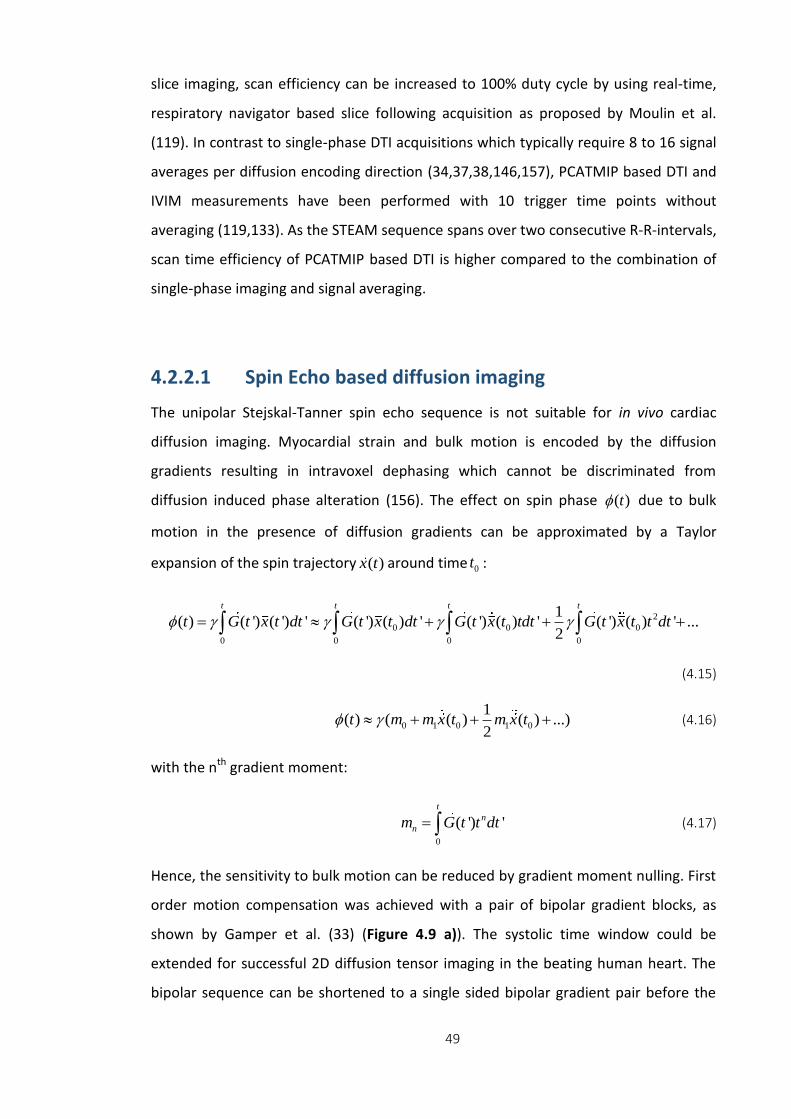
49
slice imaging, scan efficiency can be increased to 100% duty cycle by using real-time,
respiratory navigator based slice following acquisition as proposed by Moulin et al.
(119). In contrast to single-phase DTI acquisitions which typically require 8 to 16 signal
averages per diffusion encoding direction (34,37,38,146,157), PCATMIP based DTI and
IVIM measurements have been performed with 10 trigger time points without
averaging (119,133). As the STEAM sequence spans over two consecutive R-R-intervals,
scan time efficiency of PCATMIP based DTI is higher compared to the combination of
single-phase imaging and signal averaging.
4.2.2.1 Spin Echo based diffusion imaging
The unipolar Stejskal-Tanner spin echo sequence is not suitable for in vivo cardiac
diffusion imaging. Myocardial strain and bulk motion is encoded by the diffusion
gradients resulting in intravoxel dephasing which cannot be discriminated from
diffusion induced phase alteration (156). The effect on spin phase ( )t due to bulk
motion in the presence of diffusion gradients can be approximated by a Taylor
expansion of the spin trajectory ( )x t around time 0t :
2
0 0 0
0 0 0 0
1( ) ( ') ( ') ' ( ') ( ) ' ( ') ( ) ' ( ') ( ) ' ...
2
t t t t
t G t x t dt G t x t dt G t x t tdt G t x t t dt
(4.15)
0 1 0 1 0
1( ) ( ( ) ( ) ...)
2t m m x t m x t (4.16)
with the nth gradient moment:
0
( ') '
t
n
nm G t t dt (4.17)
Hence, the sensitivity to bulk motion can be reduced by gradient moment nulling. First
order motion compensation was achieved with a pair of bipolar gradient blocks, as
shown by Gamper et al. (33) (Figure 4.9 a)). The systolic time window could be
extended for successful 2D diffusion tensor imaging in the beating human heart. The
bipolar sequence can be shortened to a single sided bipolar gradient pair before the
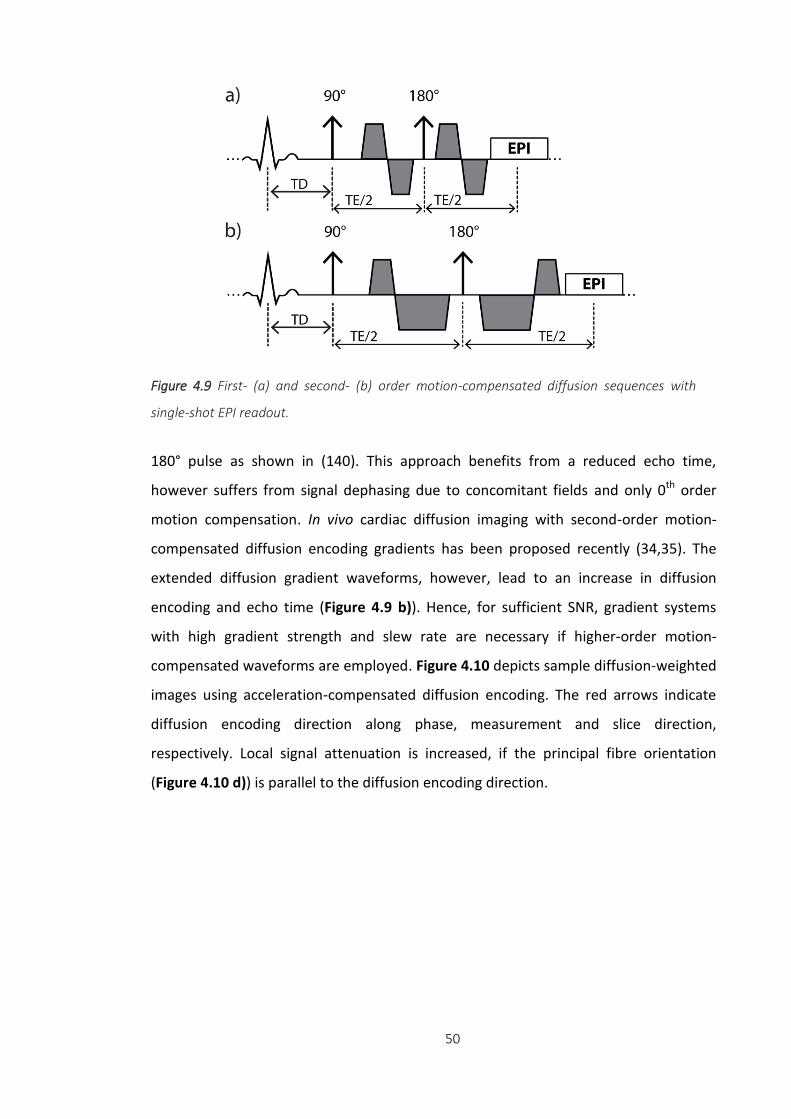
50
180° pulse as shown in (140). This approach benefits from a reduced echo time,
however suffers from signal dephasing due to concomitant fields and only 0th order
motion compensation. In vivo cardiac diffusion imaging with second-order motion-
compensated diffusion encoding gradients has been proposed recently (34,35). The
extended diffusion gradient waveforms, however, lead to an increase in diffusion
encoding and echo time (Figure 4.9 b)). Hence, for sufficient SNR, gradient systems
with high gradient strength and slew rate are necessary if higher-order motion-
compensated waveforms are employed. Figure 4.10 depicts sample diffusion-weighted
images using acceleration-compensated diffusion encoding. The red arrows indicate
diffusion encoding direction along phase, measurement and slice direction,
respectively. Local signal attenuation is increased, if the principal fibre orientation
(Figure 4.10 d)) is parallel to the diffusion encoding direction.
Figure 4.9 First- (a) and second- (b) order motion-compensated diffusion sequences with
single-shot EPI readout.

51
4.2.2.2 STEAM based diffusion imaging
In vivo cardiac DTI studies have successfully been performed with a double gated
STEAM sequence (Figure 4.11) (20,30,32,37–39,79,81,87,158–160). The sequence
spans over two consecutive heartbeats with the first and third 90° pulse applied at the
same trigger delay, followed by unipolar or bipolar diffusion gradients. Assuming
constant heart rate, the diffusion encoding is performed in the same cardiac phase in
successive cardiac cycles.
Diffusion sensitization primarily occurs during the mixing time 2
TETM RR such
that short diffusion gradients with moderate gradient strength are sufficient for
adequate diffusion weighting. Furthermore, quasi identical motion trajectories during
the application of the short diffusion encoding gradients make the STEAM sequence
less sensitive to bulk motion. During TM, magnetization stored in the longitudinal
direction decays with T1, in contrast to T2 decay in a diffusion-weighted SE sequence
(161) (Figure 4.5).
Figure 4.10 Example data of second-order motion-compensated diffusion-weighted imaging
(b=450s/mm2). Diffusion encoding is along phase (a), measurement (b) and slice selection (c)
direction (indicated by the red arrows). d) color-coded orientation of the first diffusion tensor
eigenvector.
52
Besides the intrinsic SNR loss of 50% relative to spin echoes and the inherent time
inefficiency, STEAM requires the spatial position of the heart to be consistent over
consecutive heartbeats. Accordingly, repeated breathholding or respiratory navigator
gating with narrow acceptance windows need to be employed (37). Cardiac motion is
assumed to be periodic for STEAM imaging, however, heart rate variations or
arrhythmia can cause signal loss, particularly in case of diastolic triggering (37).
The STEAM sequence with unipolar diffusion encoding gradients is sensitive to
material strain during the relatively long mixing time TM (162,163). As the diffusion
gradients phase encode the local displacement distribution (164), myocardial
deformation during the cardiac cycle results in additional modulation of the encoding
strength which confounds diffusion induced signal attenuation (162,163,165). The
impact of material strain on the diffusion tensor can be determined if the strain tensor
is known (38,163,166). The apparent diffusion tensor can be expressed by the right
stretch tensor ( )U t and the true diffusion tensor trueD :
1 1
0
1( ) ( )apparent trueD U t D U t dt
(4.18)
with being the duration of the R-R cycle. With known stretch tensor ( )U t , eq. (4.18)
can be inverted, leading to the undisturbed diffusion tensor trueD . As shown by Stoeck
et al., ( )U t can be computed from 3D tagging images (38).
Figure 4.12 summarizes the processing steps for diffusion tensor strain correction. As a
first step, diffusion and tagging data are registered to ensure geometric consistency.
Figure 4.11 STEAM sequence spanning over two consecutive heartbeats with unipolar diffusion
encoding and single-shot EPI readout.
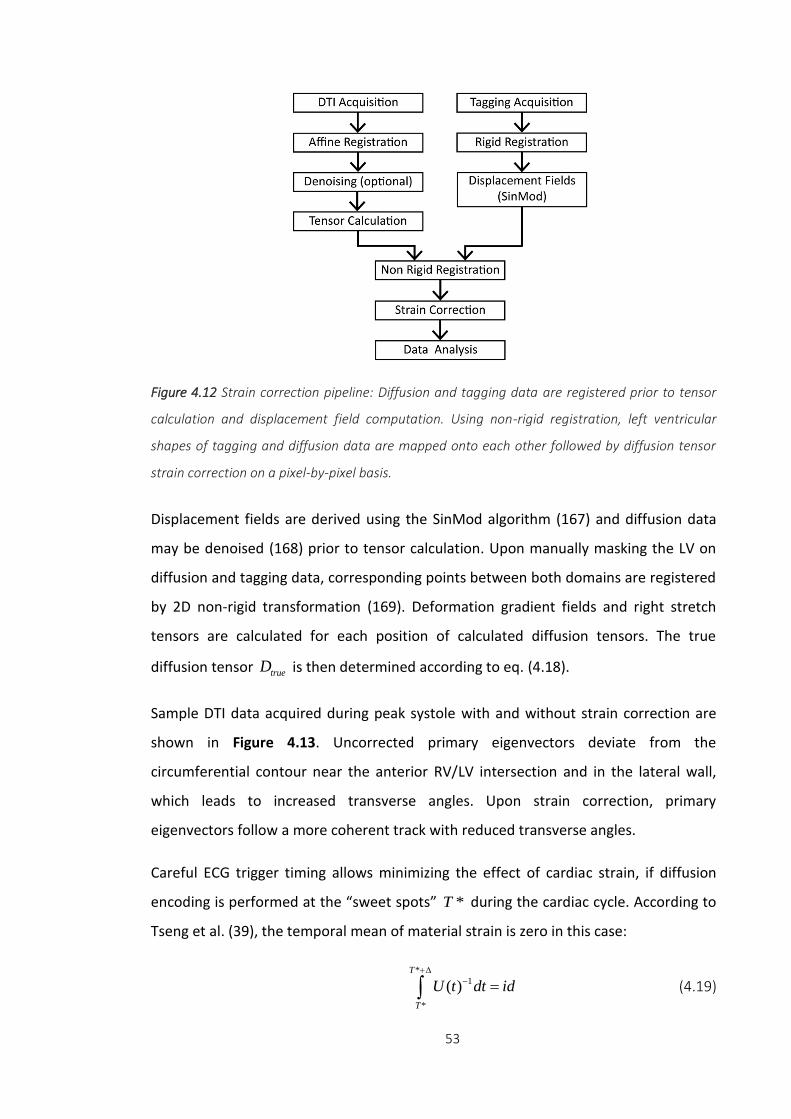
53
Displacement fields are derived using the SinMod algorithm (167) and diffusion data
may be denoised (168) prior to tensor calculation. Upon manually masking the LV on
diffusion and tagging data, corresponding points between both domains are registered
by 2D non-rigid transformation (169). Deformation gradient fields and right stretch
tensors are calculated for each position of calculated diffusion tensors. The true
diffusion tensor trueD is then determined according to eq. (4.18).
Sample DTI data acquired during peak systole with and without strain correction are
shown in Figure 4.13. Uncorrected primary eigenvectors deviate from the
circumferential contour near the anterior RV/LV intersection and in the lateral wall,
which leads to increased transverse angles. Upon strain correction, primary
eigenvectors follow a more coherent track with reduced transverse angles.
Careful ECG trigger timing allows minimizing the effect of cardiac strain, if diffusion
encoding is performed at the “sweet spots” *T during the cardiac cycle. According to
Tseng et al. (39), the temporal mean of material strain is zero in this case:
*
1
*
( )
T
T
U t dt id
(4.19)
Figure 4.12 Strain correction pipeline: Diffusion and tagging data are registered prior to tensor
calculation and displacement field computation. Using non-rigid registration, left ventricular
shapes of tagging and diffusion data are mapped onto each other followed by diffusion tensor
strain correction on a pixel-by-pixel basis.
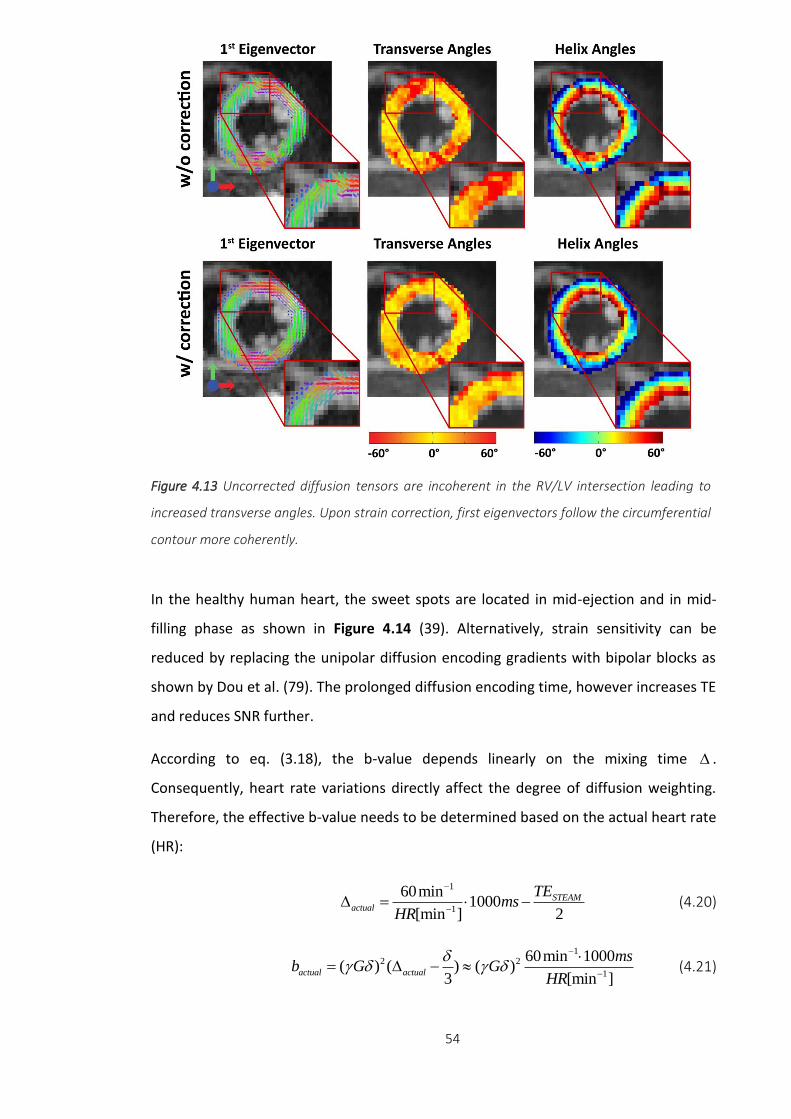
54
In the healthy human heart, the sweet spots are located in mid-ejection and in mid-
filling phase as shown in Figure 4.14 (39). Alternatively, strain sensitivity can be
reduced by replacing the unipolar diffusion encoding gradients with bipolar blocks as
shown by Dou et al. (79). The prolonged diffusion encoding time, however increases TE
and reduces SNR further.
According to eq. (3.18), the b-value depends linearly on the mixing time .
Consequently, heart rate variations directly affect the degree of diffusion weighting.
Therefore, the effective b-value needs to be determined based on the actual heart rate
(HR):
1
1
60min1000
[min ] 2
STEAMactual
TEms
HR
(4.20)
1
2 2
1
60min 1000( ) ( ) ( )
3 [min ]actual actual
msb G G
HR
(4.21)
Figure 4.13 Uncorrected diffusion tensors are incoherent in the RV/LV intersection leading to
increased transverse angles. Upon strain correction, first eigenvectors follow the circumferential
contour more coherently.
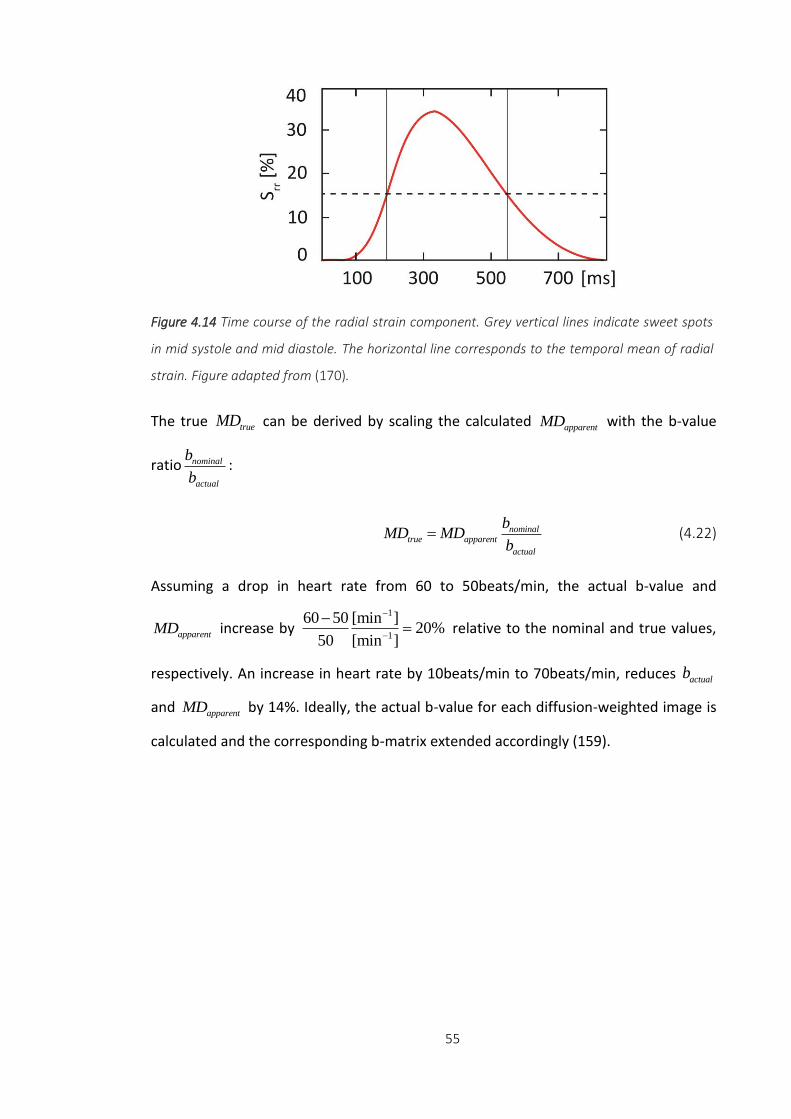
55
The true trueMD can be derived by scaling the calculated apparentMD with the b-value
ratio nominal
actual
b
b:
nominaltrue apparent
actual
bMD MD
b (4.22)
Assuming a drop in heart rate from 60 to 50beats/min, the actual b-value and
apparentMD increase by 1
1
60 50 [min ]20%
50 [min ]
relative to the nominal and true values,
respectively. An increase in heart rate by 10beats/min to 70beats/min, reduces actualb
and apparentMD by 14%. Ideally, the actual b-value for each diffusion-weighted image is
calculated and the corresponding b-matrix extended accordingly (159).
Figure 4.14 Time course of the radial strain component. Grey vertical lines indicate sweet spots
in mid systole and mid diastole. The horizontal line corresponds to the temporal mean of radial
strain. Figure adapted from (170).
56
Chapter 5
Spin Echo versus Stimulated
Echo Diffusion Tensor
Imaging of the In Vivo
Human Heart
5.1 Introduction
The fiber architecture of the heart has significant influence on cardiac function,
mechanical contraction and electrophysiology (76,83,171–173). The principal
orientation of myofibers can be obtained from histological studies (63,174,175) or ex
vivo (26,55,66) and in vivo (18,20,33,37–39,56,79,154,158,162,163,165) Diffusion
Tensor Imaging (DTI). While histological exams provide localized information on
myocyte orientation with very high spatial resolution ex vivo, cardiac DTI allows
assessment of myofiber aggregates non-invasively and in vivo. In agreement with
histology, ex vivo DTI studies have demonstrated the characteristic circumferential
alignment of myofibers with a distinct double helical pattern from endo- to epicardium
(45,46,176). Fiber disarray and myocardial remodeling due to myocardial infarction
and cardiomyopathies have been assessed by DTI methods both in animal and humans
subjects (47,48,50,51,54,87). Moreover, microstructural integrity of the myocardium
Published in: Constantin von Deuster, Christian T. Stoeck, Martin Genet, David Atkinson, Sebastian
Kozerke. “Spin Echo versus Stimulated Echo Diffusion Tensor Imaging of the In Vivo Human Heart”,
Magnetic Resonance in Medicine, doi: 10.1002/mrm.25998
57
has been described using mean diffusivity (MD) and fractional anisotropy (FA).
Whereas mean diffusivity increased in myocardial infarction, FA was found to decrease
(18,31,51,54). These findings highlight the potential of in vivo cardiac DTI to allow for
structural and functional tissue characterisation in a range of relevant diseases.
In vivo cardiac DTI has primarily been performed using the stimulated echo acquisition
mode (STEAM) (18,20,37–39,79,87,158,162,163). Alternatively, spin echo (SE) imaging
is feasible provided that motion-compensated diffusion gradients are employed or
dedicated post-processing to account for motion-induced signal loss is used
(23,33,34,40,56,161,177). Image formation is typically accomplished using echo planar
imaging (EPI) or balanced steady-state free precession imaging (36). Despite the
advances in sequence design and data processing, DTI of the beating heart remains a
challenging task due to low signal-to-noise-ratio (SNR), off-resonance artifacts, cardiac
bulk motion and myocardial strain.
In STEAM, diffusion encoding ranges across two consecutive heartbeats and hence the
spatial position and shape of the myocardium are required to be identical in
subsequent cardiac cycles. Accordingly, dedicated breath holding and navigator gating
schemes are essential to suppress respiratory motion induced displacements.
Alternatively, free breathing acquisition can be performed in combination with a
dedicated navigator gating strategy and optional patient feedback system (37). The
effect of myocardial strain during diffusion encoding using STEAM has to be considered
by acquiring at so-called “sweet spots” (39) in the cardiac cycle. Alternatively,
separately acquired strain data (38,163) may be used to correct for strain effects in the
DTI data. A key advantage of STEAM over SE relates to the modest gradient hardware
requirements as diffusion encoding takes place over a whole cardiac cycle and hence
relatively low diffusion encoding gradient strengths are sufficient for adequate
diffusion weighting.
With recent improvements in gradient hardware becoming widely available on clinical
MR systems and dedicated diffusion gradient designs, diffusion-weighted single-shot
spin echo (SE) sequences have become feasible for in vivo cardiac DTI. Several studies
have shown that signal attenuation due to myocardial motion can be addressed
successfully by incorporating motion-compensated diffusion gradient waveforms
58
(23,34,35,140,154,158,161,177–179). Promising results of the in vivo human (34) and
rat (35) heart using second and third order motion-compensated DTI have been
presented recently.
While image and data quality depend on many parameters including residual motion,
off-resonance and eddy-current effects (129), the low SNR of cardiac DTI is a significant
impediment to wider adoption of the technique in the clinic. Besides the need for
patient feedback (37) and dedicated data post-processing (38,40), low scan time
efficiency is a major reason for the small number of cardiac DTI studies on patients
(29,30,180). Accordingly, a comparison of the available sequence approaches with
regard to SNR and time efficiency is warranted to guide further improvements.
It is the objective of the present work to assess and compare SNR efficiency and
diffusion metrics derived from cardiac DTI employing acceleration-compensated
diffusion-weighted SE and cardiac triggered STEAM in both phantoms and in the in vivo
human heart.
5.2 Methods
Figure 5.1 illustrates the ECG-triggered and diffusion-weighted STEAM and SE
sequences used in the present study. For the SE variant, second-order motion-
compensated diffusion gradients are employed (34).
The SNR of SE and STEAM depend on sequence timing parameters (echo time: TE,
repetition time TR, mixing time TM), tissue properties (relaxation times T1, T2,
diffusivity D), imaging parameters (voxel size ΔV, number of signal averages NSA, flip
angle α) and diffusion encoding strength b. Here SNR efficiency (i.e., SNR normalized to
the square root of time) for the SE and STEAM sequences is defined as:
1 e
(SE) sin e e1 cos e
SE
TR T1TE T2 b D
t TR T1
VSNR
NSA
(5.1)
1 1 e
(STEAM) sin e e e2 1 cos e 2
STEAM
TR T1TE T2TM T1 b D
t TR T1
VSNR
NSA
(5.2)

59
In equation (5.2) the factors 1/2 and 1/√2 account for the inherent signal loss in
STEAM and the fact that two cardiac cycles are required to encode the stimulated
echo. Because of ECG triggering, TR and TM are determined by the subject’s heart rate
(HR) according to:
1
1
60 min1000[ ]
[min ] 2
STEAMTETR ms TM TR
HR
(5.3)
In Figure 5.2 the ratio of SNR efficiency for SE versus STEAM, SNRt(SE/STEAM), is
presented with sequence parameters according to the gradient system used in this
study (b-value=450s/mm2, TESE=70ms, TESTEAM=31ms). The SNRt(SE/STEAM) ratio is
seen to decrease with increasing heart rate but remains greater than 2.3 up to heart
rates of 90min-1. At a heart rate of 60min-1 and T1/T2 = 1030/52ms (142,143) the
theoretical SNR gain of SE relative to STEAM is approximately 3.5x.
Figure 5.1 Sequence diagrams. a) STEAM acquisition spanning over two consecutive heartbeats
and b) SE acquisition with second-order motion-compensated diffusion encoding gradients
including VERSE (variable rate selective excitation) echo pulse. Fat suppression is achieved by a
binomial excitation pulse. The excitation slab is tilted with respect to the 90° or 180° pulses to
allow for reduced field of view imaging. Prior to the first 90° excitation, rest slabs are applied
orthogonal to the field of view in phase encoding direction to suppress residually excited signal.
For both sequences, the trigger delay was set to mid systole and images were encoded by
identical single-shot EPI readouts.
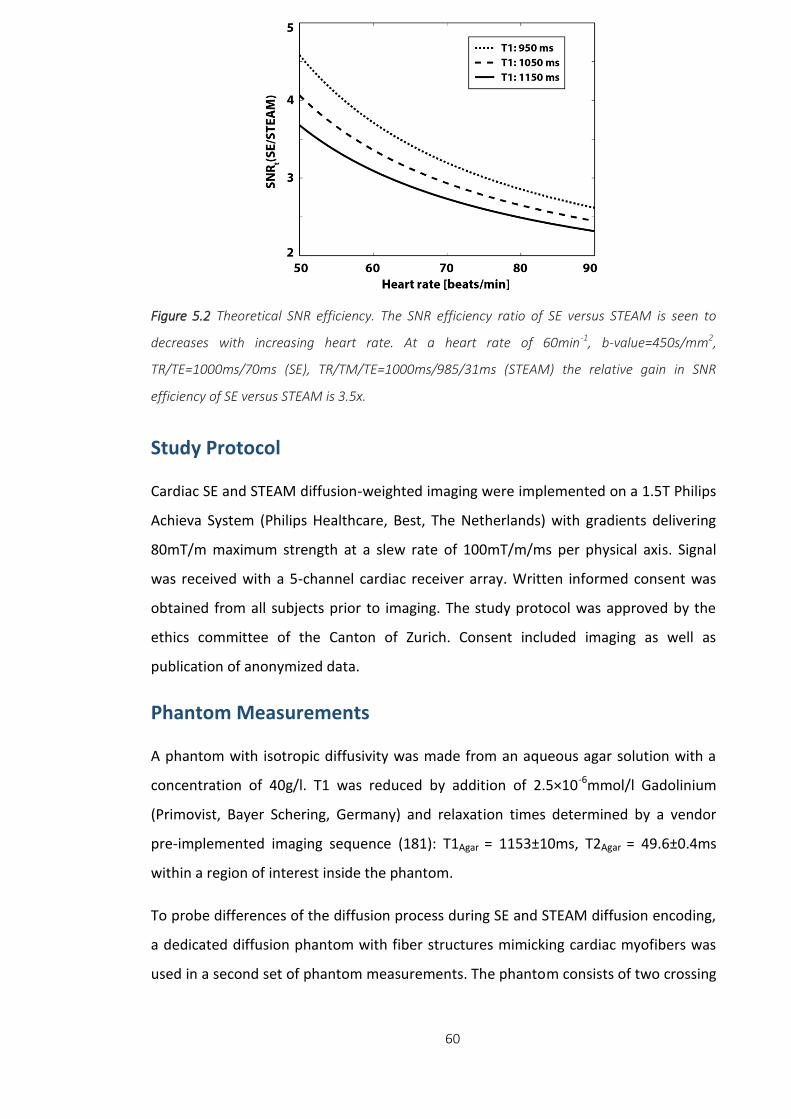
60
Study Protocol
Cardiac SE and STEAM diffusion-weighted imaging were implemented on a 1.5T Philips
Achieva System (Philips Healthcare, Best, The Netherlands) with gradients delivering
80mT/m maximum strength at a slew rate of 100mT/m/ms per physical axis. Signal
was received with a 5-channel cardiac receiver array. Written informed consent was
obtained from all subjects prior to imaging. The study protocol was approved by the
ethics committee of the Canton of Zurich. Consent included imaging as well as
publication of anonymized data.
Phantom Measurements
A phantom with isotropic diffusivity was made from an aqueous agar solution with a
concentration of 40g/l. T1 was reduced by addition of 2.5×10⁻⁶mmol/l Gadolinium
(Primovist, Bayer Schering, Germany) and relaxation times determined by a vendor
pre-implemented imaging sequence (181): T1Agar = 1153±10ms, T2Agar = 49.6±0.4ms
within a region of interest inside the phantom.
To probe differences of the diffusion process during SE and STEAM diffusion encoding,
a dedicated diffusion phantom with fiber structures mimicking cardiac myofibers was
used in a second set of phantom measurements. The phantom consists of two crossing
Figure 5.2 Theoretical SNR efficiency. The SNR efficiency ratio of SE versus STEAM is seen to
decreases with increasing heart rate. At a heart rate of 60min-1, b-value=450s/mm2,
TR/TE=1000ms/70ms (SE), TR/TM/TE=1000ms/985/31ms (STEAM) the relative gain in SNR
efficiency of SE versus STEAM is 3.5x.
61
fiber bundles (~20mm diameter) of hydrophobic polyethylene cords as described
previously (182).
The SNR efficiency of SE and STEAM was determined for several b-values (50, 100, 200,
300 and 450s/mm2). Diffusion-weighted images were acquired with in-plane
resolution: 2.8×2.8mm2, slice thickness: 16mm (isotropic phantom)/12mm (anisotropic
phantom), field of view (FOV): 230×98mm2, TR/TE (SE): 1000ms/70ms, TR/TE (STEAM):
1000ms/31ms, flip angle (SE, STEAM): 90°, 4 signal averages and 6 diffusion encoding
directions (Table 5.1). To measure noise, the scans were repeated without RF and
gradient pulses keeping the receiver gain and bandwidth the same as for actual
imaging. Sufficient time (>10sec) was allowed between image and noise acquisition to
ensure complete signal decay. SNR was determined for each voxel by dividing the
absolute signal value of the diffusion-weighted images by the standard deviation of the
real part of complex noise in a local mask of 9 by 9 pixels. SNRt(SE/STEAM) of the
anisotropic diffusion phantom was corrected for different T1/T2 values between both
phantoms (T1diffusion phantom = 934±42ms, T2 diffusion phantom = 104.2±4ms).
To reduce perfusion effects (115,159,183), in vivo DTI was performed without the b =
0s/mm2 image. Instead, three low diffusion-weighted images (b = 100s/mm2) were
acquired along orthogonal directions along with nine additional diffusion-weighted
images (b = 450s/mm2) distributed on the edge of a cube to maximize gradient
utilisation and hence gradient strength. The duration of diffusion encoding gradients
for the different diffusion weightings was kept the same and differences in b-values
were achieved by scaling the gradient strength. Imaging parameters were as follows:
in-plane resolution: 2.8×2.8mm2, slice thickness: 12mm, field of view (FOV):
230×98mm2, TR/TE (SE): 1000ms/70ms, TR/TE (STEAM): 1000ms/31ms, number of
signal averages: 16. To examine the effect of the sequence upon MD and FA, rather
than any effects due to intrinsic SNR dependence (184), the flip angle of the SE
excitation pulse was reduced to 16° to match SNR of the corresponding STEAM
sequence (flip angle STEAM: 90°). Hence, variations in MD and FA can be uniquely
assigned to differences during the diffusion encoding process.

62
In Vivo Measurements
Data were acquired in seven healthy subjects without history of cardiac disease (5
female, weight 64±6kg, age 28±6years, heart rate 64±10beats/min, min/max heart
rates: 49/89beats/min). Prior to diffusion imaging, cine data with a temporal
resolution of 10ms were acquired in two-chamber and short-axis view orientations.
According to the cine images, systolic quiescent time points were determined on a per
subject basis with a mean delay of 316±19ms.
Diffusion-weighted imaging was performed during breath holding in short-axis view
orientation with a reduced field-of-view (FOV) technique (185). Consistent levels of
breath-holds were ensured by the use of a respiratory navigator placed on the right
hemi diaphragm with a gating window of 5mm. To avoid aliasing from residual
excitation along the phase encoding direction, saturation slabs orthogonal to the
imaging plane were played out prior to the RF excitation pulse (see Figure 5.1). A 1-3-
3-1 binomial spatial-spectral excitation pulse for fat suppression (141) was employed
in the SE case. The duration of the 180° refocusing pulse was minimized using variable
SNR measurement (isotropic phantom)
Resolution b-values [s/mm2] Flip angle [deg] # directions NSA
SE 2.8x2.8x16mm3 50,100,200,300,450 90 6 4
STEAM 2.8x2.8x16mm3 50,100,200,300,450 90 6 4
SNR measurement (anisotropic phantom)
Resolution b-values [s/mm2] Flip angle [deg] # directions NSA
SE 2.8x2.8x12mm3 50,100,200,300,450 90 6 4
STEAM 2.8x2.8x12mm3 50,100,200,300,450 90 6 4
DTI measurement (anisotropic phantom)
Resolution b-values [s/mm2] Flip angle [deg] # directions NSA
SE 2.8x2.8x12mm3 100,450 16 12 16
STEAM 2.8x2.8x12mm3 100,450 90 12 16
Table 5.1 Imaging parameters of SNR and DTI phantom experiments
63
rate selective excitation (VERSE) (186) (Figure 5.1). Diffusion weighting was performed
by unipolar gradients (STEAM) and second-order motion-compensated gradient
waveforms (SE) as proposed in (34,35).
The trigger delay (TD) of the STEAM sequence was set to the systolic strain “sweet
spot” (50% end systole as shown in Figure 4.14). At this time point in the cardiac cycle,
strain approximates its temporal mean and the impact on diffusion metrics is
minimized (39). The centers of mass of the STEAM and SE diffusion gradients within an
R-R interval were aligned, resulting in a trigger delay for the SE sequence of 45% peak
systolic contraction. In vivo SNR measurements were performed in each volunteer
similar to the phantom experiments with a slice thickness of 16mm to increase SNR. To
guarantee identical b-values for the SE and STEAM sequences, the effective b-values
during STEAM acquisitions were calculated based on the actual heart rates recorded
during the in vivo experiments. Additionally, sufficient time to recover between the
breath holds was ensured to avoid significant heart rate variations during scanning. To
avoid magnetization transients during imaging, the first average was used as dummy
scan and discarded.
For DTI, total scan time of the in vivo experiments was matched between SE and
STEAM. Accordingly 8 signal averages per diffusion encoding direction were acquired
with STEAM while 16 averages were recorded with SE (Table 5.2). The imaging slice
(slice thickness: 8mm) was positioned at a mid-ventricular level. Data acquisition was
split into multiple breath holds by acquiring all signal averages of a single diffusion
encoding direction during a single breath hold. Between the breath holds, sufficient
time for complete relaxation of magnetization was insured.
Additionally, DTI and SNR measurements were repeated during respiratory navigator-
gated free breathing acquisition with identical imaging and sequence parameters. Data
collection was performed in seven healthy volunteers (5 female, weight 62±9kg, age
24±2years, heart rate 66±10beats/min) in a separate imaging session. The methods
and results are listed in the Appendix and Figure 5.9.
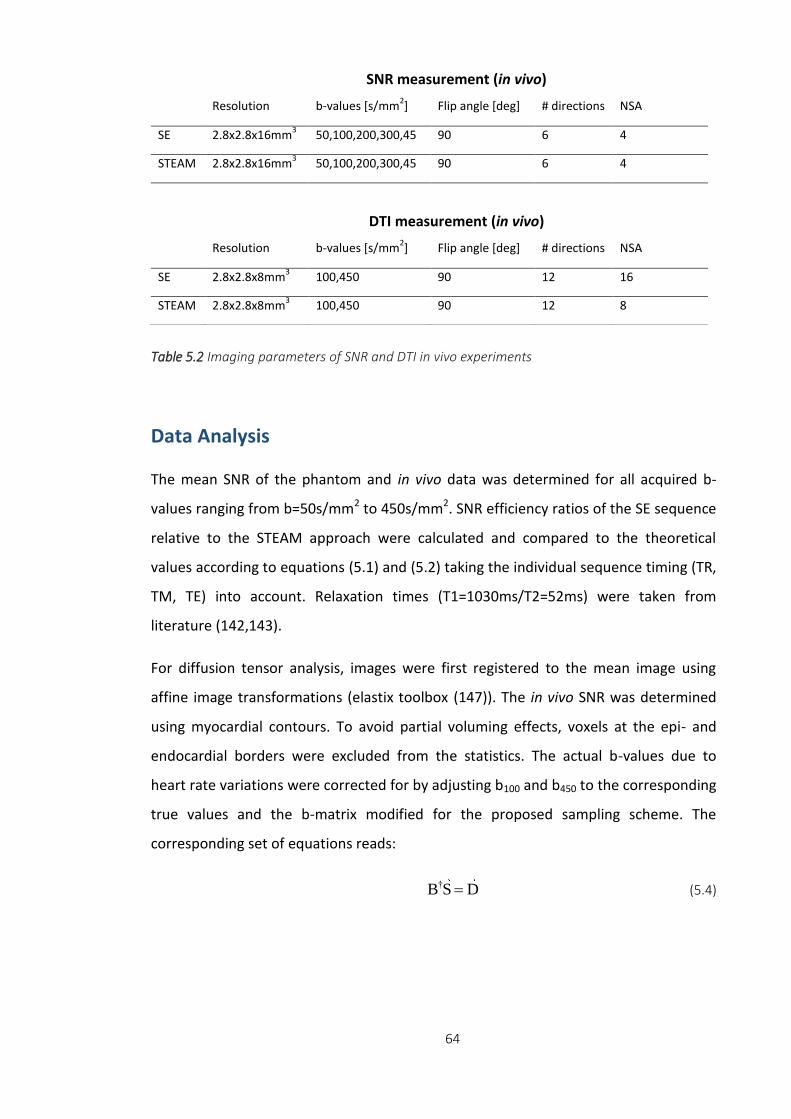
64
Data Analysis
The mean SNR of the phantom and in vivo data was determined for all acquired b-
values ranging from b=50s/mm2 to 450s/mm2. SNR efficiency ratios of the SE sequence
relative to the STEAM approach were calculated and compared to the theoretical
values according to equations (5.1) and (5.2) taking the individual sequence timing (TR,
TM, TE) into account. Relaxation times (T1=1030ms/T2=52ms) were taken from
literature (142,143).
For diffusion tensor analysis, images were first registered to the mean image using
affine image transformations (elastix toolbox (147)). The in vivo SNR was determined
using myocardial contours. To avoid partial voluming effects, voxels at the epi- and
endocardial borders were excluded from the statistics. The actual b-values due to
heart rate variations were corrected for by adjusting b100 and b450 to the corresponding
true values and the b-matrix modified for the proposed sampling scheme. The
corresponding set of equations reads:
†B S D (5.4)
SNR measurement (in vivo)
Resolution b-values [s/mm2] Flip angle [deg] # directions NSA
SE 2.8x2.8x16mm3 50,100,200,300,45
0
90 6 4
STEAM 2.8x2.8x16mm3 50,100,200,300,45
0
90 6 4
DTI measurement (in vivo)
Resolution b-values [s/mm2] Flip angle [deg] # directions NSA
SE 2.8x2.8x8mm3 100,450 90 12 16
STEAM 2.8x2.8x8mm3 100,450 90 12 8
Table 5.2 Imaging parameters of SNR and DTI in vivo experiments
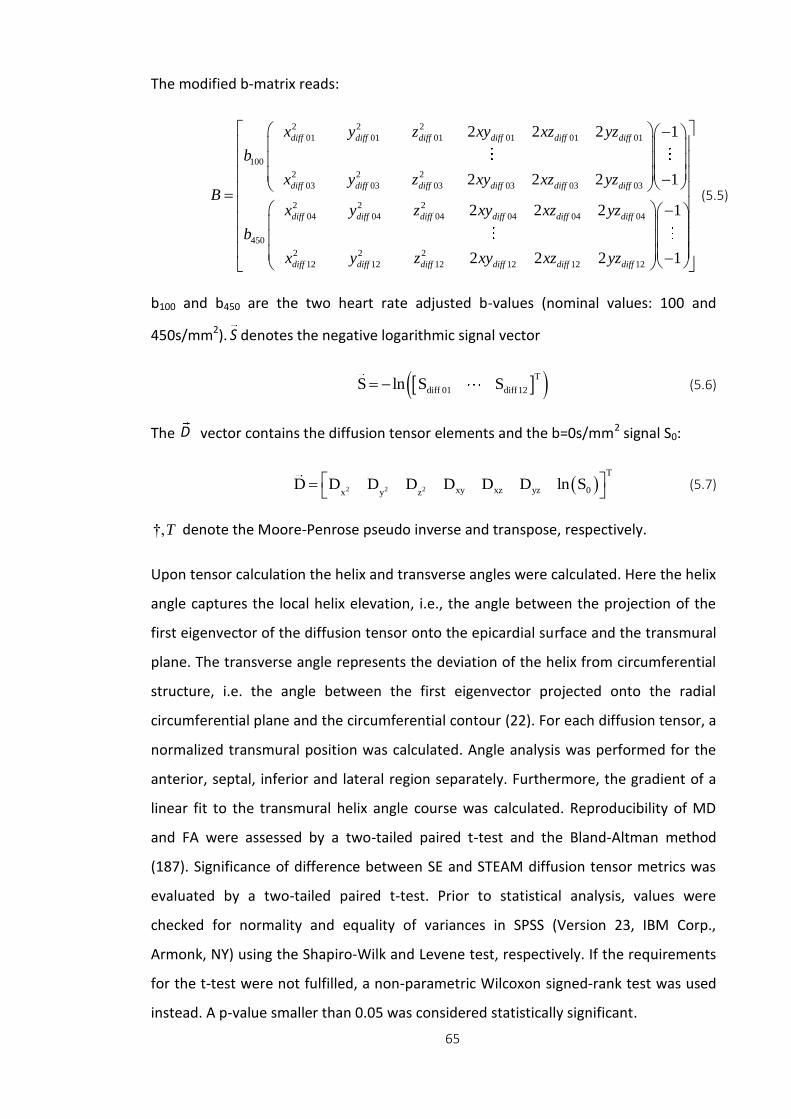
65
The modified b-matrix reads:
2 2 2
01 01 01 01 01 01
100
2 2 2
03 03 03 03 03 03
2 2 2
04 04 04 04 04 04
450
2
12
2 2 2 1
2 2 2 1
2 2 2
diff diff diff diff diff diff
diff diff diff diff diff diff
diff diff diff diff diff diff
diff d
x y z xy xz yz
b
x y z xy xz yzB
x y z xy xz yz
b
x y
2 2
12 12 12 12 12
1
2 2 2 1iff diff diff diff diffz xy xz yz
(5.5)
b100 and b450 are the two heart rate adjusted b-values (nominal values: 100 and
450s/mm2). denotes the negative logarithmic signal vector
T
diff 01 diff12S ln S S (5.6)
The vector contains the diffusion tensor elements and the b=0s/mm2 signal S0:
2 2 2
T
xy xz yz 0x y zD D D D D D D ln S
(5.7)
†,T denote the Moore-Penrose pseudo inverse and transpose, respectively.
Upon tensor calculation the helix and transverse angles were calculated. Here the helix
angle captures the local helix elevation, i.e., the angle between the projection of the
first eigenvector of the diffusion tensor onto the epicardial surface and the transmural
plane. The transverse angle represents the deviation of the helix from circumferential
structure, i.e. the angle between the first eigenvector projected onto the radial
circumferential plane and the circumferential contour (22). For each diffusion tensor, a
normalized transmural position was calculated. Angle analysis was performed for the
anterior, septal, inferior and lateral region separately. Furthermore, the gradient of a
linear fit to the transmural helix angle course was calculated. Reproducibility of MD
and FA were assessed by a two-tailed paired t-test and the Bland-Altman method
(187). Significance of difference between SE and STEAM diffusion tensor metrics was
evaluated by a two-tailed paired t-test. Prior to statistical analysis, values were
checked for normality and equality of variances in SPSS (Version 23, IBM Corp.,
Armonk, NY) using the Shapiro-Wilk and Levene test, respectively. If the requirements
for the t-test were not fulfilled, a non-parametric Wilcoxon signed-rank test was used
instead. A p-value smaller than 0.05 was considered statistically significant.
S
D

66
5.3 Results
SNR Measurements
Figure 5.3 a) shows example in vivo images for the b = 100 and 450s/mm2 acquisitions
obtained by the SE and STEAM approach. The bright blood pool signal in the b =
100s/mm2 image of the SE measurements is dephased with increasing diffusion
weighting. No signal contributions from blood in the STEAM case are noticeable. SNR
efficiency maps of SE and STEAM for a single average obtained with a b-value of
450s/mm2 are compared in Figure 5.3 b).
Figure 5.3 In vivo data. a) Example dataset acquired at b=100s/mm2 and 450s/mm2. b)
Corresponding SNR efficiency maps for b=450s/mm2.
SNR efficiency ratios SNRt(SE/STEAM) per single average of the phantom and in vivo
data are plotted in Figure 5.4. The data of the isotropic agar phantom yielded a mean
ratio of 2.84±0.08, which agrees well with theory (theoretical SNRt(SE/STEAM)=3.07) as
shown in Figure 5.4 a). While SNRt(SE/STEAM) was independent of the b-value in the
isotropic phantom, a distinct decrease of SNRt(SE/STEAM) was measured in the
anisotropic diffusion phantom. Here the ratio of SNR efficiency for SE versus STEAM
was found to decrease from 2.75±0.05 to 2.20±0.13 when increasing the b-value from
50 to 450s/mm2. The mean SNR efficiencies for the phantom measurements are listed
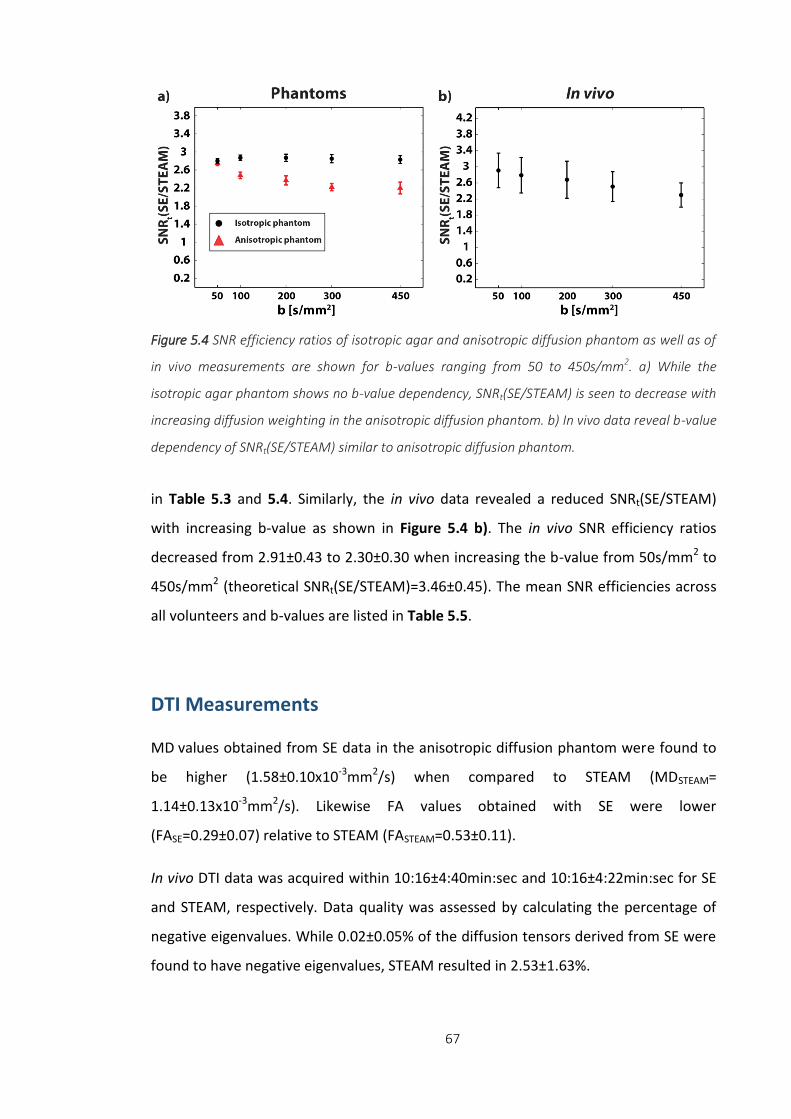
67
in Table 5.3 and 5.4. Similarly, the in vivo data revealed a reduced SNRt(SE/STEAM)
with increasing b-value as shown in Figure 5.4 b). The in vivo SNR efficiency ratios
decreased from 2.91±0.43 to 2.30±0.30 when increasing the b-value from 50s/mm2 to
450s/mm2 (theoretical SNRt(SE/STEAM)=3.46±0.45). The mean SNR efficiencies across
all volunteers and b-values are listed in Table 5.5.
DTI Measurements
MD values obtained from SE data in the anisotropic diffusion phantom were found to
be higher (1.58±0.10x10⁻³mm2/s) when compared to STEAM (MDSTEAM=
1.14±0.13x10⁻³mm2/s). Likewise FA values obtained with SE were lower
(FASE=0.29±0.07) relative to STEAM (FASTEAM=0.53±0.11).
In vivo DTI data was acquired within 10:16±4:40min:sec and 10:16±4:22min:sec for SE
and STEAM, respectively. Data quality was assessed by calculating the percentage of
negative eigenvalues. While 0.02±0.05% of the diffusion tensors derived from SE were
found to have negative eigenvalues, STEAM resulted in 2.53±1.63%.
Figure 5.4 SNR efficiency ratios of isotropic agar and anisotropic diffusion phantom as well as of
in vivo measurements are shown for b-values ranging from 50 to 450s/mm2. a) While the
isotropic agar phantom shows no b-value dependency, SNRt(SE/STEAM) is seen to decrease with
increasing diffusion weighting in the anisotropic diffusion phantom. b) In vivo data reveal b-value
dependency of SNRt(SE/STEAM) similar to anisotropic diffusion phantom.
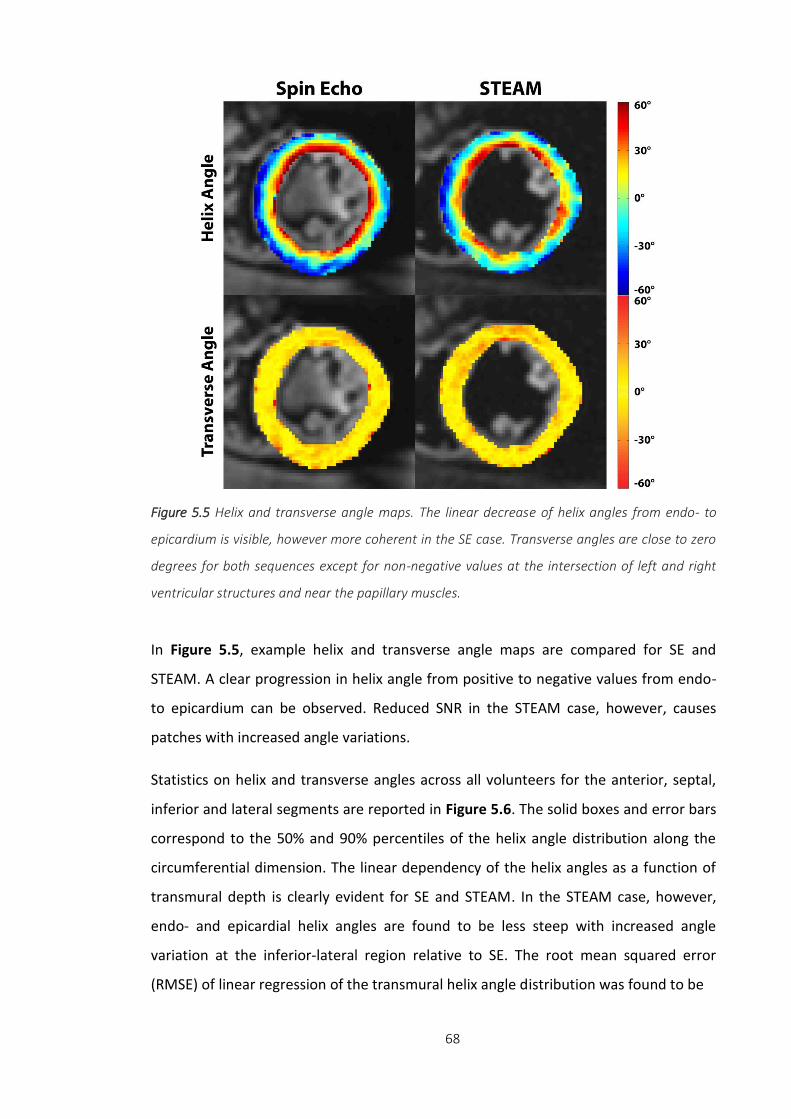
68
In Figure 5.5, example helix and transverse angle maps are compared for SE and
STEAM. A clear progression in helix angle from positive to negative values from endo-
to epicardium can be observed. Reduced SNR in the STEAM case, however, causes
patches with increased angle variations.
Statistics on helix and transverse angles across all volunteers for the anterior, septal,
inferior and lateral segments are reported in Figure 5.6. The solid boxes and error bars
correspond to the 50% and 90% percentiles of the helix angle distribution along the
circumferential dimension. The linear dependency of the helix angles as a function of
transmural depth is clearly evident for SE and STEAM. In the STEAM case, however,
endo- and epicardial helix angles are found to be less steep with increased angle
variation at the inferior-lateral region relative to SE. The root mean squared error
(RMSE) of linear regression of the transmural helix angle distribution was found to be
Figure 5.5 Helix and transverse angle maps. The linear decrease of helix angles from endo- to
epicardium is visible, however more coherent in the SE case. Transverse angles are close to zero
degrees for both sequences except for non-negative values at the intersection of left and right
ventricular structures and near the papillary muscles.
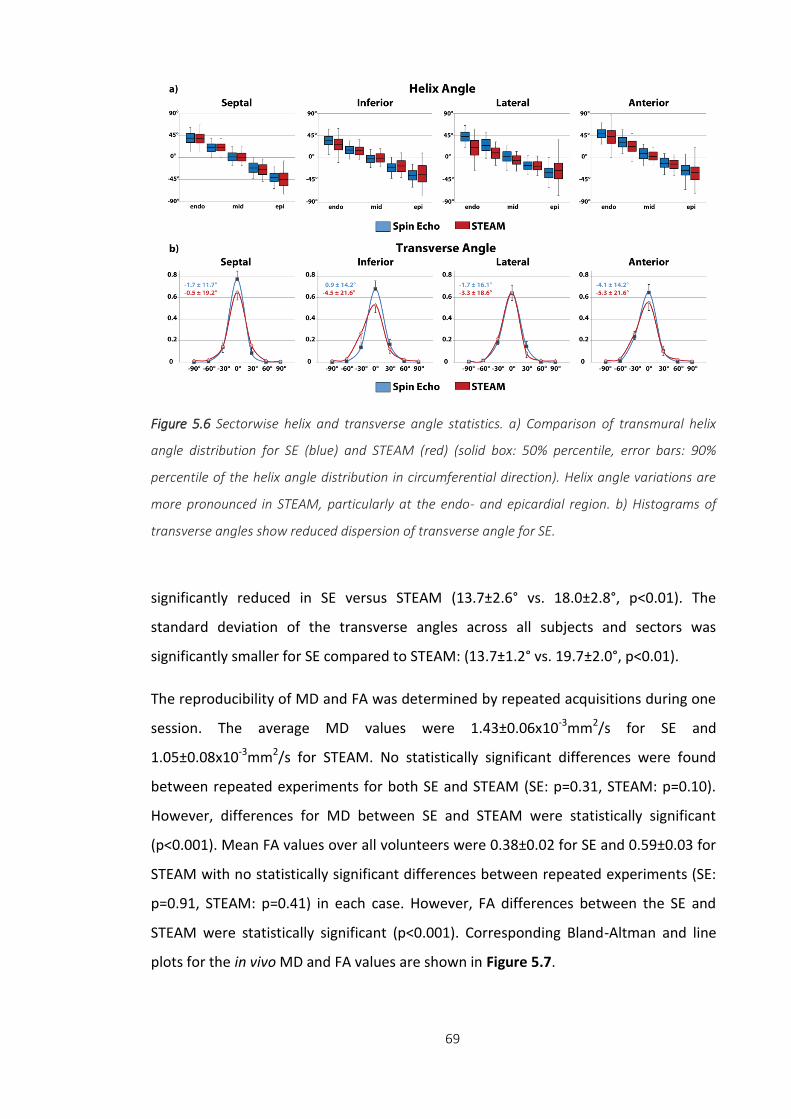
69
significantly reduced in SE versus STEAM (13.7±2.6° vs. 18.0±2.8°, p<0.01). The
standard deviation of the transverse angles across all subjects and sectors was
significantly smaller for SE compared to STEAM: (13.7±1.2° vs. 19.7±2.0°, p<0.01).
The reproducibility of MD and FA was determined by repeated acquisitions during one
session. The average MD values were 1.43±0.06x10⁻³mm2/s for SE and
1.05±0.08x10⁻³mm2/s for STEAM. No statistically significant differences were found
between repeated experiments for both SE and STEAM (SE: p=0.31, STEAM: p=0.10).
However, differences for MD between SE and STEAM were statistically significant
(p<0.001). Mean FA values over all volunteers were 0.38±0.02 for SE and 0.59±0.03 for
STEAM with no statistically significant differences between repeated experiments (SE:
p=0.91, STEAM: p=0.41) in each case. However, FA differences between the SE and
STEAM were statistically significant (p<0.001). Corresponding Bland-Altman and line
plots for the in vivo MD and FA values are shown in Figure 5.7.
Figure 5.6 Sectorwise helix and transverse angle statistics. a) Comparison of transmural helix
angle distribution for SE (blue) and STEAM (red) (solid box: 50% percentile, error bars: 90%
percentile of the helix angle distribution in circumferential direction). Helix angle variations are
more pronounced in STEAM, particularly at the endo- and epicardial region. b) Histograms of
transverse angles show reduced dispersion of transverse angle for SE.
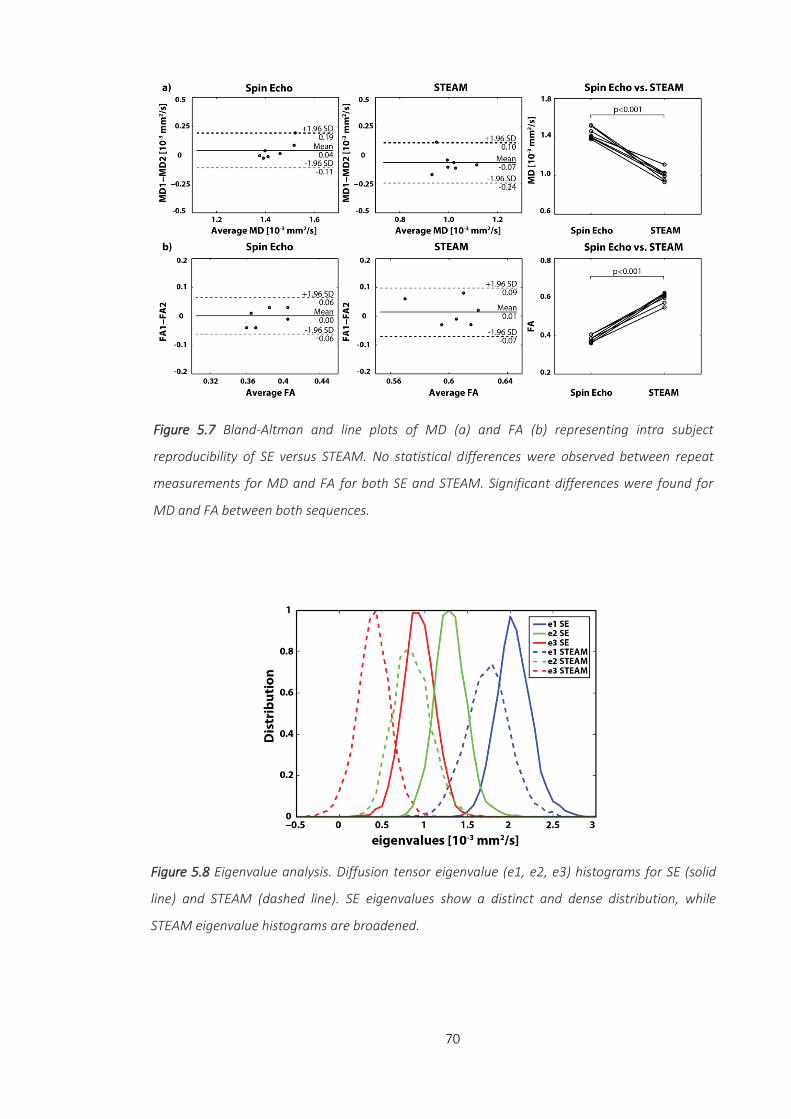
70
Figure 5.7 Bland-Altman and line plots of MD (a) and FA (b) representing intra subject
reproducibility of SE versus STEAM. No statistical differences were observed between repeat
measurements for MD and FA for both SE and STEAM. Significant differences were found for
MD and FA between both sequences.
Figure 5.8 Eigenvalue analysis. Diffusion tensor eigenvalue (e1, e2, e3) histograms for SE (solid
line) and STEAM (dashed line). SE eigenvalues show a distinct and dense distribution, while
STEAM eigenvalue histograms are broadened.

71
Figure 5.8 shows the distribution of the first, second and third eigenvalues (e1, e2, e3)
for SE and STEAM DTI data across all volunteers. The SE distributions show narrow,
almost equally high distinct peaks, whereas the eigenvalue spectrum in the STEAM
case is broadened. The small percentage of negative eigenvalues (e3) in the STEAM
case can be appreciated as well. Furthermore, the maximums of the SE eigenvalue
distributions are increased and less separate relative to STEAM, in agreement with the
results for MD and FA.
5.4 Discussion
In this study the relative SNR gain of cardiac-triggered, motion-compensated SE
diffusion tensor imaging with respect to STEAM has been demonstrated using both
phantom and in vivo data. The SNR gain was found to improve the accuracy of
diffusion metrics including helix and transverse angle maps.
At a b-value of 50s/mm2 the measured SNR efficiency gain of 2.84 of SE vs. STEAM
agreed well with theory in the phantoms. In vivo, the measured gain in SNR efficiency
at the lowest b-value was smaller compared to theory (2.91±0.21 (in vivo) vs.
3.46±0.45 (theory)). This is attributed in parts to slice profile imperfections of the
VERSE echo pulse (186) and partial volume effects through-slice in vivo. All SNR
measurements were obtained from a single signal average. Thereby confounding
factors due to image misregistration and phase correction for averaging of complex
data were avoided. To facilitate these measurements, the slice thickness was increased
to 16mm contributing to increased partial voluming.
While the ratio of SNR efficiency of SE vs. STEAM was found to be independent of the
b-value in the isotropic agar phantom, decreasing values were measured with
increasing b-value for both the anisotropic diffusion phantom and in the in vivo
myocardium. This result is explained by differences in diffusion times ΔT (ΔTSTEAM =
1000ms vs. ΔTSE = 25ms) (188,189). Assuming a mean diffusivity of 1.4x10⁻³mm2/s and
diffusion times of 25ms for SE and 1000ms for STEAM, the diffusion length is
approximately 15 and 90μm, respectively. In comparison, the thickness of cardiac
myocytes is in the range of approximately 10-20μm (44,60). Hence, diffusion becomes
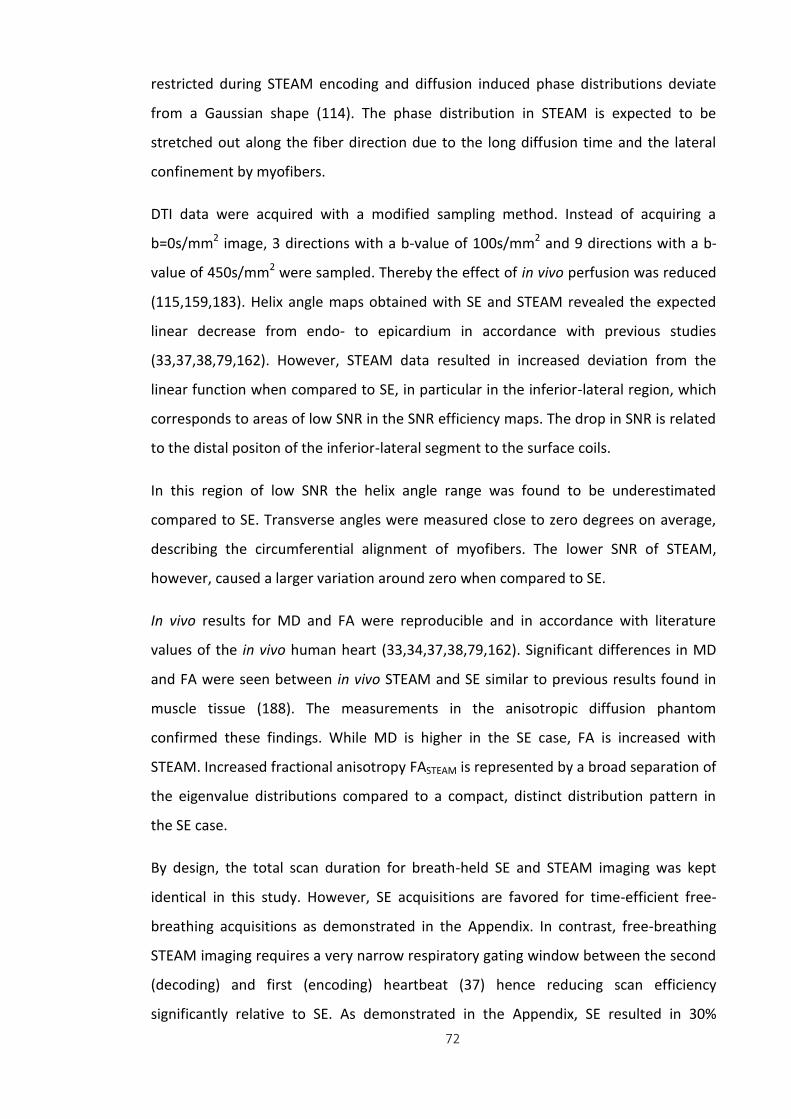
72
restricted during STEAM encoding and diffusion induced phase distributions deviate
from a Gaussian shape (114). The phase distribution in STEAM is expected to be
stretched out along the fiber direction due to the long diffusion time and the lateral
confinement by myofibers.
DTI data were acquired with a modified sampling method. Instead of acquiring a
b=0s/mm2 image, 3 directions with a b-value of 100s/mm2 and 9 directions with a b-
value of 450s/mm2 were sampled. Thereby the effect of in vivo perfusion was reduced
(115,159,183). Helix angle maps obtained with SE and STEAM revealed the expected
linear decrease from endo- to epicardium in accordance with previous studies
(33,37,38,79,162). However, STEAM data resulted in increased deviation from the
linear function when compared to SE, in particular in the inferior-lateral region, which
corresponds to areas of low SNR in the SNR efficiency maps. The drop in SNR is related
to the distal positon of the inferior-lateral segment to the surface coils.
In this region of low SNR the helix angle range was found to be underestimated
compared to SE. Transverse angles were measured close to zero degrees on average,
describing the circumferential alignment of myofibers. The lower SNR of STEAM,
however, caused a larger variation around zero when compared to SE.
In vivo results for MD and FA were reproducible and in accordance with literature
values of the in vivo human heart (33,34,37,38,79,162). Significant differences in MD
and FA were seen between in vivo STEAM and SE similar to previous results found in
muscle tissue (188). The measurements in the anisotropic diffusion phantom
confirmed these findings. While MD is higher in the SE case, FA is increased with
STEAM. Increased fractional anisotropy FASTEAM is represented by a broad separation of
the eigenvalue distributions compared to a compact, distinct distribution pattern in
the SE case.
By design, the total scan duration for breath-held SE and STEAM imaging was kept
identical in this study. However, SE acquisitions are favored for time-efficient free-
breathing acquisitions as demonstrated in the Appendix. In contrast, free-breathing
STEAM imaging requires a very narrow respiratory gating window between the second
(decoding) and first (encoding) heartbeat (37) hence reducing scan efficiency
significantly relative to SE. As demonstrated in the Appendix, SE resulted in 30%
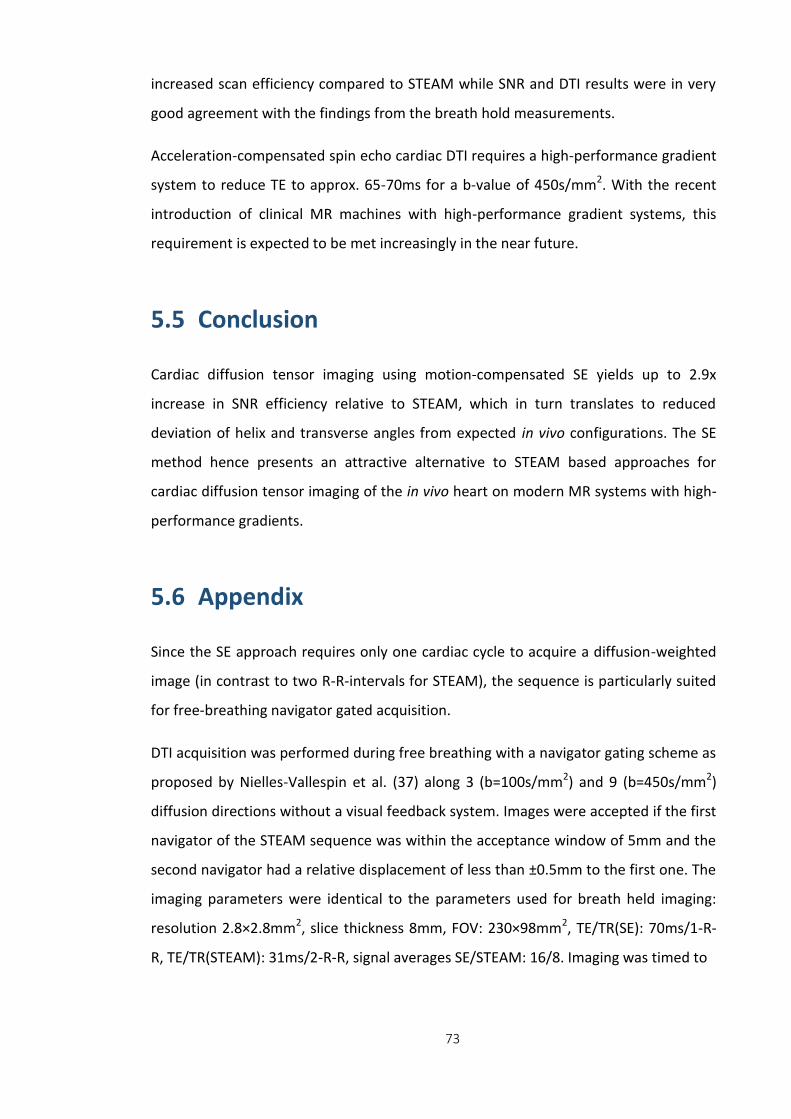
73
increased scan efficiency compared to STEAM while SNR and DTI results were in very
good agreement with the findings from the breath hold measurements.
Acceleration-compensated spin echo cardiac DTI requires a high-performance gradient
system to reduce TE to approx. 65-70ms for a b-value of 450s/mm2. With the recent
introduction of clinical MR machines with high-performance gradient systems, this
requirement is expected to be met increasingly in the near future.
5.5 Conclusion
Cardiac diffusion tensor imaging using motion-compensated SE yields up to 2.9x
increase in SNR efficiency relative to STEAM, which in turn translates to reduced
deviation of helix and transverse angles from expected in vivo configurations. The SE
method hence presents an attractive alternative to STEAM based approaches for
cardiac diffusion tensor imaging of the in vivo heart on modern MR systems with high-
performance gradients.
5.6 Appendix
Since the SE approach requires only one cardiac cycle to acquire a diffusion-weighted
image (in contrast to two R-R-intervals for STEAM), the sequence is particularly suited
for free-breathing navigator gated acquisition.
DTI acquisition was performed during free breathing with a navigator gating scheme as
proposed by Nielles-Vallespin et al. (37) along 3 (b=100s/mm2) and 9 (b=450s/mm2)
diffusion directions without a visual feedback system. Images were accepted if the first
navigator of the STEAM sequence was within the acceptance window of 5mm and the
second navigator had a relative displacement of less than ±0.5mm to the first one. The
imaging parameters were identical to the parameters used for breath held imaging:
resolution 2.8×2.8mm2, slice thickness 8mm, FOV: 230×98mm2, TE/TR(SE): 70ms/1-R-
R, TE/TR(STEAM): 31ms/2-R-R, signal averages SE/STEAM: 16/8. Imaging was timed to
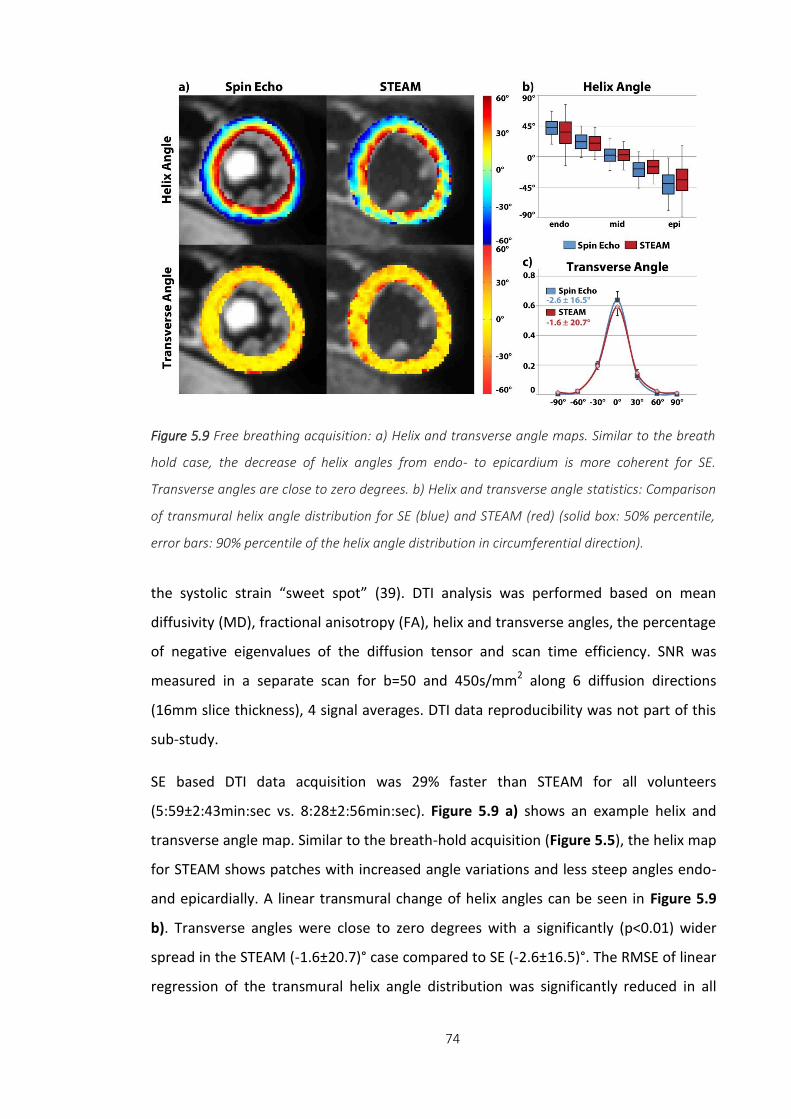
74
the systolic strain “sweet spot” (39). DTI analysis was performed based on mean
diffusivity (MD), fractional anisotropy (FA), helix and transverse angles, the percentage
of negative eigenvalues of the diffusion tensor and scan time efficiency. SNR was
measured in a separate scan for b=50 and 450s/mm2 along 6 diffusion directions
(16mm slice thickness), 4 signal averages. DTI data reproducibility was not part of this
sub-study.
SE based DTI data acquisition was 29% faster than STEAM for all volunteers
(5:59±2:43min:sec vs. 8:28±2:56min:sec). Figure 5.9 a) shows an example helix and
transverse angle map. Similar to the breath-hold acquisition (Figure 5.5), the helix map
for STEAM shows patches with increased angle variations and less steep angles endo-
and epicardially. A linear transmural change of helix angles can be seen in Figure 5.9
b). Transverse angles were close to zero degrees with a significantly (p<0.01) wider
spread in the STEAM (-1.6±20.7)° case compared to SE (-2.6±16.5)°. The RMSE of linear
regression of the transmural helix angle distribution was significantly reduced in all
Figure 5.9 Free breathing acquisition: a) Helix and transverse angle maps. Similar to the breath
hold case, the decrease of helix angles from endo- to epicardium is more coherent for SE.
Transverse angles are close to zero degrees. b) Helix and transverse angle statistics: Comparison
of transmural helix angle distribution for SE (blue) and STEAM (red) (solid box: 50% percentile,
error bars: 90% percentile of the helix angle distribution in circumferential direction).

75
cases for SE versus STEAM (15.9±3.7° vs. 19.8±4.2°, p<0.01). While 3.5±1.4% of the
diffusion tensors derived from STEAM had negative eigenvalues, no negative
eigenvalue was found in the SE case. FA values obtained with STEAM were significantly
higher relative to SE (0.60±0.03 vs. 0.37±0.03, p<0.001) while MD values were lower
for STEAM vs. SE (1.01±0.06x10⁻³mm2/s vs. 1.49±0.15x10⁻³mm2/s, p<0.02). Except for
MD, all diffusion metrics fulfilled the requirements for t-testing. MD and FA were in
accordance with breath hold and literature values (33,34,37,38,79,162). Similar to the
breath hold measurements, the in vivo data shows a SNRt(SE/STEAM) of 2.8±0.6 to
2.4±0.6 with increasing b-value from 50s/mm2 to 450s/mm2 (theoretical
SNRt(SE/STEAM)=3.4±0.5). In summary, free breathing DTI and SNR results are in very
good agreement with the results from breath hold acquisitions of this work and similar
to previous studies (37,38). In addition, scan time efficiency was significantly improved
for SE compared to STEAM. Hence, besides the SNR benefit, free breathing navigator
gating efficiency is increased when employing SE based DTI.
b [s/mm2] SNRt(SE) SNRt(STEAM) SNRt(SE/STEAM)
50 49.19±0.35 17.59±0.28 2.80±0.05
100 43.81±0.39 15.27±0.31 2.87±0.06
200 36.18±0.49 12.61±0.30 2.87±0.08
300 28.76±0.37 10.08±0.29 2.85±0.09
450 20.86±0.32 7.37±0.21 2.83±0.09
Table 5.3 Results of SNR efficiency of SE versus STEAM measured in isotropic agar phantom
for different b-values.
76
b [s/mm2] SNRt(SE) SNRt(STEAM) SNRt(SE/STEAM)
50 9.40±0.12 3.42±0.06 2.75±0.05
100 7.89±0.27 3.18±0.05 2.48±0.07
200 6.52±0.31 2.75±0.14 2.37±0.10
300 5.59±0.44 2.52±0.15 2.22±0.08
450 4.49±0.61 2.04±0.23 2.20±0.13
Table 5.4 Results of SNR efficiency measured in anisotropic diffusion phantom.
b [s/mm2] SNRt(SE) SNRt(STEAM) SNRt(SE/STEAM)
50 44.29±5.78 15.40±2.20 2.91±0.43
100 39.10±5.89 14.16±1.92 2.79±0.44
200 33.51±5.19 12.64±1.94 2.68±0.46
300 27.63±3.24 11.17±1.61 2.51±0.37
450 22.16±2.81 9.67±1.07 2.30±0.30
Table 5.5 Results of SNR efficiency of SE versus STEAM measured in vivo for different b-values.

77
Chapter 6 Studying Dynamic Myofibre Reorientation in Dilated Cardiomyopathy using In Vivo Magnetic Resonance
Diffusion Tensor Imaging‡
6.1 Introduction
Dilated cardiomyopathy (DCM) is a major cause of heart failure, morbidity and
mortality. Recent studies have reported that DCM is the third most common cause of
heart failure and the primary indication for heart transplantation (190–192). It is a
multifactorial disease encompassing hereditary and acquired forms (193). Though
heterogeneous in aetiology, histologically most cardiac findings are non-specific, with
hypertrophy and elongation of myocytes, reduced density of myofibrils, cellular
necrosis, and fibrosis (194).
Based on: Constantin von Deuster
†, Eva Sammut
†, Liya Asner, David Nordsletten, Pablo Lamata, Christian
T. Stoeck, Sebastian Kozerke, Reza Razavi,“Studying Dynamic Myofiber Aggregate Reorientationin Dilated
Cardiomyopathy Using In Vivo Magnetic Resonance Diffusion Tensor Imaging”, Circulation Cardiovascular
Imaging, in press
† equal contributors
‡ The biomechanical modelling was performed by Liya Asner and David Nordsletten.
78
The clinical course is variable however progressive and largely irreversible. Clinically,
the disease is characterised by advancing ventricular chamber enlargement and
systolic dysfunction with patients developing breathlessness and oedema due to fluid
retention and an increased risk of sudden cardiac death due to malignant arrhythmias
(195,196). Over time, the heart becomes unable to compensate for the loss of
contractile force and clinical manifestations become apparent (197).
Pathophysiologically there is myocyte dysfunction and disarray, and activation of
neurohormonal pathways to increase circulating blood volume resulting in a vicious
cycle, ultimately leading to adverse cardiac remodelling and end organ damage (198).
Despite developments in understanding and treatment approaches, the disease is not
yet fully characterised and prognosis remains poor.
In recent years, the field of cardiac Magnetic Resonance (MR) Diffusion Tensor Imaging
(DTI) has gained significant momentum. Quantitative information on the orientation of
myocardial fibre aggregates from ex vivo DTI has been shown to correlate well with
findings from histological studies (22,25,49,62,176). The integrity, mobility and
arrangement of the myocytes contribute significantly to efficient ventricular function
(76) and cardiac DTI has shown potential to gain novel insights into various cardiac
conditions (29,30,47,48,50,51,54,87,180). Using diffusion sensitizing MR sequences,
the displacement probability of diffusing water molecules within tissue of interest is
measured (96). The resulting image information may be modelled by a diffusion tensor
for each voxel. Based on the anisotropy of diffusion in tissue, the diffusion tensor can
be used to characterise microstructural properties. The primary principal eigenvector
of the diffusion tensor represents the mean myocyte direction and thus the
arrangement of myocyte aggregates can be reconstructed. Scalar metrics such as
mean diffusivity and fractional anisotropy allow characterisation of structural integrity
(32,51,54).
The majority of cardiac DTI work has been performed ex vivo (24,26,31,48–
51,54,55,66,67,176,199,200). In preclinical DCM models, alterations of the transmural
helix angle of fibre bundles (28) along with increased diffusivity and decreased
diffusion anisotropy have been described (27). One important shortcoming of ex vivo
data is the deviation of mechanical load and systemic blood pressure from in vivo
79
conditions. With advances in MR imaging methodology, in vivo cardiac DTI has been
shown to be feasible and robust in animal and human studies (23,32–
39,79,146,154,158,159). Moreover, the implementation of dual heart phase cardiac
DTI now also permits insights into dynamic changes of myocardial fibre aggregates
during the cardiac cycle confirming and complementing ex vivo studies in hearts
fixated in diastolic or systolic states (62,80). In vivo dual heart phase DTI has been
demonstrated both in healthy volunteers and patients with hypertrophic
cardiomyopathy (8,35,42).
In general, cardiac DTI is technically challenging due to cardiac and respiratory motion.
These issues are inherent to all cardiac imaging, however particularly critical in cardiac
diffusion imaging where bulk motion is two to three orders of magnitude larger
compared to displacements of diffusing water molecules. Hence, breathholding or
dedicated navigator gating schemes are necessary to suppress respiratory motion
induced signal loss (37). In addition, material strain due to cardiac contraction needs to
be accounted for to avoid systematic errors in the diffusion metrics (38,39,163).
The objective of the present work was to study dynamic alterations of myocardial
microstructure and strain in DCM patients using dual heart phase cardiac DTI and 3D
MR tagging and compare the findings relative to data from age-matched healthy
controls. Using biomechanical modelling, mechanistic insights into the underlying
processes pertaining to differences in fibre reorientation during cardiac contraction in
DCM patients versus controls are provided.
6.2 Methods
Study Protocol
Patients with non-ischaemic dilated cardiomyopathy were enrolled at St Thomas’
Hospital, Kings College London. Criteria for DCM was left ventricular ejection fraction
(LVEF) below 50%, no myocardial scar on previous cardiac MR, and a previous invasive
coronary angiogram confirming unobstructed epicardial coronary arteries. Age-
matched healthy volunteers without a history of cardiac events were enrolled as
80
control group at the University Hospital Zurich. Imaging was performed on 1.5T Philips
Achieva systems (Philips Healthcare, Best, The Netherlands) equipped with 32-channel
cardiac receiver arrays at both sites. Written informed consent was obtained from all
subjects prior to imaging, and the study protocol was approved by the ethics
committees of Kings College London and the Canton of Zurich. Obtained informed
consent included imaging as well as publication of anonymized data.
Prior to diffusion imaging, balanced steady state free precession (bSSFP) cine data
(spatial resolution 2x2x15mm3, temporal resolution 10ms) were acquired in two-
chamber and short-axis view of the left ventricle (LV). On cine images, subject-specific
mid-diastolic and peak-systolic time points were visually determined. To assess cardiac
function, a contiguous stack of short-axis bSSFP cine images from apex to base was
acquired during multiple breath holds (spatial resolutions 1.6x1.6x8mm3, temporal
resolution 30ms).
Diffusion Tensor Imaging
Diffusion-weighted imaging was performed in short-axis view orientation with a
reduced field-of-view (FOV) technique (201) using stimulated echo acquisition mode
(STEAM) imaging with single-shot echo planar image (EPI) readout (20). Since the
diffusion-weighted imaging sequence spans over two consecutive heart beats, spatial
position and diffusion encoding time are required to be identical in consecutive cycles.
Therefore the imaging plane was placed at mid-ventricular level and the acquisition
was ECG triggered to peak systole and mid diastole. Consistent levels of breath holding
were ensured by respiratory navigator gating (gating window 5mm). Eight signal
averages for each diffusion encoding direction were acquired within a single breath
hold. A total of ten optimized diffusion directions were encoded (97) with a b-value of
350s/mm2, resulting in 22 breath holds for two cardiac phases. Sufficient time to
recover between the breath holds was allowed to avoid significant heart rate
variations during data collection. To reduce echo time, crusher gradients necessary in
STEAM were removed from the diffusion-weighted acquisitions, but kept for the
“b=0s/mm2” imaging. Parameters of the diffusion sequence were: field-of-view:
309×129mm2, in-plane resolution: 2.5×2.5mm2, slice thickness: 8mm, TE/TR 18ms/2 R-
R intervals, partial Fourier factor 0.65.

81
Motion Imaging
Tissue motion and strain was quantified using three-dimensional complementary
spatial modulation of magnetization (CSPAMM) tagged imaging, employing a
segmented echo planar imaging readout (202). Three orthogonally oriented line
tagged cine image volumes were acquired sequentially, covering the whole LV. Data
acquisition was navigator gated (acceptance window 15mm) within three consecutive
breath holds, each spanning over 18 heartbeats. Imaging parameters were as follows:
field-of-view: 108x108x108mm3, spatial resolution: 3.5x7.7x7.7mm3, tag line distance:
7mm (EPI factor 7, 3 excitations per heart phase), temporal resolution: 20ms.
Geometrical stack alignment of all tagged volume images was performed by
incorporating navigator offsets and rigid image registration.
Data Analysis
Functional Analysis
Left and right ventricular volumes and ejection fractions, and left ventricular mass
were calculated by manually drawing end-diastolic and end-systolic contours on short-
axis images (excluding the papillary muscles) using commercially available software
(CVI software, Circle Cardiovascular Imaging Inc., Canada). Left ventricular (LV) wall
thickness was measured at end diastole and end systole in the mid LV, defined at the
level of the papillary muscles.
Diffusion Tensor Analysis
In plane displacements of the diffusion-weighted images due to variations of breath
hold levels were corrected by affine image registration prior to tensor calculation
(147). Systolic and diastolic diffusion tensors were determined based on the Stejskal-
Tanner equation, taking additional diffusion weighting of the “b=0s/mm2” image
acquisition due to crushers gradients into account. Systolic diffusion tensors were
corrected for myocardial strain as previously reported (38,163). Upon tensor
calculation, helix, transverse and sheet angles were computed. The helix angle α
reflects the local helix elevation, i.e. the angle between the projection of the first
eigenvector of the diffusion tensor onto the epicardial surface and the transmural
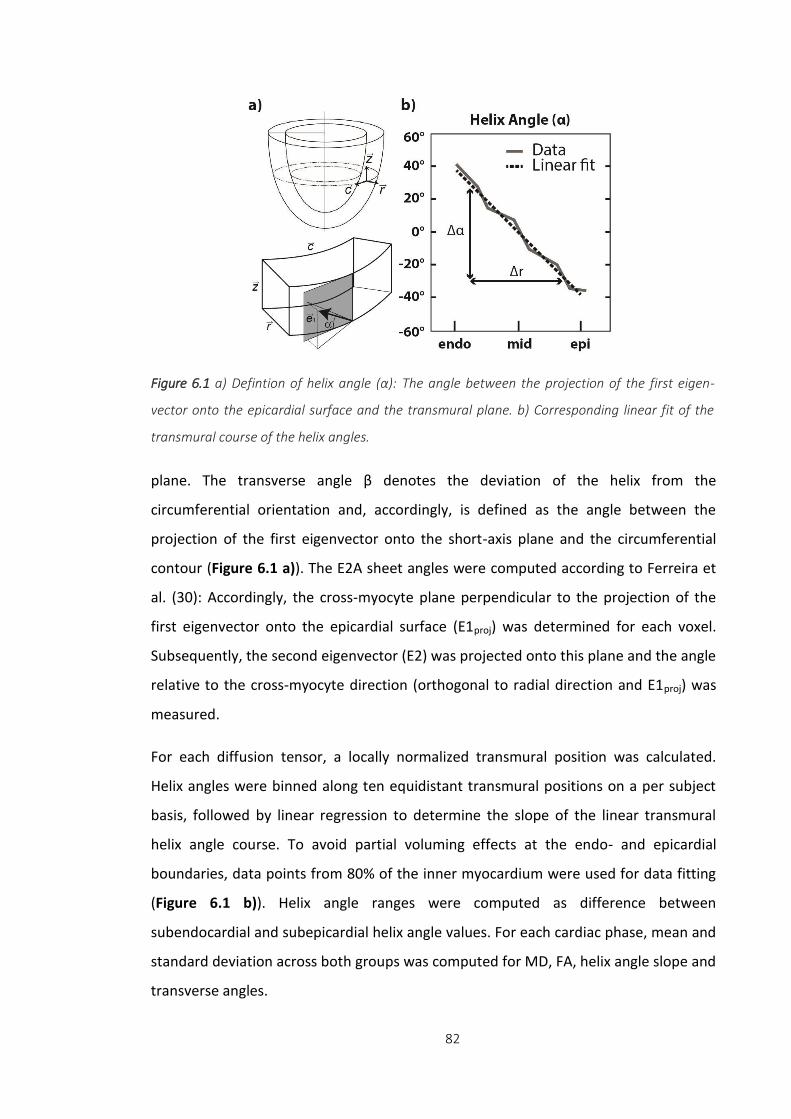
82
plane. The transverse angle β denotes the deviation of the helix from the
circumferential orientation and, accordingly, is defined as the angle between the
projection of the first eigenvector onto the short-axis plane and the circumferential
contour (Figure 6.1 a)). The E2A sheet angles were computed according to Ferreira et
al. (30): Accordingly, the cross-myocyte plane perpendicular to the projection of the
first eigenvector onto the epicardial surface (E1proj) was determined for each voxel.
Subsequently, the second eigenvector (E2) was projected onto this plane and the angle
relative to the cross-myocyte direction (orthogonal to radial direction and E1proj) was
measured.
For each diffusion tensor, a locally normalized transmural position was calculated.
Helix angles were binned along ten equidistant transmural positions on a per subject
basis, followed by linear regression to determine the slope of the linear transmural
helix angle course. To avoid partial voluming effects at the endo- and epicardial
boundaries, data points from 80% of the inner myocardium were used for data fitting
(Figure 6.1 b)). Helix angle ranges were computed as difference between
subendocardial and subepicardial helix angle values. For each cardiac phase, mean and
standard deviation across both groups was computed for MD, FA, helix angle slope and
transverse angles.
Figure 6.1 a) Defintion of helix angle (α): The angle between the projection of the first eigen-
vector onto the epicardial surface and the transmural plane. b) Corresponding linear fit of the
transmural course of the helix angles.
83
Motion and Strain Analysis
On the 3D tagging data, endo- and epicardial contours of the LV were manually defined
while excluding papillary muscles. Longitudinal, radial and circumferential strain were
determined by contour tracking utilising the SinMod algorithm (TagTrack, GyroTools
LLC, Zurich, Switzerland) (167). The time course of cardiac torsion was determined as
proposed previously (75). It is defined as the difference in rotation angle between an
apical and basal slice, normalized by their longitudinal distance. Circumferential and
radial strains are given in the mid ventricular region. Longitudinal strain was computed
across the whole LV. Additionally, 3D displacement fields were computed for diffusion
tensor strain correction at a spatial resolution of 0.9mm isotropically.
Statistical Analysis
Differences between diastolic/systolic parameters and DCM patients/controls were
determined by a Wilcoxon signed-rank and Wilcoxon rank-sum test, respectively. A p-
value smaller than 0.05 was considered statistically significant.
Biomechanical Modelling‡
Two idealised geometric models of the left ventricle truncated at the base were
created using the average measurements (end-diastolic long and short-axis lengths,
wall thicknesses and cavity volumes). The two models represent an average of the
control and DCM populations. Fibre distributions were chosen to match the average
end-diastolic helix angle slopes observed in the respective cohorts. Passive inflation
and active contraction of the ventricle were simulated using computational
biomechanical models (203–205). The impact of dilatation and increased sphericity on
the changes of helix angle slopes was explored and compared between the groups.
Additionally, strain and torsion were measured in both models with varying helix angle
slopes to investigate whether the changes in fibre orientation were in part responsible
for the differences seen in these parameters. More details on the modelling methods
are listed in the Appendix.
‡ The biomechanical modelling was performed by Liya Asner and David Nordsletten.
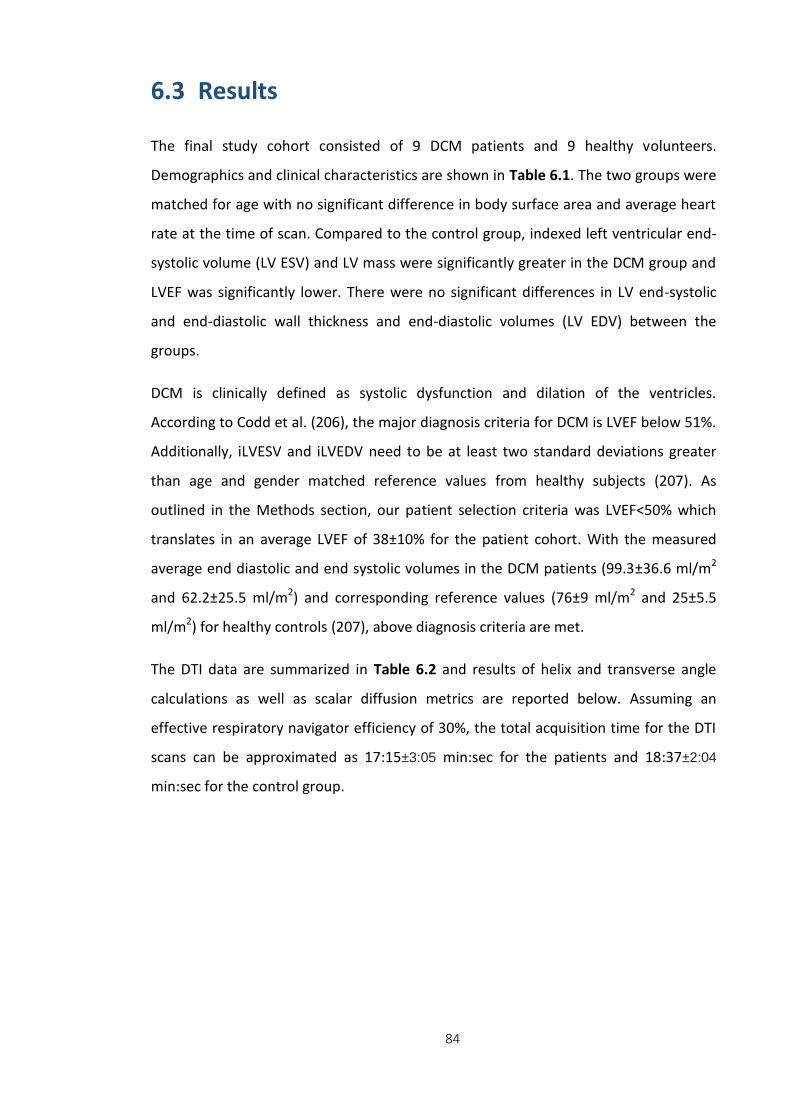
84
6.3 Results
The final study cohort consisted of 9 DCM patients and 9 healthy volunteers.
Demographics and clinical characteristics are shown in Table 6.1. The two groups were
matched for age with no significant difference in body surface area and average heart
rate at the time of scan. Compared to the control group, indexed left ventricular end-
systolic volume (LV ESV) and LV mass were significantly greater in the DCM group and
LVEF was significantly lower. There were no significant differences in LV end-systolic
and end-diastolic wall thickness and end-diastolic volumes (LV EDV) between the
groups.
DCM is clinically defined as systolic dysfunction and dilation of the ventricles.
According to Codd et al. (206), the major diagnosis criteria for DCM is LVEF below 51%.
Additionally, iLVESV and iLVEDV need to be at least two standard deviations greater
than age and gender matched reference values from healthy subjects (207). As
outlined in the Methods section, our patient selection criteria was LVEF<50% which
translates in an average LVEF of 38±10% for the patient cohort. With the measured
average end diastolic and end systolic volumes in the DCM patients (99.3±36.6 ml/m2
and 62.2±25.5 ml/m2) and corresponding reference values (76±9 ml/m2 and 25±5.5
ml/m2) for healthy controls (207), above diagnosis criteria are met.
The DTI data are summarized in Table 6.2 and results of helix and transverse angle
calculations as well as scalar diffusion metrics are reported below. Assuming an
effective respiratory navigator efficiency of 30%, the total acquisition time for the DTI
scans can be approximated as 17:15±3:05 min:sec for the patients and 18:37±2:04
min:sec for the control group.

85
DCM Control p (DCM vs Control)
Male/Total 7/9 7/9 -
Age (years) 61±12 50±6 0.52
Heart rate (beats/min) 68±12 63±7 0.38
BSA (m2) 1.8±0.2 1.8±0.2 0.75
iLV EDV (ml/m2) 99.3±36.6 80.0±11.9 0.48
iLV ESV (ml/m2) 62.2±25.5 31.2±5.1 <0.01*
LVEF (%) 38±10 60±4 <0.01*
iLV mass (g/m2) 75±15 55±12 <0.02*
iRV EDV (ml/m2) 75±28 78±16 0.40
iRV ESV (ml/m2) 37±13 31±6 0.40
RVEF (%) 54±9 60±4 0.063
LV dia. wall thickness (mm) 8.9±1.3 8.9±0.9 0.96
LV sys. wall thickness (mm) 10.4±1.7 12.7±2.4 0.054
* denotes significance
Table 6.1 Demographics and functional data from patient and control group. BSA: Body
Surface Area, iLV EDV/ESV: indexed Left Ventricular End Diastolic/Systolic Volume, EF: Ejection
Fraction, iRV EDV/ESV: indexed Right Ventricular End Diastolic/Systolic Volume. Reported
values are mean±standard deviation.
p
DCM Control DCM (dia vs sys)
Control (dia vs sys)
DCM vs Controls
Dia. HA slope (°/trans. depth) -1.15±0.35 -0.79±0.11 0.89 <0.01* <0.01*
Sys. HA slope (°/trans. depth) -1.15±0.34 -1.06±0.12 - - 0.90
Dia. HA range (°) 81±23 56±9 0.82 <0.01* <0.02*
Sys. HA range (°) 81±23 76±8 - - 0.97
Dia. TA (°) -1±26 -2±17 0.82 0.43 0.40
Sys. TA (°) 0±29 -1±26 - - 0.63
Dia. MD (x10-3
mm2/s) 1.20±0.17 1.10±0.10 0.43 0.50 0.23
Sys. MD (x10-3
mm2/s) 1.24±0.20 1.13±0.15 - - 0.27
Dia. FA 0.56±0.05 0.62±0.06 0.36 0.30 <0.04*
Sys. FA 0.58±0.05 0.59±0.04 - - 0.56
* denotes significance
Table 6.2 Diffusion tensor metrics from patient and control group. HA: Helix Angle, TA:
Transverse Angle, MD: Mean Diffusivity, FA: Fractional Anisotropy. Reported values are
mean±standard deviation.

86
Helix angles
Figure 6.2 shows example helix angle maps for a control subject and DCM patient in
diastole and systole. Histograms of transmural helix angle distributions for controls
and DCM patients are displayed in Figure 6.3. A change towards steeper helix angles
during contraction is seen in the control group, whereas reduced dynamic change
between diastole and systole is observed in the DCM patients. Bin counts of diastolic
helix angles close to zero degrees are reduced in DCM relative to healthy controls. The
corresponding transmural helix angle slopes derived from linear regression are shown
in Figure 6.4.
In diastole, the endo- and epicardial helix angles were higher in the DCM patients
compared to controls (40±11° and -41±13° versus 26±6° and -29±7°, respectively). As a
result, the diastolic helix angle slope was significantly steeper in the patients when
compared to controls (-1.15±0.35 versus -0.79±0.11, p<0.03) with a significantly higher
range of values from endo- to epicardium (81±23° versus 56±9°, p<0.02) in the DCM
patients compared to the controls in diastole.
Figure 6.2 Comparison of helix angle maps acquired in diastole and systole from control versus
DCM patient. A linear transition from positive to negative helix angles as a function of transmural
depth is seen. While endo- and epicardial helix angles become steeper during systole in the healthy
control, no explicit change between diastole and systole is found in the DCM case.

87
In systole, there was a significant increase in maximum endo- and epicardial helix angle
in the controls indicating a more longitudinal alignment of fibres with cardiac
contraction. This resulted in a significant increase in helix angle slope in the control
group from diastole to systole -0.79±0.11 to -1.06±0.12, p<0.01). In contrast, there was
no significant change in helix angle slope from diastole to systole in the DCM patients
(-1.15±0.35 to -1.15±0.34, p=0.89). The finding indicates that despite steeper endo-
and epicardial helix angles in diastole in the patients there was significantly less
longitudinal reorientation with cardiac contraction in the DCM patients than in healthy
controls.
Figure 6.3 Histograms of diastolic and systolic helix angles for controls (a) and DCM patients (b).
While a shift towards steeper helix angles is seen in the systolic healthy heart, systolic and diastolic
distributions are similar in the DCM case.
Figure 6.4 a) Comparison of transmural helix angle slopes in diastole versus systole for the
control and DCM groups. b) Diastolic and systolic helix angles for control and DCM modelling as
compared to the data.
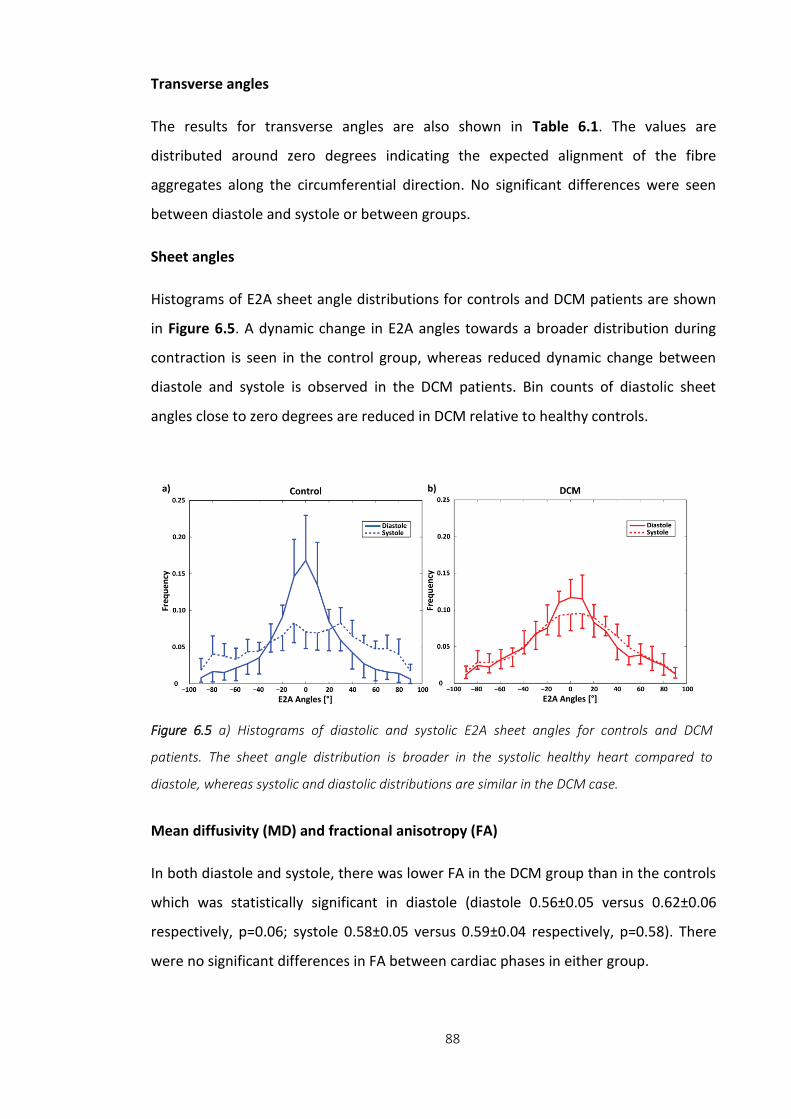
88
Transverse angles
The results for transverse angles are also shown in Table 6.1. The values are
distributed around zero degrees indicating the expected alignment of the fibre
aggregates along the circumferential direction. No significant differences were seen
between diastole and systole or between groups.
Sheet angles
Histograms of E2A sheet angle distributions for controls and DCM patients are shown
in Figure 6.5. A dynamic change in E2A angles towards a broader distribution during
contraction is seen in the control group, whereas reduced dynamic change between
diastole and systole is observed in the DCM patients. Bin counts of diastolic sheet
angles close to zero degrees are reduced in DCM relative to healthy controls.
Mean diffusivity (MD) and fractional anisotropy (FA)
In both diastole and systole, there was lower FA in the DCM group than in the controls
which was statistically significant in diastole (diastole 0.56±0.05 versus 0.62±0.06
respectively, p=0.06; systole 0.58±0.05 versus 0.59±0.04 respectively, p=0.58). There
were no significant differences in FA between cardiac phases in either group.
Figure 6.5 a) Histograms of diastolic and systolic E2A sheet angles for controls and DCM
patients. The sheet angle distribution is broader in the systolic healthy heart compared to
diastole, whereas systolic and diastolic distributions are similar in the DCM case.
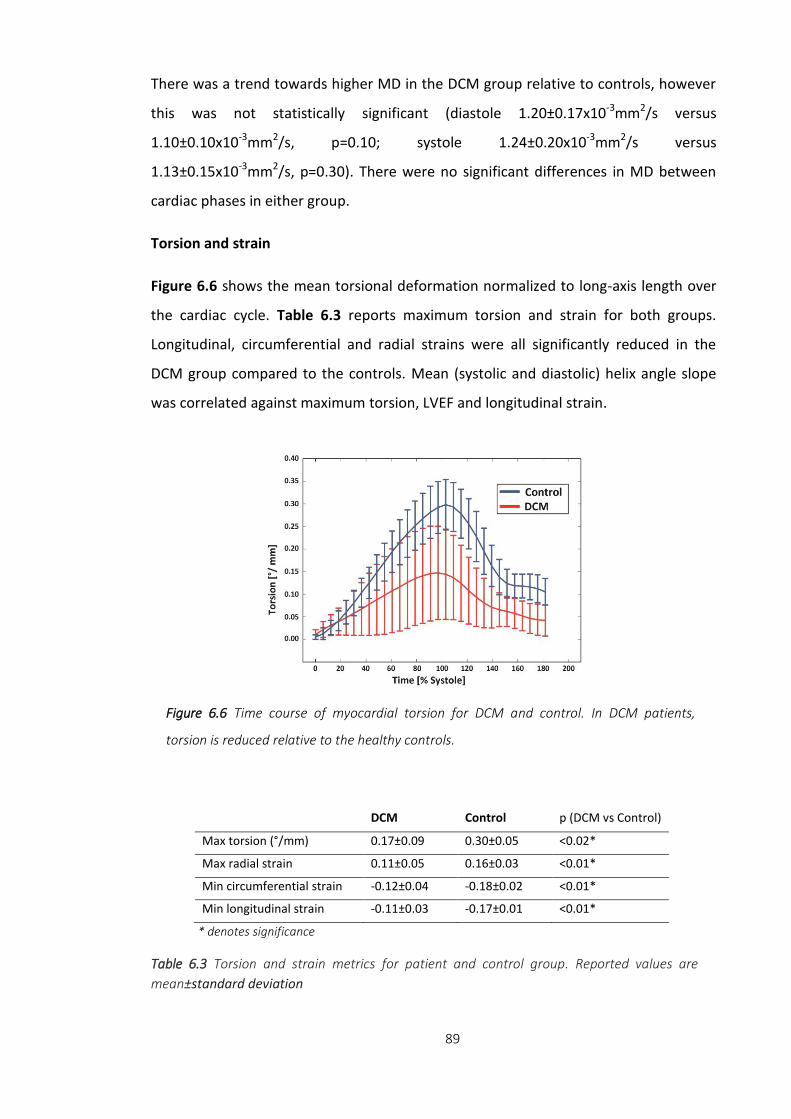
89
There was a trend towards higher MD in the DCM group relative to controls, however
this was not statistically significant (diastole 1.20±0.17x10⁻³mm2/s versus
1.10±0.10x10⁻³mm2/s, p=0.10; systole 1.24±0.20x10⁻³mm2/s versus
1.13±0.15x10⁻³mm2/s, p=0.30). There were no significant differences in MD between
cardiac phases in either group.
Torsion and strain
Figure 6.6 shows the mean torsional deformation normalized to long-axis length over
the cardiac cycle. Table 6.3 reports maximum torsion and strain for both groups.
Longitudinal, circumferential and radial strains were all significantly reduced in the
DCM group compared to the controls. Mean (systolic and diastolic) helix angle slope
was correlated against maximum torsion, LVEF and longitudinal strain.
Figure 6.6 Time course of myocardial torsion for DCM and control. In DCM patients,
torsion is reduced relative to the healthy controls.
DCM Control p (DCM vs Control)
Max torsion (°/mm) 0.17±0.09 0.30±0.05 <0.02*
Max radial strain 0.11±0.05 0.16±0.03 <0.01*
Min circumferential strain -0.12±0.04 -0.18±0.02 <0.01*
Min longitudinal strain -0.11±0.03 -0.17±0.01 <0.01*
* denotes significance
Table 6.3 Torsion and strain metrics for patient and control group. Reported values are
mean±standard deviation
90
The correlations were found to be limited in both groups and are shown in Figure 6.7.
In the DCM group, there was a trend towards reduced torsion and longitudinal strain
with increased helix angle slope compared to controls. LVEF was found to remain on
constant level of around 40% for helix angle slopes in the vicinity of 1.0°/% transmural
depth, however decreased to 15% with increased helix angle slope.
In the control group, values for peak torsion were spread by approximately 15%
around 0.30°/mm and the values for longitudinal strain were in the relatively small
range of 0.15 and 0.19 for the controls compared to 0.07 and 0.17 for the DCM
patients. Healthy LVEF values were densely distributed around 60±4%.
Biomechanical modelling‡
The active contraction phase was simulated for the healthy and the DCM models to
understand the differences in the helix angle changes between the end-diastolic and
end-systolic states. Both models were progressively activated at respective end-
systolic volumes, and the change in helix angle slopes at the endo- and epicardial
surfaces was recorded. Figure 6.4 b) shows the results for the two models. The
observation from the data that in controls the slope change is higher than in DCM
patients is supported by the model.
‡ The biomechanical modelling was performed by Liya Asner and David Nordsletten.
Figure 6.7 Peak torsion (a), left-ventricular ejection fraction (LVEF) (b) and longitudinal strain (c)
as a function of normalized helix angle (HA) slope. A trend towards lower torsion (a), LVEF (b)
and longitudinal strain (c) with increasing helix angle slope is seen in the DCM group.
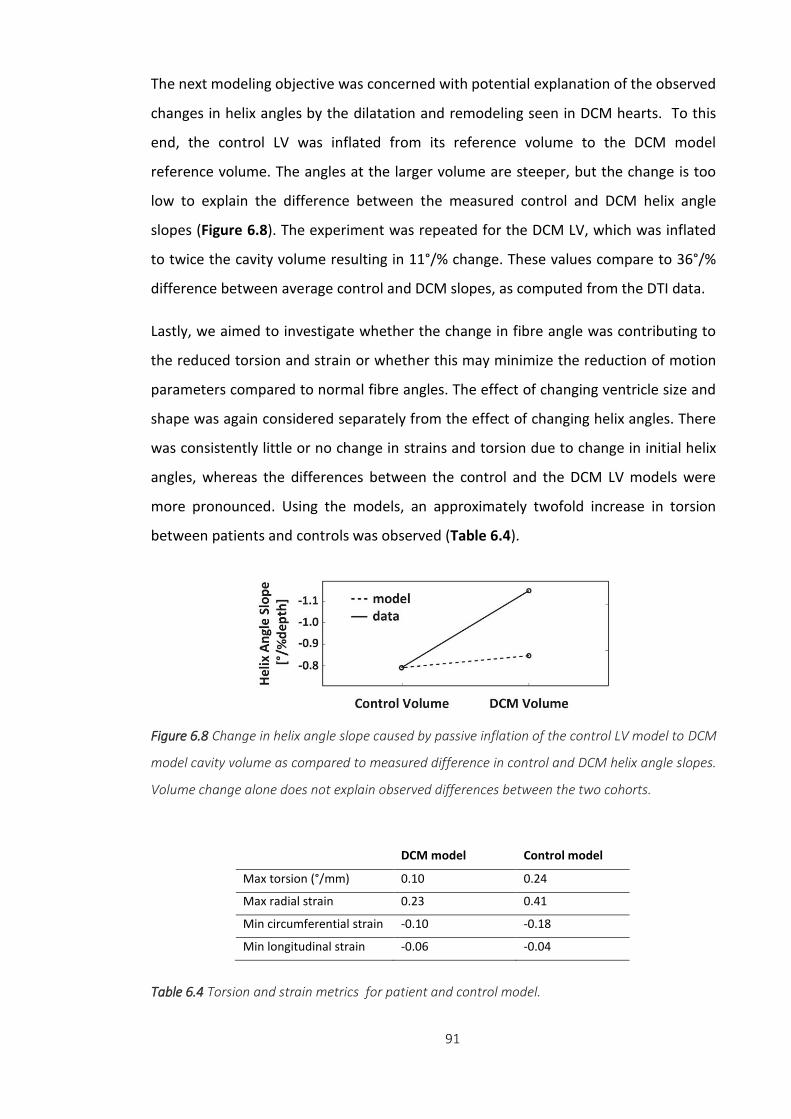
91
The next modeling objective was concerned with potential explanation of the observed
changes in helix angles by the dilatation and remodeling seen in DCM hearts. To this
end, the control LV was inflated from its reference volume to the DCM model
reference volume. The angles at the larger volume are steeper, but the change is too
low to explain the difference between the measured control and DCM helix angle
slopes (Figure 6.8). The experiment was repeated for the DCM LV, which was inflated
to twice the cavity volume resulting in 11°/% change. These values compare to 36°/%
difference between average control and DCM slopes, as computed from the DTI data.
Lastly, we aimed to investigate whether the change in fibre angle was contributing to
the reduced torsion and strain or whether this may minimize the reduction of motion
parameters compared to normal fibre angles. The effect of changing ventricle size and
shape was again considered separately from the effect of changing helix angles. There
was consistently little or no change in strains and torsion due to change in initial helix
angles, whereas the differences between the control and the DCM LV models were
more pronounced. Using the models, an approximately twofold increase in torsion
between patients and controls was observed (Table 6.4).
Figure 6.8 Change in helix angle slope caused by passive inflation of the control LV model to DCM
model cavity volume as compared to measured difference in control and DCM helix angle slopes.
Volume change alone does not explain observed differences between the two cohorts.
DCM model Control model
Max torsion (°/mm) 0.10 0.24
Max radial strain 0.23 0.41
Min circumferential strain -0.10 -0.18
Min longitudinal strain -0.06 -0.04
Table 6.4 Torsion and strain metrics for patient and control model.
92
6.4 Discussion
In this study, the dynamic change of myocardial fibre orientation in DCM patients and
healthy controls was investigated using in vivo dual-phase cardiac diffusion tensor
imaging. A statistically significant change of fibre orientation between diastole and
systole was found in the control group. The longitudinal fibre alignment during
contraction is assumed to optimize cardiac pumping efficiency and has been described
previously using in vivo and ex vivo DTI data and histology (38,46,79–81). In contrast to
healthy controls, the change in fibre and sheet angles from diastole to systole was
found to be far less pronounced in DCM patients and was not statistically different
between both heart phases. On average, diastolic fibre orientation with more
longitudinal orientation in DCM patients relative to healthy controls was observed.
Seven out of nine DCM patients showed comparable systolic helix angle configurations
relative to healthy controls. In the two remaining patients, however, clearly increased
helix angle slopes in both cardiac phases were measured. It is speculated, that this
elevated longitudinal fibre orientation could be the result of advanced remodelling as
these two patients were considerably older (76 and 77 years) when compared to the
mean age of the patient population (60±14 years). Accordingly, successive elongation
of myocytes and reduced contractility may have been present. Similar reorientation
was previously described by Tseng et al. (87) in hypertrophic hearts. However, more
recent data seems to not confirm this finding (30).
Myocardial strain and torsion obtained in the DCM patients revealed reduced
myocardial strain and impaired systolic torsion relative to controls. Our data on
maximum torsion in DCM patients and controls is in good agreement with literature
values (85). In general, cardiac pumping performance in the DCM patients was
significantly reduced compared to the controls as quantified by a number of
parameters: LVEF, maximum torsion, longitudinal, radial and circumferential strain.
Particularly low LVEF, torsion and strain values were found for the two patients with
elevated helix angle slopes.
As well as the clinical and gross structural changes seen in DCM, the results of fibre
reorientation must be considered alongside well-recognised subcellular changes such

93
as microarchitecture disarray. Histologically, heart failure is characterised by myocyte
elongation, reduced myocyte density and fibrosis and these changes have been
correlated with ex vivo DTI results in previous studies (17,27). Though histological
examination was not possible in our cohort of patients the trend towards an increase
in mean diffusivity and decrease in fractional anisotropy supports the presence of
reduced myofibril density and cellular necrosis where water is able to diffuse more
freely.
A feature of the present study was the ability to investigate the changes seen from the
MR data using biomechanical modelling. This was two fold – firstly to try to understand
whether the size and/or shape of the ventricle could be responsible for the altered
steepness of the fibres in diastole, and secondly to understand the implications of the
alterations in particular whether they appear to be beneficial or counter-productive to
efficient cardiac contraction.
Our initial tests showed that the dilatation of the heart is not sufficient to produce the
observed differences in fibre angle between the groups. We achieved more similar
results when using a dilated, more spherically-shaped heart.
We also sought to understand if the reorientation of the fibres may minimise or
exacerbate the reduction in strain and torsion seen in the remodelled ventricle. The
results show that the reduction in longitudinal strain and torsion appear to be
exacerbated by steeper fibre angles and that this is regardless of the LV model used
suggesting that this factor is independent of the changes to LV size and shape.
Accordingly, even in a dilated and remodelled heart the steeper angles are not
beneficial to maintaining longitudinal, radial or circumferential strain or torsion.
The underlying reasons for exacerbated deterioration in strain and torsion with these
fibres may reflect underlying subcellular changes that could not be examined in this
study. Efficient excitation-contraction (E-C) coupling relies on local control of calcium
ion release between voltage-gated channels found on T-tubules and receptors on the
sarcoplasmic reticulum (SR) on the myocytes. Normally, the T-tubule network is highly
organised in relation to the SR and this permits co-ordinated contraction for maximal
contractile force with least energy cost. A number of studies (208–210) have shown
that in ventricular tissue or individual myocytes in models of heart failure, there is
94
dilatation and decreased density of T-tubules with disorganisation of the T-tubule
network pattern. Reorientation of the cardiac fibres may be related to this
phenomenon and would need to be examined alongside future DTI work in this cohort
to fully appreciate the interplay between these aspects.
Interestingly we also show that there is little or poor correlation with any of the single
parameter tested against the change in helix angle slope in the subjects studied. This
suggests that a composite of factors such as dilatation, sphericity, poor systolic
function and the recognised other subcellular alterations seen in DCM may be
responsible for this structural rearrangement. Further studies would be needed to
confirm this and may be a future area of study.
In summary, we have been able to demonstrate that there are changes in the diastolic
orientation of cardiac fibres and, importantly, that there is reduced and inconsistent
dynamic reorientation of the fibres during cardiac contraction in DCM patients relative
to healthy hearts. We have been able to show that the remodelling of the heart
appears to be an important factor in the changes of fibre orientation but have also
demonstrated that the change in shape does not explain the difference seen in helix
angle slope between DCM patients and controls. We have also demonstrated that
steeper fibres are coupled with a worsening in the strain and torsion observed. Overall,
our findings provide new insights into the structural alterations within the living heart
in DCM and underline the importance of MR diffusion tensor imaging to gain deeper
understanding of cardiac disease.
Study Limitations
The DCM patient cohort in this study had a diagnosis of non-ischaemic cardiomyopathy
however the aetiology may be heterogeneous. Clinical, morphological and functional
data were variable and, accordingly, a large variation of helix angle distribution was
seen.
Because of scan time constraints, the imaging resolution of cardiac DTI was relatively
coarse (2.5x2.5x8mm3) and hence partial voluming effects were inherently present at
the endo- and epicardial borders. To reduce the impact of this, edge voxels were

95
excluded from the analysis. In line with the limited scan time available, only one slice
could be acquired using cardiac DTI.
6.5 Conclusion
Diffusion tensor imaging has revealed reduced and inconsistent dynamic reorientation
of fibres during cardiac contraction in DCM patients relative to healthy hearts.
Remodeling of the heart appears to be an important factor in the changes of fibre
orientations. Steeper fibres are coupled with a worsening in strain and torsion. Overall,
the findings provide new insights into the structural alterations in DCM patients.
6.6 Appendix‡
Overview of the biomechanical model
The biomechanical model is based on the classical continuum approach combined with
finite element discretisation. This supplement provides a brief overview of the
mathematical and computational model. Further particulars of the model and methods
used can be found in (204,211).
Let the reference configuration of the myocardium be denoted by Ω0 with the
coordinate X, and a deformed configuration at time t (0,T], T>0, be denoted by Ωt
with the coordinate x. At a given time t domain deformations can be defined as u = x -
X, while the hydrostatic pressure and the boundary tractions (described below) are
denoted by p and λ respectively. The principle of stationary potential energy (212)
states that at any time t this deformation can be found by minimising the total energy
of the system:
Π(u,p,λ) = infvsupq,μΠ(v,q,μ).
‡ The biomechanical modelling was performed by Liya Asner and David Nordsletten.
96
The total energy can be separated into internal and external energy terms:
Π = Πint(u,p) + Πext(u,p,λ).
We assume that myocardium can be modelled as a hyperelastic incompressible tissue,
so that the internal energy can be written in terms of the strain energy function Ψ, the
hydrostatic pressure p and the determinant of the deformation gradient J = det(F),
where F = Xu + I, and I is the identity matrix:
Πint = ∫Ω0Ψ + p(J − 1) dX.
The strain energy function incorporates orthotropic passive and active behaviour of
the tissue:
Ψ = Ψp + Ψa.
The model employs the Holzapfel-Ogden passive constitutive law (213), defined as
follows:
Ψp = a / (2b) exp[b(I1 − 3)] + ∑i=f,s ai / (2bi) (exp[bi(I4i − 1)2 ] − 1) + afs / (2bfs) exp[bfs I8fs2],
where a, b, af, bf, as, bs, afs, bfs represent material parameters (values given in Table S2
below), and I1, I4f, I4s, I8fs are the strain invariants associated with fibre and sheet
directions. Specifically, if at a given location in the reference domain the myocyte
aggregate (referred to as fibre in the model) and sheet orientation vectors are f0 and s0
respectively, and C = FT F is the right Cauchy-Green strain tensor, then
I1 = C : I, I4f = f0 · (C f0), I4s = s0 · (C s0), I8fs = f0 · (C s0).
Active response is produced with a simplified version of Kerchoffs-type length-
dependent constitutive laws (214,215) with reference myocyte compressive strain
l0=0.8, global active tension value AT, and added transverse activation at 30% of the
fibre activation as discussed in (205,216):
Ψa = AT ∫0I4f tanh(2(√ξ-l0)) dξ + 0.3 AT ∫0
(I1-I4f) tanh(2(√ξ-l0)) dξ.
The external energy Πext comes from any forces acting on the boundaries of the
domain. Ventricular cavity volume is set via an endocardial energy term

97
Πendo = λendo(V-Vdata),
where λendo is a scalar endocardial Lagrange multiplier representing cavity pressure, V
the cavity volume produced by the simulation, and Vdata the prescribed cavity volume.
The cavity volume can be approximated as follows (204):
V = - ∫Γendo 0.5 [(I - nb nb) x] · n dx,
where Γendo denotes the deformed configuration of the endocardial surface of the
ventricle, nb is the base normal vector and n the outward endocardial normal vector.
A simpified base condition allowing sliding in plane only was imposed due to the
generic nature of the model. The base plane was aligned with the z = 0 plane, and the
centre of the base coincided with the origin. The external energy term on the base
could be written as follows:
Πbase = ∫Γbase λbase (u· nb) dx + λ0,1 ∫Γbase u1 dx + λ0,2 ∫Γbase u2 dx + λ2 ∫Γbase u1· x2 dx ,
where Γbase denotes the deformed configuration of the base surface of the ventricle,
λbase is a spatially varying Lagrange multiplier enforcing no longitudinal motion of the
base plane, nb is the base normal vector, λ0,1 and λ0,2 are scalars ensuring no translation
of the base centre, and λ2 is a scalar enforcing no rotation around the axis.
With this definition of the energy terms, and combining all Lagrange multipliers in a
vector λ=(λendo,λbase,λ0,1,λ0,2,λ2), the full state of the system (u,p,λ) at a given time t is
found as the critical point of the total energy Π:
D(u,p,λ) Π(u,p,λ) = 0.
This equation provides the weak form of the problem, which can be solved numerically
using the finite element method. The reference domain is discretised into quadratic
hexahedral elements, with Q2-Q1 approximation for the displacement-pressure pair,
quadratic approximation on quadrilateral surface elements for λbase, and constant
approximations for λendo, λ0,1, λ0,2 and λ2. The resulting nonlinear system is solved via
Newton-Raphson iteration with line search, with linear solve steps carried out by direct
matrix inversion.
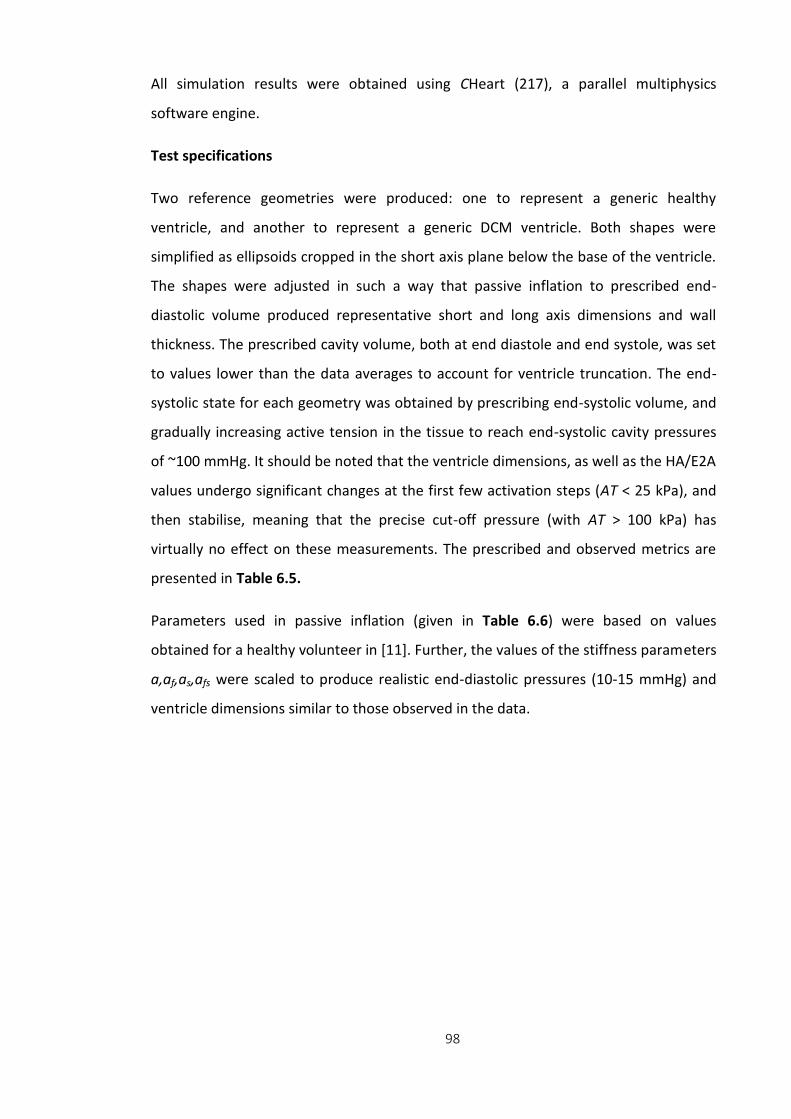
98
All simulation results were obtained using CHeart (217), a parallel multiphysics
software engine.
Test specifications
Two reference geometries were produced: one to represent a generic healthy
ventricle, and another to represent a generic DCM ventricle. Both shapes were
simplified as ellipsoids cropped in the short axis plane below the base of the ventricle.
The shapes were adjusted in such a way that passive inflation to prescribed end-
diastolic volume produced representative short and long axis dimensions and wall
thickness. The prescribed cavity volume, both at end diastole and end systole, was set
to values lower than the data averages to account for ventricle truncation. The end-
systolic state for each geometry was obtained by prescribing end-systolic volume, and
gradually increasing active tension in the tissue to reach end-systolic cavity pressures
of ~100 mmHg. It should be noted that the ventricle dimensions, as well as the HA/E2A
values undergo significant changes at the first few activation steps (AT < 25 kPa), and
then stabilise, meaning that the precise cut-off pressure (with AT > 100 kPa) has
virtually no effect on these measurements. The prescribed and observed metrics are
presented in Table 6.5.
Parameters used in passive inflation (given in Table 6.6) were based on values
obtained for a healthy volunteer in [11]. Further, the values of the stiffness parameters
a,af,as,afs were scaled to produce realistic end-diastolic pressures (10-15 mmHg) and
ventricle dimensions similar to those observed in the data.
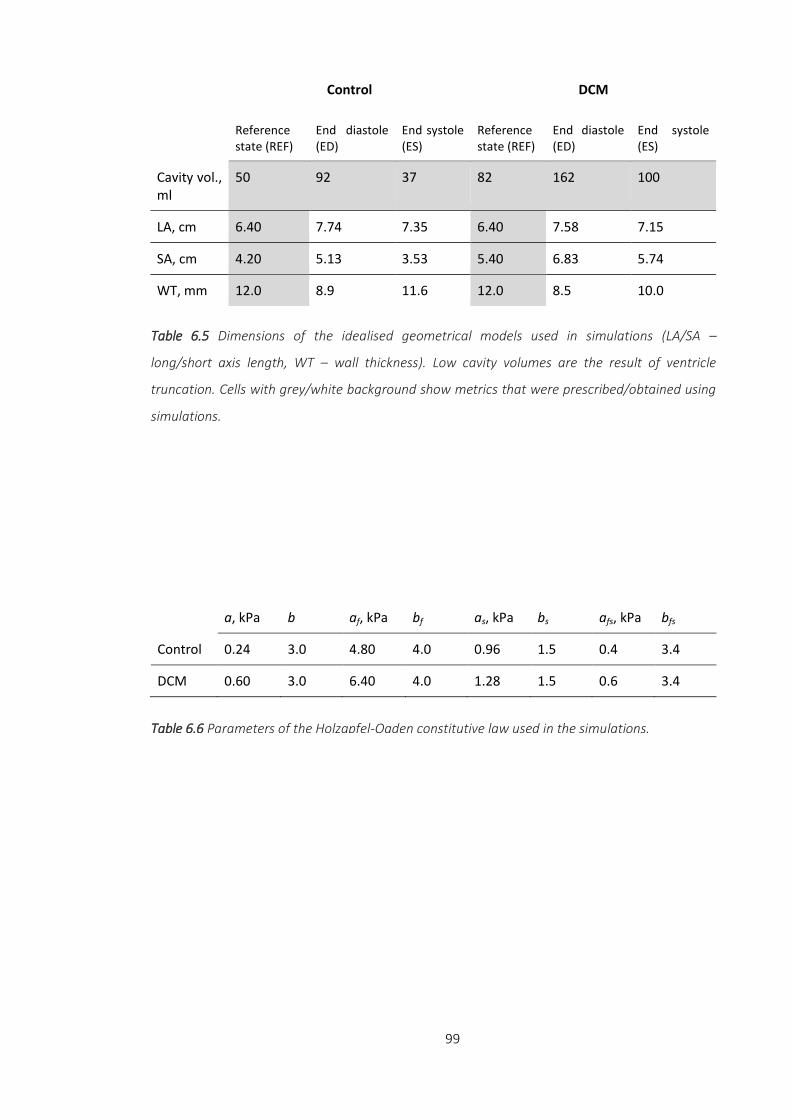
99
Control DCM
Reference state (REF)
End diastole (ED)
End systole (ES)
Reference state (REF)
End diastole (ED)
End systole (ES)
Cavity vol., ml
50 92 37 82 162 100
LA, cm 6.40 7.74 7.35 6.40 7.58 7.15
SA, cm 4.20 5.13 3.53 5.40 6.83 5.74
WT, mm 12.0 8.9 11.6 12.0 8.5 10.0
Table 6.5 Dimensions of the idealised geometrical models used in simulations (LA/SA –
long/short axis length, WT – wall thickness). Low cavity volumes are the result of ventricle
truncation. Cells with grey/white background show metrics that were prescribed/obtained using
simulations.
a, kPa b af, kPa bf as, kPa bs afs, kPa bfs
Control 0.24 3.0 4.80 4.0 0.96 1.5 0.4 3.4
DCM 0.60 3.0 6.40 4.0 1.28 1.5 0.6 3.4
Table 6.6 Parameters of the Holzapfel-Ogden constitutive law used in the simulations.
100
Chapter 7 Simultaneous Multi-Slice Diffusion Tensor Imaging of
the In Vivo Human Heart
7.1 Introduction
Stimulated echo acquisition mode (STEAM) imaging has been established as primary
method for in vivo diffusion-weighted imaging of the beating heart (20,37–
39,79,87,158,162,163). The STEAM technique, however, suffers from inherently low
signal-to-noise ratio (SNR) due to the echo signal formation and the long mixing time
(~1R-R interval). Imaging at high field strengths (3T), parallel imaging methods and
multiple signal averaging have been used to address these limitations, but full 3D
coverage of the in vivo human heart still requires very long scan times. As the STEAM
sequence spans over two consecutive heart beats, breath holding or respiratory
navigator gated free breathing methods (37) are necessary, which hampers the
translation of the STEAM approach into a clinical setting (16,29,30,180).
Based on: Constantin von Deuster, Christian T. Stoeck, Daniel Giese, Jack Harmer, Rachel W. Chan,
David Atkinson, Sebastian Kozerke. “Concurrent dual-slice cardiac DTI of the in-vivo human heart”,
Proceedings of the 21st
Meeting of ISMRM, Salt-Lake City, USA, 2013
Constantin von Deuster, Christian T. Stoeck, Martin Buehrer, Jack Harmer, Rachel W. Chan, David
Atkinson, Sebastian Kozerke. “Free-breathing cardiac DTI with simultaneous multi-slice excitation”,
Proceedings of the 22nd
Meeting of ISMRM, Milan, Italy, 2014
101
An attractive approach to accelerate diffusion-weighted imaging in the heart is
simultaneous multi-slice (SMS) imaging. Multiple slices are acquired concurrently using
multi-band excitation in combination with dedicated image reconstruction methods.
Several approaches have been proposed for SMS imaging using Wideband (218,219),
Simultaneous Image Refocusing (SIR) (220,221) and Parallel Imaging (PI) (222–225)
reconstruction methods.
The Wideband technique can lead to severe voxel tilting artifacts and hence image
blurring, whereas the SIR method extends the readout duration, increasing echo
planar imaging (EPI) distortions and signal loss due to off-resonance effects and
prolonged echo time (TE), respectively. SMS imaging with parallel imaging acquisition
does not suffer from the aforementioned drawbacks. However, the final SNR depends
on the geometry-factor which is directly related to the coil configuration and the
undersampling factor and pattern (125). The conditioning of the reconstruction
process can be improved by inducing an inter-slice image shift along the phase
encoding direction using alternating RF pulses (222) or short blip gradients along the
slice selection direction during EPI image readout (225). This approach is termed
“Controlled Aliasing In Parallel Imaging Results In Higher Acceleration” (CAIPIRINHA)
(222).
The objective of the presented work is to accelerate STEAM based cardiac DTI by
concurrent dual-slice imaging and controlled aliasing in parallel imaging (222,225).
Magnitude images and diffusion metrics for dual-slice short-axis acquisitions are
presented and compared to sequential single-slice acquisitions.
7.2 Methods
Study Protocol
Cardiac STEAM diffusion-weighted imaging was implemented on a 1.5T Philips Achieva
System (Philips Healthcare, Best, The Netherlands) equipped with a 32-channel cardiac
receiver array. Prior to diffusion imaging, cine data with a temporal resolution of 10ms
were acquired in two-chamber and short-axis view orientations. Systolic quiescent
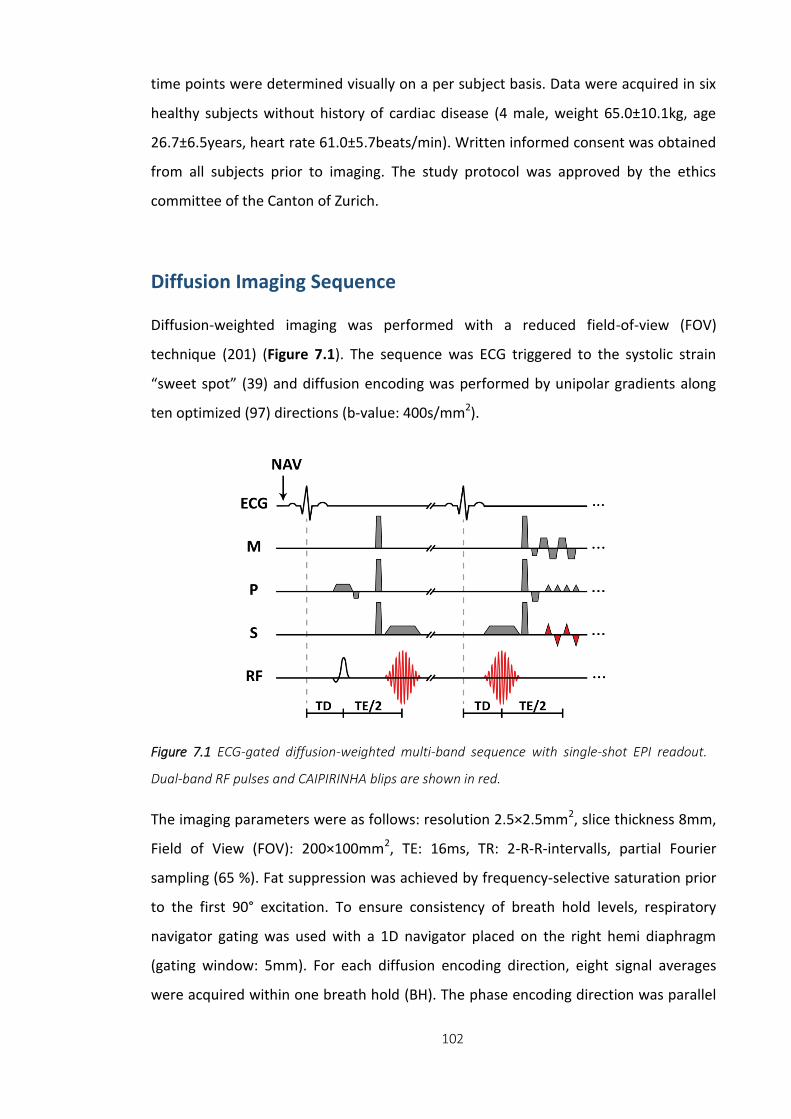
102
time points were determined visually on a per subject basis. Data were acquired in six
healthy subjects without history of cardiac disease (4 male, weight 65.0±10.1kg, age
26.7±6.5years, heart rate 61.0±5.7beats/min). Written informed consent was obtained
from all subjects prior to imaging. The study protocol was approved by the ethics
committee of the Canton of Zurich.
Diffusion Imaging Sequence
Diffusion-weighted imaging was performed with a reduced field-of-view (FOV)
technique (201) (Figure 7.1). The sequence was ECG triggered to the systolic strain
“sweet spot” (39) and diffusion encoding was performed by unipolar gradients along
ten optimized (97) directions (b-value: 400s/mm2).
The imaging parameters were as follows: resolution 2.5×2.5mm2, slice thickness 8mm,
Field of View (FOV): 200×100mm2, TE: 16ms, TR: 2-R-R-intervalls, partial Fourier
sampling (65 %). Fat suppression was achieved by frequency-selective saturation prior
to the first 90° excitation. To ensure consistency of breath hold levels, respiratory
navigator gating was used with a 1D navigator placed on the right hemi diaphragm
(gating window: 5mm). For each diffusion encoding direction, eight signal averages
were acquired within one breath hold (BH). The phase encoding direction was parallel
Figure 7.1 ECG-gated diffusion-weighted multi-band sequence with single-shot EPI readout.
Dual-band RF pulses and CAIPIRINHA blips are shown in red.

103
to the chest wall to avoid aliasing of the bright chest wall and the heart. Compared to
an anterior-posterior phase encoding direction, this orientation is also favorable with
respect to coil sensitivity variation facilitating the unfolding process.
The Shinnar-Le Roux algorithm (226) was used for RF-waveform realization, generating
two passbands corresponding to two slices with a slice thickness of 8mm and a
stopband corresponding to a slice gap of 26mm (passband ripple: 0.01, stopband
ripple: 0.01). The slice profile of the dual-band pulse was measured and compared to a
numerical Bloch simulation.
Controlled aliasing was performed by a half FOV shift of one of the two slices
(222,225). According to the Fourier shift theorem, a linear phase (m) m k y in k-
space corresponds to an offset y in image domain (y) :
/2
/2
exp(im k y)exp(im ky)N
m N
y y S m k
(7.1)
with 2 /k FOV as the k-space spacing between N equidistant k-space lines and
( )S k the complex k-space signal. For an image shift by half FOV along the phase
encoding direction, the linear phase ramp simplifies to: ( ) ,0, ,0,...m m i.e. an
alternating phase difference of and 0 between both slices. This additional phase was
generated for every second phase encoding line by alternating gradient blips along the
through-slice direction (Figure 7.1) as proposed by Setsompop et al. (225).
Upon completion of the multi-band imaging, the diffusion imaging protocol was
repeated as sequential single-slice acquisition for both slices during 22 breath holds.
The same respiratory navigator gating window was used for accelerated and non-
accelerated data acquisition to ensure geometric consistency among diffusion data
collection.

104
Image Reconstruction
As no in-plane undersampling was performed, two voxels originating from the two
slices fold onto each other forming an aliased image 𝐼𝑥 for coil x according to:
1 1,1 1,2
1
2
32 32,1 32,2
(x, y) (x, y y)(x, y)
(x, y y)(x, y) (x, y y)
I C CM
MI C C
(7.2)
where C denotes coil sensitivity and M the unaliased image voxels. The coil sensitivities
were determined by a separate b=0s/mm2 sensitivity scan during one additional
breath hold per slice. The imaging parameters were identical to the DTI scans, however
slice thickness was doubled to 16mm to increase SNR.
The reconstruction algorithm was implemented in Matlab (MathWorks, Natick, MA)
which solves eq. (7.2) in a least squares sense. The g-factor corresponding to the index
i of the folded pixel reads (125):
1[(C C) ] [(C C)]H H
ii ii iig (7.3)
It scales the SNR according to:
full
CAIPI
SNRSNR
g (7.4)
fullSNR refers to the SNR of a fully sampled sequential acquisition.
Data analysis
Consistent phase alternation of 0 and π between two consecutive k-space lines was
ensured by an off-centre dependent phase correction during image reconstruction.
Diffusion-weighted images were aligned to the b=0s/mm2 image using affine image
registration (elastix toolbox (147)). Diffusion tensors were calculated taking the
diffusion weighting of the crusher gradients of the “b=0s/mm2” image into account.
Thereupon helix angles (HA) and transverse angles (TA) were derived (22). The
gradient of a linear fit to the transmural HA course was calculated and compared
together with mean diffusivity (MD) and fractional anisotropy (FA) between multi-band
and sequential imaging. Diffusion tensor metrics were determined on the left ventricle
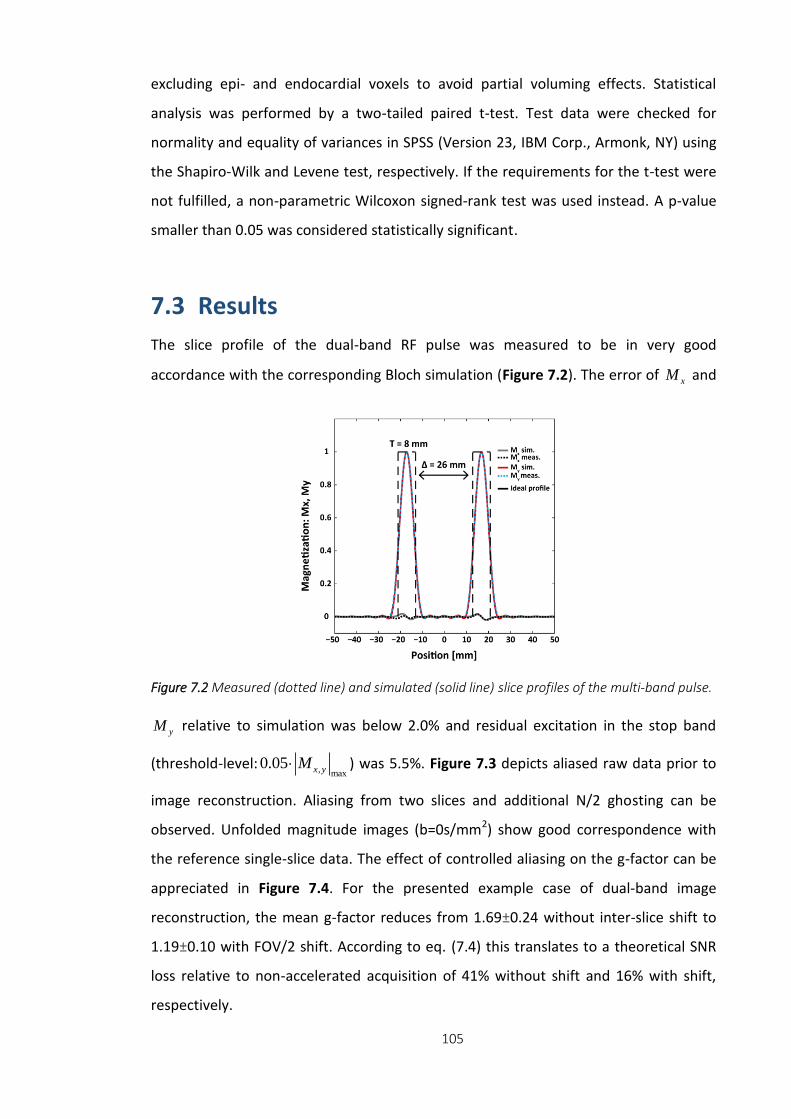
105
excluding epi- and endocardial voxels to avoid partial voluming effects. Statistical
analysis was performed by a two-tailed paired t-test. Test data were checked for
normality and equality of variances in SPSS (Version 23, IBM Corp., Armonk, NY) using
the Shapiro-Wilk and Levene test, respectively. If the requirements for the t-test were
not fulfilled, a non-parametric Wilcoxon signed-rank test was used instead. A p-value
smaller than 0.05 was considered statistically significant.
7.3 Results
The slice profile of the dual-band RF pulse was measured to be in very good
accordance with the corresponding Bloch simulation (Figure 7.2). The error of xM and
yM relative to simulation was below 2.0% and residual excitation in the stop band
(threshold-level: , max0.05 x yM ) was 5.5%. Figure 7.3 depicts aliased raw data prior to
image reconstruction. Aliasing from two slices and additional N/2 ghosting can be
observed. Unfolded magnitude images (b=0s/mm2) show good correspondence with
the reference single-slice data. The effect of controlled aliasing on the g-factor can be
appreciated in Figure 7.4. For the presented example case of dual-band image
reconstruction, the mean g-factor reduces from 1.69±0.24 without inter-slice shift to
1.19±0.10 with FOV/2 shift. According to eq. (7.4) this translates to a theoretical SNR
loss relative to non-accelerated acquisition of 41% without shift and 16% with shift,
respectively.
Figure 7.2 Measured (dotted line) and simulated (solid line) slice profiles of the multi-band pulse.

106
Figure 7.3 Left: Aliased raw data prior to image reconstruction. Right: Unfolded images show
good correspondence with reference data obtained by sequential single-slice imaging. BH: breath
hold.
Figure 7.4 g-factor maps for dual-band image reconstruction with and without FOV/2 shift. g-
factors are reduced when using controlled aliasing.

107
First eigenvectors of the diffusion tensors are shown in Figure 7.5 for SMS and
reference imaging: Accelerated and conventional data are in very good agreement
following the circumferential contour of the left ventricle. HAs are reported for four
transmural layers at septal, inferior, lateral and anterior region in Figure 7.6. A linear
transition of HA from endo- to epicardium can be seen for all cases in Figure 7.7. HAs
were found to be steeper at the midventricular level compared to the basal level.
Table 7.1 lists helix and transverse angles from SMS and sequential single-slice
imaging. Endo- and epicardial HA (HAendo, HAepi) and corresponding slopes were found
to be slightly reduced in the SMS case relative to reference data, however differences
were statistically not significant. Mean TA were close to zero degrees with comparable
standard deviations for both measurements. No statistically significant differences
were found for MD and FA in SMS and single-slice imaging. Except for TAstd (ref, midv.
slice) and FA (caipi, basal slice), all diffusion metrics fulfilled the requirements for t-
testing. Assuming an effective respiratory navigator efficiency of 30%, the total
acquisition time for the DTI scans is halved for the multiband approach compared to
the sequential single slice acquisition (19:14±1:44 min:sec vs. 9:37±0:52 min:sec).
Figure 7.5 Left: Slice locations in the left ventricle. Right: Diffusion tensor representation (1st
Eigenvector) of reconstructed CAIPI and reference DTI data. BH: breath hold.
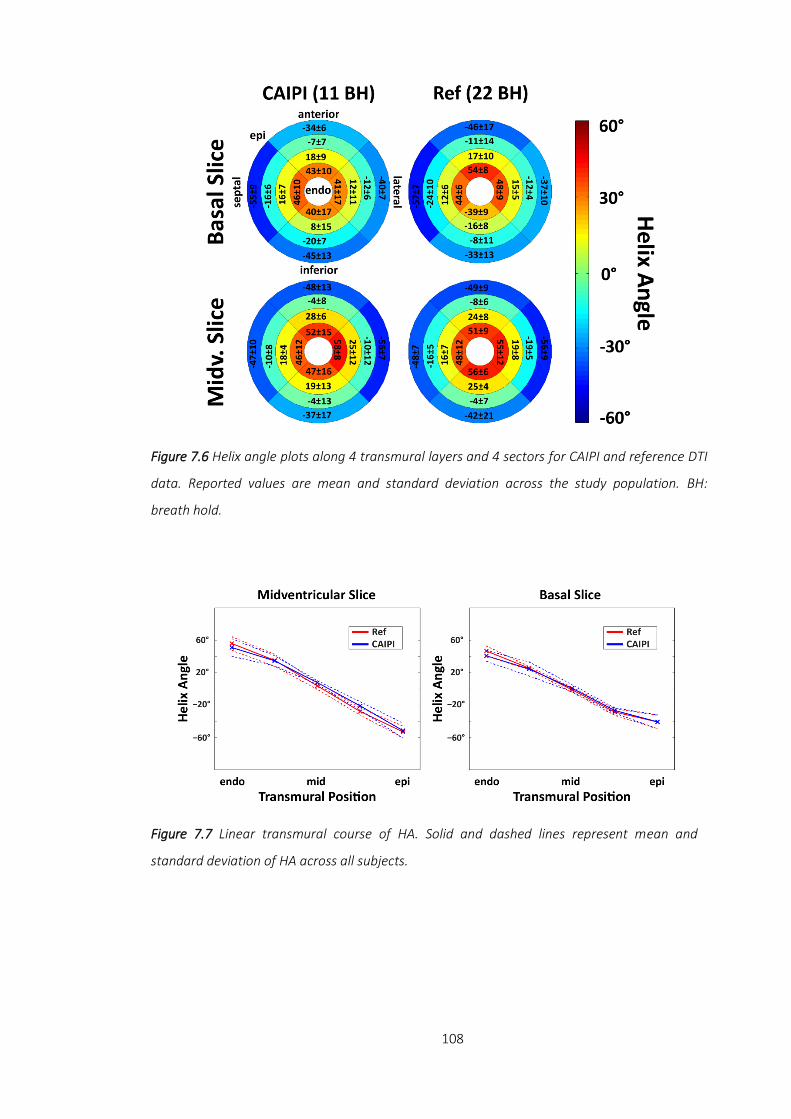
108
Figure 7.6 Helix angle plots along 4 transmural layers and 4 sectors for CAIPI and reference DTI
data. Reported values are mean and standard deviation across the study population. BH:
breath hold.
Figure 7.7 Linear transmural course of HA. Solid and dashed lines represent mean and
standard deviation of HA across all subjects.
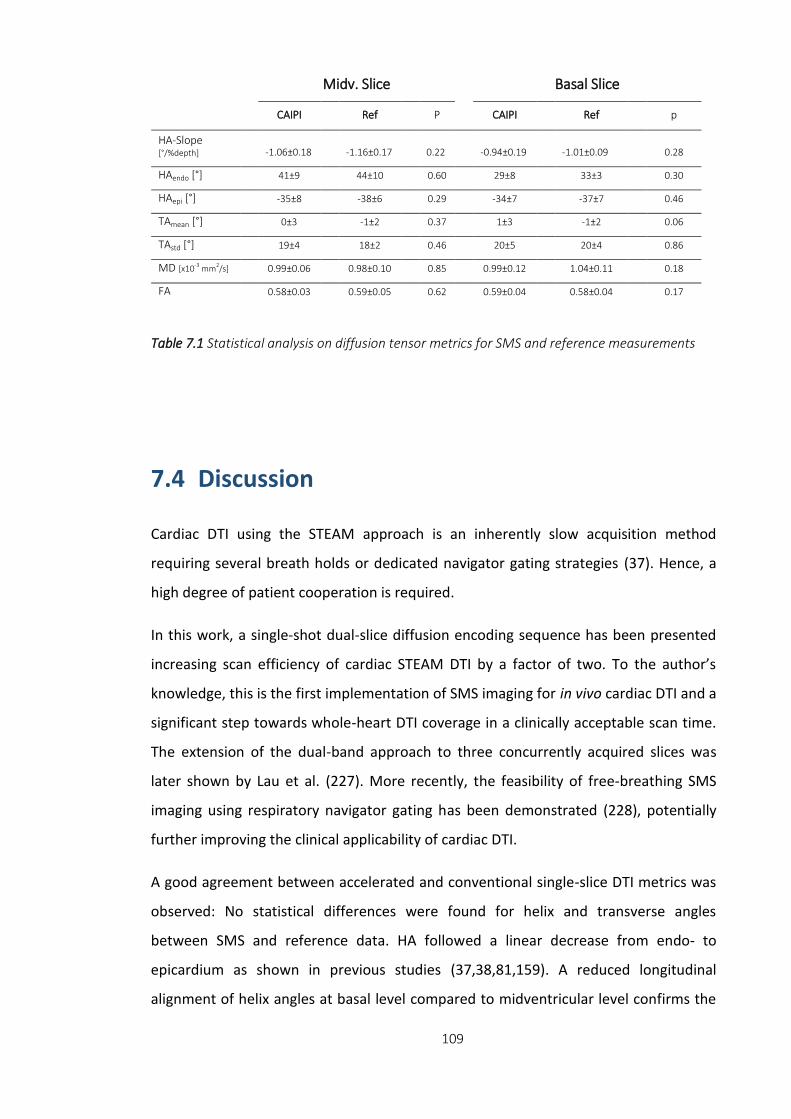
109
7.4 Discussion
Cardiac DTI using the STEAM approach is an inherently slow acquisition method
requiring several breath holds or dedicated navigator gating strategies (37). Hence, a
high degree of patient cooperation is required.
In this work, a single-shot dual-slice diffusion encoding sequence has been presented
increasing scan efficiency of cardiac STEAM DTI by a factor of two. To the author’s
knowledge, this is the first implementation of SMS imaging for in vivo cardiac DTI and a
significant step towards whole-heart DTI coverage in a clinically acceptable scan time.
The extension of the dual-band approach to three concurrently acquired slices was
later shown by Lau et al. (227). More recently, the feasibility of free-breathing SMS
imaging using respiratory navigator gating has been demonstrated (228), potentially
further improving the clinical applicability of cardiac DTI.
A good agreement between accelerated and conventional single-slice DTI metrics was
observed: No statistical differences were found for helix and transverse angles
between SMS and reference data. HA followed a linear decrease from endo- to
epicardium as shown in previous studies (37,38,81,159). A reduced longitudinal
alignment of helix angles at basal level compared to midventricular level confirms the
Midv. Slice Basal Slice
CAIPI Ref
P
CAIPI
Ref
p
HA-Slope [°/%depth] -1.06±0.18 -1.16±0.17 0.22 -0.94±0.19 -1.01±0.09 0.28
HAendo [°] 41±9
44±10 0.60
29±8 33±3
0.30
HAepi [°] -35±8
-38±6 0.29
-34±7 -37±7
0.46
TAmean [°] 0±3
-1±2 0.37
1±3 -1±2
0.06
TAstd [°] 19±4
18±2 0.46
20±5 20±4
0.86
MD [x10-3 mm2/s] 0.99±0.06
0.98±0.10 0.85
0.99±0.12 1.04±0.11
0.18
FA 0.58±0.03 0.59±0.05 0.62
0.59±0.04 0.58±0.04
0.17
Table 7.1 Statistical analysis on diffusion tensor metrics for SMS and reference measurements
110
results of Stoeck et al. (38). Transverse angles are close to zero degrees indicating a
coherent circumferential alignment of the myofibres. Differences of MD and FA
between accelerated and conventional imaging were not statistically significant.
Obtained results for MD and FA are in accordance with literature values of the in vivo
human heart (37,38,79,162).
The theoretical SNR loss of the reconstructed SMS images relative to conventional
imaging was found to be approximately 16% due to g-factor penalty. SNR efficiency
(i.e. SNR per unit time), however, increased by 2 1 41% yielding a net gain in SNR
efficiency of 19% relative to sequential single-slice imaging.
The 90° dual-band RF pulses in this study were designed utilising the Shinnar-Le Roux
algorithm (226). Due to B1 limitations, spin echo based SMS imaging may require
dedicated methods to reduce maximum RF amplitudes. The Variable Rate Selective
Excitation (VERSE) technique can be employed for this purpose, however, this
potentially increases off-resonance sensitivity (186) of the excitation slice profile.
Successful parallel image reconstruction requires an accurate determination of the
surface coil sensitivities. To this end, reference images without diffusion weighting and
similar imaging properties as the diffusion scans were acquired. In particular, image
distortions due to the EPI readout were consistent between sensitivity and SMS scans.
Solely the slice thickness was increased from 8mm to 16mm to improve SNR and
therefore reliability of the reconstruction process. The phase encoding direction was
selected parallel to the chest wall to exploit coil sensitivity variations of the cardiac
receiver array and reduce g-factor penalty. This geometry is additionally favorable as
no high signal intensity from the chest wall folds into the myocardium when
performing SMS in conjunction with CAIPIRINHA. Finally, B0 homogeneity by shimming
needs to be ensured over a larger volume as compared to single-slice acquisition.

111
7.5 Conclusion
SMS imaging can be employed to accelerate in vivo cardiac DTI by a factor of two
relative to conventional single-slice acquisition. Obtained DTI metrics were comparable
between accelerated and non-accelerated measurements. The proposed method
allows increased spatial coverage of the heart and potentially improves acceptance of
in vivo cardiac DTI in a clinical setting.
112
Chapter 8 Verification of the Intra-Voxel Incoherent Motion (IVIM) Model in the Porcine
Heart
8.1 Introduction
Magnetic resonance diffusion-weighted imaging relies on the signal attenuation due to
random motion of water molecules in the presence of diffusion encoding gradients.
Additionally, microvascular perfusion can contribute to the signal loss as described by
the intra-voxel incoherent motion (IVIM) model (115). According to Le Bihan et al.
(115), perfusion can be modeled as pseudo diffusion on a macroscopic scale, assuming
a random orientation of the capillary network and blood flow in the tissue of interest.
Consequently, the signal intensity can be described by a bi-exponential signal decay as
a function of the diffusion encoding strength (b-value). As the IVIM method is an
endogenous contrast technique, its application is particularly suited for perfusion
measurements where contrast agent administration is contraindicated. In recent years
this technique has gained significant momentum with successful applications in various
types of healthy and diseased organs (229–233).
Based on: Constantin von Deuster, Christian T. Stoeck, Lukas Wissmann, Georg Spinner, Thea
Fleischmann, Maximilian Y. Emmert, Nikola Cesarovic, Sebastian Kozerke. “Verification of the intra-voxel
incoherent motion (IVIM) model in the porcine heart”, Proceedings of the 23rd
Meeting of ISMRM,
Toronto, Canada, 2015

113
Cardiac IVIM requires reliable in vivo diffusion-weighted imaging methods. By means
of diffusion tensor imaging (DTI), the tissue microstructure can be probed by
employing diffusion-weighted single-shot spin echo (SE) (33–35,154) or Stimulated
Echo Acquisition Mode (STEAM) (31,37,38,79,87,162) techniques. A number of cardiac
DTI studies have shown that the myocardium consists of a highly organized muscular
structure forming a double helical pattern from endo- to epicardium (18,37,38,79).
Infarcted and ischemic areas can be delineated with low b-value diffusion-weighted SE
imaging in good agreement with late-gadolinium enhanced imaging (234,235). In vivo
cardiac diffusion-weighted imaging, however, still remains very challenging due to
cardiac and respiratory motion. Additionally, low signal-to-noise ratio (SNR) and long
scan times are major impediments to a wide acceptance in clinical settings. Motion
induced signal loss in SE based IVIM has been addressed by diastolic triggering and
dedicated post-processing using Principal Component Analysis (PCA) filtering in
combination with temporal maximum intensity projection (PCATMIP)
(40,119,120,133). Alternatively, diffusion encoding during systole has been performed
using motion-compensated diffusion gradient waveforms (33–35,154,155,158). In vivo
cardiac DTI studies in humans (34) and animals (35) using second- and third- order
motion-compensated diffusion imaging have been presented recently.
Cardiac IVIM parameters were initially reported for the in vivo canine heart by Callot et
al. (183). The measured diffusion-weighted signal agreed well with the bi-exponential
model of the IVIM theory with reduced signal decay in the absence of perfusion post
mortem. The employed STEAM sequence, however, allows blood circulation during the
long mixing time (~1-R-R interval) potentially biasing sensitivity to perfusion and
thereby compromising the resulting IVIM metrics. A significant reduction in diffusivity
by 29% was reported between in vivo and post mortem measurements (183).
The objective of the presented work is to validate in vivo IVIM measurements in a pig
model of myocardial infarction. In vivo measurements during systolic contraction were
obtained using a second-order motion-compensated single-shot spin echo sequence.
IVIM parameters were derived to evaluate the contribution of microvascular perfusion
to the diffusion-weighted signal. Additional post mortem IVIM measurements were
performed as a reference without motion and perfusion effects.
114
8.2 Methods
Animal Preparation and Control
Five female pigs (weight 51±23kg, heart rate 69±7beats/min) were anesthetized by a
constant intravenous dose of Propofol (1.0ml/kg/min) during surgery and in vivo MRI
measurements. An acute myocardial infarction in the apical septum was induced by
permanent distal ligation of the left anterior descending coronary artery (LAD). The
time delay between occlusion and in vivo imaging was approximately 2-3 hours. During
the in vivo measurements, the animals were intubated and ventilated. A femoral vein
catheter was used for drug delivery. Heart rate and pO2 were recorded continuously by
electrocardiogram and a peripheral pulse unit, respectively. Respiration was
monitored by a breathing belt and continuous measurements of exhaled CO2. Upon
completion of in vivo scanning, the pigs were euthanized by an overdosed potassium
chloride injection inside the MR scanner bore and the imaging protocol was repeated
thereafter. Post mortem diffusion scans were finished within 45 minutes of death as
control reference for the IVIM model. The animal experiments were performed in
adherence to the Swiss law of Animal Protection and approved by the Zurich cantonal
veterinary office.
Study Protocol
Cardiac SE diffusion-weighted imaging was implemented on a 1.5T Philips Achieva
System (Philips Healthcare, Best, The Netherlands) with gradients delivering 80mT/m
maximum strength at a slew rate of 100mT/m/ms per physical axis. Signal was
received with a 5-channel cardiac receiver array. Prior to diffusion imaging, cine data
with a temporal resolution of 10ms were acquired in two-chamber and short-axis view
orientations.
Diffusion Imaging
Diffusion-weighted imaging was performed during free breathing in short-axis view
orientation with a reduced field-of-view (FOV) technique (185) (Figure 8.1). The single-
shot spin echo sequence with second-order motion-compensated diffusion encoding

115
gradients (34,35) was ECG triggered to mid systole (50% time to peak contraction). To
avoid aliasing from residual excitation along the phase encoding direction, non-
coplanar excitation (236) in conjunction with saturation slabs orthogonal to the
imaging plane were played out prior to the RF excitation pulse. Fat suppression was
achieved by a 1-3-3-1 binomial spatial-spectral excitation (141). The duration of the
180° refocusing pulse was minimized using variable rate selective excitation (VERSE)
(186). Two slices (Figure 8.2) in healthy and ischemic region (midventricular and apical
area, respectively) were acquired. The imaging parameters were as follows: spatial
resolution: 2.4×2.4mm2, slice thickness: 10mm, field-of-view (FOV): 230×100-120mm2,
TR/TE: 2R-R/87-94ms, 8 signal averages. Data were acquired along six diffusion
encoding directions (97) for 16 b-values in the range of 0 to 880s/mm2. The b-value
distribution was taken from the literature (237). Using Monte Carlo simulations and
employing the IVIM fit error as optimization criterion, an optimal b-value distribution
can be determined as described by Lemke et al. (237). The duration of diffusion
encoding gradients for the different diffusion weightings, and hence the echo time,
was kept the same and differences in b-values were achieved by scaling the gradient
strength.
Dynamic Contrast Enhanced (DCE) Imaging
As reference method for ischemia detection, 2D first-pass contrast-enhanced perfusion
imaging was performed in short-axis view orientation upon diffusion imaging.
Perfusion and diffusion imaging was carried out at the same slice locations. A
saturation-recovery single-shot gradient echo sequence triggered to mid-systole was
Figure 8.1 Second-order motion-compensated diffusion-weighted imaging sequence. Dashed
lines indicate the variation of gradients to achieve different diffusion encoding strengths (b-
values) whilst keeping the duration of the gradients constant. Fat suppression is achieved by a
binomial excitation pulse. The trigger delay (TD) was set to mid systole.
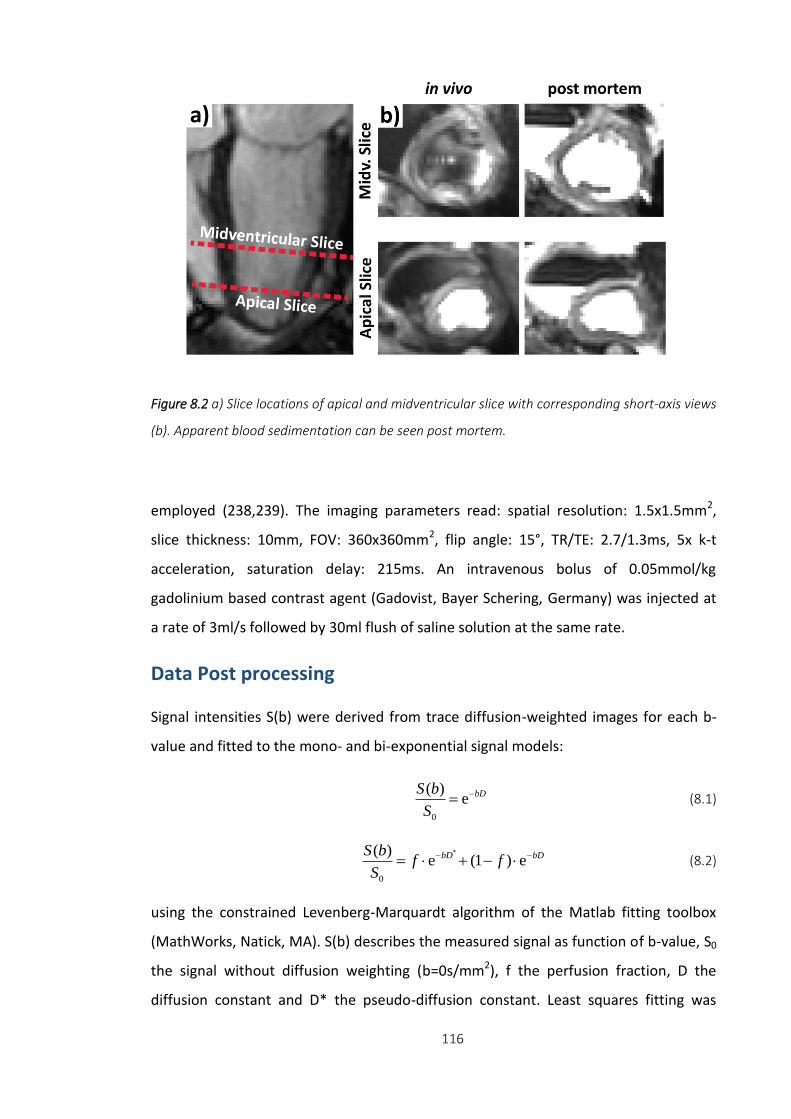
116
employed (238,239). The imaging parameters read: spatial resolution: 1.5x1.5mm2,
slice thickness: 10mm, FOV: 360x360mm2, flip angle: 15°, TR/TE: 2.7/1.3ms, 5x k-t
acceleration, saturation delay: 215ms. An intravenous bolus of 0.05mmol/kg
gadolinium based contrast agent (Gadovist, Bayer Schering, Germany) was injected at
a rate of 3ml/s followed by 30ml flush of saline solution at the same rate.
Data Post processing
Signal intensities S(b) were derived from trace diffusion-weighted images for each b-
value and fitted to the mono- and bi-exponential signal models:
0
( )e bDS b
S
(8.1)
*
0
( )e (1 ) ebD bDS b
f fS
(8.2)
using the constrained Levenberg-Marquardt algorithm of the Matlab fitting toolbox
(MathWorks, Natick, MA). S(b) describes the measured signal as function of b-value, S0
the signal without diffusion weighting (b=0s/mm2), f the perfusion fraction, D the
diffusion constant and D* the pseudo-diffusion constant. Least squares fitting was
Figure 8.2 a) Slice locations of apical and midventricular slice with corresponding short-axis views
(b). Apparent blood sedimentation can be seen post mortem.

117
performed on a pixel-by-pixel basis in the left ventricular myocardium. In the bi-
exponential case, a segmented approach as described in (183,232) was used assuming
pure diffusion for b-values above 350s/mm2. The starting values for signal fitting were:
f=0.5, D=1.0x10⁻³mm2/s and D*=10x10-3mm2/s.
Different relaxation terms of the perfusion and diffusion compartments can be
incorporated into the IVIM model as proposed by Lemke et al (118). As the transverse
relaxation times of blood and myocardium are very similar (~50-52 ms (139,142)), it is
sufficient to extend eq. (8.2) for T1 terms only:
* 11
110
( ) e (1 e ) (1 ) e (1 e )
(1 e ) (1 ) (1 e )
myoblood
myoblood
TRTRTTbD bD
TRTRTT
S b f f
Sf f
(8.3)
IVIM parameters derived by eq. (8.2) were corrected for T1 relaxation based on eq.
(8.3). T1 values for blood (T1blood) and myocardium (T1myo) were taken from literature:
1500 ms and 1030 ms, respectively (143,240). The repetition time TR was determined
by the heart rate: 60[bpm]
2 1000 [ms][bpm]
TRHR
.
Data Analysis
In each subject, a Region-of-Interest (ROI) was manually drawn to define the left
ventricle (LV) in vivo and post mortem. Voxels at the epi- and endocardial borders
were excluded from data analysis to avoid partial voluming effects. For the
midventricular slice without infarction, median IVIM parameters were derived across
the left ventricle on a per subject basis. The results of the IVIM metrics are reported as
mean ± one standard deviation across all pigs. Pre and post mortem IVIM parameter
comparison was performed using a two-tailed paired t-test. The agreement of the
mean diffusion-weighted signal with the mono- (eq. (8.1)) and bi-exponential model
(eq. (8.2)) was evaluated by the root mean squared fitting error (RMSE).
Infarcted and healthy tissue in the apical slice was classified in six circumferential
sectors based on the signal intensity of the DCE measurements: First, the signal range
between infarcted and healthy tissue was determined within a timeframe of
approximately 30s after bolus injection. If more than 50% of the area within a sector
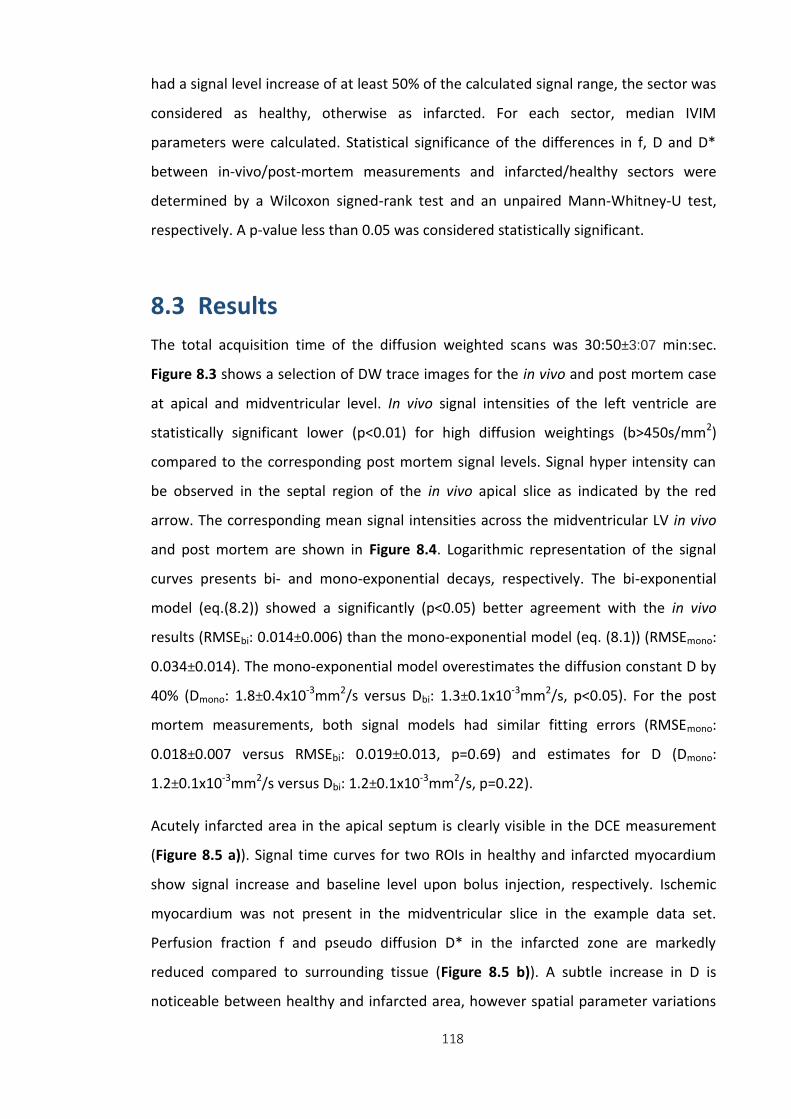
118
had a signal level increase of at least 50% of the calculated signal range, the sector was
considered as healthy, otherwise as infarcted. For each sector, median IVIM
parameters were calculated. Statistical significance of the differences in f, D and D*
between in-vivo/post-mortem measurements and infarcted/healthy sectors were
determined by a Wilcoxon signed-rank test and an unpaired Mann-Whitney-U test,
respectively. A p-value less than 0.05 was considered statistically significant.
8.3 Results
The total acquisition time of the diffusion weighted scans was 30:50±3:07 min:sec.
Figure 8.3 shows a selection of DW trace images for the in vivo and post mortem case
at apical and midventricular level. In vivo signal intensities of the left ventricle are
statistically significant lower (p<0.01) for high diffusion weightings (b>450s/mm2)
compared to the corresponding post mortem signal levels. Signal hyper intensity can
be observed in the septal region of the in vivo apical slice as indicated by the red
arrow. The corresponding mean signal intensities across the midventricular LV in vivo
and post mortem are shown in Figure 8.4. Logarithmic representation of the signal
curves presents bi- and mono-exponential decays, respectively. The bi-exponential
model (eq.(8.2)) showed a significantly (p<0.05) better agreement with the in vivo
results (RMSEbi: 0.014±0.006) than the mono-exponential model (eq. (8.1)) (RMSEmono:
0.034±0.014). The mono-exponential model overestimates the diffusion constant D by
40% (Dmono: 1.8±0.4x10⁻³mm2/s versus Dbi: 1.3±0.1x10⁻³mm2/s, p<0.05). For the post
mortem measurements, both signal models had similar fitting errors (RMSEmono:
0.018±0.007 versus RMSEbi: 0.019±0.013, p=0.69) and estimates for D (Dmono:
1.2±0.1x10⁻³mm2/s versus Dbi: 1.2±0.1x10⁻³mm2/s, p=0.22).
Acutely infarcted area in the apical septum is clearly visible in the DCE measurement
(Figure 8.5 a)). Signal time curves for two ROIs in healthy and infarcted myocardium
show signal increase and baseline level upon bolus injection, respectively. Ischemic
myocardium was not present in the midventricular slice in the example data set.
Perfusion fraction f and pseudo diffusion D* in the infarcted zone are markedly
reduced compared to surrounding tissue (Figure 8.5 b)). A subtle increase in D is
noticeable between healthy and infarcted area, however spatial parameter variations
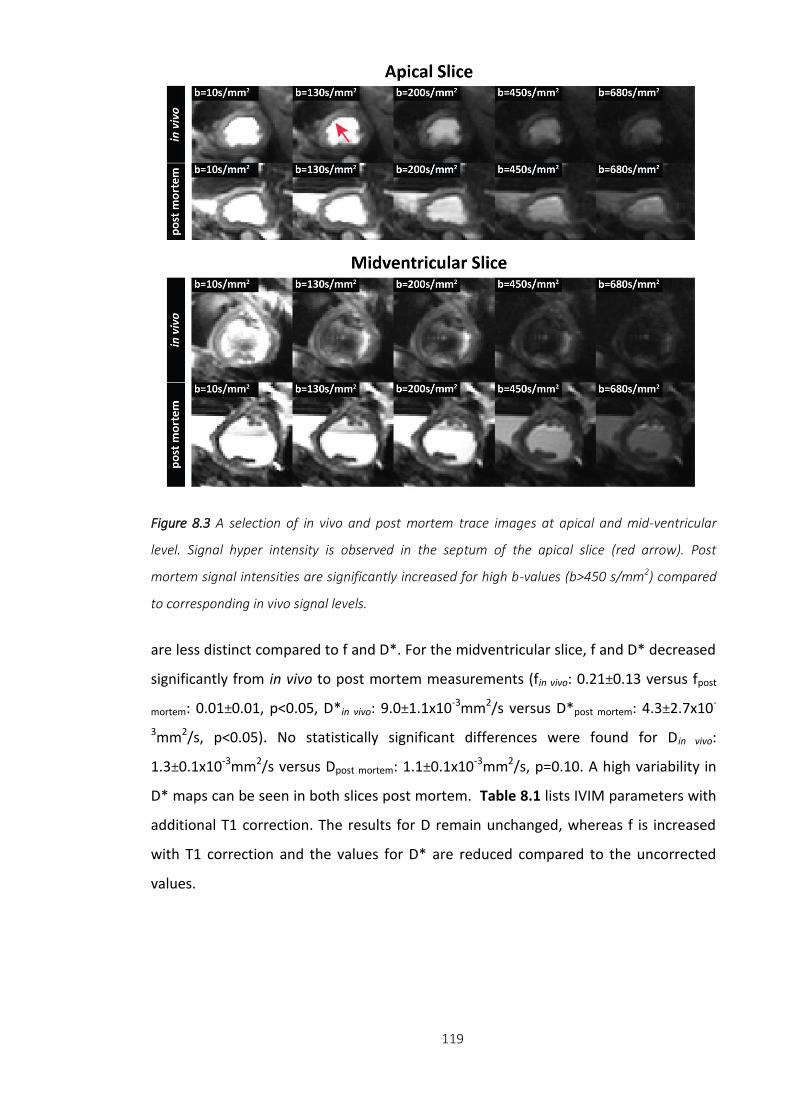
119
are less distinct compared to f and D*. For the midventricular slice, f and D* decreased
significantly from in vivo to post mortem measurements (fin vivo: 0.21±0.13 versus fpost
mortem: 0.01±0.01, p<0.05, D*in vivo: 9.0±1.1x10⁻³mm2/s versus D*post mortem: 4.3±2.7x10-
3mm2/s, p<0.05). No statistically significant differences were found for Din vivo:
1.3±0.1x10⁻³mm2/s versus Dpost mortem: 1.1±0.1x10⁻³mm2/s, p=0.10. A high variability in
D* maps can be seen in both slices post mortem. Table 8.1 lists IVIM parameters with
additional T1 correction. The results for D remain unchanged, whereas f is increased
with T1 correction and the values for D* are reduced compared to the uncorrected
values.
Figure 8.3 A selection of in vivo and post mortem trace images at apical and mid-ventricular
level. Signal hyper intensity is observed in the septum of the apical slice (red arrow). Post
mortem signal intensities are significantly increased for high b-values (b>450 s/mm2) compared
to corresponding in vivo signal levels.
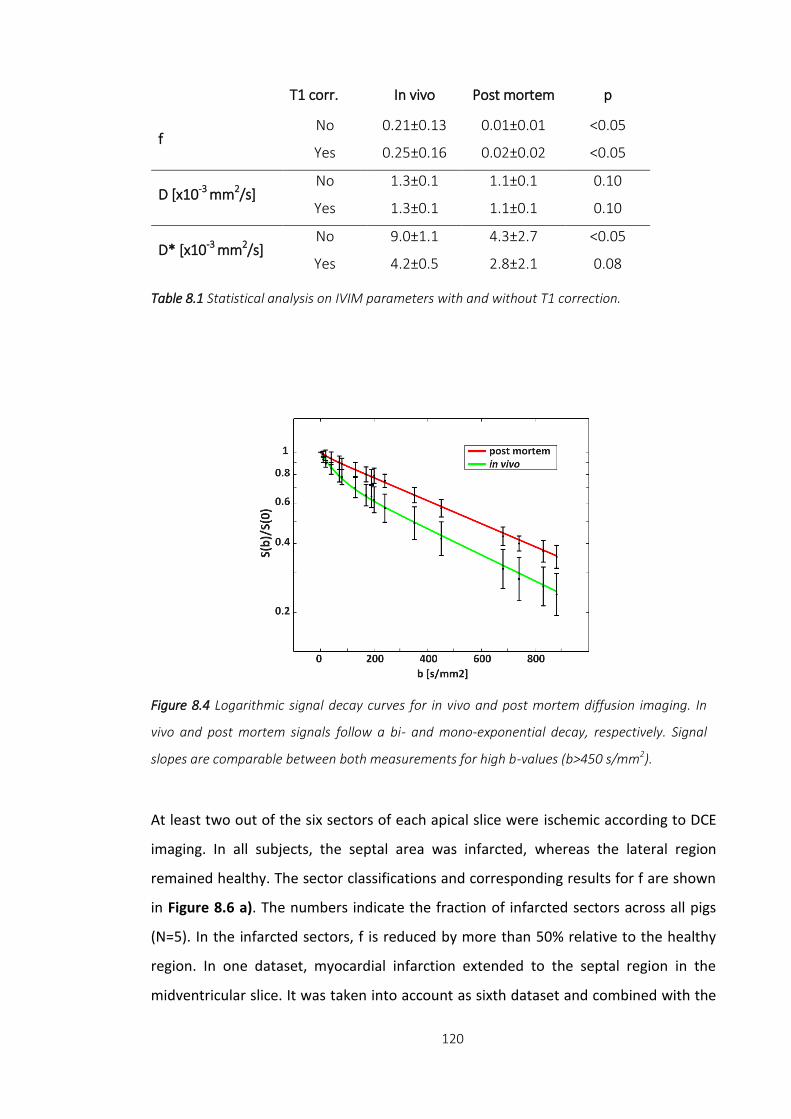
120
At least two out of the six sectors of each apical slice were ischemic according to DCE
imaging. In all subjects, the septal area was infarcted, whereas the lateral region
remained healthy. The sector classifications and corresponding results for f are shown
in Figure 8.6 a). The numbers indicate the fraction of infarcted sectors across all pigs
(N=5). In the infarcted sectors, f is reduced by more than 50% relative to the healthy
region. In one dataset, myocardial infarction extended to the septal region in the
midventricular slice. It was taken into account as sixth dataset and combined with the
Figure 8.4 Logarithmic signal decay curves for in vivo and post mortem diffusion imaging. In
vivo and post mortem signals follow a bi- and mono-exponential decay, respectively. Signal
slopes are comparable between both measurements for high b-values (b>450 s/mm2).
T1 corr. In vivo Post mortem p
f
No 0.21±0.13 0.01±0.01 <0.05
Yes 0.25±0.16 0.02±0.02 <0.05
D [x10-3 mm2/s] No 1.3±0.1 1.1±0.1 0.10
Yes 1.3±0.1 1.1±0.1 0.10
D* [x10-3 mm2/s] No 9.0±1.1 4.3±2.7 <0.05
Yes 4.2±0.5 2.8±2.1 0.08
Table 8.1 Statistical analysis on IVIM parameters with and without T1 correction.
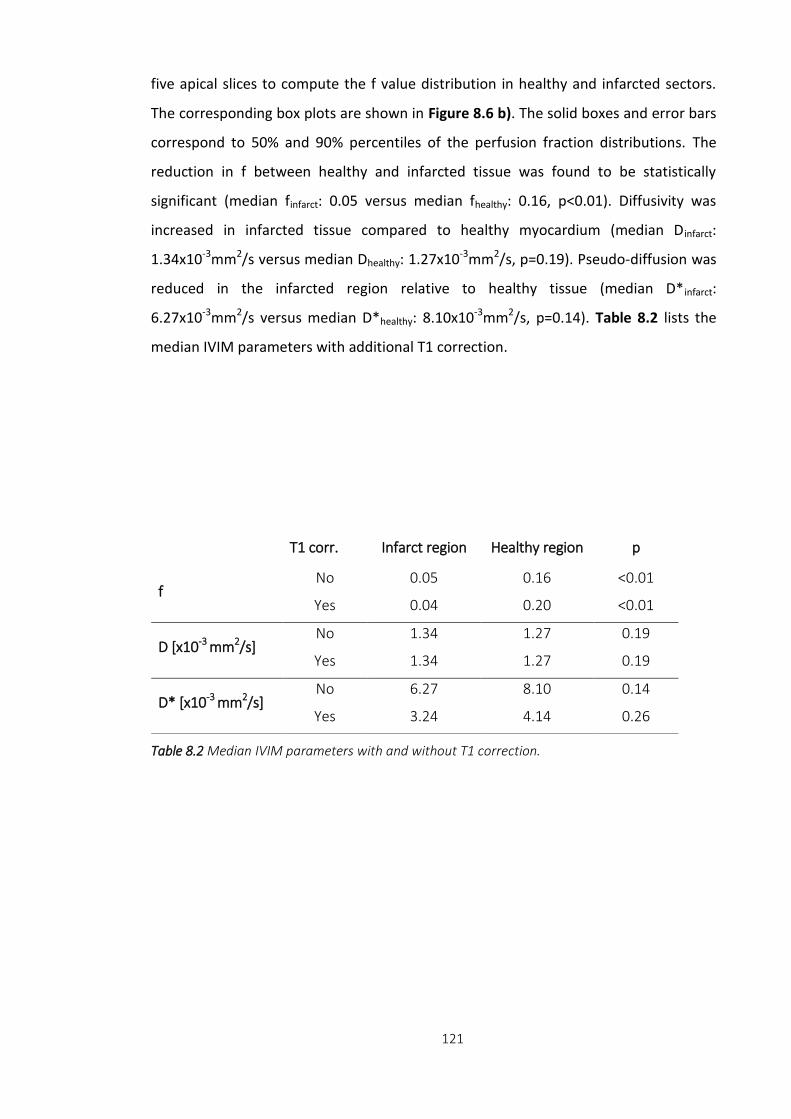
121
five apical slices to compute the f value distribution in healthy and infarcted sectors.
The corresponding box plots are shown in Figure 8.6 b). The solid boxes and error bars
correspond to 50% and 90% percentiles of the perfusion fraction distributions. The
reduction in f between healthy and infarcted tissue was found to be statistically
significant (median finfarct: 0.05 versus median fhealthy: 0.16, p<0.01). Diffusivity was
increased in infarcted tissue compared to healthy myocardium (median Dinfarct:
1.34x10⁻³mm2/s versus median Dhealthy: 1.27x10⁻³mm2/s, p=0.19). Pseudo-diffusion was
reduced in the infarcted region relative to healthy tissue (median D*infarct:
6.27x10⁻³mm2/s versus median D*healthy: 8.10x10⁻³mm2/s, p=0.14). Table 8.2 lists the
median IVIM parameters with additional T1 correction.
T1 corr. Infarct region Healthy region p
f
No 0.05 0.16 <0.01
Yes 0.04 0.20 <0.01
D [x10-3 mm2/s] No 1.34 1.27 0.19
Yes 1.34 1.27 0.19
D* [x10-3 mm2/s] No 6.27 8.10 0.14
Yes 3.24 4.14 0.26
Table 8.2 Median IVIM parameters with and without T1 correction.

122
Figure 8.5 a) Dynamic contrast enhanced (DCE) first pass perfusion imaging showing infarcted
area in septum. DCE signal time curves for two ROIs in infarcted (ROI 1) and healthy (ROI 2)
regions show baseline level and signal increase upon bolus injection, respectively. No infarcted
area can be seen in the midventricular slice. The dashed grey line indicates the time point of
the DCE images. b) In vivo and post mortem IVIM parameter maps at apical and midventricular
level: The infarcted area correlates with a reduced perfusion fraction (f) and pseudodiffusion
(D*). f reduces close to zero from in vivo to post mortem measurements. No significant change
can be observed for D between pre and post mortem imaging. Post mortem D* maps show
increased variabilty compared to in vivo D* maps.
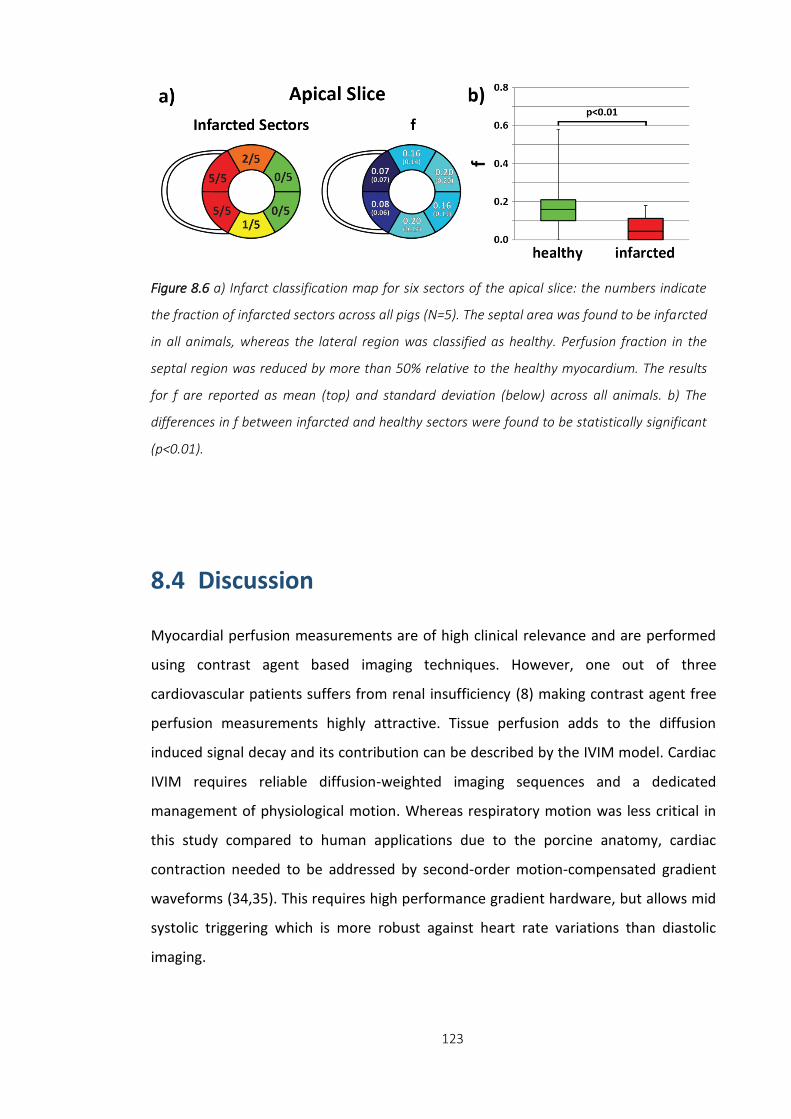
123
8.4 Discussion
Myocardial perfusion measurements are of high clinical relevance and are performed
using contrast agent based imaging techniques. However, one out of three
cardiovascular patients suffers from renal insufficiency (8) making contrast agent free
perfusion measurements highly attractive. Tissue perfusion adds to the diffusion
induced signal decay and its contribution can be described by the IVIM model. Cardiac
IVIM requires reliable diffusion-weighted imaging sequences and a dedicated
management of physiological motion. Whereas respiratory motion was less critical in
this study compared to human applications due to the porcine anatomy, cardiac
contraction needed to be addressed by second-order motion-compensated gradient
waveforms (34,35). This requires high performance gradient hardware, but allows mid
systolic triggering which is more robust against heart rate variations than diastolic
imaging.
Figure 8.6 a) Infarct classification map for six sectors of the apical slice: the numbers indicate
the fraction of infarcted sectors across all pigs (N=5). The septal area was found to be infarcted
in all animals, whereas the lateral region was classified as healthy. Perfusion fraction in the
septal region was reduced by more than 50% relative to the healthy myocardium. The results
for f are reported as mean (top) and standard deviation (below) across all animals. b) The
differences in f between infarcted and healthy sectors were found to be statistically significant
(p<0.01).

124
In this study, the IVIM model has been validated in porcine hearts using SE in vivo
cardiac diffusion-weighted imaging. To obtain a reference model without motion and
perfusion effects, the pigs were euthanatized within the scanner bore and diffusion
imaging was repeated. In vivo values for perfusion fractions were significantly reduced
to near zero post mortem in agreement with previous results obtained from dog
hearts (183). In vivo diffusion-weighted signal decay was significantly better described
by a bi-exponential model compared to a mono-exponential model. The minor
reduction in D between in vivo and post mortem was statistically not significant, which
attests good motion compensation of the employed gradient waveform designs
(34,35). Obtained results for f were slightly increased when T1 relaxation effects were
taken into account, whereas the pseudo diffusion constant D* is overestimated
without T1 correction.
Moulin et al. (119) obtained a similar diffusion constant, but lower perfusion fraction
(f=0.12±0.01, D=1.4±0.1x10⁻³mm2/s, D*=44±9x10⁻³mm2/s) in the healthy human heart.
In contrast to our work, imaging was performed with unipolar diffusion encoding
gradients (119) during diastole in combination with PCATMIP filtering to mitigate
motion induced signal loss (40,133). Delattre et al. (120) reported an increased D using
a bipolar diffusion encoding sequence: f=0.15±0.05, D=2.4±1.0x10⁻³mm2/s,
D*=76x10-3mm2/s. PCATMIP reconstruction relies on the existence of motion unbiased
signal for at least one trigger delay. Scott et al. (159) performed cardiac IVIM using the
STEAM method: The obtained values for f and D were lower compared to our findings:
f=0.06, D=0.86x10⁻³mm2/s, D*=17x10-3mm2/s. Comparable results were obtained by
Callot et al. (183): f=0.08±0.01, D=1.3±0.1x10⁻³mm2/s, D*=13±3x10⁻³mm2/s. Due to the
different diffusion encoding times of SE and STEAM based diffusion sequences,
motional narrowing (146) and water exchange effects (183) can bias diffusion results
and affect IVIM parameters. Besides variations in acquisition techniques and trigger
point in the cardiac cycle, different data processing procedures can explain differences
relative to and among literature values: Signal fitting has been performed on mean
signal within a ROI (159,183), on a pixel-by-pixel basis (119) or a combination of both
(120) for different IVIM parameters. Fitting D* is inherently badly conditioned and
highly sensitive to low SNR resulting in large variations within and across IVIM studies

125
(237). In our study, the lack of perfusion post mortem translates into increased D*
variability as seen in the D* parameter maps.
The proposed IVIM method allowed delineation of the infarcted area by low f values in
good spatial agreement with dynamic contrast-enhanced myocardial perfusion
imaging. Statistical analysis showed that the perfusion fraction is significantly reduced
in the infarcted area when compared to healthy myocardium. Hence, reduced f and D*
can be associated with a lack of microvascular perfusion, potentially leading to
reversible or irreversible ischemia with myocardial necrosis. Physiologically this may
result in local cardiac dysfunction with reduced mobility and contractility. Similar to
previous DTI studies (18,31,51,54), an increase in diffusivity was found in the infarcted
myocardium.
Study Limitations:
The obtained IVIM parameters in this study show (in parts) a high variability. This can
be explained by the relatively critical state of the animals due to the acute myocardial
infarct which causes reduced ECG signal quality. Potential miss-triggering of the
imaging sequence may result in incorrect cardiac phases and/or signal voids. In
addition, imaging was performed during mid systole when perfusion is physiologically
reduced compared to diastole (40,119,133) which lowers perfusion measurement
precision. Due to the small sample size (N=5) and low spatial resolution, statistical
analysis needed to be performed on a sector and per subject basis. For the same
reason and the fact that DCE images are primarily qualitative, first pass perfusion
measurements were evaluated in the proposed binary scheme (infarcted vs healthy).
Whereas infarcted regions and remote myocardium can be correctly described by the
binary approach, perfusion integrity in adjacent myocardium is insufficiently reflected
by this method. A higher number of animals and a quantitative analysis of DCE
perfusion imaging (including arterial input function measurements) may allow for a
more differentiated picture of IVIM-DCE imaging correlations.
In summary, cardiac IVIM has the potential to improve current methods of myocardial
tissue characterisation by mapping myocardial perfusion. This endogenous technique
is particularly appealing in clinical settings where contrast agent administration is
contraindicated. Diffusion-weighted imaging employing second-order motion-

126
compensated gradients, however, requires high performance gradient hardware. This
prerequisite is expected to be fulfilled in the near future with the recent developments
in MR gradient hardware.
8.5 Conclusion
Myocardial perfusion contributes significantly to cardiac diffusion-weighted imaging
signals at low b-values. IVIM parameter mapping allows characterisation of perfusion
fractions in good spatial agreement with dynamic contrast-enhanced imaging.
127
Chapter 9 Bayesian Intravoxel Incoherent Motion Imaging to Map Perfusion in the
Human Heart‡
9.1 Introduction
The concept of Intravoxel Incoherent Motion (IVIM) (115) for perfusion measurement
in the heart has gained significant interest in recent years (119,120). However, low
signal-to-noise ratio, partial voluming, cardiac and respiratory motion render IVIM
acquisition and parameter mapping of the heart very challenging. The objective of the
present work was to implement cardiac IVIM using a second-order motion-
compensated diffusion-weighted spin echo approach in conjunction with Bayesian
processing to permit perfusion and diffusion parameter mapping of the heart during
cardiac contraction.
Based on: Georg Spinner
†, Constantin von Deuster
†, Christian T. Stoeck, Sebastian Kozerke. “Bayesian
Intravoxel Incoherent Motion Imaging to Map Perfusion in the Human Heart”, Proceedings of the 24th
Meeting of ISMRM, Singapore, 2016
† equal contributors
‡ Methodology, data post processing and data analysis was performed by Georg Spinner.
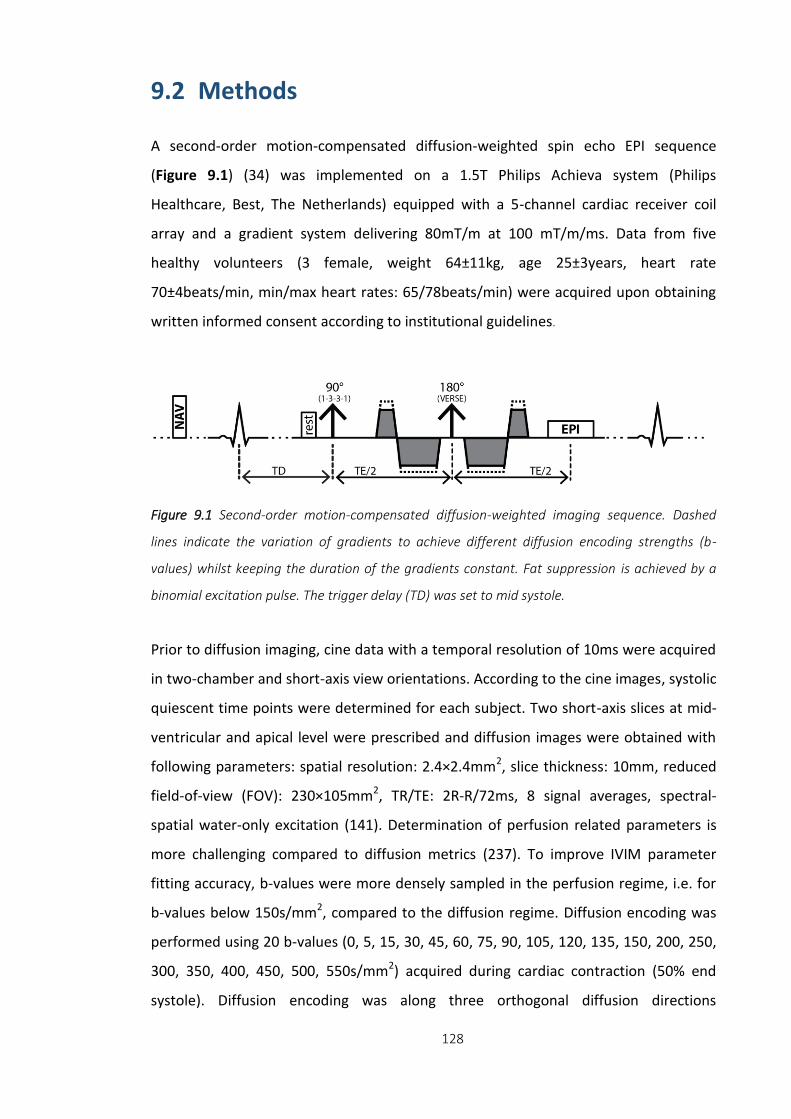
128
9.2 Methods
A second-order motion-compensated diffusion-weighted spin echo EPI sequence
(Figure 9.1) (34) was implemented on a 1.5T Philips Achieva system (Philips
Healthcare, Best, The Netherlands) equipped with a 5-channel cardiac receiver coil
array and a gradient system delivering 80mT/m at 100 mT/m/ms. Data from five
healthy volunteers (3 female, weight 64±11kg, age 25±3years, heart rate
70±4beats/min, min/max heart rates: 65/78beats/min) were acquired upon obtaining
written informed consent according to institutional guidelines.
Prior to diffusion imaging, cine data with a temporal resolution of 10ms were acquired
in two-chamber and short-axis view orientations. According to the cine images, systolic
quiescent time points were determined for each subject. Two short-axis slices at mid-
ventricular and apical level were prescribed and diffusion images were obtained with
following parameters: spatial resolution: 2.4×2.4mm2, slice thickness: 10mm, reduced
field-of-view (FOV): 230×105mm2, TR/TE: 2R-R/72ms, 8 signal averages, spectral-
spatial water-only excitation (141). Determination of perfusion related parameters is
more challenging compared to diffusion metrics (237). To improve IVIM parameter
fitting accuracy, b-values were more densely sampled in the perfusion regime, i.e. for
b-values below 150s/mm2, compared to the diffusion regime. Diffusion encoding was
performed using 20 b-values (0, 5, 15, 30, 45, 60, 75, 90, 105, 120, 135, 150, 200, 250,
300, 350, 400, 450, 500, 550s/mm2) acquired during cardiac contraction (50% end
systole). Diffusion encoding was along three orthogonal diffusion directions
Figure 9.1 Second-order motion-compensated diffusion-weighted imaging sequence. Dashed
lines indicate the variation of gradients to achieve different diffusion encoding strengths (b-
values) whilst keeping the duration of the gradients constant. Fat suppression is achieved by a
binomial excitation pulse. The trigger delay (TD) was set to mid systole.
129
maximizing gradient strength utilisation. Each diffusion direction and b-value was
acquired during respiratory navigated breath holding (acceptance window: 5mm).
In post-processing, affine image registration of diffusion-weighted images and
averages was performed using elastix (147) to correct for residual respiratory motion
induced geometrical inconsistency. In addition, image intensities were corrected to
account for variations of the effective repetition time TR as a result of varying heart
rate. Thereupon, the signal S(b) was fitted using the IVIM model (115):
*
0
( )e (1 ) ebD bDS b
f fS
(9.1)
with reference intensity S0, diffusion encoding strength b, diffusion coefficient D,
perfusion fraction f and pseudo-diffusion coefficient D*. For model fitting, a Bayesian
shrinkage prior (BSP) inference approach (241) was implemented to estimate the
parameters of the IVIM model. The shrinkage prior was a multivariate Gaussian
distribution of the log/logit-transformed IVIM parameters:
* *
log
logit log log 1
log
d D
f F F F
d D
(9.2)
The mean across the region-of-interest (ROI) of the parameter 𝜽𝑖 = [𝑑𝑖 , 𝑓𝑖, 𝑑∗𝑖] of
voxel 𝑖 is 𝝁 = [𝜇𝑑 , 𝜇𝑓 , 𝜇𝑑∗] and correlations between the parameters are described by
the covariance matrix . A Jeffrey’s prior (242) is used for the hyper-parameters 𝝁
and 𝛴𝜇:
1/2 1/2
,p I
(9.3)
This prior leads to maximization of the Fisher Information 𝐼(𝛴𝜇) and to a minimization
of the (co-)variance of the parameters in the ROI. Hence a “shrinking” of the posterior
distribution can typically be observed.
Expectation values under the posterior can be computed numerically using the Markov
Chain Monte Carlo implementation as proposed by Orton et al. To this end, 1.0x10⁴
samples were used for a burn-in phase and 2.0x10⁴for the actual sampling. Further
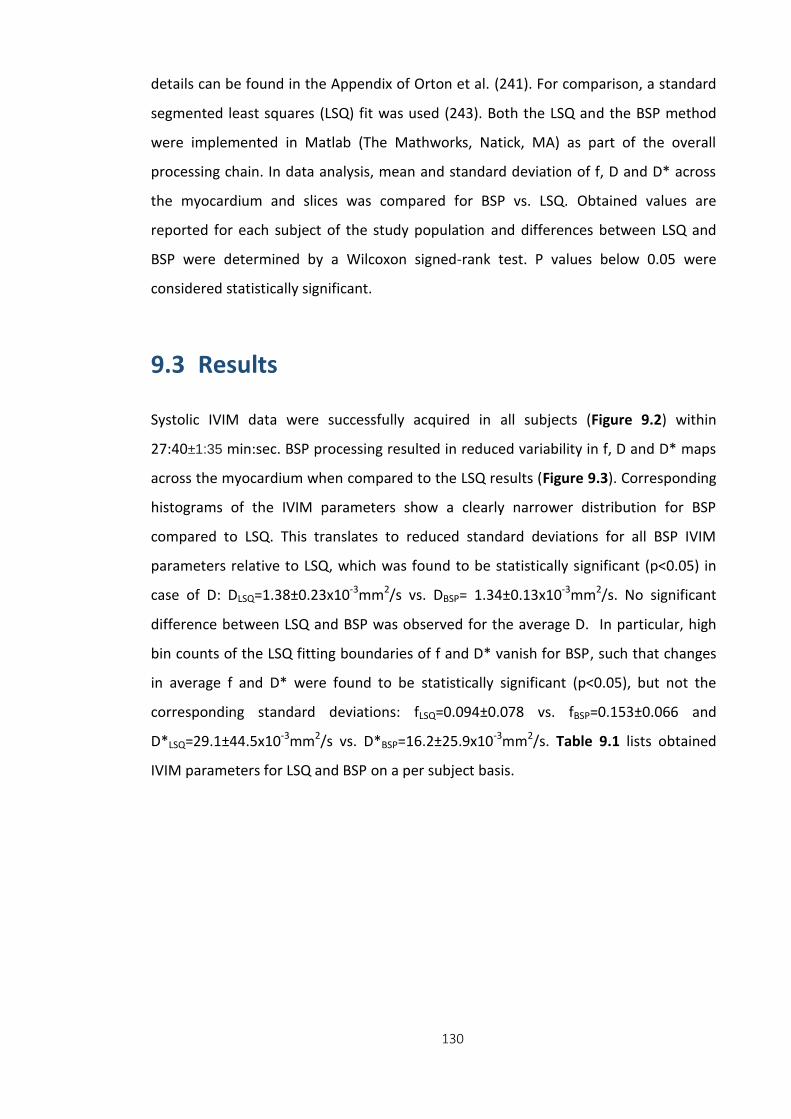
130
details can be found in the Appendix of Orton et al. (241). For comparison, a standard
segmented least squares (LSQ) fit was used (243). Both the LSQ and the BSP method
were implemented in Matlab (The Mathworks, Natick, MA) as part of the overall
processing chain. In data analysis, mean and standard deviation of f, D and D* across
the myocardium and slices was compared for BSP vs. LSQ. Obtained values are
reported for each subject of the study population and differences between LSQ and
BSP were determined by a Wilcoxon signed-rank test. P values below 0.05 were
considered statistically significant.
9.3 Results
Systolic IVIM data were successfully acquired in all subjects (Figure 9.2) within
27:40±1:35 min:sec. BSP processing resulted in reduced variability in f, D and D* maps
across the myocardium when compared to the LSQ results (Figure 9.3). Corresponding
histograms of the IVIM parameters show a clearly narrower distribution for BSP
compared to LSQ. This translates to reduced standard deviations for all BSP IVIM
parameters relative to LSQ, which was found to be statistically significant (p<0.05) in
case of D: DLSQ=1.38±0.23x10⁻³mm2/s vs. DBSP= 1.34±0.13x10⁻³mm2/s. No significant
difference between LSQ and BSP was observed for the average D. In particular, high
bin counts of the LSQ fitting boundaries of f and D* vanish for BSP, such that changes
in average f and D* were found to be statistically significant (p<0.05), but not the
corresponding standard deviations: fLSQ=0.094±0.078 vs. fBSP=0.153±0.066 and
D*LSQ=29.1±44.5x10⁻³mm2/s vs. D*BSP=16.2±25.9x10⁻³mm2/s. Table 9.1 lists obtained
IVIM parameters for LSQ and BSP on a per subject basis.
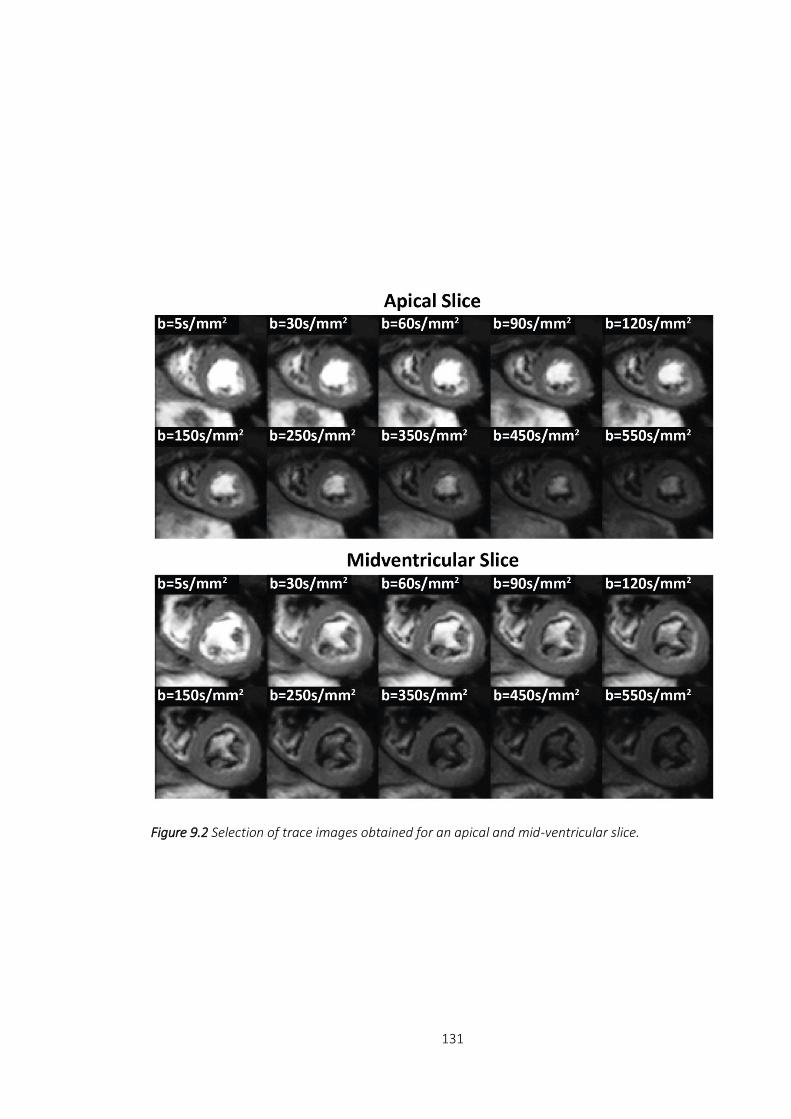
131
Figure 9.2 Selection of trace images obtained for an apical and mid-ventricular slice.

132
Figure 9.3 Example IVIM parameter maps comparing least squares (LSQ) and Bayesian
Shrinkage Prior (BSP) based results. Variability in IVIM parameters is considerably reduced for
BSP relative to LSQ.

133
9.4 Discussion
Second-order motion-compensated diffusion-weighted imaging in combination with Bayesian
shrinkage prior inference allows to map the perfusion fraction of the human heart during
systolic contraction. Imaging in systole reduces partial volume effects due to a more favorable
ratio of voxel size to myocardial thickness when compared to imaging in diastole. In addition,
systolic time points are more reproducible in the presence of heart rate variations thereby
improving the consistency of the data. In combination with Bayesian processing, perfusion
maps with reduced noise are obtained when compared to standard segmented least squares
fitting.
9.5 Conclusion
Bayesian Intravoxel Incoherent Motion mapping is considered a promising approach to
map myocardial perfusion fractions without the need for contrast agent
administration. Further work is warranted to study local perfusion changes during both
rest and pharmacologically induced stress in ischemic patients.
f D [10-3mm2/s] D* [10-3mm2/s]
Vol. Slice LSQ BSP
LSQ
BSP
LSQ
BSP
1 1 0.12±0.07
0.14±0.07 1.45±0.20
1.44±0.17 22.5±45.7
18.5±11.7
1 2 0.10±0.07
0.15±0.06 1.48±0.19
1.47±0.07 29.9±47.5
25.4±32.0
2 1 0.11±0.06
0.17±0.05 1.40±0.22
1.27±0.18 18.8±13.1
11.1±4.1
2 2 0.09±0.07
0.17±0.07 1.40±0.19
1.27±0.07 21.0±17.4
9.1±3.2
3 1 0.04±0.06
0.11±0.05 1.33±0.34
1.35±0.30 43.7±71.5
24.7±89.2
3 2 0.07±0.09
0.13±0.11 1.38±0.22
1.38±0.13 47.4±60.5
33.2±88.4
4 1 0.13±0.07
0.20±0.05 1.27±0.18
1.18±0.07 15.8±23.8
8.8±4.2
4 2 0.10±0.08
0.14±0.06 1.32±0.17
1.32±0.02 23.5±35.0
11.6±7.2
5 1 0.08±0.08
0.15±0.06 1.41±0.29
1.35±0.21 35.0±72.2
12.3±13.1
5 2 0.10±0.13
0.17±0.08 1.33±0.29
1.32±0.04 33.4±57.8
7.2±5.8
Mean 0.094±0.078
0.153*±0.066 1.38±0.23
1.34±0.13* 29.1±44.5
16.2*±25.9
Table 9.1 LSQ and BSP IVIM parameters across all volunteers. *significance for LSQ vs BSP
(p<0.05).

134
Chapter 10 Discussion and Outlook
10.1 Discussion
In this work, two sequence designs for in vivo cardiac DTI, the Stimulated Echo
Acquisition Mode (STEAM) and Spin Echo (SE) imaging, have been implemented,
validated and applied to study left ventricular tissue properties in healthy and diseased
hearts. It has been demonstrated, that under in vivo conditions, SE based diffusion
imaging using second-order motion-compensated diffusion gradients yields a 2.3-2.9
increase in SNR efficiency relative to STEAM. This SNR gain translates into improved
accuracy of diffusion tensor metrics. For multi-slice imaging, SNR can be further
increased by a slice-interleaved acquisition scheme with reduced signal saturation due
to longer TR. As the SE approach requires one R-R interval to acquire one diffusion-
weighted image (in contrast to two R-R-intervals for STEAM), an increase in scan
efficiency during free-breathing acquisition of 30% relative to STEAM could be
demonstrated (244). Statistically significant differences for mean diffusivity (MD) and
fractional anisotropy (FA) were found between both sequences in vivo. These
observations could be explained by motional narrowing effects due to different
diffusion encoding times of SE (~25ms) versus STEAM (~1000ms), however further
investigations on this discrepancy of apparent tissue property are warranted.
The STEAM technique was subsequently employed to study dynamic fibre
reorientation between heart phases in patients with dilated cardiomyopathy (DCM).
Elevation of myofibre helix angles was observed during contraction in the control
group of healthy volunteers, which is assumed to generate myocardial twist and
optimize cardiac pumping efficiency. In addition, a tendency towards a more radial

135
sheetlet orientation in systole was identified based on the secondary eigenvector
component, while diastolic data showed a more longitudinal sheetlet orientation
relative to the short-axis normal. In contrast, helix and sheetlet angles in the DCM
patients did not change significantly between heart phases and diastolic fibre
orientations were more longitudinal compared to healthy controls. In particular, a
subgroup of DCM patients with low ejection fraction (EF: 15-35%) showed remarkably
increased helix angles compared to patients with higher EF and the controls. The
reduced dynamic fibre reorientation between cardiac phases was accompanied by
reduced cardiac strain rates and torsion. These findings provide new insights into
structural alterations in the living heart in DCM.
The intrinsic low scan efficiency of cardiac DTI has been addressed by simultaneous
multi-slice imaging. A dual-band excitation pulse and a dedicated parallel image
reconstruction were implemented and applied to STEAM based diffusion imaging. A
scan acceleration factor of two relative to conventional sequential single-slice imaging
has been shown. No statistically significant differences were found between
accelerated and non-accelerated DTI results. An extension of the approach to more
than two concurrently excited slices was demonstrated recently (227). Successful
image reconstruction requires dedicated surface coil arrays to provide sufficient coil
sensitivity variation. Furthermore B0 homogeneity needs to be guaranteed over a
larger volume as compared to single slice acquisition. Potential image distortions due
to off-resonance effects, however, can be addressed by dedicated post-processing
methods incorporating B0 field maps as shown in Chapter 4.1.1.
The contribution of microvascular perfusion to the diffusion-weighted signal at low b-
values was investigated in a model of myocardial infarction in pigs. As proposed by the
Intravoxel Incoherent Motion (IVIM) theory, a bi-exponential signal decay model
allows to accurately fit the in vivo data. Low perfusion fractions were found in the
infarcted area and the absence of perfusion post mortem was correctly described.
Importantly, no statistically significant differences were found between in vivo and
post mortem diffusion components which attest a sufficient insensitivity to bulk
motion of the SE sequence. The statistical power of this study, however, was limited by
the relatively small number of subjects (N=5).

136
The inherent sensitivity to low SNR in IVIM parameter estimation has been addressed
by using Bayesian inference for parameter mapping. The proposed technique allows a
reduction in parameter variation compared to least squares regression. Future work
should investigate potential data reduction to shorten current measurement times to
clinically acceptable durations. Particularly in case of renal insufficiency, IVIM is an
appealing method to map myocardial perfusion without contrast agent administration.
10.2 Outlook
With recent developments in magnetic resonance hardware, sufficiently short echo
times (TE<70ms) for higher-order motion-compensated SE (34,35) can be realised.
Improvements in gradient hardware performance allow a considerable reduction in TE,
as the b-value has a quadratic gradient strength dependency (eq. 3.18). The feasibility
to design gradient hardware delivering 300mT/m at a slew rate of 200mT/m/ms has
been shown in the Human Connectome Project (245). While the Connectome gradient
system requires dedicated gradient amplifiers and hence considerable cost is added to
MRI system installation and maintenance, geometric scaling of gradient coils may be
pursued as an alternative option in the future. To this end, a reduction of gradient coil
diameter from 70 to 60cm would provide an increase in gradient performance from 40
to 90mT/m with standard gradient amplifiers. At these high gradient amplitudes,
mechanical gradient oscillations and eddy currents induced by gradient coil activity
need to be addressed. Consequently, magnetic field monitoring as described in
Chapter 4.1. should be used alongside advanced image reconstruction approaches to
correct for system imperfections produced by these systems.
Another fundamental consideration relates to baseline SNR and, accordingly, to static
magnetic field strength. A 1.5T system was used for most of the work described in the
present thesis. Higher static field strengths allow to elevate baseline SNR but dedicated
measures to counteract increased B0 inhomogeneity need to be fully implemented as
outlined in Chapter 4.1.
137
The SNR gain may be utilised to increase spatial resolution and hence reduce partial
voluming of current DTI protocols. Performing in vivo imaging with voxel sizes smaller
than 1.9x1.9mm2 (246) should be approached. In addition, higher angular resolution
including Q-Ball imaging (105) or model-free diffusion spectrum imaging (102) are
potential objectives for future work.
Current whole heart 3D fibre reconstructions are based on multi-slice two-dimensional
data acquisitions and optional data extrapolation methods (154). Three-dimensional
data acquisition with segmented multi-shot readouts may be performed if motion
induced phases inconsistencies between k-space segments are adequately addressed.
This can be achieved by higher-order motion-compensated diffusion encoding
gradients (34,35) in combination with phase navigators (247). Alternatively, Nguyen et
al. (36) proposed a diffusion-weighted preparation sequence which can be combined
with multi-shot 3D image readouts (Cartesian, Spiral). The feasibility of 3D multi-shot
diffusion-weighted imaging has been shown for carotid vessel wall imaging (248) with
sub-millimetre resolution. With the MUSE (“multiplexed sensitivity-encoding”) (128)
approach, phase errors in interleaved diffusion-weighted images are measured and
corrected for during image reconstruction. All multi-shot approaches circumvent the
downsides of single-shot EPI (Chapter 4.1) translating to improved spatial resolution
and reduced off-resonance sensitivity. Future work should explore 3D multi-shot
acquisition for cardiac DTI as an alternative to the established 2D single-shot EPI
readout.
In a number of studies on diseased hearts, cardiac DTI has been able to detect
myofibre reorientation, myocardial degeneration and accumulation of fibrosis -
potential hallmarks of heart failure (27–32). Hence, in vivo cardiac diffusion-weighted
imaging has the potential to extend current diagnostic tools to characterise and assess
myocardial tissue structure and integrity. The technique is expected to play an
important role in monitoring and guiding a range of therapeutic approaches. In
particular, longitudinal studies of regenerative treatment strategies are foreseen as a
promising avenue. Moreover, personalisation of data-driven in silico models of the
heart to gain mechanistic insights are important targets.

138
In particular, patient-specific microstructural information may allow enhancing models
simulating disease progression and potential treatment responses prior to intervention
in the patient (172,249). Possible applications of predictive modelling also include
radio-frequency ablation and cardiac resynchronisation therapy (250–253).

139
Abbreviations
ADC Apparent Diffusion Coefficient
BPM Beats Per Minute
BW Bandwidth
CVD Cardiovascular Disease
b100 Image with b-value of 100s/mm2
B0 Main magnetic field
B1 RF excitation field
BSA Body Surface Area
CSPAMM Complementary Spatial Modulation of Magnetization
DCM Dilated Cardiomyopathy
DSI Diffusion Spectrum Imaging
DTI Diffusion Tensor Imaging
DWI Diffusion Weighted Imaging
ECG Electrocardiography
ECV Extra Cellular Volume
EDV End Diastolic Volume
ESV End Systolic Volume
EF Ejection Fraction
EPI Echo Planar Imaging
FA Fractional Anisotropy
FID Free Induction Decay
FOV Field Of View
Gd Gadolinium
HA Helix Angle
HCM Hypertrophic Cardiomyopathy
HR Heart Rate
IVIM Intravoxel Incoherent Motion
LGE Late Gadolinium Enhancement

140
LV Left Ventricle
M Measurement encoding direction
MD Mean Diffusivity
MI Myocardial Infarction
MRI Magnetic Resonance Imaging
NMR Nuclear Magnetic Resonance
ODF Orientation Distribution Function
P Phase encoding direction
p Statistics: value of significance
PCA Principal Component Analysis
PDF Probability Density Function
QSI Q-Space Imaging
RF Radio Frequency
RV Right Ventricle
S Slice encoding direction
SD Standard Deviation
SE Spin Echo
SS Single-Shot
SINMOD Sine Wave Modeling
SNR Signal-to-Noise Ratio
STEAM Stimulated Echo Acquisition Mode
TA Transverse Angle
TE Echo Time
TM Mixing Time
TMIP Temporal Maximum Intensity Projection
TR Repetition Time

141
Bibliography
1. Mendis S, Pekka P, Norrving B. Global Atlas on cardiovascular disease prevention and control. Organization 2011:156.
2. WHO. The top 10 causes of death. 2012.
3. Dayer M, Cowie MR. Heart failure: Diagnosis and healthcare burden. Clin. Med. (Northfield. Il). 2004;4:13–18.
4. Mcmurray JJ V, Adamopoulos S, Anker SD, et al. ESC Guidelines for the diagnosis and treatment of acute and chronic heart failure 2012. Eur. J. Heart Fail. 2012;14:803–869.
5. Chambers J. Echocardiography in Clinical Practice. 2002.
6. Moon JC, Messroghli DR, Kellman P, et al. Myocardial T1 mapping and extracellular volume quantification: a Society for Cardiovascular Magnetic Resonance (SCMR) and CMR Working Group of the European Society of Cardiology consensus statement. J. Cardiovasc. Magn. Reson. 2013;15:1.
7. Kellman P, Wilson JR, Xue H, Ugander M, Arai AE. Extracellular volume fraction mapping in the myocardium, part 1: evaluation of an automated method. J. Cardiovasc. Magn. Reson. 2012;14:64.
8. Foley RN. Clinical epidemiology of cardiovascular disease in chronic kidney disease. J. Ren. Care 2010;36:4–8.
9. Kali A, Cokic I, Tang RLQ, Yang H-J, Sharif B, Marbán E, Li D, Berman DS, Dharmakumar R. Determination of location, size, and transmurality of chronic myocardial infarction without exogenous contrast media by using cardiac magnetic resonance imaging at 3 T. Circ. Cardiovasc. Imaging 2014;7:471–81.
10. Kali A, Cokic I, Tang R, Yang H-J, Sharif B, Marbán E, Li D, Berman DS, Dharmakumar R. Contrast-free T1 mapping at 3T can characterize chronic myocardial infarctions with high diagnostic accuracy. J. Cardiovasc. Magn. Reson. 2014;16:P205.
11. Van Oorschot JW, El Aidi H, Jansen Of Lorkeers SJ, et al. Endogenous assessment of chronic myocardial infarction with T1ρ-mapping in patients. J. Cardiovasc. Magn. Reson. 2014;16:104.
12. Witschey WR, Zsido G a, Koomalsingh K, et al. In vivo chronic myocardial infarction characterization by spin locked cardiovascular magnetic resonance. J. Cardiovasc. Magn. Reson. 2012;14:37.
13. Spiewak M, Malek L a., Misko J, Chojnowska L, Milosz B, Klopotowski M, Petryka J, Dabrowski M, Kepka C, Ruzyllo W. Comparison of different quantification methods of late gadolinium enhancement in patients with hypertrophic cardiomyopathy. Eur. J. Radiol. 2010;74:e149–e153.
14. Schulz-Menger J. Myocardial edema in acute ischemic injury. JACC Cardiovasc. Imaging 2011;4:279–281.
15. Xia R, Lu X, Zhang B, Wang Y, Liao J, Zheng J, Gao F. Early reperfusion can reduce infarction size but not salvaged myocardial size in acute myocardial infarction rats. JACC Cardiovasc. Imaging 2015;8:616–617.

142
16. Nguyen CT, Lu M, Bi X, Kellman P, Li D, Zhao S. In vivo diffusion-weighted MRI detection of myocardial fibrosis in hypertrophic cardiomyopathy patients. J. Cardiovasc. Magn. Reson. 2015;17:P34.
17. Abdullah OM, Drakos SG, Diakos N a, et al. Characterization of diffuse fibrosis in the failing human heart via diffusion tensor imaging and quantitative histological validation. NMR Biomed. 2014;27:1378–86.
18. Wu MT, Tseng WY, Su MY, Liu CP, Chiou KR, Wedeen VJ, Reese TG, Yang CF. Diffusion tensor magnetic resonance imaging mapping the fiber architecture remodeling in human myocardium after infarction: correlation with viability and wall motion. Circulation 2006;114:1036–1045.
19. Pop M, Ghugre NR, Ramanan V, Morikawa L, Stanisz G, Dick AJ, Wright G a. Quantification of fibrosis in infarcted swine hearts by ex vivo late gadolinium-enhancement and diffusion-weighted MRI methods. Phys. Med. Biol. 2013;58:5009–28.
20. Edelman RR, Gaa J, Wedeen VJ, Loh E, Hare JM, Prasad P, Li W. In vivo measurement of water diffusion in the human heart. Magn Reson Med 1994;32:423–428.
21. Stejskal EO, Tanner JE. Spin diffusion measurements: spin echoes in the presence of a time-dependant field gradient. J. Chem. Phys. 1965;42:5.
22. Scollan DF, Holmes A, Winslow R, Forder J. Histological validation of myocardial microstructure obtained from diffusion tensor magnetic resonance imaging. Am J Physiol 1998;275:H2308–18.
23. Sosnovik DE, Mekkaoui C, Huang S, et al. Microstructural impact of ischemia and bone marrow-derived cell therapy revealed with diffusion tensor magnetic resonance imaging tractography of the heart in vivo. Circulation 2014;129:1731–1741.
24. Hsu EW, Muzikant AL, Matulevicius SA, Penland RC, Henriquez CS. Magnetic resonance myocardial fiber-orientation mapping with direct histological correlation. Am J Physiol 1998;274:H1627–34.
25. Kung GL, Nguyen TC, Itoh A, Skare S, Ingels Jr. NB, Miller DC, Ennis DB. The presence of two local myocardial sheet populations confirmed by diffusion tensor MRI and histological validation. J Magn Reson Imaging 2011;34:1080–1091.
26. Geerts L, Bovendeerd P, Nicolay K, Arts T. Characterization of the normal cardiac myofiber field in goat measured with MR-diffusion tensor imaging. Am J Physiol Hear. Circ Physiol 2002;283:H139–45.
27. Li W, Lu M, Banerjee S, Zhong J, Ye A, Molter J, Yu X. Ex vivo diffusion tensor MRI reflects microscopic structural remodeling associated with aging and disease progression in normal and cardiomyopathic Syrian hamsters. NMR Biomed. 2009;22:819–25.
28. Helm P a., Younes L, Beg MF, Ennis DB, Leclercq C, Faris OP, McVeigh E, Kass D, Miller MI, Winslow RL. Evidence of structural remodeling in the dyssynchronous failing heart. Circ. Res. 2006;98:125–132.
29. McGill LA, Ismail TF, Nielles-Vallespin S, et al. Reproducibility of in-vivo diffusion tensor cardiovascular magnetic resonance in hypertrophic cardiomyopathy. J Cardiovasc Magn Reson 2012;14:86.
30. Ferreira P, Kilner PJ, McGill L-A, et al. In vivo cardiovascular magnetic resonance diffusion tensor imaging shows evidence of abnormal myocardial laminar orientations and mobility in hypertrophic cardiomyopathy. J. Cardiovasc. Magn. Reson. 2014;16:P338.
31. Wu M-T, Su M-YM, Huang Y-L, Chiou K-R, Yang P, Pan H-B, Reese TG, Wedeen VJ, Tseng W-YI. Sequential changes of myocardial microstructure in patients postmyocardial infarction by diffusion-

143
tensor cardiac MR: correlation with left ventricular structure and function. Circ. Cardiovasc. Imaging 2009;2:32–40, 6 p following 40.
32. Wu Y, Tse HF, Wu EX. Diffusion tensor MRI study of myocardium structural remodeling after infarction in porcine model. Conf Proc IEEE Eng Med Biol Soc 2006;1:1069–1072.
33. Gamper U, Boesiger P, Kozerke S. Diffusion imaging of the in vivo heart using spin echoes--considerations on bulk motion sensitivity. Magn Reson Med 2007;57:331–337.
34. Stoeck CT, von Deuster C, Genet M, Atkinson D, Kozerke S. Second Order Motion Compensated Spin-Echo Diffusion Tensor Imaging of the Human Heart. Magn Reson Med 2015. doi: 10.1002/mrm.25784.
35. Welsh C, Di Bella E, Hsu E. Higher-Order Motion-Compensation for In Vivo Cardiac Diffusion Tensor Imaging in Rats. IEEE Trans Med Imaging 2015. doi: 10.1109/TMI.2015.2411571.
36. Nguyen C, Fan Z, Sharif B, He Y, Dharmakumar R, Berman DS, Li D. In vivo three-dimensional high resolution cardiac diffusion-weighted MRI: A motion compensated diffusion-prepared balanced steady-state free precession approach. Magn. Reson. Med. 2014;72:1257–1267.
37. Nielles-Vallespin S, Mekkaoui C, Gatehouse P, Reese TG, Keegan J, Ferreira PF, Collins S, Speier P, Feiweier T, Silva R. In vivo diffusion tensor MRI of the human heart: Reproducibility of breath-hold and navigator-based approaches. Magn. Reson. Med. 2013;70:454–465.
38. Stoeck CT, Kalinowska A, von Deuster C, et al. Dual-phase cardiac diffusion tensor imaging with strain correction. PLoS One 2014;9:e107159.
39. Tseng WY, Reese TG, Weisskoff RM, Wedeen VJ. Cardiac diffusion tensor MRI in vivo without strain correction. Magn Reson Med 1999;42:393–403.
40. Pai VM, Rapacchi S, Kellman P, Croisille P, Wen H. PCATMIP: enhancing signal intensity in diffusion-weighted magnetic resonance imaging. Magn Reson Med 2011;65:1611–1619.
41. Le Bihan D. Diffusion and Perfusion Magnetic Resonance Imaging. Raven Press; 1995.
42. Anderson RH, Ho SY, Redmann K, Sanchez-Quintana D, Lunkenheimer PP. The anatomical arrangement of the myocardial cells making up the ventricular mass. Eur. J. Cardio-Thoracic Surg. 2005;28:517–525.
43. Sonnenblick EH, Ross J, Covell JW, Spotnitz HM, Spiro D. The Ultrastructure of the Heart in Systole and Diastole. Changes In Sarcomere Length. Circ. Res. 1967;21:423–431.
44. Spotnitz HM, Spotnitz WD, Cottrell TS, Spiro D, Sonnenblick EH. Cellular basis for volume related wall thickness changes in the rat left ventricle. J Mol Cell Cardiol 1974;6:317–331.
45. Greenbaum RA, Ho SY, Gibson DG, Becker AE, Anderson RH. Left ventricular fibre architecture in man. Br Hear. J 1981;45:248–263.
46. Streeter Jr. DD, Spotnitz HM, Patel DP, Ross Jr. J, Sonnenblick EH. Fiber orientation in the canine left ventricle during diastole and systole. Circ Res 1969;24:339–347.
47. Mekkaoui C, Huang S, Chen HH, et al. Fiber architecture in remodeled myocardium revealed with a quantitative diffusion CMR tractography framework and histological validation. J Cardiovasc Magn Reson 2012;14:70.

144
48. Sosnovik DE, Wang R, Dai G, Wang T, Aikawa E, Novikov M, Rosenzweig A, Gilbert RJ, Wedeen VJ. Diffusion spectrum MRI tractography reveals the presence of a complex network of residual myofibers in infarcted myocardium. Circ. Cardiovasc. Imaging 2009;2:206–12.
49. Tseng WY, Wedeen VJ, Reese TG, Smith RN, Halpern EF. Diffusion tensor MRI of myocardial fibers and sheets: correspondence with visible cut-face texture. J Magn Reson Imaging 2003;17:31–42.
50. Strijkers GJ, Bouts A, Blankesteijn WM, Peeters THJM, Vilanova A, van Prooijen MC, Sanders HMHF, Heijman E, Nicolay K. Diffusion tensor imaging of left ventricular remodeling in response to myocardial infarction in the mouse. NMR Biomed. 2009;22:182–90.
51. Chen J, Song SK, Liu W, McLean M, Allen JS, Tan J, Wickline SA, Yu X. Remodeling of cardiac fiber structure after infarction in rats quantified with diffusion tensor MRI. Am J Physiol Hear. Circ Physiol 2003;285:H946–54.
52. Holmes JW, Takayama Y, LeGrice I, Covell JW. Depressed regional deformation near anterior papillary muscle. Am J Physiol 1995;269:H262–70.
53. Smerup M, Agger P, Nielsen EA, Ringgaard S, Pedersen M, Niederer P, Anderson RH, Lunkenheimer PP. Regional and epi- to endocardial differences in transmural angles of left ventricular cardiomyocytes measured in ex vivo pig hearts: functional implications. Anat Rec 2013;296:1724–1734.
54. Wu EX, Wu Y, Nicholls JM, Wang J, Liao S, Zhu S, Lau CP, Tse HF. MR diffusion tensor imaging study of postinfarct myocardium structural remodeling in a porcine model. Magn Reson Med 2007;58:687–695.
55. Lombaert H, Peyrat JM, Croisille P, Rapacchi S, Fanton L, Cheriet F, Clarysse P, Magnin I, Delingette H, Ayache N. Human atlas of the cardiac fiber architecture: study on a healthy population. IEEE Trans Med Imaging 2012;31:1436–1447.
56. Wei H, Viallon M, Delattre B, Moulin K, Yang F, Croisille P, Zhu Y. Free-Breathing Diffusion Tensor Imaging and Tractography of the Human Heart in Healthy Volunteers Using Wavelet-Based Image Fusion. IEEE Trans Med Imaging 2015;34:306–316.
57. Tezuka F. Muscle fiber orientation in normal and hypertrophied hearts. Tohoku J. Exp. Med. 1975;948025:289–297.
58. Lombaert H, Peyrat JM. Joint statistics on cardiac shape and fiber architecture. Med Image Comput Comput Assist Interv 2013;16:492–500.
59. Helm P, Beg MF, Miller MI, Winslow RL. Measuring and mapping cardiac fiber and laminar architecture using diffusion tensor MR imaging. Ann N Y Acad Sci 2005;1047:296–307.
60. Gerdes AM, Moore JA, Hines JM, Kirkland PA, Bishop SP. Regional differences in myocyte size in normal rat heart. Anat Rec 1986;215:420–426.
61. LeGrice IJ, Smaill BH, Chai LZ, Edgar SG, Gavin JB, Hunter PJ. Laminar structure of the heart: ventricular myocyte arrangement and connective tissue architecture in the dog. Am J Physiol 1995;269:H571–82.
62. Hales PW, Schneider JE, Burton RA, Wright BJ, Bollensdorff C, Kohl P. Histo-anatomical structure of the living isolated rat heart in two contraction states assessed by diffusion tensor MRI. Prog Biophys Mol Biol 2012;110:319–330.
63. Pope AJ, Sands GB, Smaill BH, LeGrice IJ. Three-dimensional transmural organization of perimysial collagen in the heart. Am J Physiol Hear. Circ Physiol 2008;295:H1243–H1252.

145
64. Gilbert SH, Benson AP, Li P, V. Holden A. Visualisation of Dog Myocardial Structure from Diffusion Tensor Magnetic Resonance Imaging: The Paradox of Uniformity and Variability. FIMH 2007 2007:403–412.
65. Harrington KB, Rodriguez F, Cheng A, Langer F, Ashikaga H, Daughters GT, Criscione JC, Ingels NB, Miller DC. Direct measurement of transmural laminar architecture in the anterolateral wall of the ovine left ventricle: new implications for wall thickening mechanics. Am. J. Physiol. Heart Circ. Physiol. 2005;288:H1324–30.
66. Helm PA, Tseng H, Younes L, McVeigh ER, Winslow RL. Ex vivo 3D diffusion tensor imaging and quantification of cardiac laminar structure. Magn. Reson. Med. 2005;54:850–859.
67. Mekkaoui C, Porayette P, Jackowski MP, Kostis WJ, Dai G, Sanders S, Sosnovik DE. Diffusion MRI tractography of the developing human fetal heart. PLoS One 2013;8:e72795.
68. Tobita K, Garrison JB, Liu LJ, Tinney JP, Keller BB. Three-dimensional myofiber architecture of the embryonic left ventricle during normal development and altered mechanical loads. Anat. Rec. - Part A Discov. Mol. Cell. Evol. Biol. 2005;283:193–201.
69. Jeung M-Y, Germain P, Croisille P, Ghannudi S El, Roy C, Gangi A. Myocardial Tagging with MR Imaging: Overview of Normal and Pathologic Findings. RadioGraphics 2012;32:1381–1398.
70. Pflugfelder PW, Higgins B. Systolic Wall Thickening Was 43% ± 31%.
71. Sandstede J, Lipke C, Beer M, Hofmann S, Pabst T, Kenn W, Neubauer S, Hahn D. Age- and gender-specific differences in left and right ventricular cardiac function and mass determined by cine magnetic resonance imaging. Eur. Radiol. 2000;10:438–442. doi: 10.1007/s003300050072.
72. LeGrice IJ, Takayama Y, Covell JW. Transverse shear along myocardial cleavage planes provides a mechanism for normal systolic wall thickening. Circ Res 1995;77:182–193.
73. Dou J, Tseng WYI, Reese TG, Wedeen VJ. Combined diffusion and strain MRI reveals structure and function of human myocardial laminar sheets in vivo. Magn. Reson. Med. 2003;50:107–113.
74. Cheng YJ, Lang D, Caruthers SD, Efimov IR, Chen J, Wickline SA. Focal but reversible diastolic sheet dysfunction reflects regional calcium mishandling in dystrophic mdx mouse hearts. Am J Physiol Hear. Circ Physiol 2012;303:H559–68.
75. Stuber M, Scheidegger M, Fischer SE, Nagel E, Steinemann F, Hess O, Boesiger P. Alterations in the local myocardial motion pattern in patients suffering from pressure overload due to aortic stenosis. Circ Res 1999;100:361–8.
76. Smerup M, Partridge J, Agger P, Ringgaard S, Pedersen M, Petersen S, Hasenkam JM, Niederer P, Lunkenheimer PP, Anderson RH. A mathematical model of the mechanical link between shortening of the cardiomyocytes and systolic deformation of the left ventricular myocardium. Technol. Heal. Care 2013;21:63–79.
77. Taber L a., Yang M, Podszus WW. Mechanics of ventricular torsion. J. Biomech. 1996;29:745–752.
78. Maceiraa A, Prasada S, Khanb M, Pennella D. Normalized Left Ventricular Systolic and Diastolic Function by Steady State Free Precession Cardiovascular Magnetic Resonance. J. Cardiovasc. Magn. Reson. 2006;8:417–426.
79. Dou J, Reese TG, Tseng WY, Wedeen VJ. Cardiac diffusion MRI without motion effects. Magn Reson Med 2002;48:105–114.

146
80. Chen J, Liu W, Zhang H. Regional ventricular wall thickening reflects changes in cardiac fiber and sheet structure during contraction: quantification with diffusion tensor MRI. Am. J. Physiol. Hear. Circ. Physiol. 2005;289:1898–1907.
81. McGill L-A, Ferreira P, Scott AD, Nielles-Vallespin S, Silva R, Kilner PJ, Firmin D, Pennell D. Comparison of cardiac DTI parameters between systole and diastole. J. Cardiovasc. Magn. Reson. 2014;16:P39.
82. Ashikaga H, Criscione JC, Omens JH, Covell JW, Ingels NB. Transmural left ventricular mechanics underlying torsional recoil during relaxation. Am. J. Physiol. Heart Circ. Physiol. 2004;286:H640–7. doi: 10.1152/ajpheart.00575.2003.
83. Sano T, Takayama N, Shimamoto T. Directional difference of conduction velocity in the cardiac ventricular syncytium studied by microelectrodes. Circ Res 1959;7:262–267.
84. Mekkaoui C, Jackowski MP, Stoeck CT, Thiagalingam A, Kostis WJ, Ruskin JN, Reese TG, Kozerke S, Sosnovik DE. Detection of Infarcted and Arrhythmogenic Myocardium with DTI Tractography and Electroanatomical Voltage Mapping. 2014;22:2014.
85. Kanzaki H, Nakatani S, Yamada N, Urayama SI, Miyatake K, Kitakaze M. Impaired Systolic torsion in dilated cardiomyopathy: Reversal of apical rotation at mid-systole characterized with magnetic resonance tagging method. Basic Res. Cardiol. 2006;101:465–470.
86. Kar J, Knutsen AK, Cupps BP, Zhong X, Pasque MK. Three-dimensional regional strain computation method with displacement encoding with stimulated echoes (DENSE) in non-ischemic, non-valvular dilated cardiomyopathy patients and healthy subjects validated by tagged MRI. J. Magn. Reson. Imaging 2014;396:112804.
87. Tseng WY, Dou J, Reese TG, Wedeen VJ. Imaging myocardial fiber disarray and intramural strain hypokinesis in hypertrophic cardiomyopathy with MRI. J Magn Reson Imaging 2006;23:1–8.
88. Gilbert SH, Benson AP, Li P, Holden A V. Regional localisation of left ventricular sheet structure: integration with current models of cardiac fibre, sheet and band structure. Eur. J. Cardiothorac. Surg. 2007;32:231–49.
89. Torrent-Guasp F, Ballester M, Buckberg GD, Carreras F, Flotats A, Carrió I, Ferreira A, Samuels LE, Narula J. Spatial orientation of the ventricular muscle band: Physiologic contribution and surgical implications. J. Thorac. Cardiovasc. Surg. 2001;122:389–392.
90. Dorri F, Niederer PF, Lunkenheimer PP, Anderson RH. The architecture of the left ventricular myocytes relative to left ventricular systolic function. Eur. J. Cardiothorac. Surg. 2010;37:384–92.
91. Fick A. Ueber Diffusion. Ann. Phys. 1855;170:59–86.
92. Einstein A. Ueber die von der molekularkinetischen Theorie der Wärme geforderte Bewegung von in ruhenden Flüssigkeiten suspendierten Teilchen. Ann. Phys. 1905;322:549–560.
93. Carr HY, Purcell EM. Effects of diffusion on free precession in nuclear magnetic resonance experiments. Phys. Rev. 1954;94:630–638.
94. Bloch F. Nuclear induction. Phys. Rev. 1946;70:460–474.
95. Torrey H. Bloch Equations with Diffusion Terms. Phys. Rev. 1956;104:563–565.
96. Basser PJ. Inferring microstructural features and the physiological state of tissues from diffusion-weighted images. NMR Biomed 1995;8:333–344.
147
97. Jones DK, Horsfield MA, Simmons A. Optimal strategies for measuring diffusion in anisotropic systems by magnetic resonance imaging. Magn Reson Med 1999;42:515–525.
98. Skare S, Hedehus M, Moseley ME, Li TQ. Condition number as a measure of noise performance of diffusion tensor data acquisition schemes with MRI. J. Magn. Reson. 2000;147:340–52.
99. Papadakis N, Xing D, Huang C, Hall L, Carpenter T. A Comparative Study of Acquisition Schemes for Diffusion Tensor Imaging Using MRI. J. Magn. Reson. 1999;137:67–82.
100. Batchelor PG, Atkinson D, Hill DLG, Calamante F, Connelly A. Anisotropic noise propagation in diffusion tensor MRI sampling schemes. Magn. Reson. Med. 2003;49:1143–1151.
101. Ennis DB, Kindlman G, Rodriguez I, Helm PA, McVeigh ER. Visualization of tensor fields using superquadric glyphs. Magn Reson Med 2005;53:169–176.
102. Wedeen VJ, Hagmann P, Tseng W-YI, Reese TG, Weisskoff RM. Mapping complex tissue architecture with diffusion spectrum magnetic resonance imaging. Magn. Reson. Med. 2005;54:1377–1386.
103. Callaghan PT, Eccles CD, Xia Y. NMR microscopy of dynamic displacements: k-space and q-space imaging. J. Phys. E. 2000;21:820–822.
104. Tuch DS, Reese TG, Wiegell MR, Wedeen VJ. Diffusion MRI of Complex Neural Architecture. Neuron 2003;40:885–895.
105. Tuch DS. Q-ball imaging. Magn. Reson. Med. 2004;52:1358–1372.
106. Tournier J-D, Calamante F, Gadian DG, Connelly A. Direct estimation of the fiber orientation density function from diffusion-weighted MRI data using spherical deconvolution. Neuroimage 2004;23:1176–1185.
107. Inglis B a., Bossart EL, Buckley DL, Wirth ED, Mareci TH. Visualization of neural tissue water compartments using biexponential diffusion tensor MRI. Magn. Reson. Med. 2001;45:580–587.
108. Tuch DS, Reese TG, Wiegell MR, Makris N, Belliveau JW, Wedeen VJ. High angular resolution diffusion imaging reveals intravoxel white matter fiber heterogeneity. Magn. Reson. Med. 2002;48:577–582.
109. De Santis S, Assaf Y, Evans CJ, Jones DK. Improved precision in CHARMED assessment of white matter through sampling scheme optimization and model parsimony testing. Magn. Reson. Med. 2014;71:661–671.
110. Assaf Y, Basser PJ. Composite hindered and restricted model of diffusion (CHARMED) MR imaging of the human brain. Neuroimage 2005;27:48–58.
111. Jensen JH, Helpern J a., Ramani A, Lu H, Kaczynski K. Diffusional kurtosis imaging: The quantification of non-gaussian water diffusion by means of magnetic resonance imaging. Magn. Reson. Med. 2005;53:1432–1440.
112. Jensen JH, Chandra R. Weak-Diffusion Theory of NMR Signal in Magnetically Heterogeneous Media. J. Magn. Reson. 1997;126:193–199.
113. Menzel MI, Tan ET, Khare K, Sperl JI, King KF, Tao X, Hardy CJ, Marinelli L. Accelerated diffusion spectrum imaging in the human brain using compressed sensing. Magn Reson Med 2011;66:1226–1233.

148
114. Mazzoli V, Froeling M, Nederveen AJ, Nicolay K, Strijkers GJ. Cardiac diffusion MRI beyond DTI. In: 22nd Annual Meeting of ISMRM. Milan, Italy; 2014. p. 2560.
115. Le Bihan D, Breton E, Lallemand D, Aubin ML, Vignaud J, Laval-Jeantet M. Separation of diffusion and perfusion in intravoxel incoherent motion MR imaging. Radiology 1988;168:497–505.
116. Le Bihan D. Diffusion and IVIM. Radiology 1988:566–567.
117. Le Bihan D. Diffusion, confusion and functional MRI. Neuroimage 2012;62:1131–1136.
118. Lemke A, Laun FB, Simon D, Stieltjes B, Schad LR. An in vivo verification of the intravoxel incoherent motion effect in diffusion-weighted imaging of the abdomen. Magn. Reson. Med. 2010;64:1580–1585.
119. Moulin K, Croisille P, Feiweier T, Delattre BM a, Wei H, Robert B, Beuf O, Viallon M. In-vivo free-breathing DTI & IVIM of the whole human heart using a real-time slice-followed SE-EPI navigator-based sequence : a reproducibility study in healthy volunteers. Magn Reson Med 2015. doi: 10.1002/mrm.25852.
120. Delattre BM, Viallon M, Wei H, Zhu YM, Feiweier T, Pai VM, Wen H, Croisille P. In vivo cardiac diffusion-weighted magnetic resonance imaging: quantification of normal perfusion and diffusion coefficients with intravoxel incoherent motion imaging. Invest Radiol 2012;47:662–670.
121. Schar M, Kozerke S, Fischer SE, Boesiger P. Cardiac SSFP imaging at 3 Tesla. Magn Reson Med 2004;51:799–806.
122. Jezzard P, Balaban RS. Correction for geometric distortion in echo planar images from B0 field variations. Magn. Reson. Med. 1995;34:65–73.
123. Sutton BP, Noll DC, Fessler J a. Fast, iterative image reconstruction for MRI in the presence of field inhomogeneities. IEEE Trans Med Imagingaging 2003;22:178–188.
124. Harmer J., Chan RW, Stoeck C. ., v. Deuster C, Atkinson D, Kozerke S. Correction of Off-resonance Distortions in In-vivo Cardiac Diffusion Tensor Imaging. In: ISMRM, 2014; Milan, Italy. ; 2014.
125. Pruessmann KP, Weiger M, Scheidegger MB, Boesiger P. SENSE: Sensitivity encoding for fast MRI. Magn. Reson. Med. 1999;42:952–962.
126. Griswold M a., Jakob PM, Heidemann RM, Nittka M, Jellus V, Wang J, Kiefer B, Haase A. Generalized autocalibrating partially parallel acquisitions (GRAPPA). Magn. Reson. Med. 2002;47:1202–1210.
127. Miller KL, Pauly JM. Nonlinear phase correction for navigated diffusion imaging. Magn. Reson. Med. 2003;50:343–353.
128. Chen NK, Guidon A, Chang HC, Song AW. A robust multi-shot scan strategy for high-resolution diffusion weighted MRI enabled by multiplexed sensitivity-encoding (MUSE). Neuroimage 2013;72:41–47.
129. Chan RW, von Deuster C, Giese D, Stoeck CT, Harmer J, Aitken AP, Atkinson D, Kozerke S. Characterization and correction of eddy-current artifacts in unipolar and bipolar diffusion sequences using magnetic field monitoring. J Magn Reson 2014;244:74–84.
130. Mansfield P, Chapman B. Active magnetic screening of coils for static and time-dependent magnetic field generation in NMR imaging. J. Phys. E. 2000;19:540–545.

149
131. Boesch C, Gruetter R, Martin E. Temporal and spatial analysis of fields generated by eddy currents in superconducting magnets: optimization of corrections and quantitative characterization of magnet/gradient systems. Magn. Reson. Med. 1991;20:268–84.
132. Reese TG, Heid O, Weisskoff RM, Wedeen VJ. Reduction of eddy‐current‐induced distortion in diffusion MRI using a twice‐refocused spin echo. Magn. Reson. Med. 2003;49:177–182.
133. Rapacchi S, Wen H, Viallon M, Grenier D, Kellman P, Croisille P, Pai VM. Low b-value diffusion-weighted cardiac magnetic resonance imaging: initial results in humans using an optimal time-window imaging approach. Invest Radiol 2011;46:751–758.
134. Barmet C, De Zanche N, Pruessmann KP. Spatiotemporal magnetic field monitoring for MR. Magn. Reson. Med. 2008;60:187–197.
135. Wilm BJ, Barmet C, Pavan M, Pruessmann KP. Higher order reconstruction for MRI in the presence of spatiotemporal field perturbations. Magn. Reson. Med. 2011;65:1690–1701.
136. Giese D, Haeberlin M, Barmet C, Pruessmann KP, Schaeffter T, Kozerke S. Analysis and correction of background velocity offsets in phase-contrast flow measurements using magnetic field monitoring. Magn. Reson. Med. 2012;67:1294–1302.
137. Bernstein M a., Zhou XJ, Polzin J a., King KF, Ganin A, Pelc NJ, Glover GH. Concomitant gradient terms in phase contrast MR: Analysis and correction. Magn. Reson. Med. 1998;39:300–308.
138. King KF, Ganin A, Zhou XJ, Bernstein M a. Concomitant gradient field effects in spiral scans. Magn. Reson. Med. 1999;41:103–112.
139. Bernstein M, King K, Zhou X. Handbook of MRI Pulse Sequences. 2004.
140. Stoeck CT, von Deuster C, Toussaint N, Kozerke S. High-resolution single-shot DTI of the in-vivo human heart using asymmetric diffusion encoding. In: 21st Annual Meeting of ISMRM. Salt Lake City, Utah, USA; 2013. p. 480.
141. Meyer CH, Pauly JM, Macovski A, Nishimura DG. Simultaneous spatial and spectral selective excitation. Magn. Reson. Med. 1990;15:287–304.
142. Montant P, Sigovan M, Revel D, Douek P. MR imaging assessment of myocardial edema with T2 mapping. Diagn Interv Imaging 2015.
143. Germain P, El Ghannudi S, Jeung MY, Ohlmann P, Epailly E, Roy C, Gangi A. Native T1 mapping of the heart - a pictorial review. Clin Med Insights Cardiol 2014;8:1–11.
144. Cheng HM, Marie P. 3D Myocardial T 1 Mapping at 3T Using Variable Flip Angle Method : Pilot Study. 2014;829:823–829.
145. Ding H, Fernandez-de-Manuel L, Schär M, Schuleri KH, Halperin H, He L, Muz Zviman M, Beinart R, Herzka D a. Three-dimensional whole-heart T2 mapping at 3T. Magn. Reson. Med. 2014;00:1–14.
146. Von Deuster C, Stoeck CT, Genet M, Atkinson D, Kozerke S. Spin echo versus stimulated echo diffusion tensor imaging of the in vivo human heart. Magn. Reson. Med. 2015;00:n/a–n/a. doi: 10.1002/mrm.25998.
147. Klein S, Staring M, Murphy K, Viergever M a, Pluim JPW. Elastix: a Toolbox for Intensity-Based Medical Image Registration. IEEE Trans. Med. Imaging 2010;29:196–205.

150
148. Moore CC, Lugo-Olivieri CH, McVeigh ER, Zerhouni E a. Three-dimensional systolic strain patterns in the normal human left ventricle: characterization with tagged MR imaging. Radiology 2000;214:453–66. doi: 10.1148/radiology.214.2.r00fe17453.
149. Kuijer JPA, Marcus JT, Götte MJW, van Rossum AC, Heethaar RM. Three-Dimensional Myocardial Strains at End-Systole and During Diastole in the Left Ventricle of Normal Humans. J. Cardiovasc. Magn. Reson. 2002;4:341–351.
150. Littmann L, Symanski J. Hemodynamic implications of left bundle branch block. Res. Technol. Transf. Comput. Electrocardiol. 2000;33:115–121.
151. Ennis DB, Epstein FH, Kellman P, Fananapazir L, McVeigh ER, Arai AE. Assessment of regional systolic and diastolic dysfunction in familial hypertrophic cardiomyopathy using MR tagging. Magn. Reson. Med. 2003;50:638–642. doi: 10.1002/mrm.10543.
152. Young A a., Dokos S, Powell K a., Sturm B, McCulloch AD, Starling RC, McCarthy PM, White RD. Regional heterogeneity of function in nonischemic dilated cardiomyopathy. Cardiovasc. Res. 2001;49:308–318. doi: 10.1016/S0008-6363(00)00248-0.
153. McKay R, Pfeffer M, Pasternak R, Markis J, Come PC, Nakao S, Alderman JD, Ferguson JJ, Safian RD, Grossmann W. Left ventricular remodeling after myocardial infarction : a corollary to infarct expansion. Circulation 1986;74:693–702. doi: 10.1161/01.CIR.74.4.693.
154. Toussaint N, Stoeck CT, Schaeffter T, Kozerke S, Sermesant M, Batchelor PG. In vivo human cardiac fibre architecture estimation using shape-based diffusion tensor processing. Med. Image Anal. 2013;17:1243–55.
155. Froeling M, Strijkers GJ, Nederveen AJ, Chamuleau S a, Luijten PR. Feasibility of in vivo whole heart DTI and IVIM with a 15 minute acquisition protocol. J. Cardiovasc. Magn. Reson. 2014;16:O15.
156. Wedeen VJ, Weisskoff RM, Poncelet BP. MRI signal void due to in-plane motion is all-or-none. Magn. Reson. Med. 1994;32:116–120.
157. Scott AD, Nielles-Vallespin S, Pennell DJ, Firmin D. Improving the accuracy of cardiac DTI by averaging the complex data. In: 18th Annual SCMR Scientific Sessions. Nice, France; 2015.
158. Toussaint N, Sermesant M, Stoeck CT, Kozerke S, Batchelor PG. In vivo human 3D cardiac fibre architecture: reconstruction using curvilinear interpolation of diffusion tensor images. Med Image Comput Comput Assist Interv 2010;13:418–425.
159. Scott AD, Ferreira PF, Nielles S, Gatehouse P, McGill LA, Kilner P, Pennell DJ, Firmin DN. Optimal diffusion weighting for in vivo cardiac diffusion tensor imaging. Magn Reson Med 2014.
160. McGill L a., Ferreira PF, Scott AD, Nielles-Vallespin S, Giannakidis A, Kilner PJ, Gatehouse PD, de Silva R, Firmin DN, Pennell DJ. Relationship between cardiac diffusion tensor imaging parameters and anthropometrics in healthy volunteers. J. Cardiovasc. Magn. Reson. 2015;18:2.
161. Froeling M, Strijkers G, Nederveen AJ, Chamuleau SA, Luijten PR. Diffusion Tensor MRI of the Heart – In Vivo Imaging of Myocardial Fiber Architecture. Curr. Cardiovasc. Imaging Rep. 2014;7:9276:1–11.
162. Reese TG, Weisskoff RM, Smith RN, Rosen BR, Dinsmore RE, Wedeen VJ. Imaging myocardial fiber architecture in vivo with magnetic resonance. Magn Reson Med 1995;34:786–791.
163. Reese TG, Wedeen VJ, Weisskoff RM. Measuring Diffusion in the Presence of Material Strain. J. Magn. Reson. Ser. B 1996;112:253–258.
151
164. Cory DG, Garroway a. N. Measurement of translational displacement probabilities by NMR: An indicator of compartmentation. Magn. Reson. Med. 1990;14:435–444.
165. Tseng WY, Reese TG, Weisskoff RM, Brady TJ, Wedeen VJ. Myocardial fiber shortening in humans: initial results of MR imaging. Radiology 2000;216:128–139.
166. Hess AT, Zhong X, Spottiswoode BS, Epstein FH, Meintjes EM. Myocardial 3D strain calculation by combining cine displacement encoding with stimulated echoes (DENSE) and cine strain encoding (SENC) imaging. Magn Reson Med 2009;62:77–84.
167. Wang H, Stoeck C, Kozerke S, Amini A. Analysis of 3D cardiac deformations with 3D SinMod. IEEE EMBS 2013:4386–4389.
168. Lam F, Babacan SD, Haldar JP, Weiner MW, Schuff N, Liang ZP. Denoising diffusion-weighted magnitude MR images using rank and edge constraints. Magn Reson Med 2013. doi: 10.1002/mrm.24728.
169. Myronenko A, Song X. Point set registration: coherent point drift. IEEE Trans Pattern Anal Mach Intell 2010;32:2262–2275.
170. Tseng WI, Reese TG, Weisskoff RM, Wedeen VJ. Cardiac diffusion tensor MRI in vivo without strain correction. Magn. Reson. Med. 1999;42:393–403.
171. Vadakkumpadan F, Arevalo H, Ceritoglu C, Miller M, Trayanova N. Image-based estimation of ventricular fiber orientations for personalized modeling of cardiac electrophysiology. IEEE Trans Med Imaging 2012;31:1051–1060.
172. Lee LC, Genet M, Dang AB, Ge L, Guccione JM, Ratcliffe MB. Applications of computational modeling in cardiac surgery. J. Card. Surg. 2014;29:293–302.
173. Genet M, Lee LC, Nguyen R, Haraldsson H, Acevedo-Bolton G, Zhang Z, Ge L, Ordovas K, Kozerke S, Guccione JM. Distribution of normal human left ventricular myofiber stress at end diastole and end systole: a target for in silico design of heart failure treatments. J. Appl. Physiol. 2014;117:142–52.
174. Young AA, Legrice IJ, Young MA, Smaill BH. Extended confocal microscopy of myocardial laminae and collagen network. J Microsc 1998;192:139–150.
175. Costa KD, Takayama Y, McCulloch AD, Covell JW. Laminar fiber architecture and three-dimensional systolic mechanics in canine ventricular myocardium. Am J Physiol 1999;276:H595–607.
176. Schmid P, Jaermann T, Boesiger P, Niederer PF, Lunkenheimer PP, Cryer CW, Anderson RH. Ventricular myocardial architecture as visualised in postmortem swine hearts using magnetic resonance diffusion tensor imaging. Eur. J. cardio-thoracic Surg. 2005;27:468–472.
177. Wei H, Viallon M, Delattre BM, Wang L, Pai VM, Wen H, Xue H, Guetter C, Croisille P, Zhu Y. Assessment of cardiac motion effects on the fiber architecture of the human heart in vivo. IEEE Trans Med Imaging 2013;32:1928–1938.
178. Stoeck CT, Toussaint N, Boesiger P, Batchelor PG, Kozerke S. Sequence timing optimization in multi-slice diffusion tensor imaging of the beating heart . In: 19th Annual Meeting of ISMRM. Montréal, Canada; 2011. p. 282.
179. Nakamura T, Shibukawa S, Muro I, Kajihara N, Nishio H, Ogini T, Niwa T, Imai Y. Improvement of visualization of cardiac wall in diffusion-weighted imaging using cardiac triggering and acceleration motion correction. In: 22nd Annual Meeting of ISMRM. Milan, Italy; 2014. p. 2417.

152
180. Nguyen C, Fan Z, Xie Y, Dawkins J, Tseliou E, Bi X, Sharif B, Dharmakumar R, Marbán E, Li D. In vivo contrast free chronic myocardial infarction characterization using diffusion-weighted cardiovascular magnetic resonance. J. Cardiovasc. Magn. Reson. 2014;16:1–10.
181. Cuppen JJM. RLSQ: T1, T2, and ρ calculations, combining ratios and least squares. Magn. Reson. Med. 1987;5:513–524.
182. Reischauer C, Staempfli P, Jaermann T, Boesiger P. Construction of a temperature-controlled diffusion phantom for quality control of diffusion measurements. J Magn Reson Imaging 2009;29:692–698.
183. Callot V, Bennett E, Decking UKM, Balaban RS, Wen H. In vivo study of microcirculation in canine myocardium using the IVIM method. Magn. Reson. Med. 2003;50:531–540.
184. Froeling M, Nederveen AJ, Nicolay K, Strijkers GJ. DTI of human skeletal muscle: the effects of diffusion encoding parameters, signal-to-noise ratio and T2 on tensor indices and fiber tracts. NMR Biomed 2013;26:1339–1352.
185. Feinberg DA, Setsompop K. Ultra-fast MRI of the human brain with simultaneous multi-slice imaging. J Magn Reson 2013;229:90–100.
186. Hargreaves BA, Cunningham CH, Nishimura DG, Conolly SM. Variable-rate selective excitation for rapid MRI sequences. Magn. Reson. Med. 2004;52:590–597.
187. Bland JM, Altman DG. Statistical methods for assessing agreement between two methods of clinical measurement. Lancet 1986;1:307–310.
188. Noehren B, Andersen A, Feiweier T, Damon B, Hardy P. Comparison of twice refocused spin echo versus stimulated echo diffusion tensor imaging for tracking muscle fibers. J Magn Reson Imaging 2015;41:624–632.
189. Froeling M, Mazzoli V. Ex vivo cardiac DTI: on the effects of diffusion time and b-value. In: 17th Annual SCMR Scientific Sessions. Vol. 16. New Orleans; 2014. p. P77.
190. Taylor D, Edwards L, Boucek M, Trulock E, Aurora P, Christie J, Dobbels F, Rahmel A, Keck M, Hertz M. Registry of the International Society for Heart and Lung Transplantation: Twenty-fourth Official Adult Heart Transplant Report—2007. J. Hear. Lung Transplant. 2007;26:769–781.
191. Elliott P, Andersson B, Arbustini E, et al. Classification of the cardiomyopathies: a position statement from the european society of cardiology working group on myocardial and pericardial diseases. Eur. Heart J. 2007;29:270–276.
192. Maron BJ. Contemporary Definitions and Classification of the Cardiomyopathies: An American Heart Association Scientific Statement From the Council on Clinical Cardiology, Heart Failure and Transplantation Committee; Quality of Care and Outcomes Research and Functio. Circulation 2006;113:1807–1816.
193. Kasper EK, Agema WR, Hutchins GM, Deckers JW, Hare JM, Baughman KL. The causes of dilated cardiomyopathy: a clinicopathologic review of 673 consecutive patients. J. Am. Coll. Cardiol. 1994;23:586–590.
194. Unverferth D V, Fetters JK, Unverferth BJ, Leier C V, Magorien RD, Arn AR, Baker PB. Human myocardial histologic characteristics in congestive heart failure. Circulation 1983;68:1194–1200.
195. Wu A, Das S. Sudden death in idiopathic dilated cardiomyopathy. Am Hear. J 1992;124:1035–1045.
153
196. Tomaselli GF. What Causes Sudden Death in Heart Failure? Circ. Res. 2004;95:754–763.
197. Gerdes a M, Capasso JM. Structural remodeling and mechanical dysfunction of cardiac myocytes in heart failure. J. Mol. Cell. Cardiol. 1995;27:849–856.
198. Packer M. The neurohormonal hypothesis: a theory to explain the mechanism of disease progression in heart failure. J. Am. Coll. Cardiol. 1992:248–254.
199. Hales PW, Burton RA, Bollensdorff C, Mason F, Bishop M, Gavaghan D, Kohl P, Schneider JE. Progressive changes in T(1), T(2) and left-ventricular histo-architecture in the fixed and embedded rat heart. NMR Biomed 2011;24:836–843.
200. Eggen M, Swingen C, Iaizzo P. Ex vivo diffusion tensor MRI of human hearts: Relative effects of specimen decomposition. Magn. Reson. Med. 2012;67:1703–9.
201. Feinberg DA, Hoenninger JC, Crooks LE, Kaufman L, Watts JC, Arakawa M. Inner volume MR imaging: technical concepts and their application. Radiology 1985;156:743–747.
202. Rutz AK, Ryf S, Plein S, Boesiger P, Kozerke S. Accelerated whole-heart 3D CSPAMM for myocardial motion quantification. Magn. Reson. Med. 2008;59:755–63.
203. Nash MP, Hunter PJ. Computational Mechanics of the Heart. J. Elast. 2001;61:113–141.
204. Asner L, Hadjicharalambous M, Chabiniok R, et al. Estimation of passive and active properties in the human heart using 3D tagged MRI. Biomech. Model. Mechanobiol. 2015.
205. Usyk TP, Mazhari R, Mcculloch a. D. Effect of laminar orthotropic myofiber architecture on regional stress and strain in the canine left ventricle. J. Elast. 2000;61:143–164.
206. Codd MB, Sugrue DD, Gersh BJ, Melton LJ. Epidemiology of idiopathic dilated and hypertrophic cardiomyopathy. A population-based study in Olmsted County, Minnesota, 1975-1984. Circulation 1989;80:564–572. doi: 10.1161/01.CIR.80.3.564.
207. Kawel-Boehm N, Maceira A, Valsangiacomo-Buechel ER, Vogel-Claussen J, Turkbey EB, Williams R, Plein S, Tee M, Eng J, Bluemke D a. Normal values for cardiovascular magnetic resonance in adults and children. J. Cardiovasc. Magn. Reson. 2015;17:29. doi: 10.1186/s12968-015-0111-7.
208. Song L-S, Sobie E a, McCulle S, Lederer WJ, Balke CW, Cheng H. Orphaned ryanodine receptors in the failing heart. Proc. Natl. Acad. Sci. U. S. A. 2006;103:4305–10.
209. Louch WE, Mørk HK, Sexton J, Strømme T a, Laake P, Sjaastad I, Sejersted OM. T-tubule disorganization and reduced synchrony of Ca2+ release in murine cardiomyocytes following myocardial infarction. J. Physiol. 2006;574:519–533.
210. Lyon AR, MacLeod KT, Zhang Y, Garcia E, Kanda GK, Lab MJ, Korchev YE, Harding SE, Gorelik J. Loss of T-tubules and other changes to surface topography in ventricular myocytes from failing human and rat heart. Proc. Natl. Acad. Sci. U. S. A. 2009;106:6854–6859.
211. Asner, L Hadjicharalambous, M Chabiniok R, Peressutti D, Sammut E, Wong J, Carr-White G, Lee J, King A, Smith N, Razavi R, Nordsletten D. Patient-specific modeling for left-ventricular mechanics using data-driven boundary energies. Comput. Method Appl. M. 2016;in review.
212. Bonet J, Wood R. Nonlinear continuum mechanics for finite element analysis. Cambridge University Press; 2008.

154
213. Holzapfel G a, Ogden RW. Constitutive modelling of passive myocardium: a structurally based framework for material characterization. Philos. Trans. A. Math. Phys. Eng. Sci. 2009;367:3445–75. doi: 10.1098/rsta.2009.0091.
214. Kerckhoffs RCP, Bovendeerd PHM, Prinzen FW, Smits K, Arts T. Intra- and interventricular asynchrony of electromechanics in the ventricularly paced heart. J. Eng. Math. 2003;47:201–216. doi: 10.1023/B:ENGI.0000007972.73874.da.
215. Niederer S a., Plank G, Chinchapatnam P, Ginks M, Lamata P, Rhode KS, Rinaldi C a., Razavi R, Smith NP. Length-dependent tension in the failing heart and the efficacy of cardiac resynchronization therapy. Cardiovasc. Res. 2011;89:336–343. doi: 10.1093/cvr/cvq318.
216. Usyk TP, LeGrice IJ, McCulloch AD. Computational model of three-dimensional cardiac electromechanics. Comput. Vis. Sci. 2002;4:249–257. doi: 10.1007/s00791-002-0081-9.
217. Lee J, Cookson A, Roy I, Kerfoot E, Asner L, Vigueras G. Multiphysics Computational Modeling in CHeart. 2016;38:150–178.
218. Paley MNJ, Lee KJ, Wild JM, Griffiths PD, Whitby EH. Simultaneous parallel inclined readout image technique. Magn. Reson. Imaging 2006;24:557–562.
219. Weaver JB. Simultaneous multislice acquisition of MR images. Magn. Reson. Med. 1988;8:275–284.
220. Feinberg D a., Reese TG, Wedeen VJ. Simultaneous echo refocusing in EPI. Magn. Reson. Med. 2002;48:1–5.
221. Reese TG, Benner T, Wang R, Feinberg D a., Van Wedeen J. Halving imaging time of whole brain diffusion spectrum imaging and diffusion tractography using simultaneous image refocusing in EPI. J. Magn. Reson. Imaging 2009;29:517–522.
222. Breuer FA, Blaimer M, Heidemann RM, Mueller MF, Griswold MA, Jakob PM. Controlled aliasing in parallel imaging results in higher acceleration (CAIPIRINHA) for multi-slice imaging. Magn Reson Med 2005;53:684–691.
223. Larkman DJ, Hajnal J V., Herlihy AH, Coutts G a., Young IR, Ehnholm G. Use of multicoil arrays for separation of signal from multiple slices simultaneously excited. J. Magn. Reson. Imaging 2001;13:313–317.
224. Nunes RG, Hajnal J V, Golay X, Larkman DJ. Simultaneous slice excitation and reconstruction for single shot EPI . Proc Intl Soc Mag Reson Med 2006;14:293.
225. Setsompop K, Gagoski BA, Polimeni JR, Witzel T, Wedeen VJ, Wald LL. Blipped-controlled aliasing in parallel imaging for simultaneous multislice echo planar imaging with reduced g-factor penalty. Magn Reson Med 2012;67:1210–1224.
226. Pauly J, Le Roux P, Nishimura D, Macovski A. Parameter relations for the Shinnar-Le Roux selective excitation pulse design algorithm [NMR imaging]. IEEE Trans Med Imaging 1991;10:53–65.
227. Lau AZ, Tunnicliffe EM, Frost R, Koopmans PJ, Tyler DJ, Robson MD. Accelerated human cardiac diffusion tensor imaging using simultaneous multislice imaging. Magn Reson Med 2014. doi: 10.1002/mrm.25200.
228. Von Deuster C, Stoeck CT, Buehrer M, Harmer J, Chan RW, Atkinson D, Kozerke S. Free-breathing cardiac DTI with simultaneous multi-slice excitation. In: 22nd Annual Meeting of ISMRM. Milan, Italy; 2104. p. 2808.

155
229. Yamada I, Aung W, Himeno Y, Nakagawa T, Shibuya H. Diffusion coefficients in abdominal organs and hepatic lesions: evaluation with intravoxel incoherent motion echo-planar MR imaging. Radiology 1999;210:617–623.
230. Chandarana H, Lee VS, Hecht E, Taouli B SE. Comparison of biexponential and monoexponential model of diffusion weighted imaging in evaluation of renal lesions: preliminary experience. Invest Radiol 2011;46:285–91.
231. Lemke A, Laun FB, Klauss M, Re TJ, Simon D, Delorme S, Schad LR SB. Differentiation of pancreas carcinoma from healthy pancreatic tissue using multiple b-values: comparison of apparent diffusion coefficient and intravoxel incoherent motion derived parameters. Invest Radiol 2009;44:769–75.
232. Luciani A, Vignaud A, Cavet M, NhieuJ T Van, Mallat A, Ruel L, Laurent A, Deux J, Brugieres P, Rahmouni A. Liver Cirrhosis : Intravoxel Incoherent Motion MR Imaging. Radiology 2008;249:891–899.
233. Patel J, Sigmund EE, Rusinek H, Oei M, Babb JS, Taouli B. Diagnosis of cirrhosis with intravoxel incoherent motion diffusion MRI and dynamic contrast-enhanced MRI alone and in combination: Preliminary experience. J. Magn. Reson. Imaging 2010;31:589–600.
234. Deux J-F, Maatouk M, Vignaud A, Luciani A, Lenczner G, Mayer J, Lim P, Dubois-Randé J-L, Kobeiter H, Rahmouni A. Diffusion-weighted echo planar imaging in patients with recent myocardial infarction. Eur. Radiol. 2011;21:46–53.
235. Laissy J-P, Gaxotte V, Pasi N, BenDriss A, Feldman L, Steg PG, Senior, Serfaty J-M. Cardiac diffusion-weighted MR imaging in recent, subacute and chronic myocardial infarction: a pilot study. 2011;13:O46.
236. Reischauer C, Wilm BJ, Froehlich JM, Gutzeit A, Prikler L, Gablinger R, Boesiger P, Wentz KU. High-resolution diffusion tensor imaging of prostate cancer using a reduced FOV technique. Eur J Radiol 2011;80:e34–41.
237. Lemke A, Stieltjes B, Schad LR, Laun FB. Toward an optimal distribution of b values for intravoxel incoherent motion imaging. Magn Reson Imaging 2011;29:766–776.
238. Ogg RJ, Kingsley PB, Taylor JS. WET, a T1- and B1-insensitive water-suppression method for in vivo localized 1H NMR spectroscopy. J Magn Reson B 1994;104:1–10.
239. Plein S, Ryf S, Schwitter J, Radjenovic A, Boesiger P, Kozerke S. Dynamic contrast-enhanced myocardial perfusion MRI accelerated with k-t SENSE. Magn. Reson. Med. 2007;58:777–785.
240. Zhang X, Petersen ET, Ghariq E, De Vis JB, Webb a. G, Teeuwisse WM, Hendrikse J, Van Osch MJP. In vivo blood T1 measurements at 1.5 T, 3 T, and 7 T. Magn. Reson. Med. 2013;70:1082–1086. doi: 10.1002/mrm.24550.
241. Orton MR, Collins DJ, Koh D-M, Leach MO. Improved intravoxel incoherent motion analysis of diffusion weighted imaging by data driven Bayesian modeling. Magn. Reson. Med. 2014;71:411–20.
242. Jeffreys H. An Invariant Form for the Prior Probability in Estimation Problems. Proc. R. Soc. London A Math. Phys. Eng. Sci. 1946;186:453–461.
243. Notohamiprodjo M, Chandarana H, Mikheev A, Rusinek H, Grinstead J, Feiweier T, Raya JG, Lee VS, Sigmund EE. Combined intravoxel incoherent motion and diffusion tensor imaging of renal diffusion and flow anisotropy. Magn. Reson. Med. 2014;00:1–7.
244. Von Deuster C, Stoeck C. ., Genet M, Atkinson D, Kozerke S. Free-breathing Diffusion Tensor Imaging of the In Vivo Human Heart - Stimulated Echo vs. Spin Echo Acquisition. In: Proceedings of the International Society for Magnetic Resonance in Medicine. Singapore; 2016.
156
245. McNab J a., Edlow BL, Witzel T, et al. The Human Connectome Project and beyond: Initial applications of 300mT/m gradients. Neuroimage 2013;80:234–245.
246. McGill LA, Scott AD, Ferreira PF, et al. Heterogeneity of fractional anisotropy and mean diffusivity measurements by in vivo diffusion tensor imaging in normal human hearts. PLoS One 2015;10:1–17.
247. Liu C, Moseley ME, Bammer R. Simultaneous phase correction and SENSE reconstruction for navigated multi-shot DWI with non-cartesian k-space sampling. Magn. Reson. Med. 2005;54:1412–1422.
248. Xie Y, Yu W, Fan Z, Nguyen C, An J, Zhang Z, Debiao L. High Resolution 3D Diffusion MRI: Detection of lipi-rich necrotic core in plaques without contrast media. 2014;22:2014.
249. Wenk JF, Wall ST, Peterson RC, Helgerson SL, Sabbah HN, Burger M, Stander N, Ratcliffe MB, Guccione JM. A method for automatically optimizing medical devices for treating heart failure: designing polymeric injection patterns. J. Biomech. Eng. 2009;131:121011.
250. Trayanova NA. Computational cardiology: the heart of the matter. ISRN Cardiol 2012:269680. doi: 10.5402/2012/269680.
251. Sermesant M, Chabiniok R, Chinchapatnam P, et al. Patient-specific electromechanical models of the heart for the prediction of pacing acute effects in CRT: a preliminary clinical validation. Med Image Anal 2012;16:201–215.
252. Reumann Gurev, V. and Rice, J. J. M. Computational modeling of cardiac disease: potential for personalized medicine. Per. Med. 2009;6:45–66.
253. Relan J, Chinchapatnam P, Sermesant M, Rhode K, Ginks M, Delingette H, Rinaldi CA, Razavi R, Ayache N. Coupled personalization of cardiac electrophysiology models for prediction of ischaemic ventricular tachycardia. Interface Focus 2011;1:396–407.
157
List of Publications
Journal Articles
2016 C. von Deuster, E. Sammut, C. T. Stoeck, R. Razavi, S. Kozerke
“Mapping Dynamic Myocardial Fibre Reorientation in Dilated
Cardiomyopathy using Dual-Phase In-Vivo Cardiac Diffusion
Tensor Imaging”
In preparation
2015 C. von Deuster, C. T. Stoeck, M. Genet, D. Atkinson, S. Kozerke
“Spin Echo versus Stimulated Echo Diffusion Tensor Imaging of the
in vivo Human Heart”
Magn Reson Med., DOI 10.1002/mrm.25998
2015 F. Hennel, M. Buehrer, C. von Deuster, A. Seuven, K. P. Pruessmann
“SENSE Reconstruction for Multiband EPI Including Slice-Dependent
N/2 Ghost Correction”
Magn Reson Med., DOI 10.1002/mrm.25915
2015 C. T. Stoeck, C. von Deuster, M. Genet, D. Atkinson, S. Kozerke
“Second-Order Motion-Compensated Spin Echo Diffusion
Tensor Imaging of the Human Heart”
Magn Reson Med., DOI 10.1002/mrm.25784

158
2015 S. Bosshard, F. Stuker, C. von Deuster, A. Schroeter, M. Rudin
“BOLD fMRI of C-fiber Mediated Nociceptive Processing in Mouse
Brain in Response to Thermal Stimulation of the Forepaws”
PLoS One. 2015 May 7;10(5):e0126513
2014 R. W. Chan, C. von Deuster, C. T. Stoeck, J. Harmer, S. Punwani, N.
Ramachandran, S. Kozerke, D. Atkinson
“High-Resolution Diffusion Tensor Imaging (DTI) Of The Human
Kidneys Using A Free-Breathing Multi-Slice Targeted-FOV
Approach”
NMR Biomed. 2014 Nov;27(11):1300-12
2014 C. T. Stoeck, A. Kalinowska, C. von Deuster, J. Harmer, R. W. Chan,
M. Niemann, R. Manka, D. Atkinson, D. Sosnovik, C. Mekkaoui, S.
Kozerke
“Dual-Phase Cardiac Diffusion Tensor Imaging With Strain
Correction”
PLoS One. 2014 Sep 5;9(9):e107159
2014 R. W. Chan, C. von Deuster, D. Giese, C. T. Stoeck, J. Harmer, A. P.
Aitken, D. Atkinson, S. Kozerke
“Characterization and correction of eddy-current artifacts in
unipolar and bipolar diffusion sequences using magnetic field
monitoring”
J Magn Reson. 2014 Jul;244:74-84
159
Conference Abstracts and Proceedings
2016 C. von Deuster, C. T. Stoeck, M. Genet, D. Atkinson, S. Kozerke
“Free-breathing Diffusion Tensor Imaging of the In Vivo Human
Heart - Stimulated Echo vs. Spin Echo Acquisition”
Proceedings of the 24th Meeting of ISMRM, Singapore, Singapore
2016 C. von Deuster, E. Sammut, C. T. Stoeck, R. Razavi, S. Kozerke
“Mapping Dynamic Myocardial Fibre Reorientation in Dilated
Cardiomyopathy using Dual-Phase In-Vivo Cardiac Diffusion Tensor
Imaging”
Proceedings of the 24th Meeting of ISMRM, Singapore, Singapore
2016 G. Spinner, C. von Deuster, C. T. Stoeck, S. Kozerke
“Bayesian Intravoxel Incoherent Motion Imaging to Map Perfusion
in the Human Heart”
Proceedings of the 24th Meeting of ISMRM, Singapore, Singapore
2016 C. T. Stoeck, C. von Deuster, S. Kozerke
“Second order motion compensated spin echo diffusion tensor
imaging of the in vivo human heart – considerations on gradient
performance requirements”
Proceedings of the 24th Meeting of ISMRM, Singapore, Singapore
160
2016 M. Genet, C. T. Stoeck, C. von Deuster, L. C. Lee, J. M. Guccione, S.
Kozerke
“Finite Element Digital Image Correlation for Cardiac Strain
Analysis from 3D Whole-Heart Tagging”
Proceedings of the 24th Meeting of ISMRM, Singapore, Singapore
2016 M. Fuetterer, J. Busch, C. von Deuster, C. Binter, N. Cesarovic, M.
Lipiski, C. T. Stoeck, S. Kozerke
„Velocity-Selective Tip-Back Excitation for Hyperpolarized [13C]
Urea Cardiac Perfusion Imaging“
Proceedings of the 24th Meeting of ISMRM, Singapore, Singapore
2016 C. T. Stoeck, C. von Deuster, S. Kozerke
“Second order motion compensated spin echo cardiac DTI at
different gradient strengths”
Proceedings of the 19th Meeting of SCMR, Los Angeles, USA
2015 C. von Deuster, C. T. Stoeck, M. Genet, D. Atkinson, S. Kozerke
“Comparison of Spin Echo versus Stimulated Echo Diffusion Tensor
Imaging of the in vivo Human Heart”
Proceedings of the 32nd Meeting of ESMRMB, Edinburgh, Scotland
2015 C. von Deuster, C. T. Stoeck, M. Genet, N. Toussaint, D. Atkinson,
S. Kozerke
“A reference dataset of in-vivo human left-ventricular fiber
architecture in systole and diastole”
Proceedings of the 18th Meeting of SCMR, Nice, France
161
2015 C. von Deuster, C. T. Stoeck, L. Wissmann, G. Spinner,
T. Fleischmann, M. Y. Emmert, N. Cesarovic, S. Kozerke
“Verification of the intra-voxel incoherent motion (IVIM) model in
the porcine heart”
Proceedings of the 23rd Meeting of ISMRM, Toronto, Canada
2015 J. Busch, M. Fuetterer, C. von Deuster, N. Cesarovic, C. T. Stoeck,
S. Kozerke
“Hyperpolarized [1-13C] Pyruvate Metabolic Magnetic Resonance
Imaging in Pigs”
Proceedings of the 32nd Meeting of ESMRMB, Edinburgh, Scotland
2015 C. T. Stoeck, C. von Deuster, M. Genet, D. Atkinson, S. Kozerke
“First and Second Order Motion Compensated Spin-Echo Diffusion
Tensor Imaging of the Human Heart”
Proceedings of the 23rd Meeting of ISMRM, Toronto, Canada
2015 F. Hennel, A. Seuwen, C. von Deuster, K. P. Pruessmann
“Ghost-Correcting SENSE Reconstrcution for mutli-band EPI“
Proceedings of the 23rd Meeting of ISMRM, Toronto, Canada
2015 C. T. Stoeck, C. von Deuster, M. Genet, D. Atkinson, S. Kozerke
“Second Order Motion Compensated Spin-Echo Diffusion Tensor
Imaging of the Human Heart”
Proceedings of the 18th Meeting of SCMR, Nice, France

162
2015 C. T. Stoeck, C. von Deuster, N. Cesarovic, M. Genet, M. Y.
Emmert, S. Kozerke
“Direct comparison of in-vivo and post-mortem spin-echo based
diffusion tensor imaging in the porcine heart”
Proceedings of the 18th Meeting of SCMR, Nice, France
2014 C. von Deuster, C. T. Stoeck, M. Buehrer, J. Harmer, R. W. Chan,
D. Atkinson, S. Kozerke
“Free-Breathing Cardiac DTI with Simultaneous Multi-Slice
Excitation”
Proceedings of the 22nd Meeting of ISMRM, Milan, Italy
2014 C. T. Stoeck, A. Kalinowska, C. von Deuster, J. Harmer, S. Kozerke
“In-Vivo Dual-Phase Cardiac DTI with 3D Strain Correction”
Proceedings of the 22nd Meeting of ISMRM, Milan, Italy
2014 J. Harmer; R. W. Chan, C. T. Stoeck, C. von Deuster, D. Atkinson,
S. Kozerke
“Correction of Off-Resonance Distortions in In-Vivo Cardiac
Diffusion Tensor Imaging”
Proceedings of the 22nd Meeting of ISMRM, Milan, Italy
2014 R. W. Chan, C. von Deuster, C. T. Stoeck, J. Harmer, S. Kozerke,
D. Atkinson
“High-Resolution Diffusion Tensor Imaging (DTI) of the Human
Kidneys Using a Free-Breathing Multi-Slice Targeted-FOV
Approach”
Proceedings of the 22nd Meeting of ISMRM, Milan, Italy

163
2013 C. von Deuster, C. T. Stoeck; D. Giese, J. Harmer, R.W. Chan,
D. Atkinson, S. Kozerke
“Concurrent Dual-Slice Cardiac DTI of the in-vivo Human Heart”
Proceedings of the 21st Meeting of ISMRM, Salt Lake City, USA
2013 D. Giese, M. Buehrer, C. von Deuster, T. Schaeffter, S. Kozerke
“Multi-Slice Free Breathing Liver Imaging Using a 2D CAIPIRINHA
Navigator”
Proceedings of the 21st Meeting of ISMRM, Salt Lake City, USA
2013 R. W. Chan, S. Kozerke, D. Giese, J. Harmer, C. T. Stoeck, C. von
Deuster, A. Aitken, D. Atkinson
“Characterization and Correction of Eddy-Current Artifacts in
Unipolar and Bipolar Diffusion Sequences Using a Field-Monitoring
Approach: Application to Renal Diffusion Tensor Imaging (DTI)”
Proceedings of the 21st Meeting of ISMRM, Salt Lake City, USA
2013 C. T. Stoeck, C. von Deuster, N. Toussaint, S. Kozerke
“High-Resolution Single-Shot DTI of the in-vivo Human Heart Using
Asymmetric Diffusion Encoding”
Proceedings of the 21st Meeting of ISMRM, Salt Lake City, USA
2013 J. Harmer, C. T. Stoeck, R. W. Chan, N. Toussaint, C. von Deuster,
D. Atkinson, S. Kozerke
“In-vivo High Resolution Diffusion Tensor Imaging of the Human
Heart at 3T: Fat Suppression in the Presence of B0 Field
Inhomogeneities”
Proceedings of the 21st Meeting of ISMRM, Salt Lake City, USA

164
2011 S. C. Bosshard, F. Stuker, C. von Deuster, M. Rudin
“TRPV1-mediated entry of QX-314 leads to inhibition of
nociceptive input as measured by BOLD fMRI in mice using thermal
stimulation“
Proceedings of the 19th Meeting of ISMRM, Montréal, Canada
165
Acknowledgements
Firstly, I would like to thank Prof. Dr. Sebastian Kozerke for offering me a PhD position
to explore the exciting field of cardiac diffusion MRI. I highly appreciated his ideas and
continuous guidance during my PhD study. Without his constant support and the great
research environment, it would not have been possible to conduct this research. I
would like to thank Dr. Claudia Prieto as my second supervisor and Dr. David Atkinson
as external supervisor. Thanks to Prof. Dr. Reza Razavi for supporting the joint research
collaborations between Zurich and London.
I am very grateful to the referees Prof. Dr. P. Croisille and Prof. Dr. J. Wild for having
agreed to review and examine this work.
Thanks to all the friends and colleagues I met during my time at IBT. Thanks to Niklaus,
Lukas, Johannes, Julia, Claudio, Christian B., Christian G, Alex F., Alex G., Alex P., Jonas
S., Jonas R., Jonas W., Giorgos, Matteo, Simon, Beni, Thomas, Andi, Nicole, Max,
Kerem, Patrick, Sophie, Zsofia, Robbert, Adrian, Josip, Vlad, Dian, Martin G., Martin B.,
Gérard, Rudi and Verena. Thanks to Georg for the joint perfusion project and, of
course, many thanks to my diffusion mentor Chris Stoeck.
Thanks to Eva Sammut for applying the DTI work in clinical practice and acquiring the
DCM patient data. I also would like to thank David and Liya for the corresponding
cardiac modeling. I am grateful for my funding source from the UK (The Engineering
and Physical Sciences Research Council - EPSRC) and the repeated financial support by
the International Society of Magnetic Resonance in Medicine (ISMRM).
Finally, I would like to express my great gratitude to my family for their unconditional
support in all situations and their infinite patience.

166
Curriculum Vitae
Personal Information
Name
Constantin von Deuster
Date of birth
15 January 1986
Citizenship German
Education
4/2012 – 3/2016 PhD Candidate
Thesis “Towards Reliable Diffusion MRI of the In Vivo Human Heart”
supervised by Prof. Dr. Sebastian Kozerke and Dr. Claudia Prieto.
Division of Imaging Sciences and Biomedical Engineering, School of
Medicine, King’s College London, England, Institute for Biomedical
Engineering (IBT), ETH and University of Zurich, Switzerland
3/2010 – 4/2012 M.Sc. in Physics
Master thesis “Parallel slice encoding in MR diffusion tensor imaging”
supervised by Prof. Dr. Sebastian Kozerke and Dr. Philip Batchelor.
Division of Imaging Sciences and Biomedical Engineering, School of
Medicine, King’s College London, England, Institute for Biomedical
Engineering (IBT), ETH and University of Zurich, Switzerland
3/2008 – 3/2010 B.Sc. in Physics
Swiss Federal Institute of Technology (ETH Zurich), Switzerland

167
8/2005 – 2/2008 Undergraduate studies in “Nanostrukturtechnik“
University of Würzburg, Germany
6/2005 High School
Röntgen-Gymnasium Würzburg, Germany