compensation and benefits - kentucky and benefits of kentucky public school employees research...
TRANSCRIPT


Compensation and Benefitsof
Kentucky Public School Employees
Research Report No. 306
Legislative Research CommissionFrankfort, Kentucky
June 2002
Printed with state funds. Available in alternative form upon request.

v
vi
Compensation and Benefitsof
Kentucky Public School Employees
INTERIM JOINT COMMITTEE ON EDUCATION
Rep. Frank Rasche, Co-ChairSen. Lindy Casebier, Co-Chair
Rep. Larry BelcherSen. Walter BlevinsRep. Robert BuckinghamRep. Mike CherryRep. Jack Coleman, Jr.Rep. Hubert CollinsRep. Barbara ColterRep. Jon DraudRep. Tim FeeleyRep. Gippy GrahamSen. Brett GuthrieSen. David KaremSen. Alice Forgy KerrSen. Vernon McGahaRep. Mary Lou MarzianRep. Reginald MeeksRep. Charles MillerRep. Harry Moberly, Jr.
Rep. Russ MobleySen. Gerald NealRep. Rick NelsonRep. Tom RinerSen. Ernesto ScorsoneSen. Dan SeumSen. Tim ShaughnessyRep. Charles SilerRep. Arnold SimpsonRep. Dottie SimsRep. Kathy SteinSen. Robert StiversRep. Gary TappRep. Jim ThompsonRep. Mark TreeshSen. Johnny Ray TurnerRep. Charles WaltonSen. Jack Westwood
LRC EDUCATION COMMITTEE STAFF:
Ethel Alston, Audrey Carr, Sandy Deaton,Evelyn Gibson, Kelley McQuerry, Lisa Moore
Technical assistance was provided to the subcommittees by theOffice of the Economists and Program Review and Investigations
Committee Staff:Barry Boardman and Dan Jacovitch

vii
viii
SUBCOMMITTEE ON TEACHER COMPENSATION OF THEINTERIM JOINT COMMITTEE ON EDUCATION
Sen. Lindy Casebier, Co-ChairRep. Harry Moberly, Co-Chair
Rep. Jack ColemanRep. Jon DraudRep. Tim FeeleyRep. Gippy GrahamSen. David KaremRep. Reginald Meeks
Rep. Rick NelsonSen. Ernesto ScorsoneSen. Robert StiversRep. Jim ThompsonRep. Charlie WaltonRep. Frank Rasche, Ex Officio
LRC Staff: Audrey Carr, Kelley McQuerry
SUBCOMMITTEE ON CLASSIFIED PERSONNEL COMPENSATION OF THEINTERIM JOINT COMMITTEE ON EDUCATION
Sen. Jack Westwood, Co-ChairRep. Hubert Collins, Co-Chair
Rep. Barbara White ColterRep. Mary Lou MarzianRep. Charles MillerRep. Russ MobleySen. Gerald NealRep. Tom RinerRep. Barbara White ColterRep. Mary Lou Marzian
Rep. Charles MillerRep. Russ MobleySen. Gerald Neal Rep. Tom RinerRep. Kathy SteinRep. Dottie SimsRep. Charles Siler, Jr.Sen. Lindy Casebier, Ex-OfficioRep. Frank Rasche, Ex-Officio
LRC Staff: Ethel Alston, Bettina Abshire, Linda Hughes, Lisa Moore

i
FOREWORD
The 2000 General Assembly enacted two resolutions that directed the Interim JointCommittee on Education to study compensation of school personnel. SCR 88 directed a study ofteacher compensation and benefits. HCR 114 directed a study of salaries of classified employeesin local school districts. This report presents information compiled by two subcommitteesestablished by the Interim Joint Committee on Education to conduct these studies. The work ofboth subcommittees was presented to and accepted by the full committee and is combined in thisreport.
The report was prepared by the staff of the Interim Joint Committee on Education withassistance from the office of the LRC Staff Economists and the Program Review andInvestigations Committee staff. We would like to acknowledge the assistance of the local schooldistricts in providing data necessary to the completion of the study, and all of those otheragencies and groups that provided valuable input to the work of the subcommittees. Since thereport is being published following the 2002 Session, actions taken by the 2002 GeneralAssembly to address the issues contained in this report have been included.
Robert Sherman, DirectorLegislative Research Commission
The CapitolFrankfort, KentuckyJune 2002

ii
iii
CONTENTS
FOREWORD…………………………………………………………………………….…….…i
SUMMARY…………………………………………………………………………………….vii
I. INTRODUCTION............................................................................................................... 1
II. STATUTORY PROVISIONS RELATING TOCOMPENSATION AND BENEFITS FOR CERTIFIED ANDCLASSIFIED PERSONNEL IN KENTUCKY SCHOOL DISTRICTS............................ 3
III. AN ANALYSIS OF TEACHER COMPENSATION AND BENEFITS ......................... 13
IV. AN ANALYSIS OF CLASSIFIED PERSONNELCOMPENSATION AND BENEFITS .............................................................................. 35
V. FINDINGS AND RECOMMENDATIONS ..................................................................... 57
Part A: Teacher Compensation and Benefits ................................................................... 57
Part B: Compensation and Benefits for Classified Personnel .......................................... 61
BIBLIOGRAPHY……………………………………………………………………………...63
APPENDICES…………………………………………………………………………………67
A. Survey: Compensation, Benefits, and Personnel Policiesfor Classified and Certified School Employees ................................................................ 69
B. Presenters to the Interim Joint Committee, Subcommitteeson Teacher Compensation, and Classified Personnel Compensation ............................... 79
C. School District Codes........................................................................................................ 81
D. Map of Kentucky School Calendar by District, 2001-2002.............................................. 83
E. Map of Kentucky School District Median Years Experiencefor Public School Teachers................................................................................................ 85
F. Professional Staff Data on Kentucky’s Teachers .............................................................. 87
G. Map Indicating Number of Public School Teachers by District, 2000-2001.................... 89
H. Salary Schedules in Local School Districts....................................................................... 91
iv
I. Teacher Salary and Experience Summary 2000-2001 .................................................... 113
J. Map of School Districts Above and Below State’s Average Annual Salaryfor Public School Teachers, 2000-2001 .......................................................................... 121
K. Ten Local School Districts with the Largest Number of EmergencyEmergency Certificates Granted, 2000-2001, 1999-2000, and 1998-1999..................... 123
L. Number of Kentucky Emergency Teaching Certificates Awardedby Content Area, 2000-2001, 1999-2000, and 1998-1999.............................................. 125
M. 1999-2000 Local District Revenue: Percentageof State, Local, and Federal Revenue.............................................................................. 129
N. Classified Employees Average Pay, Hours, and Contract Daysby Job Classification: 2000-2001 School Year ............................................................... 137
O. Employees With Multiple Jobs and Who Earn Minimum WageWithin a School District 2000-2001................................................................................ 149
P. Female Employment by Job Classification..................................................................... 151
Q. Actions by the 2002 General Assembly Relating toCompensation and Benefits for School Employees ........................................................ 159
LIST OF TABLESTABLES
1. Minimum Statewide Teacher Salary Schedule for 2000-2001 and 2001-2002 ................ 21
2. Distribution of Kentucky Teachers by Rank and Experience for the 2000-2001 SY ....... 22
3. Average Teacher Salaries in States Surrounding Kentuckyand National Ranking 1999-2000...................................................................................... 24
4. Southern Regional Education Board (SREB) Averages 1999-2000................................. 24
5. Statewide Totals of Classified School Employees by Job Family 2000-2001.................. 36
6. State Averages for Per Pupil Revenues 1999-2000........................................................... 37
7. Job Positions With the Largest Number of Employees 2000-2001 .................................. 38
v
8. Job Classifications by District with One or MoreEmployees Earning Minimum Wage ................................................................................ 40
9. Male and Female Employees by Job Family 2000-2001 .................................................. 43
10. Male and Female Mean Hourly Pay Differences forthe Top Job Classifications as Measured by Total Employment 2000-2001.................... 44
11. Statewide Cost of Living Increases for Classified Employees,1999-2000 and 2000-2001 School Years .......................................................................... 45
12. Districts that Granted Cost of Living Increases In Excessof the Amount to Certified Employees.............................................................................. 46
13. Districts in FY 1999-2000 and FY 2000-2001 that Granted Cost of Living IncreasesLess than the Amount Certified Employees Received ...................................................... 47
14. Number of Full Time Classified Employees by Job Family and Pay Range 2000-2001...48
15. Training for Classified Staff 2000-2001 ........................................................................... 52
16. Recruitment Activities in Local School Districts for Classified Employees 2000-2001.. 53
17. Contracts with Outside Vendors 2000-2001 ..................................................................... 54
18. Performance Evaluations 2000-2001 ................................................................................ 55
19. Rewards Distribution in Successful Schools..................................................................... 56

vi
vii
SUMMARY
The Interim Joint Committee on Education was required to study and makerecommendations relating to compensation and benefits for teachers by 2000 SCR 88 and forclassified personnel by 2000 HCR 114. Two subcommittees, the Subcommittee on TeacherCompensation and the Subcommittee on Classified Personnel Compensation, studied the issuesand made recommendations to the Interim Joint Committee.
Data and information were gathered from a review of existing statutes; national and statestudies; testimony from a variety of stakeholders including national researchers, state educationagencies, private advocacy groups, business and citizens groups, and local school districtpersonnel; and classified and professional staff data collected from local school districts by theKentucky Department of Education and the Education Professional Standards Board. In addition,an LRC web-based survey was sent to all school districts to gather additional information that isnot reported to other state agencies.
Compensation and benefits for certified and classified personnel comprise the largestexpenditure of funds within local school district budgets. While the percentage of expendituresfor personnel costs may vary from district to district, the personnel costs typically comprise75%-80% of the expenditures.
The number of full-time employees in local school districts in 2000-2001 was over95,000, with 48,018 certified personnel, including 40,904 teachers; and 48,470 classifiedemployees. In 2000-2001, the statewide expenditure for teachers’ salaries was $1,470,490,954and for classified employees salaries totaled $651,858,590.
TEACHERS AND CERTIFIED PERSONNEL
According to recent research, compensation and benefits are a factor in the ability of alocal board of education to recruit and retain teachers. Although many experienced teachers haveindicated salary was not a factor in their choice to enter teaching, they believe that it is importantto young people who are making career choices. The lack of career advancement opportunities inteaching and the long-term level of compensation and benefits do play a role in both recruitmentand retention.
Kentucky is faced with the dilemma of relatively flat teacher salaries and increased costsfor health care benefits, which makes teaching less appealing at the very time when the state isexperiencing a shortage of teachers and a growing number of emergency certified teachers.
Finding qualified applicants has become increasingly difficult. The number of emergencycertificates has grown each year. In 1998-1999, Kentucky approved 506 emergency certificates;in 1999-2000, 931; and by March 2001, it had approved 1336 emergency certificates for the2000-2001 school year. Other states are facing similar problems.
viii
Keeping existing teachers in the classrooms as well as recruiting new persons to theprofession are the best ways to alleviate teacher shortages and decrease the number of emergencycertified persons. A significant percentage of Kentucky’s teachers is eligible for retirement, andrecruitment of new teachers is difficult as other professions appeal to many of Kentucky’sbrightest people. However, the challenge of meeting the teacher demand may be partially met byincreasing beginning teacher salaries and benefits, providing career advancement opportunities,and providing incentives for existing teachers to achieve higher levels of skill and knowledgewith opportunities to provide classroom leadership to other teachers (Cornett, 2001).
While Kentucky’s student population has not grown, it has become more diverse. Someprogress has been made in recruiting a more diverse teaching force, but the lack of minorityteachers and teachers skilled in a variety of languages still exists. Kentucky’s teachingpopulation is similar to the rest of the nation—a predominantly female, white population (78%).
Kentucky’s relative position in the ranking of teachers’ salaries compared to other statesis always changing as other states also work to improve salaries for teachers. However,regardless of what data source is used, Kentucky ranks in the bottom half of the nation in averageteachers’ salaries. Based on “1999-2000 NEA: Education Statistics,” Kentucky is thirty-secondin average teachers’ salaries at $36,380 as compared to the national average of $41,724. Perhapsmore importantly, higher salaries prevail in many of the school districts in states adjoiningKentucky, creating significant competition for teachers. All of the surrounding states exceptMissouri, Tennessee, and West Virginia have average salaries that are higher than Kentuckybased on 1999-2000 data.
Kentucky’s salary schedule reflects a pattern that results in teachers’ salaries increasing ata greater rate during the first half of a teacher’s career than the second half, which is both a resultof greater salary differentiation among the lower cells as well as teachers earning different rankstatus. The prescribed minimum salary schedule stops at twenty years and over. The schedulemay act as a disincentive to those comparing the long term career financial opportunity ofteaching with other professions.
Legislation enacted by the 2000 General Assembly gives selected teachers an opportunityto earn salary supplements for attaining national board certification, serving as mentors to otherteachers in approved activities, and serving as supervising teachers of student teachers. TheGeneral Assembly also increased stipends for teachers who serve as resource teachers to teacherinterns and provided an option of graduate course tuition waivers for those teachers serving asresource or supervising teachers. While these areas are viewed as excellent opportunities, theyreach only a few hundred teachers annually.
Kentucky’s benefits are similar to other southern states. Kentucky’s retirement programis highly competitive and superior to many other states with excellent pay-out provisions andhealth insurance for retirees. The number of paid holidays and sick leave days is comparable tothose of other states as well. Kentucky teachers are also provided a life insurance policy. On theother hand, the rising costs for health insurance and the lack of options for health insuranceproviders in many locations in the state have added to the anxiety and dissatisfaction ofKentucky teachers. Since Kentucky does not subsidize the cost of dependent health insurance

ix
coverage as do a majority of other states that have state group plans, the dependent health carepremiums paid by members of the Commonwealth Group are substantially higher than theaverage of other states, according to a report by the Commonwealth Health Insurance Board.
Believing that “every Kentucky child is entitled to have a highly qualified, caring teacherin every course and classroom,” the Interim Joint Committee on Education adopted principles tobe considered as a basis for a long-range strategy. The long-range plan should:
• Build on the past by continuing to support a basic salary schedule that provides equityregardless of the school assignments, the subject area assignments, and race or gender ofthe teachers, and provide options as well as incentives to school districts to developprofessional compensation plans that supplement or modify the schedule to accommodateunique community needs;
• Recognize the importance of raising the minimum basic salary levels for beginning aswell as more experienced teachers as revenue permits in order for Kentucky to competewith the surrounding states for teachers and to make the teaching profession competitivewith other professions that are recruiting persons to their fields;
• Acknowledge that Kentucky has demanded from its teachers that they teach to newstandards, that they bear greater risks than in the past, and that they take greaterleadership roles within the total school program. Further, many teachers may feelunprepared to deal with the cultural and language diversity, the needs of children withdisabilities, classroom management and discipline, and to effectively engage parents inthe educational process. More time for planning, curriculum research and development,working with other teachers, and professional development is needed to meet theseincreased demands;
• Acknowledge that the public may not see that increased salary and benefits are needed asteachers may be among the highest paid persons in some communities; they perceiveteachers work fewer days and hours than others; and other professionals in somecommunities may not be paid well either. However, it is likely that the public willsupport increased pay for teachers who acquire more knowledge and skill and who worka longer work year, and to ensure that teachers’ salaries are competitive with otherprofessionals in hard to fill content areas; and
• Support the research finding that teachers are the most important variable in how wellstudents learn and achieve—more important than socio-economic status and otherfactors. It is our responsibility to provide adequate compensation and benefits to developand retain a supply of highly qualified teachers.
x
CLASSIFIED EMPLOYEES
Classified school employees perform valuable services to the public education system.They are a dedicated, caring group of individuals who are generally career employees in theschool districts. Comprising 50% of all public school employees in the state, the classifiedservice is dominated by female employees at 79% and male employees totaling 21% of theworkforce. Instructional assistants, bus drivers, cooks and bakers, and custodians comprised over50% of the total number of classified employees.
The primary concern of classified employees is inadequate salaries. Among the full-timeemployees who work seven hours per day with a total of 180 contract days, about 16% earned$12,000 or less per year, and 9,990 earned $12,000 to $20,000. The majority of employees are inthe instructional, operations, and secretarial/clerical job classifications. Job classifications withthe largest number of employees have pay ranges beginning at minimum wage, $5.15:instructional assistants, bus drivers, custodians, and cooks/bakers.
Two thousand six hundred and eighty-one employees perform multiple jobs, somepaying minimum wages, and 88% or 2359 of the employees have at least one job as aninstructional assistant, bus driver, or bus monitor. The average salary of multiple job employeesis $18,352 with the range between $12,000 and $35,000.
Salaries of school employees are primarily funded through the Support EducationExcellence in Kentucky (SEEK) program. Once funding is received, a school district has thediscretion to allocate funds based on programmatic objectives. When comparing the state, localand federal contributions to education in 1999-2000, state revenues make up the greater portionwith 56% or $3,807 average expenditure per pupil: local revenue at 33% or $2,244 per pupil; andfederal revenue at 11% or $746 per pupil. Based on the 2001-2002 payroll, a 1% increase insalaries is estimated to cost $6.5 million; a 5% increase would cost $32.6 million; and a 10%increase is estimated at $65 million.
While shortages in available personnel have not affected the majority of school districts,some have found it difficult to recruit persons in job classifications such as bus driver andcustodian. A reason has been the inability to provide competitive salaries for certain jobclassifications because of the wide availability of jobs in the private sector.
Compensation and benefits of classified employees are fixed by local boards ofeducation pursuant to KRS 160.290. Absent from state law is a requirement that school districtsadopt salary schedules for classified employees. Salary schedules are regarded as essential toolsfor providing structure for a compensation system and for providing equity in job classificationsand job types, and the majority of districts do maintain schedules. Of 176 school districts, 167school districts submitted salary schedules at the request of the subcommittee. The schedulesvary considerably across the school districts. Moreover, salaries and wages are enhanced byextra duty, educational achievement, and in a few school districts, by performance evaluations.
The benefit package for classified employees is comparable to private sector employeesfor the same job classifications as well as comparable to other state and county employees.
xi
School districts provide sick leave, emergency leave, training opportunities, retirement, andhealth and life insurance. However, the increasing costs of health insurance are troubling tomany employees who depend on this coverage for their families, particularly when salaries forclassified employees remain relatively low.
In school years 1999-2000 and 2000-2001, a total of 172 and 173 school districtsrespectively, awarded cost of living adjustments to classified employees without a state mandate.The majority of districts granted increases that were equal to or in excess of the increasesawarded certified employees during these periods: 97 districts in 1999-2000, and 118 districts in2000-2001.
KRS 158.6455 requires that rewards distributed to successful schools shall be used forschool purposes as determined by the certified teachers on staff. Based on the accountabilitytesting system, known as KIRIS Cycle III (1996-1998), there were 511 of 902 successful schoolsand 538 of 743 successful schools in Interim Accountability Cycle (1996-2000) that sharedreward monies with classified employees. The amount or percentage of the reward given toclassified employees is not known according to the Kentucky Department of Education (KDE).However, a full-time certified teacher received an average of $959.00 in 1999-2000. Thedistribution of rewards has caused disharmony in some school districts and some classifiedemployees have expressed their discontent about the lack of financial recognition for their effortsand contributions to school success.
For service after July 1, 2000, classified employees who average 80 or more hours ofwork per month and who are paid for 180 or more days are eligible to earn a full year ofretirement service credit in accordance with KRS 78.510 and 78.615. Classified employeeswhose total paid days are less than the 180 days may purchase credit according the rulesestablished by the County Employees Retirement System.
This provision has generated discussion and concern for those employees who havecontracts based on 175 instructional days and do not meet the statutory requirement. There isanecdotal evidence that some school districts have added additional days so that the 180 daythreshold is met and classified employees can earn a year’s credit.
Recommendations Relating to Teachers
1. Retain a single salary schedule that recognizes educational rank and experience fordetermining base pay and provide options for salary supplements beyond the base.
2. In the 2002 Regular Session of the General Assembly, adopt a required minimum salaryschedule in the biennial budget that reflects the actual beginning salaries of teachers inthe state and adjust the cells proportionately in order to establish the base from whichfuture salary adjustments are made.
3. Beginning in the 2003-2004 school year or when state funding to supplement existingsalaries is available, modify the cells in the state single salary schedule by establishing a
xii
cell for 20-24 years experience, one for 25-29 years experience, one for 30 and beyondyears experience with a $500 to $1000 minimum incremental difference among thesenew cells. If the existing district schedule provides for the pay differential, no additionaladjustment is required and a teacher would not receive a pay increase under theseprovisions unless the district chose to do so.
4. If funds are available, beginning in the 2004-2006 biennium, require that the localdistricts raise the basic salary at all salary cells in the single salary schedule by aminimum of $1000 or a proportional amount based on the state appropriations for thispurpose.
5. In addition to increases in base salaries, beginning in the 2004-2006 biennium or whenfunds become available and in the subsequent biennia, lengthen the work year as follows:
6. 2004-2005 School Year—Add two additional days for instruction and one day forprofessional development to equal a 188 day calendar (177 days instruction, 5professional development days, 4 holidays, 1 opening and 1 closing day)
2005-2006 School Year—Add two additional days for instruction and one day forprofessional development to equal a 191 day calendar (179 days instruction, 6professional development days, 4 holidays, 1 opening and 1 closing day)
2006-2007 School Year—Add one additional day for instruction and one day forprofessional development to equal a 193 day calendar (180 days instruction, 7professional development days, 4 holidays, 1 opening and 1 closing day)
2007-2008 School Year—Add one additional day for professional development to equal a194 day calendar (180 days for instruction, 8 professional development days, 4 holidays,1 opening and 1 closing day)
7. Provide supplemental funding to local districts to ensure teachers the same cost of livingadjustment that is provided state government workers beginning with the 2002-2004biennium.
8. Adequately fund in the 2002-2004 biennium and in subsequent biennia, the supplementsfor teachers who earn National Board Certification, and in future biennia considerincreasing the supplements; and
9. Increase funds when available for those who serve as resource teachers to interns; whoserve as supervising teachers; and who serve as classroom mentors.
10. Establish a state fund to be administered by the Kentucky Department of Education forthe purpose of supporting the development of at least five local district pilot,differentiated pay programs that are designed to decrease the number of emergencycertified teachers employed in the district, provide career advancement opportunities forclassroom teachers who voluntarily wish to participate, and reward teachers forincreasing their skills, knowledge and instructional leadership within the district or school
xiii
based on specific criteria established by the local board of education and in compliancewith the criteria for participation in the competitive grant process as established by theKentucky Board of Education.
11. Require the Kentucky Department of Education to gather information from the districtpilot compensation plans and provide recommendations to the General Assembly prior tothe 2004 regular session regarding the feasibility of establishing a statewide teacheradvancement program.
12. Establish a state fund designated for local districts to “grow their own teachers” byproviding loans to emergency certified personnel and existing classified personnel suchas teachers’ aides to become certified to teach in their districts. Design this as a loanforgiveness program so that the individual gives service back to the district for fundsreceived. Provide that the Kentucky Higher Education Assistance Authority manage thefund.
13. Continue funding a statewide recruitment plan and encourage the Kentucky Departmentof Education to continue efforts under way to attract high school students and collegestudents to teaching through teacher clubs and other efforts.
14. Modify the current scholarship program for teachers to eliminate the need-basedrequirement only for existing certified teachers to receive scholarships to return to schoolto become certified in chronic teacher shortage areas, as determined by the Commissionerof Education in cooperation with the EPSB, in areas such as special education, math,science, foreign language or any area where there is a determined critical shortage.
15. During the 2002-2004 require the Legislative Research Commission to conduct aresearch study of the Kentucky Teacher and Principal Internship programs and report thefindings to the Interim Joint Committee on Education with recommendations, includingbudget recommendations for improving the existing internship program, includingmentoring support for second year teachers.
16. Clarify in statute that local school districts may provide additional salary compensationabove the base single salary schedule for teachers who are recruited to serve in criticalshortage areas including geographic, subject matter, or diversity; and teachers who agreeto transfer from a high-performing school to a low-performing school. Require theKentucky Board of Education to promulgate administrative regulations to define high andlow-performing schools, acceptable transfers within shortage areas, and the conditionsunder which the additional salary compensation may be provided for these purposes.
17. Urge the General Assembly to consider funding a supplement for dependent carecoverage for health insurance plans.
18. Urge the Council on Postsecondary Education, in collaboration with the Kentucky Boardof Education, to include a provision in the criteria for developing Model TeacherPreparation programs for paid sabbaticals for a limited number of experienced teachers toparticipate in professional renewal and growth activities with the university.

xiv
19. Consider funding to support administrative aides for special education teachers in localschool districts.
20. Urge the federal government to fully fund special education, and continue to advocate tostate and federal officials the need to reduce paper work burdens on teachers in specialeducation.
21. Support amending the current law to permit retired teachers to return to full-time teachingwithout regard to the number who may do so as long as it is actuarially sound for theretirement system.
Recommendations Relating to Classified Personnel
1. KRS 158.6455 should be amended to require that if certified employees elect to grantbonuses, reward monies shall be distributed equally to all certified and classifiedemployees in the school.
2. The Kentucky Board of Education should review the formula for calculating the rewardamounts to be disbursed to successful schools and consider adding classified employeesin the formula.
3. The Kentucky Department of Education should be granted greater oversight of thefinancial management and evaluation of school districts. The department should begranted authority to establish standards for school financial management and to conductfinancial audits on a random basis.
4. Local districts should continue to grant cost of living increases to classified employeesand that the increase should be equal to the increase provided to certified employees.
5. The Kentucky County Employees Retirement System and the Kentucky Department ofEducation are directed to review the number of days required for classified employees toreceive a year’s credit for retirement and find solutions to include those employees whowork fewer than the required 180 days and 80 hours a month.
6. Any increase in salaries for classified employees should be funded through the SEEKformula.
7. Increases to salaries of classified employees also may be funded through a state/localmatch program that is established outside of the SEEK program.
8. The local boards of education should establish salary schedules for the various jobpositions comprising the district’s classified employee system.
Actions of the Interim Joint Committee on Education
The Interim Joint Committee on Education accepted the reports of the subcommittees andthe recommendations as stated above on December 5, 2001.
1
CHAPTER I
INTRODUCTION
The Interim Joint Committee on Education was directed by 2000 SCR 88 to studycompensation of teachers and to develop recommendations so that by 2004 Kentucky’s teacherssalaries and benefits mirror the national average. The committee was also directed under 2000HCR 114 to conduct a study of the compensation of classified employees to determine itsadequacy and make recommendations regarding the propriety of a statewide salary schedule,cost of living adjustments, and the financial impact of these measures on the state and localschool districts.
The Interim Joint Committee on Education adopted a workplan on February 6, 2001,which assigned the major study functions to a Subcommittee on Teacher Compensation and aSubcommittee on Classified Personnel Compensation. Between February and April 2001,education committee staff prepared briefing materials for the committee and a web-based surveycalled Compensation, Benefits, & Personnel Policies for Classified and Certified Personnel(Appendix A). The survey questions were initially reviewed by a local school districtsuperintendent and revisions were made based on his input. A field trial was conducted using theweb-survey with three school districts for technical effectiveness. After some minor adjustmentsto the data fields, superintendents were sent a letter describing the purposes of the survey and ahard-copy of the survey from the co-chairs of the committee in advance of e-mailing the websurvey to the 176 superintendents and all local district finance officers in April 2001. Districtswere asked to complete and transmit the survey response electronically within two weeks ofreceiving the e-mail directions. A reminder e-mail was sent to all superintendents of districts thathad not responded by April 30, 2001. One hundred twenty-nine districts responded by the Maymeeting of the subcommittees. At the request of the subcommittees, follow-up to the non-reporting districts was made and 173 of the 176 local school districts were included in the surveyfinal analyses, which was completed in July 2001. Non-reporting districts included Adair Countyand Fulton Independent. McCracken County’s completed survey was received after theresponses had been tabulated.
In addition, to the above LRC survey, summary statistics were drawn from data suppliedby the Kentucky Department of Education from district data supplied annually through theProfessional Staff Data and Classified Staff Data systems. Analyses of this data were conductedby staff from the Office of the Economists and the Program and Investigations Committee,including regression analysis that used the data on individual teachers and district-specificinformation to establish relationships between various components of the salary schedules usedby the school districts. Other materials prepared for the committee included a review of existingstatutes; national and state studies; and legislative actions in other states.
In April 2001, the interim committee held an initial meeting to discuss teachercompensation which was immediately followed by meetings of the respective subcommittees. Atthe full committee meeting, the senior vice-president of the Southern Regional Education Board
2
set the stage for the study by relating national issues regarding recruitment, retention,compensation, and benefits for teachers as well as current policy trends among the Southernstates. She highlighted pertinent data and suggested the importance of adopting state policies thatwould help Kentucky retain existing teachers and entice persons to pursue teaching as a career.
The Subcommittees on Teacher Compensation and Classified Personnel Compensationheld five additional meetings each. During these meetings additional information and data weregathered from testimony from a variety of stakeholders including national researchers, stateeducation agencies, private advocacy groups, business and citizens groups, local school districtpersonnel, and state agencies including the Kentucky Department of Education and theEducation Professional Standards Board (Appendix B).
Chapter II of this report provides a review of the current statutory provisions relating tocompensation and benefits of teachers and classified personnel. Chapter III provides a detailedreview of the status of teacher compensation and benefits in Kentucky and also providescomparison data with other states and with other professions. Chapter IV provides a detailedreview of compensation and benefits of classified personnel in Kentucky. Chapter V provides thefindings and recommendations that the Interim Joint Committee on Education accepted onDecember 5, 2001.

3
CHAPTER II
STATUTORY REQUIREMENTS RELATING TOCOMPENSATION AND BENEFITS OF SCHOOL PERSONNEL
REQUIREMENTS FOR TEACHERS AND OTHER CERTIFIED PERSONNEL
Contracts and Tenure
Kentucky law requires that a local board of education enter into written contracts, eitherlimited or continuing, for the employment of all teachers, which applies to any position forwhich certification is required (KRS 161.730). Any teacher who has had four years ofconsecutive reemployment in a district shall be provided a continuing contract beginning thefifth year of teaching, as long as the teacher has proper certification. This is commonly referredto as receiving “tenure” or “continuing status.” When a teacher has attained continuing contractstatus in one district and becomes employed in another district, the teacher shall retain thatstatus. However, a district may require a one year probationary period of service in the districtbefore granting that status (KRS 161.740).
Salary Schedule
Kentucky, like most states, provides for a minimum single salary schedule. Kentucky’ssingle salary schedule is defined as a schedule adopted by a local board of education from whichall teachers are paid for one hundred and eighty-five days and is based on training, experience,and any other factors that the Kentucky Board of Education may approve and which does notdiscriminate between salaries paid elementary and secondary teachers. If the biennial budget billcontains a minimum statewide salary schedule, no teacher shall be paid less than the amountspecified in the biennial budget salary schedule for the individual teacher’s educationalqualifications and experience (KRS 157.320).
Education Ranking of Teachers
Ranking of teachers is assigned by the Education Professional Standards Board (theBoard) by meeting the following requirements:
Rank I. Those holding a regular certificate, a Master’s degree or equivalent continuingeducation and who have 30 hours of approved graduate work or equivalent continuing educationor those who have met the requirements of Rank II and current certification of the NationalBoard for Professional Teaching Standards.

4
Rank II. Those holding a regular certificate and who have a Master’s degree in a subjectfield approved by the Education Professional Standards Board or equivalent continuingeducation.
Rank III. Those holding regular certificates and who have an approved four year collegedegree or the equivalent.
Rank IV. Those holding emergency certificates and who have 96 to 128 semester hoursof approved college training or the equivalent.
Rank V. Those holding emergency certificates and who have 64 to 95 semester hours ofapproved college training or the equivalent.
The Board, in defining preparation for certain types of vocational teachers as equivalentto college training, gives consideration to apprenticeship training and industrial experience (KRS161.1211).
Cost of Living Adjustments to the Salary Schedule
Kentucky teachers receive annual cost of living increases under provisions of KRS157.420, which requires the Kentucky Board of Education only approve a salary schedule for alocal board of education that has been adjusted over the previous year’s salary schedule by thelesser of:
(a) The percent increase in the average annual consumer price index for all urbanconsumers between the two most recent calendar years, as published by the U.S.Bureau of Labor Statistics and stated in the statutory budget memorandum and thebiennial budget report; or
(b) The percent of increase of the base funding level in the Support EducationExcellence in Kentucky (SEEK) program.
Although teachers are as a rule employed for less than ten months, a local board ofeducation under provisions of 702 KAR 3:060 may pay all employees in twelve monthlypayments.
Adjustments and Supplements to the Salary Schedule
Kentucky teachers may receive additional compensation above the district single salaryschedule. A district may extend the school calendar beyond the 185 days or provide additionalpaid days or salary supplements for selected personnel based on extra service. In additionteachers may receive pay for selected state defined or funded initiatives as follows:
• National Board Certification. KRS 157.395 provides that effective July 14, 2000 anannual national board certification salary supplement of $2000 be provided for the life of
5
the certificate as long as the teacher stays in the classroom or does classroom mentoring.The supplement ceases if the teacher no longer has national certification or leavesteaching. The supplement is added to the base salary and is counted for both tax andretirement purposes.
• Extra Services. 702 KAR 3:070 provides that professional personnel who render servicesbeyond those normally expected of other professional members of the staff when theseduties extend beyond the regular school day may be allowed increments in pay.Expenditures for increments for extra duties classified as extra service shall be paid fromlocal revenue or funds other than the allotment for instructional salaries in SEEK.
• The Kentucky Internship Program. The internship program for new teachers as describedin KRS 161.030 requires that teachers and principals serve on internship committees asresource personnel. Teachers who serve as resource teachers receive a stipend for theirwork, which must be at least seventy hours working with the beginning teacher. During2000-2001 the resource teacher received $1200 and for 2001-2002, $1400 per intern.Principals do not receive a supplement for serving on internship committees.
• Supervising Teachers. Teachers who serve as supervising or cooperating teachers forstudent teachers under provisions of KRS 161.042 receive a stipend based on the numberof students supervised. Prior to the 2000-2001 school year, teachers received a very smallamount from the university they served. 2000 RS HB 502 provided, for the first time, astate allocation to be distributed by the Education Professional Standards Board for thispurpose. There were approximately 2550 supervising teachers who received supplementsfor their work during the 2000-2001 school year. A supervising teacher received asupplement of $328.00 for each student teacher supervised for twelve weeks. A teacherwho provided less than twelve weeks supervision received a pro rata share.
• Vocational Agricultural Teachers. KRS 157.360(11) requires that each vocationalagriculture teacher be hired for twelve months per year, but an agriculture teacher maynot receive pay for any day in which the teacher is attending a higher education class forpurposes of teacher certification.
• Rewards. KRS 158.6455 provides that a reward shall be distributed to successful schools(those that exceed their improvement goal set by the Commonwealth AccountabilityTesting System) based on the number of full-time, part-time, and itinerant certified staffemployed in the school. These rewards may be used for multiple purposes including, butnot limited to, instructional materials, professional development, and cash awards toteachers and other staff.
Benefits
Current Kentucky law ensures several benefits for teachers and permits additional fringebenefits to be provided by each local school district under KRS 160.291 that are deemed to befor services rendered and for the benefit of the common schools.
6
Teachers are required to participate in the Kentucky Teachers’ Retirement System and donot contribute to Social Security; however, they are required to make Medicare contributions. Ateacher may qualify for service retirement by the attainment of sixty years and completion of fiveyears of service; 55 years of age and completion of a minimum of five years of service with anactuarial reduction of the basic allowance of five percent for each year the member’s age is lessthan sixty years or for each year the member’s years of Kentucky service credit is less than 27whichever is lesser; or completion of 27 years of service regardless of age. The retirementsystem may allow that annuities be based on the high three years of salary for those who are 55years of age and have a minimum of 27 years service. Others are on the basis of five high yearsalaries (KRS 161.600).
Teachers are guaranteed sick leave under KRS 161.155 of not less than ten days of sickleave during each school year, without deduction of salary. The ten days of sick leave grantedmay be taken by a teacher on any ten days of the school year and shall be granted in addition toaccumulated sick leave days. Sick leave days accumulate without limitation and may betransferred with an employee from one district to another and between the Kentucky Departmentof Education and a school district. Each local board of education is required to establish a sickleave donation program to permit teachers or employees to voluntarily contribute sick leave toteachers or employees and may establish a sick leave bank.
A local board of education may compensate a teacher, at the time of retirement, for eachunused sick leave day. The rate of compensation for each unused sick leave day shall be basedon a percentage of the daily salary rate calculated from the teacher’s last annual salary, not toexceed 30%. Payment for unused sick leave days shall be incorporated into the annual salary ofthe final year of service; provided that the member makes the regular retirement contribution.
In addition to sick leave, emergency or personal leave may be provided. KRS 161.152(2)provides that a local district may allow that any full-time employee be provided up to three daysfor emergency leave and not affect sick leave for purposes established by the local board ofeducation, and KRS 161.155 provides that in addition, three days of sick leave may be used foremergencies under KRS 161.152(3).
Teachers are covered under the provisions of the state health insurance program and areprovided $20,000 life insurance protection, the same as state employees. The Kentucky RetiredTeachers’ System also provides $2000 life insurance for active members. KRS 161.158 providesthat each local board of education may form its employees into a group or groups or recognizeexisting groups for the purpose of obtaining the advantages of group life, disability, medical, anddental insurance, or any group insurance plans to aid its employees.
The insurance provisions are defined in 702 KAR 1:035, which provides that grouphealth coverage shall consist of a single contract or the single contract dollar equivalent appliedto any alternate plans of coverage contained in the master contracts between the Commonwealthand the carriers; and group life insurance coverage shall consist of benefit amounts specified inthe master contract between the Commonwealth and the carrier.
7
REQUIREMENTS FOR CLASSIFIED EMPLOYEES
Definition of Classified Employee
KRS 161.011 defines “classified employee” as an employee of a local district who is notrequired to have certification for his or her position. This statute and KRS 160.380 require thatclassified employees have the qualifications prescribed by law and by the administrativeregulations of the Kentucky Board of Education and of the employing school board. Employeeshired after July 1990 must hold at least a high school diploma or GED certificate or showprogress toward obtaining a GED by enrolling in a GED program and making satisfactoryprogress. Classified employees hired before July 1990 are encouraged to obtain a high schooldiploma or its equivalent.
Contracts and Continuous Active Service
KRS 161.011 requires school districts to enter into written, annually renewable contractswith classified employees. Employees who have served less than four years and are notified byApril 30 that the contract will not be renewed for the subsequent year may request thesuperintendent to provide written reasons for the nonrenewal. Classified employees with fouryears of continuous active service whose contracts are not renewed may request thesuperintendent to provide a specific and complete written statement of the grounds fornonrenewal of the contract.
Pursuant to KRS 161.011, a school district can make a reduction in force due to reductionof funding, enrollment, or changes in the school or district boundaries, or other compellingreasons. When a reduction in force is necessary, the superintendent shall reduce the classifiedemployees within each job classification on the basis of seniority and qualifications of thoseemployees who have less than four years. If it becomes necessary to reduce employees who havemore than four years of service, it shall be done on the basis of seniority and qualificationswithin each job classification. The recall of positions must be done according to seniority and therestoration of benefits. Local boards of education shall also provide written policies which shallinclude, but not be limited to, terms and conditions of employment, identification anddocumentation of fringe benefits, employee rights, and procedures for the reduction or laying offof employees, and discipline guidelines that satisfy due process requirements.
Salaries and Salary Schedules
There is no statutory requirement for a statewide, single salary schedule for classifiedemployees. KRS 160.290 authorizes each board of education to have general control andmanagement of the public schools, all school funds, and public school property, and to exerciseall powers prescribed by law in the administration of the public school system, appoint thesuperintendent of schools, and fix the compensation of employees. In addition, KRS 160.291requires employees who work on a continuing, regular basis to be paid for services rendered,
8
extra duty and fringe benefits on prescribed dates as determined by the employing school district.Procedures for payment are established in 702 KAR 3:060.
Specific requirements are imposed on local school districts regarding the employment ofsome classified employees. 702 KAR 6:040 requires that each school district establish and adopta uniform pay scale for full-time school food service employees and that each school districtprovide worker’s compensation and fulfill minimum hourly wage rates for school food servicepersonnel. KRS 161.011 provides that classified employees of family resource and youth servicecenters shall receive the same rate of salary adjustment as provided for other local board ofeducation employees in the same classification; however, the law is silent regarding cost ofliving increases for other classified employees.
KRS 161.145 provides that except for bus drivers, physical examinations required as acondition of employment are provided by the county health department at no cost to theemployee unless he or she chooses to be examined by a private physician. KRS 160.380 requiresthat persons initially hired as classified employees submit to a state criminal background checkconducted by the Kentucky State Police.
Group Health and Life Insurance Programs
KRS 161.158 permits each district board of education to form its employees into a groupor groups or recognize existing groups for the purpose of obtaining the advantages of group life,disability, medical and dental insurance or any plan to aid its employees. 702 KAR 1:035establishes the basis for administration of the programs by the Department of Education andprovides that group health coverage shall consist of a single contract or the single contract dollarequivalent applied to any alternate plans of coverage contained in the master contracts betweenthe Commonwealth and the carriers; and group life insurance coverage shall consist of benefitamounts specified in the master contract between the Commonwealth and the carrier.
Retirement Program
Classified employees are covered under the County Employees Retirement System. KRS78.510 et seq. establish the County Employees Retirement System and coupled with an employercontributing 7.17% of an employee’s salary, full-time noncertified employees of local schoolboards who average eighty or more hours of work per month based on the employee’s contractcontribute 5.0% of his or her creditable compensation. Effective in school year 2000-2001, a fullyear of service will be earned by any employee who works 180 or more days and averages eightyhours or more per month. KRS 61.559 provides that an employee is eligible for retirementallowance if the employee has 27 or more years of service, at least fifteen of which are currentservice.
9
Emergency and Sick Leave
KRS 161.152 provides that a local district may allow any full-time employee up to threedays for emergency leave and not affect sick leave. A local school district may grant to schoolemployees sick leave which may accumulate without limitation and shall be transferred in theevent the employee transfers employment to another school district in the state, to the KentuckyDepartment of Education, or transfers from the Department to a school district under KRS161.155. Employees may use up to three days sick leave per school year for emergency leavepursuant to KRS 161.152. Employees may also contribute to a sick leave donation program if theemploying district offers the program. Upon retirement or the death of an employee who was anactive contributing member of the retirement system, the local school district may compensatethe employee’s estate for the unused sick leave.
Training Opportunities
KRS 161.011 provides that local school districts, if financially feasible, may providetraining for classified employees focusing on topics including, but not limited to, suicideprevention, abuse recognition, and cardiopulmonary resuscitation (CPR).
Superintendent’s Screening Committee
KRS 160.352 requires that classified employees in the school district elect one classifiedemployee to serve on a screening committee to recommend candidates for the office ofsuperintendent when a vacancy occurs.
School-Based Decision Making Councils
KRS 160.345 states that if a school council establishes committees, it shall adopt a policyto facilitate the participation of classified employees. KRS 157.360 requires that kindergartenaides shall be provided for each 24 full-time equivalent kindergarten students enrolled except inthose schools in which the school-based decision making council has voted to waive thisprovision.
Certification, Licensing and Training Mandates for Classified Employees
Persons filling some positions are required by federal or state laws to possess specificlicenses, credentials, and standards of competence. Additional requirements may be imposed bya local school district. These are described below.
Food Service Personnel. Pursuant to the National School Lunch Act of 1946 42 U.S.C.Sections 1751 et. seq. and the Child Nutrition Act of 1966 42 U.S.C Sections 1771 et seq., and

10
administrative regulations of the Kentucky Board of Education the following relate to the hiring,compensation, training and qualifications of food service personnel.
• Local school district — 702 KAR 6:010 provides that the operation of food serviceprograms and the development of rules regarding the employment and salaries ofpersonnel are the responsibility of the local school district.
• Food service director — 702 KAR 6:020 provides that if the local board determines aneed for employing a food service director, the person appointed to the district-wideposition shall meet certification requirements established by the Kentucky Board ofEducation. 702 KAR 6:030 also provides if a food service director is not hired, the schoolprincipal shall be responsible for food service programs.
• Personnel — 702 KAR 6:040 establishes that food service personnel are hired undercontract establishing hours, terms and conditions; compensated based on a uniform payscale for full-time personnel and minimum wage rates; covered by workers’compensation; and provided training programs.
• Training course — 702 KAR 6:045 provides as a condition of initial employment in aschool kitchen, beginning school food service personnel shall complete a training courseconsisting of a minimum of seven hours conducted by the Kentucky Board of Educationand be issued a certificate that shall be renewed annually. Substitute school food servicepersonnel are also required to complete a four-hour training program.
Health Personnel. There are no statutory requirements that specific health personnel beemployed in a school district; however, certification for CPR and First Aid is required for at leastone adult while children are present during school hours in accordance with 704 KAR 4:020 (13)(b). If health related personnel are employed they shall meet the specific statutory and regulatoryrequirements for their respective positions.
• Registered Nurse — Qualifications for license to practice and use of the designation,R.N., are established in KRS 314.041.
• Advanced Registered Nurse Practitioner — Qualifications, registration, certification by anationally recognized agency and designation to practice are established in KRS 314.042.
• Licensed practical nurse — Qualifications for license to practice are established in KRS314.051.
• Speech—language pathologist, speech—language assistant or audiologist must belicensed in accordance with provisions of KRS Chapter 334A. which includescertification by the American Speech and Hearing Association (KRS 334A.050).Pursuant to KRS 334A.030, professionals who are employed in a public school shallreceive the same salary and benefits as certified teachers with Rank III and thecorresponding years of experience.
11
• Occupational Therapist — Requirements for licensure are set forth in KRS 319A.130.
• Physical Therapist and Assistants — KRS 327.020 and 327.050 outline the requirementsfor licensure in the state. 201 KAR 22:101 defines the supervision of practice forassistants.
Instructional Aides and Assistants. KRS 161.044 requires the Kentucky Board ofEducation to promulgate administrative regulations governing the qualifications of teachers’aides in the common schools. All teachers’ aides shall have a high school diploma or a generalequivalency diploma. Noninstructional and instructional aides are distinguished and localdistricts are to provide training opportunities for the instructional aides with the certifiedemployee to whom the aide is assigned. Local districts shall give preference to applicants for theposition of teacher’s aide who have regular or emergency teacher certifications. 704 KAR 3:410and 704 KAR 3:420 designate preschool associate teachers as classified employees in aparaprofessional role to direct instruction of preschool students under the supervision of acertified and qualified professional.
Maintenance and Operations/Building and Grounds Personnel.
• Persons trained in asbestos abatement — KRS 224.20-300 requires the NaturalResources and Environmental Protection Cabinet to develop and maintain acomprehensive statewide asbestos contractor accreditation program relating to asbestos inschools. 401 KAR 58:005 provides for an accreditation program for persons performingasbestos abatement activities in school buildings. These activities include inspection forasbestos in schools, design, supervision or performing response actions in schoolbuildings, and management plans addressing hazards in school buildings.
• Plumbers — KRS 318.030 requires persons engaged in the plumbing trade to be licensedas a master plumber or a journeyman under KRS 318.030. However, KRS 318.020exempts maintenance personnel from the requirement.
School Bus Drivers. 702 KAR 5:080 outlines the qualifications and responsibilities ofthe bus drivers, requiring medical examinations; criminal records check and driver historyreports; minimum age of 21 years; a commercial driver’s license with an endorsement for aschool bus; and certification by the Department of Education based on successful completion ofthe training course with in-service updates for annual recertification.
Security/Law Enforcement Officers. School districts are not required to employsecurity or law enforcement officers; however, if the district chooses to have school resourceofficers, KRS 158.441 requires the employment of a school resource officer through a contractwith a local law enforcement agency and a school district.

12
13
CHAPTER III
AN ANALYSIS OF TEACHER COMPENSATION AND BENEFITS
Teacher compensation and benefits were considered by the Subcommittee on TeacherCompensation within the broader context and discussion of ensuring that all Kentucky studentshave the benefit of high quality teaching that leads students to attain the capacities defined inKRS 158.645. The subcommittee recognized that Kentucky teachers have been asked to assumemore responsibility, meet higher qualifications, and respond to high stakes assessment andaccountability standards — all with little additional compensation and under circumstances inwhich Kentucky teachers’ salaries lag behind many of the surrounding states and statesthroughout the nation.
In its work the subcommittee considered the current research findings relating to teachingquality; the relationship between compensation, recruitment, and retention of teachers; thecompetitiveness of Kentucky’s teachers’ salaries with other states and other professions;legislative actions in other states; emerging pay plans in other states; concerns andrecommendations of stakeholders within Kentucky; and costs associated with improvingteachers’ compensation and benefits. At the same time, the subcommittee was cognizant of theadvice of one Southern Regional Education Board (SREB) consultant who urged the committee“to make sure that decisions made about teacher salaries link to the state priorities.” She alsourged the committee to recognize that Kentucky can increase its supply of teachers by keepingcurrent teachers in the classroom; to target problems and priorities in thinking about themarketplace; to view compensation as equal to salary and benefits, not just salary; and toconsider both group and individual incentives to meet Kentucky’s priorities (Cornett, 2001).
Nationally, teacher compensation has taken on renewed interest within the realm ofschool improvement. Policy makers, concerned with the ongoing demand to improve educationare also faced with making sure that there will be enough quality teachers to educate today’s andtomorrow’s generation of students. Many variables influence student achievement. Researchhighlights the important relationship between teaching quality and student achievement. Dr.William Sanders, while at the University of Tennessee, pioneered work in Tennessee using theTennessee Value-Added Assessment System that produced empirical evidence that teachereffectiveness is more important than the effects of class size and students’ backgrounds in howstudents perform (Sanders & Rivers, 1996). The work of Sanders was also used in Texas andyielded the same results.
The National Commission on Teaching and America’s Future, which was established tolook at implications for teaching embodied in school reforms and how to ensure that all studentshave access to skilled, knowledgeable, and committed teachers, determined that the mostimportant variable to student success is a caring, competent teacher. The Commission found thatin many states and districts the hiring practices, support systems, and rewards are out of synchwith student standards and goals for academic achievement. They reported that other countries
14
invest far more in preparing teachers, pay them more in relation to competing professionaloccupations, and give them broader decision-making authority. The Commission recommendedthat states and districts look at ways to use financial incentives to enhance teacher quality(National Commission on Teaching, 1996; Darling-Hammond, 1997).
Other evidence that teaching quality matters is reflected in the results of the MetlifeSurvey of American Teachers 2001, which was based on a nationally representative sample ofprincipals, students, and teachers and examined how teachers, principals, and students evaluatetheir own schools on key measures of an effective school environment, including, but not limitedto, the following questions:
• Are students experiencing high-quality teaching?
• Are academic standards and expectations for students high?
• What are students’ attitudes toward learning?
• What will be the state of teaching in the future?
• Do teachers feel satisfied with their career and plan to remain in teaching?
• Are today’s students interested in becoming teachers themselves?
In the Metlife survey, “teacher quality” was based on a combination of perceivedattributes, including how well teachers (1) knew their subject, (2) cared about their students, (3)believed all students could learn, (4) maintained discipline, and (5) taught individual studentsaccording to their different needs and abilities. The survey’s findings indicate that students whorate the quality of teaching they receive as a “B” or “C” are nearly half as likely as those ratingthe quality of teaching as an “A” to report that their school is helping a lot to prepare them for asuccessful future (41% vs. 75%). Similarly, teachers who rate the overall quality as “B” or “C”are less likely than those who rate the quality as “A” to report that all or most of their studentswill achieve their full potential for the school year (65% vs. 81%).”
Students who think their teachers excel in areas like knowing their subject, caring aboutstudents, believing all students can learn, maintaining discipline, and providing individualizedattention differ in several important ways from the nearly one in ten students who give theirteachers failing grades (D’s and F’s). Students who experience “A” level teaching quality aremore likely than students experiencing poor teaching quality to have high expectations for theirfuture, to like school, to enjoy their classes, to really like learning, to participate often in class,and to report that students in their school care about learning and getting a good education.Students who give their teachers failing grades are also those who are most likely to report thattheir schools do not have enough classrooms, are not very safe or very clean, and are too noisy toconcentrate (Metlife, 2001).
Low-income students are more likely than high-income students to rate teaching in theirschools as low-quality. Teachers in schools with high proportions of low-income students areless likely to give the teachers in their school an “A” in knowing their subject areas and caringabout students. Low-income students themselves give similar assessments (MetLife, 2001).
15
Low-quality teaching is perceived as more prevalent in schools with high proportions ofminority students. Students in schools with mostly minorities are less likely to give the teachersin their school an “A” in knowing their subject areas, caring about students, and maintainingdiscipline. In addition, teachers in schools with high proportions of low-income students are lesssatisfied with their school relationships and less satisfied with teaching. Teachers in theseschools feel less successful at their job and are more likely to feel frustrated and unappreciated attheir job (MetLife, 2001).
Overall, the Metlife study found that nine in ten teachers feel very or somewhat satisfiedwith their job, with 52% very satisfied. Teachers’ top reasons for feeling satisfied with their jobinclude working with students; having a rewarding profession; feeling good knowing a child haslearned; making a difference in a student’s life; seeing a child’s growth; and loving teaching. Onthe other hand, the eight percent of teachers who feel dissatisfied identified low salary andnegative working conditions as their reasons for being dissatisfied. Unfavorable workingconditions were further described as lack of administrative support; disciplinary problems; lackof resources; lack of respect; and classes that are too large.
The teachers that are the most satisfied are teachers with many years of experience andteachers in schools with few low-income students. “Satisfaction” is a teaching quality issue;satisfied teachers are overwhelmingly more likely than dissatisfied teachers to feel successful attheir job, to have control of what and how they teach in class, and to have clearly defined tasksand responsibilities. Dissatisfied teachers are more than six times as likely to feel frustrated andunappreciated at their job (Metlife, 2001).
The Metlife study raises some important questions relating to how states can attract andretain the most capable persons as well as how states can support the development of existingteachers and retain them. Important questions are: “How do the beginning salaries and careeradvancement opportunities fit into the overall picture?” and “How can working environmentsand support systems contribute to more interest and satisfaction in teaching as a career?”
1999 KENTUCKY TASK FORCE ON TEACHER QUALITY
The Kentucky Task Force on Teacher Quality in 1999 spent considerable time delvinginto ways to enhance teaching. The task force supported the notion that teachers andadministrators require professional preparation and long-term professional development toenable them to succeed in today’s classrooms and schools. Increasingly, public sentiment,reinforced by educators themselves, reflects concerns about the adequacy of the infrastructuressupporting teacher preparation, the quality of teacher preparation programs, the possibility offuture teacher shortages, the availability of professional development and support for existingteachers, the compensation, benefits, and work environments for teachers, and the overall stateleadership and policy functions that are necessary to enhance the teaching profession (LRCResearch Report, No. 297).

16
The 1999 task force agreed that incentives and career enhancements should be providedteachers through the duration of teachers’ careers and that salary and compensation structuresmust support Kentucky’s education goals. The current compensation structure does not addressthe current needs of the teaching force, nor does it appear attractive to potential teachers (LRCResearch Report, No. 297).
Two years later, the conditions the task force considered remain relatively the same—perhaps even more of a concern. Although Kentucky’s school population has not grown, criticalshortages of teachers loom throughout the nation and within the state, sparking an increase in thenumber of teachers who are teaching on emergency certificates. Some of the startling dataprojections include the following:
• The U.S. Department of Education has estimated that the nation will lose almost half ofthe teaching force due to retirement in the next ten years.
• Based on Education Week’s “Quality Counts 2000” report, the brightest novice teachers,as measured by their college entrance exams, were the most likely to leave the profession.
• According to the National Center for Education Statistics, it is estimated that 30 percentof all teachers and up to 50 percent of teachers in urban schools leave their jobs withinfive years. Out of every 600 students entering four-year teaching programs, only 180complete them, only 72 become teachers and only about 40 are still teaching severalyears later.
• Of the approximately 49,000 teachers and administrators, Kentucky has a significantnumber who leave districts annually. At the end of the 1999-2000 school year, more than3800 teachers and more than 300 administrators left their districts. The two main reasonsfor both teachers and administrators were retirement and taking a position in anotherdistrict. Unfortunately, the data does not indicate whether the primary reason fortransferring to another district was to improve salary and benefits, working conditions, oranother reason.
EMERGENCY CERTIFICATION
As noted previously, it is becoming increasingly difficult to find and retain fully preparedteachers for all public classrooms—a need that many Americans deem the most critical strategyto improving student achievement. In Kentucky, the number of retirees has been steady for thepast several years with the teachers’ retirement system reporting that approximately 2000 retireannually. Finding qualified applicants has become increasingly difficult. The number ofemergency certificates has grown each year. In 1998-99, Kentucky approved 506 emergencycertificates; in 1999-2000, 931; and by March 2000, 1336 emergency teachers were approved forthe 2000-2001 school year. All districts had at least one emergency certified teacher in 2000-2001; however, more than 58% of the emergency certificates were in ten counties of the state(Appendix K).
17
The largest number of emergency certificates was awarded in the learning and behaviordisorders area all three years. When this content area is combined with emergency certificates forteaching students who have “moderate and severe disabilities,” “visual impairments,” and“hearing impairments,” it is apparent that lack of teachers applying for certification for teachingexceptional children is a continuing, growing problem. Many other content areas are requiringemergency certified persons, which may suggest that shortages are developing in previouslyoversupplied areas such as language arts, social studies, and select vocational areas, andexpanded offerings in foreign language and English as a Second Language are increasingdemands for particular specialties (Appendix L). Districts also reported they had difficultyfinding principals, counselors, and qualified substitute teachers in 1999-2000 (LRCCompensation Survey, 2001).
While Kentucky’s student population has not grown substantially, it has become morediverse. While some progress has been made in recruiting a more diverse teaching force, the lackof minority teachers and teachers skilled in a variety of languages remains problematic.Kentucky’s teaching population is similar to the rest of the nation—a predominantly female(78%), white population (LRC Compensation Survey, 2001).
EFFECTS OF CURRENT COMPENSATION LEVELS ONRECRUITMENT AND RETENTION OF TEACHERS
While there are many factors that increase teacher shortages, including increasingnumbers of persons eligible for retirement, it is clear that compensation and benefits appear toplay a part in the ability to initially recruit teachers and to retain existing teachers. In the Metlifestudy mentioned earlier:
• One in eight teachers reports that he or she very likely will leave to teach somewhere elsein the next five years. For the three in ten who will very or fairly likely leave to teachsomewhere else, their reasons include moving, economics, and working conditions.
• One in eight teachers report that it is very likely that they will leave the teachingprofession altogether and go into some different occupation. Teachers who aredissatisfied with teaching are three times as likely as satisfied teachers to plan on leavingthe profession, although one in nine satisfied teachers very likely plans on leaving.
• Existing teachers indicate that the overwhelming change that would keep them in theprofession is an increased salary. Other changes that would keep them in the professionwere support from administration and smaller class size.
• Seven in ten teachers and three quarters of principals indicated that providing more timefor ongoing professional development related to daily classroom activities would help toretain quality teachers.

18
• Principals who indicated the likelihood of leaving stated a major reason is to obtain betterpay in another location. Other reasons were moving, wanting a new challenge, retiring,and career advancement.
• Responses to what would help in recruiting and retaining quality teachers were:
• Providing financial incentives
• Providing mentoring and ongoing support for new teachers
• Involving teachers in the creation of policies that they will be implementing
• Providing career growth opportunities
• Providing more time for ongoing professional development related to dailyclassroom activities
• Providing opportunities for networking or coaching for all teachers
SURVEY OF NATIONAL AND STATE “TEACHERS OF THE YEAR”
In a national study conducted in 2000 by the Chief State School Officers (CSSO) of 400national and state “Teachers of the Year,” the respondents indicated that the single mostimportant factor in the respondents’ original decisions to become teachers was their desire towork with children. Seventy-seven percent reported that their decisions were not influenced bythe lack of other options—teaching was a positive and desirable choice. Beginning teacher salarydid not factor heavily into the decisions to teach for 74% of the respondents. The respondentsbelieve that their observations of a new generation making the decision to teach are for similarreasons—a desire to work with children and a love of subject matter. However, 47% reportedthat salary potential is very important to today’s teachers, and a smaller number indicated thatbeginning teaching salary (43%) and advancement opportunities (38%) are also very importantfactors (Goldberg & Proctor, 2000).
A majority of respondents to the CSSO study indicated that while financial considerationwas not a major reason in their decisions to become teachers, they felt financial incentives werethe most effective recruitment strategies for new teachers. Eighty-three percent cited higherbeginning salaries; 75%, scholarship programs for education students; 64%, student loan“forgiveness” programs; and 60%, “signing” bonuses for both urban and rural teachers as themost effective strategies for recruiting quality teachers. Overall 82% considered teacher salariesto be a large obstacle standing in the way of recruiting bright, energetic individuals to theprofession. Fifty-one percent of the respondents identified career potential as an obstacle; 49%,the status of teachers; and another 49%, working conditions (Golberg & Proctor, 2000).
Eighty-nine percent of the respondents in the CSSO study indicated that beginningsalaries alone were not enough to retain new teachers—they also need administrator support andinformal and formal mentoring programs. Sixty-three percent thought more would remain in theprofession if they had lower class size; 60%, if they had systematic evaluation of their work; and58%, if teachers received more parental support (Goldberg & Proctor, 2000).

19
The CSSO study respondents indicated that school administrator support and better paywould encourage experienced teachers to continue teaching. Seventy-three percent cited a greatneed for an active role in school decision making. They indicated veteran teachers are motivatedby more planning time with peers (72%); opportunities to go on sabbaticals for professionalgrowth (64%); career advancement opportunities (57%); and ongoing professional development(57%). It should be noted that since the CSSO study is a select group, validation of the surveyresults may be needed by using the same or a similar survey with a more diverse teachingpopulation.
Kentucky teachers who participated in a series of two-hour discussion groups conductedby Horizon Research in September 2001 responded similarly to the teachers in the CSSO study.The participants’ primary reasons for becoming teachers were “to make a difference” in the lifeof a child; “to remain involved in a subject/knowledge area of choice”; and “to have a securejob/salary and reasonable standard of living.” They believe that teachers leave the professionbecause of their inability to control and manage time for planning and teaching content; lack ofrespect as a trained and well-educated professional; and unexpected and unreasonable salarydeductions for maintaining an acceptable standard of living, such as deductions for majormedical and dental care.
KANSAS STATE DEPARTMENT OF EDUCATION SURVEY
Similar results were found in a recent survey conducted by the Kansas State Departmentof Education of persons who were certified to hold teacher, administrator, and support positionsin the State of Kansas but were thought not to be working in a certified position. Seven hundredand fourteen responses were analyzed. One-third of the male and one-sixth of the femalerespondents were retired. Males indicated that the top reasons for not being employed in acertified position in an elementary or secondary school were inadequate salaries; other careerreasons; refusal to deal with student discipline problems; other employment; and lack of supportfrom administrators. Female respondents indicated unable to relocate to places of employment;other career reasons; staying home to raise children; refusal to deal with student disciplineproblems; inadequate salaries; and lack of support from colleagues. Respondents who had beenemployed in certified positions in the past indicated they were most satisfied with the differentaspects of their positions and least satisfied with salaries and lack of influence over schoolpolicies. Less than half of the respondents would definitely recommend the teaching professionto a friend (Kansas, 2000).
OPINION SURVEYS OF HIGH SCHOOL COLLEGE-BOUND STUDENTS
Other professions appear to have a competitive recruiting edge over teaching. A MilkenFamily Foundation public opinion survey of college-bound high school students found thatbarely one in ten expressed a strong interest in teaching. The most often cited reasons were thepoor image assigned to the teaching profession and the lack of respect for teachers. On the other

20
hand, a slightly higher figure was reported in the Metlife study. In that study, three in tenstudents (31%) indicated they were very or somewhat interested in becoming teachers when theyfinish their education, including 11% who were very interested. Students with good grades andpoor grades were equally likely to be interested in teaching. However, lower-income students aremore likely than high-income students to be very or somewhat interested (44% to 33%).Students’ main reasons for wanting to become teachers include the following: wanting to helpchildren (23%); liking children (15%) and sharing their knowledge of subjects they enjoy (10%).
In the same survey, 87% of principals indicated they would definitely or probably advisea qualified student to pursue a career in teaching, including 55% who would definitely advisebecause it is a rewarding career and because of the need for good teachers. Fifty percent of thoseprincipals who would not advise a student to pursue a career in teaching mentioned that it doesnot provide a great salary, and 37% indicated there is no prestige (Milken, 1999).
PUBLIC OPINION SURVEY OF TEACHING AS A BENEFIT TO SOCIETY
A 1998 public opinion survey indicated that teachers top the list in providing the mostbenefit to society, out ranking the next highest profession, physicians, by 3:1. Despite the valueplaced on teaching, medicine was the career the respondents would most recommend to a familymember. However, when respondents were asked if teachers were guaranteed an income of$60,000 a year, 81% indicated that they would encourage a family member to become a teacher.This suggests that salary is a strong influence on career choice (Haselkorn, 1998).
Some teachers have difficulty reconciling the findings in the public opinion survey notedpreviously with what they know about existing teacher salaries. They question whether societyreally values teaching, as they view salary as a symbol of how society values their work. Arespondent in the CSSO study that was noted earlier said “Raise professional respect by payingteachers salaries comparable to salaries received by other professionals who have similareducational requirements and degrees.” Another said, “Our culture doesn’t value teachers. That’sobvious from the way they’re compensated for their work. [Society] pays the people we admire.It’s a vicious cycle: The less we’re paid, the less we’re valued, the less we’re paid.”
SALARIES OF TEACHERS AND OTHER PROFESSIONALS
It is somewhat difficult to make comparisons of the teaching profession, a traditionallypublic-paid profession, with those professions that are found in the private sector. Dr. StephenClements suggested in a 1999 report that the entry salary for a beginning teacher in Kentucky isnot “grossly out of line with those other jobs available in the state that require a similar level ofeducational attainment.” He suggested that teachers receive respectable benefits beyond theirbasic salary. However, Clements conceded his data did not include comparisons with lawyers,doctors, and engineers, who may begin with modest entry level salaries but have much greaterlong term salary opportunities.
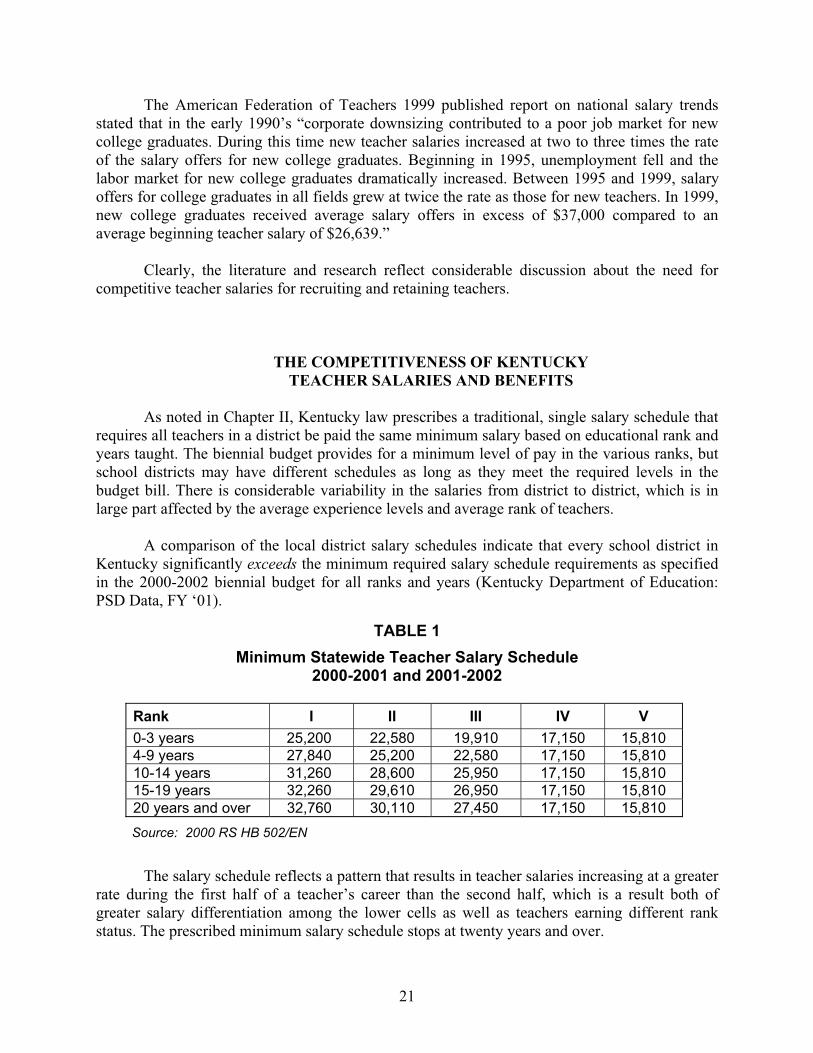
21
The American Federation of Teachers 1999 published report on national salary trendsstated that in the early 1990’s “corporate downsizing contributed to a poor job market for newcollege graduates. During this time new teacher salaries increased at two to three times the rateof the salary offers for new college graduates. Beginning in 1995, unemployment fell and thelabor market for new college graduates dramatically increased. Between 1995 and 1999, salaryoffers for college graduates in all fields grew at twice the rate as those for new teachers. In 1999,new college graduates received average salary offers in excess of $37,000 compared to anaverage beginning teacher salary of $26,639.”
Clearly, the literature and research reflect considerable discussion about the need forcompetitive teacher salaries for recruiting and retaining teachers.
THE COMPETITIVENESS OF KENTUCKYTEACHER SALARIES AND BENEFITS
As noted in Chapter II, Kentucky law prescribes a traditional, single salary schedule thatrequires all teachers in a district be paid the same minimum salary based on educational rank andyears taught. The biennial budget provides for a minimum level of pay in the various ranks, butschool districts may have different schedules as long as they meet the required levels in thebudget bill. There is considerable variability in the salaries from district to district, which is inlarge part affected by the average experience levels and average rank of teachers.
A comparison of the local district salary schedules indicate that every school district inKentucky significantly exceeds the minimum required salary schedule requirements as specifiedin the 2000-2002 biennial budget for all ranks and years (Kentucky Department of Education:PSD Data, FY ‘01).
TABLE 1Minimum Statewide Teacher Salary Schedule
2000-2001 and 2001-2002
Rank I II III IV V0-3 years 25,200 22,580 19,910 17,150 15,8104-9 years 27,840 25,200 22,580 17,150 15,81010-14 years 31,260 28,600 25,950 17,150 15,81015-19 years 32,260 29,610 26,950 17,150 15,81020 years and over 32,760 30,110 27,450 17,150 15,810Source: 2000 RS HB 502/EN
The salary schedule reflects a pattern that results in teacher salaries increasing at a greaterrate during the first half of a teacher’s career than the second half, which is a result both ofgreater salary differentiation among the lower cells as well as teachers earning different rankstatus. The prescribed minimum salary schedule stops at twenty years and over.
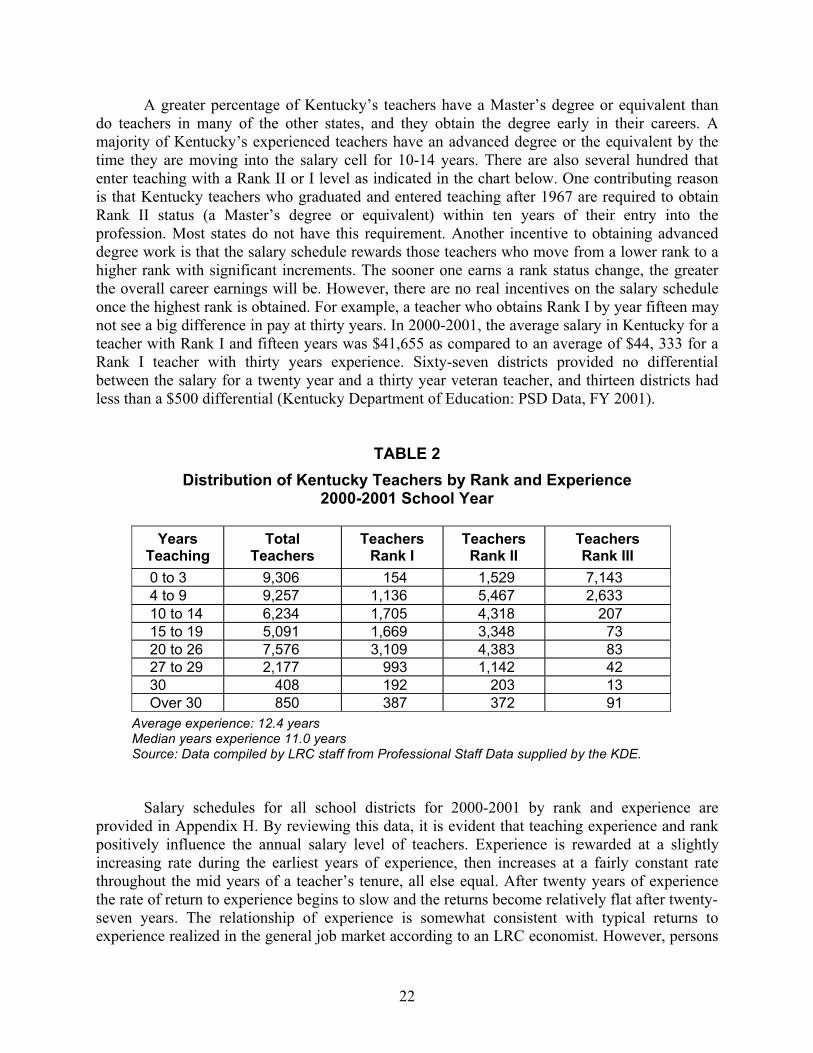
22
A greater percentage of Kentucky’s teachers have a Master’s degree or equivalent thando teachers in many of the other states, and they obtain the degree early in their careers. Amajority of Kentucky’s experienced teachers have an advanced degree or the equivalent by thetime they are moving into the salary cell for 10-14 years. There are also several hundred thatenter teaching with a Rank II or I level as indicated in the chart below. One contributing reasonis that Kentucky teachers who graduated and entered teaching after 1967 are required to obtainRank II status (a Master’s degree or equivalent) within ten years of their entry into theprofession. Most states do not have this requirement. Another incentive to obtaining advanceddegree work is that the salary schedule rewards those teachers who move from a lower rank to ahigher rank with significant increments. The sooner one earns a rank status change, the greaterthe overall career earnings will be. However, there are no real incentives on the salary scheduleonce the highest rank is obtained. For example, a teacher who obtains Rank I by year fifteen maynot see a big difference in pay at thirty years. In 2000-2001, the average salary in Kentucky for ateacher with Rank I and fifteen years was $41,655 as compared to an average of $44, 333 for aRank I teacher with thirty years experience. Sixty-seven districts provided no differentialbetween the salary for a twenty year and a thirty year veteran teacher, and thirteen districts hadless than a $500 differential (Kentucky Department of Education: PSD Data, FY 2001).
TABLE 2Distribution of Kentucky Teachers by Rank and Experience
2000-2001 School Year
YearsTeaching
TotalTeachers
TeachersRank I
TeachersRank II
TeachersRank III
0 to 3 9,306 154 1,529 7,1434 to 9 9,257 1,136 5,467 2,63310 to 14 6,234 1,705 4,318 20715 to 19 5,091 1,669 3,348 7320 to 26 7,576 3,109 4,383 8327 to 29 2,177 993 1,142 4230 408 192 203 13Over 30 850 387 372 91
Average experience: 12.4 yearsMedian years experience 11.0 yearsSource: Data compiled by LRC staff from Professional Staff Data supplied by the KDE.
Salary schedules for all school districts for 2000-2001 by rank and experience areprovided in Appendix H. By reviewing this data, it is evident that teaching experience and rankpositively influence the annual salary level of teachers. Experience is rewarded at a slightlyincreasing rate during the earliest years of experience, then increases at a fairly constant ratethroughout the mid years of a teacher’s tenure, all else equal. After twenty years of experiencethe rate of return to experience begins to slow and the returns become relatively flat after twenty-seven years. The relationship of experience is somewhat consistent with typical returns toexperience realized in the general job market according to an LRC economist. However, persons
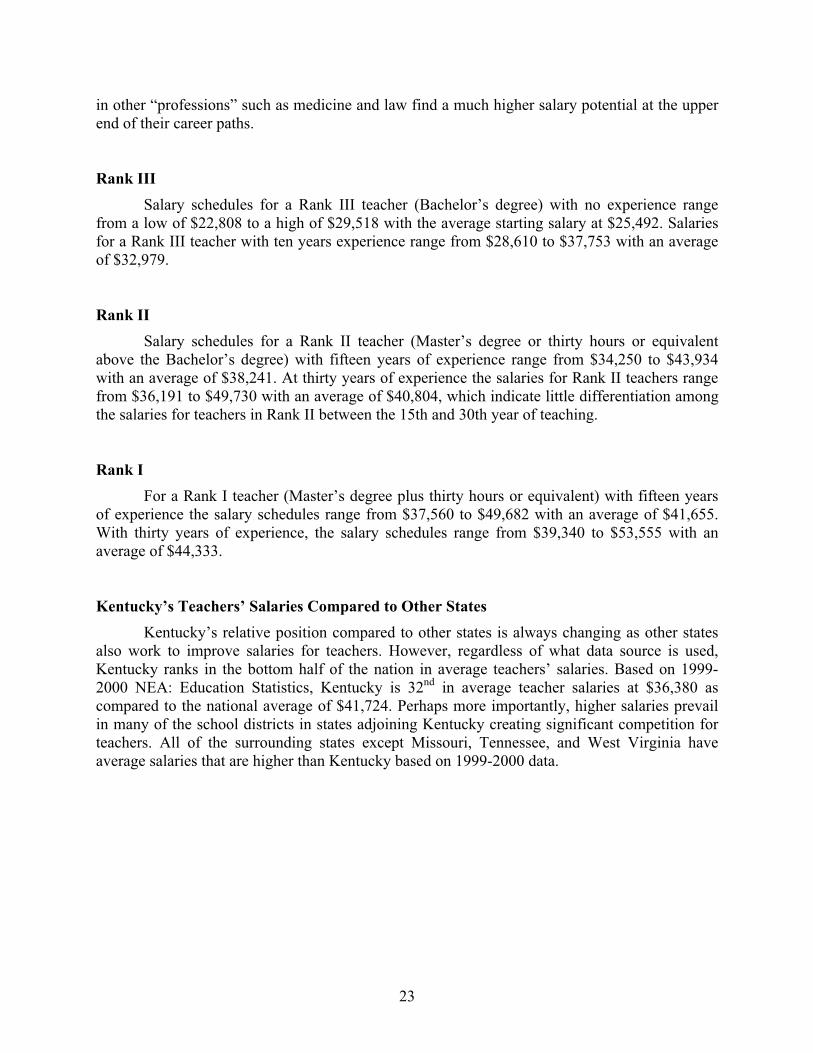
23
in other “professions” such as medicine and law find a much higher salary potential at the upperend of their career paths.
Rank IIISalary schedules for a Rank III teacher (Bachelor’s degree) with no experience range
from a low of $22,808 to a high of $29,518 with the average starting salary at $25,492. Salariesfor a Rank III teacher with ten years experience range from $28,610 to $37,753 with an averageof $32,979.
Rank IISalary schedules for a Rank II teacher (Master’s degree or thirty hours or equivalent
above the Bachelor’s degree) with fifteen years of experience range from $34,250 to $43,934with an average of $38,241. At thirty years of experience the salaries for Rank II teachers rangefrom $36,191 to $49,730 with an average of $40,804, which indicate little differentiation amongthe salaries for teachers in Rank II between the 15th and 30th year of teaching.
Rank IFor a Rank I teacher (Master’s degree plus thirty hours or equivalent) with fifteen years
of experience the salary schedules range from $37,560 to $49,682 with an average of $41,655.With thirty years of experience, the salary schedules range from $39,340 to $53,555 with anaverage of $44,333.
Kentucky’s Teachers’ Salaries Compared to Other StatesKentucky’s relative position compared to other states is always changing as other states
also work to improve salaries for teachers. However, regardless of what data source is used,Kentucky ranks in the bottom half of the nation in average teachers’ salaries. Based on 1999-2000 NEA: Education Statistics, Kentucky is 32nd in average teacher salaries at $36,380 ascompared to the national average of $41,724. Perhaps more importantly, higher salaries prevailin many of the school districts in states adjoining Kentucky creating significant competition forteachers. All of the surrounding states except Missouri, Tennessee, and West Virginia haveaverage salaries that are higher than Kentucky based on 1999-2000 data.
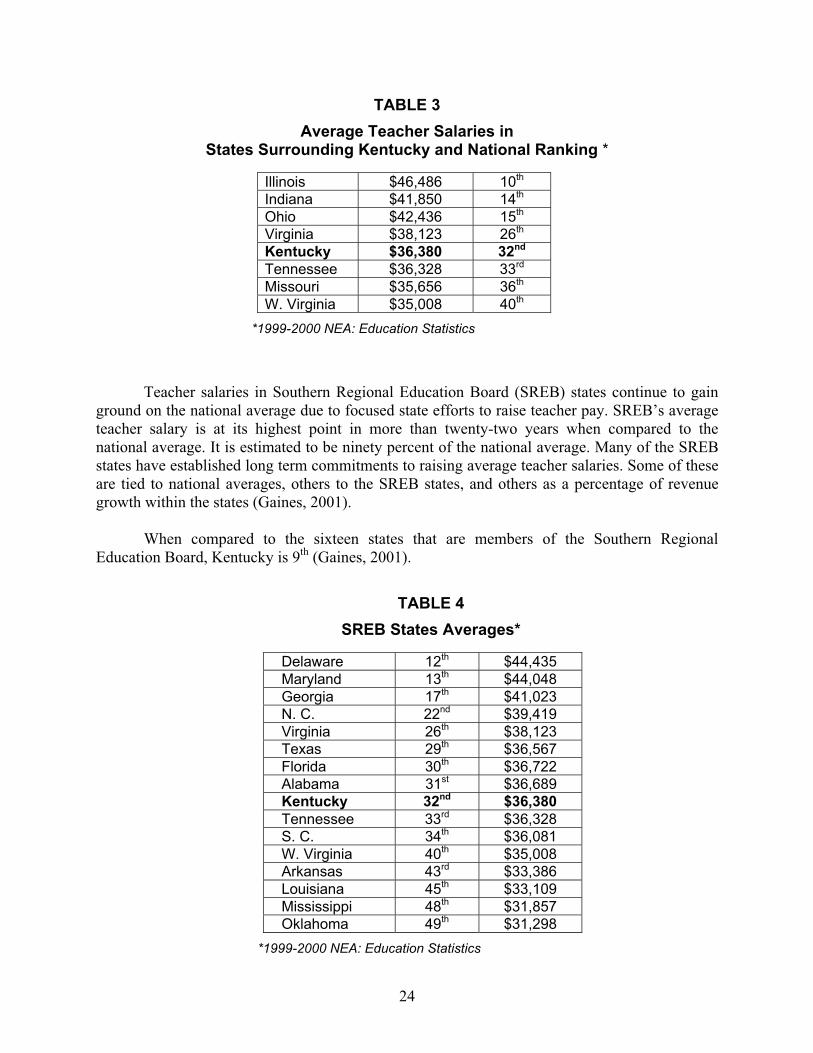
24
TABLE 3Average Teacher Salaries in
States Surrounding Kentucky and National Ranking *
Illinois $46,486 10th
Indiana $41,850 14th
Ohio $42,436 15th
Virginia $38,123 26th
Kentucky $36,380 32nd
Tennessee $36,328 33rd
Missouri $35,656 36th
W. Virginia $35,008 40th
*1999-2000 NEA: Education Statistics
Teacher salaries in Southern Regional Education Board (SREB) states continue to gainground on the national average due to focused state efforts to raise teacher pay. SREB’s averageteacher salary is at its highest point in more than twenty-two years when compared to thenational average. It is estimated to be ninety percent of the national average. Many of the SREBstates have established long term commitments to raising average teacher salaries. Some of theseare tied to national averages, others to the SREB states, and others as a percentage of revenuegrowth within the states (Gaines, 2001).
When compared to the sixteen states that are members of the Southern RegionalEducation Board, Kentucky is 9th (Gaines, 2001).
TABLE 4SREB States Averages*
Delaware 12th $44,435Maryland 13th $44,048Georgia 17th $41,023N. C. 22nd $39,419Virginia 26th $38,123Texas 29th $36,567Florida 30th $36,722Alabama 31st $36,689Kentucky 32nd $36,380Tennessee 33rd $36,328S. C. 34th $36,081W. Virginia 40th $35,008Arkansas 43rd $33,386Louisiana 45th $33,109Mississippi 48th $31,857Oklahoma 49th $31,298
*1999-2000 NEA: Education Statistics
25
Although policy makers have often linked their salary goals to “averages,” an SREBreport asserts that statewide salary averages and comparisons often mask many of the issuesrelating to teacher compensation such as the variation of salaries within an individual state; thelength of teachers’ contracts among states; the effects of retirement patterns; and teachers’ yearsof experience, ranks, or highest degrees and the proportions of different degrees; and variationswithin cost of living (Gaines, 2000).
As noted earlier, current compensation, benefits, and the nature of the work environmentfor teachers are frequently perceived as not competitive with other professions. Teachers’average starting salaries are generally lower than those of other professions, and the life-timesalary potential of a career teacher is much lower than that of a person in other professions. Toadvance financially, teachers often leave the classroom for administrative positions or leave theprofession altogether.
With the exception of additional pay for more education and years experience, andsupplements for extra work, there is a general lack of career advancement opportunities thatallow teachers to stay in teaching and achieve higher salaries and benefits. Even so, the largestteachers’ organization in Kentucky has stated that the traditional single salary schedule is stillviable and provides equity among teachers as it awards compensation based on years ofexperience and levels of educational rank, regardless of the content area taught, the school level,gender, or race of the teacher.
In addition, the teachers’ organization maintains that it should be a priority to provideacross-the-board raises to the salary schedule before other means should be considered. On theother hand, advocates for changing the traditional single salary schedule have suggested that it istime to change the single salary schedule because, while it provides salaries to all teachers in afair way, it is not strategically aligned with needed knowledge and skills to meet currenteducation goals. It does not have a student achievement results element and it is not a goodstructure for salary increases in order to recruit and retain teachers (Kelley & Odden; Milken).
In addition to base salary, Kentucky provides its teachers a benefit package that includesfour paid holidays, a paid life insurance policy of $20,000, a retirement program, ten paid sickleave days per year with an unlimited accumulation option, and a state-supported healthinsurance program. Local boards of education may provide additional benefits, although thesehave been historically limited. For example, in 1999-2000, 35 of the 176 districts providedadditional life insurance coverage, one district provided a matching contribution to employeeswho contributed to a deferred compensation plan, two districts provided disability insurance, onedistrict provided five family days, and two districts offered an employee assistance program(LRC Compensation Survey, 2001).
When compared to other states, Kentucky’s retirement program is highly competitive.According to officials from the Kentucky Teachers’ Retirement System, “KTRS is one of thebest systems in the nation.” The system ranks high because the service multiplier is 2.5 percentand benefits are figured on the highest three years of salary for those age 55 and older with 27years of service. Benefits include disability, survivor, and medical benefits. KTRS is only one ofthree teacher retirement systems in the nation that provides full medical benefits. Annuity
26
payments to retired members contribute significantly to the economy in each Kentucky county.In 1999-2000, $564.3 million dollars were paid in retirement benefits in Kentucky, and thatincreased by ten percent in 2000-2001 to $621.0 million dollars. During 2000-2001, theretirement payments are above $60 million dollars per month and KTRS plans to spend $720million dollars in retirement benefits during 2001-2002. Employees make a 9.85 percentcontribution to KTRS, which is matched by the employer at 13.10 percent.
The average classroom teacher retires at age 54 with 29 years of service with an averagesalary of $42,000 and draws an annual annuity of $31,000 with an annual medical benefit of$2,800. The system has historically taken a fiscally sound approach to investing for its membersas well as exercised caution in supporting changes in the state statutes governing the system.While employees may retire with 27 years’ experience regardless of age, a recently adopted lawencourages persons to stay longer by permitting benefits to be based on the high three years ofteaching for those who have at least 27 years and are age 55. Efforts to open the door morewidely to reemploy retired teachers and administrators in critical shortage areas have beenresisted to avoid increasing the actuarial liability to the system. The system also has concernabout its unfunded liability for health insurance for retired members (Testimony: Harbin, Leach,& Barnes, 2001).
The rising costs for health insurance and the lack of options for health insuranceproviders in many locations in the state have added to the anxiety and dissatisfaction of teachers.Kentucky’s teachers participate in the state group health care plan that is available to most stateworkers. The state pays the full cost of individual healthcare coverage under the lowest costoption in each county, with a specific minimum, monthly defined dollar contribution. The valueof the state’s contribution to the medical benefit averages $241 monthly per employee. While thestate contribution is comparable to many of the southern states, Kentucky does not subsidize thecost of dependent health insurance coverage. A majority of other states (88%) do subsidize thesecosts, therefore the dependent healthcare premiums paid by members of the CommonwealthGroup are substantially higher than the average of other states, based on data supplied to theKentucky Health Insurance Board by OPEHI and William M. Mercer, Incorporated in 2001. Thecost of premiums has been increasing by double digits and appears likely to continue for theforeseeable future. The rising costs of family coverage have outpaced the cost of living increasesfor teachers, which in general have been less than 2.5% annually.
Concerns about the compensation and benefits for teaching are frequently coupled with aconcern about the daily work environment. Generally, teachers have little time during the workday for preparation, planning, reflection on their work, and little time for dialog with otherteachers to observe and learn from each other—all factors related to improving teaching. Manyteachers do not have regular planning periods. While some have assistants and teacher aides oraccess to volunteers to help with clerical, instructional duties, and other non instructional duties,many do not. The daily professional life of a teacher is often one of isolation from other adults—not to mention that uninterrupted lunch breaks, restroom breaks, and dedicated, individual workspace are often limited. In addition, educational researchers have observed that many teachershave found it stressful to adapt and learn new ways of teaching to meet the requirements of astandards-based curriculum, high stakes accountability, and expectations for student
27
achievement. Even the incorporation of school-based decision making into Kentucky law addedadditional responsibility although it gave teachers more control in the operation of the school.
Teachers’ ongoing responsibility to pursue additional training to maintain certificationrequires a significant financial and time investment. The opportunity for professionaldevelopment activities has been historically provided after school when teachers are exhaustedfrom teaching or in evening and summer programs that are too often disconnected fromclassroom practices. In recent years, the General Assembly has made significant efforts toimprove the quality of programs. Since 1990, funding has been provided annually to districts andschools to support professional development activities and stipends for teachers throughout theyear; new options for recertification have been provided to include national board certificationthrough planned professional development experiences rather than traditional college courses.School rewards to schools that meet or exceed their accountability goals may be used forbonuses to teachers.
Professional Compensation Plans
Kentucky has been concerned about the compensation issue since the adoption of theKentucky Education Reform Act of 1990 which directed the Kentucky Board of Education todevelop recommendations for a professional compensation plan. Such a plan has not beencompleted. In 1998, the General Assembly directed the Kentucky Board of Education to conducta pilot program that recognizes professional competency, skills and knowledge, contributions toimprove schools and student achievement and learning, professional involvement in local, state,and national organizations, and certification from the National Board for Professional TeachingStandards. Oldham County was selected to pilot a plan with the assistance of a steeringcommittee. The Oldham County pilot focused primarily on supporting and rewarding teacherswho complete National Board Certification and is similar to action the General Assembly took in2000 when it adopted House Bill 25 to provide incentives for national board certified teachers.
Incentives
While Kentucky has been unable to make big changes in the base salaries of teachers,there have been changes since 1990 that help selected teachers earn more salary for service anddemonstration of performance. Due to action of the 2000 General Assembly, selected teachershave an opportunity to earn salary supplements for earning national board certification, forserving as a teacher mentor to other teachers in approved mentoring activities, and for serving assupervising teachers of student teachers. Increased stipends for teachers who serve as resourceteachers to teacher interns were provided and an option of graduate course tuition waivers forthose teachers serving as resource or supervising teachers was established. While these areas areviewed as excellent opportunities, they reach only a few hundred teachers annually. For examplethere are currently less than two hundred nationally board certified teachers although there aremore in pursuit of the credential. There are approximately 3000 resource teachers per year andapproximately 2600 supervising teachers. There were approximately seventy nationally certified

28
teachers receiving funds for mentoring other teachers in 2000-2001. Many of the teachersparticipate in multiple options in a given year.
The Kentucky incentives to teachers have been similar to those in several states. Somestates have gone further and many states lag behind. Kentucky was a leader in establishing theinternship program for first year teachers and making provisions to pay existing teachers to serveas resource teachers. Kentucky was one of the first states to establish school-based rewards forschools that reach their achievement goals, which can be used for salary bonuses. Kentucky wasone of the first states to mandate school-based decision making.
ACTIONS IN OTHER STATES
A review of what other states have done to address teacher compensation yielded thefollowing information:
• In 2000, Arkansas adopted a two year plan to raise teacher pay by $3000. A tax law waspassed in 1991 that expanded and raised sales taxes and required districts to use theseadditional revenues to increase the pay of certified personnel.
• In 2000, Delaware adopted a long range plan to lengthen the number of days ofemployment to include more days for professional development of teachers.
• Florida provides bonuses to help keep teachers from leaving the classroom.
• Iowa adopted the Student Achievement and Teacher Quality Act in 2001 that willprovide advancement in career status and pay for teachers who acquire and demonstratesignificant knowledge and skills. Four career levels have been established: provisional,career, career II, and advanced.
• Maryland provides state funds through a matching program to provide a one percent payraise for teachers in districts that increase pay by at least four percent. The overall goal isto raise pay for teachers by ten percent over two years.
• Mississippi provides reimbursements not to exceed $1000 for documented movingexpenses to those teachers who have entered contracts for employment in a school districtsituated within a geographical area of the state where there exists a critical shortage ofteachers as designated by the state board. Mississippi also instituted a home loan programfor eligible licensed teachers who render service to the state in a geographical area wherethere is a critical shortage of teachers. The loan must be used to purchase a home in thecounty in which the teacher is rendering service. The maximum amount of the loan is$6000. A teacher who renders service as a teacher in the critical shortage area may beforgiven up to one third of the loan received.
29
• Nearly all SREB states have established bonuses to teachers who earn national boardcertification, but the awards range from $1000 to $7500 each year annually for the tenyear life of the certificate. Kentucky’s is $2000 each year if the teacher stays in classroomteaching or serves as a mentoring teacher.
• In 1997, North Carolina adopted school-based incentive awards up to $1500 for eachteacher and up to $500 for those schools that achieve higher than expectedimprovements; and up to $750 dollars for each teacher and up to $375 for each teacherassistant in schools that meet the expected improvements. North Carolina also adoptedextra pay for mentor teachers and extra pay to compensate every newly certified teacherfor three additional days of employment for orientation and classroom participation.North Carolina also has in place a Teaching Fellows program to recruit high performinghigh school seniors into teaching as a career.
• Oklahoma approved a $3000 teacher pay raise for 2000-2001, but did not include a raisein 2001-2002.
• Texas gave teachers a $3000 raise in 1999-2000 and is attempting to start a state healthplan for teachers—previously, local districts offered health insurance benefits.
• West Virginia has approved extra pay to be given to teachers with more than thirty yearsexperience.
Other states such as Colorado, California, Arizona, South Carolina, and Florida provideoptions for local school districts to develop knowledge and skill-based pay systems that eitherreplace or supplement the traditional single salary schedule. The knowledge and skill-based paysystems reward teachers with base pay increases and/or bonuses for acquiring specificknowledge and skills that are demonstrated to meet educational goals, including studentachievement. They are intended to improve skills of current teachers, attract and retain skilledteachers and guide teachers in professional development. Several districts are in the process ofdeveloping these alternatives to the traditional schedules. How well they will work is still to bedetermined. It should also be noted that the skill-based pay programs are not a total departurefrom the single salary schedule as all of them retain seniority and degrees as pay criteria.
Cincinnati Public Schools developed one of the first and most publicized plans whichmodifies the single salary schedule with a schedule that bases pay on the evaluation of ateacher’s classroom performance. The Cincinnati plan also provides higher salaries for teachersin shortage areas, supplements for national board certification, base pay increases for knowledgeand skills, and housing supplements under certain circumstances. The first stages required thedevelopment of a revised evaluation system, training, and piloting the process. The success ofthis plan is still to be determined. The teacher’s union will vote in 2002 to see if the plan will befully implemented or if the portion that ties pay to the evaluation system will be rescinded(Cincinnati, 2000).

30
Selected school districts in Florida, Arizona, and South Carolina are developingdifferentiated staffing and differential pay based on the Teacher Advancement Program modelproposed by the Milken Foundation that provides:
1. Multiple career paths—Paths range from inductee to master teacher, offering all teachersthe opportunity to advance without having to leave the classroom.
2. Market-Driven Compensation—This replaces the lock-step salary structures and providesflexibility to establish salaries.
3. Performance-Based Accountability—This is rigorous, tied to compensation, and includesdifferentiated requirements based on the teacher’s position. Teachers are assessed againsthigh standards that measure their performance in content knowledge, planning,instruction, assessment, and producing student learning gains.
4. Ongoing, Applied Professional Growth—This requires a school-wide commitment andincludes all teachers to ensure adequate time for teachers to meet, reflect, learn, and growprofessionally.
5. Expanding the Supply of High Quality Teachers—This is achieved by making the initialacademic degree and teaching certification attainable in four years; providing alternativecertification to give beginning teachers as well as mid-career professionals the ability toenter teaching as adjuncts through assessments and classroom demonstration; andallowing outstanding retiring teachers to continue working on a part-time basis as facultyfellows.
These pilots are also building their systems on the existing salary bases. All are too newto know how effective they are (Testimony: Solmon and Bendotti, 2001).
TESTIMONY
A variety of stakeholders made recommendations to the subcommittee regarding teachercompensation and benefits to ensure that qualified personnel will be available to all Kentuckystudents. The stakeholders represented teachers, administrators, parents, local boards ofeducation, and the private sector. There was agreement that action must be forthcoming and acommitment made to a long-range plan for raising teacher salaries and providing ongoingprofessional support to attract and retain high quality teachers (Testimony).
There was considerable agreement among various education advocacy groups as well asthe private sector that quality teachers deserve pay and benefits comparable to otherprofessionals and that current pay levels are inadequate. However, the options for increasingcompensation did not garner the same level of agreement. As mentioned earlier, the largestteachers’ organization in Kentucky believes the traditional single salary schedule that awardscompensation based on years of experience and levels of educational rank must be continued andacross the board raises to the salary schedule are needed before other means should be

31
considered. No group suggested that the single salary schedule be eliminated but did offer thatdifferentiated pay options be permitted to supplement the schedule. These options might includepay for demonstrated knowledge and expertise, subject area specialty, and teaching in difficultschool assignments. Likewise, most of the stakeholders believe permitting districts to grantsigning bonuses in shortage areas is viable.
All stakeholder groups agreed that lengthening the employment year for teachers isneeded although there was some disagreement as to whether the increased length of theemployment year should be for increasing professional development and planning days orincreasing the instructional days or doing some of both.
Other specific stakeholder suggestions included:
1. Provide a state matching fund program to enable districts to pilot teacher advancementprograms or other modified salary programs and adopt enabling legislation to permitdistricts to provide alternative professional compensation plans at the district level ratherthan a single salary schedule.
2. Provide a matching fund and enabling legislation for those districts that wish to providefinancial incentives for paraprofessionals and emergency teachers to seek teachercertification and to give service within the district.
3. Amend the current statutes relating to the school calendar to phase-in a lengthened schoolyear to allow for more planning, curriculum development, professional development, andstudent instruction.
4. Amend the current teacher scholarship program to remove the need-based requirement inorder to provide incentives to attract individuals to teaching.
5. Increase the basic salary levels for beginning as well as veteran teachers with lesscompression in the salary schedule between twenty and thirty years of experience.
6. Retain the single salary schedule as a base for compensating all teachers, but provideextra compensation for the following:
• Demonstrated knowledge and performance in the classroom;
• Mastery of established career levels;
• Demonstrated leadership in teaching and school-based roles; and
• Acceptance of assignments in teaching shortage areas including subject matterand geographic shortages.
7. Expand funding for the Teachers’ Professional Growth Fund and the National BoardCertification Incentives.

32
8. Clarify existing statutes to specify that districts may provide signing bonuses or otherfinancial incentives to recruit teachers when geographic or content-specific shortage areasor a lack of diversity have been identified.
Several members of the subcommittee expressed concern about the annual cost of livingraises that are less for public school personnel than they are for state workers. Other memberswere concerned about the need for incentives for the recruitment of high school students into thesystem, to decrease the number of emergency certified teachers, to encourage paraprofessionalsto seek certification, and to encourage mid-career changers and certified teachers to earnadditional endorsements in order to maintain an adequate teacher pool.
The subcommittee also revisited the recommendations in the 1999 Task Force on TeacherQuality Report relating to recruitment and retention and compensation and benefits, most ofwhich parallel options stated above.
COSTS ASSOCIATED WITH CHANGES IN COMPENSATION
The subcommittee was made aware of the existing state revenue shortfalls and theincreased costs for many of the proposals and took these under advisement as it deliberated itsrecommendations. Members agreed that increased costs should not be passed to local boards ofeducation without additional state funds to support new mandates.
Based on current data for 2000-2001, and estimates provided by the KentuckyDepartment of Education and the Education Professional Standards Board:
• The cost of raising salaries for certified personnel by 1% under the current local districtsalary schedules is $19 million dollars.
• The cost of raising the cost of living adjustment to 5% per year would cost an additional$53.2 million above the funding required to comply with the existing law that is based onCPI or SEEK base raises, whichever is lower, and stands at 2.2% for the current schoolyear.
• The cost of adding one day for professional development would be $10.2 million in 2003;$10.4 million in 2004.
• The cost of adding one instructional day would be $13.8 million in 2003; $14.2 million in2004.
• The needed additional funds to continue the same level of support for the teachers whoreceive National Board Certification, based on the number of teachers in the pipeline isestimated to be more than $2 million in FY ‘03 and $3 million in FY ‘04. This includes

33
funds for salary supplements required by existing law, mentoring funds, reimbursementfees, and costs of substitute teachers.
• The cost of raising teachers salaries and benefits to mirror the national average by 2004 isestimated in excess of $200 million dollars with all variables remaining constant.

34
35
CHAPTER IV
AN ANALYSIS OF CLASSIFIED PERSONNELCOMPENSATION AND BENEFITS
For many years, there has been a great deal of interest concerning the status of theclassified employees and the adequacy of compensation and benefits provided in local schooldistricts. Wages and benefits are fixed for classified employees by local school districts. There isno specified statewide salary minimum schedule as is the case with teachers.
The salaries of classified employees have been historically modest and trail those of theirprivate sector counterparts. However, the health insurance benefits, life insurance coverage, andsick leave options offered by local school districts compare to the benefits offered in privatesector employment, which is limited in many Kentucky counties.
Classified employees play an important and vital role in the overall quality of theeducational experiences of students by providing for a safe school environment and the efficientoperation of school facilities. Classified employees are generally career employees who serve asschool bus drivers, clerical and accounting staff, maintenance and custodial workers, foodservice workers, and instructional assistants.
House Concurrent Resolution 114 passed by the 2000 General Assembly expressed thesense of the General Assembly that this study should determine the adequacy of wages, salaries,and benefits of classified employees and should recommend whether a statewide salary scheduleis appropriate. To this end, the subcommittee heard testimony from a variety of state and localofficials and education organizations and reviewed data profiling the classified employeesacross the state. While regional and national data would have assisted the subcommittee indetermining the comparability of wages and salaries of similarly situated employees, data fromthe National Center for Education Statistics, U. S. Department of Education, were not availableat the time of publishing this report. Therefore, the findings and recommendations reached in thisstudy are based on data and information supplied to the subcommittee from the LegislativeResearch Commission and the Kentucky Department of Education.
PROFILE OF CLASSIFIED EMPLOYEES
The following profile was generated from the Classified Staff Database (CSD), collectedby the Kentucky Department of Education (KDE) from local school districts and compiled byLRC staff. The CSD reports the following information: name, an identifier, district ofemployment, gender, job classification and positions held, annual salary or hourly wages, hoursper day, and contract days. Information not requested or collected by the CSD includes aclassified employee’s years of experience in the current position, work history in other classified

36
job positions in the school district or out of the district, and the level of education or professionalcertification and training.
The 176 local school districts employed 48,470 classified employees and paid$651,858,590 in salaries and wages in the 2000-2001 school year. These numbers representincreases of 3,089 employees and $33,582,845 in the statewide payroll when compared to datafrom 1999-2000.
TABLE 5
Statewide Totals of Classified School Employees by Job Family2000-2001
Job Family StaffPercent ofTotal Staff Total Wages
Percent ofTotal Wages
Communications 80 0.2% $1,984,892 0.3%Fiscal 911 1.9% $21,945,598 3.4%Food Services 7,866 16.2% $76,074,402 11.7%Health 488 1.0% $12,297,444 1.9%Instructional 15,831 32.7% $178,739,154 27.4%Library/Media 322 0.7% $3,937,984 0.6%Maintenance 1,187 2.4% $433,069,723 3.7%Management 732 1.5% $24,364,813 2.1%MIS 501 1.0% $14,001,000 2.1%Miscellaneous 5 0.0% $4,500 0.0%Operations 4,908 10.1% $83,687,735 12.8%Personnel 98 0.2% $2,525,173 0.4%Purchasing 39 0.1% $1,004,475 0.2%Secretarial/Clerical 4,695 9.7% $78,150,639 12.0%Security/Law Enforcement 223 0.5% $4,686,970 0.7%Student Services 354 0.7% $7,154,721 1.1%Transportation 10,106 20.9% $105,029,363 16.1%Warehouse 124 0.3% $3,200,003 0.5%Total 48,470 $651,858,590
Source: Compiled by LRC Staff from data supplied by the KDE
STATE, LOCAL, AND FEDERAL FUNDING
Wages and salaries of classified employees are primarily funded through state and localrevenue through the Support Education Excellence In Kentucky program (SEEK), the majorstate finance program for public schools. SEEK is comprised of several components:
1. A guaranteed base funding amount per pupil ($2,994 in 2000-2001 and $3,066 in 2001-2002) of which $100 is reserved for capital/building purposes;

37
2. Adjustments added to the base funding to reflect the increased cost of providing servicesfor at-risk students, exceptional children, transportation, home and hospital instructionand vocational education programs;
3. Local school district’s required contribution of a minimum $0.30 on $100 of the assessedproperty valuation;
4. Tier I - Local districts generating through tax levies additional revenues (up to 15% ofthe SEEK guaranteed base) which are equalized through state funds in districts whoseproperty wealth is less than 150% of the state per pupil property tax assessment($470,000); and
5. Tier II - Local districts generating additional revenue through voter approved tax leviesincreasing the funding up to 30% of the revenue from SEEK and Tier I.
SEEK funding disbursed to the local school districts is not earmarked for the support of aparticular operation or program. Therefore, each board of education determines the educationaland administrative strategies and needs, and allocates revenue accordingly.
While SEEK funding does provide the greater portion of education funding, other sourcesinclude state categorical programs, and local and federal revenues. The proportion of state, localand federal contributions varies from district to district highlighting the fact that districts havedifferent needs. The statewide averages for state, local, and federal per pupil revenues in FY1999-2000 are listed in Table 6. The state per pupil amount represents all funding available tothe school district including SEEK and categorical programs funds and grants. Local fundingcomes from tax assessments on real and tangible property. The federal per pupil amountrepresents grants and entitlement program revenue received in the school districts.
TABLE 6
State Averages for Per Pupil Revenues1999-2000
LocalPer Pupil
StatePer Pupil
FederalPer Pupil
TotalPer Pupil
565,693 ADA $2,244 $3,807 $746 $6,798% Per Pupil 33% 56% 11%
Source: Kentucky Department of Education
The percentage of state funding in 1999-2000 across all school districts ranged from ahigh of 79.4% to a low of 20% while the percentage of local funds ranged from 78% to 10%.Federal per pupil revenues spanned from a low of 1.4% to a high of 27.8%. (See Appendix M forthe Percentage of State, Local and Federal Revenue, 1999-2000).
38
JOB DESCRIPTIONS, PAY, HOURS AND CONTRACT DAYS
Pursuant to KRS 161.011, the commissioner of the Kentucky Department of Educationhas established job classifications and minimum qualifications for local district classifiedemployment positions. To date, 277 job classifications in eighteen job families describe positionsin the classified service in 2000-2001. From the Classified Staff Database supplied by theKentucky Department of Education, Table 7 displays the job positions with the largest number ofemployees, including the number of persons employed, the mean, minimum, and maximum payrates, the mean number of hours per day and contract days, and the mean annual pay. Theseclassifications represent about 89% of the total classified service and 80% of the total statewidepayroll.
TABLE 7Job Positions with the Largest Number of Employees
2000-2001
JobNumber
Employed
MeanPayRate
MinimumPay Rate
MaximumPay Rate
MeanHours
Per Day
MeanContract
Days
MeanAnnual
PayInstructionalAssistant I 9456 $8.57 $5.15 $37.45 7 182 $10,152Bus Driver 7238 $11.53 $5.15 $39.87 5 178 $10,099Cook/Baker 3939 $7.87 $5.15 $13.70 6 181 $8,761Custodian 4001 $8.79 $5.15 $30.60 7 238 $15,690InstructionalAssistant II 3349 $8.98 $5.15 $18.48 7 182 $10,715TOTAL 27,983
Source: Compiled by LRC Staff from data supplied by the Kentucky Department of Education
The same information concerning all 277 job classifications and the mean pay, hours, andcontract days for the 2000-2001 school year is located in Appendix N.
MINIMUM WAGES
A primary objective of this study is to determine the adequacy of compensation andbenefits of classified employees. Regional and national data on salaries and wages of similarlysituated employees are not available for comparison. To assist in determining the level of salariesof classified personnel, an analysis was conducted of the job classifications in which employeesearn the state and federal minimum hourly wage of $5.15. As shown in Table 7, the jobclassifications with the largest number of employees along with 16 other job classifications insome districts have minimum pay ranges beginning at the minimum hourly wage rate of $5.15.
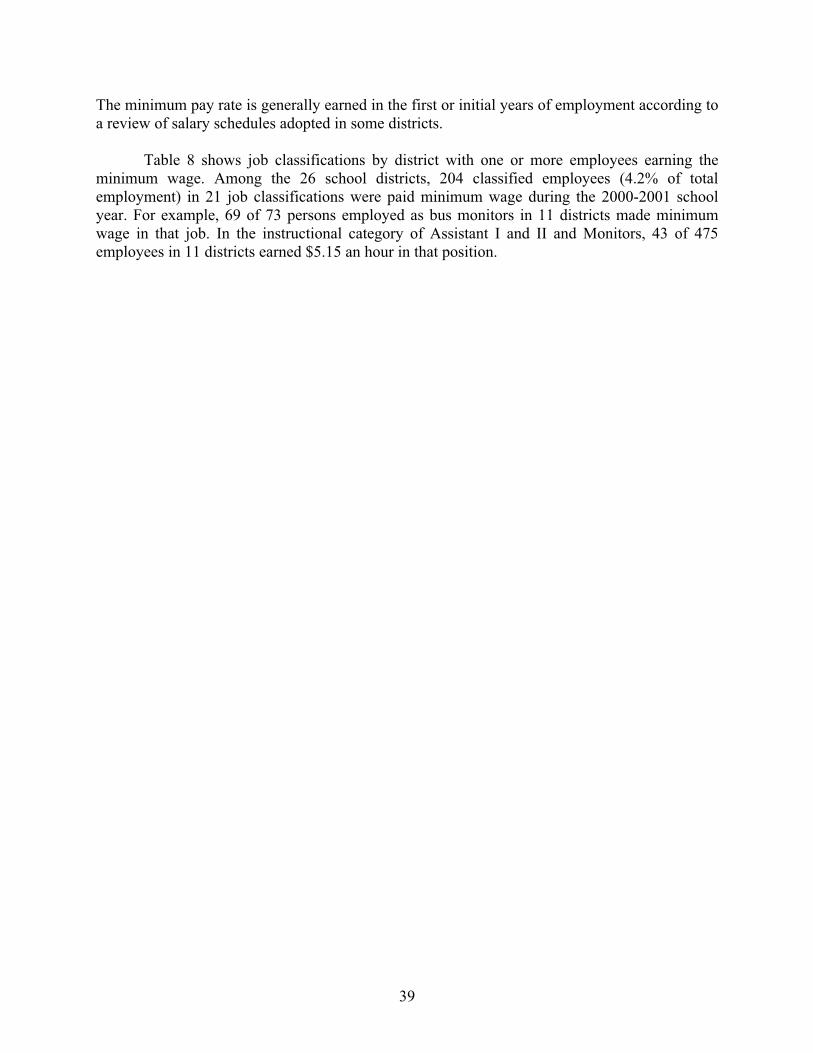
39
The minimum pay rate is generally earned in the first or initial years of employment according toa review of salary schedules adopted in some districts.
Table 8 shows job classifications by district with one or more employees earning theminimum wage. Among the 26 school districts, 204 classified employees (4.2% of totalemployment) in 21 job classifications were paid minimum wage during the 2000-2001 schoolyear. For example, 69 of 73 persons employed as bus monitors in 11 districts made minimumwage in that job. In the instructional category of Assistant I and II and Monitors, 43 of 475employees in 11 districts earned $5.15 an hour in that position.
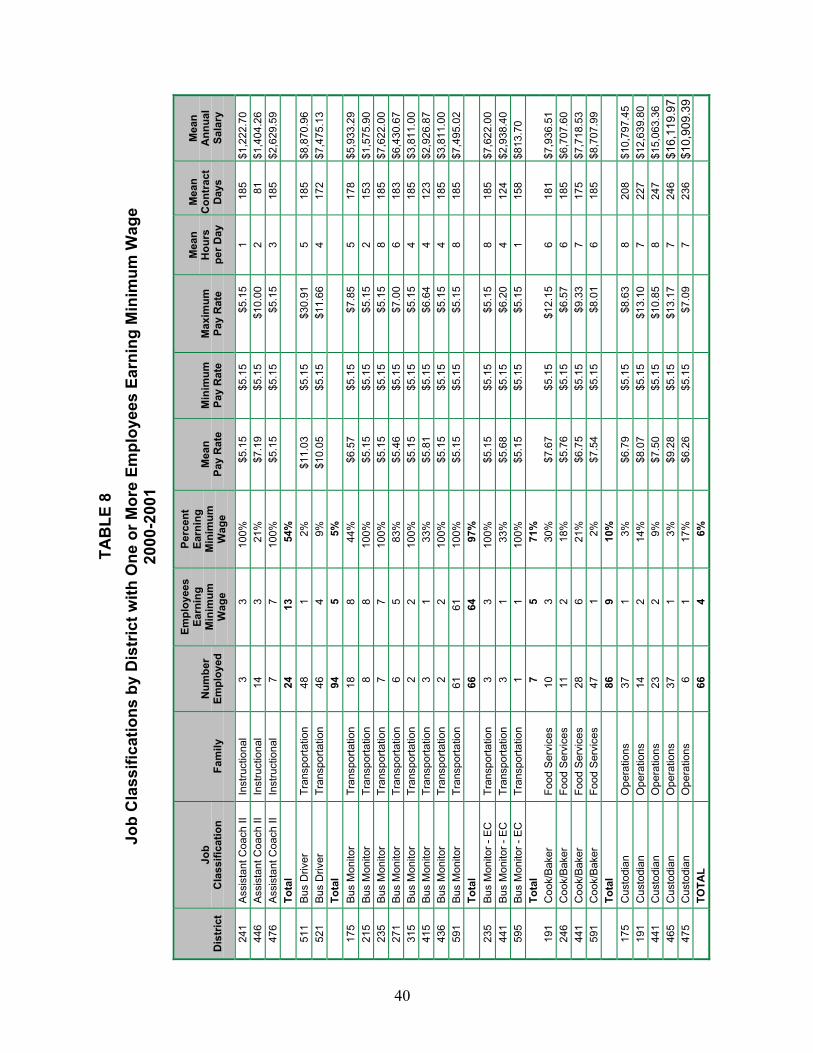
40
TAB
LE 8
Job
Cla
ssifi
catio
ns b
y D
istr
ict w
ith O
ne o
r Mor
e Em
ploy
ees
Earn
ing
Min
imum
Wag
e20
00-2
001
Dis
tric
tJo
bC
lass
ifica
tion
Fam
ilyN
umbe
rEm
ploy
ed
Empl
oyee
sEa
rnin
gM
inim
umW
age
Perc
ent
Earn
ing
Min
imum
Wag
eM
ean
Pay
Rat
eM
inim
umPa
y R
ate
Max
imum
Pay
Rat
e
Mea
nH
ours
per D
ay
Mea
nC
ontr
act
Day
s
Mea
nA
nnua
lSa
lary
241
Assi
stan
t Coa
ch II
Inst
ruct
iona
l3
310
0%$5
.15
$5.1
5$5
.15
118
5$1
,222
.70
446
Assi
stan
t Coa
ch II
Inst
ruct
iona
l14
321
%$7
.19
$5.1
5$1
0.00
281
$1,4
04.2
647
6As
sist
ant C
oach
IIIn
stru
ctio
nal
77
100%
$5.1
5$5
.15
$5.1
53
185
$2,6
29.5
9To
tal
2413
54%
511
Bus
Driv
erTr
ansp
orta
tion
481
2%$1
1.03
$5.1
5$3
0.91
518
5$8
,870
.96
521
Bus
Driv
erTr
ansp
orta
tion
464
9%$1
0.05
$5.1
5$1
1.66
417
2$7
,475
.13
Tota
l94
55%
175
Bus
Mon
itor
Tran
spor
tatio
n18
844
%$6
.57
$5.1
5$7
.85
517
8$5
,933
.29
215
Bus
Mon
itor
Tran
spor
tatio
n8
810
0%$5
.15
$5.1
5$5
.15
215
3$1
,575
.90
235
Bus
Mon
itor
Tran
spor
tatio
n7
710
0%$5
.15
$5.1
5$5
.15
818
5$7
,622
.00
271
Bus
Mon
itor
Tran
spor
tatio
n6
583
%$5
.46
$5.1
5$7
.00
618
3$6
,430
.67
315
Bus
Mon
itor
Tran
spor
tatio
n2
210
0%$5
.15
$5.1
5$5
.15
418
5$3
,811
.00
415
Bus
Mon
itor
Tran
spor
tatio
n3
133
%$5
.81
$5.1
5$6
.64
412
3$2
,926
.87
436
Bus
Mon
itor
Tran
spor
tatio
n2
210
0%$5
.15
$5.1
5$5
.15
418
5$3
,811
.00
591
Bus
Mon
itor
Tran
spor
tatio
n61
6110
0%$5
.15
$5.1
5$5
.15
818
5$7
,495
.02
Tota
l66
6497
%23
5Bu
s M
onito
r - E
CTr
ansp
orta
tion
33
100%
$5.1
5$5
.15
$5.1
58
185
$7,6
22.0
044
1Bu
s M
onito
r - E
CTr
ansp
orta
tion
31
33%
$5.6
8$5
.15
$6.2
04
124
$2,9
38.4
059
5Bu
s M
onito
r - E
CTr
ansp
orta
tion
11
100%
$5.1
5$5
.15
$5.1
51
158
$813
.70
Tota
l7
571
%19
1C
ook/
Bake
rFo
od S
ervi
ces
103
30%
$7.6
7$5
.15
$12.
156
181
$7,9
36.5
124
6C
ook/
Bake
rFo
od S
ervi
ces
112
18%
$5.7
6$5
.15
$6.5
76
185
$6,7
07.6
044
1C
ook/
Bake
rFo
od S
ervi
ces
286
21%
$6.7
5$5
.15
$9.3
37
175
$7,7
18.5
359
1C
ook/
Bake
rFo
od S
ervi
ces
471
2%$7
.54
$5.1
5$8
.01
618
5$8
,707
.99
Tota
l86
910
%17
5C
usto
dian
Ope
ratio
ns37
13%
$6.7
9$5
.15
$8.6
38
208
$10,
797.
4519
1C
usto
dian
Ope
ratio
ns14
214
%$8
.07
$5.1
5$1
3.10
722
7$1
2,63
9.80
441
Cus
todi
anO
pera
tions
232
9%$7
.50
$5.1
5$1
0.85
824
7$1
5,06
3.36
465
Cus
todi
anO
pera
tions
371
3%$9
.28
$5.1
5$1
3.17
724
6$1
6,11
9.97
475
Cus
todi
anO
pera
tions
61
17%
$6.2
6$5
.15
$7.0
97
236
$10,
909.
39TO
TAL
664
6%
40

41
Dis
tric
tJo
bC
lass
ifica
tion
Fam
ilyN
umbe
rEm
ploy
ed
Empl
oyee
sEa
rnin
gM
inim
umW
age
Perc
ent
Earn
ing
Min
imum
Wag
eM
ean
Pay
Rat
eM
inim
umPa
y R
ate
Max
imum
Pay
Rat
e
Mea
nH
ours
per D
ay
Mea
nC
ontr
act
Day
s
Mea
nA
nnua
lSa
lary
155
Inst
ruct
iona
l Ass
t IIn
stru
ctio
nal
233
13%
$6.8
6$5
.15
$7.3
47
176
$8,5
32.5
519
1In
stru
ctio
nal A
sst I
Inst
ruct
iona
l15
17%
$7.8
0$5
.15
$11.
296
176
$8,5
28.7
323
5In
stru
ctio
nal A
sst I
Inst
ruct
iona
l21
15%
$7.6
4$5
.15
$11.
026
185
$8,5
95.1
428
5In
stru
ctio
nal A
sst I
Inst
ruct
iona
l72
11%
$7.1
1$5
.15
$9.1
18
187
$10,
092.
5341
5In
stru
ctio
nal A
sst I
Inst
ruct
iona
l37
514
%$7
.80
$5.1
5$1
0.65
718
1$9
,691
.11
431
Inst
ruct
iona
l Ass
t IIn
stru
ctio
nal
585
9%$7
.02
$5.1
5$1
4.84
618
6$7
,451
.69
441
Inst
ruct
iona
l Ass
t IIn
stru
ctio
nal
413
7%$6
.62
$5.1
5$9
.22
717
9$7
,944
.24
591
Inst
ruct
iona
l Ass
t IIn
stru
ctio
nal
140
107%
$7.8
6$5
.15
$15.
007
189
$10,
399.
24TO
TAL
447
317%
285
Inst
ruct
iona
l Ass
t II
Inst
ruct
iona
l12
18%
$6.7
8$5
.15
$7.9
47
179
$8,9
48.3
844
6In
stru
ctio
nal M
onito
r IIn
stru
ctio
nal
1612
75%
$5.2
0$5
.15
$5.6
74
133
$2,1
00.9
547
6As
st B
oard
Sec
Secr
etar
ial/
Cle
rical
11
100%
$5.1
5$5
.15
$5.1
54
260
$5,0
07.8
6
305
Chi
ld D
ev C
ente
rAs
st. S
upt.
Inst
ruct
iona
l6
117
%$7
.33
$5.1
5$7
.98
723
4$1
1,80
1.30
251
Cle
rkSe
cret
aria
l/C
leric
al13
215
%$6
.36
$5.1
5$8
.56
618
1$6
,392
.29
241
Empl
oyee
Bene
fits
Spec
ialis
tPe
rson
nel
11
100%
$5.1
5$5
.15
$5.1
51
194
$999
.62
551
Food
Ser
vice
Ass
it I
Food
Ser
vice
s20
15%
$14.
46$5
.15
$46.
806
66$2
,128
.78
476
Hea
d C
oach
Inst
ruct
iona
l9
889
%$5
.22
$5.1
5$5
.79
418
5$3
,541
.04
191
Lunc
hroo
m M
onito
rFo
od S
ervi
ces
33
100%
$5.1
5$5
.15
$5.1
51
175
$1,0
51.4
624
1P
ublic
Info
rmat
ion
Offi
cer
Com
mun
icat
ions
43
75%
$6.4
9$5
.15
$10.
501
195
$1,2
65.0
647
6Sa
fety
Insp
ecto
rSe
curit
y1
110
0%$5
.15
$5.1
5$5
.15
226
0$2
,396
.81
171
Scho
ol S
ecre
tary
I –
Hig
h Sc
hool
Secr
etar
ial/
Cle
rical
11
100%
$5.1
5$5
.15
$5.1
58
205
$8,4
46.0
0
441
Secr
etar
y I
Secr
etar
ial/
Cle
rical
51
20%
$6.3
7$5
.15
$7.8
68
236
$12,
160.
56
591
Staf
f Sup
port
Sec
reta
rySe
cret
aria
l/C
leric
al10
110
%$8
.28
$5.1
5$1
3.91
819
7$1
2,47
2.47
41
42
MULTIPLE JOB ASSIGNMENTS
A number of persons perform multiple job assignments, with at least one of the positionsbeing a minimum wage job. Of the 48,470 classified employees reported in the Classified StaffData, 2,681 persons performed 5,611 jobs by working more than one job in the school district.This represents 5.5% of all employees reported in the database. Among 2,681 personsperforming those jobs, 208 persons performed three or more jobs within the districts.
Of the multiple job employees, 88% had at least one job as either an instructionalassistant, a bus driver, or a bus monitor. Sixty-one percent or 1635 employees were bus driversor monitors and 27% of 723 employees were instructional assistants. This equates to 19% of allbus drivers and monitors and 9% of all instructional assistant jobs filled by persons holdingmultiple jobs within the districts.
The average annual salary for multiple job employees who work at least 1,260 hours (7hours per day, 180 contract days) is $18,352. Approximately 73% of all full-time multiple jobemployees earn between $12,000 and $35,000 annually. Thirty-two employees earn minimumwage in at least one of the multiple jobs they hold (Appendix O).
GENDER DIFFERENCES IN ASSIGNMENTS AND PAY
Of the 48,470 classified employees reported in the Classified Staff Database (CSD),2000-2001, female employees number 38,368 representing 79% of the workforce while 10,102male employees make up 21% of the classified service.
Table 9 indicates the total number of male and female employees by job family. Femaleemployees predominantly fill positions in the job families that have the largest number ofemployees, including fiscal, food services, health, instructional, and secretarial/clerical. Maleemployees dominate maintenance, security/law enforcement, and warehouse job categories.
According to the Classified Staff Database, fifty-one or 18% of 277 job classificationslisted are held by total female populations. Females do not hold positions in thirty-nine jobclassifications representing 14% of the 277 classifications in school districts.
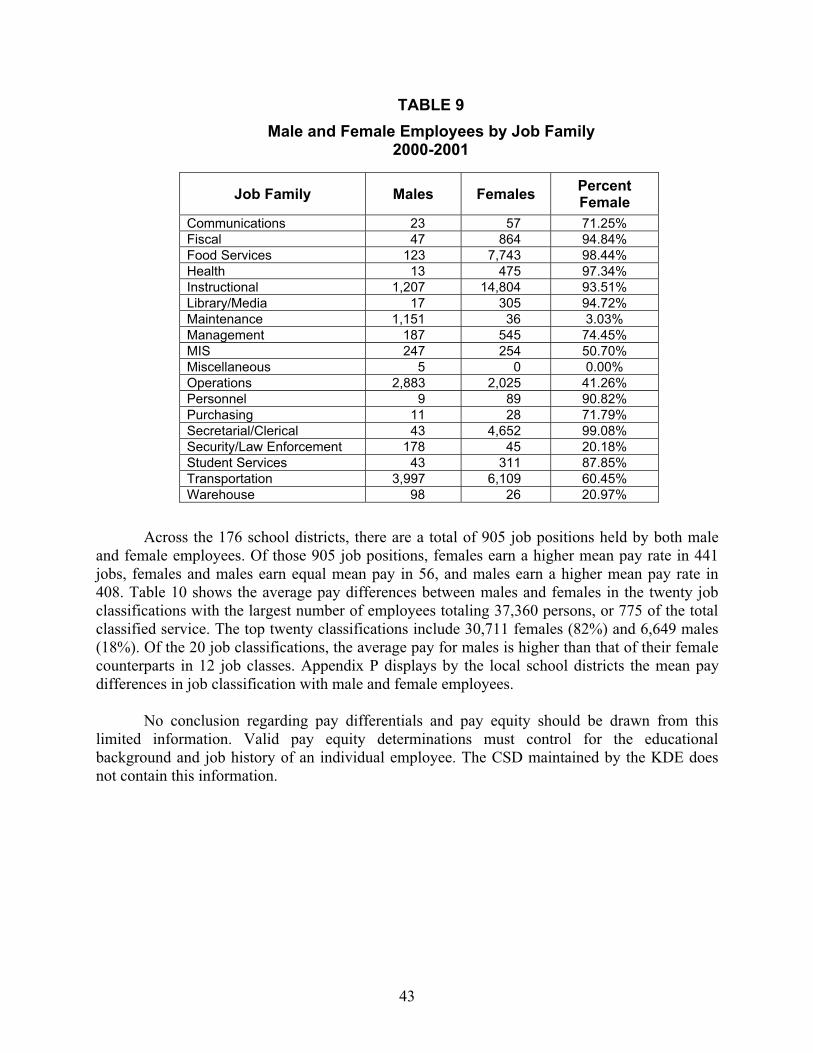
43
TABLE 9Male and Female Employees by Job Family
2000-2001
Job Family Males Females PercentFemale
Communications 23 57 71.25%Fiscal 47 864 94.84%Food Services 123 7,743 98.44%Health 13 475 97.34%Instructional 1,207 14,804 93.51%Library/Media 17 305 94.72%Maintenance 1,151 36 3.03%Management 187 545 74.45%MIS 247 254 50.70%Miscellaneous 5 0 0.00%Operations 2,883 2,025 41.26%Personnel 9 89 90.82%Purchasing 11 28 71.79%Secretarial/Clerical 43 4,652 99.08%Security/Law Enforcement 178 45 20.18%Student Services 43 311 87.85%Transportation 3,997 6,109 60.45%Warehouse 98 26 20.97%
Across the 176 school districts, there are a total of 905 job positions held by both maleand female employees. Of those 905 job positions, females earn a higher mean pay rate in 441jobs, females and males earn equal mean pay in 56, and males earn a higher mean pay rate in408. Table 10 shows the average pay differences between males and females in the twenty jobclassifications with the largest number of employees totaling 37,360 persons, or 775 of the totalclassified service. The top twenty classifications include 30,711 females (82%) and 6,649 males(18%). Of the 20 job classifications, the average pay for males is higher than that of their femalecounterparts in 12 job classes. Appendix P displays by the local school districts the mean paydifferences in job classification with male and female employees.
No conclusion regarding pay differentials and pay equity should be drawn from thislimited information. Valid pay equity determinations must control for the educationalbackground and job history of an individual employee. The CSD maintained by the KDE doesnot contain this information.
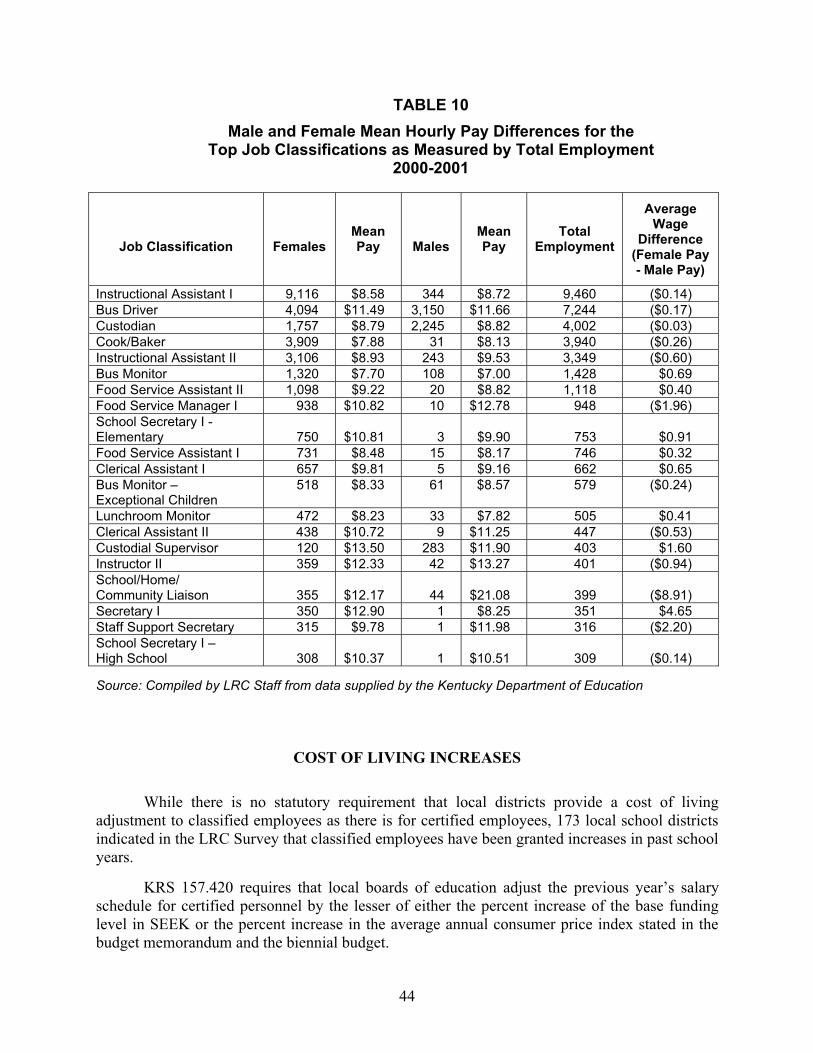
44
TABLE 10Male and Female Mean Hourly Pay Differences for the
Top Job Classifications as Measured by Total Employment2000-2001
Job Classification FemalesMeanPay Males
MeanPay
TotalEmployment
AverageWage
Difference(Female Pay- Male Pay)
Instructional Assistant I 9,116 $8.58 344 $8.72 9,460 ($0.14)Bus Driver 4,094 $11.49 3,150 $11.66 7,244 ($0.17)Custodian 1,757 $8.79 2,245 $8.82 4,002 ($0.03)Cook/Baker 3,909 $7.88 31 $8.13 3,940 ($0.26)Instructional Assistant II 3,106 $8.93 243 $9.53 3,349 ($0.60)Bus Monitor 1,320 $7.70 108 $7.00 1,428 $0.69Food Service Assistant II 1,098 $9.22 20 $8.82 1,118 $0.40Food Service Manager I 938 $10.82 10 $12.78 948 ($1.96)School Secretary I -Elementary 750 $10.81 3 $9.90 753 $0.91Food Service Assistant I 731 $8.48 15 $8.17 746 $0.32Clerical Assistant I 657 $9.81 5 $9.16 662 $0.65Bus Monitor –Exceptional Children
518 $8.33 61 $8.57 579 ($0.24)
Lunchroom Monitor 472 $8.23 33 $7.82 505 $0.41Clerical Assistant II 438 $10.72 9 $11.25 447 ($0.53)Custodial Supervisor 120 $13.50 283 $11.90 403 $1.60Instructor II 359 $12.33 42 $13.27 401 ($0.94)School/Home/Community Liaison 355 $12.17 44 $21.08 399 ($8.91)Secretary I 350 $12.90 1 $8.25 351 $4.65Staff Support Secretary 315 $9.78 1 $11.98 316 ($2.20)School Secretary I –High School 308 $10.37 1 $10.51 309 ($0.14)
Source: Compiled by LRC Staff from data supplied by the Kentucky Department of Education
COST OF LIVING INCREASES
While there is no statutory requirement that local districts provide a cost of livingadjustment to classified employees as there is for certified employees, 173 local school districtsindicated in the LRC Survey that classified employees have been granted increases in past schoolyears.
KRS 157.420 requires that local boards of education adjust the previous year’s salaryschedule for certified personnel by the lesser of either the percent increase of the base fundinglevel in SEEK or the percent increase in the average annual consumer price index stated in thebudget memorandum and the biennial budget.
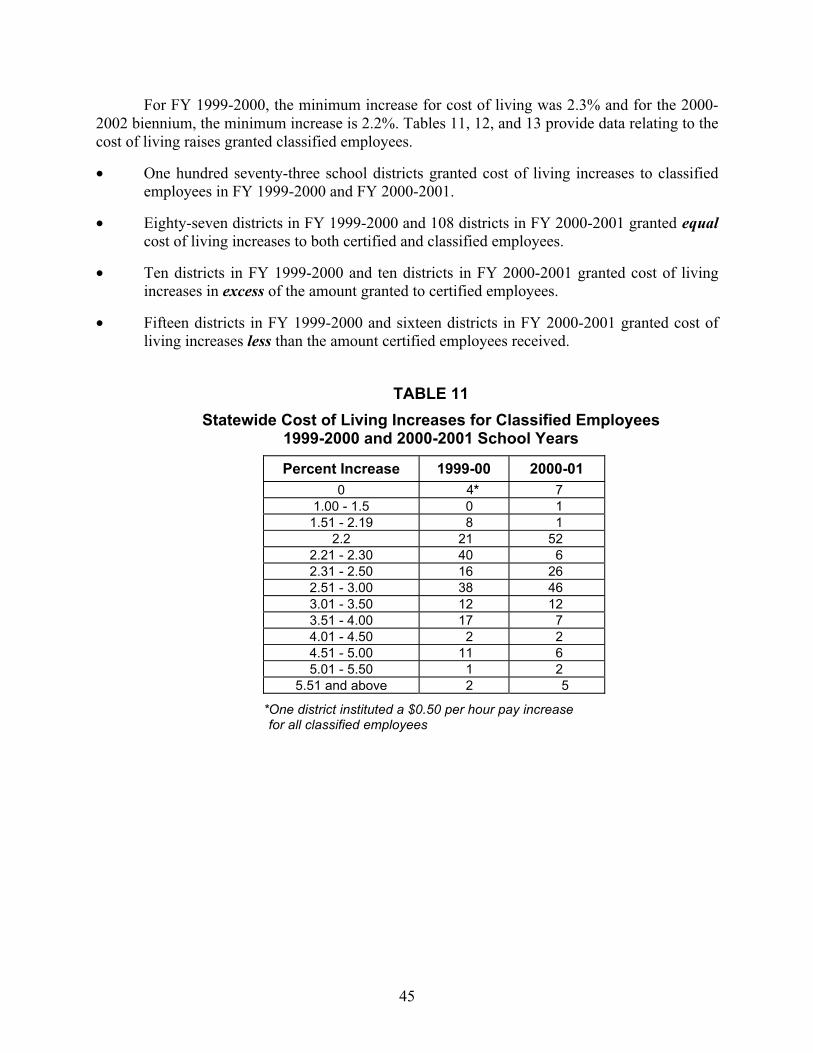
45
For FY 1999-2000, the minimum increase for cost of living was 2.3% and for the 2000-2002 biennium, the minimum increase is 2.2%. Tables 11, 12, and 13 provide data relating to thecost of living raises granted classified employees.
• One hundred seventy-three school districts granted cost of living increases to classifiedemployees in FY 1999-2000 and FY 2000-2001.
• Eighty-seven districts in FY 1999-2000 and 108 districts in FY 2000-2001 granted equalcost of living increases to both certified and classified employees.
• Ten districts in FY 1999-2000 and ten districts in FY 2000-2001 granted cost of livingincreases in excess of the amount granted to certified employees.
• Fifteen districts in FY 1999-2000 and sixteen districts in FY 2000-2001 granted cost ofliving increases less than the amount certified employees received.
TABLE 11Statewide Cost of Living Increases for Classified Employees
1999-2000 and 2000-2001 School Years
Percent Increase 1999-00 2000-010 4* 7
1.00 - 1.5 0 11.51 - 2.19 8 1
2.2 21 522.21 - 2.30 40 62.31 - 2.50 16 262.51 - 3.00 38 463.01 - 3.50 12 123.51 - 4.00 17 74.01 - 4.50 2 24.51 - 5.00 11 65.01 - 5.50 1 2
5.51 and above 2 5
*One district instituted a $0.50 per hour pay increase*for all classified employees

46
TABLE 12Districts that Granted Cost of LivingIncreases in Excess of the Amount
Granted to Certified Employees
FY 1999-2000
District Classified% Increase
Certified% Increase
Campbell (91) 3.2 2.5Clinton (131) 4.0 2.8Clay (125) 5.0 2.3Dayton (147) 3.0 2.4Frankfort (177) 2.99 2.8Fulton (185) 3.0 2.3Jessamine (281) 6.5 4.37Magoffin (371) 6.0 2.3Owsley (475) 3.0 2.4Todd (551) 3.5 3.2
FY 2000-2001
District Classified% Increase
Certified% Increase
Bath (25) 4.0 3.0Campbell (91) 6.8 3.5Clay (125) 4.0 3.0Clinton (131) 3.0 2.3Covington Ind. (134) 4.6 2.2Dayton (147) 7.5 5.0Frankfort (177) 4.49 3.0Jessamine (281) 7.2 4.51Magoffin (371) 3.7 2.2Owsley (475) 3.0 2.4
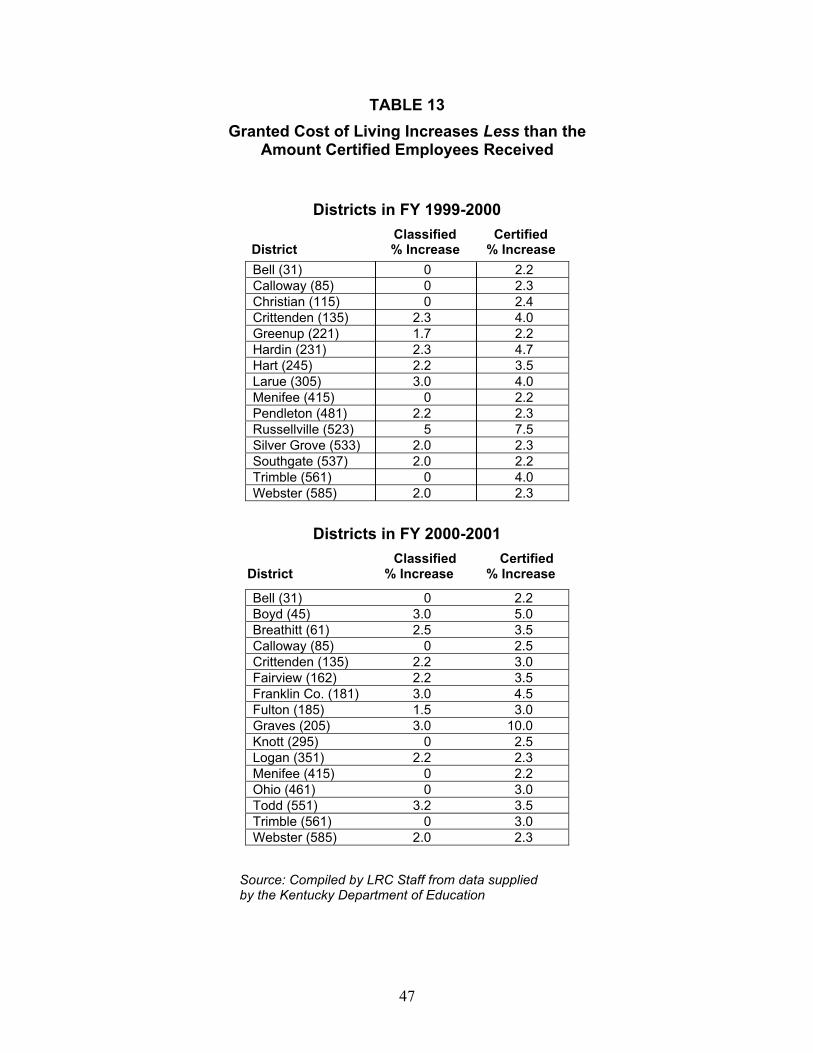
47
TABLE 13Granted Cost of Living Increases Less than the
Amount Certified Employees Received
Districts in FY 1999-2000Classified Certified
District % Increase % IncreaseBell (31) 0 2.2Calloway (85) 0 2.3Christian (115) 0 2.4Crittenden (135) 2.3 4.0Greenup (221) 1.7 2.2Hardin (231) 2.3 4.7Hart (245) 2.2 3.5Larue (305) 3.0 4.0Menifee (415) 0 2.2Pendleton (481) 2.2 2.3Russellville (523) 5 7.5Silver Grove (533) 2.0 2.3Southgate (537) 2.0 2.2Trimble (561) 0 4.0Webster (585) 2.0 2.3
Districts in FY 2000-2001Classified Certified
District % Increase % Increase
Bell (31) 0 2.2Boyd (45) 3.0 5.0Breathitt (61) 2.5 3.5Calloway (85) 0 2.5Crittenden (135) 2.2 3.0Fairview (162) 2.2 3.5Franklin Co. (181) 3.0 4.5Fulton (185) 1.5 3.0Graves (205) 3.0 10.0Knott (295) 0 2.5Logan (351) 2.2 2.3Menifee (415) 0 2.2Ohio (461) 0 3.0Todd (551) 3.2 3.5Trimble (561) 0 3.0Webster (585) 2.0 2.3
Source: Compiled by LRC Staff from data suppliedby the Kentucky Department of Education
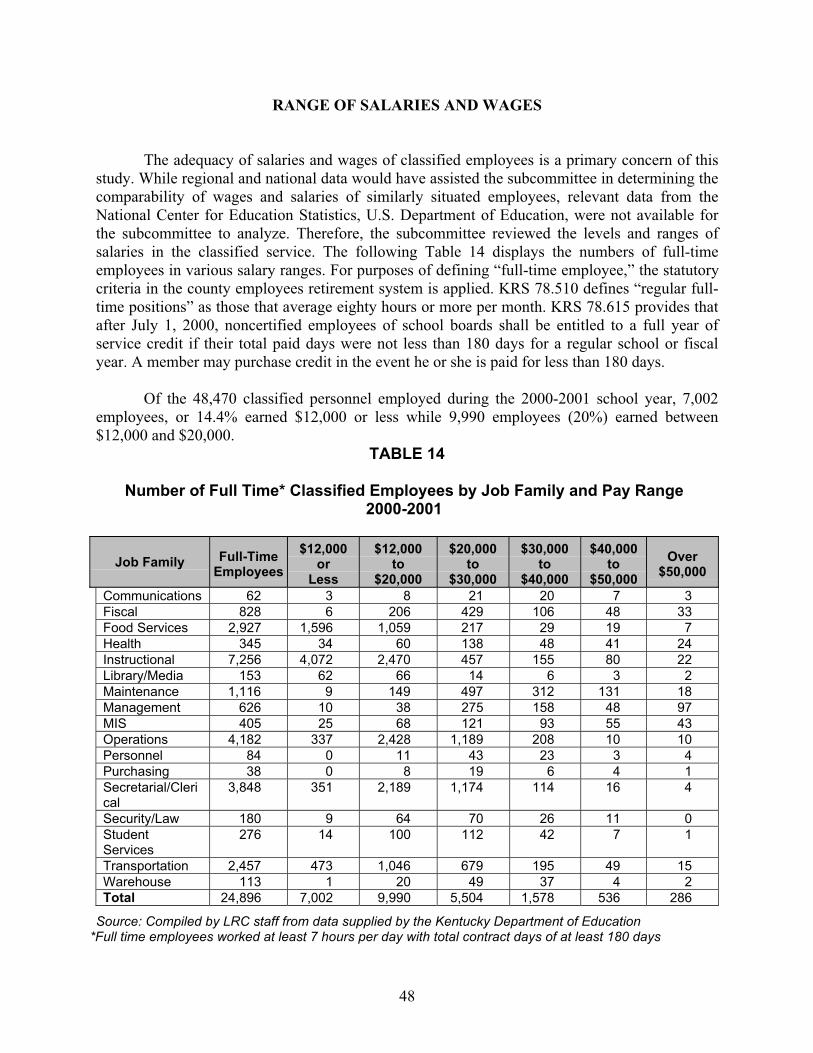
48
RANGE OF SALARIES AND WAGES
The adequacy of salaries and wages of classified employees is a primary concern of thisstudy. While regional and national data would have assisted the subcommittee in determining thecomparability of wages and salaries of similarly situated employees, relevant data from theNational Center for Education Statistics, U.S. Department of Education, were not available forthe subcommittee to analyze. Therefore, the subcommittee reviewed the levels and ranges ofsalaries in the classified service. The following Table 14 displays the numbers of full-timeemployees in various salary ranges. For purposes of defining “full-time employee,” the statutorycriteria in the county employees retirement system is applied. KRS 78.510 defines “regular full-time positions” as those that average eighty hours or more per month. KRS 78.615 provides thatafter July 1, 2000, noncertified employees of school boards shall be entitled to a full year ofservice credit if their total paid days were not less than 180 days for a regular school or fiscalyear. A member may purchase credit in the event he or she is paid for less than 180 days.
Of the 48,470 classified personnel employed during the 2000-2001 school year, 7,002employees, or 14.4% earned $12,000 or less while 9,990 employees (20%) earned between$12,000 and $20,000.
TABLE 14
Number of Full Time* Classified Employees by Job Family and Pay Range2000-2001
Job Family Full-TimeEmployees
$12,000or
Less
$12,000to
$20,000
$20,000to
$30,000
$30,000to
$40,000
$40,000to
$50,000Over
$50,000
Communications 62 3 8 21 20 7 3Fiscal 828 6 206 429 106 48 33Food Services 2,927 1,596 1,059 217 29 19 7Health 345 34 60 138 48 41 24Instructional 7,256 4,072 2,470 457 155 80 22Library/Media 153 62 66 14 6 3 2Maintenance 1,116 9 149 497 312 131 18Management 626 10 38 275 158 48 97MIS 405 25 68 121 93 55 43Operations 4,182 337 2,428 1,189 208 10 10Personnel 84 0 11 43 23 3 4Purchasing 38 0 8 19 6 4 1Secretarial/Clerical
3,848 351 2,189 1,174 114 16 4
Security/Law 180 9 64 70 26 11 0StudentServices
276 14 100 112 42 7 1
Transportation 2,457 473 1,046 679 195 49 15Warehouse 113 1 20 49 37 4 2Total 24,896 7,002 9,990 5,504 1,578 536 286
Source: Compiled by LRC staff from data supplied by the Kentucky Department of Education*Full time employees worked at least 7 hours per day with total contract days of at least 180 days

49
BENEFITS FOR CLASSIFIED EMPLOYEES
Classified employees throughout the state receive benefits prescribed by the KentuckyRevised Statutes. These include sick, emergency and personal leave, retirement benefits, andhealth and life insurance.
Sick, Personal, and Emergency Leave
As noted in Chapter II, a local school district may grant up to three days for emergencyleave and not affect sick leave. Sick leave may accumulate without limitation and betransferable. Employees are allowed to use up to three days sick leave for emergency leave perschool year and be paid for unused sick leave upon retirement or death of an active contributingmember.
One hundred and sixty-one districts provided usable responses to the LRC surveyregarding sick leave. Of the 161 districts, eight districts (5%) offered eleven days sick leave, 135districts (84%) offered ten sick days and the remaining 11% or eighteen districts offered nine orfewer sick leave days (LRC Survey, 2001).
In response to the question whether the districts paid for unused sick leave to retirees, 138out of 169 responding districts reported providing this benefit.
One hundred seventy-three districts responded to the question whether the districtprovided personal and emergency days. Forty-nine districts (28%) granted three days; 47districts (27%) granted two days; one district offered 1.5 days; 50 districts (29%) offered onlyone day, and 26 districts (15%) did not offer days for personal leave. Fifty-four school districts(31.21%) offered three emergency days as a benefit to classified employees, 37 districts offeredtwo days, thirteen districts granted one day, while 69 districts (39.88%) do not provideemergency days as a benefit.
Professional Development Days
One hundred-fifty districts (85%) of the 173 responding reported that they granted paidprofessional development days to classified employees. However, testimony fromrepresentatives of the Kentucky Education Support Professional Association disputed the factthat districts offer professional days as a benefit (Testimony: Toombs, 2001).
Retirement Program
Classified employees are members of the County Employees Retirement System, towhich employees contribute 5.0% and employers contribute 7.17% of an employee’s salary.
50
Classified employees also contribute to Social Security at a rate of 6.0% which is matched by theemployer.
For service after July 1, 2000, classified employees who average eighty or more hours ofwork per month and who are paid for 180 or more days are eligible to earn a full year ofretirement service credit in accordance with KRS 78.510 and 78.615. Classified employees whoare paid less than the 180 days may purchase credit according to the rules established by theCounty Employees Retirement System.
Health Insurance
Any employee who works at least eighty hours per month is eligible to participate in thestate health insurance program and may pay the premium for those months not employed. Thehigh cost of health insurance is a major concern for all employees. Premiums are expected to riseabout 11% in 2002. Testimony revealed the hardship of some classified employees who struggleto pay for insurance coverage. A representative of the Kentucky Educational SupportProfessional Association reported at the April and November 2001 subcommittee meetings thatthe costs of the monthly premium consumes take home pay for some employees, and othersactually owe the school district after premium cost and all of the other employee deductions arecalculated (Testimony: Franklin, Toombs, and Watson, 2001).
Life Insurance
The Commonwealth provides for each full-time employee a life insurance benefit of$20,000 under group coverage that is based on the master contract between the Commonwealthand the insurance carrier.
Additional Benefits Provided to Classified Employees
School districts were surveyed regarding the benefits they offer employees that arebeyond those benefits required by law. The responses among the 173 districts show that sixtyschool districts (35.26%) offer dental insurance or reimbursement plans; and thirty-two districts(19%) offer expanded life insurance coverage. Moreover, Anderson County offers matchingdollars to employee contributions to a financial investment plan.
SALARY SCHEDULES IN LOCAL SCHOOL DISTRICTS
Local school districts were asked to submit the salary schedules, and 167 of 176 schooldistricts complied. Salary schedules for the 2000-2001 school year were received from thirty-four school districts in association with their survey response. The remaining 142 districts
51
submitted schedules for FY 2001-2002 as a result of a later request made by the Office ofEducation Accountability.
A review of the salary schedules received shows little uniformity in the design:
• Some districts assigned pay for job classifications to a grid of pay rates for hourly orsalaried positions.
• Some districts have pay schedules for each job class.
• Some state an hourly pay rate or an annual salary for the current year.
• Many pay schedules show annual increments for each year or for a term of years ofservice and experience while one district shows no increase between one and twentyyears of service.
Extra Duty as a Salary Enhancement
For classified employees, extra duty may include responsibilities or job assignments overand beyond the duties of the primary job assignment. Local district salary schedules characterizeextra duty as supervisory or managerial duties, or assignment to evening and night shifts,particularly among bus drivers, custodial, maintenance, and food service workers. Based on the173 districts responding to the LRC Survey, 146 school districts (84.9%) awarded additional payand thirty school districts (17.34%) granted compensatory time for extra duties performed.
Educational Achievement as a Salary Enhancement
Educational achievement was also a basis for salary enhancements in 39 school districts(22.54%) of the 173 school districts responding. Based on a review of the salary schedules, acollege degree or a certain number of hours toward a college degree qualified certain employeesfor increased salaries.
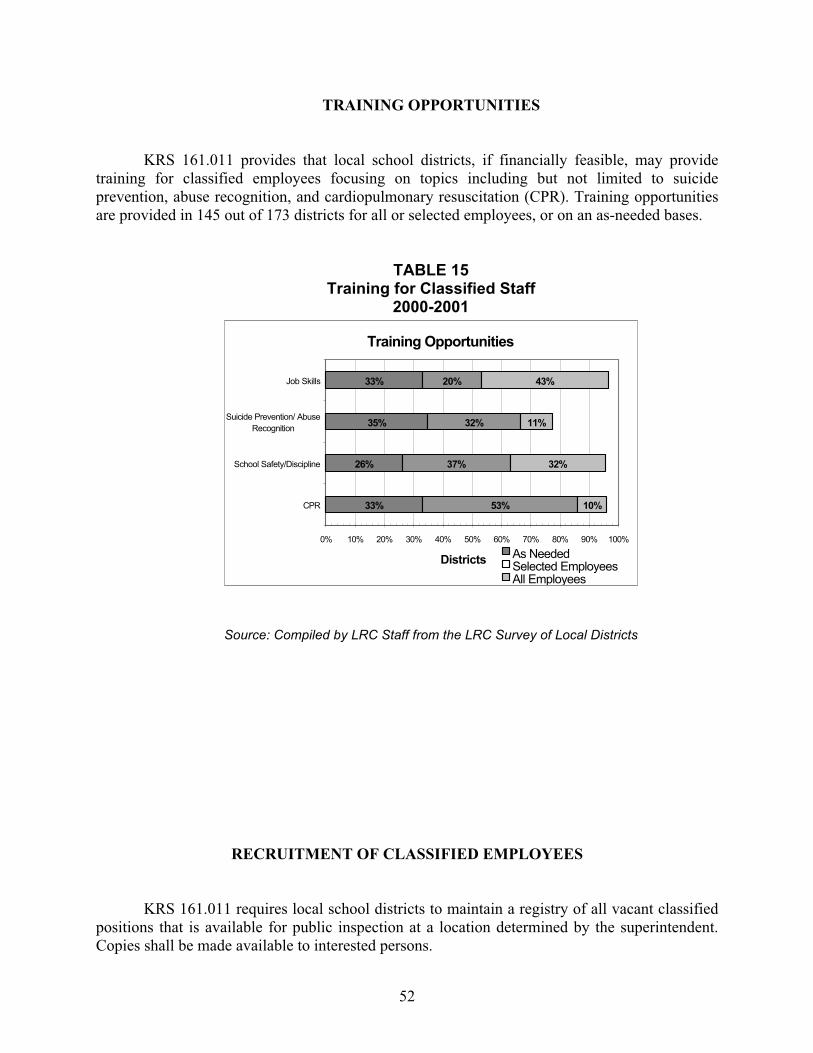
52
TRAINING OPPORTUNITIES
KRS 161.011 provides that local school districts, if financially feasible, may providetraining for classified employees focusing on topics including but not limited to suicideprevention, abuse recognition, and cardiopulmonary resuscitation (CPR). Training opportunitiesare provided in 145 out of 173 districts for all or selected employees, or on an as-needed bases.
TABLE 15Training for Classified Staff
2000-2001
Training Opportunities
33%
26%
35%
33%
10%
32%
11%
53%
37%
32%
20% 43%
0% 10% 20% 30% 40% 50% 60% 70% 80% 90% 100%
CPR
School Safety/Discipline
Suicide Prevention/ AbuseRecognition
Job Skills
Districts As NeededSelected EmployeesAll Employees
Source: Compiled by LRC Staff from the LRC Survey of Local Districts
RECRUITMENT OF CLASSIFIED EMPLOYEES
KRS 161.011 requires local school districts to maintain a registry of all vacant classifiedpositions that is available for public inspection at a location determined by the superintendent.Copies shall be made available to interested persons.
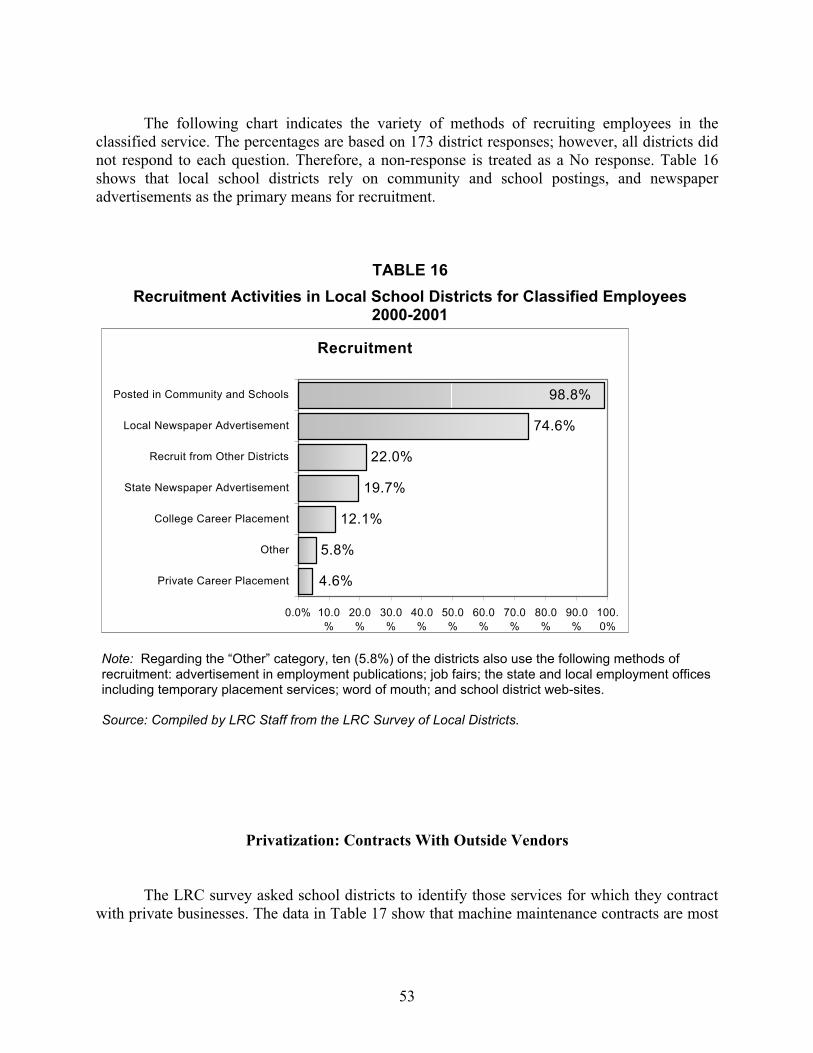
53
The following chart indicates the variety of methods of recruiting employees in theclassified service. The percentages are based on 173 district responses; however, all districts didnot respond to each question. Therefore, a non-response is treated as a No response. Table 16shows that local school districts rely on community and school postings, and newspaperadvertisements as the primary means for recruitment.
TABLE 16Recruitment Activities in Local School Districts for Classified Employees
2000-2001
Recruitment
5.8%
12.1%
19.7%
22.0%
74.6%
98.8%
4.6%
0.0% 10.0%
20.0%
30.0%
40.0%
50.0%
60.0%
70.0%
80.0%
90.0%
100.0%
Private Career Placement
Other
College Career Placement
State Newspaper Advertisement
Recruit from Other Districts
Local Newspaper Advertisement
Posted in Community and Schools
Note: Regarding the “Other” category, ten (5.8%) of the districts also use the following methods ofrecruitment: advertisement in employment publications; job fairs; the state and local employment officesincluding temporary placement services; word of mouth; and school district web-sites.
Source: Compiled by LRC Staff from the LRC Survey of Local Districts.
Privatization: Contracts With Outside Vendors
The LRC survey asked school districts to identify those services for which they contractwith private businesses. The data in Table 17 show that machine maintenance contracts are most
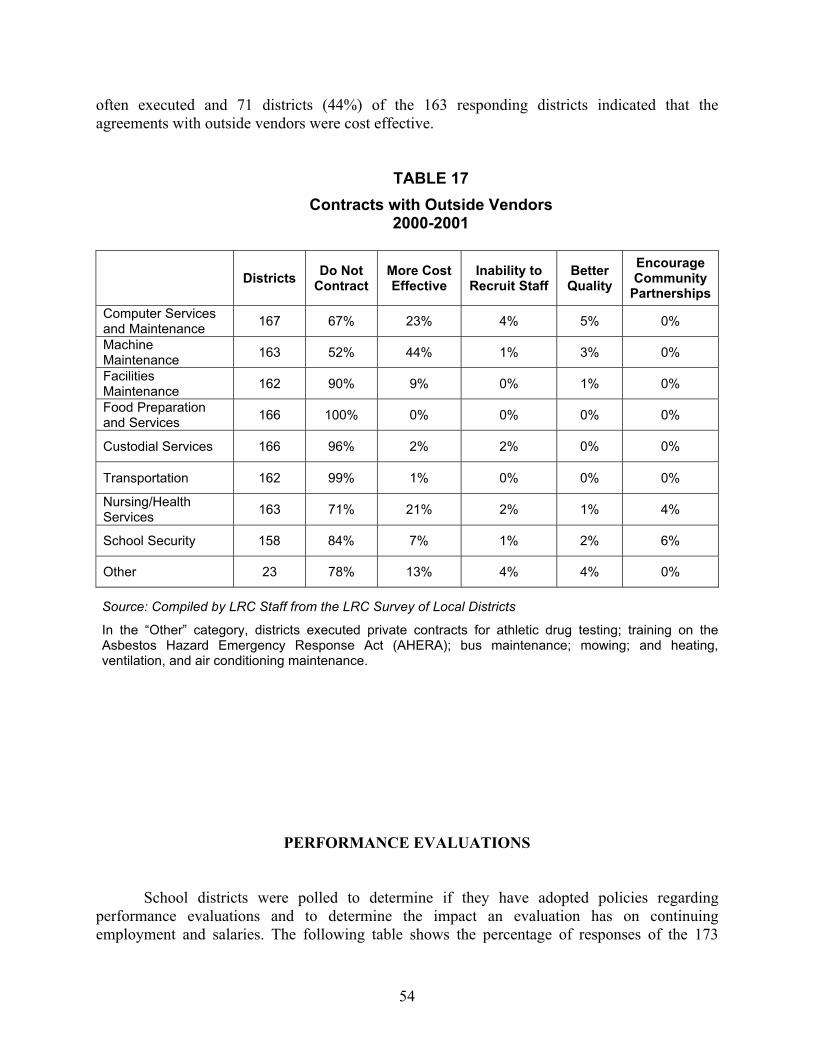
54
often executed and 71 districts (44%) of the 163 responding districts indicated that theagreements with outside vendors were cost effective.
TABLE 17Contracts with Outside Vendors
2000-2001
Districts Do NotContract
More CostEffective
Inability toRecruit Staff
BetterQuality
EncourageCommunity
PartnershipsComputer Servicesand Maintenance 167 67% 23% 4% 5% 0%
MachineMaintenance 163 52% 44% 1% 3% 0%
FacilitiesMaintenance 162 90% 9% 0% 1% 0%
Food Preparationand Services 166 100% 0% 0% 0% 0%
Custodial Services 166 96% 2% 2% 0% 0%
Transportation 162 99% 1% 0% 0% 0%
Nursing/HealthServices 163 71% 21% 2% 1% 4%
School Security 158 84% 7% 1% 2% 6%
Other 23 78% 13% 4% 4% 0%
Source: Compiled by LRC Staff from the LRC Survey of Local Districts
In the “Other” category, districts executed private contracts for athletic drug testing; training on theAsbestos Hazard Emergency Response Act (AHERA); bus maintenance; mowing; and heating,ventilation, and air conditioning maintenance.
PERFORMANCE EVALUATIONS
School districts were polled to determine if they have adopted policies regardingperformance evaluations and to determine the impact an evaluation has on continuingemployment and salaries. The following table shows the percentage of responses of the 173

55
districts. Ninety-eight percent (98.8%) of the districts used evaluations to improve performance,but only 3.5% use the evaluations to adjust wages or salaries.
TABLE 18Performance Evaluations
2000-2001
Performance Evaluations Percent of DistrictsWhere Statement Applies
Have Written Policy Requiring Evaluation 97.7%Every Classified Employee is Evaluated 87.8%Evaluation May Determine Contract Renewal 94.8%Evaluations are Used to Improve Performance 98.8%Evaluations are Used to Adjust Wage or Salary 3.5%
Source: Compiled by LRC Staff from data supplied from the LRC Survey of local districts.
PROFESSIONAL BARGAINING UNITS
In four school districts, classified employee salaries and benefits are professionallynegotiated or bargained by a union or organization representing classified employees. They areas follows:
• Carter County classified employees, represented by the Kentucky Education SupportPersonnel Association.
• Floyd County bus drivers, represented by the United Steelworkers of America.
• Harlan County classified employees, represented by the United Machine Workers ofAmerica.
• Jefferson County selected service employees, represented by Teamsters Local 783; foodservice employees, represented by International Union Local 557 AFL-CIO.
REWARDS DISTRIBUTED TO SUCCESSFUL SCHOOLS
The Kentucky Department of Education has collected data on the use of rewards earnedby successful schools under the accountability and assessment system pursuant to KRS158.6455. Table 19 displays the frequency counts and the percentages of the uses of the rewards
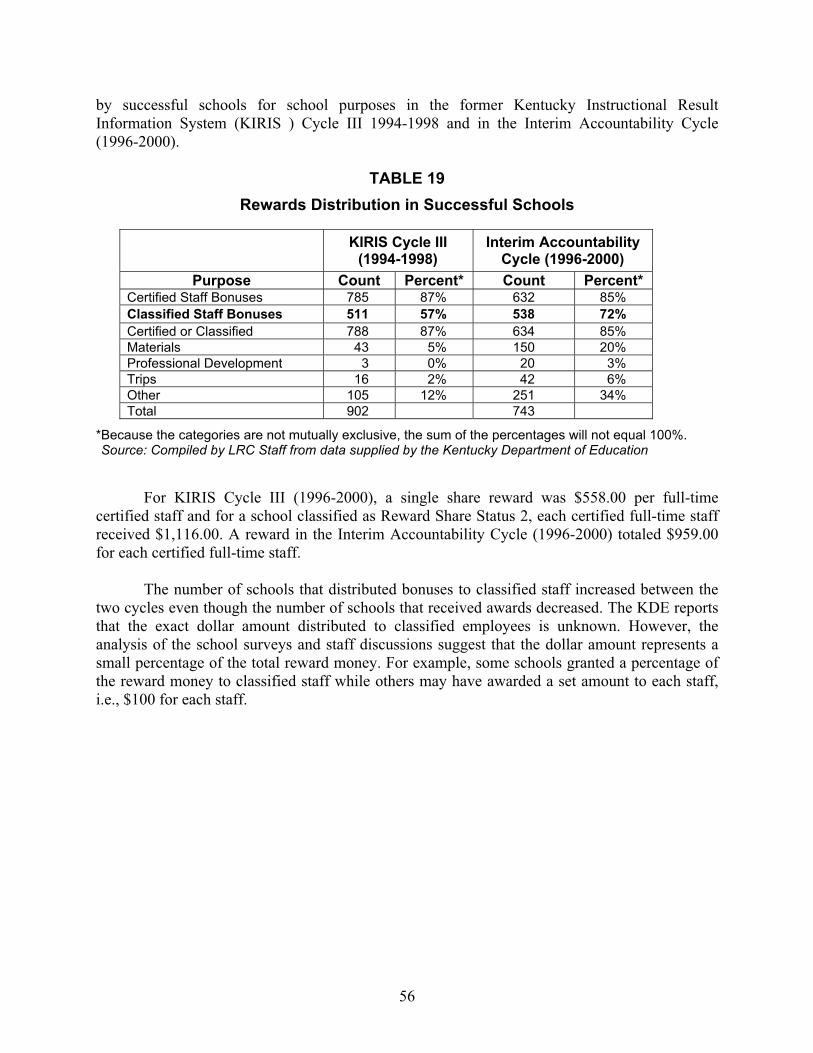
56
by successful schools for school purposes in the former Kentucky Instructional ResultInformation System (KIRIS ) Cycle III 1994-1998 and in the Interim Accountability Cycle(1996-2000).
TABLE 19Rewards Distribution in Successful Schools
KIRIS Cycle III(1994-1998)
Interim AccountabilityCycle (1996-2000)
Purpose Count Percent* Count Percent*Certified Staff Bonuses 785 87% 632 85%Classified Staff Bonuses 511 57% 538 72%Certified or Classified 788 87% 634 85%Materials 43 5% 150 20%Professional Development 3 0% 20 3%Trips 16 2% 42 6%Other 105 12% 251 34%Total 902 743
*Because the categories are not mutually exclusive, the sum of the percentages will not equal 100%.*Source: Compiled by LRC Staff from data supplied by the Kentucky Department of Education
For KIRIS Cycle III (1996-2000), a single share reward was $558.00 per full-timecertified staff and for a school classified as Reward Share Status 2, each certified full-time staffreceived $1,116.00. A reward in the Interim Accountability Cycle (1996-2000) totaled $959.00for each certified full-time staff.
The number of schools that distributed bonuses to classified staff increased between thetwo cycles even though the number of schools that received awards decreased. The KDE reportsthat the exact dollar amount distributed to classified employees is unknown. However, theanalysis of the school surveys and staff discussions suggest that the dollar amount represents asmall percentage of the total reward money. For example, some schools granted a percentage ofthe reward money to classified staff while others may have awarded a set amount to each staff,i.e., $100 for each staff.
57
CHAPTER V
FINDINGS AND RECOMMENDATIONS
FINDINGS RELATED TO TEACHER COMPENSATION AND BENEFITS
The Subcommittee on Teacher Compensation has given careful consideration to theissues relating to teacher compensation and found no debate about the value of quality teachingto the well-being of our families and children and the quality of life for our state as a whole. TheSubcommittee members discussed that without well-educated citizens, the state will have greatdifficulty in competing in a world economy and improving the quality of life for all Kentuckians.
Kentucky is faced with the dilemma of relatively flat teacher salaries and increased costsfor health care benefits, a situation which makes teaching less appealing at the very time whenthe state is experiencing a crisis in the growing number of emergency certified teachers. Asignificant percentage of Kentucky’s teachers are eligible for retirement, and recruitment of newteachers is difficult as other professions appeal to many of Kentucky’s brightest people. Keepingteachers in the classroom is a challenge that may be partially met by increasing beginningteacher salaries and benefits, providing career advancement opportunities, and providingincentives for existing teachers to achieve higher levels of skill and knowledge withopportunities to provide classroom leadership to other teachers. The subcommittee believes thatkeeping existing teachers in the classrooms as well as recruiting new persons to the professionare the best ways to alleviate teacher shortages and decrease the number of emergency certifiedpersons.
In order that “every Kentucky child have a highly qualified, caring teacher in everycourse and classroom,” the subcommittee recommended that the Interim Joint Committee onEducation adopt a series of recommendations that send a clear message that the GeneralAssembly is committed to a long-range strategy to address teacher compensation and benefitsand that the professional contributions that teachers make to our state are valued. Likewise, theSubcommittee recommended that the Joint Committee take some action to recognize thecontributions of classified personnel.
The following principles adopted by the Subcommittee on Teacher Compensation andBenefits underpin the recommendations:
• It is important to build on the past by continuing to support a basic salary schedule thatprovides equity regardless of the school assignments, the subject area assignments, andrace or gender of the teachers, but options should be provided as well as incentives toschool districts to develop professional compensation plans that supplement or modifythe schedule to accommodate unique community needs.

58
• Raising the minimum basic salary levels for beginning as well as more experiencedteachers as revenue permits is essential to Kentucky’s being able to compete with thesurrounding states for teachers and making the teaching profession competitive withother professions that are recruiting.
• It should be acknowledged that Kentucky has demanded from its teachers that they teachto new standards, that they bear greater risks than in the past, and that they take greaterleadership roles within the total school program. We recognize that many teachers mayfeel unprepared to deal with the cultural and language diversity, the needs of childrenwith disabilities, classroom management and discipline, and effectively engaging parentsin the educational process. More time for planning, curriculum research anddevelopment, working with other teachers, and professional development is needed tomeet these increased demands.
• It should be acknowledged that the public may not see that increased salary and benefitsare needed, as teachers may be among the highest paid persons in some communities;they perceive teachers work fewer days and hours than others; and other professionals insome communities may not be paid well either. However, we believe that the public willsupport increased pay for teachers who acquire more knowledge and skill, for teacherswho work a longer work year, and for assurance that teachers’ salaries are competitivewith other professionals in hard to fill content areas.
• Research supports the notion that teachers are the most important variable in how wellstudents learn and achieve—more important than socio-economic status and otherfactors. It is our responsibility to provide adequate compensation and benefits to developand retain a supply of highly qualified teachers.
Recommendations Related to Teacher Compensation and Benefits
1. Retain a single salary schedule that recognizes educational rank and experience fordetermining base pay, but provide options for salary supplements beyond the base.
2. In the 2002 regular session of the General Assembly, adopt a required minimum salaryschedule in the biennial budget that reflects the actual beginning salaries of teachers inthe state and adjust the cells proportionately in order to establish the base from whichfuture salary adjustments are made.
3. Beginning in the 2003-2004 school year or when state funding to supplement existingsalaries is available, modify the cells in the state single salary schedule by establishing acell for 20-24 years experience, one for 25-29 years experience, and one for 30 andbeyond years experience with a $500 - $1000 minimal incremental difference amongthese new cells. If the existing district schedule provides for the pay differential, noadditional adjustment is required, and a teacher would not receive a pay increase underthese provisions unless the district chose to do so.

59
4. If funds are available, beginning in the 2004-2006 biennium, require that the localdistricts raise the basic salary at all salary cells in the single salary schedule by aminimum of $1000 or a proportional amount, based on the state appropriations for thispurpose.
5. In addition to increases in base salaries, beginning in the 2004-2006 biennium or whenfunds become available and in the subsequent biennia, lengthen the work year as follows:
6. 2004-2005 School Year—Add two additional days for instruction and one day forprofessional development to equal a 188 day calendar (177 days instruction, 5professional development days, 4 holidays, 1 opening and 1 closing day)
7. 2005-2006 School Year—Add two additional days for instruction and one day forprofessional development to equal a 191 day calendar (179 days instruction, 6professional development days, 4 holidays, 1 opening and 1 closing day)
8. 2006-2007 School Year—Add one additional day for instruction and one day forprofessional development to equal a 193 day calendar (180 days instruction, 7professional development days, 4 holidays, 1 opening and 1 closing day)
9. 2007-2008 School Year—Add one additional day for professional development to equal a194 day calendar (180 days for instruction, 8 professional development days, 4 holidays,1 opening and 1 closing day)
10. Provide supplemental funding to local districts to ensure teachers the same cost of livingadjustment that is provided state government workers beginning with the 2002-2004biennium.
11. Adequately fund in the 2002-2004 biennium and in subsequent biennia, the supplementsfor teachers who earn National Board Certification, and in future biennia considerincreasing the supplements; and
12. Increase funds when available for those who serve as resource teachers to interns, whoserve as supervising teachers, and who serve as classroom mentors.
13. Establish a state fund to be administered by the Kentucky Department of Education forthe purpose of supporting the development of at least five (5) local district pilot,differentiated pay programs that are designed to decrease the number of emergencycertified teachers employed in the district, provide career advancement opportunities forclassroom teachers who voluntarily wish to participate, and reward teachers forincreasing their skills, knowledge, and instructional leadership within the district orschool based on specific criteria established by the local board of education and incompliance with the criteria for participation in the competitive grant process asestablished by the Kentucky Board of Education.
60
14. Require the Kentucky Department of Education to gather information from the districtpilot compensation plans and provide recommendations to the General Assembly prior tothe 2004 regular session regarding the feasibility of establishing a statewide teacheradvancement program.
15. Establish a state fund designated for local districts to “Grow their own Teachers” byproviding loans to emergency certified personnel and existing classified personnel suchas teachers’ aides to become certified to teach in their districts. Design this on a loanforgiveness proposition so that the individual gives service back to the district for fundsreceived. Provide that the Kentucky Higher Education Savings Plan Trust manage thefund.
16. Continue funding a statewide recruitment plan and encourage the Kentucky Departmentof Education to continue efforts under way to attract high school students and collegestudents to teaching through teacher clubs and other efforts.
17. Modify the current scholarship program for teachers to eliminate the need-basedrequirement only for existing certified teachers to receive scholarships to return to schoolto become certified in chronic teacher shortage areas, as determined by the Commissionerof Education in cooperation with the EPSB, in areas such as special education, math,science, foreign language, or any area where there is a determined critical shortage.
18. During the 2002-2004 require the Legislative Research Commission to conduct aresearch study of the Kentucky Teacher and Principal Internship programs and report thefindings to the Interim Joint Committee on Education with recommendations, includingbudget recommendations for improving the existing internship program, includingmentoring support for second year teachers.
19. Clarify in statute that local school districts may provide additional salary compensationabove the base single salary schedule for teachers who are recruited to serve in criticalshortage areas including geographic, subject matter, or diversity; and teachers who agreeto transfer from a high-performing school to a low-performing school. Require theKentucky Board of Education to promulgate administrative regulations to define high andlow-performing schools, acceptable transfers within shortage areas, and the conditionsunder which the additional salary compensation may be provided for these purposes.
20. Urge the General Assembly to consider funding a supplement for dependent carecoverage for health insurance plans.
21. Urge the Council on Postsecondary Education, in collaboration with the Kentucky Boardof Education, to include a provision in the criteria for developing Model TeacherPreparation programs for paid sabbaticals for a limited number of experienced teachers toparticipate in professional renewal and growth activities with the university.
22. Consider funding to support administrative aides for special education teachers in localschool districts.
61
23. Urge the federal government to fully fund special education, and continue to advocate tostate and federal officials the need to reduce paper work burdens on teachers in specialeducation.
24. Support amending the current law to permit retired teachers to return to full-timeteachingwithout regard to the number who may do so as long as it is actuarially sound for theretirement system.
FINDINGS RELATED TOCOMPENSATION AND BENEFITS FOR CLASSIFIED EMPLOYEES
Classified employees perform a valuable service to the education system. They are adedicated, caring group of individuals who are as a rule career employees within the schooldistricts. However, some districts are finding it difficult to recruit persons to particular jobclassifications. One reason has been the inability to provide competitive salaries for certain jobclassifications, because of the wide availability of jobs in the private sector. However, shortagesin available personnel have not affected the majority of school districts.
The benefit package for classified employees is comparable to that of private sectoremployees for the same job classifications. The benefits are comparable to other state and countyemployees. However, the increasing costs of health care are troubling to many employees whodepend on this coverage for their families, particularly when salaries for classified employeesremain relatively low.
Although not required by law, the majority of school districts do have in place salaryschedules and policies, although these may vary considerably.
While cost of living increases are not required by law, most districts have providedincreases equal to or greater than the percentages given to certified employees.
The Subcommittee on Classified Personnel Compensation believes its purpose was tofocus on increasing the salaries and wages of classified employees, and it should be the intent ofthe General Assembly to seek this end even though the Commonwealth of Kentucky facesrevenue shortfalls.
Recommendations Relating to Classified Personnel
1. KRS 158.6455 should be amended to require that if certified employees elect to grantbonuses, reward monies shall be distributed equally to all certified and classifiedemployees in the school.

62
2. The Kentucky Board of Education should review the formula for calculating the rewardamounts to be disbursed to successful schools and consider adding classified employeesin the formula.
3. The Kentucky Department of Education should be granted greater oversight of thefinancial management and evaluation of school districts. The department should begranted authority to establish standards for school financial management and to conductfinancial audits on a random basis.
4. Local districts should continue to grant cost of living increases to classified employees,and the increase should be equal to the increase provided to certified employees.
5. The Kentucky County Employees Retirement System and the Kentucky Department ofEducation are directed to review the number of days required for classified employees toreceive a year’s credit for retirement and to find solutions to include those employeeswho “have fallen through the cracks”—i. e., employees who work fewer than the required180 days and eighty hours a month.
6. Any increase in salaries for classified employees should be funded through the SEEKformula.
7. Increases to salaries of classified employees also may be funded through a state/localmatch program that is established outside of the SEEK program.
8. The local boards of education should establish salary schedules for the various jobpositions comprising the district’s classified employee system.
ACTIONS OF THE INTERIM JOINT COMMITTEE ON EDUCATION
The Interim Joint Committee on Education accepted the reports of the subcommittees andthe recommendations as stated above on December 5, 2001.
63
BIBLIOGRAPHY
Bolich, Anjanette M. Reduce Your Losses: Help New Teachers Become Veteran Teachers.Atlanta, GA: Southern Regional Education Board, 2001.
Cincinnati Federation of Teachers and Cincinnati Public Schools. Teacher Education System.Cincinnati: Cincinnati Public Schools, 2000.
Clements, Stephen. Kentucky Teachers: Charting a Course for KERA’s Second Decade.Frankfort, Kentucky: The Kentucky Long-Term Policy Research Center, 1999.
Darling-Hammond, Linda. Doing What Matters Most: Investing in Quality Teaching. New York:National Commission for Teaching and America’s Future, 1997.
__________. Solving the Dilemmas of Teacher Supply, Demand, and Standards. New York:National Commission for Teaching and America’s Future, 2000.
__________. Teacher Quality and Student Achievement: A Review of State Policy Evidence.Seattle: Center for the Study of Teaching and Policy, University of Washington, 2000.
Fordham Foundation, Thomas B. The Teachers We Need and How to Get More of Them.Washington, D.C.: Thomas B. Fordham Foundation, 1999.http://www.edexcellence.net/library/teacher.html
Gaines, Gale F. Beyond Salaries: Employer Benefits for Teachers in the SREB States. Atlanta:Southern Regional Education Board, 2001.
__________. Focus on Teacher Salaries: An Update on Average Salaries and Recent LegislativeActions in the SREB States. Atlanta: Southern Regional Education Board, 2001.
__________. Focus on Teacher Salaries:What Teacher Salary Averages Don’t Show. Atlanta:Southern Regional Education Board, 2000.
__________. Teacher Salaries and State Priorities for Educational Quality:A Vital Link.Atlanta: Southern Regional Education Board, 2000.
Goldberg, Phyllis and Karen M. Proctor. Teacher Voices 2000: A Survey on TeacherRecruitment and Retention, Commissioned by Scholastic Inc. Washington, D.C.: Council ofChief State School Officers, October 2000.
Haselkorn, David and Louis Harris. The Essential Profession: American Education at theCrossroads. Belmont, MA: Recruiting New Teachers, Inc. (RNT), 2001.
Hirsch, Eric. Teacher Recruitment: Staffing Classrooms and Quality Teachers. Denver: StateHigher Education Executive Officers, 2001.
64
_________. Teacher Policy: A Summary of Current Trends. State Legislative Report, 23: 5.Denver: National Conference of State Legislatures, February 1998.
Horizon Research. Exploration of the Dynamics of Job Satisfaction Among Kentucky PublicSchool Teachers: Qualitative Research Key Findings. Frankfort: Kentucky School BoardsAssociation, 2001.
Kansas. State Department of Education. Results of Teacher Survey prepared by Dr. SherrillMartinez. Topeka: State Department of Education, 2000.
Kelley, Carolyn and Allan Odden. Reinventing Teacher Compensation System. New Brunswick,NJ: CPRE Finance Center, September 1995.
Kentucky. Legislative Research Commission. LRC Survey Compensation, Benefits, andPersonnel Policies for Classified and Certified School Employees, 2001 (unpublished).
__________. Legislative Research Commission. Teacher Quality Issues in Kentucky. ResearchMemorandum No. 297. Frankfort: LRC, 2000.
MetLife. The Metlife Survey of the American Teacher. Prepared by Harris Interactive Inc. Projectteam: Dana Markow, Sarah Fauth, and Diana Gravitch. New York: MetLife, 2001.
Milanowski, Anthony. The Variety of Knowledge and Skill-Based Pay Design: A Comparison ofSeven New Pay Systems for K-12 Teachers. Madison, WI: Consortium for Policy Research inEducation, May 2001.
Milken, Lowell. A Matter of Quality: A Strategy for Assuring the High Caliber of America’sTeachers. Santa Monica, CA: Milken Family Foundation, 1999.
National Commission for Teaching and America’s Future. What Matters Most: Teaching forAmerica’s Future. New York: National Commission for Teaching and America’s Future, 1996.
Nelson, F. Howard, Krista Schneider, and Jewell C. Gould. Survey and Analysis of TeacherSalary Trends 1999. Washington, D.C.: American Federation of Teachers, 1999.
Rupert, Sandra S. Improving Pension Portability for K-12 Teachers. Denver: State HigherEducation Executive Officers, 2001.
Russell, Alene Bycer and Sandra S. Ruppe Compendium of Resources on Teacher Mobility.Denver: State Higher Education Executive Officers, 2001.rt.
Samuelsen, Shelby. Current Trends in Teacher Policy. State Legislative Report, 25:3. Denver:National Conference of State Legislatures, March 2000.
65
Sanders, William L. and June C. Rivers. Cumulative and Residual Effects of Teachers on FutureStudent Academic Achievement. Knoxville: University of Tennessee Value-Added Research andAssessment Center, November 1996.
United States. Department of Education, National Center for Education Statistics. Attrition ofNew Teachers Among Recent College graduates: Comparing Occupational Stability Among1992-93 Graduates Who Taught and Those Who Worked on Other Occupations, NCES 2001-189, by Robin R. Henke and Lisa Zahn. Project Officer: C. Dennis Carroll. Washington, D.C.:U.S. Government Printing Office, 2001.
__________. Department of Education, National Center for Education Statistics. Out of FieldTeaching and Educational Equality. Statistical Analysis Report No. 96-040, by Richard M.Ingersoll. Washington, D.C.: U.S. Government Printing Office, 1996.
__________. Department of Education, National Center for Education Statistics. TeacherQuality: A Report on the Preparation and Qualifications of Public School Teachers. StatisticalAnalysis Report No. 99-080, by Laurie Lewis et al., Bernie Greene, project officer. Washington,D.C.: U.S. Government Printing Office, 1999.

66
67
LIST OF APPENDICES
A. Survey: Compensation, Benefits, and Personnel Policies for Classified and Certified SchoolEmployees
B. Presenters to the Interim Joint Committee, Subcommittees on Teacher Compensation, andClassified Personnel Compensation
C. School District Codes
D. Map of Kentucky School Calendar by District, 2001-2002
E. Map of Kentucky School District Median Years Experience for Public School Teachers
F. Professional Staff Data on Kentucky’s Teachers
G. Map Indicating Number of Public School Teachers by District, 2000-2001
H. Salary Schedules in Local School Districts
I. Teacher Salary and Experience Summary, 2000-2001
J. Map of School Districts Above and Below State’s Average Annual Salary for Public SchoolTeachers, 2000-2001
K. Ten Local School Districts with the Largest Number of Emergency Certificates Granted,2000-2001, 1999-2000, and 1998-1999
L. Number of Kentucky Emergency Teaching Certificates Awarded by Content Area, 2000-2001, 1999-2000, and 1998-1999
M. 1999-2000 Local District Revenue: Percentage of State, Local, and Federal Revenue
N. Classified Employees Average Pay, Hours, and Contract Days by Job Classification, 2000-2001 School Year
O. Employees With Multiple Jobs Who Earn Minimum Wage Within a School District, 2000-2001
P. Female Employment by Job Classification
Q. Actions by the 2002 General Assembly Relating to Compensation and Benefits for SchoolEmployees

68

69
APPENDIX A
SURVEY: COMPENSATION, BENEFITS,AND PERSONNEL POLICIES FOR
CLASSIFIED AND CERTIFIED SCHOOL EMPLOYEES
INTRODUCTION
The purpose of the survey is to inform the Legislative Research Commission’s Interim JointCommittee on Education as it studies compensation, benefits, and personnel issues relating to classifiedand certified school personnel. PART I of the survey deals with classified and support personnel who arenot required to have certification for their positions. PART II deals with personnel needing certification tohold their positions. The questions and statements relate to the current 2000-2001 school year unlessotherwise indicated.
PART I: CLASSIFIED EMPLOYEES
Please Enter Your School District Code:
1. Please answer the following questions regarding particular job classifications that exist in your district.If a position does not exist, please ignore the questions that accompany it.
(a) Building Maintenance SupervisorsIf you do not employ this job classification, skip to (b).
Are there salaried positions for this classification? Yes NoIf Yes, is a salary schedule maintained for these salaried workers? Yes No
Are there hourly positions for this classification? Yes NoIf Yes, is a salary schedule maintained for these hourly workers? Yes No
Is pay for this classification differentiated by the following:In-district years of experience? Yes NoOut-of-district years of experience? Yes NoEducation credentials or achievement? Yes No
Has the district had difficulty finding qualified persons for this classification duringthe 2000-2001 school year? Yes No
(b) Building Maintenance TechniciansIf you do not employ this job classification, skip to (c).
Are there salaried positions for this classification? Yes NoIf Yes, is a salary schedule maintained for these salaried workers? Yes No
Are there hourly positions for this classification? Yes NoIf Yes, is a salary schedule maintained for these hourly workers? Yes No
Is pay for this classification differentiated by the following:In-district years of experience? Yes NoOut-of-district years of experience? Yes NoEducation credentials or achievement? Yes No
Has the district had difficulty finding qualified persons for this classification duringthe 2000-2001 school year? Yes No
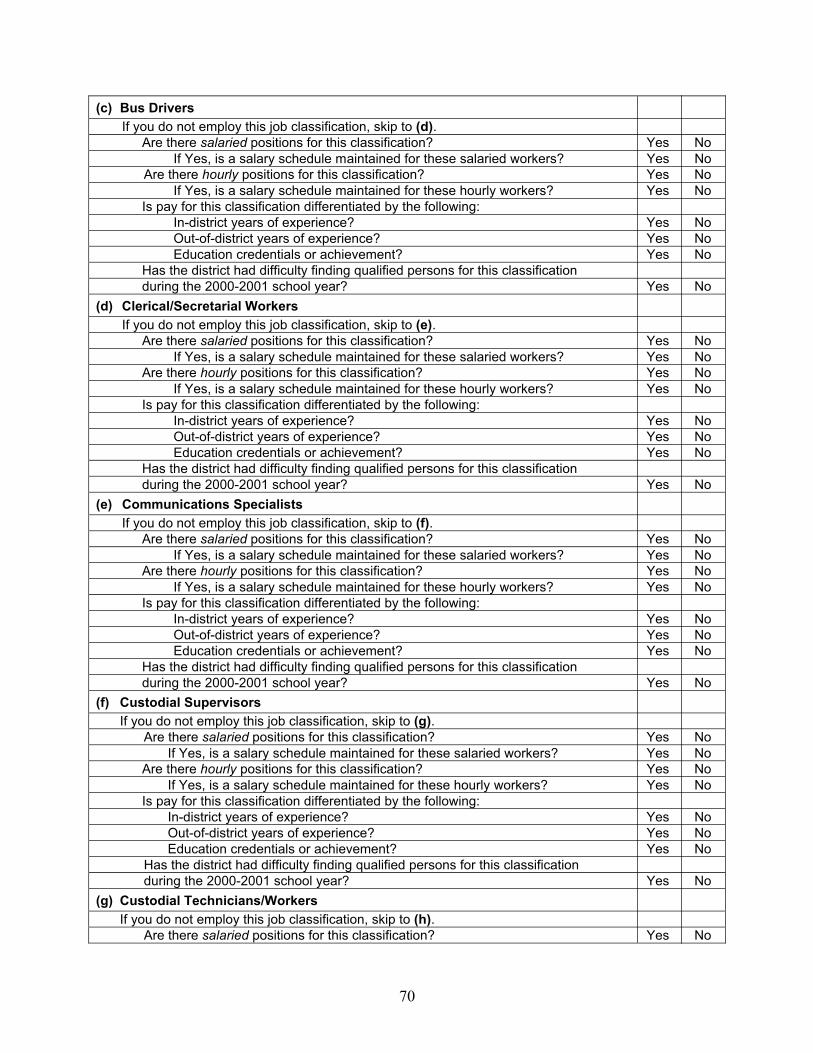
70
(c) Bus DriversIf you do not employ this job classification, skip to (d).
Are there salaried positions for this classification? Yes NoIf Yes, is a salary schedule maintained for these salaried workers? Yes No
Are there hourly positions for this classification? Yes NoIf Yes, is a salary schedule maintained for these hourly workers? Yes No
Is pay for this classification differentiated by the following:In-district years of experience? Yes NoOut-of-district years of experience? Yes NoEducation credentials or achievement? Yes No
Has the district had difficulty finding qualified persons for this classificationduring the 2000-2001 school year? Yes No
(d) Clerical/Secretarial WorkersIf you do not employ this job classification, skip to (e).
Are there salaried positions for this classification? Yes NoIf Yes, is a salary schedule maintained for these salaried workers? Yes No
Are there hourly positions for this classification? Yes NoIf Yes, is a salary schedule maintained for these hourly workers? Yes No
Is pay for this classification differentiated by the following:In-district years of experience? Yes NoOut-of-district years of experience? Yes NoEducation credentials or achievement? Yes No
Has the district had difficulty finding qualified persons for this classificationduring the 2000-2001 school year? Yes No
(e) Communications SpecialistsIf you do not employ this job classification, skip to (f).
Are there salaried positions for this classification? Yes NoIf Yes, is a salary schedule maintained for these salaried workers? Yes No
Are there hourly positions for this classification? Yes NoIf Yes, is a salary schedule maintained for these hourly workers? Yes No
Is pay for this classification differentiated by the following:In-district years of experience? Yes NoOut-of-district years of experience? Yes NoEducation credentials or achievement? Yes No
Has the district had difficulty finding qualified persons for this classificationduring the 2000-2001 school year? Yes No
(f) Custodial SupervisorsIf you do not employ this job classification, skip to (g).
Are there salaried positions for this classification? Yes NoIf Yes, is a salary schedule maintained for these salaried workers? Yes No
Are there hourly positions for this classification? Yes NoIf Yes, is a salary schedule maintained for these hourly workers? Yes No
Is pay for this classification differentiated by the following:In-district years of experience? Yes NoOut-of-district years of experience? Yes NoEducation credentials or achievement? Yes No
Has the district had difficulty finding qualified persons for this classificationduring the 2000-2001 school year? Yes No
(g) Custodial Technicians/WorkersIf you do not employ this job classification, skip to (h).
Are there salaried positions for this classification? Yes No
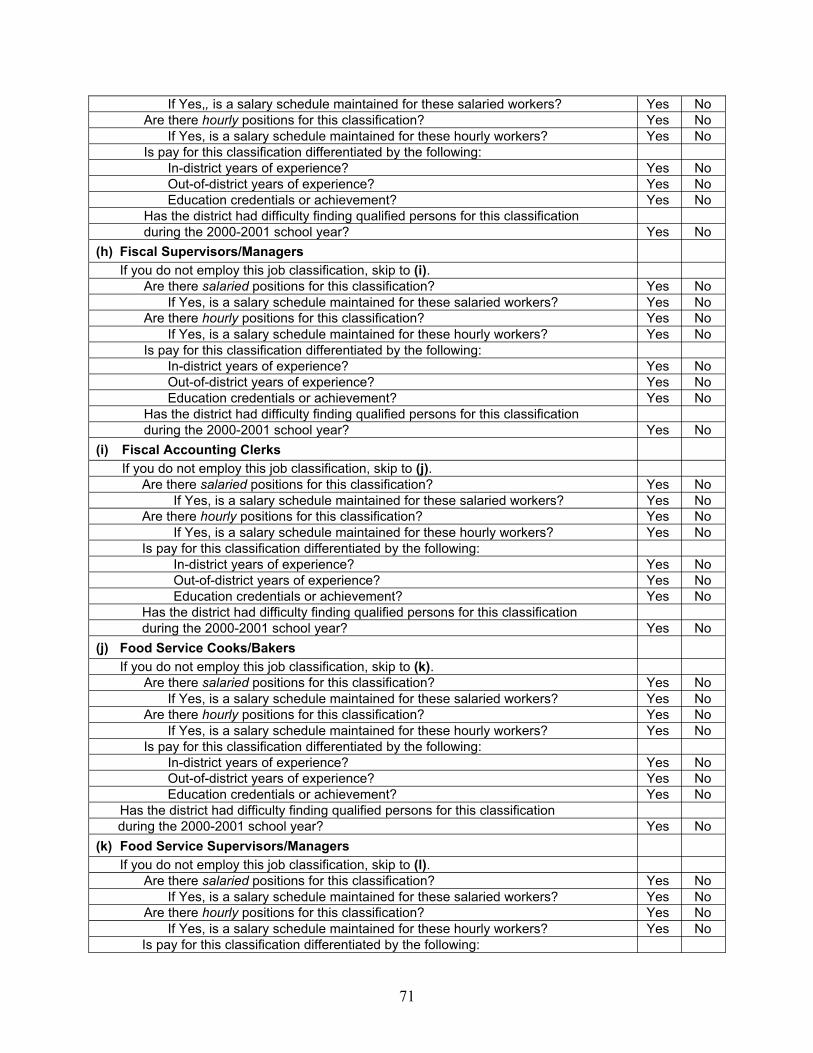
71
If Yes,, is a salary schedule maintained for these salaried workers? Yes NoAre there hourly positions for this classification? Yes No
If Yes, is a salary schedule maintained for these hourly workers? Yes NoIs pay for this classification differentiated by the following:
In-district years of experience? Yes NoOut-of-district years of experience? Yes NoEducation credentials or achievement? Yes No
Has the district had difficulty finding qualified persons for this classificationduring the 2000-2001 school year? Yes No
(h) Fiscal Supervisors/ManagersIf you do not employ this job classification, skip to (i).
Are there salaried positions for this classification? Yes NoIf Yes, is a salary schedule maintained for these salaried workers? Yes No
Are there hourly positions for this classification? Yes NoIf Yes, is a salary schedule maintained for these hourly workers? Yes No
Is pay for this classification differentiated by the following:In-district years of experience? Yes NoOut-of-district years of experience? Yes NoEducation credentials or achievement? Yes No
Has the district had difficulty finding qualified persons for this classificationduring the 2000-2001 school year? Yes No
(i) Fiscal Accounting ClerksIf you do not employ this job classification, skip to (j).
Are there salaried positions for this classification? Yes NoIf Yes, is a salary schedule maintained for these salaried workers? Yes No
Are there hourly positions for this classification? Yes NoIf Yes, is a salary schedule maintained for these hourly workers? Yes No
Is pay for this classification differentiated by the following:In-district years of experience? Yes NoOut-of-district years of experience? Yes NoEducation credentials or achievement? Yes No
Has the district had difficulty finding qualified persons for this classificationduring the 2000-2001 school year? Yes No
(j) Food Service Cooks/BakersIf you do not employ this job classification, skip to (k).
Are there salaried positions for this classification? Yes NoIf Yes, is a salary schedule maintained for these salaried workers? Yes No
Are there hourly positions for this classification? Yes NoIf Yes, is a salary schedule maintained for these hourly workers? Yes No
Is pay for this classification differentiated by the following:In-district years of experience? Yes NoOut-of-district years of experience? Yes NoEducation credentials or achievement? Yes No
Has the district had difficulty finding qualified persons for this classificationduring the 2000-2001 school year? Yes No
(k) Food Service Supervisors/ManagersIf you do not employ this job classification, skip to (l).
Are there salaried positions for this classification? Yes NoIf Yes, is a salary schedule maintained for these salaried workers? Yes No
Are there hourly positions for this classification? Yes NoIf Yes, is a salary schedule maintained for these hourly workers? Yes No
Is pay for this classification differentiated by the following:
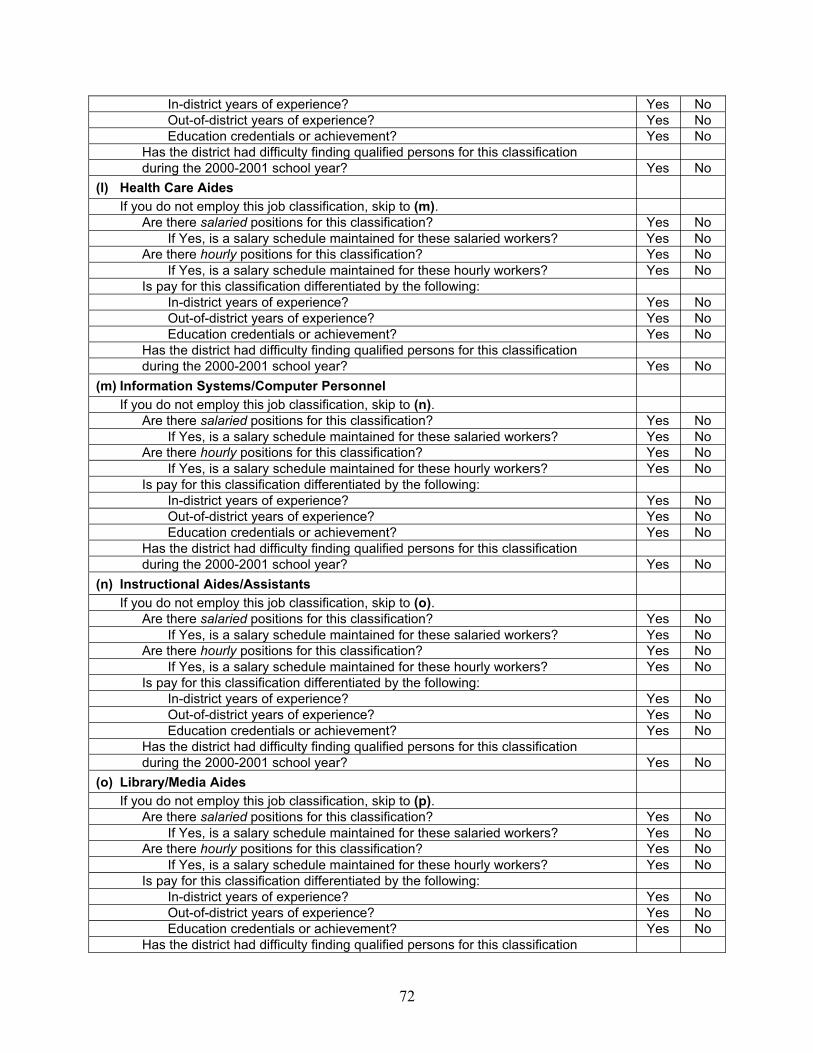
72
In-district years of experience? Yes NoOut-of-district years of experience? Yes NoEducation credentials or achievement? Yes No
Has the district had difficulty finding qualified persons for this classificationduring the 2000-2001 school year? Yes No
(l) Health Care AidesIf you do not employ this job classification, skip to (m).
Are there salaried positions for this classification? Yes NoIf Yes, is a salary schedule maintained for these salaried workers? Yes No
Are there hourly positions for this classification? Yes NoIf Yes, is a salary schedule maintained for these hourly workers? Yes No
Is pay for this classification differentiated by the following:In-district years of experience? Yes NoOut-of-district years of experience? Yes NoEducation credentials or achievement? Yes No
Has the district had difficulty finding qualified persons for this classificationduring the 2000-2001 school year? Yes No
(m) Information Systems/Computer PersonnelIf you do not employ this job classification, skip to (n).
Are there salaried positions for this classification? Yes NoIf Yes, is a salary schedule maintained for these salaried workers? Yes No
Are there hourly positions for this classification? Yes NoIf Yes, is a salary schedule maintained for these hourly workers? Yes No
Is pay for this classification differentiated by the following:In-district years of experience? Yes NoOut-of-district years of experience? Yes NoEducation credentials or achievement? Yes No
Has the district had difficulty finding qualified persons for this classificationduring the 2000-2001 school year? Yes No
(n) Instructional Aides/AssistantsIf you do not employ this job classification, skip to (o).
Are there salaried positions for this classification? Yes NoIf Yes, is a salary schedule maintained for these salaried workers? Yes No
Are there hourly positions for this classification? Yes NoIf Yes, is a salary schedule maintained for these hourly workers? Yes No
Is pay for this classification differentiated by the following:In-district years of experience? Yes NoOut-of-district years of experience? Yes NoEducation credentials or achievement? Yes No
Has the district had difficulty finding qualified persons for this classificationduring the 2000-2001 school year? Yes No
(o) Library/Media AidesIf you do not employ this job classification, skip to (p).
Are there salaried positions for this classification? Yes NoIf Yes, is a salary schedule maintained for these salaried workers? Yes No
Are there hourly positions for this classification? Yes NoIf Yes, is a salary schedule maintained for these hourly workers? Yes No
Is pay for this classification differentiated by the following:In-district years of experience? Yes NoOut-of-district years of experience? Yes NoEducation credentials or achievement? Yes No
Has the district had difficulty finding qualified persons for this classification
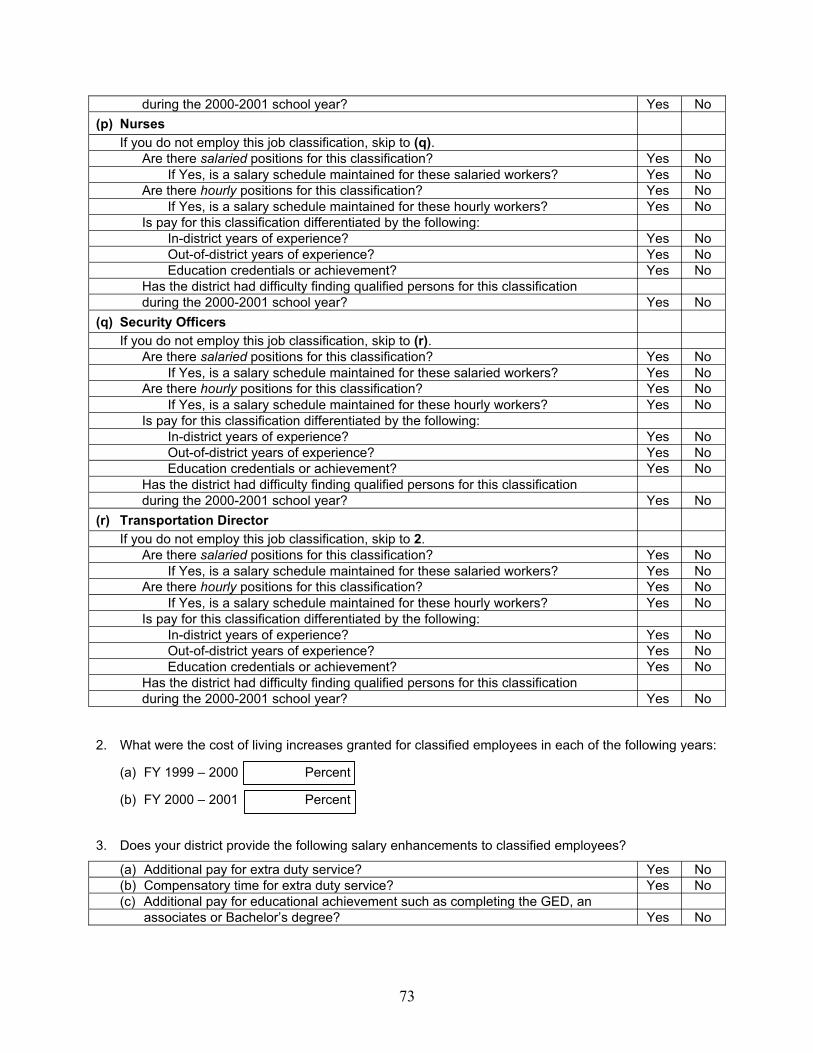
73
during the 2000-2001 school year? Yes No(p) Nurses
If you do not employ this job classification, skip to (q).Are there salaried positions for this classification? Yes No
If Yes, is a salary schedule maintained for these salaried workers? Yes NoAre there hourly positions for this classification? Yes No
If Yes, is a salary schedule maintained for these hourly workers? Yes NoIs pay for this classification differentiated by the following:
In-district years of experience? Yes NoOut-of-district years of experience? Yes NoEducation credentials or achievement? Yes No
Has the district had difficulty finding qualified persons for this classificationduring the 2000-2001 school year? Yes No
(q) Security OfficersIf you do not employ this job classification, skip to (r).
Are there salaried positions for this classification? Yes NoIf Yes, is a salary schedule maintained for these salaried workers? Yes No
Are there hourly positions for this classification? Yes NoIf Yes, is a salary schedule maintained for these hourly workers? Yes No
Is pay for this classification differentiated by the following:In-district years of experience? Yes NoOut-of-district years of experience? Yes NoEducation credentials or achievement? Yes No
Has the district had difficulty finding qualified persons for this classificationduring the 2000-2001 school year? Yes No
(r) Transportation DirectorIf you do not employ this job classification, skip to 2.
Are there salaried positions for this classification? Yes NoIf Yes, is a salary schedule maintained for these salaried workers? Yes No
Are there hourly positions for this classification? Yes NoIf Yes, is a salary schedule maintained for these hourly workers? Yes No
Is pay for this classification differentiated by the following:In-district years of experience? Yes NoOut-of-district years of experience? Yes NoEducation credentials or achievement? Yes No
Has the district had difficulty finding qualified persons for this classificationduring the 2000-2001 school year? Yes No
2. What were the cost of living increases granted for classified employees in each of the following years:
(a) FY 1999 – 2000 Percent
(b) FY 2000 – 2001 Percent
3. Does your district provide the following salary enhancements to classified employees?
(a) Additional pay for extra duty service? Yes No(b) Compensatory time for extra duty service? Yes No(c) Additional pay for educational achievement such as completing the GED, an
associates or Bachelor’s degree? Yes No
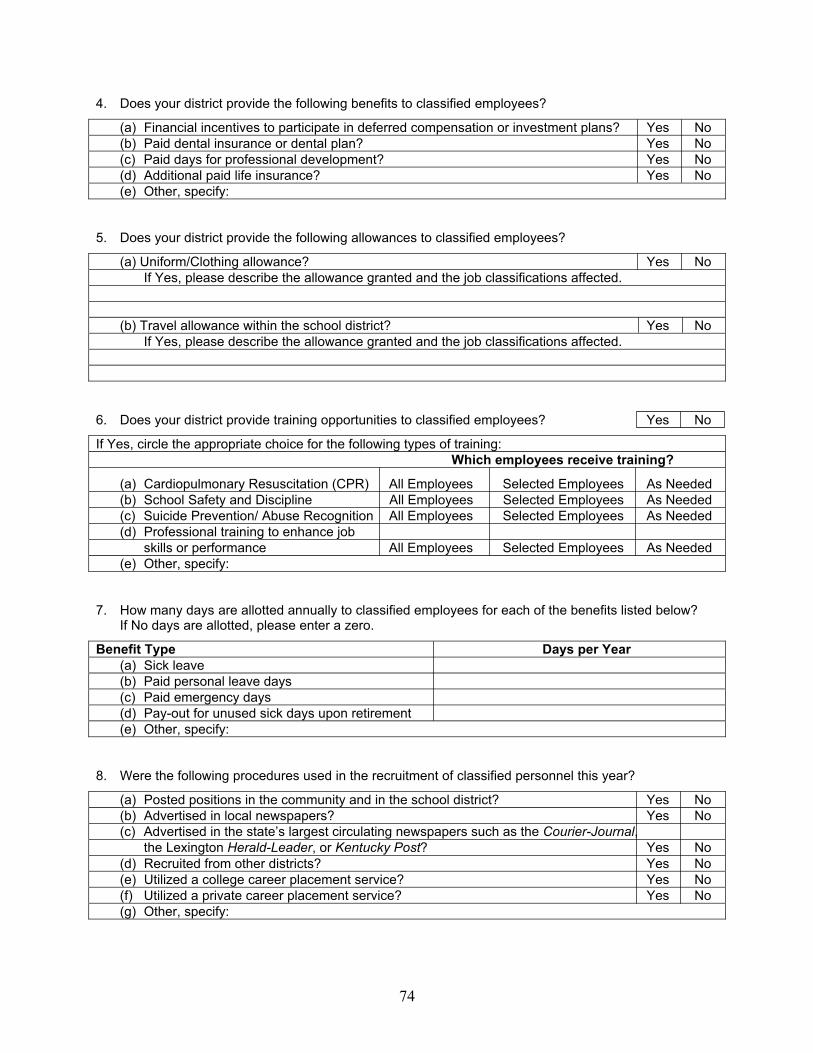
74
4. Does your district provide the following benefits to classified employees?
(a) Financial incentives to participate in deferred compensation or investment plans? Yes No(b) Paid dental insurance or dental plan? Yes No(c) Paid days for professional development? Yes No(d) Additional paid life insurance? Yes No(e) Other, specify:
5. Does your district provide the following allowances to classified employees?
(a) Uniform/Clothing allowance? Yes NoIf Yes, please describe the allowance granted and the job classifications affected.
(b) Travel allowance within the school district? Yes NoIf Yes, please describe the allowance granted and the job classifications affected.
6. Does your district provide training opportunities to classified employees? Yes No
If Yes, circle the appropriate choice for the following types of training:Which employees receive training?
(a) Cardiopulmonary Resuscitation (CPR) All Employees Selected Employees As Needed(b) School Safety and Discipline All Employees Selected Employees As Needed(c) Suicide Prevention/ Abuse Recognition All Employees Selected Employees As Needed(d) Professional training to enhance job
skills or performance All Employees Selected Employees As Needed(e) Other, specify:
7. How many days are allotted annually to classified employees for each of the benefits listed below?If No days are allotted, please enter a zero.
Benefit Type Days per Year(a) Sick leave(b) Paid personal leave days(c) Paid emergency days(d) Pay-out for unused sick days upon retirement(e) Other, specify:
8. Were the following procedures used in the recruitment of classified personnel this year?
(a) Posted positions in the community and in the school district? Yes No(b) Advertised in local newspapers? Yes No(c) Advertised in the state’s largest circulating newspapers such as the Courier-Journal,
the Lexington Herald-Leader, or Kentucky Post? Yes No(d) Recruited from other districts? Yes No(e) Utilized a college career placement service? Yes No(f) Utilized a private career placement service? Yes No(g) Other, specify:
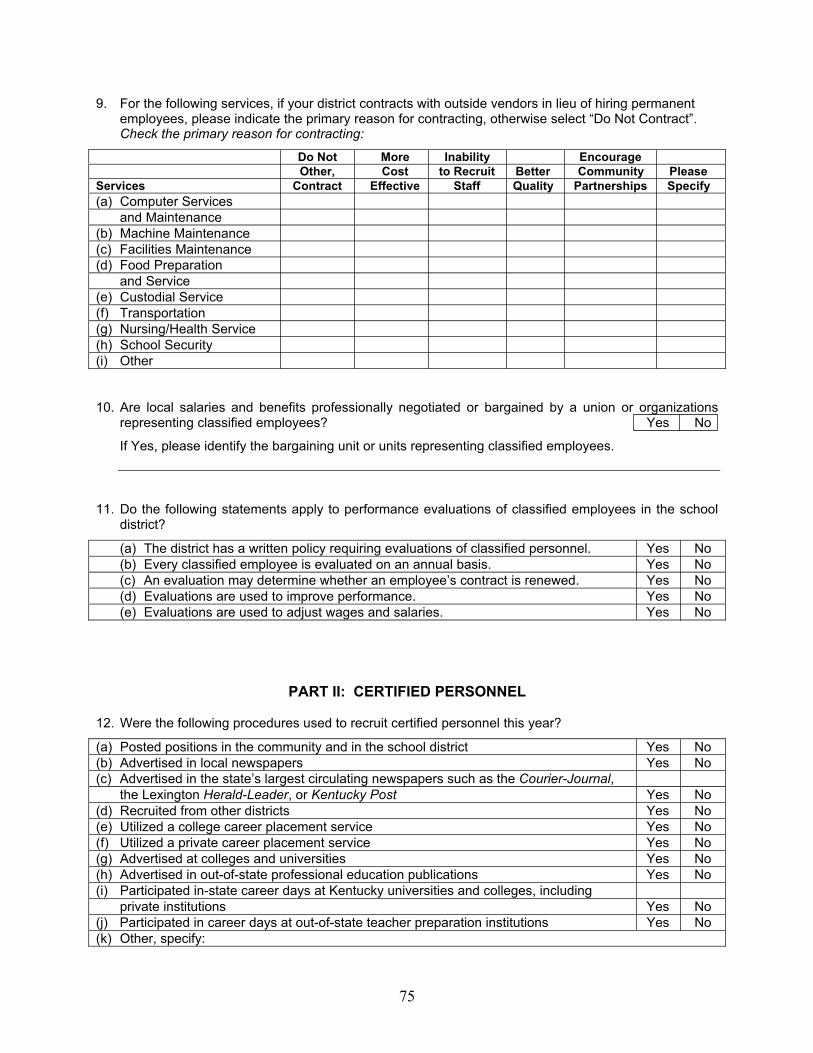
75
9. For the following services, if your district contracts with outside vendors in lieu of hiring permanentemployees, please indicate the primary reason for contracting, otherwise select “Do Not Contract”.Check the primary reason for contracting:
Do Not More Inability EncourageOther, Cost to Recruit Better Community Please
Services Contract Effective Staff Quality Partnerships Specify(a) Computer Services
and Maintenance(b) Machine Maintenance(c) Facilities Maintenance(d) Food Preparation
and Service(e) Custodial Service(f) Transportation(g) Nursing/Health Service(h) School Security(i) Other
10. Are local salaries and benefits professionally negotiated or bargained by a union or organizationsrepresenting classified employees? Yes No
If Yes, please identify the bargaining unit or units representing classified employees.
11. Do the following statements apply to performance evaluations of classified employees in the schooldistrict?
(a) The district has a written policy requiring evaluations of classified personnel. Yes No(b) Every classified employee is evaluated on an annual basis. Yes No(c) An evaluation may determine whether an employee’s contract is renewed. Yes No(d) Evaluations are used to improve performance. Yes No(e) Evaluations are used to adjust wages and salaries. Yes No
PART II: CERTIFIED PERSONNEL
12. Were the following procedures used to recruit certified personnel this year?
(a) Posted positions in the community and in the school district Yes No(b) Advertised in local newspapers Yes No(c) Advertised in the state’s largest circulating newspapers such as the Courier-Journal,
the Lexington Herald-Leader, or Kentucky Post Yes No(d) Recruited from other districts Yes No(e) Utilized a college career placement service Yes No(f) Utilized a private career placement service Yes No(g) Advertised at colleges and universities Yes No(h) Advertised in out-of-state professional education publications Yes No(i) Participated in-state career days at Kentucky universities and colleges, including
private institutions Yes No(j) Participated in career days at out-of-state teacher preparation institutions Yes No(k) Other, specify:

76
13. How many classroom teachers and administrators left the school district after the 1999-2000 schoolyear, for each of the following reasons? (Place the number in each blank corresponding to thereason, using only one reason for each person who left).
Number that Left School DistrictTeachers Administrators
Total that left after 1999-2000 school yearReason for Leaving(a) Regular retirement(b) Disability retirement(c) Took an education position in another school district in Kentucky,
Kentucky, including private schools(d) Took a position in a regional or state education organization or
institution(e) Took an education position in another state(f) Left public education for private sector employment(g) Left public education for other public employment (non-education)(h) Took leave for family reasons(i) Pursuit of additional education(j) Did not satisfactorily complete internship(k) Non-tenured teacher whose contract was not renewed N/A(l) Assignment was not renewed by the district N/A(m) Voluntarily resigned, reasons unknown(n) Tenured employee whose contract was terminated for cause(o) Ineligible to continue employment as he or she did not maintain
certification(p ) Unknown status
14. What was the percent (%) increase in the district’s single salary schedule for certified employees for the two years listed below?
(a) 1999 - 2000 Percent
(b) 2000 - 2001
15. Does your district provide the following salary enhancements to certified employees?
(a) Additional pay for extra duty service Yes No(b) Compensatory time for extra duty service Yes No(c) Bonuses for serving as a teacher mentor beyond any state funded program Yes No(d) Salary supplements for national board certified teachers beyond any state
funded program Yes No(e) Additional paid professional development days beyond the four days required Yes No
16. Does your district provide the following benefits to certified employees?
(a) Financial incentives to participate in deferred compensation or investment plans Yes No(b) Paid dental insurance or dental plan Yes No(c) Paid days for professional development Yes No(d) Additional paid life insurance Yes No(e) Other, specify:
Percent
Percent
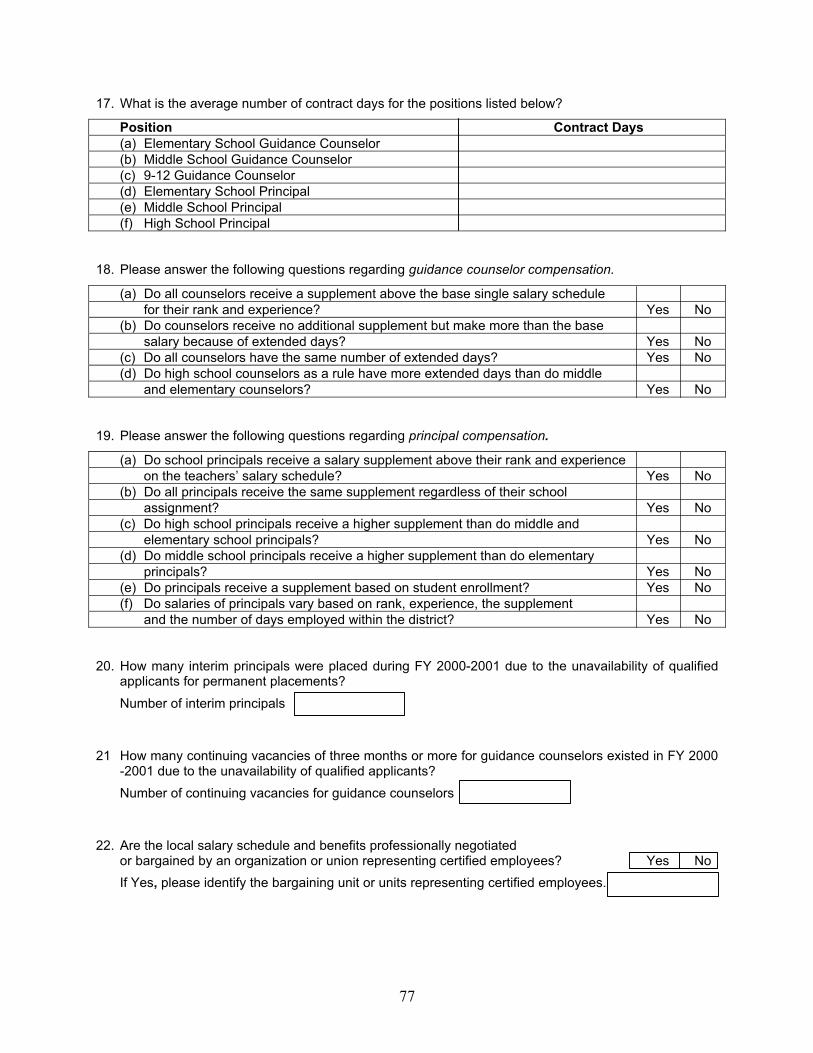
77
17. What is the average number of contract days for the positions listed below?
Position Contract Days(a) Elementary School Guidance Counselor(b) Middle School Guidance Counselor(c) 9-12 Guidance Counselor(d) Elementary School Principal(e) Middle School Principal(f) High School Principal
18. Please answer the following questions regarding guidance counselor compensation.
(a) Do all counselors receive a supplement above the base single salary schedulefor their rank and experience? Yes No
(b) Do counselors receive no additional supplement but make more than the basesalary because of extended days? Yes No
(c) Do all counselors have the same number of extended days? Yes No(d) Do high school counselors as a rule have more extended days than do middle
and elementary counselors? Yes No
19. Please answer the following questions regarding principal compensation.
(a) Do school principals receive a salary supplement above their rank and experienceon the teachers’ salary schedule? Yes No
(b) Do all principals receive the same supplement regardless of their schoolassignment? Yes No
(c) Do high school principals receive a higher supplement than do middle andelementary school principals? Yes No
(d) Do middle school principals receive a higher supplement than do elementaryprincipals? Yes No
(e) Do principals receive a supplement based on student enrollment? Yes No(f) Do salaries of principals vary based on rank, experience, the supplement
and the number of days employed within the district? Yes No
20. How many interim principals were placed during FY 2000-2001 due to the unavailability of qualifiedapplicants for permanent placements?
Number of interim principals
21 How many continuing vacancies of three months or more for guidance counselors existed in FY 2000-2001 due to the unavailability of qualified applicants?Number of continuing vacancies for guidance counselors
22. Are the local salary schedule and benefits professionally negotiatedor bargained by an organization or union representing certified employees? Yes NoIf Yes, please identify the bargaining unit or units representing certified employees.

78
23. What is the percent (%) of the 2000-2001 district budget allocated to salaries for the two categories ofpersonnel?
24. What is the percent (%) of the 2000-2001 district budget allocated for fringe benefits for employees in the district?
Percent
Percent

79
APPENDIX B
PERSONS TESTIFYING TO THEINTERIM JOINT COMMITTEE ON EDUCATION
Arizona Teacher Advancement ProgramMs. Micheline Bendotti, Executive Director
Milken FoundationDr. Lewis C. Solmon, Senior Vice President
Southern Regional Education BoardDr. Lynn Cornett, Executive Vice President
PERSONS TESTIFYING TO THESUBCOMMITTEE ON TEACHER COMPENSATION
Kentucky Association of School Administrators (KASA)Ms. Glenda Thornton, President
Kentucky Association of School Boards (KSBA)Mr. David Keller, Executive Director
Kentucky Board of Education (KBE)Ms. Helen Mountjoy, Chair
Kentucky Chamber of CommerceMr. Tony Sholar, Senior Vice President for Public Affairs
Kentucky Congress of Parents and Teachers Association (PTA)Ms. Sharon Barker, PresidentMs. Sharon Whitworth, Legislation Commissioner
Kentucky Department of Education (KDE)Mr. Gene Wilhoit, Commissioner
Kentucky Education Association (KEA)Ms. Judith Gambill, President
Kentucky Teachers’ Retirement System (KTRS)Mr. Gary L. Harbin, Executive SecretaryMr. Bill Leach, Bill Leach, Director of Member ServicesMr. Bo Barnes, General Counsel

80
Legislative Research CommissionDr. Barry Boardman, Staff Economist
Prichard Committee for Academic ExcellenceDr. Robert Sexton, Executive Director
Southern Regional Education Board (SREB)Dr. Lynn Cornett, Executive Vice President
PERSONS TESTIFYING TO THESUBCOMMITTEE ON COMPENSATION FOR CLASSIFIED PERSONNEL
Cabinet for Families and Children (CFC)Office of Family Resource and Youth Service CentersDr. Sandy Goodlett, Executive Director
Classified PersonnelMr. J. D. Johnson, Fayette CountyMs. Peggy Franklin, Jefferson County
Kentucky Association of School Administrators (KASA)Mr. Wayne Young, Executive Director
Kentucky Department of Education (KDE)Mr. Gene Wilhoit, CommissionerDr. Bill Insko, Director, Division of Assessment ImplementationMs. Kyna Koch, Associate Commissioner, District Support Services
Kentucky Education Support Professionals Association (KESPA)Ms. Nancy Toombs, PresidentMs. Betty Watson, Manager
Kentucky School Boards Association (KSBA)Ms. Libby Marshall, Legislative Liaison
Martin County Public SchoolsMr. William Slone, Superintendent
Office of Education Accountability (OEA)Dr. Ken Henry, Director
Office of Policy and Management (OPM)Dr. James Ramsey, State Budget DirectorMs. Beth Jurek, Deputy Director
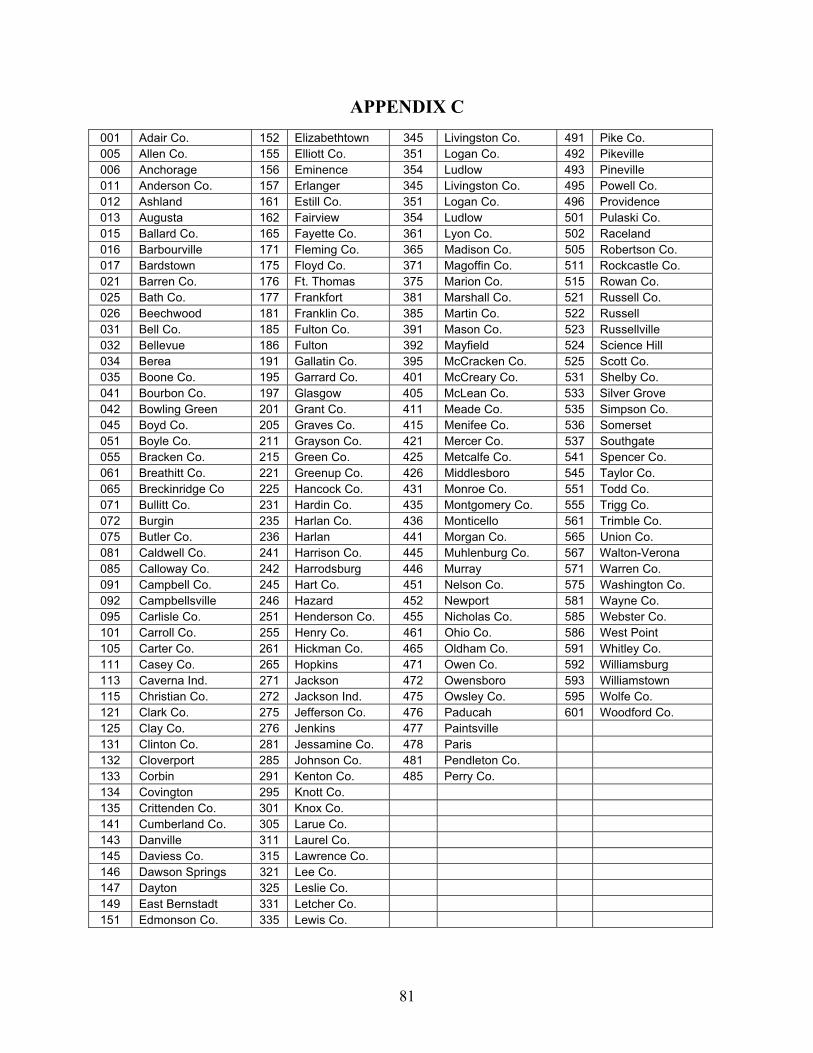
81
APPENDIX C001 Adair Co. 152 Elizabethtown 345 Livingston Co. 491 Pike Co.005 Allen Co. 155 Elliott Co. 351 Logan Co. 492 Pikeville006 Anchorage 156 Eminence 354 Ludlow 493 Pineville011 Anderson Co. 157 Erlanger 345 Livingston Co. 495 Powell Co.012 Ashland 161 Estill Co. 351 Logan Co. 496 Providence013 Augusta 162 Fairview 354 Ludlow 501 Pulaski Co.015 Ballard Co. 165 Fayette Co. 361 Lyon Co. 502 Raceland016 Barbourville 171 Fleming Co. 365 Madison Co. 505 Robertson Co.017 Bardstown 175 Floyd Co. 371 Magoffin Co. 511 Rockcastle Co.021 Barren Co. 176 Ft. Thomas 375 Marion Co. 515 Rowan Co.025 Bath Co. 177 Frankfort 381 Marshall Co. 521 Russell Co.026 Beechwood 181 Franklin Co. 385 Martin Co. 522 Russell031 Bell Co. 185 Fulton Co. 391 Mason Co. 523 Russellville032 Bellevue 186 Fulton 392 Mayfield 524 Science Hill034 Berea 191 Gallatin Co. 395 McCracken Co. 525 Scott Co.035 Boone Co. 195 Garrard Co. 401 McCreary Co. 531 Shelby Co.041 Bourbon Co. 197 Glasgow 405 McLean Co. 533 Silver Grove042 Bowling Green 201 Grant Co. 411 Meade Co. 535 Simpson Co.045 Boyd Co. 205 Graves Co. 415 Menifee Co. 536 Somerset051 Boyle Co. 211 Grayson Co. 421 Mercer Co. 537 Southgate055 Bracken Co. 215 Green Co. 425 Metcalfe Co. 541 Spencer Co.061 Breathitt Co. 221 Greenup Co. 426 Middlesboro 545 Taylor Co.065 Breckinridge Co 225 Hancock Co. 431 Monroe Co. 551 Todd Co.071 Bullitt Co. 231 Hardin Co. 435 Montgomery Co. 555 Trigg Co.072 Burgin 235 Harlan Co. 436 Monticello 561 Trimble Co.075 Butler Co. 236 Harlan 441 Morgan Co. 565 Union Co.081 Caldwell Co. 241 Harrison Co. 445 Muhlenburg Co. 567 Walton-Verona085 Calloway Co. 242 Harrodsburg 446 Murray 571 Warren Co.091 Campbell Co. 245 Hart Co. 451 Nelson Co. 575 Washington Co.092 Campbellsville 246 Hazard 452 Newport 581 Wayne Co.095 Carlisle Co. 251 Henderson Co. 455 Nicholas Co. 585 Webster Co.101 Carroll Co. 255 Henry Co. 461 Ohio Co. 586 West Point105 Carter Co. 261 Hickman Co. 465 Oldham Co. 591 Whitley Co.111 Casey Co. 265 Hopkins 471 Owen Co. 592 Williamsburg113 Caverna Ind. 271 Jackson 472 Owensboro 593 Williamstown115 Christian Co. 272 Jackson Ind. 475 Owsley Co. 595 Wolfe Co.121 Clark Co. 275 Jefferson Co. 476 Paducah 601 Woodford Co.125 Clay Co. 276 Jenkins 477 Paintsville131 Clinton Co. 281 Jessamine Co. 478 Paris132 Cloverport 285 Johnson Co. 481 Pendleton Co.133 Corbin 291 Kenton Co. 485 Perry Co.134 Covington 295 Knott Co.135 Crittenden Co. 301 Knox Co.141 Cumberland Co. 305 Larue Co.143 Danville 311 Laurel Co.145 Daviess Co. 315 Lawrence Co.146 Dawson Springs 321 Lee Co.147 Dayton 325 Leslie Co.149 East Bernstadt 331 Letcher Co.151 Edmonson Co. 335 Lewis Co.

82
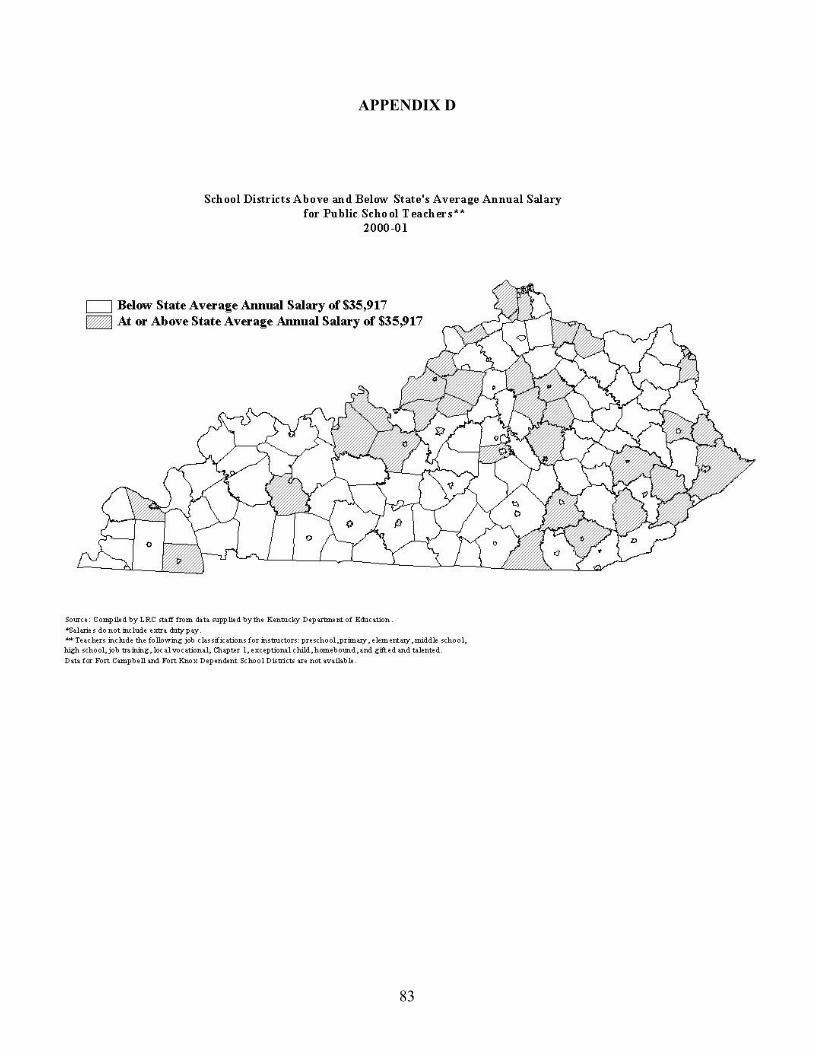
83
APPENDIX D

84

85
APPENDIX E

86
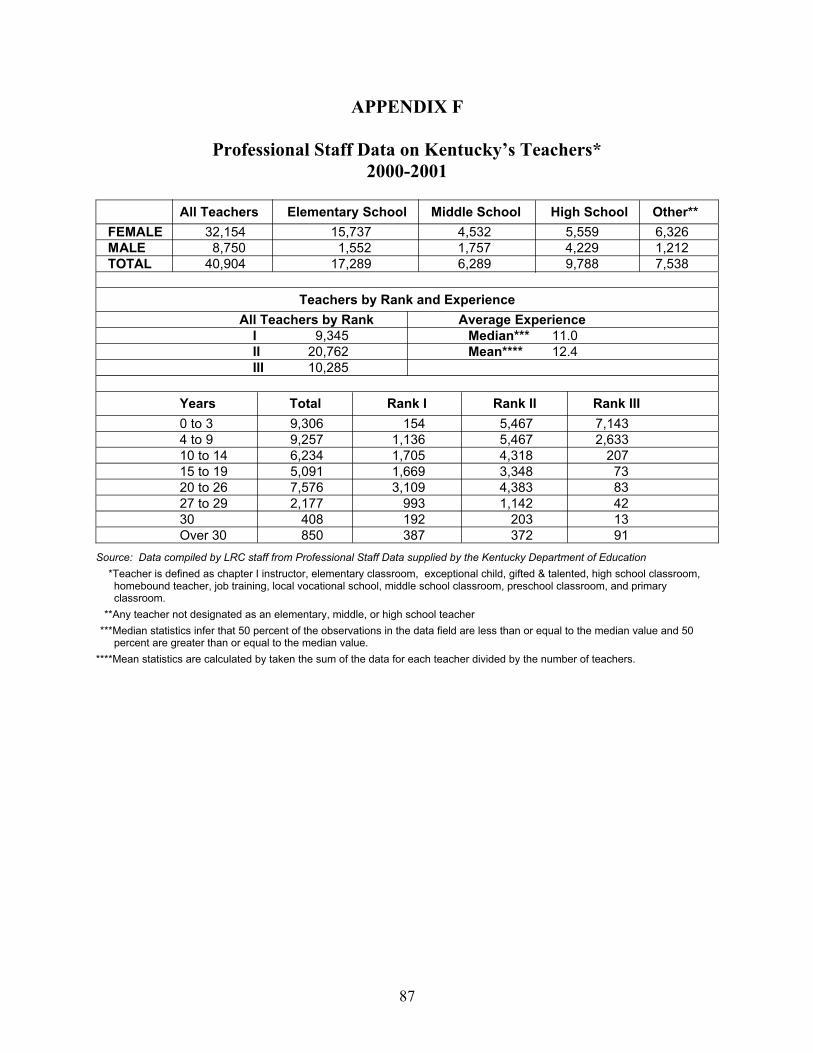
87
APPENDIX F
Professional Staff Data on Kentucky’s Teachers*2000-2001
All Teachers Elementary School Middle School High School Other**FEMALE 32,154 15,737 4,532 5,559 6,326MALE 8,750 1,552 1,757 4,229 1,212TOTAL 40,904 17,289 6,289 9,788 7,538
Teachers by Rank and ExperienceAll Teachers by Rank Average Experience
I 9,345 Median*** 11.0II 20,762 Mean**** 12.4III 10,285
Years Total Rank I Rank II Rank III0 to 3 9,306 154 5,467 7,1434 to 9 9,257 1,136 5,467 2,63310 to 14 6,234 1,705 4,318 20715 to 19 5,091 1,669 3,348 7320 to 26 7,576 3,109 4,383 8327 to 29 2,177 993 1,142 4230 408 192 203 13Over 30 850 387 372 91
Source: Data compiled by LRC staff from Professional Staff Data supplied by the Kentucky Department of Education****Teacher is defined as chapter I instructor, elementary classroom, exceptional child, gifted & talented, high school classroom,
homebound teacher, job training, local vocational school, middle school classroom, preschool classroom, and primaryclassroom.
****Any teacher not designated as an elementary, middle, or high school teacher****Median statistics infer that 50 percent of the observations in the data field are less than or equal to the median value and 50
percent are greater than or equal to the median value.****Mean statistics are calculated by taken the sum of the data for each teacher divided by the number of teachers.

88

89
APPENDIX G

90
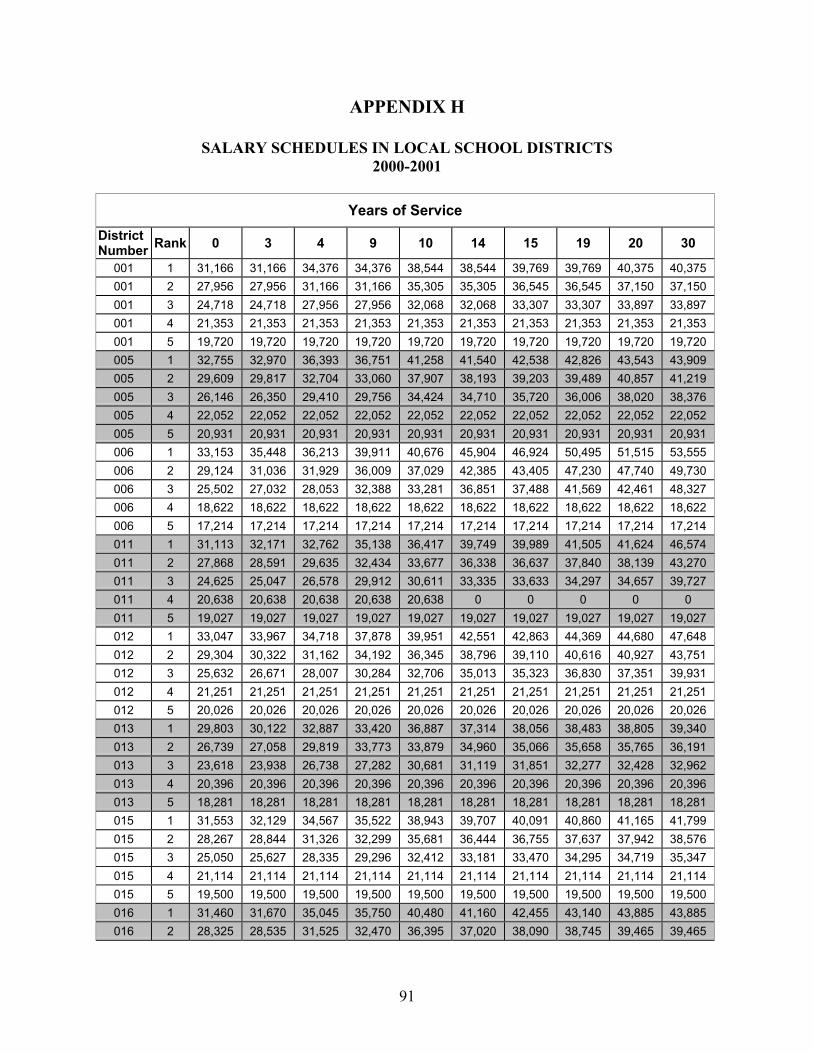
91
APPENDIX H
SALARY SCHEDULES IN LOCAL SCHOOL DISTRICTS2000-2001
Years of ServiceDistrictNumber Rank 0 3 4 9 10 14 15 19 20 30
001 1 31,166 31,166 34,376 34,376 38,544 38,544 39,769 39,769 40,375 40,375001 2 27,956 27,956 31,166 31,166 35,305 35,305 36,545 36,545 37,150 37,150001 3 24,718 24,718 27,956 27,956 32,068 32,068 33,307 33,307 33,897 33,897001 4 21,353 21,353 21,353 21,353 21,353 21,353 21,353 21,353 21,353 21,353001 5 19,720 19,720 19,720 19,720 19,720 19,720 19,720 19,720 19,720 19,720005 1 32,755 32,970 36,393 36,751 41,258 41,540 42,538 42,826 43,543 43,909005 2 29,609 29,817 32,704 33,060 37,907 38,193 39,203 39,489 40,857 41,219005 3 26,146 26,350 29,410 29,756 34,424 34,710 35,720 36,006 38,020 38,376005 4 22,052 22,052 22,052 22,052 22,052 22,052 22,052 22,052 22,052 22,052005 5 20,931 20,931 20,931 20,931 20,931 20,931 20,931 20,931 20,931 20,931006 1 33,153 35,448 36,213 39,911 40,676 45,904 46,924 50,495 51,515 53,555006 2 29,124 31,036 31,929 36,009 37,029 42,385 43,405 47,230 47,740 49,730006 3 25,502 27,032 28,053 32,388 33,281 36,851 37,488 41,569 42,461 48,327006 4 18,622 18,622 18,622 18,622 18,622 18,622 18,622 18,622 18,622 18,622006 5 17,214 17,214 17,214 17,214 17,214 17,214 17,214 17,214 17,214 17,214011 1 31,113 32,171 32,762 35,138 36,417 39,749 39,989 41,505 41,624 46,574011 2 27,868 28,591 29,635 32,434 33,677 36,338 36,637 37,840 38,139 43,270011 3 24,625 25,047 26,578 29,912 30,611 33,335 33,633 34,297 34,657 39,727011 4 20,638 20,638 20,638 20,638 20,638 0 0 0 0 0011 5 19,027 19,027 19,027 19,027 19,027 19,027 19,027 19,027 19,027 19,027012 1 33,047 33,967 34,718 37,878 39,951 42,551 42,863 44,369 44,680 47,648012 2 29,304 30,322 31,162 34,192 36,345 38,796 39,110 40,616 40,927 43,751012 3 25,632 26,671 28,007 30,284 32,706 35,013 35,323 36,830 37,351 39,931012 4 21,251 21,251 21,251 21,251 21,251 21,251 21,251 21,251 21,251 21,251012 5 20,026 20,026 20,026 20,026 20,026 20,026 20,026 20,026 20,026 20,026013 1 29,803 30,122 32,887 33,420 36,887 37,314 38,056 38,483 38,805 39,340013 2 26,739 27,058 29,819 33,773 33,879 34,960 35,066 35,658 35,765 36,191013 3 23,618 23,938 26,738 27,282 30,681 31,119 31,851 32,277 32,428 32,962013 4 20,396 20,396 20,396 20,396 20,396 20,396 20,396 20,396 20,396 20,396013 5 18,281 18,281 18,281 18,281 18,281 18,281 18,281 18,281 18,281 18,281015 1 31,553 32,129 34,567 35,522 38,943 39,707 40,091 40,860 41,165 41,799015 2 28,267 28,844 31,326 32,299 35,681 36,444 36,755 37,637 37,942 38,576015 3 25,050 25,627 28,335 29,296 32,412 33,181 33,470 34,295 34,719 35,347015 4 21,114 21,114 21,114 21,114 21,114 21,114 21,114 21,114 21,114 21,114015 5 19,500 19,500 19,500 19,500 19,500 19,500 19,500 19,500 19,500 19,500016 1 31,460 31,670 35,045 35,750 40,480 41,160 42,455 43,140 43,885 43,885016 2 28,325 28,535 31,525 32,470 36,395 37,020 38,090 38,745 39,465 39,465

92
Years of ServiceDistrictNumber Rank 0 3 4 9 10 14 15 19 20 30
016 3 25,035 25,255 28,540 29,170 33,145 33,750 34,695 35,330 36,015 36,015016 4 23,490 23,490 23,490 23,490 23,490 23,490 23,490 23,490 23,490 23,490016 5 20,380 20,380 20,380 20,380 20,380 20,380 20,380 20,380 20,380 20,380017 1 34,898 36,076 37,934 40,034 42,814 44,441 46,125 48,531 49,299 51,909017 2 31,348 32,604 34,474 36,575 39,334 40,913 42,569 44,302 44,905 47,335017 3 27,824 29,072 30,888 32,881 35,641 37,120 38,744 39,609 39,906 41,840017 4 17,528 17,528 17,528 17,528 17,528 17,528 17,528 17,528 17,528 17,528017 5 16,158 16,158 16,158 16,158 16,158 16,158 16,158 16,158 16,158 16,158021 1 32,361 32,579 35,914 36,284 40,894 41,188 42,800 43,097 43,723 44,167021 2 28,979 29,196 32,628 32,995 37,493 37,787 39,414 39,710 40,373 40,816021 3 25,784 25,997 29,311 29,679 34,120 34,412 36,113 36,411 36,863 37,306021 4 20,674 20,674 20,674 20,674 20,674 20,674 20,674 20,674 20,674 20,674021 5 19,058 19,058 19,058 19,058 19,058 19,058 19,058 19,058 19,058 19,058025 1 31,390 31,920 34,800 35,330 39,060 39,480 40,340 40,760 41,070 41,600025 2 28,200 28,520 31,390 32,140 35,760 36,190 36,920 37,450 37,780 38,310025 3 24,900 25,220 28,200 28,740 32,460 32,890 33,630 34,050 34,380 35,010025 4 19,060 19,060 19,060 19,060 19,060 19,060 19,060 19,060 19,060 19,060025 5 17,560 17,560 17,560 17,560 17,560 17,560 17,560 17,560 17,560 17,560026 1 32,610 33,869 34,288 36,385 36,805 38,483 38,902 40,580 40,999 49,287026 2 29,360 30,619 31,038 33,135 33,554 35,232 35,652 37,329 37,749 44,042026 3 26,004 27,263 27,682 39,779 30,199 31,876 32,296 33,974 34,393 39,847026 4 26,004 26,004 26,004 26,004 26,004 26,004 26,004 26,004 26,004 26,004026 5 18,963 18,963 18,963 18,963 18,963 18,963 18,963 18,963 18,963 18,963031 1 28,093 31,726 34,242 35,357 39,418 39,418 40,669 40,669 41,289 42,428031 2 25,750 28,597 31,188 32,526 36,104 36,104 37,373 37,373 37,991 39,130031 3 22,808 25,750 28,559 28,813 32,794 32,794 34,059 34,059 34,666 35,807031 4 17,528 17,528 17,528 17,528 17,528 17,528 17,528 17,528 17,528 17,528031 5 16,160 16,160 16,160 16,160 16,160 16,160 16,160 16,160 16,160 16,160032 1 30,918 31,822 34,240 35,753 37,350 39,015 40,089 42,024 43,743 47,452032 2 27,952 28,968 31,037 32,657 34,170 35,844 36,919 38,935 40,574 44,228032 3 25,125 26,088 27,944 29,560 31,099 32,781 33,856 35,790 37,564 41,057032 4 20,710 20,710 20,710 20,710 20,710 20,710 20,710 20,710 20,710 20,710032 5 17,301 17,301 17,301 17,301 17,301 17,301 17,301 17,301 17,301 17,301034 1 31,824 32,249 35,102 35,921 39,362 39,362 41,188 41,188 42,805 42,805034 2 28,666 29,032 31,871 32,487 36,117 36,117 37,917 37,917 39,433 39,433034 3 25,397 25,885 28,666 29,356 32,901 32,901 34,603 34,603 35,973 35,973034 4 22,018 22,018 22,018 22,018 22,018 22,018 22,018 22,018 22,018 22,018034 5 16,158 16,158 16,158 16,158 16,158 16,158 16,158 16,158 16,158 16,158035 1 31,614 33,796 34,523 38,158 38,886 41,794 42,521 45,430 46,157 51,247035 2 28,705 30,886 31,613 35,249 35,976 38,885 39,612 42,520 43,247 48,337035 3 25,797 27,979 28,706 32,341 33,069 35,977 36,704 39,613 40,340 45,430035 4 21,471 21,471 21,471 21,471 21,471 21,471 21,471 21,471 21,471 21,471035 5 18,330 18,330 18,330 18,330 18,330 18,330 18,330 18,330 18,330 18,330
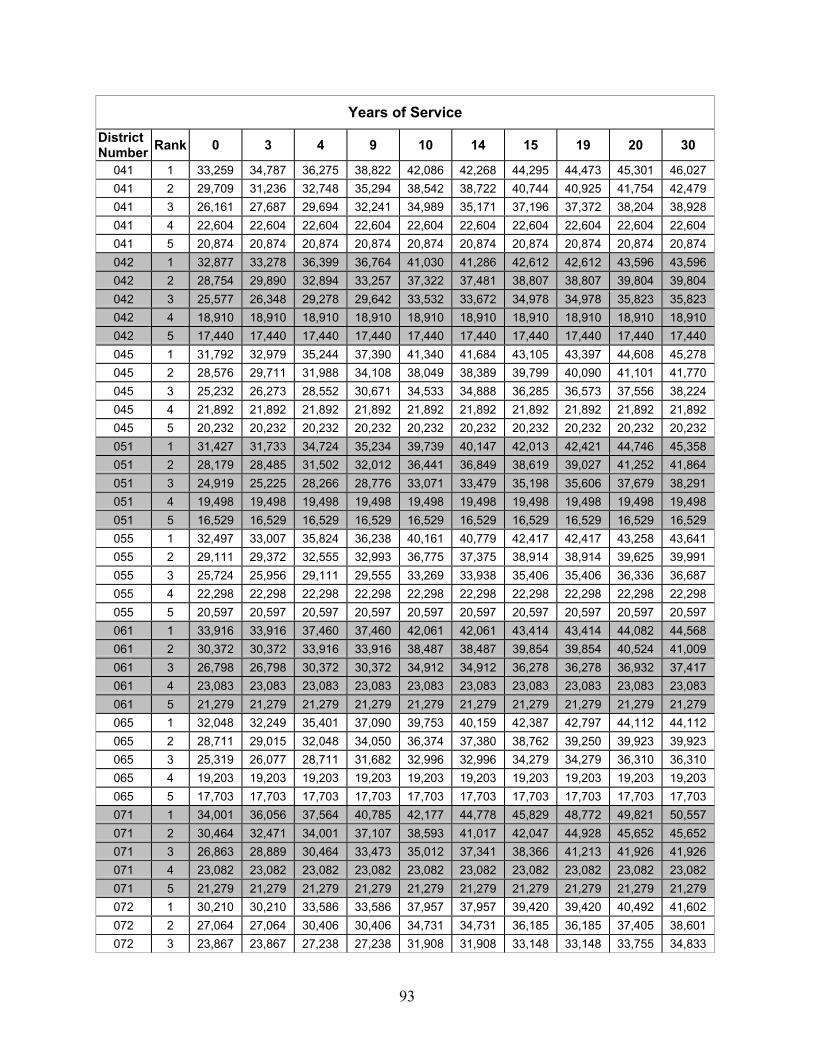
93
Years of ServiceDistrictNumber Rank 0 3 4 9 10 14 15 19 20 30
041 1 33,259 34,787 36,275 38,822 42,086 42,268 44,295 44,473 45,301 46,027041 2 29,709 31,236 32,748 35,294 38,542 38,722 40,744 40,925 41,754 42,479041 3 26,161 27,687 29,694 32,241 34,989 35,171 37,196 37,372 38,204 38,928041 4 22,604 22,604 22,604 22,604 22,604 22,604 22,604 22,604 22,604 22,604041 5 20,874 20,874 20,874 20,874 20,874 20,874 20,874 20,874 20,874 20,874042 1 32,877 33,278 36,399 36,764 41,030 41,286 42,612 42,612 43,596 43,596042 2 28,754 29,890 32,894 33,257 37,322 37,481 38,807 38,807 39,804 39,804042 3 25,577 26,348 29,278 29,642 33,532 33,672 34,978 34,978 35,823 35,823042 4 18,910 18,910 18,910 18,910 18,910 18,910 18,910 18,910 18,910 18,910042 5 17,440 17,440 17,440 17,440 17,440 17,440 17,440 17,440 17,440 17,440045 1 31,792 32,979 35,244 37,390 41,340 41,684 43,105 43,397 44,608 45,278045 2 28,576 29,711 31,988 34,108 38,049 38,389 39,799 40,090 41,101 41,770045 3 25,232 26,273 28,552 30,671 34,533 34,888 36,285 36,573 37,556 38,224045 4 21,892 21,892 21,892 21,892 21,892 21,892 21,892 21,892 21,892 21,892045 5 20,232 20,232 20,232 20,232 20,232 20,232 20,232 20,232 20,232 20,232051 1 31,427 31,733 34,724 35,234 39,739 40,147 42,013 42,421 44,746 45,358051 2 28,179 28,485 31,502 32,012 36,441 36,849 38,619 39,027 41,252 41,864051 3 24,919 25,225 28,266 28,776 33,071 33,479 35,198 35,606 37,679 38,291051 4 19,498 19,498 19,498 19,498 19,498 19,498 19,498 19,498 19,498 19,498051 5 16,529 16,529 16,529 16,529 16,529 16,529 16,529 16,529 16,529 16,529055 1 32,497 33,007 35,824 36,238 40,161 40,779 42,417 42,417 43,258 43,641055 2 29,111 29,372 32,555 32,993 36,775 37,375 38,914 38,914 39,625 39,991055 3 25,724 25,956 29,111 29,555 33,269 33,938 35,406 35,406 36,336 36,687055 4 22,298 22,298 22,298 22,298 22,298 22,298 22,298 22,298 22,298 22,298055 5 20,597 20,597 20,597 20,597 20,597 20,597 20,597 20,597 20,597 20,597061 1 33,916 33,916 37,460 37,460 42,061 42,061 43,414 43,414 44,082 44,568061 2 30,372 30,372 33,916 33,916 38,487 38,487 39,854 39,854 40,524 41,009061 3 26,798 26,798 30,372 30,372 34,912 34,912 36,278 36,278 36,932 37,417061 4 23,083 23,083 23,083 23,083 23,083 23,083 23,083 23,083 23,083 23,083061 5 21,279 21,279 21,279 21,279 21,279 21,279 21,279 21,279 21,279 21,279065 1 32,048 32,249 35,401 37,090 39,753 40,159 42,387 42,797 44,112 44,112065 2 28,711 29,015 32,048 34,050 36,374 37,380 38,762 39,250 39,923 39,923065 3 25,319 26,077 28,711 31,682 32,996 32,996 34,279 34,279 36,310 36,310065 4 19,203 19,203 19,203 19,203 19,203 19,203 19,203 19,203 19,203 19,203065 5 17,703 17,703 17,703 17,703 17,703 17,703 17,703 17,703 17,703 17,703071 1 34,001 36,056 37,564 40,785 42,177 44,778 45,829 48,772 49,821 50,557071 2 30,464 32,471 34,001 37,107 38,593 41,017 42,047 44,928 45,652 45,652071 3 26,863 28,889 30,464 33,473 35,012 37,341 38,366 41,213 41,926 41,926071 4 23,082 23,082 23,082 23,082 23,082 23,082 23,082 23,082 23,082 23,082071 5 21,279 21,279 21,279 21,279 21,279 21,279 21,279 21,279 21,279 21,279072 1 30,210 30,210 33,586 33,586 37,957 37,957 39,420 39,420 40,492 41,602072 2 27,064 27,064 30,406 30,406 34,731 34,731 36,185 36,185 37,405 38,601072 3 23,867 23,867 27,238 27,238 31,908 31,908 33,148 33,148 33,755 34,833
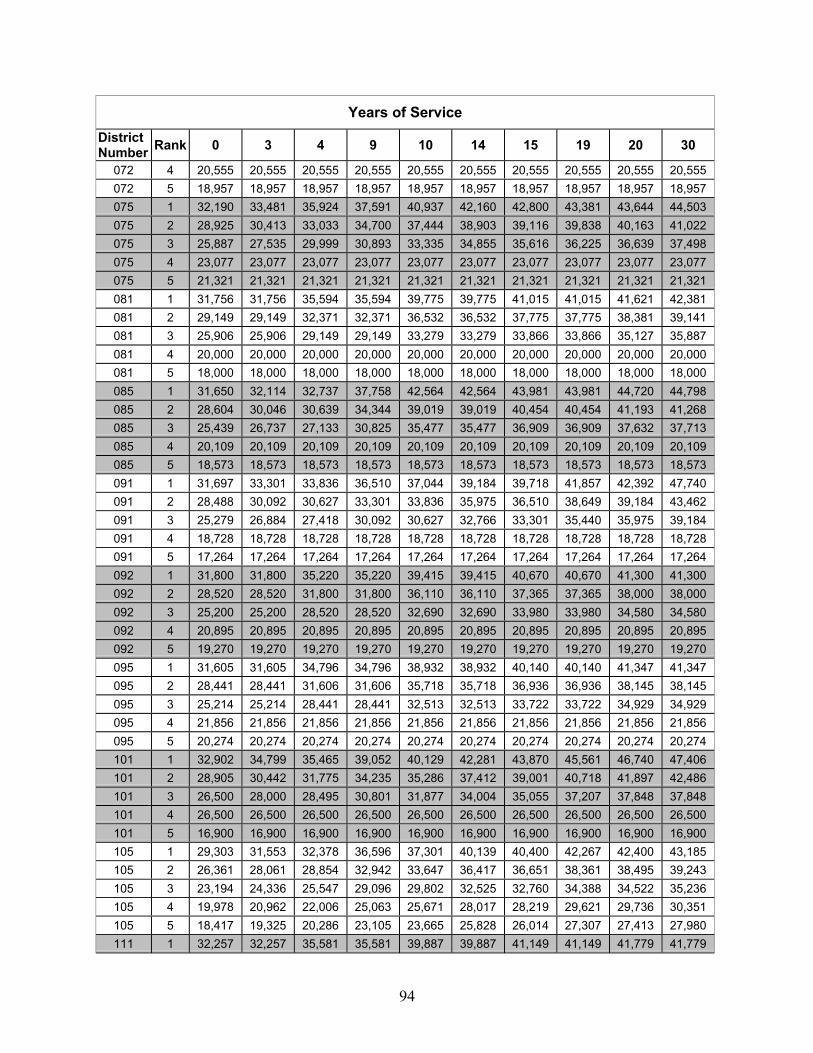
94
Years of ServiceDistrictNumber Rank 0 3 4 9 10 14 15 19 20 30
072 4 20,555 20,555 20,555 20,555 20,555 20,555 20,555 20,555 20,555 20,555072 5 18,957 18,957 18,957 18,957 18,957 18,957 18,957 18,957 18,957 18,957075 1 32,190 33,481 35,924 37,591 40,937 42,160 42,800 43,381 43,644 44,503075 2 28,925 30,413 33,033 34,700 37,444 38,903 39,116 39,838 40,163 41,022075 3 25,887 27,535 29,999 30,893 33,335 34,855 35,616 36,225 36,639 37,498075 4 23,077 23,077 23,077 23,077 23,077 23,077 23,077 23,077 23,077 23,077075 5 21,321 21,321 21,321 21,321 21,321 21,321 21,321 21,321 21,321 21,321081 1 31,756 31,756 35,594 35,594 39,775 39,775 41,015 41,015 41,621 42,381081 2 29,149 29,149 32,371 32,371 36,532 36,532 37,775 37,775 38,381 39,141081 3 25,906 25,906 29,149 29,149 33,279 33,279 33,866 33,866 35,127 35,887081 4 20,000 20,000 20,000 20,000 20,000 20,000 20,000 20,000 20,000 20,000081 5 18,000 18,000 18,000 18,000 18,000 18,000 18,000 18,000 18,000 18,000085 1 31,650 32,114 32,737 37,758 42,564 42,564 43,981 43,981 44,720 44,798085 2 28,604 30,046 30,639 34,344 39,019 39,019 40,454 40,454 41,193 41,268085 3 25,439 26,737 27,133 30,825 35,477 35,477 36,909 36,909 37,632 37,713085 4 20,109 20,109 20,109 20,109 20,109 20,109 20,109 20,109 20,109 20,109085 5 18,573 18,573 18,573 18,573 18,573 18,573 18,573 18,573 18,573 18,573091 1 31,697 33,301 33,836 36,510 37,044 39,184 39,718 41,857 42,392 47,740091 2 28,488 30,092 30,627 33,301 33,836 35,975 36,510 38,649 39,184 43,462091 3 25,279 26,884 27,418 30,092 30,627 32,766 33,301 35,440 35,975 39,184091 4 18,728 18,728 18,728 18,728 18,728 18,728 18,728 18,728 18,728 18,728091 5 17,264 17,264 17,264 17,264 17,264 17,264 17,264 17,264 17,264 17,264092 1 31,800 31,800 35,220 35,220 39,415 39,415 40,670 40,670 41,300 41,300092 2 28,520 28,520 31,800 31,800 36,110 36,110 37,365 37,365 38,000 38,000092 3 25,200 25,200 28,520 28,520 32,690 32,690 33,980 33,980 34,580 34,580092 4 20,895 20,895 20,895 20,895 20,895 20,895 20,895 20,895 20,895 20,895092 5 19,270 19,270 19,270 19,270 19,270 19,270 19,270 19,270 19,270 19,270095 1 31,605 31,605 34,796 34,796 38,932 38,932 40,140 40,140 41,347 41,347095 2 28,441 28,441 31,606 31,606 35,718 35,718 36,936 36,936 38,145 38,145095 3 25,214 25,214 28,441 28,441 32,513 32,513 33,722 33,722 34,929 34,929095 4 21,856 21,856 21,856 21,856 21,856 21,856 21,856 21,856 21,856 21,856095 5 20,274 20,274 20,274 20,274 20,274 20,274 20,274 20,274 20,274 20,274101 1 32,902 34,799 35,465 39,052 40,129 42,281 43,870 45,561 46,740 47,406101 2 28,905 30,442 31,775 34,235 35,286 37,412 39,001 40,718 41,897 42,486101 3 26,500 28,000 28,495 30,801 31,877 34,004 35,055 37,207 37,848 37,848101 4 26,500 26,500 26,500 26,500 26,500 26,500 26,500 26,500 26,500 26,500101 5 16,900 16,900 16,900 16,900 16,900 16,900 16,900 16,900 16,900 16,900105 1 29,303 31,553 32,378 36,596 37,301 40,139 40,400 42,267 42,400 43,185105 2 26,361 28,061 28,854 32,942 33,647 36,417 36,651 38,361 38,495 39,243105 3 23,194 24,336 25,547 29,096 29,802 32,525 32,760 34,388 34,522 35,236105 4 19,978 20,962 22,006 25,063 25,671 28,017 28,219 29,621 29,736 30,351105 5 18,417 19,325 20,286 23,105 23,665 25,828 26,014 27,307 27,413 27,980111 1 32,257 32,257 35,581 35,581 39,887 39,887 41,149 41,149 41,779 41,779
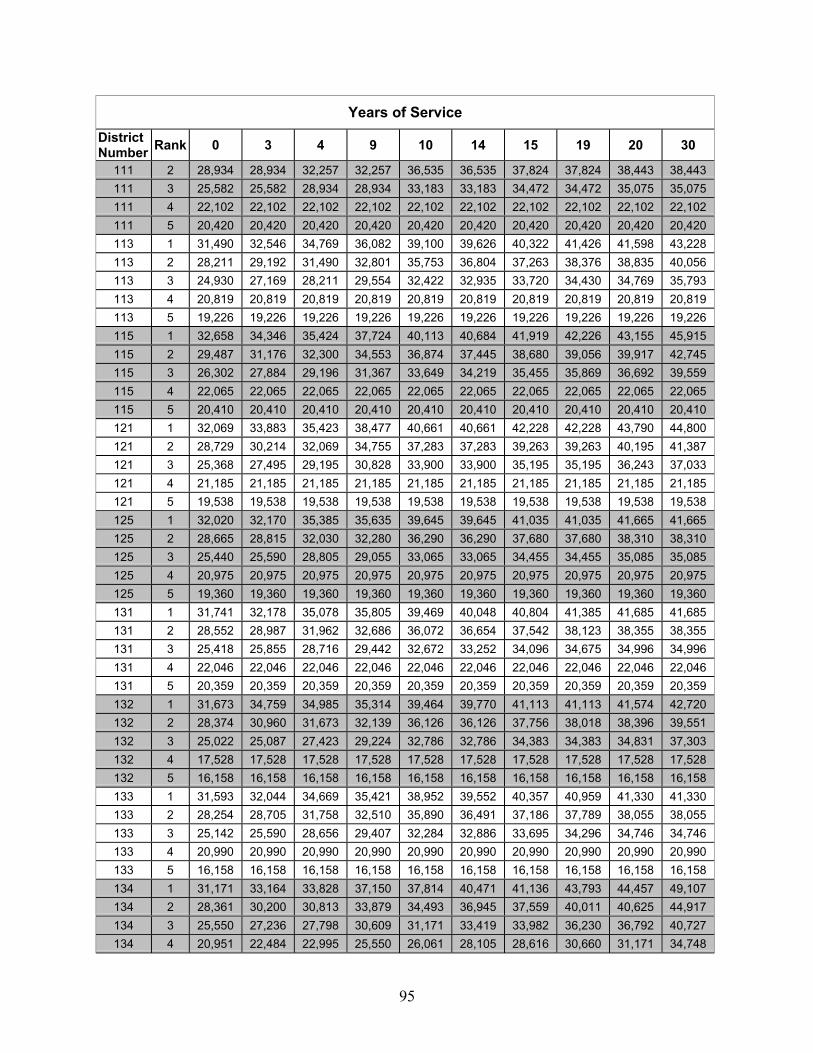
95
Years of ServiceDistrictNumber Rank 0 3 4 9 10 14 15 19 20 30
111 2 28,934 28,934 32,257 32,257 36,535 36,535 37,824 37,824 38,443 38,443111 3 25,582 25,582 28,934 28,934 33,183 33,183 34,472 34,472 35,075 35,075111 4 22,102 22,102 22,102 22,102 22,102 22,102 22,102 22,102 22,102 22,102111 5 20,420 20,420 20,420 20,420 20,420 20,420 20,420 20,420 20,420 20,420113 1 31,490 32,546 34,769 36,082 39,100 39,626 40,322 41,426 41,598 43,228113 2 28,211 29,192 31,490 32,801 35,753 36,804 37,263 38,376 38,835 40,056113 3 24,930 27,169 28,211 29,554 32,422 32,935 33,720 34,430 34,769 35,793113 4 20,819 20,819 20,819 20,819 20,819 20,819 20,819 20,819 20,819 20,819113 5 19,226 19,226 19,226 19,226 19,226 19,226 19,226 19,226 19,226 19,226115 1 32,658 34,346 35,424 37,724 40,113 40,684 41,919 42,226 43,155 45,915115 2 29,487 31,176 32,300 34,553 36,874 37,445 38,680 39,056 39,917 42,745115 3 26,302 27,884 29,196 31,367 33,649 34,219 35,455 35,869 36,692 39,559115 4 22,065 22,065 22,065 22,065 22,065 22,065 22,065 22,065 22,065 22,065115 5 20,410 20,410 20,410 20,410 20,410 20,410 20,410 20,410 20,410 20,410121 1 32,069 33,883 35,423 38,477 40,661 40,661 42,228 42,228 43,790 44,800121 2 28,729 30,214 32,069 34,755 37,283 37,283 39,263 39,263 40,195 41,387121 3 25,368 27,495 29,195 30,828 33,900 33,900 35,195 35,195 36,243 37,033121 4 21,185 21,185 21,185 21,185 21,185 21,185 21,185 21,185 21,185 21,185121 5 19,538 19,538 19,538 19,538 19,538 19,538 19,538 19,538 19,538 19,538125 1 32,020 32,170 35,385 35,635 39,645 39,645 41,035 41,035 41,665 41,665125 2 28,665 28,815 32,030 32,280 36,290 36,290 37,680 37,680 38,310 38,310125 3 25,440 25,590 28,805 29,055 33,065 33,065 34,455 34,455 35,085 35,085125 4 20,975 20,975 20,975 20,975 20,975 20,975 20,975 20,975 20,975 20,975125 5 19,360 19,360 19,360 19,360 19,360 19,360 19,360 19,360 19,360 19,360131 1 31,741 32,178 35,078 35,805 39,469 40,048 40,804 41,385 41,685 41,685131 2 28,552 28,987 31,962 32,686 36,072 36,654 37,542 38,123 38,355 38,355131 3 25,418 25,855 28,716 29,442 32,672 33,252 34,096 34,675 34,996 34,996131 4 22,046 22,046 22,046 22,046 22,046 22,046 22,046 22,046 22,046 22,046131 5 20,359 20,359 20,359 20,359 20,359 20,359 20,359 20,359 20,359 20,359132 1 31,673 34,759 34,985 35,314 39,464 39,770 41,113 41,113 41,574 42,720132 2 28,374 30,960 31,673 32,139 36,126 36,126 37,756 38,018 38,396 39,551132 3 25,022 25,087 27,423 29,224 32,786 32,786 34,383 34,383 34,831 37,303132 4 17,528 17,528 17,528 17,528 17,528 17,528 17,528 17,528 17,528 17,528132 5 16,158 16,158 16,158 16,158 16,158 16,158 16,158 16,158 16,158 16,158133 1 31,593 32,044 34,669 35,421 38,952 39,552 40,357 40,959 41,330 41,330133 2 28,254 28,705 31,758 32,510 35,890 36,491 37,186 37,789 38,055 38,055133 3 25,142 25,590 28,656 29,407 32,284 32,886 33,695 34,296 34,746 34,746133 4 20,990 20,990 20,990 20,990 20,990 20,990 20,990 20,990 20,990 20,990133 5 16,158 16,158 16,158 16,158 16,158 16,158 16,158 16,158 16,158 16,158134 1 31,171 33,164 33,828 37,150 37,814 40,471 41,136 43,793 44,457 49,107134 2 28,361 30,200 30,813 33,879 34,493 36,945 37,559 40,011 40,625 44,917134 3 25,550 27,236 27,798 30,609 31,171 33,419 33,982 36,230 36,792 40,727134 4 20,951 22,484 22,995 25,550 26,061 28,105 28,616 30,660 31,171 34,748

96
Years of ServiceDistrictNumber Rank 0 3 4 9 10 14 15 19 20 30
134 5 16,210 16,210 16,210 16,210 16,210 16,210 16,210 16,210 16,210 16,210135 1 32,445 32,754 35,741 36,256 39,861 40,273 41,303 41,715 41,818 41,818135 2 29,149 29,458 32,569 33,084 36,874 37,286 38,007 38,419 39,140 39,140135 3 25,956 26,265 29,252 29,767 33,393 33,805 34,649 35,061 35,329 35,329135 4 21,231 21,231 21,231 21,231 21,231 21,231 21,231 21,231 21,231 21,231135 5 19,577 19,577 19,577 19,577 19,577 19,577 19,577 19,577 19,577 19,577141 1 32,219 32,219 35,539 35,539 39,851 39,851 41,110 41,110 41,745 41,745141 2 28,909 28,909 32,219 32,219 36,503 36,503 37,774 37,774 38,411 38,411141 3 25,547 25,547 28,909 28,909 33,158 33,158 34,427 34,427 35,048 35,048141 4 22,068 22,068 22,068 22,068 22,068 22,068 22,068 22,068 22,068 22,068141 5 20,387 20,387 20,387 20,387 20,387 20,387 20,387 20,387 20,387 20,387143 1 29,830 30,814 32,715 34,683 36,455 37,766 39,023 40,662 42,302 43,286143 2 26,944 27,928 29,830 31,798 33,569 34,880 36,137 37,777 39,416 40,400143 3 24,059 25,043 26,944 28,912 30,683 31,995 33,251 34,891 36,531 37,515143 4 20,133 20,133 20,133 20,133 20,133 20,133 20,133 20,133 20,133 20,133143 5 18,670 18,670 18,670 18,670 18,670 18,670 18,670 18,670 18,670 18,670145 1 30,807 31,946 32,717 36,070 37,031 40,435 42,781 45,087 46,008 46,238145 2 27,610 28,502 29,583 32,625 33,631 37,151 39,204 41,292 42,011 42,240145 3 24,821 25,713 26,586 29,825 30,624 33,177 34,052 35,639 36,220 36,450145 4 20,266 20,266 20,266 20,266 20,266 20,266 20,266 20,266 20,266 20,266145 5 18,690 18,690 18,690 18,690 18,690 18,690 18,690 18,690 18,690 18,690146 1 30,506 30,982 33,618 34,584 38,125 38,904 39,774 40,888 41,952 44,050146 2 27,347 27,824 30,560 31,492 35,000 35,758 36,652 37,625 38,736 40,696146 3 24,455 24,879 27,744 28,966 31,766 32,501 33,326 34,299 35,310 37,318146 4 19,234 19,234 19,234 19,234 19,234 19,234 19,234 19,234 19,234 19,234146 5 17,731 17,731 17,731 17,731 17,731 17,731 17,731 17,731 17,731 17,731147 1 33,012 34,814 37,619 38,858 43,700 45,693 46,360 47,866 48,420 51,065147 2 30,748 31,424 34,149 35,275 40,062 41,975 42,608 43,981 44,490 46,958147 3 27,141 27,763 30,624 31,750 36,379 38,232 38,835 40,123 40,592 43,121147 4 21,851 21,851 21,851 21,851 21,851 21,851 21,851 21,851 21,851 21,851147 5 20,162 20,162 20,162 20,162 20,162 20,162 20,162 20,162 20,162 20,162149 1 33,690 33,690 37,161 37,161 41,665 41,665 42,992 42,992 43,645 44,711149 2 30,219 30,219 33,690 33,690 38,164 38,164 39,506 39,506 40,161 41,139149 3 26,718 26,718 30,219 30,219 34,662 34,662 35,754 35,754 36,644 37,538149 4 23,082 23,082 23,082 23,082 23,082 23,082 23,082 23,082 23,082 23,082149 5 21,316 21,316 21,316 21,316 21,316 21,316 21,316 21,316 21,316 21,316151 1 32,045 32,469 35,059 35,798 39,305 39,899 40,695 41,317 41,968 41,968151 2 28,709 29,275 31,822 32,525 36,130 36,738 37,329 37,934 38,655 38,655151 3 25,504 26,644 28,726 29,548 32,720 33,280 34,099 34,663 35,187 35,187151 4 22,403 22,403 22,403 22,403 22,403 22,403 22,403 22,403 22,403 22,403151 5 20,766 20,766 20,766 20,766 20,766 20,766 20,766 20,766 20,766 20,766152 1 30,866 32,331 34,077 36,517 38,719 40,675 41,737 43,686 44,706 46,543152 2 27,916 29,376 30,973 33,958 35,512 37,463 38,545 40,494 41,387 42,800
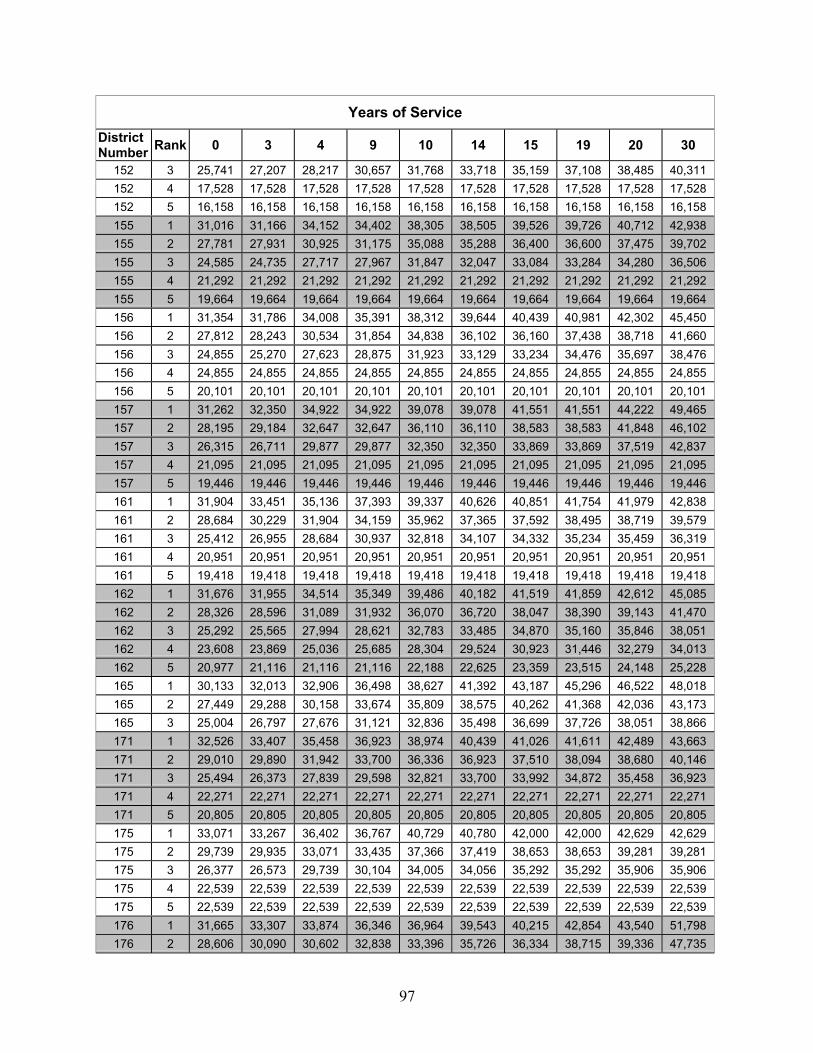
97
Years of ServiceDistrictNumber Rank 0 3 4 9 10 14 15 19 20 30
152 3 25,741 27,207 28,217 30,657 31,768 33,718 35,159 37,108 38,485 40,311152 4 17,528 17,528 17,528 17,528 17,528 17,528 17,528 17,528 17,528 17,528152 5 16,158 16,158 16,158 16,158 16,158 16,158 16,158 16,158 16,158 16,158155 1 31,016 31,166 34,152 34,402 38,305 38,505 39,526 39,726 40,712 42,938155 2 27,781 27,931 30,925 31,175 35,088 35,288 36,400 36,600 37,475 39,702155 3 24,585 24,735 27,717 27,967 31,847 32,047 33,084 33,284 34,280 36,506155 4 21,292 21,292 21,292 21,292 21,292 21,292 21,292 21,292 21,292 21,292155 5 19,664 19,664 19,664 19,664 19,664 19,664 19,664 19,664 19,664 19,664156 1 31,354 31,786 34,008 35,391 38,312 39,644 40,439 40,981 42,302 45,450156 2 27,812 28,243 30,534 31,854 34,838 36,102 36,160 37,438 38,718 41,660156 3 24,855 25,270 27,623 28,875 31,923 33,129 33,234 34,476 35,697 38,476156 4 24,855 24,855 24,855 24,855 24,855 24,855 24,855 24,855 24,855 24,855156 5 20,101 20,101 20,101 20,101 20,101 20,101 20,101 20,101 20,101 20,101157 1 31,262 32,350 34,922 34,922 39,078 39,078 41,551 41,551 44,222 49,465157 2 28,195 29,184 32,647 32,647 36,110 36,110 38,583 38,583 41,848 46,102157 3 26,315 26,711 29,877 29,877 32,350 32,350 33,869 33,869 37,519 42,837157 4 21,095 21,095 21,095 21,095 21,095 21,095 21,095 21,095 21,095 21,095157 5 19,446 19,446 19,446 19,446 19,446 19,446 19,446 19,446 19,446 19,446161 1 31,904 33,451 35,136 37,393 39,337 40,626 40,851 41,754 41,979 42,838161 2 28,684 30,229 31,904 34,159 35,962 37,365 37,592 38,495 38,719 39,579161 3 25,412 26,955 28,684 30,937 32,818 34,107 34,332 35,234 35,459 36,319161 4 20,951 20,951 20,951 20,951 20,951 20,951 20,951 20,951 20,951 20,951161 5 19,418 19,418 19,418 19,418 19,418 19,418 19,418 19,418 19,418 19,418162 1 31,676 31,955 34,514 35,349 39,486 40,182 41,519 41,859 42,612 45,085162 2 28,326 28,596 31,089 31,932 36,070 36,720 38,047 38,390 39,143 41,470162 3 25,292 25,565 27,994 28,621 32,783 33,485 34,870 35,160 35,846 38,051162 4 23,608 23,869 25,036 25,685 28,304 29,524 30,923 31,446 32,279 34,013162 5 20,977 21,116 21,116 21,116 22,188 22,625 23,359 23,515 24,148 25,228165 1 30,133 32,013 32,906 36,498 38,627 41,392 43,187 45,296 46,522 48,018165 2 27,449 29,288 30,158 33,674 35,809 38,575 40,262 41,368 42,036 43,173165 3 25,004 26,797 27,676 31,121 32,836 35,498 36,699 37,726 38,051 38,866171 1 32,526 33,407 35,458 36,923 38,974 40,439 41,026 41,611 42,489 43,663171 2 29,010 29,890 31,942 33,700 36,336 36,923 37,510 38,094 38,680 40,146171 3 25,494 26,373 27,839 29,598 32,821 33,700 33,992 34,872 35,458 36,923171 4 22,271 22,271 22,271 22,271 22,271 22,271 22,271 22,271 22,271 22,271171 5 20,805 20,805 20,805 20,805 20,805 20,805 20,805 20,805 20,805 20,805175 1 33,071 33,267 36,402 36,767 40,729 40,780 42,000 42,000 42,629 42,629175 2 29,739 29,935 33,071 33,435 37,366 37,419 38,653 38,653 39,281 39,281175 3 26,377 26,573 29,739 30,104 34,005 34,056 35,292 35,292 35,906 35,906175 4 22,539 22,539 22,539 22,539 22,539 22,539 22,539 22,539 22,539 22,539175 5 22,539 22,539 22,539 22,539 22,539 22,539 22,539 22,539 22,539 22,539176 1 31,665 33,307 33,874 36,346 36,964 39,543 40,215 42,854 43,540 51,798176 2 28,606 30,090 30,602 32,838 33,396 35,726 36,334 38,715 39,336 47,735
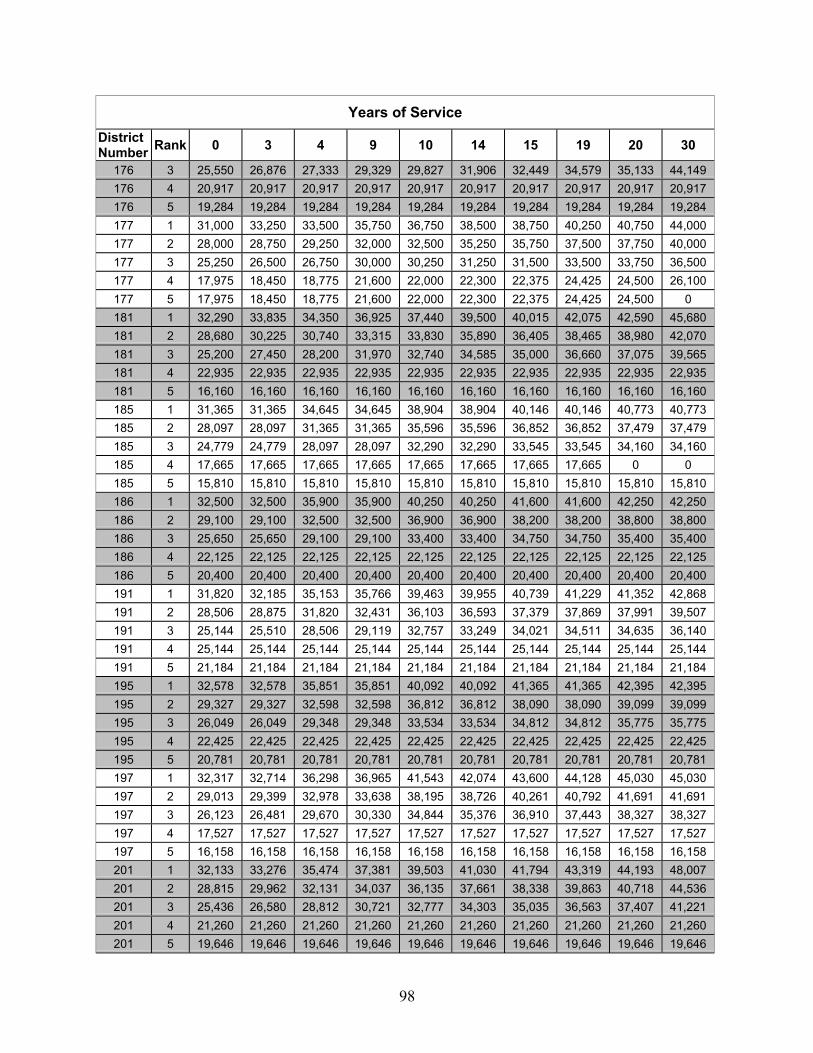
98
Years of ServiceDistrictNumber Rank 0 3 4 9 10 14 15 19 20 30
176 3 25,550 26,876 27,333 29,329 29,827 31,906 32,449 34,579 35,133 44,149176 4 20,917 20,917 20,917 20,917 20,917 20,917 20,917 20,917 20,917 20,917176 5 19,284 19,284 19,284 19,284 19,284 19,284 19,284 19,284 19,284 19,284177 1 31,000 33,250 33,500 35,750 36,750 38,500 38,750 40,250 40,750 44,000177 2 28,000 28,750 29,250 32,000 32,500 35,250 35,750 37,500 37,750 40,000177 3 25,250 26,500 26,750 30,000 30,250 31,250 31,500 33,500 33,750 36,500177 4 17,975 18,450 18,775 21,600 22,000 22,300 22,375 24,425 24,500 26,100177 5 17,975 18,450 18,775 21,600 22,000 22,300 22,375 24,425 24,500 0181 1 32,290 33,835 34,350 36,925 37,440 39,500 40,015 42,075 42,590 45,680181 2 28,680 30,225 30,740 33,315 33,830 35,890 36,405 38,465 38,980 42,070181 3 25,200 27,450 28,200 31,970 32,740 34,585 35,000 36,660 37,075 39,565181 4 22,935 22,935 22,935 22,935 22,935 22,935 22,935 22,935 22,935 22,935181 5 16,160 16,160 16,160 16,160 16,160 16,160 16,160 16,160 16,160 16,160185 1 31,365 31,365 34,645 34,645 38,904 38,904 40,146 40,146 40,773 40,773185 2 28,097 28,097 31,365 31,365 35,596 35,596 36,852 36,852 37,479 37,479185 3 24,779 24,779 28,097 28,097 32,290 32,290 33,545 33,545 34,160 34,160185 4 17,665 17,665 17,665 17,665 17,665 17,665 17,665 17,665 0 0185 5 15,810 15,810 15,810 15,810 15,810 15,810 15,810 15,810 15,810 15,810186 1 32,500 32,500 35,900 35,900 40,250 40,250 41,600 41,600 42,250 42,250186 2 29,100 29,100 32,500 32,500 36,900 36,900 38,200 38,200 38,800 38,800186 3 25,650 25,650 29,100 29,100 33,400 33,400 34,750 34,750 35,400 35,400186 4 22,125 22,125 22,125 22,125 22,125 22,125 22,125 22,125 22,125 22,125186 5 20,400 20,400 20,400 20,400 20,400 20,400 20,400 20,400 20,400 20,400191 1 31,820 32,185 35,153 35,766 39,463 39,955 40,739 41,229 41,352 42,868191 2 28,506 28,875 31,820 32,431 36,103 36,593 37,379 37,869 37,991 39,507191 3 25,144 25,510 28,506 29,119 32,757 33,249 34,021 34,511 34,635 36,140191 4 25,144 25,144 25,144 25,144 25,144 25,144 25,144 25,144 25,144 25,144191 5 21,184 21,184 21,184 21,184 21,184 21,184 21,184 21,184 21,184 21,184195 1 32,578 32,578 35,851 35,851 40,092 40,092 41,365 41,365 42,395 42,395195 2 29,327 29,327 32,598 32,598 36,812 36,812 38,090 38,090 39,099 39,099195 3 26,049 26,049 29,348 29,348 33,534 33,534 34,812 34,812 35,775 35,775195 4 22,425 22,425 22,425 22,425 22,425 22,425 22,425 22,425 22,425 22,425195 5 20,781 20,781 20,781 20,781 20,781 20,781 20,781 20,781 20,781 20,781197 1 32,317 32,714 36,298 36,965 41,543 42,074 43,600 44,128 45,030 45,030197 2 29,013 29,399 32,978 33,638 38,195 38,726 40,261 40,792 41,691 41,691197 3 26,123 26,481 29,670 30,330 34,844 35,376 36,910 37,443 38,327 38,327197 4 17,527 17,527 17,527 17,527 17,527 17,527 17,527 17,527 17,527 17,527197 5 16,158 16,158 16,158 16,158 16,158 16,158 16,158 16,158 16,158 16,158201 1 32,133 33,276 35,474 37,381 39,503 41,030 41,794 43,319 44,193 48,007201 2 28,815 29,962 32,131 34,037 36,135 37,661 38,338 39,863 40,718 44,536201 3 25,436 26,580 28,812 30,721 32,777 34,303 35,035 36,563 37,407 41,221201 4 21,260 21,260 21,260 21,260 21,260 21,260 21,260 21,260 21,260 21,260201 5 19,646 19,646 19,646 19,646 19,646 19,646 19,646 19,646 19,646 19,646

99
Years of ServiceDistrictNumber Rank 0 3 4 9 10 14 15 19 20 30
205 1 32,566 32,566 35,888 35,888 40,238 40,238 41,517 41,517 42,710 43,615205 2 29,357 29,357 32,566 32,566 36,858 36,858 38,152 38,152 39,288 40,250205 3 26,186 26,186 29,357 29,357 33,481 33,481 34,770 34,770 35,893 36,842205 4 22,890 22,890 22,890 22,890 22,890 22,890 22,890 22,890 22,890 22,890205 5 21,293 21,293 21,293 21,293 21,293 21,293 21,293 21,293 21,293 21,293211 1 31,771 32,605 35,187 36,577 39,595 40,707 40,985 42,096 42,374 43,764211 2 28,461 29,295 31,833 33,223 36,215 37,327 37,605 38,716 38,994 40,384211 3 25,098 25,932 28,758 30,147 33,099 34,211 34,489 35,601 35,879 37,268211 4 18,531 18,531 18,531 18,531 18,531 18,531 18,531 18,531 18,531 18,531211 5 17,115 17,115 17,115 17,115 17,115 17,115 17,115 17,115 17,115 17,115215 1 30,908 30,908 34,094 34,094 38,231 38,231 39,438 39,438 40,048 40,048215 2 27,735 27,735 30,908 30,908 35,023 35,023 36,240 36,240 36,851 36,851215 3 24,510 24,510 27,735 27,735 31,809 31,809 33,027 33,027 33,625 33,625215 4 18,838 18,838 18,838 18,838 18,838 18,838 18,838 18,838 18,838 18,838215 5 17,366 17,366 17,366 17,366 17,366 17,366 17,366 17,366 17,366 17,366221 1 30,953 32,404 33,324 35,796 38,466 39,789 40,120 41,441 41,771 45,627221 2 28,098 29,548 30,469 33,102 35,512 36,834 37,165 38,487 38,818 42,674221 3 25,242 26,693 27,861 30,279 32,601 33,884 34,212 35,533 35,864 39,720221 4 20,335 20,335 20,335 20,335 20,335 20,335 20,335 20,335 20,335 20,335221 5 20,300 20,300 20,300 20,300 20,300 20,300 20,300 20,300 20,300 20,300225 1 31,518 32,077 35,077 36,341 40,511 41,521 42,950 44,126 44,391 45,770225 2 28,163 28,704 31,691 32,958 37,129 38,144 39,572 40,745 41,010 42,356225 3 24,764 25,234 27,987 29,000 33,048 33,860 35,263 36,076 36,276 36,276225 4 17,665 17,665 17,665 17,665 17,665 17,665 17,665 17,665 17,665 17,665225 5 16,284 16,284 16,284 16,284 16,284 16,284 16,284 16,284 16,284 16,284231 1 31,781 33,726 34,401 37,982 38,742 41,935 42,774 46,300 47,226 50,117231 2 28,892 30,660 31,273 34,528 35,219 38,121 38,883 42,088 42,930 45,558231 3 26,265 27,873 28,430 31,389 32,017 34,656 35,349 38,263 39,028 41,417231 4 21,111 21,111 21,111 21,111 21,111 21,111 21,111 21,111 21,111 21,111231 5 19,540 19,540 19,540 19,540 19,540 19,540 19,540 19,540 19,540 19,540235 1 31,642 32,280 34,603 35,672 38,994 40,638 41,301 42,152 44,098 44,098235 2 28,334 29,409 31,183 32,457 35,785 36,638 38,045 38,900 40,820 40,820235 3 25,170 25,819 28,206 29,850 32,467 33,315 35,022 35,915 37,671 37,671235 4 21,389 21,389 21,389 21,389 21,389 21,389 21,389 21,389 21,389 21,389235 5 20,123 20,123 20,123 20,123 20,123 20,123 20,123 20,123 20,123 20,123236 1 31,193 31,526 34,407 35,017 38,730 39,227 40,280 40,779 41,996 42,939236 2 27,703 28,036 30,915 31,470 35,183 35,626 36,568 37,066 38,229 39,171236 3 24,379 24,766 27,536 28,145 31,693 32,135 33,077 33,576 34,685 35,626236 4 20,833 21,221 23,991 24,600 28,145 28,589 29,531 30,030 31,138 32,080236 5 19,225 19,613 22,384 22,994 26,539 26,983 27,925 28,423 29,531 30,473241 1 31,572 32,910 34,874 35,825 39,196 39,848 40,411 41,332 41,719 42,451241 2 28,384 28,931 31,572 33,121 36,131 36,600 37,097 38,138 38,403 39,076241 3 24,936 26,434 28,283 30,414 32,508 33,326 33,768 34,564 35,060 35,675
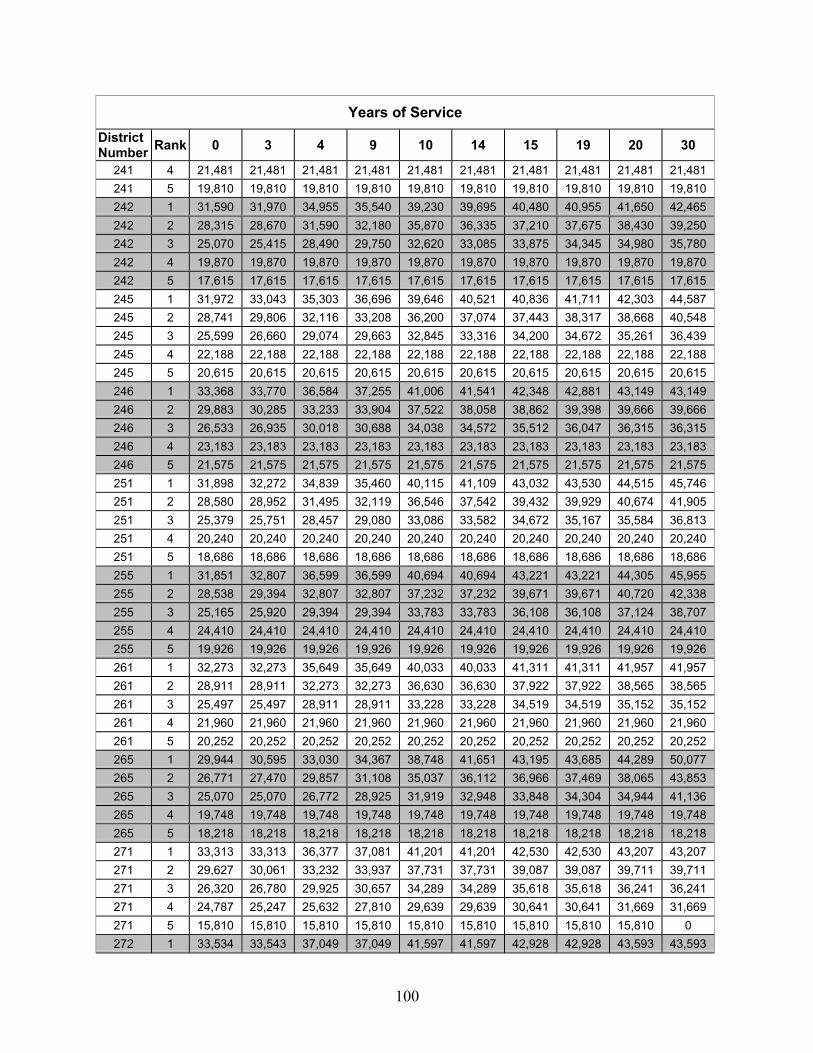
100
Years of ServiceDistrictNumber Rank 0 3 4 9 10 14 15 19 20 30
241 4 21,481 21,481 21,481 21,481 21,481 21,481 21,481 21,481 21,481 21,481241 5 19,810 19,810 19,810 19,810 19,810 19,810 19,810 19,810 19,810 19,810242 1 31,590 31,970 34,955 35,540 39,230 39,695 40,480 40,955 41,650 42,465242 2 28,315 28,670 31,590 32,180 35,870 36,335 37,210 37,675 38,430 39,250242 3 25,070 25,415 28,490 29,750 32,620 33,085 33,875 34,345 34,980 35,780242 4 19,870 19,870 19,870 19,870 19,870 19,870 19,870 19,870 19,870 19,870242 5 17,615 17,615 17,615 17,615 17,615 17,615 17,615 17,615 17,615 17,615245 1 31,972 33,043 35,303 36,696 39,646 40,521 40,836 41,711 42,303 44,587245 2 28,741 29,806 32,116 33,208 36,200 37,074 37,443 38,317 38,668 40,548245 3 25,599 26,660 29,074 29,663 32,845 33,316 34,200 34,672 35,261 36,439245 4 22,188 22,188 22,188 22,188 22,188 22,188 22,188 22,188 22,188 22,188245 5 20,615 20,615 20,615 20,615 20,615 20,615 20,615 20,615 20,615 20,615246 1 33,368 33,770 36,584 37,255 41,006 41,541 42,348 42,881 43,149 43,149246 2 29,883 30,285 33,233 33,904 37,522 38,058 38,862 39,398 39,666 39,666246 3 26,533 26,935 30,018 30,688 34,038 34,572 35,512 36,047 36,315 36,315246 4 23,183 23,183 23,183 23,183 23,183 23,183 23,183 23,183 23,183 23,183246 5 21,575 21,575 21,575 21,575 21,575 21,575 21,575 21,575 21,575 21,575251 1 31,898 32,272 34,839 35,460 40,115 41,109 43,032 43,530 44,515 45,746251 2 28,580 28,952 31,495 32,119 36,546 37,542 39,432 39,929 40,674 41,905251 3 25,379 25,751 28,457 29,080 33,086 33,582 34,672 35,167 35,584 36,813251 4 20,240 20,240 20,240 20,240 20,240 20,240 20,240 20,240 20,240 20,240251 5 18,686 18,686 18,686 18,686 18,686 18,686 18,686 18,686 18,686 18,686255 1 31,851 32,807 36,599 36,599 40,694 40,694 43,221 43,221 44,305 45,955255 2 28,538 29,394 32,807 32,807 37,232 37,232 39,671 39,671 40,720 42,338255 3 25,165 25,920 29,394 29,394 33,783 33,783 36,108 36,108 37,124 38,707255 4 24,410 24,410 24,410 24,410 24,410 24,410 24,410 24,410 24,410 24,410255 5 19,926 19,926 19,926 19,926 19,926 19,926 19,926 19,926 19,926 19,926261 1 32,273 32,273 35,649 35,649 40,033 40,033 41,311 41,311 41,957 41,957261 2 28,911 28,911 32,273 32,273 36,630 36,630 37,922 37,922 38,565 38,565261 3 25,497 25,497 28,911 28,911 33,228 33,228 34,519 34,519 35,152 35,152261 4 21,960 21,960 21,960 21,960 21,960 21,960 21,960 21,960 21,960 21,960261 5 20,252 20,252 20,252 20,252 20,252 20,252 20,252 20,252 20,252 20,252265 1 29,944 30,595 33,030 34,367 38,748 41,651 43,195 43,685 44,289 50,077265 2 26,771 27,470 29,857 31,108 35,037 36,112 36,966 37,469 38,065 43,853265 3 25,070 25,070 26,772 28,925 31,919 32,948 33,848 34,304 34,944 41,136265 4 19,748 19,748 19,748 19,748 19,748 19,748 19,748 19,748 19,748 19,748265 5 18,218 18,218 18,218 18,218 18,218 18,218 18,218 18,218 18,218 18,218271 1 33,313 33,313 36,377 37,081 41,201 41,201 42,530 42,530 43,207 43,207271 2 29,627 30,061 33,232 33,937 37,731 37,731 39,087 39,087 39,711 39,711271 3 26,320 26,780 29,925 30,657 34,289 34,289 35,618 35,618 36,241 36,241271 4 24,787 25,247 25,632 27,810 29,639 29,639 30,641 30,641 31,669 31,669271 5 15,810 15,810 15,810 15,810 15,810 15,810 15,810 15,810 15,810 0272 1 33,534 33,543 37,049 37,049 41,597 41,597 42,928 42,928 43,593 43,593
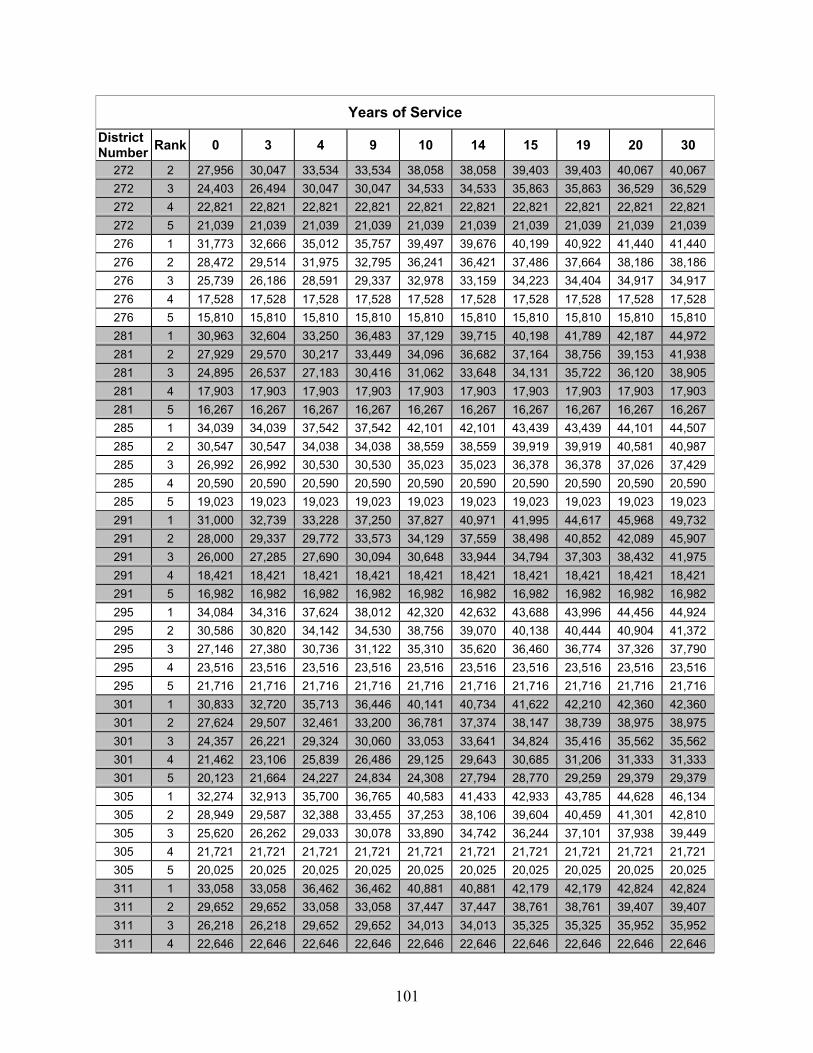
101
Years of ServiceDistrictNumber Rank 0 3 4 9 10 14 15 19 20 30
272 2 27,956 30,047 33,534 33,534 38,058 38,058 39,403 39,403 40,067 40,067272 3 24,403 26,494 30,047 30,047 34,533 34,533 35,863 35,863 36,529 36,529272 4 22,821 22,821 22,821 22,821 22,821 22,821 22,821 22,821 22,821 22,821272 5 21,039 21,039 21,039 21,039 21,039 21,039 21,039 21,039 21,039 21,039276 1 31,773 32,666 35,012 35,757 39,497 39,676 40,199 40,922 41,440 41,440276 2 28,472 29,514 31,975 32,795 36,241 36,421 37,486 37,664 38,186 38,186276 3 25,739 26,186 28,591 29,337 32,978 33,159 34,223 34,404 34,917 34,917276 4 17,528 17,528 17,528 17,528 17,528 17,528 17,528 17,528 17,528 17,528276 5 15,810 15,810 15,810 15,810 15,810 15,810 15,810 15,810 15,810 15,810281 1 30,963 32,604 33,250 36,483 37,129 39,715 40,198 41,789 42,187 44,972281 2 27,929 29,570 30,217 33,449 34,096 36,682 37,164 38,756 39,153 41,938281 3 24,895 26,537 27,183 30,416 31,062 33,648 34,131 35,722 36,120 38,905281 4 17,903 17,903 17,903 17,903 17,903 17,903 17,903 17,903 17,903 17,903281 5 16,267 16,267 16,267 16,267 16,267 16,267 16,267 16,267 16,267 16,267285 1 34,039 34,039 37,542 37,542 42,101 42,101 43,439 43,439 44,101 44,507285 2 30,547 30,547 34,038 34,038 38,559 38,559 39,919 39,919 40,581 40,987285 3 26,992 26,992 30,530 30,530 35,023 35,023 36,378 36,378 37,026 37,429285 4 20,590 20,590 20,590 20,590 20,590 20,590 20,590 20,590 20,590 20,590285 5 19,023 19,023 19,023 19,023 19,023 19,023 19,023 19,023 19,023 19,023291 1 31,000 32,739 33,228 37,250 37,827 40,971 41,995 44,617 45,968 49,732291 2 28,000 29,337 29,772 33,573 34,129 37,559 38,498 40,852 42,089 45,907291 3 26,000 27,285 27,690 30,094 30,648 33,944 34,794 37,303 38,432 41,975291 4 18,421 18,421 18,421 18,421 18,421 18,421 18,421 18,421 18,421 18,421291 5 16,982 16,982 16,982 16,982 16,982 16,982 16,982 16,982 16,982 16,982295 1 34,084 34,316 37,624 38,012 42,320 42,632 43,688 43,996 44,456 44,924295 2 30,586 30,820 34,142 34,530 38,756 39,070 40,138 40,444 40,904 41,372295 3 27,146 27,380 30,736 31,122 35,310 35,620 36,460 36,774 37,326 37,790295 4 23,516 23,516 23,516 23,516 23,516 23,516 23,516 23,516 23,516 23,516295 5 21,716 21,716 21,716 21,716 21,716 21,716 21,716 21,716 21,716 21,716301 1 30,833 32,720 35,713 36,446 40,141 40,734 41,622 42,210 42,360 42,360301 2 27,624 29,507 32,461 33,200 36,781 37,374 38,147 38,739 38,975 38,975301 3 24,357 26,221 29,324 30,060 33,053 33,641 34,824 35,416 35,562 35,562301 4 21,462 23,106 25,839 26,486 29,125 29,643 30,685 31,206 31,333 31,333301 5 20,123 21,664 24,227 24,834 24,308 27,794 28,770 29,259 29,379 29,379305 1 32,274 32,913 35,700 36,765 40,583 41,433 42,933 43,785 44,628 46,134305 2 28,949 29,587 32,388 33,455 37,253 38,106 39,604 40,459 41,301 42,810305 3 25,620 26,262 29,033 30,078 33,890 34,742 36,244 37,101 37,938 39,449305 4 21,721 21,721 21,721 21,721 21,721 21,721 21,721 21,721 21,721 21,721305 5 20,025 20,025 20,025 20,025 20,025 20,025 20,025 20,025 20,025 20,025311 1 33,058 33,058 36,462 36,462 40,881 40,881 42,179 42,179 42,824 42,824311 2 29,652 29,652 33,058 33,058 37,447 37,447 38,761 38,761 39,407 39,407311 3 26,218 26,218 29,652 29,652 34,013 34,013 35,325 35,325 35,952 35,952311 4 22,646 22,646 22,646 22,646 22,646 22,646 22,646 22,646 22,646 22,646
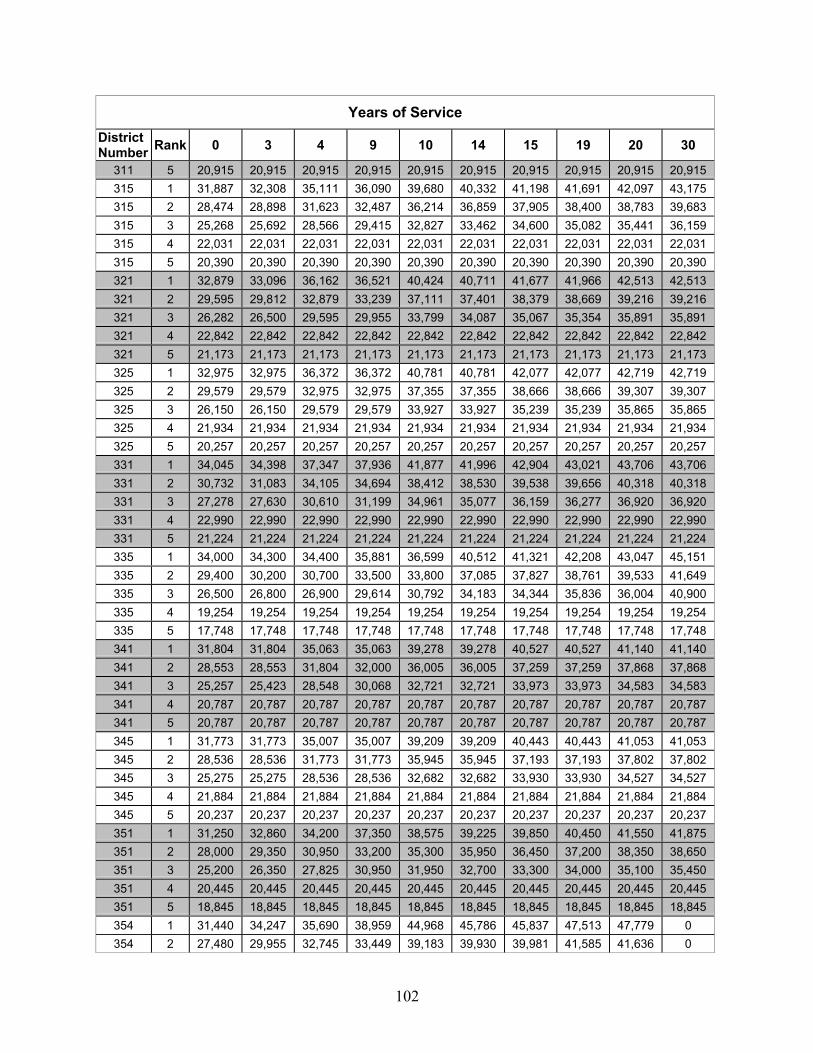
102
Years of ServiceDistrictNumber Rank 0 3 4 9 10 14 15 19 20 30
311 5 20,915 20,915 20,915 20,915 20,915 20,915 20,915 20,915 20,915 20,915315 1 31,887 32,308 35,111 36,090 39,680 40,332 41,198 41,691 42,097 43,175315 2 28,474 28,898 31,623 32,487 36,214 36,859 37,905 38,400 38,783 39,683315 3 25,268 25,692 28,566 29,415 32,827 33,462 34,600 35,082 35,441 36,159315 4 22,031 22,031 22,031 22,031 22,031 22,031 22,031 22,031 22,031 22,031315 5 20,390 20,390 20,390 20,390 20,390 20,390 20,390 20,390 20,390 20,390321 1 32,879 33,096 36,162 36,521 40,424 40,711 41,677 41,966 42,513 42,513321 2 29,595 29,812 32,879 33,239 37,111 37,401 38,379 38,669 39,216 39,216321 3 26,282 26,500 29,595 29,955 33,799 34,087 35,067 35,354 35,891 35,891321 4 22,842 22,842 22,842 22,842 22,842 22,842 22,842 22,842 22,842 22,842321 5 21,173 21,173 21,173 21,173 21,173 21,173 21,173 21,173 21,173 21,173325 1 32,975 32,975 36,372 36,372 40,781 40,781 42,077 42,077 42,719 42,719325 2 29,579 29,579 32,975 32,975 37,355 37,355 38,666 38,666 39,307 39,307325 3 26,150 26,150 29,579 29,579 33,927 33,927 35,239 35,239 35,865 35,865325 4 21,934 21,934 21,934 21,934 21,934 21,934 21,934 21,934 21,934 21,934325 5 20,257 20,257 20,257 20,257 20,257 20,257 20,257 20,257 20,257 20,257331 1 34,045 34,398 37,347 37,936 41,877 41,996 42,904 43,021 43,706 43,706331 2 30,732 31,083 34,105 34,694 38,412 38,530 39,538 39,656 40,318 40,318331 3 27,278 27,630 30,610 31,199 34,961 35,077 36,159 36,277 36,920 36,920331 4 22,990 22,990 22,990 22,990 22,990 22,990 22,990 22,990 22,990 22,990331 5 21,224 21,224 21,224 21,224 21,224 21,224 21,224 21,224 21,224 21,224335 1 34,000 34,300 34,400 35,881 36,599 40,512 41,321 42,208 43,047 45,151335 2 29,400 30,200 30,700 33,500 33,800 37,085 37,827 38,761 39,533 41,649335 3 26,500 26,800 26,900 29,614 30,792 34,183 34,344 35,836 36,004 40,900335 4 19,254 19,254 19,254 19,254 19,254 19,254 19,254 19,254 19,254 19,254335 5 17,748 17,748 17,748 17,748 17,748 17,748 17,748 17,748 17,748 17,748341 1 31,804 31,804 35,063 35,063 39,278 39,278 40,527 40,527 41,140 41,140341 2 28,553 28,553 31,804 32,000 36,005 36,005 37,259 37,259 37,868 37,868341 3 25,257 25,423 28,548 30,068 32,721 32,721 33,973 33,973 34,583 34,583341 4 20,787 20,787 20,787 20,787 20,787 20,787 20,787 20,787 20,787 20,787341 5 20,787 20,787 20,787 20,787 20,787 20,787 20,787 20,787 20,787 20,787345 1 31,773 31,773 35,007 35,007 39,209 39,209 40,443 40,443 41,053 41,053345 2 28,536 28,536 31,773 31,773 35,945 35,945 37,193 37,193 37,802 37,802345 3 25,275 25,275 28,536 28,536 32,682 32,682 33,930 33,930 34,527 34,527345 4 21,884 21,884 21,884 21,884 21,884 21,884 21,884 21,884 21,884 21,884345 5 20,237 20,237 20,237 20,237 20,237 20,237 20,237 20,237 20,237 20,237351 1 31,250 32,860 34,200 37,350 38,575 39,225 39,850 40,450 41,550 41,875351 2 28,000 29,350 30,950 33,200 35,300 35,950 36,450 37,200 38,350 38,650351 3 25,200 26,350 27,825 30,950 31,950 32,700 33,300 34,000 35,100 35,450351 4 20,445 20,445 20,445 20,445 20,445 20,445 20,445 20,445 20,445 20,445351 5 18,845 18,845 18,845 18,845 18,845 18,845 18,845 18,845 18,845 18,845354 1 31,440 34,247 35,690 38,959 44,968 45,786 45,837 47,513 47,779 0354 2 27,480 29,955 32,745 33,449 39,183 39,930 39,981 41,585 41,636 0
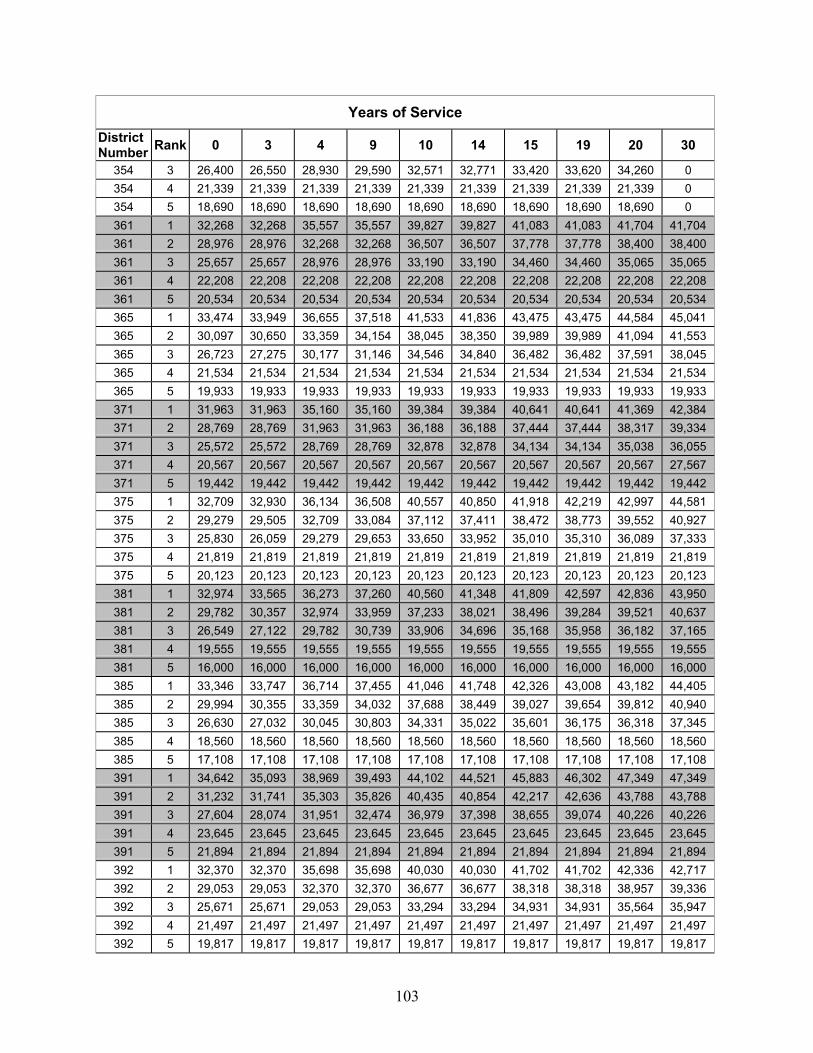
103
Years of ServiceDistrictNumber Rank 0 3 4 9 10 14 15 19 20 30
354 3 26,400 26,550 28,930 29,590 32,571 32,771 33,420 33,620 34,260 0354 4 21,339 21,339 21,339 21,339 21,339 21,339 21,339 21,339 21,339 0354 5 18,690 18,690 18,690 18,690 18,690 18,690 18,690 18,690 18,690 0361 1 32,268 32,268 35,557 35,557 39,827 39,827 41,083 41,083 41,704 41,704361 2 28,976 28,976 32,268 32,268 36,507 36,507 37,778 37,778 38,400 38,400361 3 25,657 25,657 28,976 28,976 33,190 33,190 34,460 34,460 35,065 35,065361 4 22,208 22,208 22,208 22,208 22,208 22,208 22,208 22,208 22,208 22,208361 5 20,534 20,534 20,534 20,534 20,534 20,534 20,534 20,534 20,534 20,534365 1 33,474 33,949 36,655 37,518 41,533 41,836 43,475 43,475 44,584 45,041365 2 30,097 30,650 33,359 34,154 38,045 38,350 39,989 39,989 41,094 41,553365 3 26,723 27,275 30,177 31,146 34,546 34,840 36,482 36,482 37,591 38,045365 4 21,534 21,534 21,534 21,534 21,534 21,534 21,534 21,534 21,534 21,534365 5 19,933 19,933 19,933 19,933 19,933 19,933 19,933 19,933 19,933 19,933371 1 31,963 31,963 35,160 35,160 39,384 39,384 40,641 40,641 41,369 42,384371 2 28,769 28,769 31,963 31,963 36,188 36,188 37,444 37,444 38,317 39,334371 3 25,572 25,572 28,769 28,769 32,878 32,878 34,134 34,134 35,038 36,055371 4 20,567 20,567 20,567 20,567 20,567 20,567 20,567 20,567 20,567 27,567371 5 19,442 19,442 19,442 19,442 19,442 19,442 19,442 19,442 19,442 19,442375 1 32,709 32,930 36,134 36,508 40,557 40,850 41,918 42,219 42,997 44,581375 2 29,279 29,505 32,709 33,084 37,112 37,411 38,472 38,773 39,552 40,927375 3 25,830 26,059 29,279 29,653 33,650 33,952 35,010 35,310 36,089 37,333375 4 21,819 21,819 21,819 21,819 21,819 21,819 21,819 21,819 21,819 21,819375 5 20,123 20,123 20,123 20,123 20,123 20,123 20,123 20,123 20,123 20,123381 1 32,974 33,565 36,273 37,260 40,560 41,348 41,809 42,597 42,836 43,950381 2 29,782 30,357 32,974 33,959 37,233 38,021 38,496 39,284 39,521 40,637381 3 26,549 27,122 29,782 30,739 33,906 34,696 35,168 35,958 36,182 37,165381 4 19,555 19,555 19,555 19,555 19,555 19,555 19,555 19,555 19,555 19,555381 5 16,000 16,000 16,000 16,000 16,000 16,000 16,000 16,000 16,000 16,000385 1 33,346 33,747 36,714 37,455 41,046 41,748 42,326 43,008 43,182 44,405385 2 29,994 30,355 33,359 34,032 37,688 38,449 39,027 39,654 39,812 40,940385 3 26,630 27,032 30,045 30,803 34,331 35,022 35,601 36,175 36,318 37,345385 4 18,560 18,560 18,560 18,560 18,560 18,560 18,560 18,560 18,560 18,560385 5 17,108 17,108 17,108 17,108 17,108 17,108 17,108 17,108 17,108 17,108391 1 34,642 35,093 38,969 39,493 44,102 44,521 45,883 46,302 47,349 47,349391 2 31,232 31,741 35,303 35,826 40,435 40,854 42,217 42,636 43,788 43,788391 3 27,604 28,074 31,951 32,474 36,979 37,398 38,655 39,074 40,226 40,226391 4 23,645 23,645 23,645 23,645 23,645 23,645 23,645 23,645 23,645 23,645391 5 21,894 21,894 21,894 21,894 21,894 21,894 21,894 21,894 21,894 21,894392 1 32,370 32,370 35,698 35,698 40,030 40,030 41,702 41,702 42,336 42,717392 2 29,053 29,053 32,370 32,370 36,677 36,677 38,318 38,318 38,957 39,336392 3 25,671 25,671 29,053 29,053 33,294 33,294 34,931 34,931 35,564 35,947392 4 21,497 21,497 21,497 21,497 21,497 21,497 21,497 21,497 21,497 21,497392 5 19,817 19,817 19,817 19,817 19,817 19,817 19,817 19,817 19,817 19,817
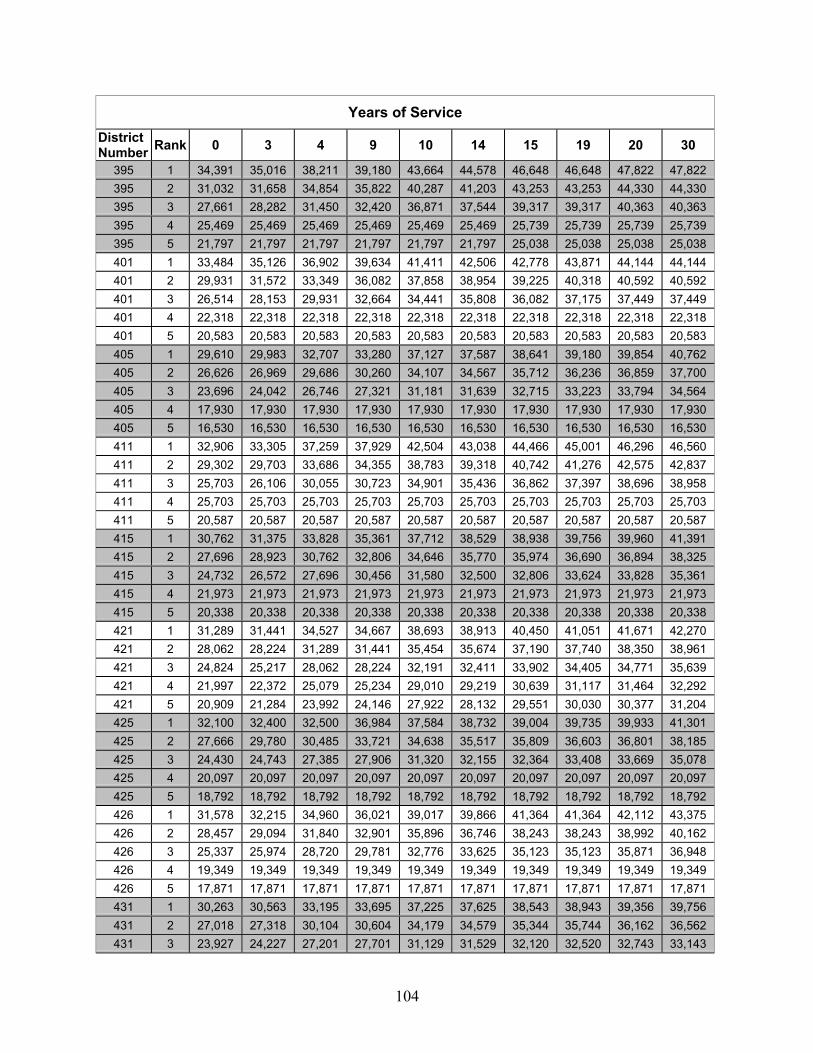
104
Years of ServiceDistrictNumber Rank 0 3 4 9 10 14 15 19 20 30
395 1 34,391 35,016 38,211 39,180 43,664 44,578 46,648 46,648 47,822 47,822395 2 31,032 31,658 34,854 35,822 40,287 41,203 43,253 43,253 44,330 44,330395 3 27,661 28,282 31,450 32,420 36,871 37,544 39,317 39,317 40,363 40,363395 4 25,469 25,469 25,469 25,469 25,469 25,469 25,739 25,739 25,739 25,739395 5 21,797 21,797 21,797 21,797 21,797 21,797 25,038 25,038 25,038 25,038401 1 33,484 35,126 36,902 39,634 41,411 42,506 42,778 43,871 44,144 44,144401 2 29,931 31,572 33,349 36,082 37,858 38,954 39,225 40,318 40,592 40,592401 3 26,514 28,153 29,931 32,664 34,441 35,808 36,082 37,175 37,449 37,449401 4 22,318 22,318 22,318 22,318 22,318 22,318 22,318 22,318 22,318 22,318401 5 20,583 20,583 20,583 20,583 20,583 20,583 20,583 20,583 20,583 20,583405 1 29,610 29,983 32,707 33,280 37,127 37,587 38,641 39,180 39,854 40,762405 2 26,626 26,969 29,686 30,260 34,107 34,567 35,712 36,236 36,859 37,700405 3 23,696 24,042 26,746 27,321 31,181 31,639 32,715 33,223 33,794 34,564405 4 17,930 17,930 17,930 17,930 17,930 17,930 17,930 17,930 17,930 17,930405 5 16,530 16,530 16,530 16,530 16,530 16,530 16,530 16,530 16,530 16,530411 1 32,906 33,305 37,259 37,929 42,504 43,038 44,466 45,001 46,296 46,560411 2 29,302 29,703 33,686 34,355 38,783 39,318 40,742 41,276 42,575 42,837411 3 25,703 26,106 30,055 30,723 34,901 35,436 36,862 37,397 38,696 38,958411 4 25,703 25,703 25,703 25,703 25,703 25,703 25,703 25,703 25,703 25,703411 5 20,587 20,587 20,587 20,587 20,587 20,587 20,587 20,587 20,587 20,587415 1 30,762 31,375 33,828 35,361 37,712 38,529 38,938 39,756 39,960 41,391415 2 27,696 28,923 30,762 32,806 34,646 35,770 35,974 36,690 36,894 38,325415 3 24,732 26,572 27,696 30,456 31,580 32,500 32,806 33,624 33,828 35,361415 4 21,973 21,973 21,973 21,973 21,973 21,973 21,973 21,973 21,973 21,973415 5 20,338 20,338 20,338 20,338 20,338 20,338 20,338 20,338 20,338 20,338421 1 31,289 31,441 34,527 34,667 38,693 38,913 40,450 41,051 41,671 42,270421 2 28,062 28,224 31,289 31,441 35,454 35,674 37,190 37,740 38,350 38,961421 3 24,824 25,217 28,062 28,224 32,191 32,411 33,902 34,405 34,771 35,639421 4 21,997 22,372 25,079 25,234 29,010 29,219 30,639 31,117 31,464 32,292421 5 20,909 21,284 23,992 24,146 27,922 28,132 29,551 30,030 30,377 31,204425 1 32,100 32,400 32,500 36,984 37,584 38,732 39,004 39,735 39,933 41,301425 2 27,666 29,780 30,485 33,721 34,638 35,517 35,809 36,603 36,801 38,185425 3 24,430 24,743 27,385 27,906 31,320 32,155 32,364 33,408 33,669 35,078425 4 20,097 20,097 20,097 20,097 20,097 20,097 20,097 20,097 20,097 20,097425 5 18,792 18,792 18,792 18,792 18,792 18,792 18,792 18,792 18,792 18,792426 1 31,578 32,215 34,960 36,021 39,017 39,866 41,364 41,364 42,112 43,375426 2 28,457 29,094 31,840 32,901 35,896 36,746 38,243 38,243 38,992 40,162426 3 25,337 25,974 28,720 29,781 32,776 33,625 35,123 35,123 35,871 36,948426 4 19,349 19,349 19,349 19,349 19,349 19,349 19,349 19,349 19,349 19,349426 5 17,871 17,871 17,871 17,871 17,871 17,871 17,871 17,871 17,871 17,871431 1 30,263 30,563 33,195 33,695 37,225 37,625 38,543 38,943 39,356 39,756431 2 27,018 27,318 30,104 30,604 34,179 34,579 35,344 35,744 36,162 36,562431 3 23,927 24,227 27,201 27,701 31,129 31,529 32,120 32,520 32,743 33,143
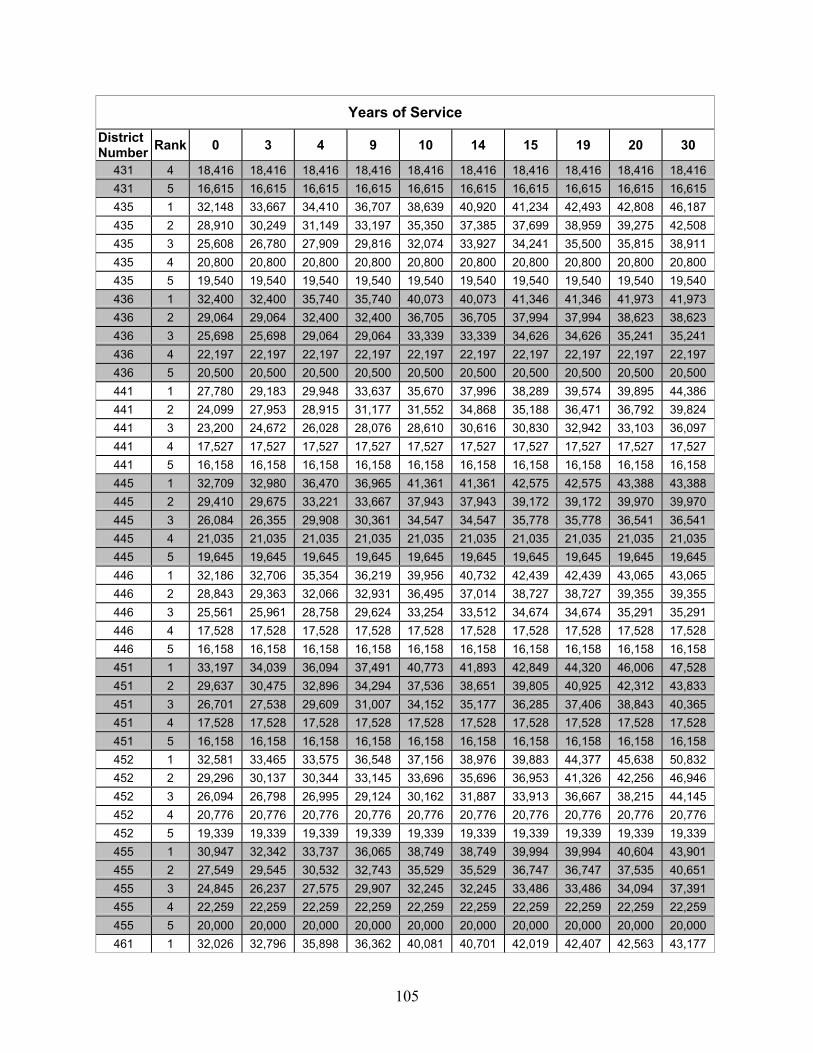
105
Years of ServiceDistrictNumber Rank 0 3 4 9 10 14 15 19 20 30
431 4 18,416 18,416 18,416 18,416 18,416 18,416 18,416 18,416 18,416 18,416431 5 16,615 16,615 16,615 16,615 16,615 16,615 16,615 16,615 16,615 16,615435 1 32,148 33,667 34,410 36,707 38,639 40,920 41,234 42,493 42,808 46,187435 2 28,910 30,249 31,149 33,197 35,350 37,385 37,699 38,959 39,275 42,508435 3 25,608 26,780 27,909 29,816 32,074 33,927 34,241 35,500 35,815 38,911435 4 20,800 20,800 20,800 20,800 20,800 20,800 20,800 20,800 20,800 20,800435 5 19,540 19,540 19,540 19,540 19,540 19,540 19,540 19,540 19,540 19,540436 1 32,400 32,400 35,740 35,740 40,073 40,073 41,346 41,346 41,973 41,973436 2 29,064 29,064 32,400 32,400 36,705 36,705 37,994 37,994 38,623 38,623436 3 25,698 25,698 29,064 29,064 33,339 33,339 34,626 34,626 35,241 35,241436 4 22,197 22,197 22,197 22,197 22,197 22,197 22,197 22,197 22,197 22,197436 5 20,500 20,500 20,500 20,500 20,500 20,500 20,500 20,500 20,500 20,500441 1 27,780 29,183 29,948 33,637 35,670 37,996 38,289 39,574 39,895 44,386441 2 24,099 27,953 28,915 31,177 31,552 34,868 35,188 36,471 36,792 39,824441 3 23,200 24,672 26,028 28,076 28,610 30,616 30,830 32,942 33,103 36,097441 4 17,527 17,527 17,527 17,527 17,527 17,527 17,527 17,527 17,527 17,527441 5 16,158 16,158 16,158 16,158 16,158 16,158 16,158 16,158 16,158 16,158445 1 32,709 32,980 36,470 36,965 41,361 41,361 42,575 42,575 43,388 43,388445 2 29,410 29,675 33,221 33,667 37,943 37,943 39,172 39,172 39,970 39,970445 3 26,084 26,355 29,908 30,361 34,547 34,547 35,778 35,778 36,541 36,541445 4 21,035 21,035 21,035 21,035 21,035 21,035 21,035 21,035 21,035 21,035445 5 19,645 19,645 19,645 19,645 19,645 19,645 19,645 19,645 19,645 19,645446 1 32,186 32,706 35,354 36,219 39,956 40,732 42,439 42,439 43,065 43,065446 2 28,843 29,363 32,066 32,931 36,495 37,014 38,727 38,727 39,355 39,355446 3 25,561 25,961 28,758 29,624 33,254 33,512 34,674 34,674 35,291 35,291446 4 17,528 17,528 17,528 17,528 17,528 17,528 17,528 17,528 17,528 17,528446 5 16,158 16,158 16,158 16,158 16,158 16,158 16,158 16,158 16,158 16,158451 1 33,197 34,039 36,094 37,491 40,773 41,893 42,849 44,320 46,006 47,528451 2 29,637 30,475 32,896 34,294 37,536 38,651 39,805 40,925 42,312 43,833451 3 26,701 27,538 29,609 31,007 34,152 35,177 36,285 37,406 38,843 40,365451 4 17,528 17,528 17,528 17,528 17,528 17,528 17,528 17,528 17,528 17,528451 5 16,158 16,158 16,158 16,158 16,158 16,158 16,158 16,158 16,158 16,158452 1 32,581 33,465 33,575 36,548 37,156 38,976 39,883 44,377 45,638 50,832452 2 29,296 30,137 30,344 33,145 33,696 35,696 36,953 41,326 42,256 46,946452 3 26,094 26,798 26,995 29,124 30,162 31,887 33,913 36,667 38,215 44,145452 4 20,776 20,776 20,776 20,776 20,776 20,776 20,776 20,776 20,776 20,776452 5 19,339 19,339 19,339 19,339 19,339 19,339 19,339 19,339 19,339 19,339455 1 30,947 32,342 33,737 36,065 38,749 38,749 39,994 39,994 40,604 43,901455 2 27,549 29,545 30,532 32,743 35,529 35,529 36,747 36,747 37,535 40,651455 3 24,845 26,237 27,575 29,907 32,245 32,245 33,486 33,486 34,094 37,391455 4 22,259 22,259 22,259 22,259 22,259 22,259 22,259 22,259 22,259 22,259455 5 20,000 20,000 20,000 20,000 20,000 20,000 20,000 20,000 20,000 20,000461 1 32,026 32,796 35,898 36,362 40,081 40,701 42,019 42,407 42,563 43,177
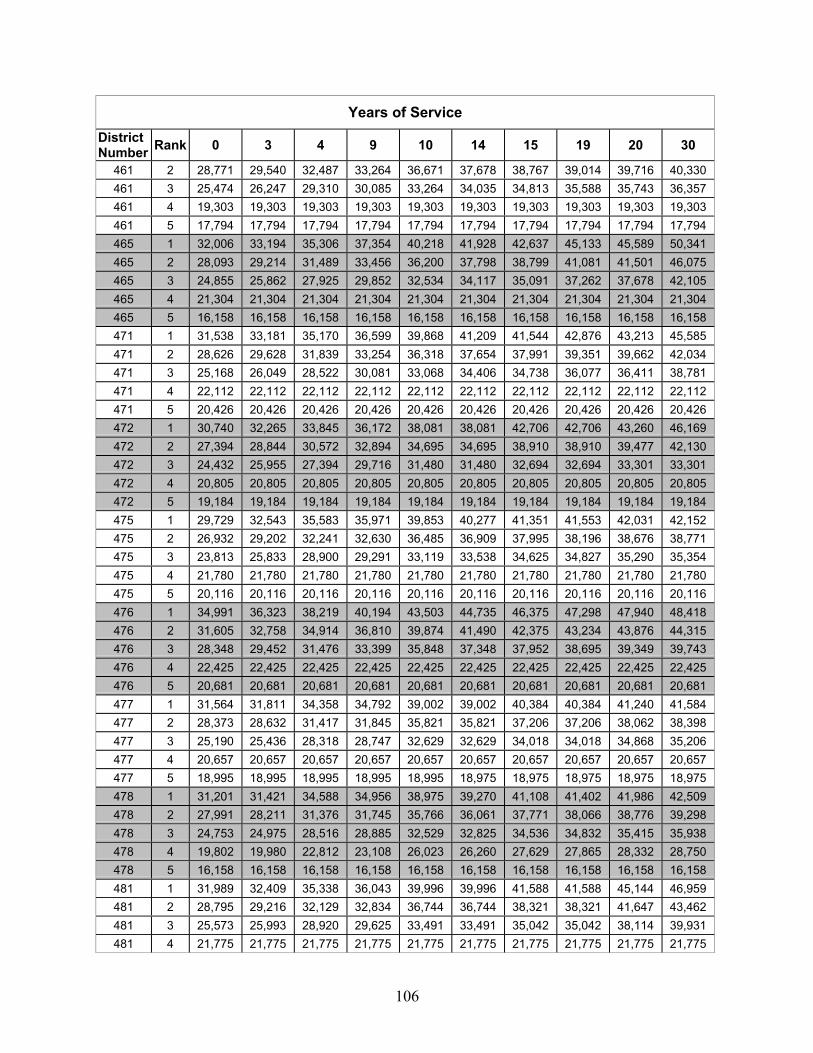
106
Years of ServiceDistrictNumber Rank 0 3 4 9 10 14 15 19 20 30
461 2 28,771 29,540 32,487 33,264 36,671 37,678 38,767 39,014 39,716 40,330461 3 25,474 26,247 29,310 30,085 33,264 34,035 34,813 35,588 35,743 36,357461 4 19,303 19,303 19,303 19,303 19,303 19,303 19,303 19,303 19,303 19,303461 5 17,794 17,794 17,794 17,794 17,794 17,794 17,794 17,794 17,794 17,794465 1 32,006 33,194 35,306 37,354 40,218 41,928 42,637 45,133 45,589 50,341465 2 28,093 29,214 31,489 33,456 36,200 37,798 38,799 41,081 41,501 46,075465 3 24,855 25,862 27,925 29,852 32,534 34,117 35,091 37,262 37,678 42,105465 4 21,304 21,304 21,304 21,304 21,304 21,304 21,304 21,304 21,304 21,304465 5 16,158 16,158 16,158 16,158 16,158 16,158 16,158 16,158 16,158 16,158471 1 31,538 33,181 35,170 36,599 39,868 41,209 41,544 42,876 43,213 45,585471 2 28,626 29,628 31,839 33,254 36,318 37,654 37,991 39,351 39,662 42,034471 3 25,168 26,049 28,522 30,081 33,068 34,406 34,738 36,077 36,411 38,781471 4 22,112 22,112 22,112 22,112 22,112 22,112 22,112 22,112 22,112 22,112471 5 20,426 20,426 20,426 20,426 20,426 20,426 20,426 20,426 20,426 20,426472 1 30,740 32,265 33,845 36,172 38,081 38,081 42,706 42,706 43,260 46,169472 2 27,394 28,844 30,572 32,894 34,695 34,695 38,910 38,910 39,477 42,130472 3 24,432 25,955 27,394 29,716 31,480 31,480 32,694 32,694 33,301 33,301472 4 20,805 20,805 20,805 20,805 20,805 20,805 20,805 20,805 20,805 20,805472 5 19,184 19,184 19,184 19,184 19,184 19,184 19,184 19,184 19,184 19,184475 1 29,729 32,543 35,583 35,971 39,853 40,277 41,351 41,553 42,031 42,152475 2 26,932 29,202 32,241 32,630 36,485 36,909 37,995 38,196 38,676 38,771475 3 23,813 25,833 28,900 29,291 33,119 33,538 34,625 34,827 35,290 35,354475 4 21,780 21,780 21,780 21,780 21,780 21,780 21,780 21,780 21,780 21,780475 5 20,116 20,116 20,116 20,116 20,116 20,116 20,116 20,116 20,116 20,116476 1 34,991 36,323 38,219 40,194 43,503 44,735 46,375 47,298 47,940 48,418476 2 31,605 32,758 34,914 36,810 39,874 41,490 42,375 43,234 43,876 44,315476 3 28,348 29,452 31,476 33,399 35,848 37,348 37,952 38,695 39,349 39,743476 4 22,425 22,425 22,425 22,425 22,425 22,425 22,425 22,425 22,425 22,425476 5 20,681 20,681 20,681 20,681 20,681 20,681 20,681 20,681 20,681 20,681477 1 31,564 31,811 34,358 34,792 39,002 39,002 40,384 40,384 41,240 41,584477 2 28,373 28,632 31,417 31,845 35,821 35,821 37,206 37,206 38,062 38,398477 3 25,190 25,436 28,318 28,747 32,629 32,629 34,018 34,018 34,868 35,206477 4 20,657 20,657 20,657 20,657 20,657 20,657 20,657 20,657 20,657 20,657477 5 18,995 18,995 18,995 18,995 18,995 18,975 18,975 18,975 18,975 18,975478 1 31,201 31,421 34,588 34,956 38,975 39,270 41,108 41,402 41,986 42,509478 2 27,991 28,211 31,376 31,745 35,766 36,061 37,771 38,066 38,776 39,298478 3 24,753 24,975 28,516 28,885 32,529 32,825 34,536 34,832 35,415 35,938478 4 19,802 19,980 22,812 23,108 26,023 26,260 27,629 27,865 28,332 28,750478 5 16,158 16,158 16,158 16,158 16,158 16,158 16,158 16,158 16,158 16,158481 1 31,989 32,409 35,338 36,043 39,996 39,996 41,588 41,588 45,144 46,959481 2 28,795 29,216 32,129 32,834 36,744 36,744 38,321 38,321 41,647 43,462481 3 25,573 25,993 28,920 29,625 33,491 33,491 35,042 35,042 38,114 39,931481 4 21,775 21,775 21,775 21,775 21,775 21,775 21,775 21,775 21,775 21,775
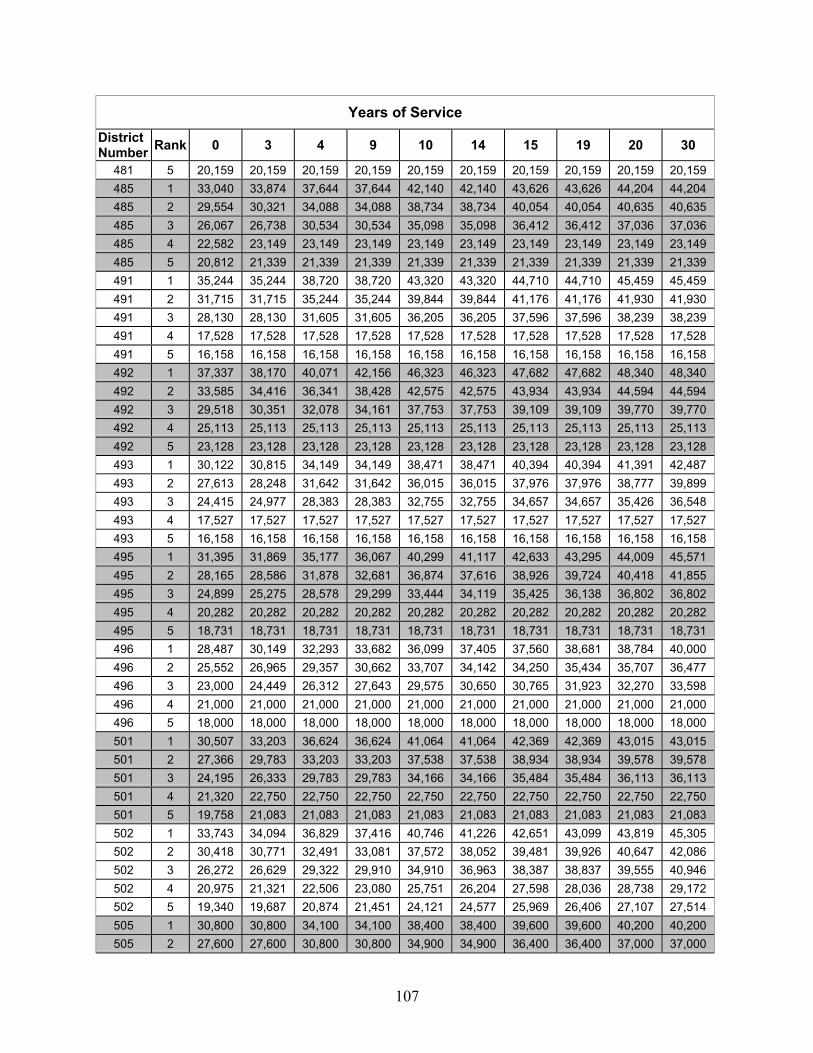
107
Years of ServiceDistrictNumber Rank 0 3 4 9 10 14 15 19 20 30
481 5 20,159 20,159 20,159 20,159 20,159 20,159 20,159 20,159 20,159 20,159485 1 33,040 33,874 37,644 37,644 42,140 42,140 43,626 43,626 44,204 44,204485 2 29,554 30,321 34,088 34,088 38,734 38,734 40,054 40,054 40,635 40,635485 3 26,067 26,738 30,534 30,534 35,098 35,098 36,412 36,412 37,036 37,036485 4 22,582 23,149 23,149 23,149 23,149 23,149 23,149 23,149 23,149 23,149485 5 20,812 21,339 21,339 21,339 21,339 21,339 21,339 21,339 21,339 21,339491 1 35,244 35,244 38,720 38,720 43,320 43,320 44,710 44,710 45,459 45,459491 2 31,715 31,715 35,244 35,244 39,844 39,844 41,176 41,176 41,930 41,930491 3 28,130 28,130 31,605 31,605 36,205 36,205 37,596 37,596 38,239 38,239491 4 17,528 17,528 17,528 17,528 17,528 17,528 17,528 17,528 17,528 17,528491 5 16,158 16,158 16,158 16,158 16,158 16,158 16,158 16,158 16,158 16,158492 1 37,337 38,170 40,071 42,156 46,323 46,323 47,682 47,682 48,340 48,340492 2 33,585 34,416 36,341 38,428 42,575 42,575 43,934 43,934 44,594 44,594492 3 29,518 30,351 32,078 34,161 37,753 37,753 39,109 39,109 39,770 39,770492 4 25,113 25,113 25,113 25,113 25,113 25,113 25,113 25,113 25,113 25,113492 5 23,128 23,128 23,128 23,128 23,128 23,128 23,128 23,128 23,128 23,128493 1 30,122 30,815 34,149 34,149 38,471 38,471 40,394 40,394 41,391 42,487493 2 27,613 28,248 31,642 31,642 36,015 36,015 37,976 37,976 38,777 39,899493 3 24,415 24,977 28,383 28,383 32,755 32,755 34,657 34,657 35,426 36,548493 4 17,527 17,527 17,527 17,527 17,527 17,527 17,527 17,527 17,527 17,527493 5 16,158 16,158 16,158 16,158 16,158 16,158 16,158 16,158 16,158 16,158495 1 31,395 31,869 35,177 36,067 40,299 41,117 42,633 43,295 44,009 45,571495 2 28,165 28,586 31,878 32,681 36,874 37,616 38,926 39,724 40,418 41,855495 3 24,899 25,275 28,578 29,299 33,444 34,119 35,425 36,138 36,802 36,802495 4 20,282 20,282 20,282 20,282 20,282 20,282 20,282 20,282 20,282 20,282495 5 18,731 18,731 18,731 18,731 18,731 18,731 18,731 18,731 18,731 18,731496 1 28,487 30,149 32,293 33,682 36,099 37,405 37,560 38,681 38,784 40,000496 2 25,552 26,965 29,357 30,662 33,707 34,142 34,250 35,434 35,707 36,477496 3 23,000 24,449 26,312 27,643 29,575 30,650 30,765 31,923 32,270 33,598496 4 21,000 21,000 21,000 21,000 21,000 21,000 21,000 21,000 21,000 21,000496 5 18,000 18,000 18,000 18,000 18,000 18,000 18,000 18,000 18,000 18,000501 1 30,507 33,203 36,624 36,624 41,064 41,064 42,369 42,369 43,015 43,015501 2 27,366 29,783 33,203 33,203 37,538 37,538 38,934 38,934 39,578 39,578501 3 24,195 26,333 29,783 29,783 34,166 34,166 35,484 35,484 36,113 36,113501 4 21,320 22,750 22,750 22,750 22,750 22,750 22,750 22,750 22,750 22,750501 5 19,758 21,083 21,083 21,083 21,083 21,083 21,083 21,083 21,083 21,083502 1 33,743 34,094 36,829 37,416 40,746 41,226 42,651 43,099 43,819 45,305502 2 30,418 30,771 32,491 33,081 37,572 38,052 39,481 39,926 40,647 42,086502 3 26,272 26,629 29,322 29,910 34,910 36,963 38,387 38,837 39,555 40,946502 4 20,975 21,321 22,506 23,080 25,751 26,204 27,598 28,036 28,738 29,172502 5 19,340 19,687 20,874 21,451 24,121 24,577 25,969 26,406 27,107 27,514505 1 30,800 30,800 34,100 34,100 38,400 38,400 39,600 39,600 40,200 40,200505 2 27,600 27,600 30,800 30,800 34,900 34,900 36,400 36,400 37,000 37,000
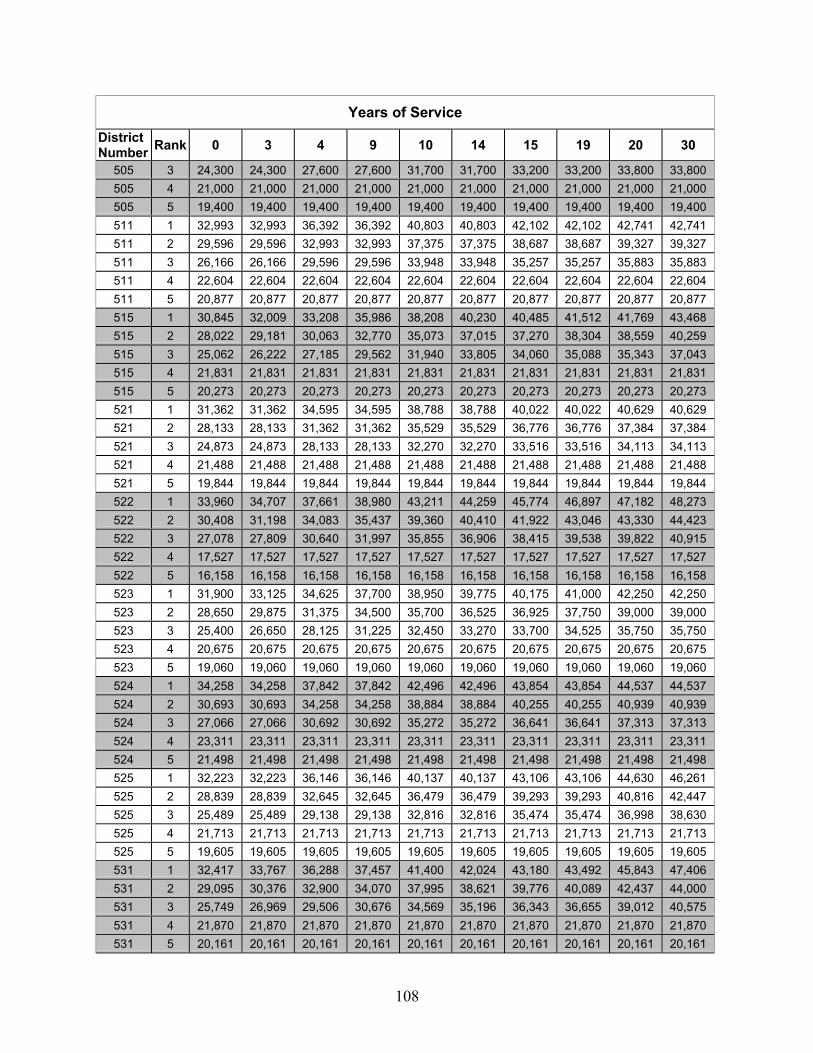
108
Years of ServiceDistrictNumber Rank 0 3 4 9 10 14 15 19 20 30
505 3 24,300 24,300 27,600 27,600 31,700 31,700 33,200 33,200 33,800 33,800505 4 21,000 21,000 21,000 21,000 21,000 21,000 21,000 21,000 21,000 21,000505 5 19,400 19,400 19,400 19,400 19,400 19,400 19,400 19,400 19,400 19,400511 1 32,993 32,993 36,392 36,392 40,803 40,803 42,102 42,102 42,741 42,741511 2 29,596 29,596 32,993 32,993 37,375 37,375 38,687 38,687 39,327 39,327511 3 26,166 26,166 29,596 29,596 33,948 33,948 35,257 35,257 35,883 35,883511 4 22,604 22,604 22,604 22,604 22,604 22,604 22,604 22,604 22,604 22,604511 5 20,877 20,877 20,877 20,877 20,877 20,877 20,877 20,877 20,877 20,877515 1 30,845 32,009 33,208 35,986 38,208 40,230 40,485 41,512 41,769 43,468515 2 28,022 29,181 30,063 32,770 35,073 37,015 37,270 38,304 38,559 40,259515 3 25,062 26,222 27,185 29,562 31,940 33,805 34,060 35,088 35,343 37,043515 4 21,831 21,831 21,831 21,831 21,831 21,831 21,831 21,831 21,831 21,831515 5 20,273 20,273 20,273 20,273 20,273 20,273 20,273 20,273 20,273 20,273521 1 31,362 31,362 34,595 34,595 38,788 38,788 40,022 40,022 40,629 40,629521 2 28,133 28,133 31,362 31,362 35,529 35,529 36,776 36,776 37,384 37,384521 3 24,873 24,873 28,133 28,133 32,270 32,270 33,516 33,516 34,113 34,113521 4 21,488 21,488 21,488 21,488 21,488 21,488 21,488 21,488 21,488 21,488521 5 19,844 19,844 19,844 19,844 19,844 19,844 19,844 19,844 19,844 19,844522 1 33,960 34,707 37,661 38,980 43,211 44,259 45,774 46,897 47,182 48,273522 2 30,408 31,198 34,083 35,437 39,360 40,410 41,922 43,046 43,330 44,423522 3 27,078 27,809 30,640 31,997 35,855 36,906 38,415 39,538 39,822 40,915522 4 17,527 17,527 17,527 17,527 17,527 17,527 17,527 17,527 17,527 17,527522 5 16,158 16,158 16,158 16,158 16,158 16,158 16,158 16,158 16,158 16,158523 1 31,900 33,125 34,625 37,700 38,950 39,775 40,175 41,000 42,250 42,250523 2 28,650 29,875 31,375 34,500 35,700 36,525 36,925 37,750 39,000 39,000523 3 25,400 26,650 28,125 31,225 32,450 33,270 33,700 34,525 35,750 35,750523 4 20,675 20,675 20,675 20,675 20,675 20,675 20,675 20,675 20,675 20,675523 5 19,060 19,060 19,060 19,060 19,060 19,060 19,060 19,060 19,060 19,060524 1 34,258 34,258 37,842 37,842 42,496 42,496 43,854 43,854 44,537 44,537524 2 30,693 30,693 34,258 34,258 38,884 38,884 40,255 40,255 40,939 40,939524 3 27,066 27,066 30,692 30,692 35,272 35,272 36,641 36,641 37,313 37,313524 4 23,311 23,311 23,311 23,311 23,311 23,311 23,311 23,311 23,311 23,311524 5 21,498 21,498 21,498 21,498 21,498 21,498 21,498 21,498 21,498 21,498525 1 32,223 32,223 36,146 36,146 40,137 40,137 43,106 43,106 44,630 46,261525 2 28,839 28,839 32,645 32,645 36,479 36,479 39,293 39,293 40,816 42,447525 3 25,489 25,489 29,138 29,138 32,816 32,816 35,474 35,474 36,998 38,630525 4 21,713 21,713 21,713 21,713 21,713 21,713 21,713 21,713 21,713 21,713525 5 19,605 19,605 19,605 19,605 19,605 19,605 19,605 19,605 19,605 19,605531 1 32,417 33,767 36,288 37,457 41,400 42,024 43,180 43,492 45,843 47,406531 2 29,095 30,376 32,900 34,070 37,995 38,621 39,776 40,089 42,437 44,000531 3 25,749 26,969 29,506 30,676 34,569 35,196 36,343 36,655 39,012 40,575531 4 21,870 21,870 21,870 21,870 21,870 21,870 21,870 21,870 21,870 21,870531 5 20,161 20,161 20,161 20,161 20,161 20,161 20,161 20,161 20,161 20,161
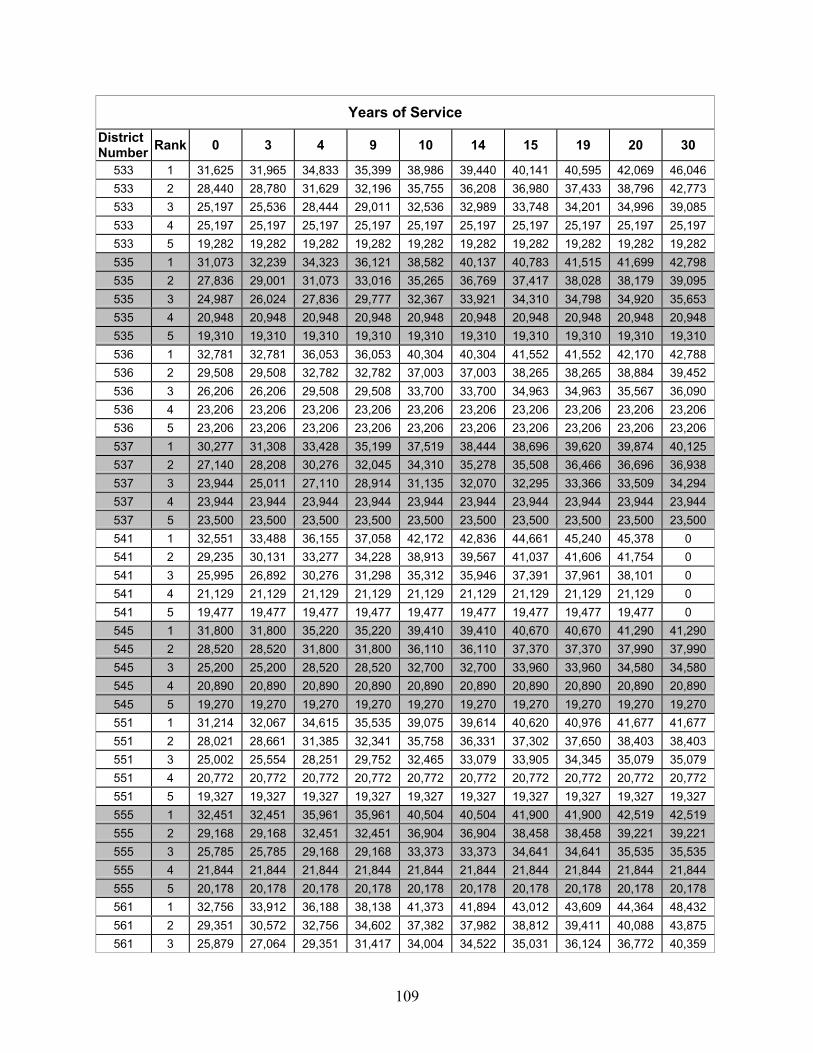
109
Years of ServiceDistrictNumber Rank 0 3 4 9 10 14 15 19 20 30
533 1 31,625 31,965 34,833 35,399 38,986 39,440 40,141 40,595 42,069 46,046533 2 28,440 28,780 31,629 32,196 35,755 36,208 36,980 37,433 38,796 42,773533 3 25,197 25,536 28,444 29,011 32,536 32,989 33,748 34,201 34,996 39,085533 4 25,197 25,197 25,197 25,197 25,197 25,197 25,197 25,197 25,197 25,197533 5 19,282 19,282 19,282 19,282 19,282 19,282 19,282 19,282 19,282 19,282535 1 31,073 32,239 34,323 36,121 38,582 40,137 40,783 41,515 41,699 42,798535 2 27,836 29,001 31,073 33,016 35,265 36,769 37,417 38,028 38,179 39,095535 3 24,987 26,024 27,836 29,777 32,367 33,921 34,310 34,798 34,920 35,653535 4 20,948 20,948 20,948 20,948 20,948 20,948 20,948 20,948 20,948 20,948535 5 19,310 19,310 19,310 19,310 19,310 19,310 19,310 19,310 19,310 19,310536 1 32,781 32,781 36,053 36,053 40,304 40,304 41,552 41,552 42,170 42,788536 2 29,508 29,508 32,782 32,782 37,003 37,003 38,265 38,265 38,884 39,452536 3 26,206 26,206 29,508 29,508 33,700 33,700 34,963 34,963 35,567 36,090536 4 23,206 23,206 23,206 23,206 23,206 23,206 23,206 23,206 23,206 23,206536 5 23,206 23,206 23,206 23,206 23,206 23,206 23,206 23,206 23,206 23,206537 1 30,277 31,308 33,428 35,199 37,519 38,444 38,696 39,620 39,874 40,125537 2 27,140 28,208 30,276 32,045 34,310 35,278 35,508 36,466 36,696 36,938537 3 23,944 25,011 27,110 28,914 31,135 32,070 32,295 33,366 33,509 34,294537 4 23,944 23,944 23,944 23,944 23,944 23,944 23,944 23,944 23,944 23,944537 5 23,500 23,500 23,500 23,500 23,500 23,500 23,500 23,500 23,500 23,500541 1 32,551 33,488 36,155 37,058 42,172 42,836 44,661 45,240 45,378 0541 2 29,235 30,131 33,277 34,228 38,913 39,567 41,037 41,606 41,754 0541 3 25,995 26,892 30,276 31,298 35,312 35,946 37,391 37,961 38,101 0541 4 21,129 21,129 21,129 21,129 21,129 21,129 21,129 21,129 21,129 0541 5 19,477 19,477 19,477 19,477 19,477 19,477 19,477 19,477 19,477 0545 1 31,800 31,800 35,220 35,220 39,410 39,410 40,670 40,670 41,290 41,290545 2 28,520 28,520 31,800 31,800 36,110 36,110 37,370 37,370 37,990 37,990545 3 25,200 25,200 28,520 28,520 32,700 32,700 33,960 33,960 34,580 34,580545 4 20,890 20,890 20,890 20,890 20,890 20,890 20,890 20,890 20,890 20,890545 5 19,270 19,270 19,270 19,270 19,270 19,270 19,270 19,270 19,270 19,270551 1 31,214 32,067 34,615 35,535 39,075 39,614 40,620 40,976 41,677 41,677551 2 28,021 28,661 31,385 32,341 35,758 36,331 37,302 37,650 38,403 38,403551 3 25,002 25,554 28,251 29,752 32,465 33,079 33,905 34,345 35,079 35,079551 4 20,772 20,772 20,772 20,772 20,772 20,772 20,772 20,772 20,772 20,772551 5 19,327 19,327 19,327 19,327 19,327 19,327 19,327 19,327 19,327 19,327555 1 32,451 32,451 35,961 35,961 40,504 40,504 41,900 41,900 42,519 42,519555 2 29,168 29,168 32,451 32,451 36,904 36,904 38,458 38,458 39,221 39,221555 3 25,785 25,785 29,168 29,168 33,373 33,373 34,641 34,641 35,535 35,535555 4 21,844 21,844 21,844 21,844 21,844 21,844 21,844 21,844 21,844 21,844555 5 20,178 20,178 20,178 20,178 20,178 20,178 20,178 20,178 20,178 20,178561 1 32,756 33,912 36,188 38,138 41,373 41,894 43,012 43,609 44,364 48,432561 2 29,351 30,572 32,756 34,602 37,382 37,982 38,812 39,411 40,088 43,875561 3 25,879 27,064 29,351 31,417 34,004 34,522 35,031 36,124 36,772 40,359

110
Years of ServiceDistrictNumber Rank 0 3 4 9 10 14 15 19 20 30
561 4 25,879 25,879 25,879 25,879 25,879 25,879 25,879 25,879 25,879 25,879561 5 20,050 20,050 20,050 20,050 20,050 20,050 20,050 20,050 20,050 20,050565 1 29,918 31,295 33,456 35,083 38,454 40,423 40,720 41,516 42,097 42,622565 2 26,808 27,968 30,131 31,757 35,032 36,825 37,135 37,882 38,452 38,977565 3 23,638 25,120 27,030 28,601 31,258 32,947 33,326 33,979 34,605 35,131565 4 21,300 21,300 21,300 21,300 21,300 21,300 21,300 21,300 21,300 21,300565 5 19,300 19,300 19,300 19,300 19,300 19,300 19,300 19,300 19,300 19,300567 1 32,274 34,606 35,656 37,972 40,035 41,212 41,553 44,634 45,401 51,548567 2 29,036 31,547 32,390 34,390 36,747 38,465 38,804 40,879 41,399 45,547567 3 26,536 27,904 29,147 30,722 33,235 34,919 35,262 36,628 36,970 39,882567 4 17,527 17,527 17,527 17,527 17,527 17,527 17,527 17,527 17,527 17,527567 5 16,158 16,158 16,158 16,158 16,158 16,158 16,158 16,158 16,158 16,158571 1 32,715 32,943 36,137 36,508 40,615 40,910 41,966 42,263 42,709 42,709571 2 29,370 29,705 32,819 34,679 37,193 37,490 38,530 38,827 39,306 39,306571 3 26,026 26,247 29,519 29,904 33,787 34,084 35,142 35,437 35,869 35,869571 4 20,525 20,525 20,525 20,525 20,525 20,525 20,525 20,525 20,525 20,525571 5 18,920 18,920 18,920 18,920 18,920 18,920 18,920 18,920 18,920 18,920575 1 32,114 32,468 35,441 36,032 39,839 40,313 41,323 41,796 42,429 43,019575 2 28,879 29,233 32,091 32,681 36,524 36,996 38,013 38,486 39,118 39,708575 3 25,591 25,945 28,695 29,287 33,214 33,687 34,690 35,164 35,808 36,398575 4 20,232 20,232 20,232 20,232 20,232 20,232 20,232 20,232 20,232 20,232575 5 18,645 18,645 18,645 18,645 18,645 18,645 18,645 18,645 18,645 18,645581 1 31,287 31,427 34,334 34,689 38,655 38,937 39,831 40,112 40,576 41,656581 2 27,956 28,166 31,181 31,532 35,359 35,643 36,623 36,907 37,334 38,414581 3 24,769 24,982 28,046 28,402 32,014 32,299 33,400 33,684 34,067 35,147581 4 21,458 21,458 21,458 21,458 21,458 21,458 21,458 21,458 21,458 21,458581 5 19,817 19,817 19,817 19,817 19,817 19,817 19,817 19,817 19,817 19,817585 1 30,375 31,338 33,799 35,402 37,648 38,931 39,359 40,643 40,964 42,889585 2 27,594 28,557 30,803 32,408 34,868 36,150 36,471 37,756 38,077 40,001585 3 24,707 25,670 27,809 29,519 31,552 32,835 33,156 34,440 34,761 36,686585 4 20,000 20,000 20,000 20,000 20,000 20,000 20,000 20,000 20,000 20,000585 5 16,158 16,158 16,158 16,158 16,158 16,158 16,158 16,158 16,158 16,158586 1 29,967 31,389 33,084 35,453 37,591 39,490 40,521 42,414 43,404 45,187586 2 27,103 28,520 30,070 32,969 34,478 36,372 37,422 39,315 40,182 41,553586 3 24,991 26,415 27,395 29,764 30,843 32,736 34,135 36,027 37,364 39,137586 4 20,000 20,000 20,000 20,000 20,000 20,000 20,000 20,000 20,000 20,000586 5 15,810 15,810 15,810 15,810 15,810 15,810 15,810 15,810 15,810 15,810591 1 32,093 32,093 35,401 35,401 39,693 39,693 40,955 40,955 41,970 42,362591 2 28,788 28,788 32,093 32,093 36,356 36,356 37,634 37,634 38,618 38,979591 3 25,454 25,454 28,788 28,788 33,021 33,021 34,299 34,299 35,236 35,567591 4 21,989 21,989 21,989 21,989 21,989 21,989 21,989 21,989 22,197 22,404591 5 20,306 20,306 20,306 20,306 20,306 20,306 20,306 20,306 20,500 20,691592 1 31,409 31,874 34,452 35,224 38,704 39,325 40,102 40,723 41,067 42,337
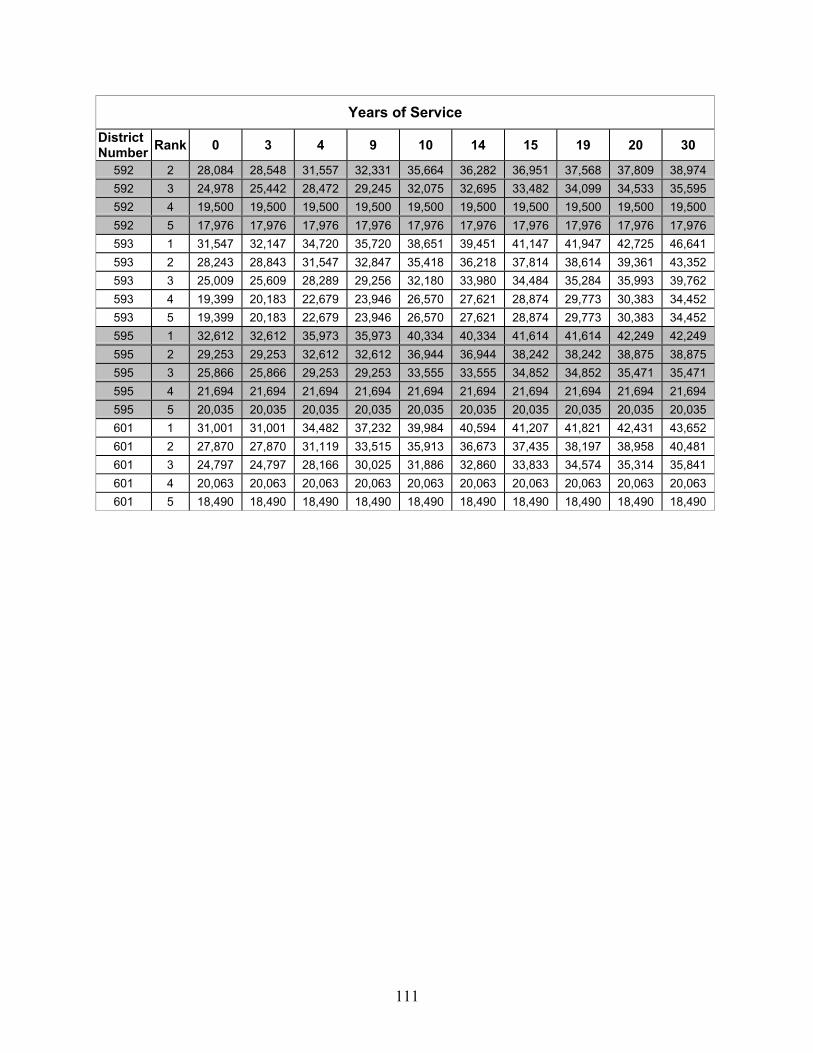
111
Years of ServiceDistrictNumber Rank 0 3 4 9 10 14 15 19 20 30
592 2 28,084 28,548 31,557 32,331 35,664 36,282 36,951 37,568 37,809 38,974592 3 24,978 25,442 28,472 29,245 32,075 32,695 33,482 34,099 34,533 35,595592 4 19,500 19,500 19,500 19,500 19,500 19,500 19,500 19,500 19,500 19,500592 5 17,976 17,976 17,976 17,976 17,976 17,976 17,976 17,976 17,976 17,976593 1 31,547 32,147 34,720 35,720 38,651 39,451 41,147 41,947 42,725 46,641593 2 28,243 28,843 31,547 32,847 35,418 36,218 37,814 38,614 39,361 43,352593 3 25,009 25,609 28,289 29,256 32,180 33,980 34,484 35,284 35,993 39,762593 4 19,399 20,183 22,679 23,946 26,570 27,621 28,874 29,773 30,383 34,452593 5 19,399 20,183 22,679 23,946 26,570 27,621 28,874 29,773 30,383 34,452595 1 32,612 32,612 35,973 35,973 40,334 40,334 41,614 41,614 42,249 42,249595 2 29,253 29,253 32,612 32,612 36,944 36,944 38,242 38,242 38,875 38,875595 3 25,866 25,866 29,253 29,253 33,555 33,555 34,852 34,852 35,471 35,471595 4 21,694 21,694 21,694 21,694 21,694 21,694 21,694 21,694 21,694 21,694595 5 20,035 20,035 20,035 20,035 20,035 20,035 20,035 20,035 20,035 20,035601 1 31,001 31,001 34,482 37,232 39,984 40,594 41,207 41,821 42,431 43,652601 2 27,870 27,870 31,119 33,515 35,913 36,673 37,435 38,197 38,958 40,481601 3 24,797 24,797 28,166 30,025 31,886 32,860 33,833 34,574 35,314 35,841601 4 20,063 20,063 20,063 20,063 20,063 20,063 20,063 20,063 20,063 20,063601 5 18,490 18,490 18,490 18,490 18,490 18,490 18,490 18,490 18,490 18,490

112
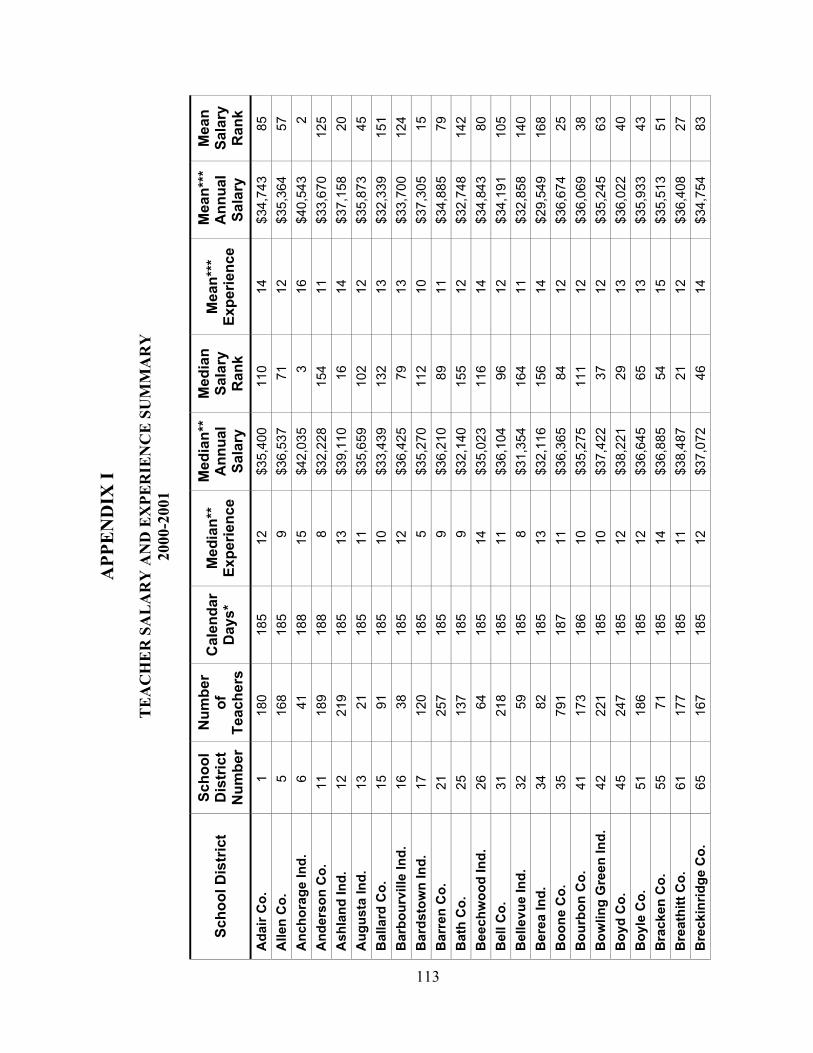
113
APP
EN
DIX
I
TE
AC
HE
R S
AL
AR
Y A
ND
EX
PER
IEN
CE
SU
MM
AR
Y20
00-2
001
Scho
ol D
istr
ict
Scho
olD
istr
ict
Num
ber
Num
ber
ofTe
ache
rsC
alen
dar
Day
s*M
edia
n**
Expe
rienc
eM
edia
n**
Ann
ual
Sala
ry
Med
ian
Sala
ryR
ank
Mea
n***
Expe
rienc
e M
ean*
**A
nnua
lSa
lary
Mea
nSa
lary
Ran
kA
dair
Co.
118
018
512
$35,
400
110
14$3
4,74
385
Alle
n C
o.5
168
185
9$3
6,53
771
12$3
5,36
457
Anc
hora
ge In
d.6
4118
815
$42,
035
316
$40,
543
2A
nder
son
Co.
1118
918
88
$32,
228
154
11$3
3,67
012
5A
shla
nd In
d.12
219
185
13$3
9,11
016
14$3
7,15
820
Aug
usta
Ind.
1321
185
11$3
5,65
910
212
$35,
873
45B
alla
rd C
o.15
9118
510
$33,
439
132
13$3
2,33
915
1B
arbo
urvi
lle In
d.16
3818
512
$36,
425
7913
$33,
700
124
Bar
dsto
wn
Ind.
1712
018
55
$35,
270
112
10$3
7,30
515
Bar
ren
Co.
2125
718
59
$36,
210
8911
$34,
885
79B
ath
Co.
2513
718
59
$32,
140
155
12$3
2,74
814
2B
eech
woo
d In
d.26
6418
514
$35,
023
116
14$3
4,84
380
Bel
l Co.
3121
818
511
$36,
104
9612
$34,
191
105
Bel
levu
e In
d.32
5918
58
$31,
354
164
11$3
2,85
814
0B
erea
Ind.
3482
185
13$3
2,11
615
614
$29,
549
168
Boo
ne C
o.35
791
187
11$3
6,36
584
12$3
6,67
425
Bou
rbon
Co.
4117
318
610
$35,
275
111
12$3
6,06
938
Bow
ling
Gre
en In
d.42
221
185
10$3
7,42
237
12$3
5,24
563
Boy
d C
o.45
247
185
12$3
8,22
129
13$3
6,02
240
Boy
le C
o.51
186
185
12$3
6,64
565
13$3
5,93
343
Bra
cken
Co.
5571
185
14$3
6,88
554
15$3
5,51
351
Bre
athi
tt C
o.61
177
185
11$3
8,48
721
12$3
6,40
827
Bre
ckin
ridge
Co.
6516
718
512
$37,
072
4614
$34,
754
83
113

114
Scho
ol D
istr
ict
Scho
olD
istr
ict
Num
ber
Num
ber
ofTe
ache
rsC
alen
dar
Day
s*M
edia
n**
Expe
rienc
eM
edia
n**
Ann
ual
Sala
ry
Med
ian
Sala
ryR
ank
Mea
n***
Expe
rienc
e M
ean*
**A
nnua
lSa
lary
Mea
nSa
lary
Ran
kB
ullit
t Co.
7161
818
512
$40,
297
813
$39,
448
3B
urgi
n In
d.72
2618
52
$27,
064
173
7$2
8,63
617
0B
utle
r Co.
7515
818
510
$34,
700
118
11$3
3,99
811
2C
aldw
ell C
o.81
137
185
12$3
6,53
273
14$3
4,54
794
Cal
low
ay C
o.85
207
185
13$3
9,01
918
14$3
6,29
930
Cam
pbel
l Co.
9128
418
59
$33,
301
133
12$3
4,07
910
9C
ampb
ells
ville
Ind.
9295
185
10$3
2,68
014
511
$32,
157
155
Car
lisle
Co.
9560
185
13$3
5,71
810
014
$33,
785
120
Car
roll
Co.
101
121
185
13$3
6,90
052
12$3
6,36
628
Car
ter C
o.10
532
718
512
$36,
417
8113
$34,
313
101
Cas
ey C
o.11
117
518
511
$36,
535
7212
$33,
807
118
Cav
erna
Ind.
113
6418
511
$36,
148
9311
$34,
035
111
Chr
istia
n C
o.11
557
818
511
$36,
886
5313
$35,
289
60C
lark
Co.
121
321
185
13$3
7,28
340
14$3
6,07
737
Cla
y C
o.12
532
818
510
$36,
290
8512
$35,
044
73C
linto
n C
o.13
110
518
511
$36,
218
8812
$35,
133
68C
love
rpor
t Ind
.13
218
185
17$3
8,15
730
17$3
7,28
916
Cor
bin
Ind.
133
136
185
12$3
6,19
290
13$3
4,99
775
Cov
ingt
on In
d.13
435
319
011
$34,
794
117
12$3
5,03
774
Crit
tend
en C
o.13
510
018
511
$37,
080
4512
$35,
183
66C
umbe
rland
Co.
141
8418
510
$36,
503
7612
$34,
417
98D
anvi
lle In
d.14
313
718
513
$31,
798
159
14$3
1,90
015
8D
avie
ss C
o.14
565
018
511
$34,
563
119
13$3
4,99
576
Daw
son
Sprin
gs In
d.14
649
186
14$3
5,57
110
315
$33,
378
130
Day
ton
Ind.
147
8118
513
$40,
455
714
$38,
640
8Ea
st B
erns
tadt
Ind.
149
3118
510
$33,
690
127
11$3
3,64
212
6Ed
mon
son
Co.
151
127
185
10$3
6,27
986
12$3
4,24
210
3El
izab
etht
own
Ind.
152
138
185
9$3
2,92
414
111
$33,
970
113
114

115
Scho
ol D
istr
ict
Scho
olD
istr
ict
Num
ber
Num
ber
ofTe
ache
rsC
alen
dar
Day
s*M
edia
n**
Expe
rienc
eM
edia
n**
Ann
ual
Sala
ry
Med
ian
Sala
ryR
ank
Mea
n***
Expe
rienc
e M
ean*
**A
nnua
lSa
lary
Mea
nSa
lary
Ran
kEl
liott
Co.
155
8918
510
$35,
138
114
12$3
3,93
211
4Em
inen
ce In
d.15
643
185
7$2
7,62
317
19
$28,
246
173
Erla
nger
Ind.
157
141
187
8$3
2,99
914
011
$34,
196
104
Estil
l Co.
161
199
185
11$3
6,72
162
13$3
4,17
710
6Fa
irvie
w In
d.16
245
185
9$2
7,99
417
011
$28,
509
171
Faye
tte C
o.16
525
3619
012
$36,
776
5913
$36,
022
41Fl
emin
g C
o.17
115
018
511
$36,
923
5113
$35,
256
61Fl
oyd
Co.
175
445
185
10$3
7,41
938
11$3
4,72
686
Fort
Tho
mas
Ind.
176
148
188
11$3
4,51
512
013
$35,
757
48Fr
ankf
ort I
nd.
177
6818
515
$36,
250
8714
$34,
753
84Fr
ankl
in C
o.18
135
118
58
$32,
800
142
11$3
3,62
612
7Fu
lton
Co.
185
5318
517
$36,
852
5615
$34,
315
100
Fulto
n In
d.18
643
185
13$3
2,50
014
913
$29,
577
167
Gal
latin
Co.
191
9018
55
$28,
629
168
8$2
9,97
616
6G
arra
rd C
o.19
516
518
510
$32,
598
146
11$3
2,18
515
4G
lasg
ow In
d.19
713
818
514
$38,
460
2214
$36,
221
33G
rant
Co.
201
204
185
6$3
2,51
114
89
$32,
659
144
Gra
ves
Co.
205
242
185
10$3
6,85
057
12$3
4,91
478
Gra
yson
Co.
211
269
185
11$3
6,62
766
14$3
5,14
167
Gre
en C
o.21
511
518
58
$34,
094
124
11$3
2,44
814
7G
reen
up C
o.22
120
418
513
$36,
669
6314
$35,
247
62H
anco
ck C
o.22
510
818
510
$32,
704
144
12$3
3,83
211
7H
ardi
n C
o.23
178
418
510
$35,
923
9912
$36,
298
31H
arla
n C
o.23
535
118
510
$36,
004
9812
$35,
317
59H
arla
n In
d.23
665
185
13$3
5,18
311
315
$31,
691
161
Har
rison
Co.
241
198
185
10$3
6,13
194
12$3
4,56
492
Har
rods
burg
Ind.
242
6418
56
$31,
648
162
10$3
1,58
216
2H
art C
o.24
515
118
510
$36,
418
8012
$35,
096
70
115
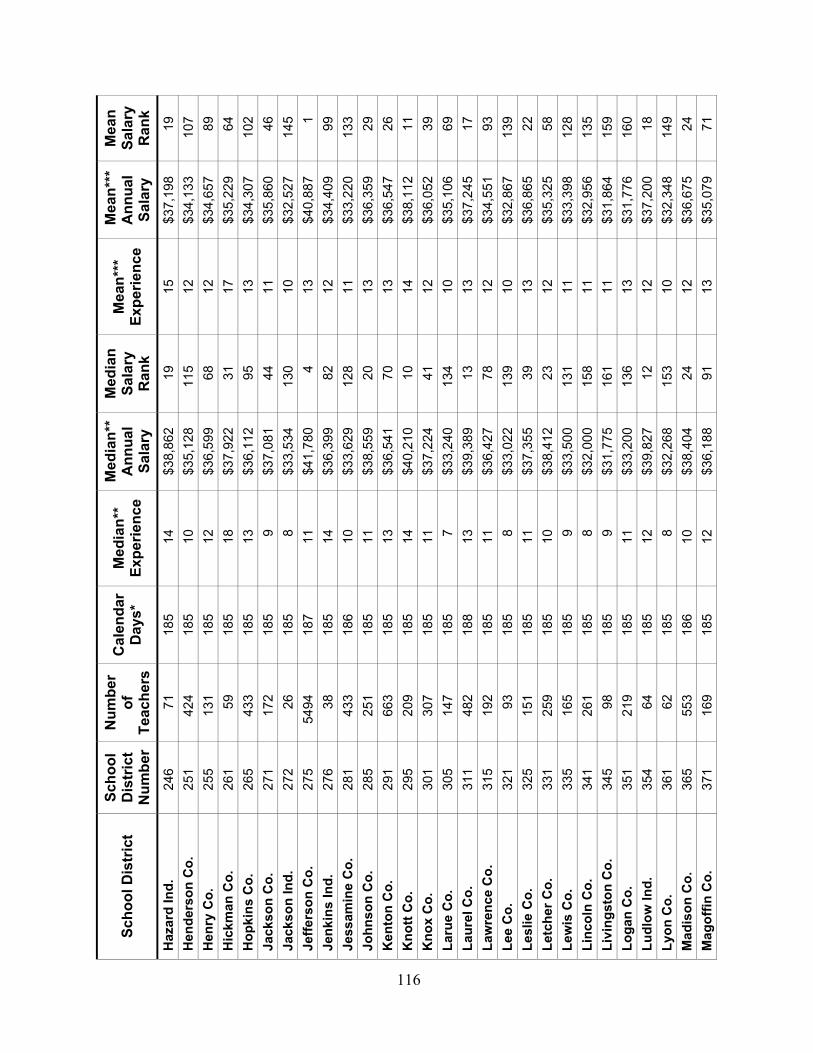
116
Scho
ol D
istr
ict
Scho
olD
istr
ict
Num
ber
Num
ber
ofTe
ache
rsC
alen
dar
Day
s*M
edia
n**
Expe
rienc
eM
edia
n**
Ann
ual
Sala
ry
Med
ian
Sala
ryR
ank
Mea
n***
Expe
rienc
e M
ean*
**A
nnua
lSa
lary
Mea
nSa
lary
Ran
kH
azar
d In
d.24
671
185
14$3
8,86
219
15$3
7,19
819
Hen
ders
on C
o.25
142
418
510
$35,
128
115
12$3
4,13
310
7H
enry
Co.
255
131
185
12$3
6,59
968
12$3
4,65
789
Hic
kman
Co.
261
5918
518
$37,
922
3117
$35,
229
64H
opki
ns C
o.26
543
318
513
$36,
112
9513
$34,
307
102
Jack
son
Co.
271
172
185
9$3
7,08
144
11$3
5,86
046
Jack
son
Ind.
272
2618
58
$33,
534
130
10$3
2,52
714
5Je
ffers
on C
o.27
554
9418
711
$41,
780
413
$40,
887
1Je
nkin
s In
d.27
638
185
14$3
6,39
982
12$3
4,40
999
Jess
amin
e C
o.28
143
318
610
$33,
629
128
11$3
3,22
013
3Jo
hnso
n C
o.28
525
118
511
$38,
559
2013
$36,
359
29K
ento
n C
o.29
166
318
513
$36,
541
7013
$36,
547
26K
nott
Co.
295
209
185
14$4
0,21
010
14$3
8,11
211
Kno
x C
o.30
130
718
511
$37,
224
4112
$36,
052
39La
rue
Co.
305
147
185
7$3
3,24
013
410
$35,
106
69La
urel
Co.
311
482
188
13$3
9,38
913
13$3
7,24
517
Law
renc
e C
o.31
519
218
511
$36,
427
7812
$34,
551
93Le
e C
o.32
193
185
8$3
3,02
213
910
$32,
867
139
Lesl
ie C
o.32
515
118
511
$37,
355
3913
$36,
865
22Le
tche
r Co.
331
259
185
10$3
8,41
223
12$3
5,32
558
Lew
is C
o.33
516
518
59
$33,
500
131
11$3
3,39
812
8Li
ncol
n C
o.34
126
118
58
$32,
000
158
11$3
2,95
613
5Li
ving
ston
Co.
345
9818
59
$31,
775
161
11$3
1,86
415
9Lo
gan
Co.
351
219
185
11$3
3,20
013
613
$31,
776
160
Ludl
ow In
d.35
464
185
12$3
9,82
712
12$3
7,20
018
Lyon
Co.
361
6218
58
$32,
268
153
10$3
2,34
814
9M
adis
on C
o.36
555
318
610
$38,
404
2412
$36,
675
24M
agof
fin C
o.37
116
918
512
$36,
188
9113
$35,
079
71
116
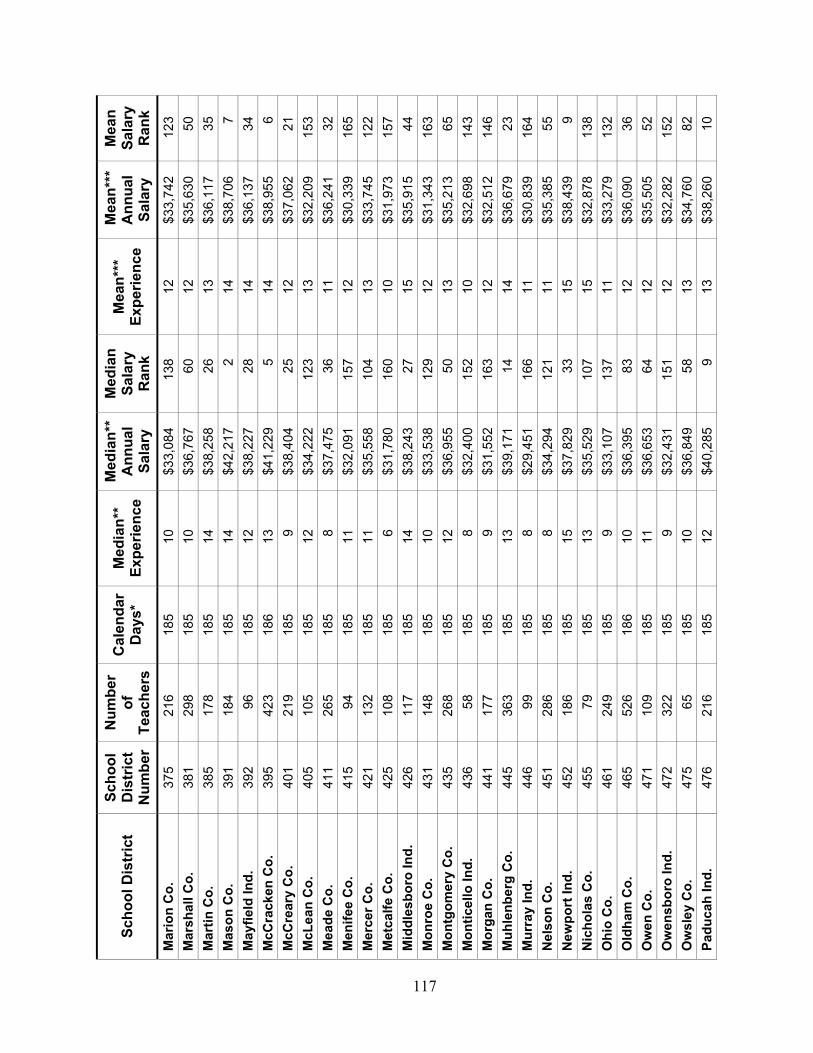
117
Scho
ol D
istr
ict
Scho
olD
istr
ict
Num
ber
Num
ber
ofTe
ache
rsC
alen
dar
Day
s*M
edia
n**
Expe
rienc
eM
edia
n**
Ann
ual
Sala
ry
Med
ian
Sala
ryR
ank
Mea
n***
Expe
rienc
e M
ean*
**A
nnua
lSa
lary
Mea
nSa
lary
Ran
kM
ario
n C
o.37
521
618
510
$33,
084
138
12$3
3,74
212
3M
arsh
all C
o.38
129
818
510
$36,
767
6012
$35,
630
50M
artin
Co.
385
178
185
14$3
8,25
826
13$3
6,11
735
Mas
on C
o.39
118
418
514
$42,
217
214
$38,
706
7M
ayfie
ld In
d.39
296
185
12$3
8,22
728
14$3
6,13
734
McC
rack
en C
o.39
542
318
613
$41,
229
514
$38,
955
6M
cCre
ary
Co.
401
219
185
9$3
8,40
425
12$3
7,06
221
McL
ean
Co.
405
105
185
12$3
4,22
212
313
$32,
209
153
Mea
de C
o.41
126
518
58
$37,
475
3611
$36,
241
32M
enife
e C
o.41
594
185
11$3
2,09
115
712
$30,
339
165
Mer
cer C
o.42
113
218
511
$35,
558
104
13$3
3,74
512
2M
etca
lfe C
o.42
510
818
56
$31,
780
160
10$3
1,97
315
7M
iddl
esbo
ro In
d.42
611
718
514
$38,
243
2715
$35,
915
44M
onro
e C
o.43
114
818
510
$33,
538
129
12$3
1,34
316
3M
ontg
omer
y C
o.43
526
818
512
$36,
955
5013
$35,
213
65M
ontic
ello
Ind.
436
5818
58
$32,
400
152
10$3
2,69
814
3M
orga
n C
o.44
117
718
59
$31,
552
163
12$3
2,51
214
6M
uhle
nber
g C
o.44
536
318
513
$39,
171
1414
$36,
679
23M
urra
y In
d.44
699
185
8$2
9,45
116
611
$30,
839
164
Nel
son
Co.
451
286
185
8$3
4,29
412
111
$35,
385
55N
ewpo
rt In
d.45
218
618
515
$37,
829
3315
$38,
439
9N
icho
las
Co.
455
7918
513
$35,
529
107
15$3
2,87
813
8O
hio
Co.
461
249
185
9$3
3,10
713
711
$33,
279
132
Old
ham
Co.
465
526
186
10$3
6,39
583
12$3
6,09
036
Ow
en C
o.47
110
918
511
$36,
653
6412
$35,
505
52O
wen
sbor
o In
d.47
232
218
59
$32,
431
151
12$3
2,28
215
2O
wsl
ey C
o.47
565
185
10$3
6,84
958
13$3
4,76
082
Padu
cah
Ind.
476
216
185
12$4
0,28
59
13$3
8,26
010
117
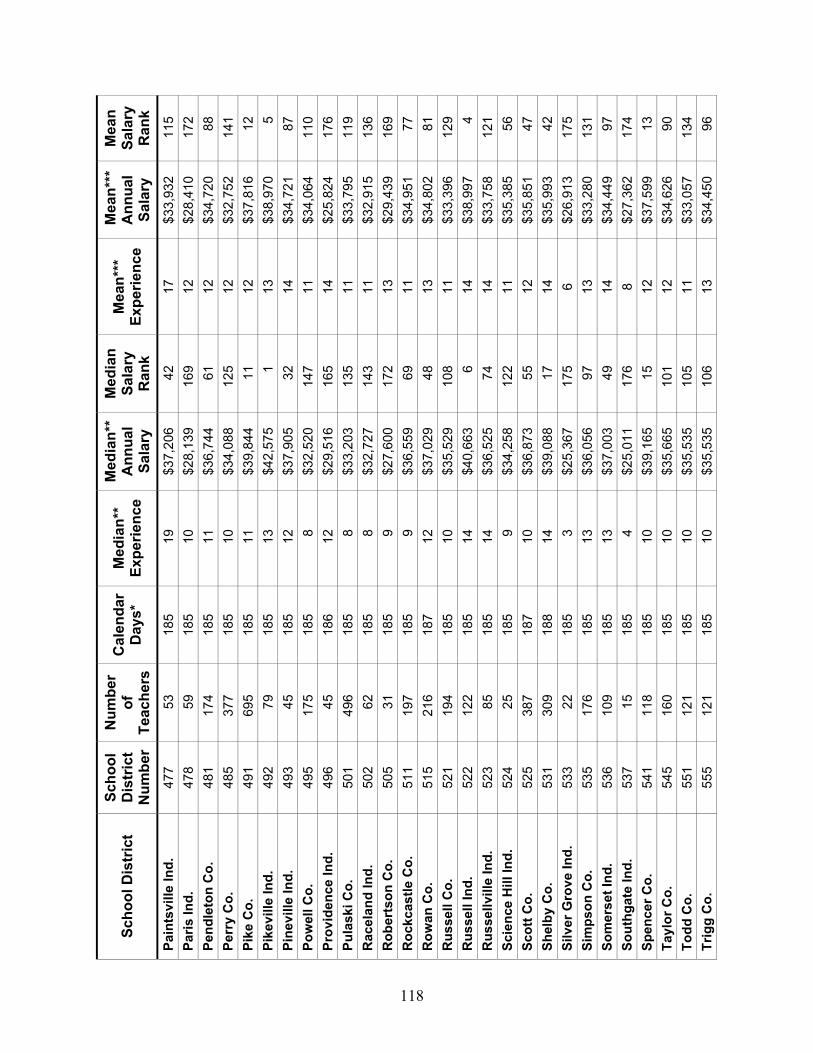
118
Scho
ol D
istr
ict
Scho
olD
istr
ict
Num
ber
Num
ber
ofTe
ache
rsC
alen
dar
Day
s*M
edia
n**
Expe
rienc
eM
edia
n**
Ann
ual
Sala
ry
Med
ian
Sala
ryR
ank
Mea
n***
Expe
rienc
e M
ean*
**A
nnua
lSa
lary
Mea
nSa
lary
Ran
kPa
ints
ville
Ind.
477
5318
519
$37,
206
4217
$33,
932
115
Paris
Ind.
478
5918
510
$28,
139
169
12$2
8,41
017
2Pe
ndle
ton
Co.
481
174
185
11$3
6,74
461
12$3
4,72
088
Perr
y C
o.48
537
718
510
$34,
088
125
12$3
2,75
214
1Pi
ke C
o.49
169
518
511
$39,
844
1112
$37,
816
12Pi
kevi
lle In
d.49
279
185
13$4
2,57
51
13$3
8,97
05
Pine
ville
Ind.
493
4518
512
$37,
905
3214
$34,
721
87Po
wel
l Co.
495
175
185
8$3
2,52
014
711
$34,
064
110
Prov
iden
ce In
d.49
645
186
12$2
9,51
616
514
$25,
824
176
Pula
ski C
o.50
149
618
58
$33,
203
135
11$3
3,79
511
9R
acel
and
Ind.
502
6218
58
$32,
727
143
11$3
2,91
513
6R
ober
tson
Co.
505
3118
59
$27,
600
172
13$2
9,43
916
9R
ockc
astle
Co.
511
197
185
9$3
6,55
969
11$3
4,95
177
Row
an C
o.51
521
618
712
$37,
029
4813
$34,
802
81R
usse
ll C
o.52
119
418
510
$35,
529
108
11$3
3,39
612
9R
usse
ll In
d.52
212
218
514
$40,
663
614
$38,
997
4R
usse
llvill
e In
d.52
385
185
14$3
6,52
574
14$3
3,75
812
1Sc
ienc
e H
ill In
d.52
425
185
9$3
4,25
812
211
$35,
385
56Sc
ott C
o.52
538
718
710
$36,
873
5512
$35,
851
47Sh
elby
Co.
531
309
188
14$3
9,08
817
14$3
5,99
342
Silv
er G
rove
Ind.
533
2218
53
$25,
367
175
6$2
6,91
317
5Si
mps
on C
o.53
517
618
513
$36,
056
9713
$33,
280
131
Som
erse
t Ind
.53
610
918
513
$37,
003
4914
$34,
449
97So
uthg
ate
Ind.
537
1518
54
$25,
011
176
8$2
7,36
217
4Sp
ence
r Co.
541
118
185
10$3
9,16
515
12$3
7,59
913
Tayl
or C
o.54
516
018
510
$35,
665
101
12$3
4,62
690
Todd
Co.
551
121
185
10$3
5,53
510
511
$33,
057
134
Trig
g C
o.55
512
118
510
$35,
535
106
13$3
4,45
096
118
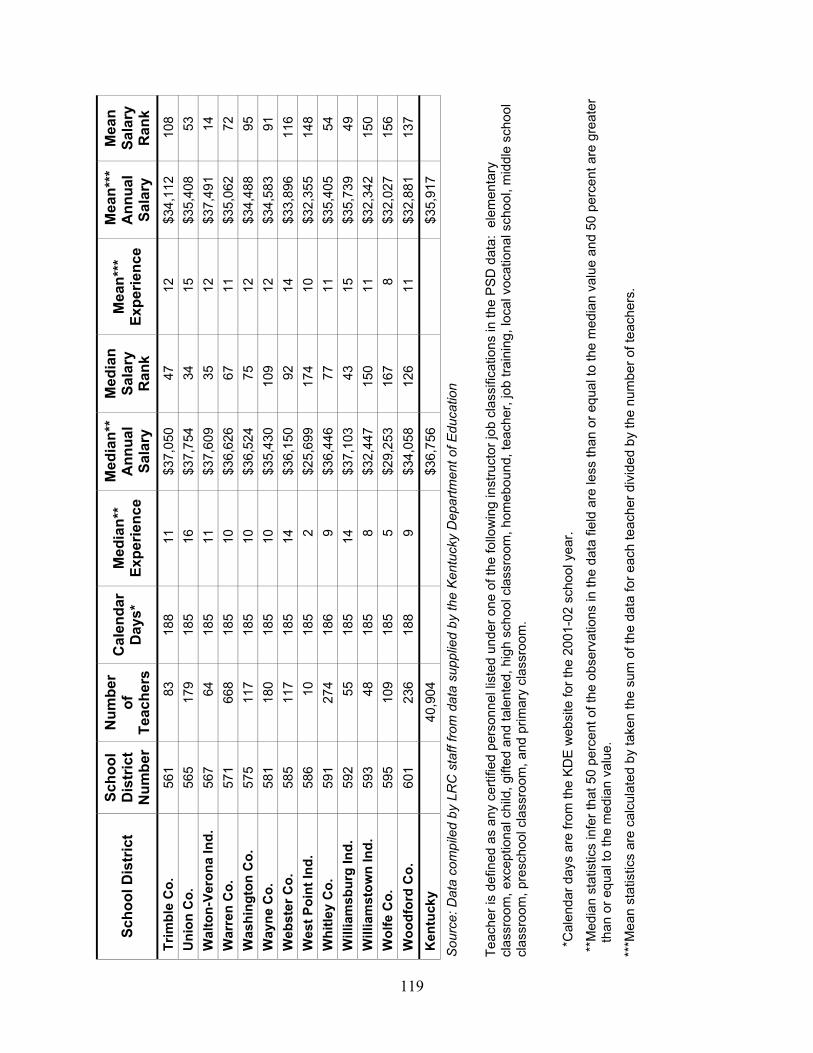
119
Scho
ol D
istr
ict
Scho
olD
istr
ict
Num
ber
Num
ber
ofTe
ache
rsC
alen
dar
Day
s*M
edia
n**
Expe
rienc
eM
edia
n**
Ann
ual
Sala
ry
Med
ian
Sala
ryR
ank
Mea
n***
Expe
rienc
e M
ean*
**A
nnua
lSa
lary
Mea
nSa
lary
Ran
kTr
imbl
e C
o.56
183
188
11$3
7,05
047
12$3
4,11
210
8U
nion
Co.
565
179
185
16$3
7,75
434
15$3
5,40
853
Wal
ton-
Vero
na In
d.56
764
185
11$3
7,60
935
12$3
7,49
114
War
ren
Co.
571
668
185
10$3
6,62
667
11$3
5,06
272
Was
hing
ton
Co.
575
117
185
10$3
6,52
475
12$3
4,48
895
Way
ne C
o.58
118
018
510
$35,
430
109
12$3
4,58
391
Web
ster
Co.
585
117
185
14$3
6,15
092
14$3
3,89
611
6W
est P
oint
Ind.
586
1018
52
$25,
699
174
10$3
2,35
514
8W
hitle
y C
o.59
127
418
69
$36,
446
7711
$35,
405
54W
illia
msb
urg
Ind.
592
5518
514
$37,
103
4315
$35,
739
49W
illia
mst
own
Ind.
593
4818
58
$32,
447
150
11$3
2,34
215
0W
olfe
Co.
595
109
185
5$2
9,25
316
78
$32,
027
156
Woo
dfor
d C
o.60
123
618
89
$34,
058
126
11$3
2,88
113
7K
entu
cky
40,9
04$3
6,75
6$3
5,91
7S
ourc
e: D
ata
com
pile
d by
LR
C s
taff
from
dat
a su
pplie
d by
the
Ken
tuck
y D
epar
tmen
t of E
duca
tion
Teac
her i
s de
fined
as
any
certi
fied
pers
onne
l lis
ted
unde
r one
of t
he fo
llow
ing
inst
ruct
or jo
b cl
assi
ficat
ions
in th
e P
SD
dat
a: e
lem
enta
rycl
assr
oom
, exc
eptio
nal c
hild
, gift
ed a
nd ta
lent
ed, h
igh
scho
ol c
lass
room
, hom
ebou
nd, t
each
er, j
ob tr
aini
ng, l
ocal
voc
atio
nal s
choo
l, m
iddl
e sc
hool
clas
sroo
m, p
resc
hool
cla
ssro
om, a
nd p
rimar
y cl
assr
oom
.
TeaT
each
er
***C
alen
dar d
ays
are
from
the
KD
E w
ebsi
te fo
r the
200
1-02
sch
ool y
ear.
***M
edia
n st
atis
tics
infe
r tha
t 50
perc
ent o
f the
obs
erva
tions
in th
e da
ta fi
eld
are
less
than
or e
qual
to th
e m
edia
n va
lue
and
50 p
erce
nt a
re g
reat
erth
an o
r equ
al to
the
med
ian
valu
e.
***M
ean
stat
istic
s ar
e ca
lcul
ated
by
take
n th
e su
m o
f the
dat
a fo
r eac
h te
ache
r div
ided
by
the
num
ber o
f tea
cher
s.
119

120
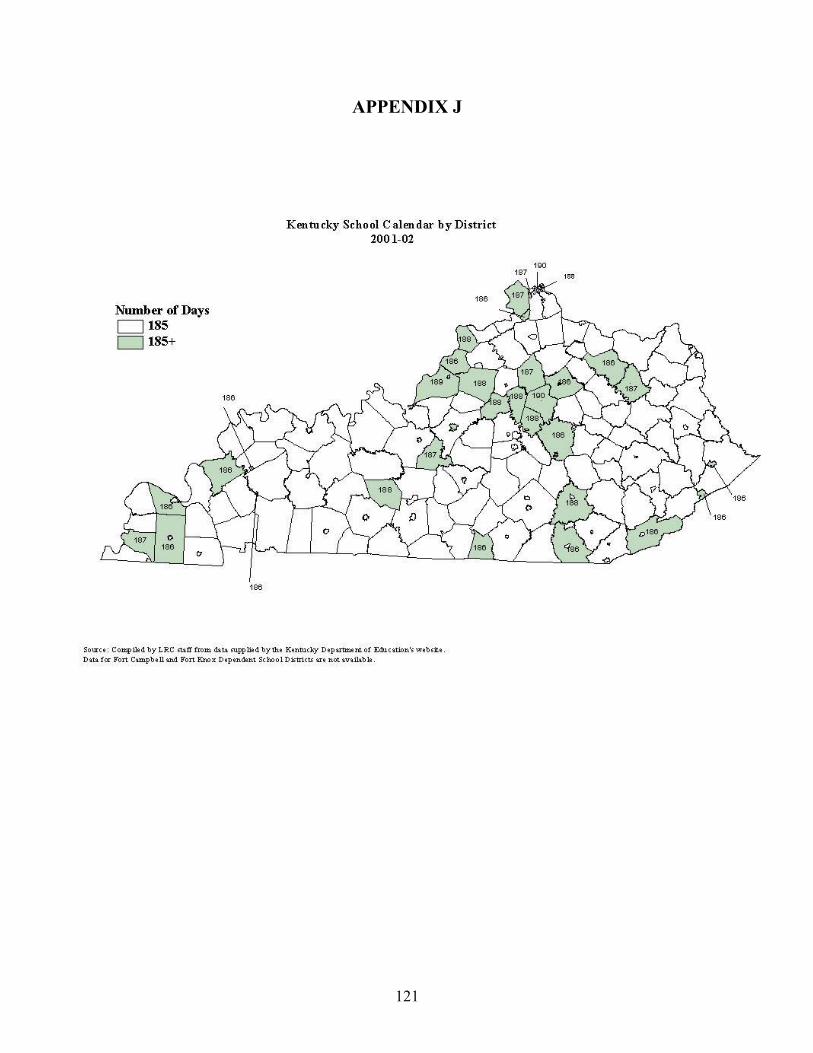
121
APPENDIX J

122
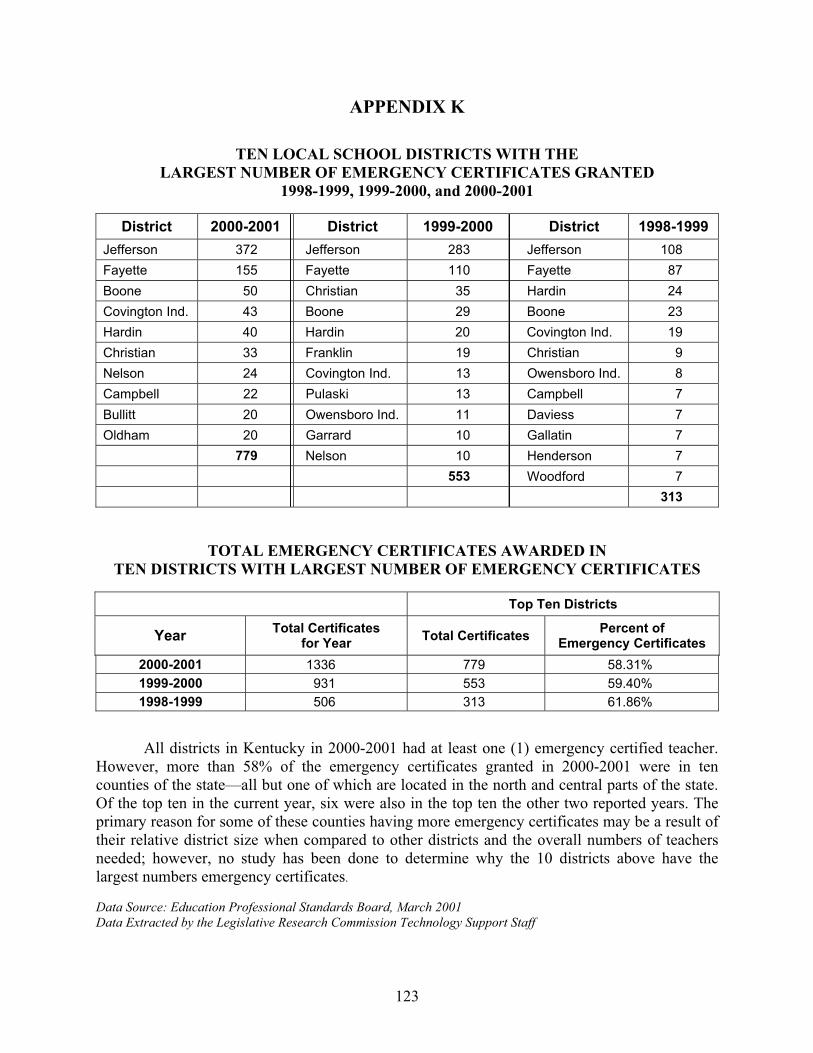
123
APPENDIX K
TEN LOCAL SCHOOL DISTRICTS WITH THELARGEST NUMBER OF EMERGENCY CERTIFICATES GRANTED
1998-1999, 1999-2000, and 2000-2001
District 2000-2001 District 1999-2000 District 1998-1999Jefferson 372 Jefferson 283 Jefferson 108Fayette 155 Fayette 110 Fayette 87Boone 50 Christian 35 Hardin 24Covington Ind. 43 Boone 29 Boone 23Hardin 40 Hardin 20 Covington Ind. 19Christian 33 Franklin 19 Christian 9Nelson 24 Covington Ind. 13 Owensboro Ind. 8Campbell 22 Pulaski 13 Campbell 7Bullitt 20 Owensboro Ind. 11 Daviess 7Oldham 20 Garrard 10 Gallatin 7
779 Nelson 10 Henderson 7553 Woodford 7
313
TOTAL EMERGENCY CERTIFICATES AWARDED INTEN DISTRICTS WITH LARGEST NUMBER OF EMERGENCY CERTIFICATES
Top Ten Districts
Year Total Certificatesfor Year Total Certificates Percent of
Emergency Certificates2000-2001 1336 779 58.31%1999-2000 931 553 59.40%1998-1999 506 313 61.86%
All districts in Kentucky in 2000-2001 had at least one (1) emergency certified teacher.However, more than 58% of the emergency certificates granted in 2000-2001 were in tencounties of the state—all but one of which are located in the north and central parts of the state.Of the top ten in the current year, six were also in the top ten the other two reported years. Theprimary reason for some of these counties having more emergency certificates may be a result oftheir relative district size when compared to other districts and the overall numbers of teachersneeded; however, no study has been done to determine why the 10 districts above have thelargest numbers emergency certificates.
Data Source: Education Professional Standards Board, March 2001Data Extracted by the Legislative Research Commission Technology Support Staff

124
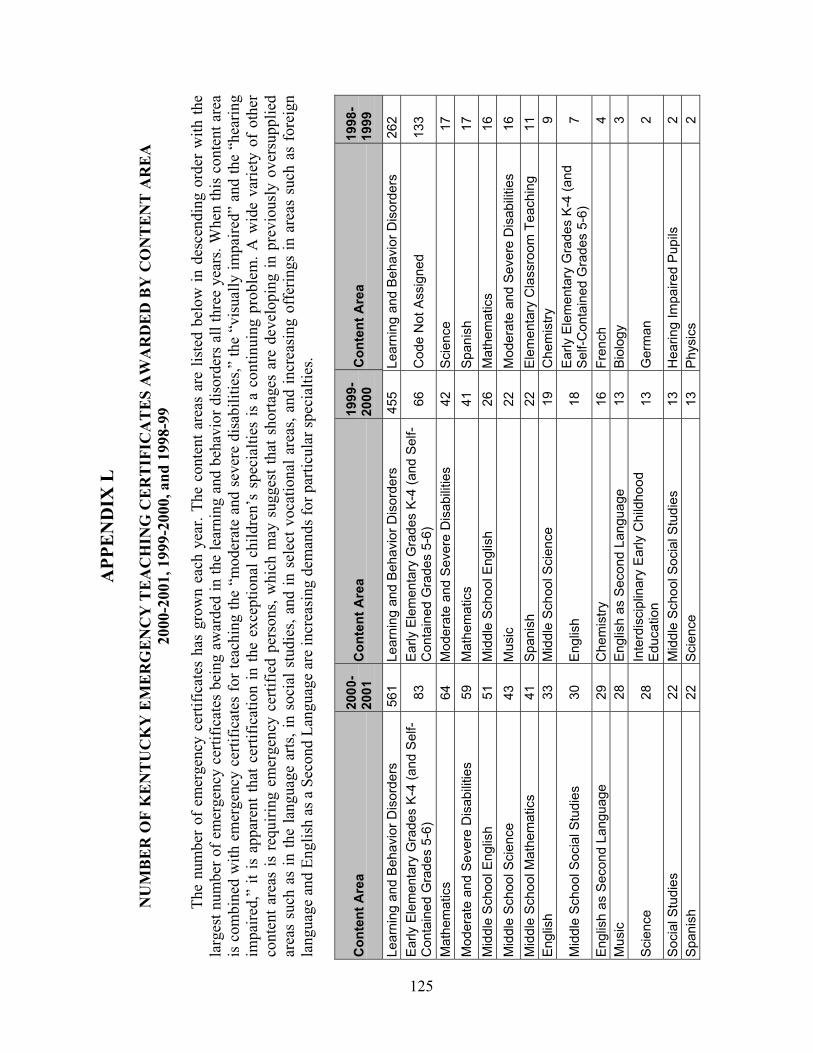
125
APP
EN
DIX
L
NU
MB
ER
OF
KE
NT
UC
KY
EM
ER
GE
NC
Y T
EA
CH
ING
CE
RT
IFIC
AT
ES
AW
AR
DE
D B
Y C
ON
TE
NT
AR
EA
2000
-200
1, 1
999-
2000
, and
199
8-99
The
num
ber
of e
mer
genc
y ce
rtific
ates
has
gro
wn
each
yea
r. Th
e co
nten
t are
as a
re li
sted
bel
ow in
des
cend
ing
orde
r w
ith th
ela
rges
t num
ber o
f em
erge
ncy
certi
ficat
es b
eing
aw
arde
d in
the
lear
ning
and
beh
avio
r dis
orde
rs a
ll th
ree
year
s. W
hen
this
con
tent
are
ais
com
bine
d w
ith e
mer
genc
y ce
rtific
ates
for t
each
ing
the
“mod
erat
e an
d se
vere
dis
abili
ties,”
the
“vis
ually
impa
ired”
and
the
“hea
ring
impa
ired,
” it
is a
ppar
ent t
hat c
ertif
icat
ion
in th
e ex
cept
iona
l chi
ldre
n’s
spec
ialti
es is
a c
ontin
uing
pro
blem
. A w
ide
varie
ty o
f ot
her
cont
ent a
reas
is r
equi
ring
emer
genc
y ce
rtifie
d pe
rson
s, w
hich
may
sug
gest
that
sho
rtage
s ar
e de
velo
ping
in p
revi
ousl
y ov
ersu
pplie
dar
eas
such
as
in th
e la
ngua
ge a
rts, i
n so
cial
stu
dies
, and
in s
elec
t voc
atio
nal a
reas
, and
incr
easi
ng o
ffer
ings
in a
reas
suc
h as
for
eign
lang
uage
and
Eng
lish
as a
Sec
ond
Lang
uage
are
incr
easi
ng d
eman
ds fo
r par
ticul
ar sp
ecia
lties
.
Con
tent
Are
a20
00-
2001
Con
tent
Are
a19
99-
2000
Con
tent
Are
a19
98-
1999
Lear
ning
and
Beh
avio
r Dis
orde
rs56
1Le
arni
ng a
nd B
ehav
ior D
isor
ders
455
Lear
ning
and
Beh
avio
r Dis
orde
rs26
2E
arly
Ele
men
tary
Gra
des
K-4
(and
Sel
f-C
onta
ined
Gra
des
5-6)
83E
arly
Ele
men
tary
Gra
des
K-4
(and
Sel
f-C
onta
ined
Gra
des
5-6)
66C
ode
Not
Ass
igne
d13
3
Mat
hem
atic
s64
Mod
erat
e an
d S
ever
e D
isab
ilitie
s42
Sci
ence
17M
oder
ate
and
Sev
ere
Dis
abili
ties
59M
athe
mat
ics
41S
pani
sh17
Mid
dle
Sch
ool E
nglis
h51
Mid
dle
Sch
ool E
nglis
h26
Mat
hem
atic
s16
Mid
dle
Sch
ool S
cien
ce43
Mus
ic22
Mod
erat
e an
d S
ever
e D
isab
ilitie
s16
Mid
dle
Sch
ool M
athe
mat
ics
41S
pani
sh22
Ele
men
tary
Cla
ssro
om T
each
ing
11E
nglis
h33
Mid
dle
Sch
ool S
cien
ce19
Che
mis
try9
Mid
dle
Sch
ool S
ocia
l Stu
dies
30E
nglis
h18
Ear
ly E
lem
enta
ry G
rade
s K
-4 (a
ndS
elf-C
onta
ined
Gra
des
5-6)
7
Eng
lish
as S
econ
d La
ngua
ge29
Che
mis
try16
Fren
ch4
Mus
ic28
Eng
lish
as S
econ
d La
ngua
ge13
Bio
logy
3
Sci
ence
28In
terd
isci
plin
ary
Ear
ly C
hild
hood
Edu
catio
n13
Ger
man
2
Soc
ial S
tudi
es22
Mid
dle
Sch
ool S
ocia
l Stu
dies
13H
earin
g Im
paire
d P
upils
2S
pani
sh22
Sci
ence
13P
hysi
cs2
125
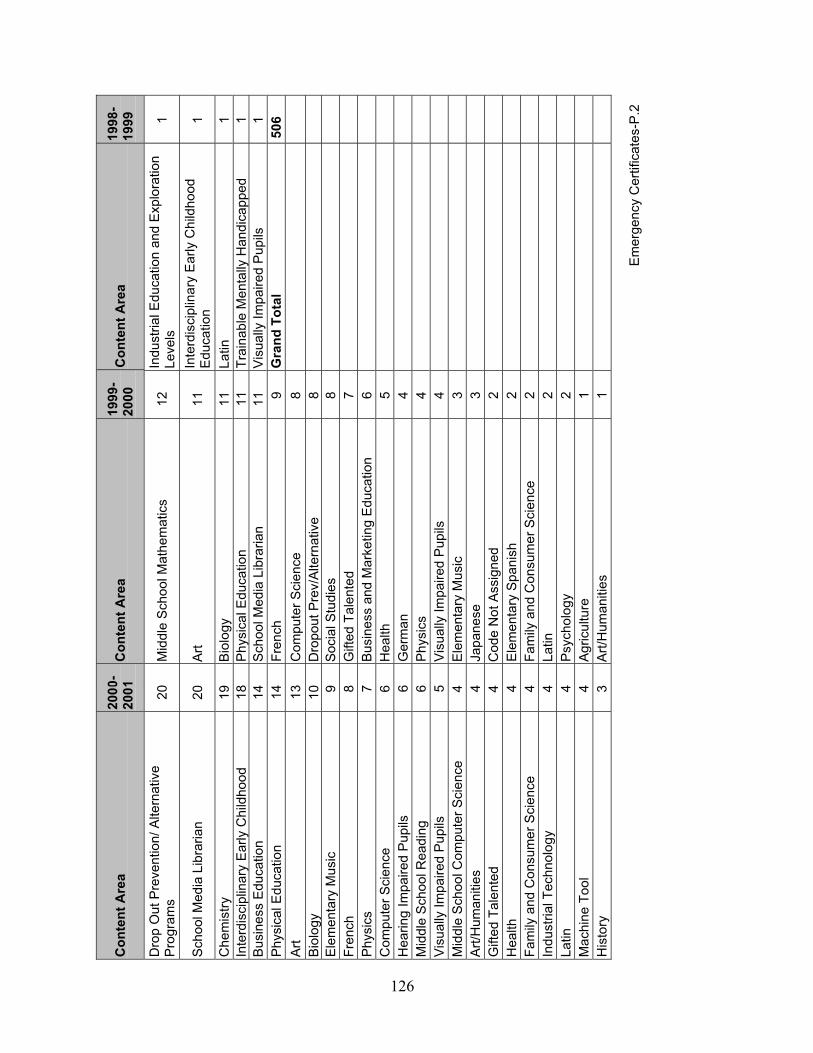
126
Con
tent
Are
a20
00-
2001
Con
tent
Are
a19
99-
2000
Con
tent
Are
a19
98-
1999
Dro
p O
ut P
reve
ntio
n/ A
ltern
ativ
eP
rogr
ams
20M
iddl
e S
choo
l Mat
hem
atic
s12
Indu
stria
l Edu
catio
n an
d E
xplo
ratio
nLe
vels
1
Sch
ool M
edia
Lib
raria
n20
Art
11In
terd
isci
plin
ary
Ear
ly C
hild
hood
Edu
catio
n1
Che
mis
try19
Bio
logy
11La
tin1
Inte
rdis
cipl
inar
y E
arly
Chi
ldho
od18
Phy
sica
l Edu
catio
n11
Trai
nabl
e M
enta
lly H
andi
capp
ed1
Bus
ines
s E
duca
tion
14S
choo
l Med
ia L
ibra
rian
11V
isua
lly Im
paire
d P
upils
1P
hysi
cal E
duca
tion
14Fr
ench
9G
rand
Tot
al50
6A
rt13
Com
pute
r Sci
ence
8B
iolo
gy10
Dro
pout
Pre
v/A
ltern
ativ
e8
Ele
men
tary
Mus
ic9
Soc
ial S
tudi
es8
Fren
ch8
Gift
ed T
alen
ted
7P
hysi
cs7
Bus
ines
s an
d M
arke
ting
Edu
catio
n6
Com
pute
r Sci
ence
6H
ealth
5H
earin
g Im
paire
d P
upils
6G
erm
an4
Mid
dle
Sch
ool R
eadi
ng6
Phy
sics
4V
isua
lly Im
paire
d P
upils
5V
isua
lly Im
paire
d P
upils
4M
iddl
e S
choo
l Com
pute
r Sci
ence
4E
lem
enta
ry M
usic
3A
rt/H
uman
ities
4Ja
pane
se3
Gift
ed T
alen
ted
4C
ode
Not
Ass
igne
d2
Hea
lth4
Ele
men
tary
Spa
nish
2Fa
mily
and
Con
sum
er S
cien
ce4
Fam
ily a
nd C
onsu
mer
Sci
ence
2In
dust
rial T
echn
olog
y4
Latin
2La
tin4
Psy
chol
ogy
2M
achi
ne T
ool
4A
gric
ultu
re1
His
tory
3A
rt/H
uman
ities
1
E
mer
genc
y C
ertif
icat
es-P
.2
126
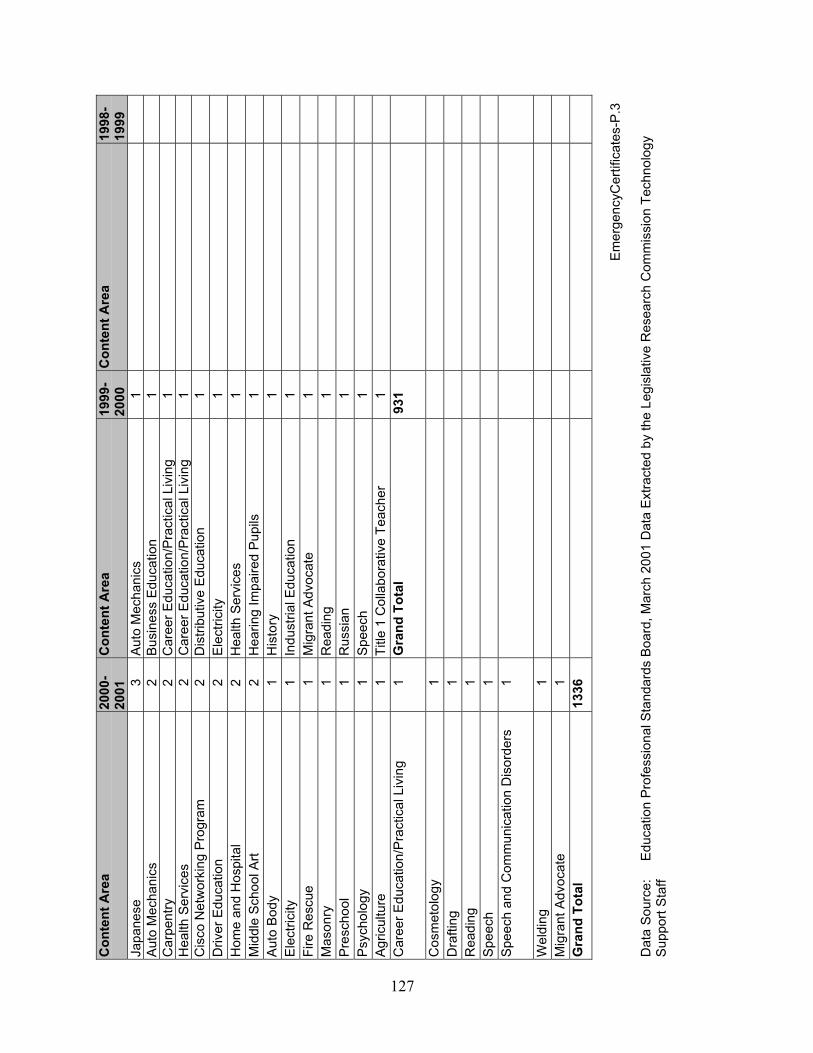
127
Con
tent
Are
a20
00-
2001
Con
tent
Are
a19
99-
2000
Con
tent
Are
a19
98-
1999
Japa
nese
3A
uto
Mec
hani
cs1
Aut
o M
echa
nics
2B
usin
ess
Edu
catio
n1
Car
pent
ry2
Car
eer E
duca
tion/
Pra
ctic
al L
ivin
g1
Hea
lth S
ervi
ces
2C
aree
r Edu
catio
n/P
ract
ical
Liv
ing
1C
isco
Net
wor
king
Pro
gram
2D
istri
butiv
e E
duca
tion
1D
river
Edu
catio
n2
Ele
ctric
ity1
Hom
e an
d H
ospi
tal
2H
ealth
Ser
vice
s1
Mid
dle
Sch
ool A
rt2
Hea
ring
Impa
ired
Pup
ils1
Aut
o B
ody
1H
isto
ry1
Ele
ctric
ity1
Indu
stria
l Edu
catio
n1
Fire
Res
cue
1M
igra
nt A
dvoc
ate
1M
ason
ry1
Rea
ding
1P
resc
hool
1R
ussi
an1
Psy
chol
ogy
1S
peec
h1
Agr
icul
ture
1Ti
tle 1
Col
labo
rativ
e Te
ache
r1
Car
eer E
duca
tion/
Pra
ctic
al L
ivin
g1
Gra
nd T
otal
931
Cos
met
olog
y1
Dra
fting
1R
eadi
ng1
Spe
ech
1S
peec
h an
d C
omm
unic
atio
n D
isor
ders
1
Wel
ding
1M
igra
nt A
dvoc
ate
1G
rand
Tot
al13
36
Em
erge
ncyC
ertif
icat
es-P
.3
Dat
a S
ourc
e:E
duca
tion
Pro
fess
iona
l Sta
ndar
ds B
oard
, Mar
ch 2
001
Dat
a E
xtra
cted
by
the
Legi
slat
ive
Res
earc
h C
omm
issi
on T
echn
olog
yS
uppo
rt S
taff
127

128
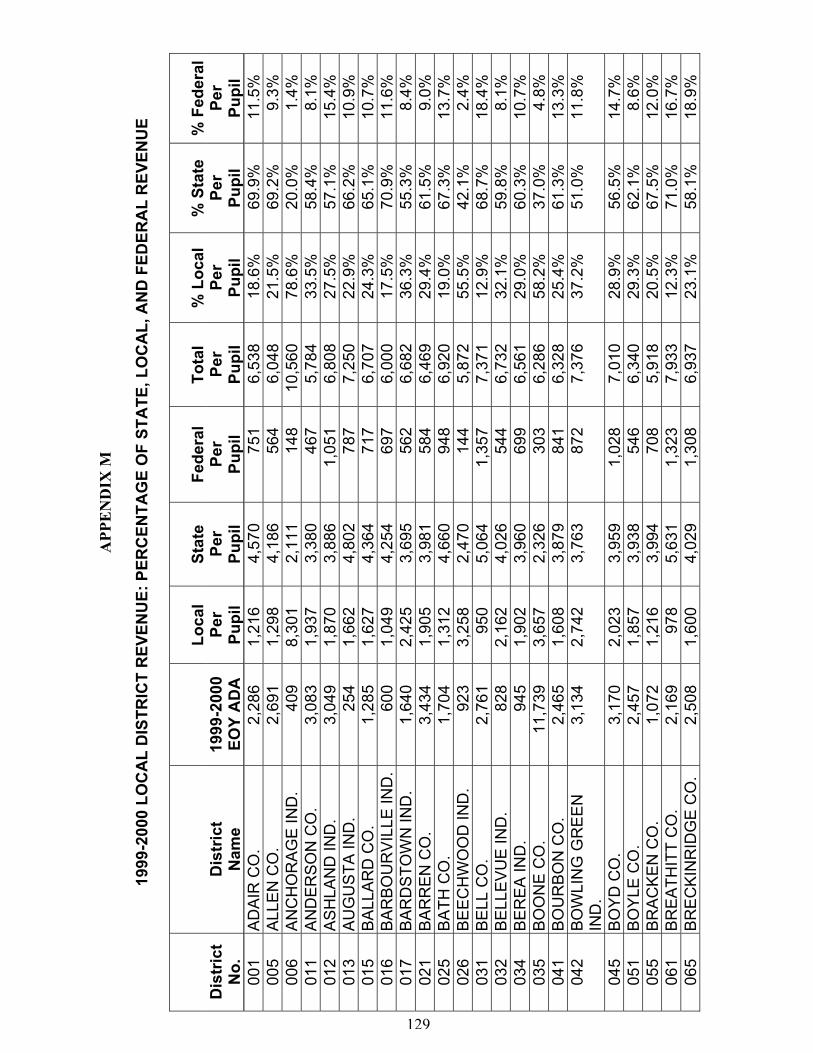
129
APP
EN
DIX
M
1999
-200
0 LO
CA
L D
ISTR
ICT
REV
ENU
E: P
ERC
ENTA
GE
OF
STA
TE, L
OC
AL,
AN
D F
EDER
AL
REV
ENU
E
Loca
lSt
ate
Fede
ral
Tota
l%
Loc
al%
Sta
te%
Fed
eral
Dis
tric
tD
istr
ict
1999
-200
0Pe
rPe
rPe
rPe
rPe
rPe
rPe
rN
o.N
ame
EOY
AD
APu
pil
Pupi
lPu
pil
Pupi
lPu
pil
Pupi
lPu
pil
001
AD
AIR
CO
.2,
286
1,21
64,
570
751
6,53
818
.6%
69.9
%11
.5%
005
ALL
EN
CO
.2,
691
1,29
84,
186
564
6,04
821
.5%
69.2
%9.
3%00
6A
NC
HO
RA
GE
IND
.40
98,
301
2,11
114
810
,560
78.6
%20
.0%
1.4%
011
AN
DE
RS
ON
CO
.3,
083
1,93
73,
380
467
5,78
433
.5%
58.4
%8.
1%01
2A
SH
LAN
D IN
D.
3,04
91,
870
3,88
61,
051
6,80
827
.5%
57.1
%15
.4%
013
AU
GU
STA
IND
.25
41,
662
4,80
278
77,
250
22.9
%66
.2%
10.9
%01
5B
ALL
AR
D C
O.
1,28
51,
627
4,36
471
76,
707
24.3
%65
.1%
10.7
%01
6B
AR
BO
UR
VIL
LE IN
D.
600
1,04
94,
254
697
6,00
017
.5%
70.9
%11
.6%
017
BA
RD
STO
WN
IND
.1,
640
2,42
53,
695
562
6,68
236
.3%
55.3
%8.
4%02
1B
AR
RE
N C
O.
3,43
41,
905
3,98
158
46,
469
29.4
%61
.5%
9.0%
025
BA
TH C
O.
1,70
41,
312
4,66
094
86,
920
19.0
%67
.3%
13.7
%02
6B
EE
CH
WO
OD
IND
.92
33,
258
2,47
014
45,
872
55.5
%42
.1%
2.4%
031
BE
LL C
O.
2,76
195
05,
064
1,35
77,
371
12.9
%68
.7%
18.4
%03
2B
ELL
EV
UE
IND
.82
82,
162
4,02
654
46,
732
32.1
%59
.8%
8.1%
034
BE
RE
A IN
D.
945
1,90
23,
960
699
6,56
129
.0%
60.3
%10
.7%
035
BO
ON
E C
O.
11,7
393,
657
2,32
630
36,
286
58.2
%37
.0%
4.8%
041
BO
UR
BO
N C
O.
2,46
51,
608
3,87
984
16,
328
25.4
%61
.3%
13.3
%04
2BO
WLI
NG
GR
EE
NIN
D.
3,13
42,
742
3,76
387
27,
376
37.2
%51
.0%
11.8
%
045
BO
YD
CO
.3,
170
2,02
33,
959
1,02
87,
010
28.9
%56
.5%
14.7
%05
1B
OY
LE C
O.
2,45
71,
857
3,93
854
66,
340
29.3
%62
.1%
8.6%
055
BR
AC
KE
N C
O.
1,07
21,
216
3,99
470
85,
918
20.5
%67
.5%
12.0
%06
1B
RE
ATH
ITT
CO
.2,
169
978
5,63
11,
323
7,93
312
.3%
71.0
%16
.7%
065
BR
EC
KIN
RID
GE
CO
.2,
508
1,60
04,
029
1,30
86,
937
23.1
%58
.1%
18.9
%
129
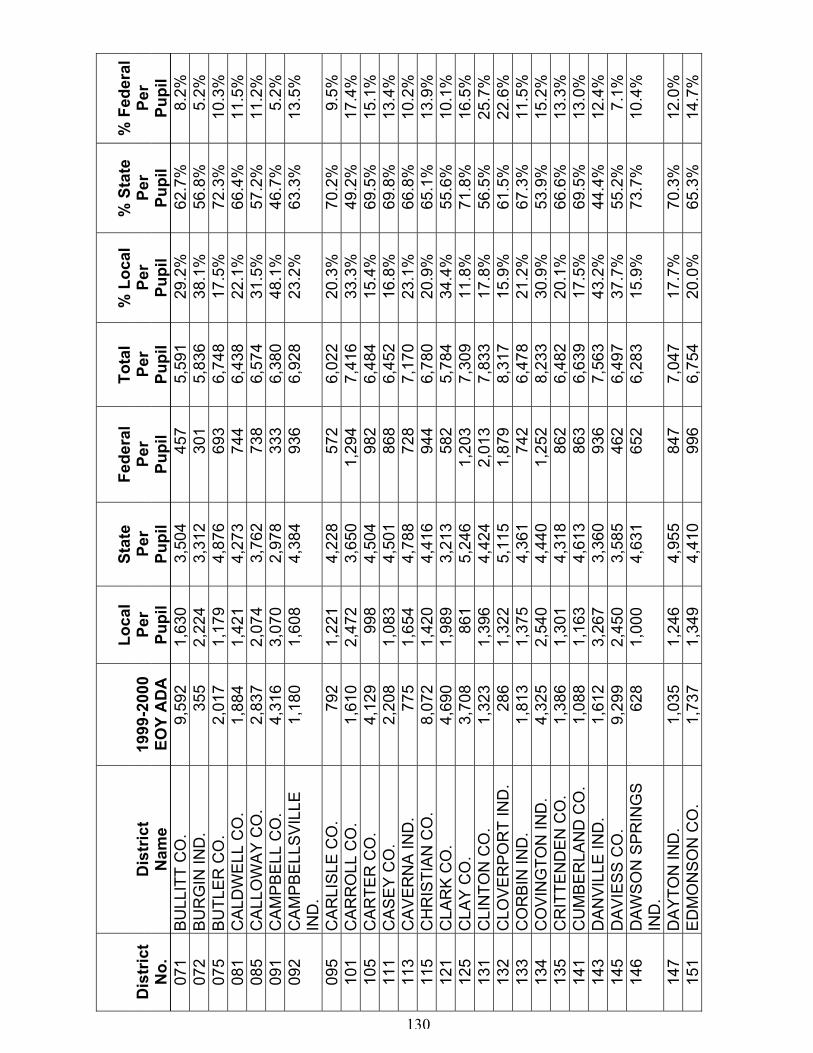
130
Loca
lSt
ate
Fede
ral
Tota
l%
Loc
al%
Sta
te%
Fed
eral
Dis
tric
tD
istr
ict
1999
-200
0Pe
rPe
rPe
rPe
rPe
rPe
rPe
rN
o.N
ame
EOY
AD
APu
pil
Pupi
lPu
pil
Pupi
lPu
pil
Pupi
lPu
pil
071
BU
LLIT
T C
O.
9,59
21,
630
3,50
445
75,
591
29.2
%62
.7%
8.2%
072
BU
RG
IN IN
D.
355
2,22
43,
312
301
5,83
638
.1%
56.8
%5.
2%07
5B
UTL
ER
CO
.2,
017
1,17
94,
876
693
6,74
817
.5%
72.3
%10
.3%
081
CAL
DW
ELL
CO
.1,
884
1,42
14,
273
744
6,43
822
.1%
66.4
%11
.5%
085
CA
LLO
WA
Y C
O.
2,83
72,
074
3,76
273
86,
574
31.5
%57
.2%
11.2
%09
1C
AM
PB
ELL
CO
.4,
316
3,07
02,
978
333
6,38
048
.1%
46.7
%5.
2%09
2C
AM
PB
ELL
SV
ILLE
IND
.1,
180
1,60
84,
384
936
6,92
823
.2%
63.3
%13
.5%
095
CA
RLI
SLE
CO
.79
21,
221
4,22
857
26,
022
20.3
%70
.2%
9.5%
101
CA
RR
OLL
CO
.1,
610
2,47
23,
650
1,29
47,
416
33.3
%49
.2%
17.4
%10
5C
AR
TER
CO
.4,
129
998
4,50
498
26,
484
15.4
%69
.5%
15.1
%11
1C
AS
EY
CO
.2,
208
1,08
34,
501
868
6,45
216
.8%
69.8
%13
.4%
113
CA
VE
RN
A IN
D.
775
1,65
44,
788
728
7,17
023
.1%
66.8
%10
.2%
115
CH
RIS
TIA
N C
O.
8,07
21,
420
4,41
694
46,
780
20.9
%65
.1%
13.9
%12
1C
LAR
K C
O.
4,69
01,
989
3,21
358
25,
784
34.4
%55
.6%
10.1
%12
5C
LAY
CO
.3,
708
861
5,24
61,
203
7,30
911
.8%
71.8
%16
.5%
131
CLI
NTO
N C
O.
1,32
31,
396
4,42
42,
013
7,83
317
.8%
56.5
%25
.7%
132
CLO
VE
RP
OR
T IN
D.
286
1,32
25,
115
1,87
98,
317
15.9
%61
.5%
22.6
%13
3C
OR
BIN
IND
.1,
813
1,37
54,
361
742
6,47
821
.2%
67.3
%11
.5%
134
CO
VIN
GTO
N IN
D.
4,32
52,
540
4,44
01,
252
8,23
330
.9%
53.9
%15
.2%
135
CR
ITTE
ND
EN
CO
.1,
386
1,30
14,
318
862
6,48
220
.1%
66.6
%13
.3%
141
CU
MB
ER
LAN
D C
O.
1,08
81,
163
4,61
386
36,
639
17.5
%69
.5%
13.0
%14
3D
AN
VIL
LE IN
D.
1,61
23,
267
3,36
093
67,
563
43.2
%44
.4%
12.4
%14
5D
AV
IES
S C
O.
9,29
92,
450
3,58
546
26,
497
37.7
%55
.2%
7.1%
146
DAW
SO
N S
PR
ING
SIN
D.
628
1,00
04,
631
652
6,28
315
.9%
73.7
%10
.4%
147
DA
YTO
N IN
D.
1,03
51,
246
4,95
584
77,
047
17.7
%70
.3%
12.0
%15
1E
DM
ON
SO
N C
O.
1,73
71,
349
4,41
099
66,
754
20.0
%65
.3%
14.7
%
130
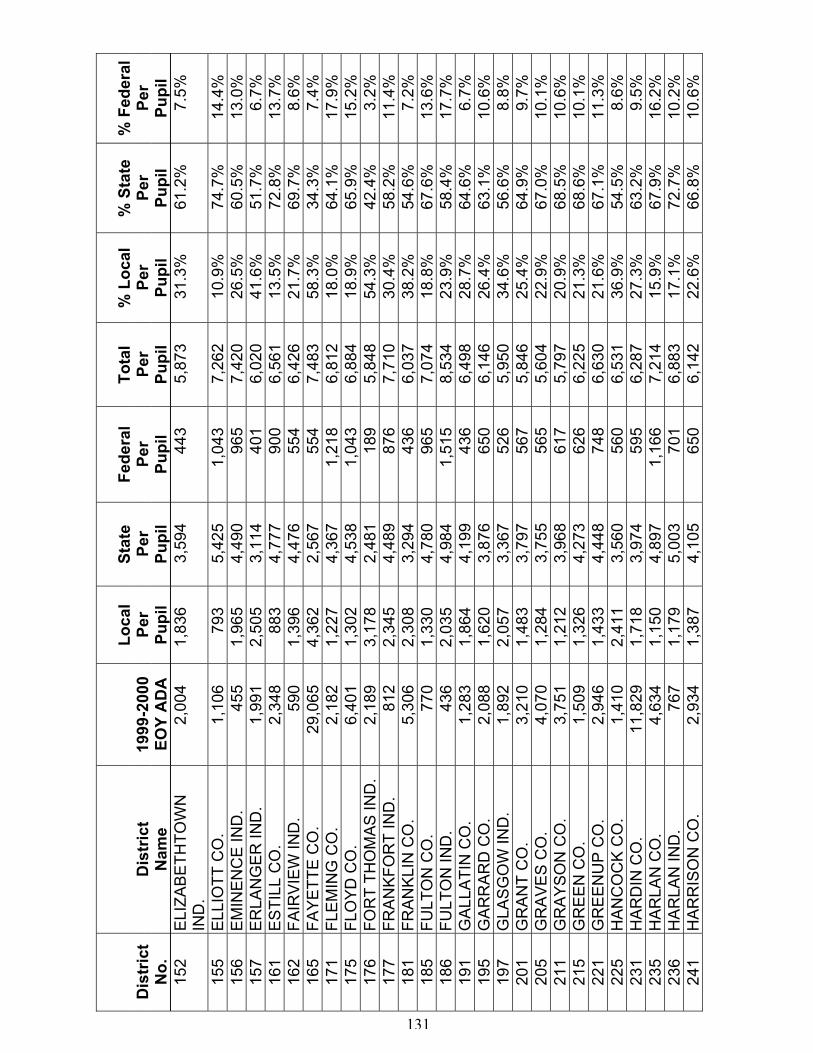
131
Loca
lSt
ate
Fede
ral
Tota
l%
Loc
al%
Sta
te%
Fed
eral
Dis
tric
tD
istr
ict
1999
-200
0Pe
rPe
rPe
rPe
rPe
rPe
rPe
rN
o.N
ame
EOY
AD
APu
pil
Pupi
lPu
pil
Pupi
lPu
pil
Pupi
lPu
pil
152
ELI
ZAB
ETH
TOW
NIN
D.
2,00
41,
836
3,59
444
35,
873
31.3
%61
.2%
7.5%
155
ELL
IOTT
CO
.1,
106
793
5,42
51,
043
7,26
210
.9%
74.7
%14
.4%
156
EM
INE
NC
E IN
D.
455
1,96
54,
490
965
7,42
026
.5%
60.5
%13
.0%
157
ER
LAN
GE
R IN
D.
1,99
12,
505
3,11
440
16,
020
41.6
%51
.7%
6.7%
161
ES
TILL
CO
.2,
348
883
4,77
790
06,
561
13.5
%72
.8%
13.7
%16
2FA
IRV
IEW
IND
.59
01,
396
4,47
655
46,
426
21.7
%69
.7%
8.6%
165
FAY
ETT
E C
O.
29,0
654,
362
2,56
755
47,
483
58.3
%34
.3%
7.4%
171
FLE
MIN
G C
O.
2,18
21,
227
4,36
71,
218
6,81
218
.0%
64.1
%17
.9%
175
FLO
YD
CO
.6,
401
1,30
24,
538
1,04
36,
884
18.9
%65
.9%
15.2
%17
6FO
RT
THO
MA
S IN
D.
2,18
93,
178
2,48
118
95,
848
54.3
%42
.4%
3.2%
177
FRA
NK
FOR
T IN
D.
812
2,34
54,
489
876
7,71
030
.4%
58.2
%11
.4%
181
FRA
NK
LIN
CO
.5,
306
2,30
83,
294
436
6,03
738
.2%
54.6
%7.
2%18
5FU
LTO
N C
O.
770
1,33
04,
780
965
7,07
418
.8%
67.6
%13
.6%
186
FULT
ON
IND
.43
62,
035
4,98
41,
515
8,53
423
.9%
58.4
%17
.7%
191
GA
LLA
TIN
CO
.1,
283
1,86
44,
199
436
6,49
828
.7%
64.6
%6.
7%19
5G
AR
RA
RD
CO
.2,
088
1,62
03,
876
650
6,14
626
.4%
63.1
%10
.6%
197
GLA
SG
OW
IND
.1,
892
2,05
73,
367
526
5,95
034
.6%
56.6
%8.
8%20
1G
RA
NT
CO
.3,
210
1,48
33,
797
567
5,84
625
.4%
64.9
%9.
7%20
5G
RA
VE
S C
O.
4,07
01,
284
3,75
556
55,
604
22.9
%67
.0%
10.1
%21
1G
RA
YS
ON
CO
.3,
751
1,21
23,
968
617
5,79
720
.9%
68.5
%10
.6%
215
GR
EE
N C
O.
1,50
91,
326
4,27
362
66,
225
21.3
%68
.6%
10.1
%22
1G
RE
EN
UP
CO
.2,
946
1,43
34,
448
748
6,63
021
.6%
67.1
%11
.3%
225
HA
NC
OC
K C
O.
1,41
02,
411
3,56
056
06,
531
36.9
%54
.5%
8.6%
231
HA
RD
IN C
O.
11,8
291,
718
3,97
459
56,
287
27.3
%63
.2%
9.5%
235
HA
RLA
N C
O.
4,63
41,
150
4,89
71,
166
7,21
415
.9%
67.9
%16
.2%
236
HA
RLA
N IN
D.
767
1,17
95,
003
701
6,88
317
.1%
72.7
%10
.2%
241
HA
RR
ISO
N C
O.
2,93
41,
387
4,10
565
06,
142
22.6
%66
.8%
10.6
%
131
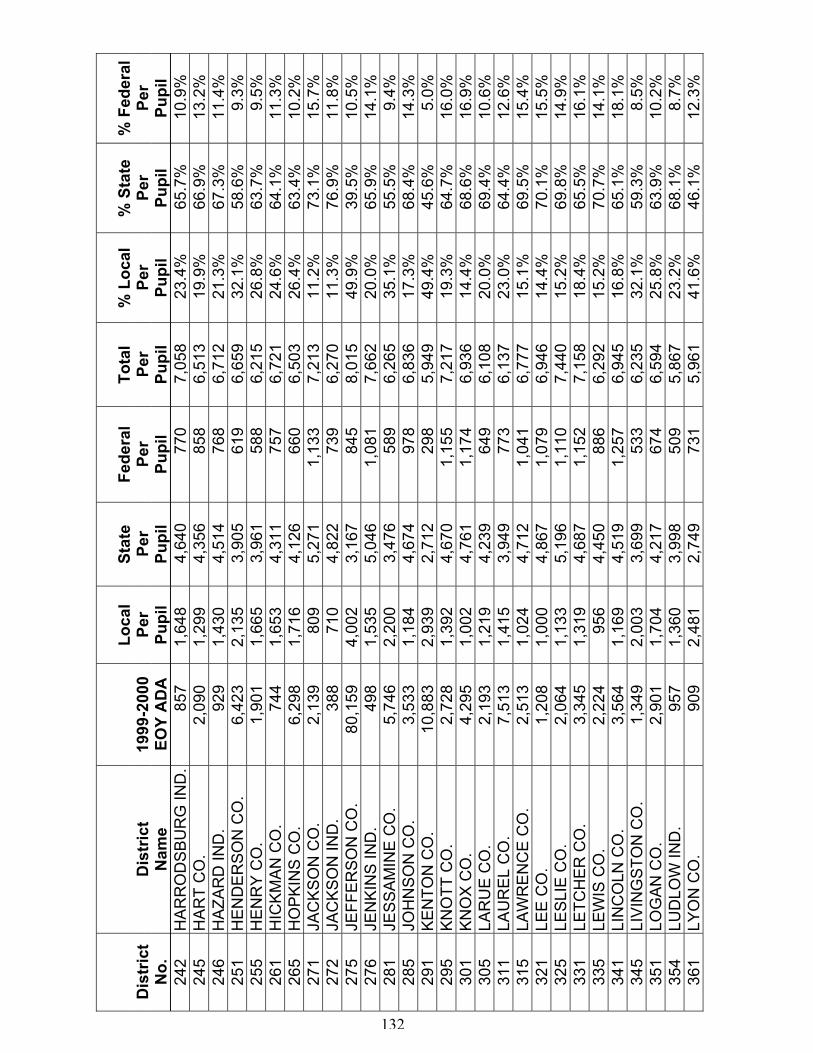
132
Loca
lSt
ate
Fede
ral
Tota
l%
Loc
al%
Sta
te%
Fed
eral
Dis
tric
tD
istr
ict
1999
-200
0Pe
rPe
rPe
rPe
rPe
rPe
rPe
rN
o.N
ame
EOY
AD
APu
pil
Pupi
lPu
pil
Pupi
lPu
pil
Pupi
lPu
pil
242
HA
RR
OD
SB
UR
G IN
D.
857
1,64
84,
640
770
7,05
823
.4%
65.7
%10
.9%
245
HA
RT
CO
.2,
090
1,29
94,
356
858
6,51
319
.9%
66.9
%13
.2%
246
HA
ZAR
D IN
D.
929
1,43
04,
514
768
6,71
221
.3%
67.3
%11
.4%
251
HE
ND
ER
SO
N C
O.
6,42
32,
135
3,90
561
96,
659
32.1
%58
.6%
9.3%
255
HE
NR
Y C
O.
1,90
11,
665
3,96
158
86,
215
26.8
%63
.7%
9.5%
261
HIC
KM
AN
CO
.74
41,
653
4,31
175
76,
721
24.6
%64
.1%
11.3
%26
5H
OP
KIN
S C
O.
6,29
81,
716
4,12
666
06,
503
26.4
%63
.4%
10.2
%27
1JA
CK
SO
N C
O.
2,13
980
95,
271
1,13
37,
213
11.2
%73
.1%
15.7
%27
2JA
CK
SO
N IN
D.
388
710
4,82
273
96,
270
11.3
%76
.9%
11.8
%27
5JE
FFE
RS
ON
CO
.80
,159
4,00
23,
167
845
8,01
549
.9%
39.5
%10
.5%
276
JEN
KIN
S IN
D.
498
1,53
55,
046
1,08
17,
662
20.0
%65
.9%
14.1
%28
1JE
SS
AM
INE
CO
.5,
746
2,20
03,
476
589
6,26
535
.1%
55.5
%9.
4%28
5JO
HN
SO
N C
O.
3,53
31,
184
4,67
497
86,
836
17.3
%68
.4%
14.3
%29
1K
EN
TON
CO
.10
,883
2,93
92,
712
298
5,94
949
.4%
45.6
%5.
0%29
5K
NO
TT C
O.
2,72
81,
392
4,67
01,
155
7,21
719
.3%
64.7
%16
.0%
301
KN
OX
CO
.4,
295
1,00
24,
761
1,17
46,
936
14.4
%68
.6%
16.9
%30
5LA
RU
E C
O.
2,19
31,
219
4,23
964
96,
108
20.0
%69
.4%
10.6
%31
1LA
UR
EL
CO
.7,
513
1,41
53,
949
773
6,13
723
.0%
64.4
%12
.6%
315
LAW
RE
NC
E C
O.
2,51
31,
024
4,71
21,
041
6,77
715
.1%
69.5
%15
.4%
321
LEE
CO
.1,
208
1,00
04,
867
1,07
96,
946
14.4
%70
.1%
15.5
%32
5LE
SLI
E C
O.
2,06
41,
133
5,19
61,
110
7,44
015
.2%
69.8
%14
.9%
331
LETC
HE
R C
O.
3,34
51,
319
4,68
71,
152
7,15
818
.4%
65.5
%16
.1%
335
LEW
IS C
O.
2,22
495
64,
450
886
6,29
215
.2%
70.7
%14
.1%
341
LIN
CO
LN C
O.
3,56
41,
169
4,51
91,
257
6,94
516
.8%
65.1
%18
.1%
345
LIV
ING
STO
N C
O.
1,34
92,
003
3,69
953
36,
235
32.1
%59
.3%
8.5%
351
LOG
AN
CO
.2,
901
1,70
44,
217
674
6,59
425
.8%
63.9
%10
.2%
354
LUD
LOW
IND
.95
71,
360
3,99
850
95,
867
23.2
%68
.1%
8.7%
361
LYO
N C
O.
909
2,48
12,
749
731
5,96
141
.6%
46.1
%12
.3%
132
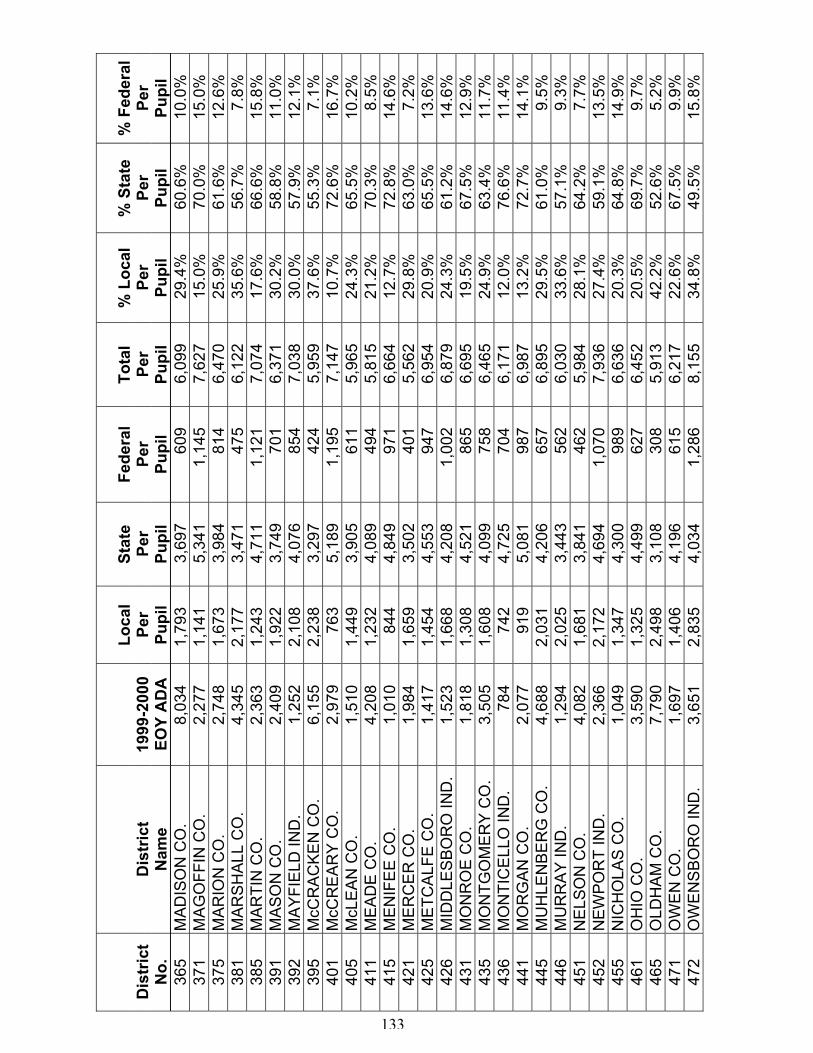
133
Loca
lSt
ate
Fede
ral
Tota
l%
Loc
al%
Sta
te%
Fed
eral
Dis
tric
tD
istr
ict
1999
-200
0Pe
rPe
rPe
rPe
rPe
rPe
rPe
rN
o.N
ame
EOY
AD
APu
pil
Pupi
lPu
pil
Pupi
lPu
pil
Pupi
lPu
pil
365
MA
DIS
ON
CO
.8,
034
1,79
33,
697
609
6,09
929
.4%
60.6
%10
.0%
371
MA
GO
FFIN
CO
.2,
277
1,14
15,
341
1,14
57,
627
15.0
%70
.0%
15.0
%37
5M
AR
ION
CO
.2,
748
1,67
33,
984
814
6,47
025
.9%
61.6
%12
.6%
381
MA
RS
HA
LL C
O.
4,34
52,
177
3,47
147
56,
122
35.6
%56
.7%
7.8%
385
MA
RTI
N C
O.
2,36
31,
243
4,71
11,
121
7,07
417
.6%
66.6
%15
.8%
391
MA
SO
N C
O.
2,40
91,
922
3,74
970
16,
371
30.2
%58
.8%
11.0
%39
2M
AY
FIE
LD IN
D.
1,25
22,
108
4,07
685
47,
038
30.0
%57
.9%
12.1
%39
5M
cCR
AC
KE
N C
O.
6,15
52,
238
3,29
742
45,
959
37.6
%55
.3%
7.1%
401
McC
RE
AR
Y C
O.
2,97
976
35,
189
1,19
57,
147
10.7
%72
.6%
16.7
%40
5M
cLE
AN
CO
.1,
510
1,44
93,
905
611
5,96
524
.3%
65.5
%10
.2%
411
ME
AD
E C
O.
4,20
81,
232
4,08
949
45,
815
21.2
%70
.3%
8.5%
415
ME
NIF
EE
CO
.1,
010
844
4,84
997
16,
664
12.7
%72
.8%
14.6
%42
1M
ER
CE
R C
O.
1,98
41,
659
3,50
240
15,
562
29.8
%63
.0%
7.2%
425
ME
TCA
LFE
CO
.1,
417
1,45
44,
553
947
6,95
420
.9%
65.5
%13
.6%
426
MID
DLE
SB
OR
O IN
D.
1,52
31,
668
4,20
81,
002
6,87
924
.3%
61.2
%14
.6%
431
MO
NR
OE
CO
.1,
818
1,30
84,
521
865
6,69
519
.5%
67.5
%12
.9%
435
MO
NTG
OM
ER
Y C
O.
3,50
51,
608
4,09
975
86,
465
24.9
%63
.4%
11.7
%43
6M
ON
TIC
ELL
O IN
D.
784
742
4,72
570
46,
171
12.0
%76
.6%
11.4
%44
1M
OR
GA
N C
O.
2,07
791
95,
081
987
6,98
713
.2%
72.7
%14
.1%
445
MU
HLE
NB
ER
G C
O.
4,68
82,
031
4,20
665
76,
895
29.5
%61
.0%
9.5%
446
MU
RR
AY
IND
.1,
294
2,02
53,
443
562
6,03
033
.6%
57.1
%9.
3%45
1N
ELS
ON
CO
.4,
082
1,68
13,
841
462
5,98
428
.1%
64.2
%7.
7%45
2N
EWP
OR
T IN
D.
2,36
62,
172
4,69
41,
070
7,93
627
.4%
59.1
%13
.5%
455
NIC
HO
LAS
CO
.1,
049
1,34
74,
300
989
6,63
620
.3%
64.8
%14
.9%
461
OH
IO C
O.
3,59
01,
325
4,49
962
76,
452
20.5
%69
.7%
9.7%
465
OLD
HA
M C
O.
7,79
02,
498
3,10
830
85,
913
42.2
%52
.6%
5.2%
471
OW
EN
CO
.1,
697
1,40
64,
196
615
6,21
722
.6%
67.5
%9.
9%47
2O
WE
NS
BO
RO
IND
.3,
651
2,83
54,
034
1,28
68,
155
34.8
%49
.5%
15.8
%
133
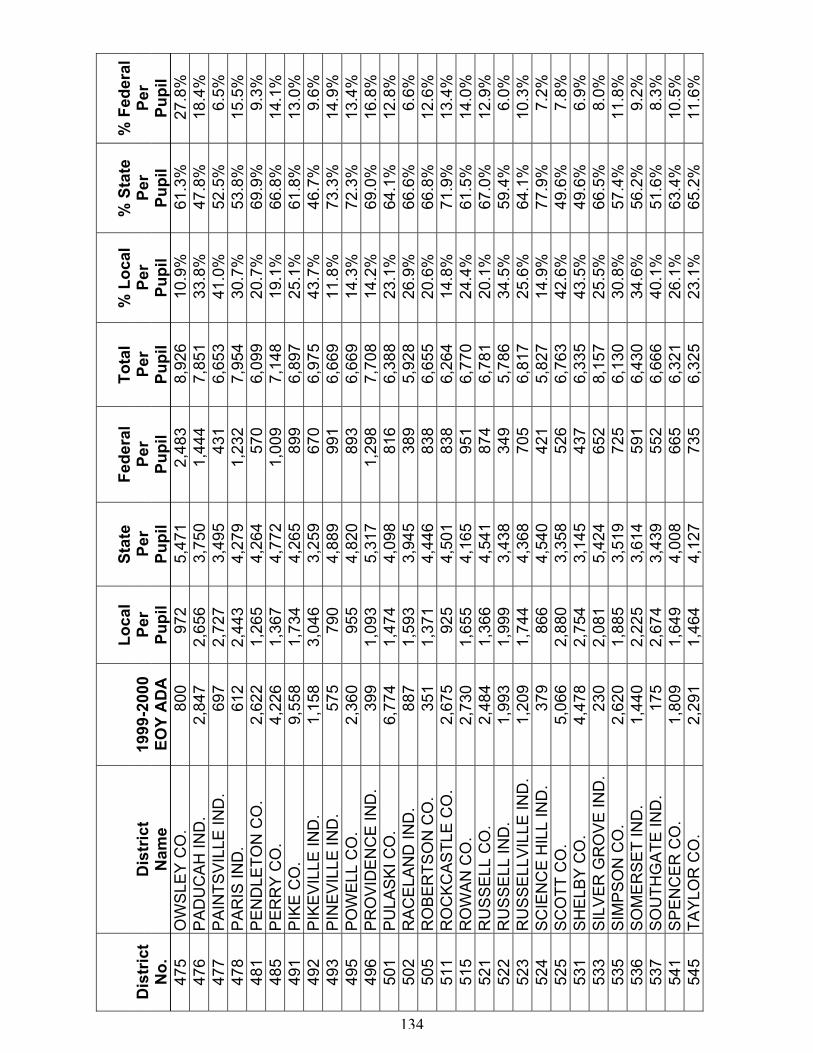
134
Loca
lSt
ate
Fede
ral
Tota
l%
Loc
al%
Sta
te%
Fed
eral
Dis
tric
tD
istr
ict
1999
-200
0Pe
rPe
rPe
rPe
rPe
rPe
rPe
rN
o.N
ame
EOY
AD
APu
pil
Pupi
lPu
pil
Pupi
lPu
pil
Pupi
lPu
pil
475
OW
SLE
Y C
O.
800
972
5,47
12,
483
8,92
610
.9%
61.3
%27
.8%
476
PA
DU
CA
H IN
D.
2,84
72,
656
3,75
01,
444
7,85
133
.8%
47.8
%18
.4%
477
PA
INTS
VIL
LE IN
D.
697
2,72
73,
495
431
6,65
341
.0%
52.5
%6.
5%47
8P
AR
IS IN
D.
612
2,44
34,
279
1,23
27,
954
30.7
%53
.8%
15.5
%48
1P
EN
DLE
TON
CO
.2,
622
1,26
54,
264
570
6,09
920
.7%
69.9
%9.
3%48
5P
ER
RY
CO
.4,
226
1,36
74,
772
1,00
97,
148
19.1
%66
.8%
14.1
%49
1P
IKE
CO
.9,
558
1,73
44,
265
899
6,89
725
.1%
61.8
%13
.0%
492
PIK
EV
ILLE
IND
.1,
158
3,04
63,
259
670
6,97
543
.7%
46.7
%9.
6%49
3P
INE
VIL
LE IN
D.
575
790
4,88
999
16,
669
11.8
%73
.3%
14.9
%49
5PO
WE
LL C
O.
2,36
095
54,
820
893
6,66
914
.3%
72.3
%13
.4%
496
PR
OV
IDE
NC
E IN
D.
399
1,09
35,
317
1,29
87,
708
14.2
%69
.0%
16.8
%50
1P
ULA
SK
I CO
.6,
774
1,47
44,
098
816
6,38
823
.1%
64.1
%12
.8%
502
RA
CE
LAN
D IN
D.
887
1,59
33,
945
389
5,92
826
.9%
66.6
%6.
6%50
5R
OB
ER
TSO
N C
O.
351
1,37
14,
446
838
6,65
520
.6%
66.8
%12
.6%
511
RO
CK
CA
STL
E C
O.
2,67
592
54,
501
838
6,26
414
.8%
71.9
%13
.4%
515
RO
WA
N C
O.
2,73
01,
655
4,16
595
16,
770
24.4
%61
.5%
14.0
%52
1R
US
SE
LL C
O.
2,48
41,
366
4,54
187
46,
781
20.1
%67
.0%
12.9
%52
2R
US
SE
LL IN
D.
1,99
31,
999
3,43
834
95,
786
34.5
%59
.4%
6.0%
523
RU
SS
ELL
VIL
LE IN
D.
1,20
91,
744
4,36
870
56,
817
25.6
%64
.1%
10.3
%52
4S
CIE
NC
E H
ILL
IND
.37
986
64,
540
421
5,82
714
.9%
77.9
%7.
2%52
5S
CO
TT C
O.
5,06
62,
880
3,35
852
66,
763
42.6
%49
.6%
7.8%
531
SH
ELB
Y C
O.
4,47
82,
754
3,14
543
76,
335
43.5
%49
.6%
6.9%
533
SIL
VE
R G
RO
VE
IND
.23
02,
081
5,42
465
28,
157
25.5
%66
.5%
8.0%
535
SIM
PS
ON
CO
.2,
620
1,88
53,
519
725
6,13
030
.8%
57.4
%11
.8%
536
SO
ME
RS
ET
IND
.1,
440
2,22
53,
614
591
6,43
034
.6%
56.2
%9.
2%53
7S
OU
THG
ATE
IND
.17
52,
674
3,43
955
26,
666
40.1
%51
.6%
8.3%
541
SP
EN
CE
R C
O.
1,80
91,
649
4,00
866
56,
321
26.1
%63
.4%
10.5
%54
5TA
YLO
R C
O.
2,29
11,
464
4,12
773
56,
325
23.1
%65
.2%
11.6
%
134
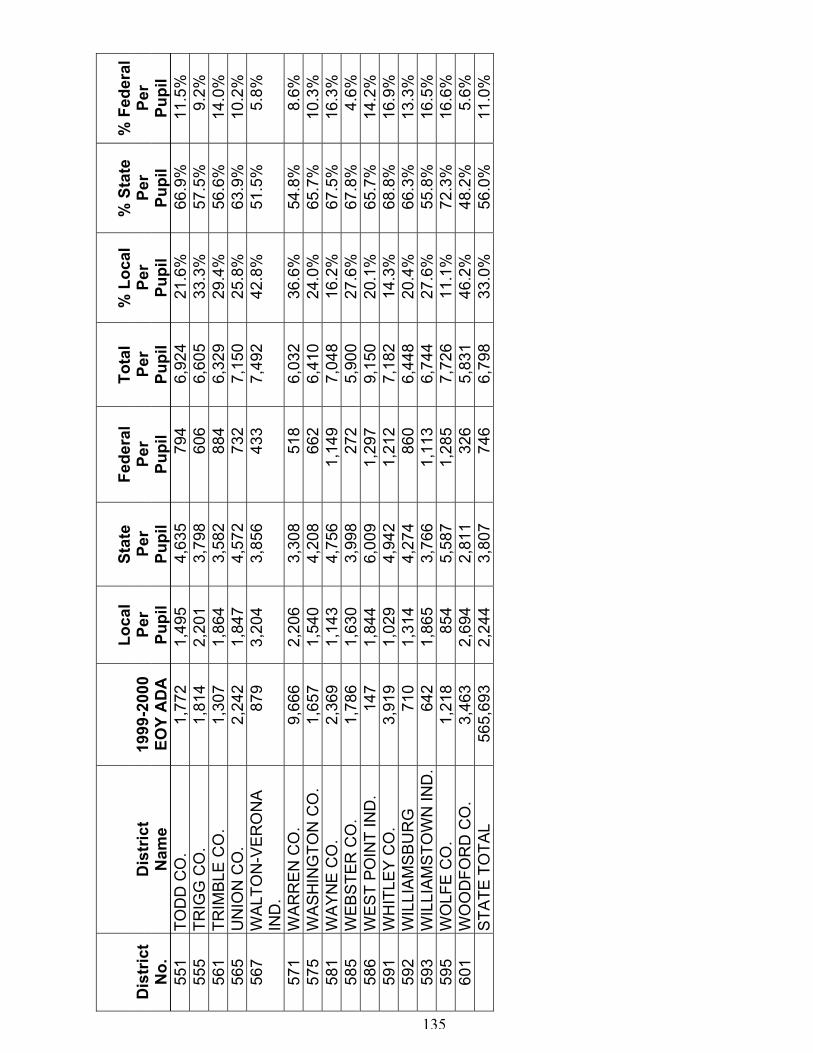
135
Loca
lSt
ate
Fede
ral
Tota
l%
Loc
al%
Sta
te%
Fed
eral
Dis
tric
tD
istr
ict
1999
-200
0Pe
rPe
rPe
rPe
rPe
rPe
rPe
rN
o.N
ame
EOY
AD
APu
pil
Pupi
lPu
pil
Pupi
lPu
pil
Pupi
lPu
pil
551
TOD
D C
O.
1,77
21,
495
4,63
579
46,
924
21.6
%66
.9%
11.5
%55
5TR
IGG
CO
.1,
814
2,20
13,
798
606
6,60
533
.3%
57.5
%9.
2%56
1TR
IMB
LE C
O.
1,30
71,
864
3,58
288
46,
329
29.4
%56
.6%
14.0
%56
5U
NIO
N C
O.
2,24
21,
847
4,57
273
27,
150
25.8
%63
.9%
10.2
%56
7W
ALT
ON
-VE
RO
NA
IND
.87
93,
204
3,85
643
37,
492
42.8
%51
.5%
5.8%
571
WA
RR
EN
CO
.9,
666
2,20
63,
308
518
6,03
236
.6%
54.8
%8.
6%57
5W
AS
HIN
GTO
N C
O.
1,65
71,
540
4,20
866
26,
410
24.0
%65
.7%
10.3
%58
1W
AY
NE
CO
.2,
369
1,14
34,
756
1,14
97,
048
16.2
%67
.5%
16.3
%58
5W
EB
STE
R C
O.
1,78
61,
630
3,99
827
25,
900
27.6
%67
.8%
4.6%
586
WE
ST
PO
INT
IND
.14
71,
844
6,00
91,
297
9,15
020
.1%
65.7
%14
.2%
591
WH
ITLE
Y C
O.
3,91
91,
029
4,94
21,
212
7,18
214
.3%
68.8
%16
.9%
592
WIL
LIA
MS
BU
RG
710
1,31
44,
274
860
6,44
820
.4%
66.3
%13
.3%
593
WIL
LIA
MS
TOW
N IN
D.
642
1,86
53,
766
1,11
36,
744
27.6
%55
.8%
16.5
%59
5W
OLF
E C
O.
1,21
885
45,
587
1,28
57,
726
11.1
%72
.3%
16.6
%60
1W
OO
DFO
RD
CO
.3,
463
2,69
42,
811
326
5,83
146
.2%
48.2
%5.
6%S
TATE
TO
TAL
565,
693
2,24
43,
807
746
6,79
833
.0%
56.0
%11
.0%
135

136
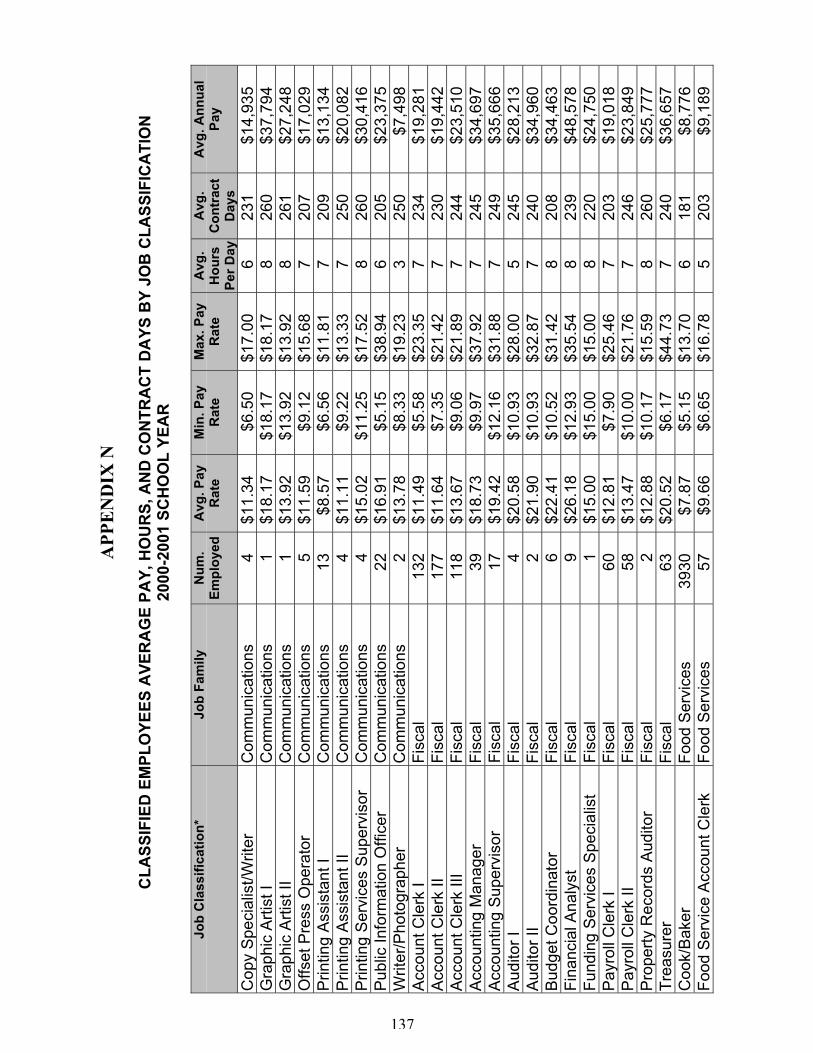
137
APP
EN
DIX
N
CLA
SSIF
IED
EM
PLO
YEES
AVE
RA
GE
PAY,
HO
UR
S, A
ND
CO
NTR
AC
T D
AYS
BY
JOB
CLA
SSIF
ICA
TIO
N20
00-2
001
SCH
OO
L YE
AR
Job
Cla
ssifi
catio
n*Jo
b Fa
mily
Num
.Em
ploy
edA
vg. P
ayR
ate
Min
. Pay
Rat
eM
ax. P
ayR
ate
Avg
.H
ours
Per D
ay
Avg
.C
ontr
act
Day
s
Avg
. Ann
ual
Pay
Cop
y S
peci
alis
t/Writ
erC
omm
unic
atio
ns4
$11.
34$6
.50
$17.
006
231
$14,
935
Gra
phic
Arti
st I
Com
mun
icat
ions
1$1
8.17
$18.
17$1
8.17
826
0$3
7,79
4G
raph
ic A
rtist
IIC
omm
unic
atio
ns1
$13.
92$1
3.92
$13.
928
261
$27,
248
Offs
et P
ress
Ope
rato
rC
omm
unic
atio
ns5
$11.
59$9
.12
$15.
687
207
$17,
029
Prin
ting
Ass
ista
nt I
Com
mun
icat
ions
13$8
.57
$6.5
6$1
1.81
720
9$1
3,13
4P
rintin
g A
ssis
tant
IIC
omm
unic
atio
ns4
$11.
11$9
.22
$13.
337
250
$20,
082
Prin
ting
Ser
vice
s S
uper
viso
rC
omm
unic
atio
ns4
$15.
02$1
1.25
$17.
528
260
$30,
416
Pub
lic In
form
atio
n O
ffice
rC
omm
unic
atio
ns22
$16.
91$5
.15
$38.
946
205
$23,
375
Writ
er/P
hoto
grap
her
Com
mun
icat
ions
2$1
3.78
$8.3
3$1
9.23
325
0$7
,498
Acc
ount
Cle
rk I
Fisc
al13
2$1
1.49
$5.5
8$2
3.35
723
4$1
9,28
1A
ccou
nt C
lerk
IIFi
scal
177
$11.
64$7
.35
$21.
427
230
$19,
442
Acc
ount
Cle
rk II
IFi
scal
118
$13.
67$9
.06
$21.
897
244
$23,
510
Acc
ount
ing
Man
ager
Fisc
al39
$18.
73$9
.97
$37.
927
245
$34,
697
Acc
ount
ing
Sup
ervi
sor
Fisc
al17
$19.
42$1
2.16
$31.
887
249
$35,
666
Aud
itor I
Fisc
al4
$20.
58$1
0.93
$28.
005
245
$28,
213
Aud
itor I
IFi
scal
2$2
1.90
$10.
93$3
2.87
724
0$3
4,96
0B
udge
t Coo
rdin
ator
Fisc
al6
$22.
41$1
0.52
$31.
428
208
$34,
463
Fina
ncia
l Ana
lyst
Fisc
al9
$26.
18$1
2.93
$35.
548
239
$48,
578
Fund
ing
Ser
vice
s S
peci
alis
tFi
scal
1$1
5.00
$15.
00$1
5.00
822
0$2
4,75
0P
ayro
ll C
lerk
IFi
scal
60$1
2.81
$7.9
0$2
5.46
720
3$1
9,01
8P
ayro
ll C
lerk
IIFi
scal
58$1
3.47
$10.
00$2
1.76
724
6$2
3,84
9P
rope
rty R
ecor
ds A
udito
rFi
scal
2$1
2.88
$10.
17$1
5.59
826
0$2
5,77
7Tr
easu
rer
Fisc
al63
$20.
52$6
.17
$44.
737
240
$36,
657
Coo
k/B
aker
Food
Ser
vice
s39
30$7
.87
$5.1
5$1
3.70
618
1$8
,776
Food
Ser
vice
Acc
ount
Cle
rkFo
od S
ervi
ces
57$9
.66
$6.6
5$1
6.78
520
3$9
,189
137
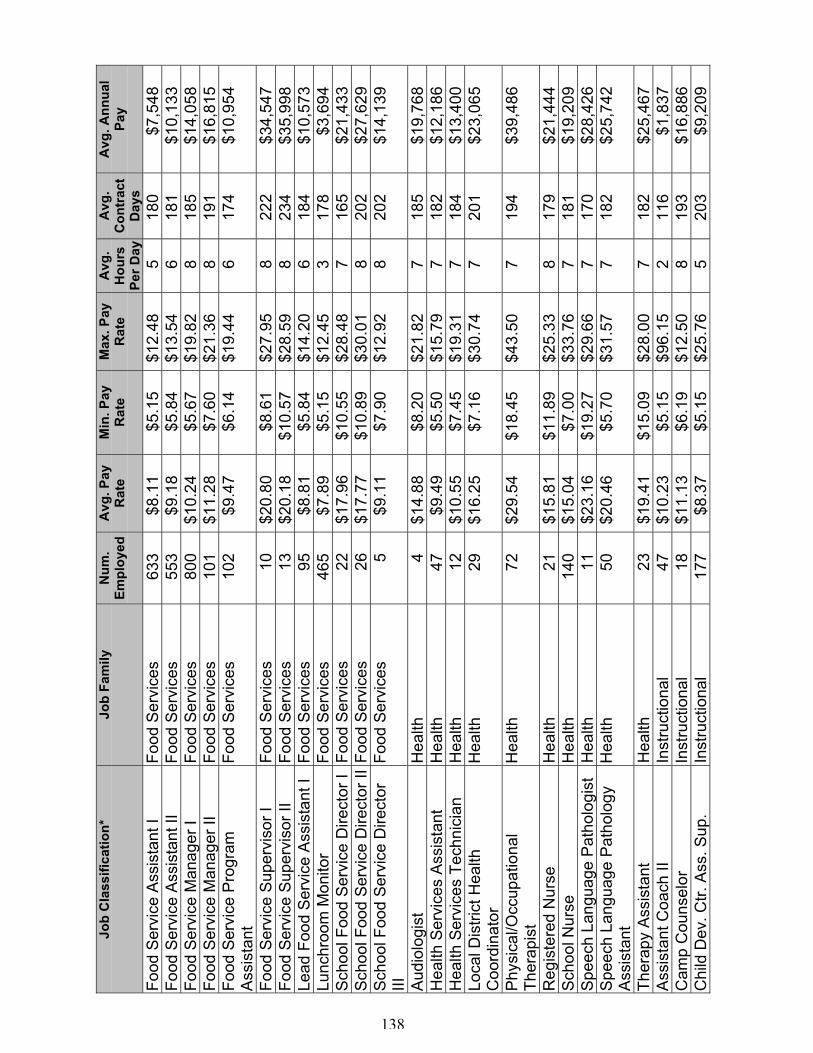
138
Job
Cla
ssifi
catio
n*Jo
b Fa
mily
Num
.Em
ploy
edA
vg. P
ayR
ate
Min
. Pay
Rat
eM
ax. P
ayR
ate
Avg
.H
ours
Per D
ay
Avg
.C
ontr
act
Day
s
Avg
. Ann
ual
Pay
Food
Ser
vice
Ass
ista
nt I
Food
Ser
vice
s63
3$8
.11
$5.1
5$1
2.48
518
0$7
,548
Food
Ser
vice
Ass
ista
nt II
Food
Ser
vice
s55
3$9
.18
$5.8
4$1
3.54
618
1$1
0,13
3Fo
od S
ervi
ce M
anag
er I
Food
Ser
vice
s80
0$1
0.24
$5.6
7$1
9.82
818
5$1
4,05
8Fo
od S
ervi
ce M
anag
er II
Food
Ser
vice
s10
1$1
1.28
$7.6
0$2
1.36
819
1$1
6,81
5Fo
od S
ervi
ce P
rogr
amA
ssis
tant
Food
Ser
vice
s10
2$9
.47
$6.1
4$1
9.44
617
4$1
0,95
4
Food
Ser
vice
Sup
ervi
sor I
Food
Ser
vice
s10
$20.
80$8
.61
$27.
958
222
$34,
547
Food
Ser
vice
Sup
ervi
sor I
IFo
od S
ervi
ces
13$2
0.18
$10.
57$2
8.59
823
4$3
5,99
8Le
ad F
ood
Ser
vice
Ass
ista
nt I
Food
Ser
vice
s95
$8.8
1$5
.84
$14.
206
184
$10,
573
Lunc
hroo
m M
onito
rFo
od S
ervi
ces
465
$7.8
9$5
.15
$12.
453
178
$3,
694
Sch
ool F
ood
Ser
vice
Dire
ctor
IFo
od S
ervi
ces
22$1
7.96
$10.
55$2
8.48
716
5$2
1,43
3S
choo
l Foo
d S
ervi
ce D
irect
or II
Food
Ser
vice
s26
$17.
77$1
0.89
$30.
018
202
$27,
629
Sch
ool F
ood
Ser
vice
Dire
ctor
IIIFo
od S
ervi
ces
5$9
.11
$7.9
0$1
2.92
820
2$1
4,13
9
Aud
iolo
gist
Hea
lth4
$14.
88$8
.20
$21.
827
185
$19,
768
Hea
lth S
ervi
ces
Ass
ista
ntH
ealth
47$9
.49
$5.5
0$1
5.79
718
2$1
2,18
6H
ealth
Ser
vice
s Te
chni
cian
Hea
lth12
$10.
55$7
.45
$19.
317
184
$13,
400
Loca
l Dis
trict
Hea
lthC
oord
inat
orH
ealth
29$1
6.25
$7.1
6$3
0.74
720
1$2
3,06
5
Phy
sica
l/Occ
upat
iona
lTh
erap
ist
Hea
lth72
$29.
54$1
8.45
$43.
507
194
$39,
486
Reg
iste
red
Nur
seH
ealth
21$1
5.81
$11.
89$2
5.33
817
9$2
1,44
4S
choo
l Nur
seH
ealth
140
$15.
04$7
.00
$33.
767
181
$19,
209
Spe
ech
Lang
uage
Pat
holo
gist
Hea
lth11
$23.
16$1
9.27
$29.
667
170
$28,
426
Spe
ech
Lang
uage
Pat
holo
gyA
ssis
tant
Hea
lth50
$20.
46$5
.70
$31.
577
182
$25,
742
Ther
apy
Ass
ista
ntH
ealth
23$1
9.41
$15.
09$2
8.00
718
2$2
5,46
7A
ssis
tant
Coa
ch II
Inst
ruct
iona
l47
$10.
23$5
.15
$96.
152
116
$1,8
37C
amp
Cou
nsel
orIn
stru
ctio
nal
18$1
1.13
$6.1
9$1
2.50
819
3$1
6,88
6C
hild
Dev
. Ctr.
Ass
. Sup
.In
stru
ctio
nal
177
$8.3
7$5
.15
$25.
765
203
$9,2
09
138
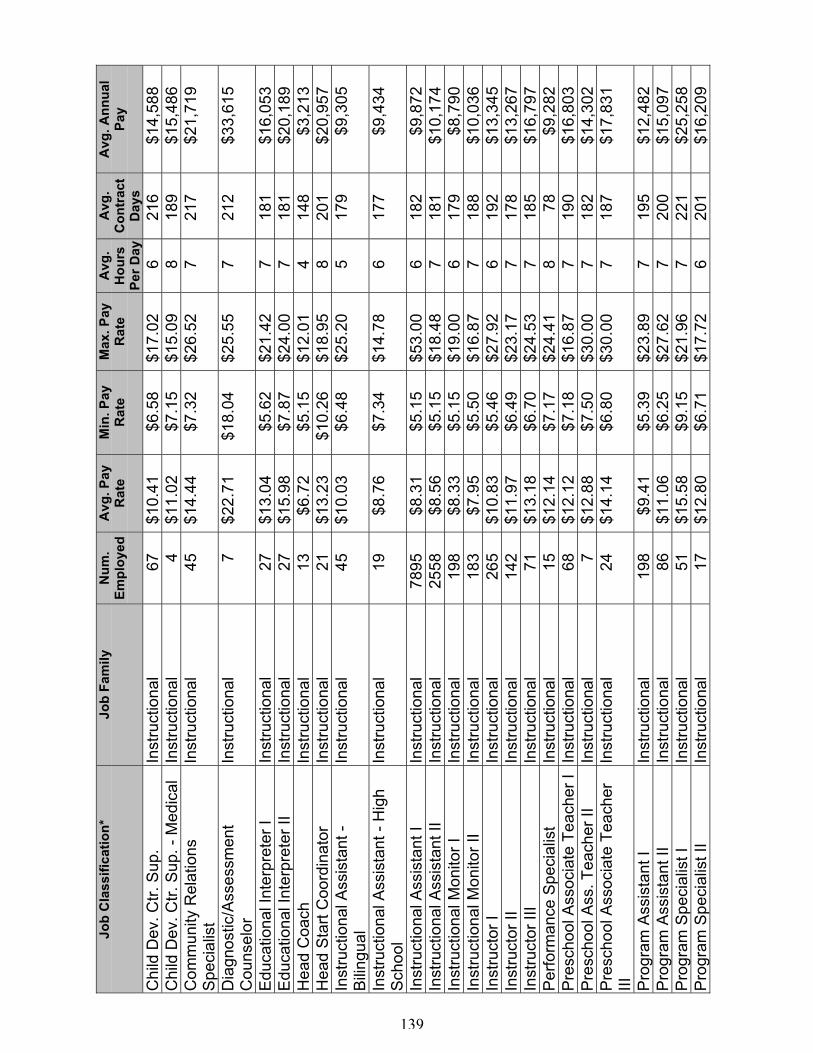
139
Job
Cla
ssifi
catio
n*Jo
b Fa
mily
Num
.Em
ploy
edA
vg. P
ayR
ate
Min
. Pay
Rat
eM
ax. P
ayR
ate
Avg
.H
ours
Per D
ay
Avg
.C
ontr
act
Day
s
Avg
. Ann
ual
Pay
Chi
ld D
ev. C
tr. S
up.
Inst
ruct
iona
l67
$10.
41$6
.58
$17.
026
216
$14,
588
Chi
ld D
ev. C
tr. S
up. -
Med
ical
Inst
ruct
iona
l4
$11.
02$7
.15
$15.
098
189
$15,
486
Com
mun
ity R
elat
ions
Spe
cial
ist
Inst
ruct
iona
l45
$14.
44$7
.32
$26.
527
217
$21,
719
Dia
gnos
tic/A
sses
smen
tC
ouns
elor
Inst
ruct
iona
l7
$22.
71$1
8.04
$25.
557
212
$33,
615
Edu
catio
nal I
nter
pret
er I
Inst
ruct
iona
l27
$13.
04$5
.62
$21.
427
181
$16,
053
Edu
catio
nal I
nter
pret
er II
Inst
ruct
iona
l27
$15.
98$7
.87
$24.
007
181
$20,
189
Hea
d C
oach
Inst
ruct
iona
l13
$6.7
2$5
.15
$12.
014
148
$3,2
13H
ead
Sta
rt C
oord
inat
orIn
stru
ctio
nal
21$1
3.23
$10.
26$1
8.95
820
1$2
0,95
7In
stru
ctio
nal A
ssis
tant
-B
iling
ual
Inst
ruct
iona
l45
$10.
03$6
.48
$25.
205
179
$9,3
05
Inst
ruct
iona
l Ass
ista
nt -
Hig
hS
choo
lIn
stru
ctio
nal
19$8
.76
$7.3
4$1
4.78
617
7$9
,434
Inst
ruct
iona
l Ass
ista
nt I
Inst
ruct
iona
l78
95$8
.31
$5.1
5$5
3.00
618
2$9
,872
Inst
ruct
iona
l Ass
ista
nt II
Inst
ruct
iona
l25
58$8
.56
$5.1
5$1
8.48
718
1$1
0,17
4In
stru
ctio
nal M
onito
r IIn
stru
ctio
nal
198
$8.3
3$5
.15
$19.
006
179
$8,7
90In
stru
ctio
nal M
onito
r II
Inst
ruct
iona
l18
3$7
.95
$5.5
0$1
6.87
718
8$1
0,03
6In
stru
ctor
IIn
stru
ctio
nal
265
$10.
83$5
.46
$27.
926
192
$13,
345
Inst
ruct
or II
Inst
ruct
iona
l14
2$1
1.97
$6.4
9$2
3.17
717
8$1
3,26
7In
stru
ctor
III
Inst
ruct
iona
l71
$13.
18$6
.70
$24.
537
185
$16,
797
Per
form
ance
Spe
cial
ist
Inst
ruct
iona
l15
$12.
14$7
.17
$24.
418
78$9
,282
Pre
scho
ol A
ssoc
iate
Tea
cher
IIn
stru
ctio
nal
68$1
2.12
$7.1
8$1
6.87
719
0$1
6,80
3P
resc
hool
Ass
. Tea
cher
IIIn
stru
ctio
nal
7$1
2.88
$7.5
0$3
0.00
718
2$1
4,30
2P
resc
hool
Ass
ocia
te T
each
erIII
Inst
ruct
iona
l24
$14.
14 $
6.80
$30.
007
187
$17,
831
Pro
gram
Ass
ista
nt I
Inst
ruct
iona
l19
8 $
9.41
$5.
39$2
3.89
719
5$1
2,48
2P
rogr
am A
ssis
tant
IIIn
stru
ctio
nal
86$1
1.06
$6.
25$2
7.62
720
0$1
5,09
7P
rogr
am S
peci
alis
t IIn
stru
ctio
nal
51$1
5.58
$9.
15$2
1.96
722
1$2
5,25
8P
rogr
am S
peci
alis
t II
Inst
ruct
iona
l17
$12.
80 $
6.71
$17.
726
201
$16,
209
139

140
Job
Cla
ssifi
catio
n*Jo
b Fa
mily
Num
.Em
ploy
edA
vg. P
ayR
ate
Min
. Pay
Rat
eM
ax. P
ayR
ate
Avg
.H
ours
Per D
ay
Avg
.C
ontr
act
Day
s
Avg
. Ann
ual
Pay
Pro
gram
Spe
cial
ist I
IIIn
stru
ctio
nal
20$1
2.52
$7.
11$3
6.04
721
6$1
8,77
5R
esea
rch
Tech
nici
anIn
stru
ctio
nal
1 $
8.98
$8.
98 $
8.98
824
0$1
7,24
2S
choo
l/Hom
e/C
omm
. Lia
ison
Inst
ruct
iona
l25
2$1
1.88
$5.
52$4
0.00
720
3$1
6,12
1Li
brar
y M
edia
Cle
rkLi
brar
y/M
edia
214
$8.
84 $
5.67
$14.
726
188
$10,
318
Med
ia P
rodu
cer/T
echn
ical
Coo
rdin
ator
Libr
ary/
Med
ia6
$18.
86$1
1.30
$27.
038
250
$37,
598
Med
ia T
echn
icia
nLi
brar
y/M
edia
28$1
0.05
$6.
50$1
4.42
721
0$1
5,24
5C
onst
ruct
ion
Insp
ecto
rM
aint
enan
ce6
$26.
24$1
3.53
$38.
958
254
$52,
237
Dra
fting
Spe
cial
ist
Mai
nten
ance
1$1
2.98
$12.
98$1
2.98
826
0$2
6,99
8E
lect
rical
Eng
inee
rM
aint
enan
ce1
$21.
31$2
1.31
$21.
318
261
$44,
500
Ene
rgy
Sys
tem
s S
uper
viso
rM
aint
enan
ce1
$10.
30$1
0.30
$10.
305
220
$11,
330
HV
AC
Tec
hnic
ian
Mai
nten
ance
40$1
4.79
$9.
90$2
1.07
825
2$2
9,27
2In
sula
tion
Insp
ecto
rM
aint
enan
ce1
$15.
38$1
5.38
$15.
388
260
$31,
989
Lead
Mai
nten
ance
Tec
hnic
ian
Mai
nten
ance
32$1
4.87
$9.
75$2
8.63
825
8$2
9,75
9Le
ad M
aint
enan
ce W
orke
rM
aint
enan
ce31
$13.
50 $
9.60
$18.
398
253
$26,
861
Mai
nten
ance
App
rent
ice
Mai
nten
ance
16 $
9.27
$7.
50$1
5.12
820
9$1
5,68
9M
aint
enan
ce M
anag
er -
Ele
ctro
nics
Mai
nten
ance
1$1
6.63
$16.
63$1
6.63
824
0$3
1,93
0
Mai
nten
ance
Man
ager
-G
ener
alM
aint
enan
ce24
$17.
90 $
7.50
$28.
808
239
$32,
651
Mai
nten
ance
Sch
edul
ing
Spe
cial
ist
Mai
nten
ance
3$1
6.25
$15.
18$1
7.30
623
5$2
3,93
2
Mai
nten
ance
Sup
ervi
sor
Mai
nten
ance
89$1
6.36
$5.3
6$3
3.42
824
6$3
0,71
2M
aint
enan
ce T
echn
icia
n I
Mai
nten
ance
83$1
1.50
$7.5
0$1
8.75
825
2$2
2,39
1M
aint
enan
ce T
echn
icia
n II
Mai
nten
ance
80$1
2.31
$6.5
8$1
7.20
825
3$2
3,66
6M
aint
enan
ce T
echn
icia
n III
Mai
nten
ance
133
$13.
71$9
.25
$20.
898
249
$27,
049
Mai
nten
ance
Tec
hnic
ian
IVM
aint
enan
ce49
$14.
09$5
.50
$21.
788
247
$28,
068
Mai
nten
ance
Wor
ker I
Mai
nten
ance
189
$10.
10$5
.97
$18.
148
243
$18,
986
Mai
nten
ance
Wor
ker I
IM
aint
enan
ce13
6$1
1.57
$6.9
5$1
9.24
824
9$2
2,45
6P
reve
ntiv
e M
aint
enan
ceM
aint
enan
ce2
$12.
78$1
1.70
$13.
868
251
$25,
702
140
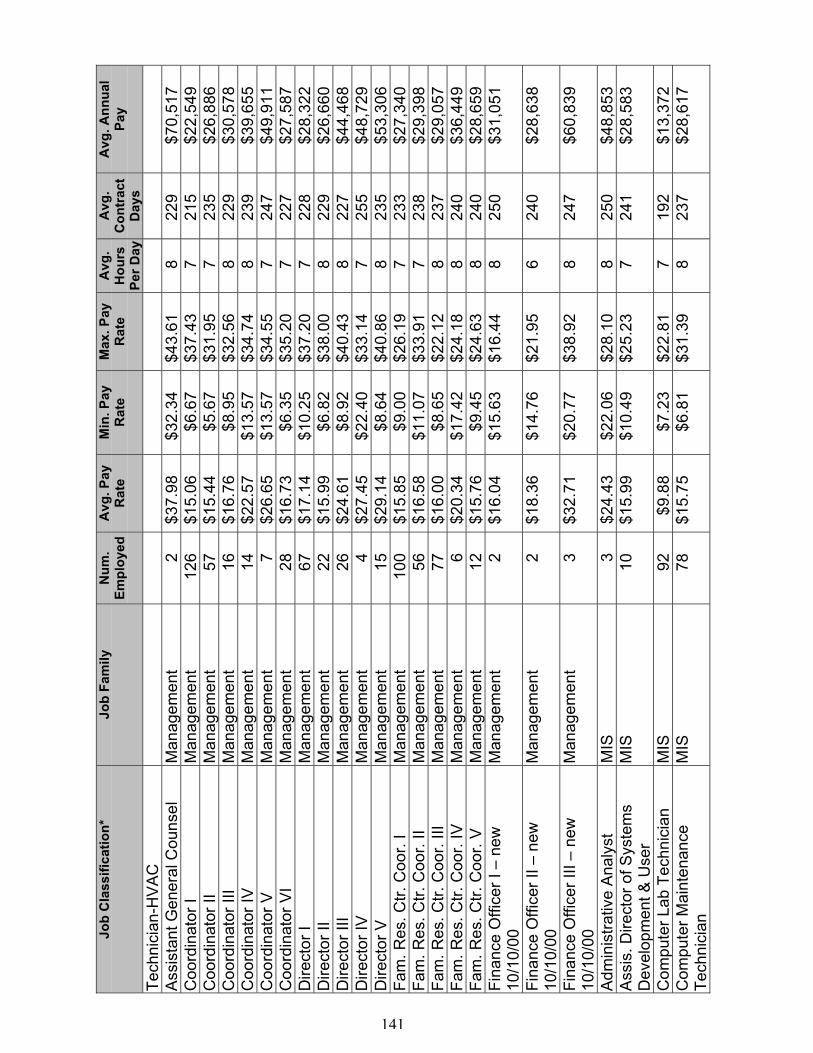
141
Job
Cla
ssifi
catio
n*Jo
b Fa
mily
Num
.Em
ploy
edA
vg. P
ayR
ate
Min
. Pay
Rat
eM
ax. P
ayR
ate
Avg
.H
ours
Per D
ay
Avg
.C
ontr
act
Day
s
Avg
. Ann
ual
Pay
Tech
nici
an-H
VA
CA
ssis
tant
Gen
eral
Cou
nsel
Man
agem
ent
2$3
7.98
$32.
34$4
3.61
822
9$7
0,51
7C
oord
inat
or I
Man
agem
ent
126
$15.
06$6
.67
$37.
437
215
$22,
549
Coo
rdin
ator
IIM
anag
emen
t57
$15.
44$5
.67
$31.
957
235
$26,
886
Coo
rdin
ator
III
Man
agem
ent
16$1
6.76
$8.9
5$3
2.56
822
9$3
0,57
8C
oord
inat
or IV
Man
agem
ent
14$2
2.57
$13.
57$3
4.74
823
9$3
9,65
5C
oord
inat
or V
Man
agem
ent
7$2
6.65
$13.
57$3
4.55
724
7$4
9,91
1C
oord
inat
or V
IM
anag
emen
t28
$16.
73$6
.35
$35.
207
227
$27,
587
Dire
ctor
IM
anag
emen
t67
$17.
14$1
0.25
$37.
207
228
$28,
322
Dire
ctor
IIM
anag
emen
t22
$15.
99$6
.82
$38.
008
229
$26,
660
Dire
ctor
III
Man
agem
ent
26$2
4.61
$8.9
2$4
0.43
822
7$4
4,46
8D
irect
or IV
Man
agem
ent
4$2
7.45
$22.
40$3
3.14
725
5$4
8,72
9D
irect
or V
Man
agem
ent
15$2
9.14
$8.6
4$4
0.86
823
5$5
3,30
6Fa
m. R
es. C
tr. C
oor.
IM
anag
emen
t10
0$1
5.85
$9.0
0$2
6.19
723
3$2
7,34
0Fa
m. R
es. C
tr. C
oor.
IIM
anag
emen
t56
$16.
58$1
1.07
$33.
917
238
$29,
398
Fam
. Res
. Ctr.
Coo
r. III
Man
agem
ent
77$1
6.00
$8.6
5$2
2.12
823
7$2
9,05
7Fa
m. R
es. C
tr. C
oor.
IVM
anag
emen
t6
$20.
34$1
7.42
$24.
188
240
$36,
449
Fam
. Res
. Ctr.
Coo
r. V
Man
agem
ent
12$1
5.76
$9.4
5$2
4.63
824
0$2
8,65
9Fi
nanc
e O
ffice
r I –
new
10/1
0/00
Man
agem
ent
2$1
6.04
$15.
63$1
6.44
825
0$3
1,05
1
Fina
nce
Offi
cer I
I – n
ew10
/10/
00M
anag
emen
t2
$18.
36$1
4.76
$21.
956
240
$28,
638
Fina
nce
Offi
cer I
II –
new
10/1
0/00
Man
agem
ent
3$3
2.71
$20.
77$3
8.92
824
7$6
0,83
9
Adm
inis
trativ
e A
naly
stM
IS3
$24.
43$2
2.06
$28.
108
250
$48,
853
Ass
is. D
irect
or o
f Sys
tem
sD
evel
opm
ent &
Use
rM
IS10
$15.
99$1
0.49
$25.
237
241
$28,
583
Com
pute
r Lab
Tec
hnic
ian
MIS
92$9
.88
$7.2
3$2
2.81
719
2$1
3,37
2C
ompu
ter M
aint
enan
ceTe
chni
cian
MIS
78$1
5.75
$6.8
1$3
1.39
823
7$2
8,61
7
141
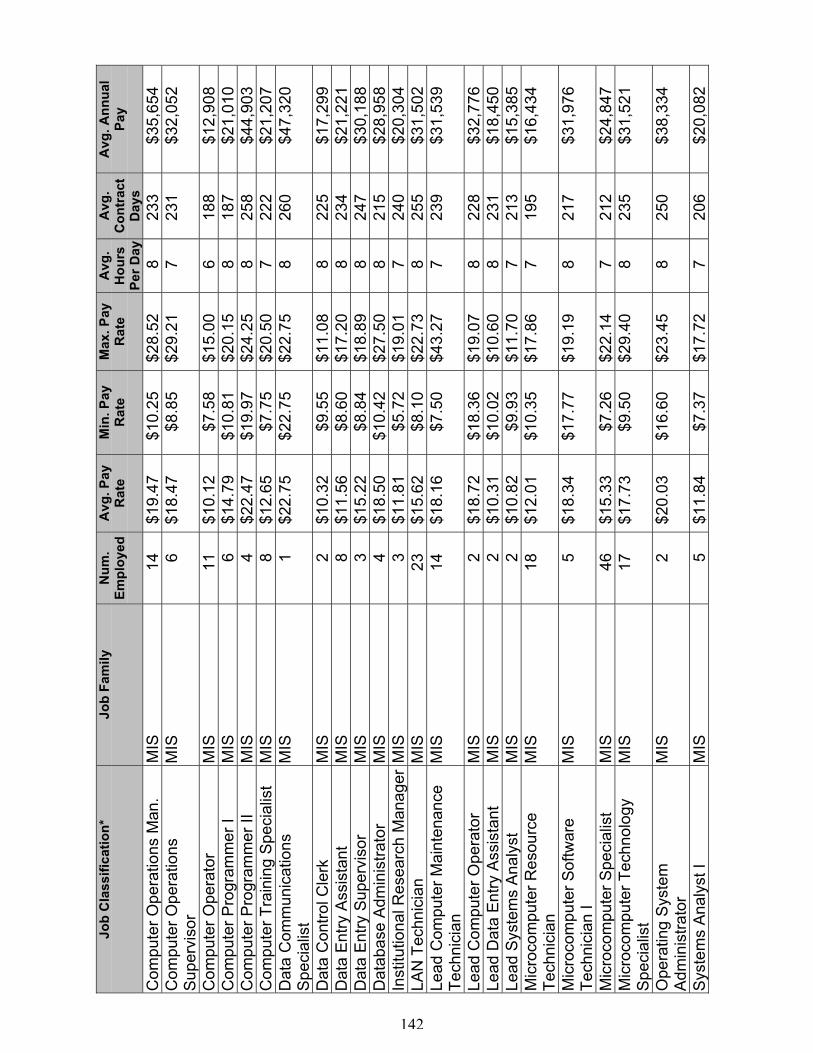
142
Job
Cla
ssifi
catio
n*Jo
b Fa
mily
Num
.Em
ploy
edA
vg. P
ayR
ate
Min
. Pay
Rat
eM
ax. P
ayR
ate
Avg
.H
ours
Per D
ay
Avg
.C
ontr
act
Day
s
Avg
. Ann
ual
Pay
Com
pute
r Ope
ratio
ns M
an.
MIS
14$1
9.47
$10.
25$2
8.52
823
3$3
5,65
4C
ompu
ter O
pera
tions
Sup
ervi
sor
MIS
6$1
8.47
$8.8
5$2
9.21
723
1$3
2,05
2
Com
pute
r Ope
rato
rM
IS11
$10.
12$7
.58
$15.
006
188
$12,
908
Com
pute
r Pro
gram
mer
IM
IS6
$14.
79$1
0.81
$20.
158
187
$21,
010
Com
pute
r Pro
gram
mer
IIM
IS4
$22.
47$1
9.97
$24.
258
258
$44,
903
Com
pute
r Tra
inin
g S
peci
alis
tM
IS8
$12.
65$7
.75
$20.
507
222
$21,
207
Dat
a C
omm
unic
atio
nsS
peci
alis
tM
IS1
$22.
75$2
2.75
$22.
758
260
$47,
320
Dat
a C
ontro
l Cle
rkM
IS2
$10.
32$9
.55
$11.
088
225
$17,
299
Dat
a E
ntry
Ass
ista
ntM
IS8
$11.
56$8
.60
$17.
208
234
$21,
221
Dat
a E
ntry
Sup
ervi
sor
MIS
3$1
5.22
$8.8
4$1
8.89
824
7$3
0,18
8D
atab
ase
Adm
inis
trato
rM
IS4
$18.
50$1
0.42
$27.
508
215
$28,
958
Inst
itutio
nal R
esea
rch
Man
ager
MIS
3$1
1.81
$5.7
2$1
9.01
724
0$2
0,30
4LA
N T
echn
icia
nM
IS23
$15.
62$8
.10
$22.
738
255
$31,
502
Lead
Com
pute
r Mai
nten
ance
Tech
nici
anM
IS14
$18.
16$7
.50
$43.
277
239
$31,
539
Lead
Com
pute
r Ope
rato
rM
IS2
$18.
72$1
8.36
$19.
078
228
$32,
776
Lead
Dat
a E
ntry
Ass
ista
ntM
IS2
$10.
31$1
0.02
$10.
608
231
$18,
450
Lead
Sys
tem
s A
naly
stM
IS2
$10.
82$9
.93
$11.
707
213
$15,
385
Mic
roco
mpu
ter R
esou
rce
Tech
nici
anM
IS18
$12.
01$1
0.35
$17.
867
195
$16,
434
Mic
roco
mpu
ter S
oftw
are
Tech
nici
an I
MIS
5$1
8.34
$17.
77$1
9.19
821
7$3
1,97
6
Mic
roco
mpu
ter S
peci
alis
tM
IS46
$15.
33$7
.26
$22.
147
212
$24,
847
Mic
roco
mpu
ter T
echn
olog
yS
peci
alis
tM
IS17
$17.
73$9
.50
$29.
408
235
$31,
521
Ope
ratin
g S
yste
mA
dmin
istra
tor
MIS
2$2
0.03
$16.
60$2
3.45
825
0$3
8,33
4
Sys
tem
s A
naly
st I
MIS
5$1
1.84
$7.3
7$1
7.72
720
6$2
0,08
2
142
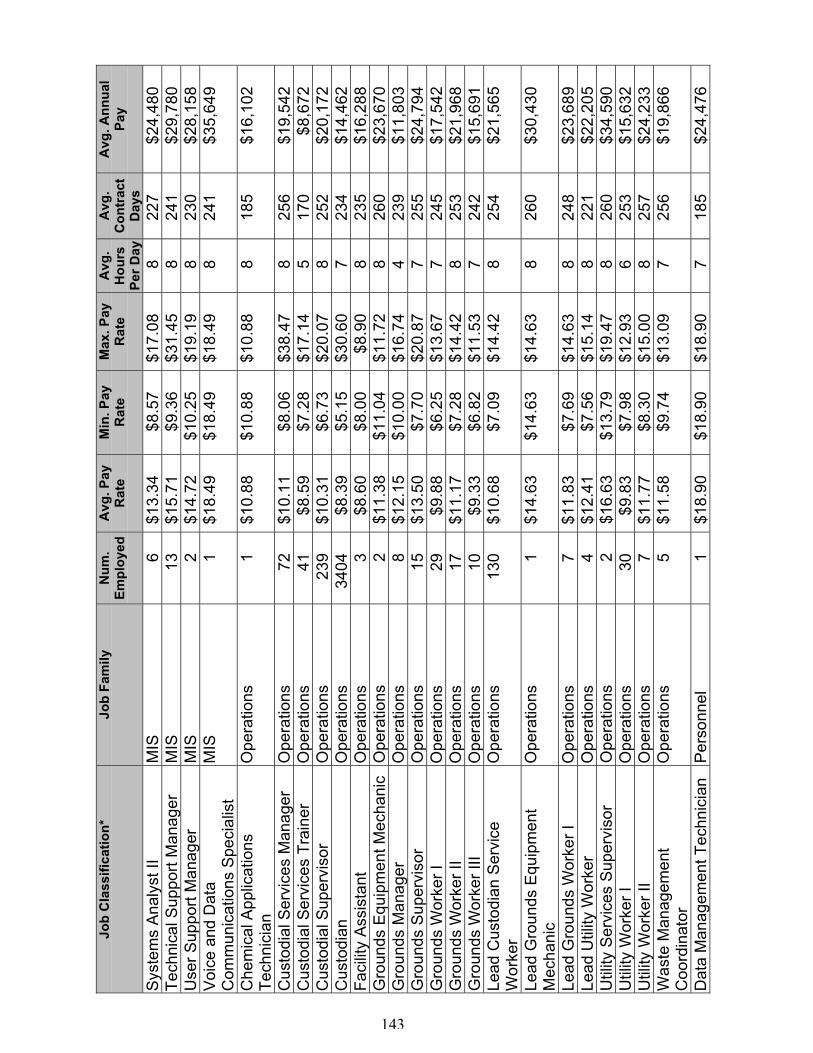
143
Job
Cla
ssifi
catio
n*Jo
b Fa
mily
Num
.Em
ploy
edA
vg. P
ayR
ate
Min
. Pay
Rat
eM
ax. P
ayR
ate
Avg
.H
ours
Per D
ay
Avg
.C
ontr
act
Day
s
Avg
. Ann
ual
Pay
Sys
tem
s A
naly
st II
MIS
6$1
3.34
$8.5
7$1
7.08
822
7$2
4,48
0Te
chni
cal S
uppo
rt M
anag
erM
IS13
$15.
71$9
.36
$31.
458
241
$29,
780
Use
r Sup
port
Man
ager
MIS
2$1
4.72
$10.
25$1
9.19
823
0$2
8,15
8V
oice
and
Dat
aC
omm
unic
atio
ns S
peci
alis
tM
IS1
$18.
49$1
8.49
$18.
498
241
$35,
649
Che
mic
al A
pplic
atio
nsTe
chni
cian
Ope
ratio
ns1
$10.
88$1
0.88
$10.
888
185
$16,
102
Cus
todi
al S
ervi
ces
Man
ager
Ope
ratio
ns72
$10.
11$8
.06
$38.
478
256
$19,
542
Cus
todi
al S
ervi
ces
Trai
ner
Ope
ratio
ns41
$8.5
9$7
.28
$17.
145
170
$8,6
72C
usto
dial
Sup
ervi
sor
Ope
ratio
ns23
9$1
0.31
$6.7
3$2
0.07
825
2$2
0,17
2C
usto
dian
Ope
ratio
ns34
04$8
.39
$5.1
5$3
0.60
723
4$1
4,46
2Fa
cilit
y A
ssis
tant
Ope
ratio
ns3
$8.6
0$8
.00
$8.9
08
235
$16,
288
Gro
unds
Equ
ipm
ent M
echa
nic
Ope
ratio
ns2
$11.
38$1
1.04
$11.
728
260
$23,
670
Gro
unds
Man
ager
Ope
ratio
ns8
$12.
15$1
0.00
$16.
744
239
$11,
803
Gro
unds
Sup
ervi
sor
Ope
ratio
ns15
$13.
50$7
.70
$20.
877
255
$24,
794
Gro
unds
Wor
ker I
Ope
ratio
ns29
$9.8
8$6
.25
$13.
677
245
$17,
542
Gro
unds
Wor
ker I
IO
pera
tions
17$1
1.17
$7.2
8$1
4.42
825
3$2
1,96
8G
roun
ds W
orke
r III
Ope
ratio
ns10
$9.3
3$6
.82
$11.
537
242
$15,
691
Lead
Cus
todi
an S
ervi
ceW
orke
rO
pera
tions
130
$10.
68$7
.09
$14.
428
254
$21,
565
Lead
Gro
unds
Equ
ipm
ent
Mec
hani
cO
pera
tions
1$1
4.63
$14.
63$1
4.63
826
0$3
0,43
0
Lead
Gro
unds
Wor
ker I
Ope
ratio
ns7
$11.
83$7
.69
$14.
638
248
$23,
689
Lead
Util
ity W
orke
rO
pera
tions
4$1
2.41
$7.5
6$1
5.14
822
1$2
2,20
5U
tility
Ser
vice
s S
uper
viso
rO
pera
tions
2$1
6.63
$13.
79$1
9.47
826
0$3
4,59
0U
tility
Wor
ker I
Ope
ratio
ns30
$9.8
3$7
.98
$12.
936
253
$15,
632
Util
ity W
orke
r II
Ope
ratio
ns7
$11.
77$8
.30
$15.
008
257
$24,
233
Was
te M
anag
emen
tC
oord
inat
orO
pera
tions
5$1
1.58
$9.7
4$1
3.09
725
6$1
9,86
6
Dat
a M
anag
emen
t Tec
hnic
ian
Per
sonn
el1
$18.
90$1
8.90
$18.
907
185
$24,
476
143
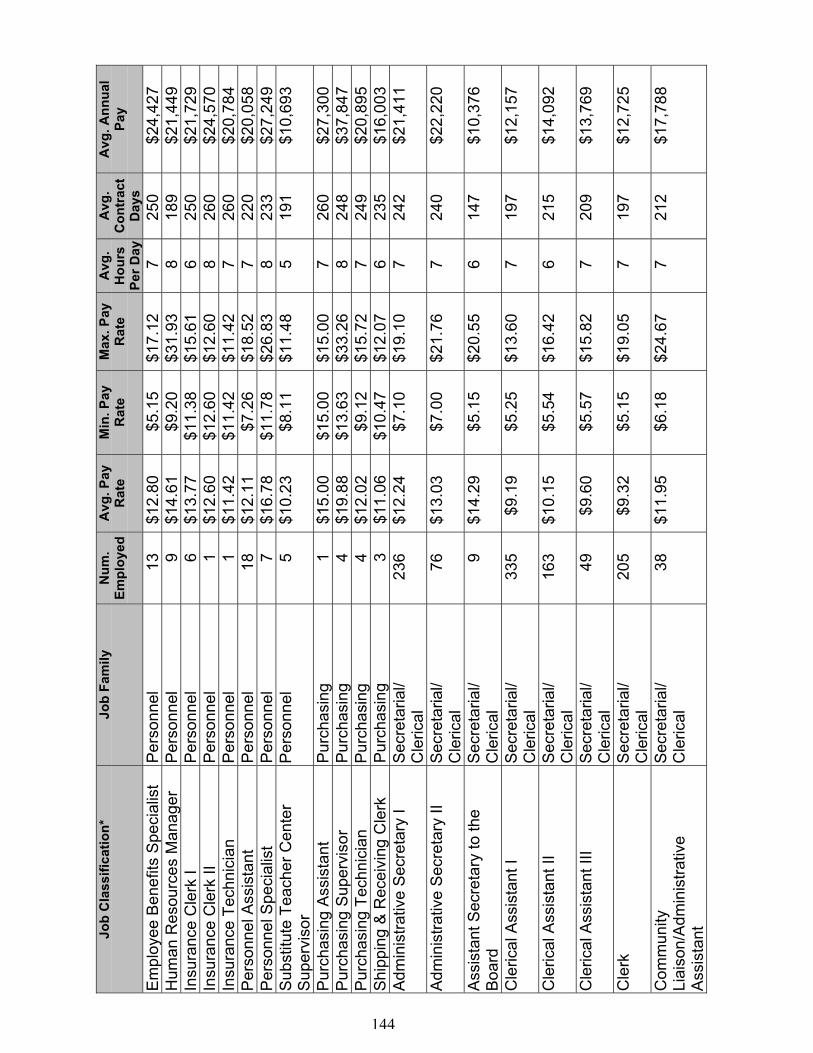
144
Job
Cla
ssifi
catio
n*Jo
b Fa
mily
Num
.Em
ploy
edA
vg. P
ayR
ate
Min
. Pay
Rat
eM
ax. P
ayR
ate
Avg
.H
ours
Per D
ay
Avg
.C
ontr
act
Day
s
Avg
. Ann
ual
Pay
Em
ploy
ee B
enef
its S
peci
alis
tP
erso
nnel
13$1
2.80
$5.1
5$1
7.12
725
0$2
4,42
7H
uman
Res
ourc
es M
anag
erP
erso
nnel
9$1
4.61
$9.2
0$3
1.93
818
9$2
1,44
9In
sura
nce
Cle
rk I
Per
sonn
el6
$13.
77$1
1.38
$15.
616
250
$21,
729
Insu
ranc
e C
lerk
IIP
erso
nnel
1$1
2.60
$12.
60$1
2.60
826
0$2
4,57
0In
sura
nce
Tech
nici
anP
erso
nnel
1$1
1.42
$11.
42$1
1.42
726
0$2
0,78
4P
erso
nnel
Ass
ista
ntP
erso
nnel
18$1
2.11
$7.2
6$1
8.52
722
0$2
0,05
8P
erso
nnel
Spe
cial
ist
Per
sonn
el7
$16.
78$1
1.78
$26.
838
233
$27,
249
Sub
stitu
te T
each
er C
ente
rS
uper
viso
rP
erso
nnel
5$1
0.23
$8.1
1$1
1.48
519
1$1
0,69
3
Pur
chas
ing
Ass
ista
ntP
urch
asin
g1
$15.
00$1
5.00
$15.
007
260
$27,
300
Pur
chas
ing
Sup
ervi
sor
Pur
chas
ing
4$1
9.88
$13.
63$3
3.26
824
8$3
7,84
7P
urch
asin
g Te
chni
cian
Pur
chas
ing
4$1
2.02
$9.1
2$1
5.72
724
9$2
0,89
5S
hipp
ing
& R
ecei
ving
Cle
rkP
urch
asin
g3
$11.
06$1
0.47
$12.
076
235
$16,
003
Adm
inis
trativ
e S
ecre
tary
IS
ecre
taria
l/C
leric
al23
6$1
2.24
$7.1
0$1
9.10
724
2$2
1,41
1
Adm
inis
trativ
e S
ecre
tary
IIS
ecre
taria
l/C
leric
al76
$13.
03$7
.00
$21.
767
240
$22,
220
Ass
ista
nt S
ecre
tary
to th
eB
oard
Sec
reta
rial/
Cle
rical
9$1
4.29
$5.1
5$2
0.55
614
7$1
0,37
6
Cle
rical
Ass
ista
nt I
Sec
reta
rial/
Cle
rical
335
$9.1
9$5
.25
$13.
607
197
$12,
157
Cle
rical
Ass
ista
nt II
Sec
reta
rial/
Cle
rical
163
$10.
15$5
.54
$16.
426
215
$14,
092
Cle
rical
Ass
ista
nt II
IS
ecre
taria
l/C
leric
al49
$9.6
0$5
.57
$15.
827
209
$13,
769
Cle
rkS
ecre
taria
l/C
leric
al20
5$9
.32
$5.1
5$1
9.05
719
7$1
2,72
5
Com
mun
ityLi
aiso
n/A
dmin
istra
tive
Ass
ista
nt
Sec
reta
rial/
Cle
rical
38$1
1.95
$6.1
8$2
4.67
721
2$1
7,78
8
144
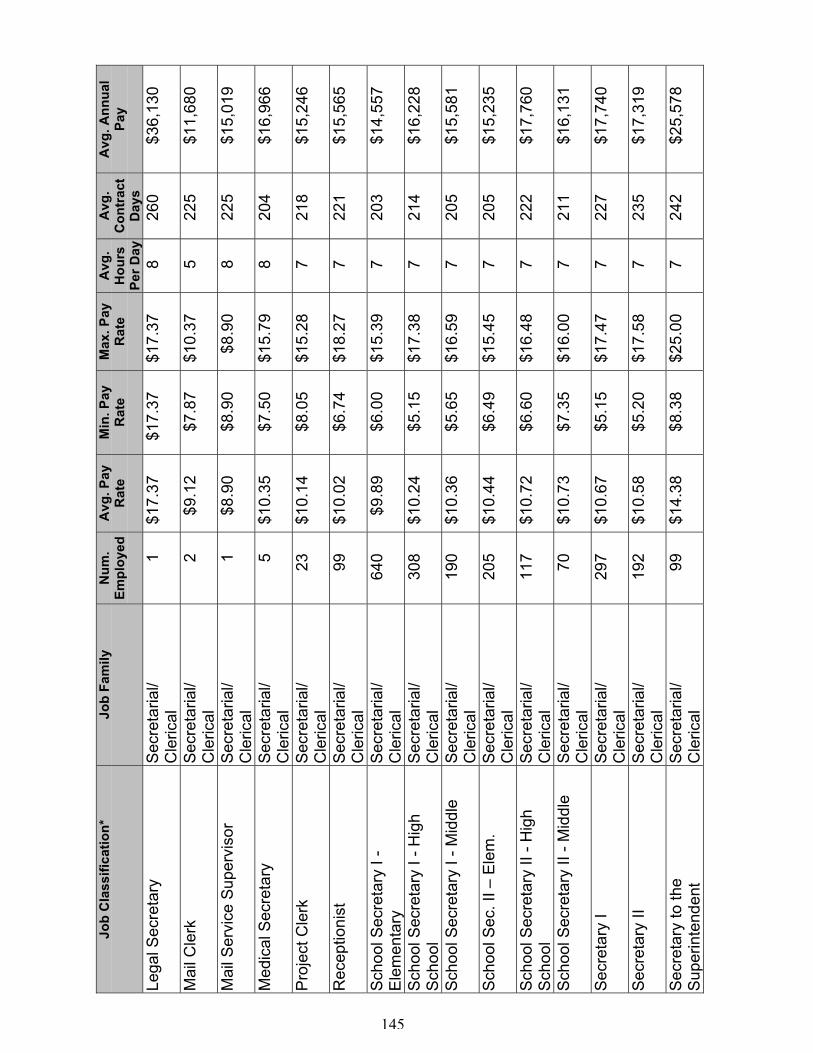
145
Job
Cla
ssifi
catio
n*Jo
b Fa
mily
Num
.Em
ploy
edA
vg. P
ayR
ate
Min
. Pay
Rat
eM
ax. P
ayR
ate
Avg
.H
ours
Per D
ay
Avg
.C
ontr
act
Day
s
Avg
. Ann
ual
Pay
Lega
l Sec
reta
ryS
ecre
taria
l/C
leric
al1
$17.
37$1
7.37
$17.
378
260
$36,
130
Mai
l Cle
rkS
ecre
taria
l/C
leric
al2
$9.1
2$7
.87
$10.
375
225
$11,
680
Mai
l Ser
vice
Sup
ervi
sor
Sec
reta
rial/
Cle
rical
1$8
.90
$8.9
0$8
.90
822
5$1
5,01
9
Med
ical
Sec
reta
ryS
ecre
taria
l/C
leric
al5
$10.
35$7
.50
$15.
798
204
$16,
966
Pro
ject
Cle
rkS
ecre
taria
l/C
leric
al23
$10.
14$8
.05
$15.
287
218
$15,
246
Rec
eptio
nist
Sec
reta
rial/
Cle
rical
99$1
0.02
$6.7
4$1
8.27
722
1$1
5,56
5
Sch
ool S
ecre
tary
I -
Ele
men
tary
Sec
reta
rial/
Cle
rical
640
$9.8
9$6
.00
$15.
397
203
$14,
557
Sch
ool S
ecre
tary
I - H
igh
Sch
ool
Sec
reta
rial/
Cle
rical
308
$10.
24$5
.15
$17.
387
214
$16,
228
Sch
ool S
ecre
tary
I - M
iddl
eS
ecre
taria
l/C
leric
al19
0$1
0.36
$5.6
5$1
6.59
720
5$1
5,58
1
Sch
ool S
ec. I
I – E
lem
.S
ecre
taria
l/C
leric
al20
5$1
0.44
$6.4
9$1
5.45
720
5$1
5,23
5
Sch
ool S
ecre
tary
II -
Hig
hS
choo
lS
ecre
taria
l/C
leric
al11
7$1
0.72
$6.6
0$1
6.48
722
2$1
7,76
0
Sch
ool S
ecre
tary
II -
Mid
dle
Sec
reta
rial/
Cle
rical
70$1
0.73
$7.3
5$1
6.00
721
1$1
6,13
1
Sec
reta
ry I
Sec
reta
rial/
Cle
rical
297
$10.
67$5
.15
$17.
477
227
$17,
740
Sec
reta
ry II
Sec
reta
rial/
Cle
rical
192
$10.
58$5
.20
$17.
587
235
$17,
319
Sec
reta
ry to
the
Sup
erin
tend
ent
Sec
reta
rial/
Cle
rical
99$1
4.38
$8.3
8$2
5.00
724
2$2
5,57
8
145
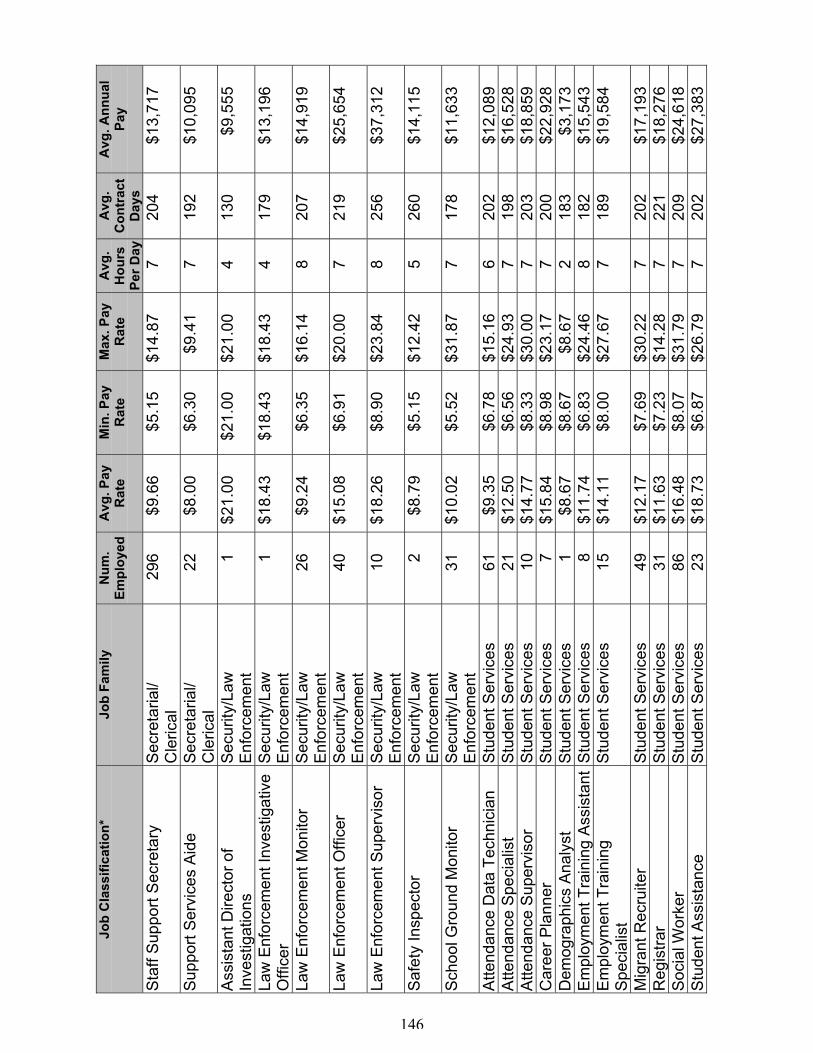
146
Job
Cla
ssifi
catio
n*Jo
b Fa
mily
Num
.Em
ploy
edA
vg. P
ayR
ate
Min
. Pay
Rat
eM
ax. P
ayR
ate
Avg
.H
ours
Per D
ay
Avg
.C
ontr
act
Day
s
Avg
. Ann
ual
Pay
Sta
ff S
uppo
rt S
ecre
tary
Sec
reta
rial/
Cle
rical
296
$9.6
6$5
.15
$14.
877
204
$13,
717
Sup
port
Ser
vice
s A
ide
Sec
reta
rial/
Cle
rical
22$8
.00
$6.3
0$9
.41
719
2$1
0,09
5
Ass
ista
nt D
irect
or o
fIn
vest
igat
ions
Sec
urity
/Law
Enf
orce
men
t1
$21.
00$2
1.00
$21.
004
130
$9,5
55
Law
Enf
orce
men
t Inv
estig
ativ
eO
ffice
rS
ecur
ity/L
awE
nfor
cem
ent
1$1
8.43
$18.
43$1
8.43
417
9$1
3,19
6
Law
Enf
orce
men
t Mon
itor
Sec
urity
/Law
Enf
orce
men
t26
$9.2
4$6
.35
$16.
148
207
$14,
919
Law
Enf
orce
men
t Offi
cer
Sec
urity
/Law
Enf
orce
men
t40
$15.
08$6
.91
$20.
007
219
$25,
654
Law
Enf
orce
men
t Sup
ervi
sor
Sec
urity
/Law
Enf
orce
men
t10
$18.
26$8
.90
$23.
848
256
$37,
312
Saf
ety
Insp
ecto
rS
ecur
ity/L
awE
nfor
cem
ent
2$8
.79
$5.1
5$1
2.42
526
0$1
4,11
5
Sch
ool G
roun
d M
onito
rS
ecur
ity/L
awE
nfor
cem
ent
31$1
0.02
$5.5
2$3
1.87
717
8$1
1,63
3
Atte
ndan
ce D
ata
Tech
nici
anS
tude
nt S
ervi
ces
61$9
.35
$6.7
8$1
5.16
620
2$1
2,08
9A
ttend
ance
Spe
cial
ist
Stu
dent
Ser
vice
s21
$12.
50$6
.56
$24.
937
198
$16,
528
Atte
ndan
ce S
uper
viso
rS
tude
nt S
ervi
ces
10$1
4.77
$8.3
3$3
0.00
720
3$1
8,85
9C
aree
r Pla
nner
Stu
dent
Ser
vice
s7
$15.
84$8
.98
$23.
177
200
$22,
928
Dem
ogra
phic
s A
naly
stS
tude
nt S
ervi
ces
1$8
.67
$8.6
7$8
.67
218
3$3
,173
Em
ploy
men
t Tra
inin
g A
ssis
tant
Stu
dent
Ser
vice
s8
$11.
74$6
.83
$24.
468
182
$15,
543
Em
ploy
men
t Tra
inin
gS
peci
alis
tS
tude
nt S
ervi
ces
15$1
4.11
$8.0
0$2
7.67
718
9$1
9,58
4
Mig
rant
Rec
ruite
rS
tude
nt S
ervi
ces
49$1
2.17
$7.6
9$3
0.22
720
2$1
7,19
3R
egis
trar
Stu
dent
Ser
vice
s31
$11.
63$7
.23
$14.
287
221
$18,
276
Soc
ial W
orke
rS
tude
nt S
ervi
ces
86$1
6.48
$8.0
7$3
1.79
720
9$2
4,61
8S
tude
nt A
ssis
tanc
eS
tude
nt S
ervi
ces
23$1
8.73
$6.8
7$2
6.79
720
2$2
7,38
3
146
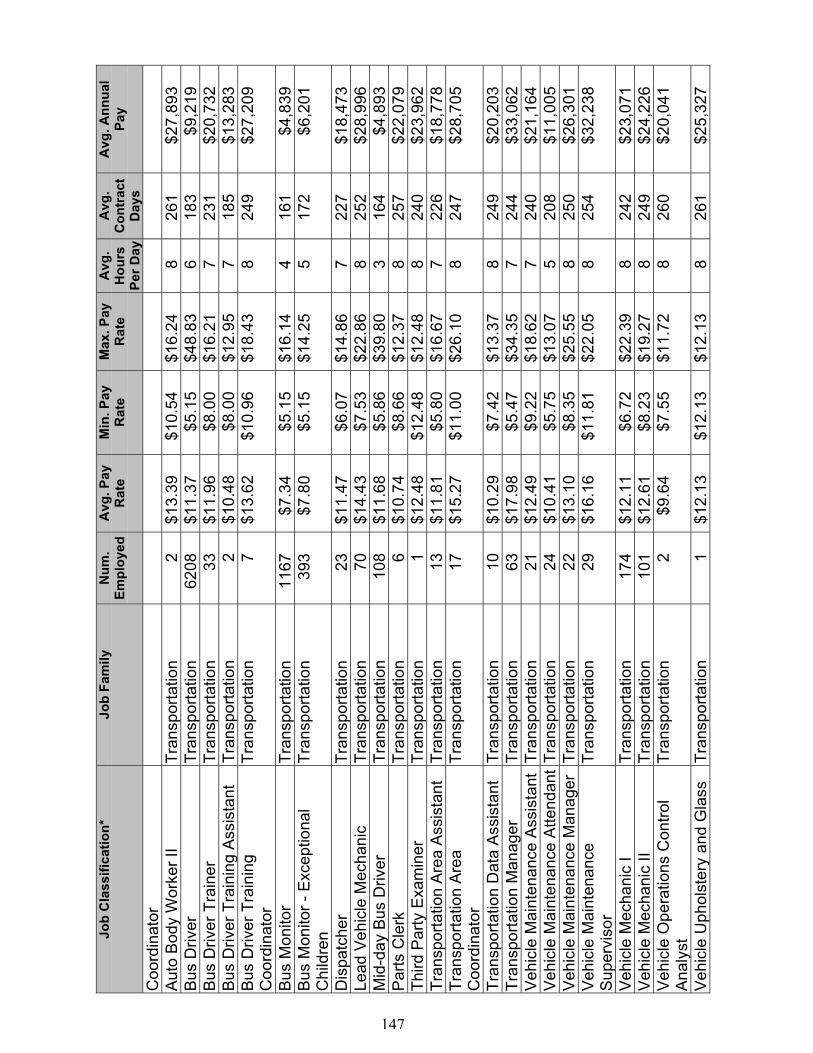
147
Job
Cla
ssifi
catio
n*Jo
b Fa
mily
Num
.Em
ploy
edA
vg. P
ayR
ate
Min
. Pay
Rat
eM
ax. P
ayR
ate
Avg
.H
ours
Per D
ay
Avg
.C
ontr
act
Day
s
Avg
. Ann
ual
Pay
Coo
rdin
ator
Aut
o B
ody
Wor
ker I
ITr
ansp
orta
tion
2$1
3.39
$10.
54$1
6.24
826
1$2
7,89
3B
us D
river
Tran
spor
tatio
n62
08$1
1.37
$5.1
5$4
8.83
618
3$9
,219
Bus
Driv
er T
rain
erTr
ansp
orta
tion
33$1
1.96
$8.0
0$1
6.21
723
1$2
0,73
2B
us D
river
Tra
inin
g A
ssis
tant
Tran
spor
tatio
n2
$10.
48$8
.00
$12.
957
185
$13,
283
Bus
Driv
er T
rain
ing
Coo
rdin
ator
Tran
spor
tatio
n7
$13.
62$1
0.96
$18.
438
249
$27,
209
Bus
Mon
itor
Tran
spor
tatio
n11
67$7
.34
$5.1
5$1
6.14
416
1$4
,839
Bus
Mon
itor -
Exc
eptio
nal
Chi
ldre
nTr
ansp
orta
tion
393
$7.8
0$5
.15
$14.
255
172
$6,2
01
Dis
patc
her
Tran
spor
tatio
n23
$11.
47$6
.07
$14.
867
227
$18,
473
Lead
Veh
icle
Mec
hani
cTr
ansp
orta
tion
70$1
4.43
$7.5
3$2
2.86
825
2$2
8,99
6M
id-d
ay B
us D
river
Tran
spor
tatio
n10
8$1
1.68
$5.8
6$3
9.80
316
4$4
,893
Par
ts C
lerk
Tran
spor
tatio
n6
$10.
74$8
.66
$12.
378
257
$22,
079
Third
Par
ty E
xam
iner
Tran
spor
tatio
n1
$12.
48$1
2.48
$12.
488
240
$23,
962
Tran
spor
tatio
n A
rea
Ass
ista
ntTr
ansp
orta
tion
13$1
1.81
$5.8
0$1
6.67
722
6$1
8,77
8Tr
ansp
orta
tion
Are
aC
oord
inat
orTr
ansp
orta
tion
17$1
5.27
$11.
00$2
6.10
824
7$2
8,70
5
Tran
spor
tatio
n D
ata
Ass
ista
ntTr
ansp
orta
tion
10$1
0.29
$7.4
2$1
3.37
824
9$2
0,20
3Tr
ansp
orta
tion
Man
ager
Tran
spor
tatio
n63
$17.
98$5
.47
$34.
357
244
$33,
062
Veh
icle
Mai
nten
ance
Ass
ista
ntTr
ansp
orta
tion
21$1
2.49
$9.2
2$1
8.62
724
0$2
1,16
4V
ehic
le M
aint
enan
ce A
ttend
ant
Tran
spor
tatio
n24
$10.
41$5
.75
$13.
075
208
$11,
005
Veh
icle
Mai
nten
ance
Man
ager
Tran
spor
tatio
n22
$13.
10$8
.35
$25.
558
250
$26,
301
Veh
icle
Mai
nten
ance
Sup
ervi
sor
Tran
spor
tatio
n29
$16.
16$1
1.81
$22.
058
254
$32,
238
Veh
icle
Mec
hani
c I
Tran
spor
tatio
n17
4$1
2.11
$6.7
2$2
2.39
824
2$2
3,07
1V
ehic
le M
echa
nic
IITr
ansp
orta
tion
101
$12.
61$8
.23
$19.
278
249
$24,
226
Veh
icle
Ope
ratio
ns C
ontro
lA
naly
stTr
ansp
orta
tion
2$9
.64
$7.5
5$1
1.72
826
0$2
0,04
1
Veh
icle
Uph
olst
ery
and
Gla
ssTr
ansp
orta
tion
1$1
2.13
$12.
13$1
2.13
826
1$2
5,32
7
147
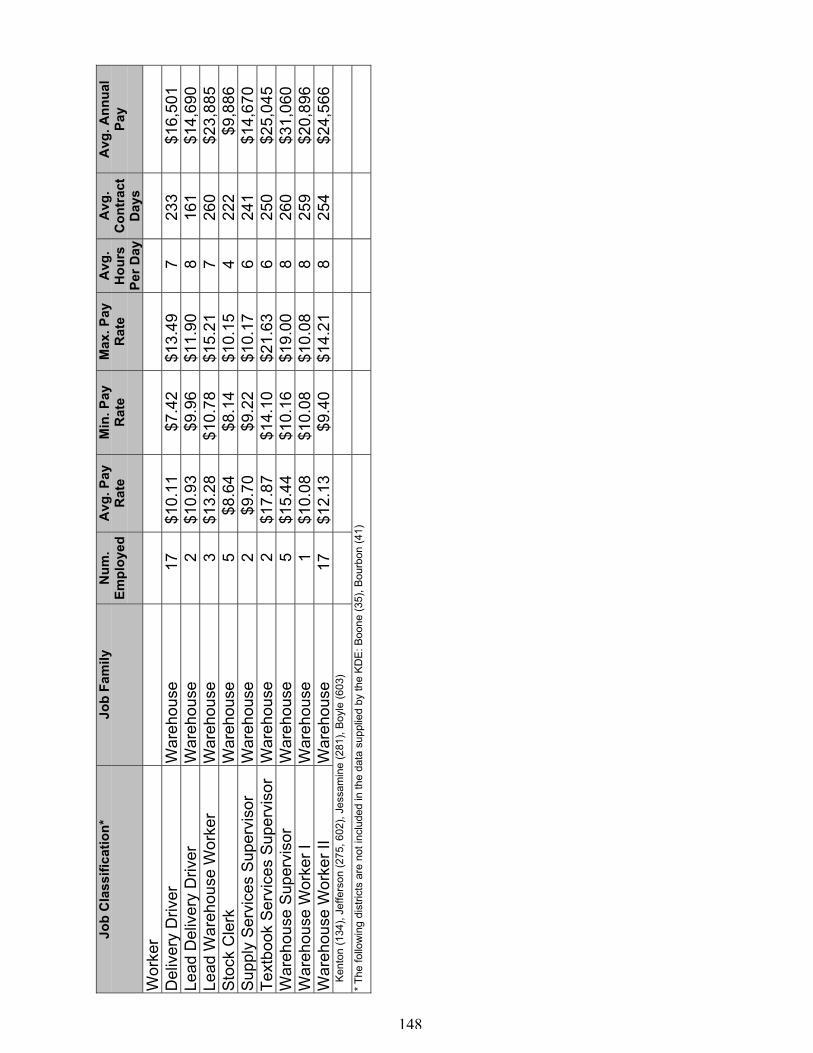
148
Job
Cla
ssifi
catio
n*Jo
b Fa
mily
Num
.Em
ploy
edA
vg. P
ayR
ate
Min
. Pay
Rat
eM
ax. P
ayR
ate
Avg
.H
ours
Per D
ay
Avg
.C
ontr
act
Day
s
Avg
. Ann
ual
Pay
Wor
ker
Del
iver
y D
river
War
ehou
se17
$10.
11$7
.42
$13.
497
233
$16,
501
Lead
Del
iver
y D
river
War
ehou
se2
$10.
93$9
.96
$11.
908
161
$14,
690
Lead
War
ehou
se W
orke
rW
areh
ouse
3$1
3.28
$10.
78$1
5.21
726
0$2
3,88
5S
tock
Cle
rkW
areh
ouse
5$8
.64
$8.1
4$1
0.15
422
2$9
,886
Sup
ply
Ser
vice
s S
uper
viso
rW
areh
ouse
2$9
.70
$9.2
2$1
0.17
624
1$1
4,67
0Te
xtbo
ok S
ervi
ces
Sup
ervi
sor
War
ehou
se2
$17.
87$1
4.10
$21.
636
250
$25,
045
War
ehou
se S
uper
viso
rW
areh
ouse
5$1
5.44
$10.
16$1
9.00
826
0$3
1,06
0W
areh
ouse
Wor
ker I
War
ehou
se1
$10.
08$1
0.08
$10.
088
259
$20,
896
War
ehou
se W
orke
r II
War
ehou
se17
$12.
13$9
.40
$14.
218
254
$24,
566
Ke
nton
(134
), Je
ffers
on (2
75, 6
02),
Jess
amin
e (2
81),
Boyl
e (6
03)
* Th
e fo
llow
ing
dist
ricts
are
not
incl
uded
in th
e da
ta s
uppl
ied
by th
e KD
E: B
oone
(35)
, Bou
rbon
(41)
148
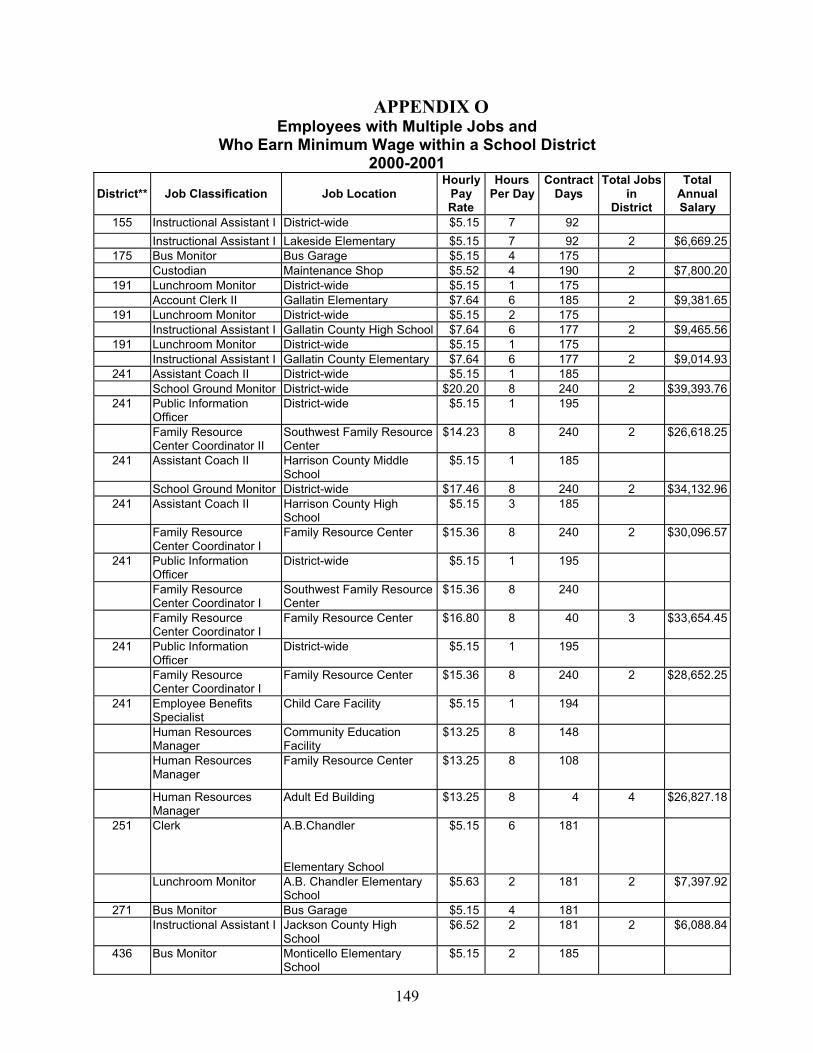
149
APPENDIX OEmployees with Multiple Jobs and
Who Earn Minimum Wage within a School District2000-2001
District** Job Classification Job LocationHourly
PayRate
HoursPer Day
ContractDays
Total Jobsin
District
TotalAnnualSalary
155 Instructional Assistant I District-wide $5.15 7 92Instructional Assistant I Lakeside Elementary $5.15 7 92 2 $6,669.25
175 Bus Monitor Bus Garage $5.15 4 175Custodian Maintenance Shop $5.52 4 190 2 $7,800.20
191 Lunchroom Monitor District-wide $5.15 1 175Account Clerk II Gallatin Elementary $7.64 6 185 2 $9,381.65
191 Lunchroom Monitor District-wide $5.15 2 175Instructional Assistant I Gallatin County High School $7.64 6 177 2 $9,465.56
191 Lunchroom Monitor District-wide $5.15 1 175Instructional Assistant I Gallatin County Elementary $7.64 6 177 2 $9,014.93
241 Assistant Coach II District-wide $5.15 1 185School Ground Monitor District-wide $20.20 8 240 2 $39,393.76
241 Public InformationOfficer
District-wide $5.15 1 195
Family ResourceCenter Coordinator II
Southwest Family ResourceCenter
$14.23 8 240 2 $26,618.25
241 Assistant Coach II Harrison County MiddleSchool
$5.15 1 185
School Ground Monitor District-wide $17.46 8 240 2 $34,132.96241 Assistant Coach II Harrison County High
School $5.15 3 185
Family ResourceCenter Coordinator I
Family Resource Center $15.36 8 240 2 $30,096.57
241 Public InformationOfficer
District-wide $5.15 1 195
Family ResourceCenter Coordinator I
Southwest Family ResourceCenter
$15.36 8 240
Family ResourceCenter Coordinator I
Family Resource Center $16.80 8 40 3 $33,654.45
241 Public InformationOfficer
District-wide $5.15 1 195
Family ResourceCenter Coordinator I
Family Resource Center $15.36 8 240 2 $28,652.25
241 Employee BenefitsSpecialist
Child Care Facility $5.15 1 194
Human ResourcesManager
Community EducationFacility
$13.25 8 148
Human ResourcesManager
Family Resource Center $13.25 8 108
Human ResourcesManager
Adult Ed Building $13.25 8 4 4 $26,827.18
251 Clerk A.B.Chandler
Elementary School
$5.15 6 181
Lunchroom Monitor A.B. Chandler ElementarySchool
$5.63 2 181 2 $7,397.92
271 Bus Monitor Bus Garage $5.15 4 181Instructional Assistant I Jackson County High
School $6.52 2 181 2 $6,088.84
436 Bus Monitor Monticello ElementarySchool
$5.15 2 185
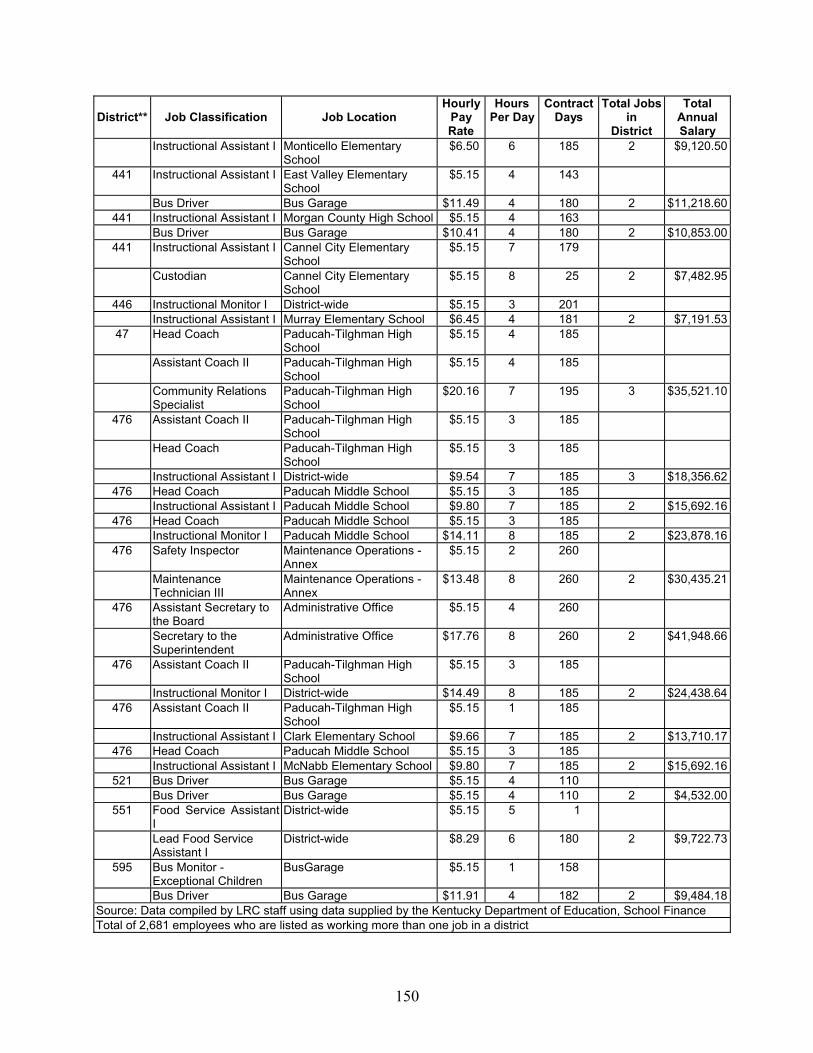
150
District** Job Classification Job LocationHourly
PayRate
HoursPer Day
ContractDays
Total Jobsin
District
TotalAnnualSalary
Instructional Assistant I Monticello ElementarySchool
$6.50 6 185 2 $9,120.50
441 Instructional Assistant I East Valley ElementarySchool
$5.15 4 143
Bus Driver Bus Garage $11.49 4 180 2 $11,218.60441 Instructional Assistant I Morgan County High School $5.15 4 163
Bus Driver Bus Garage $10.41 4 180 2 $10,853.00441 Instructional Assistant I Cannel City Elementary
School $5.15 7 179
Custodian Cannel City ElementarySchool
$5.15 8 25 2 $7,482.95
446 Instructional Monitor I District-wide $5.15 3 201Instructional Assistant I Murray Elementary School $6.45 4 181 2 $7,191.53
47 Head Coach Paducah-Tilghman HighSchool
$5.15 4 185
Assistant Coach II Paducah-Tilghman HighSchool
$5.15 4 185
Community RelationsSpecialist
Paducah-Tilghman HighSchool
$20.16 7 195 3 $35,521.10
476 Assistant Coach II Paducah-Tilghman HighSchool
$5.15 3 185
Head Coach Paducah-Tilghman HighSchool
$5.15 3 185
Instructional Assistant I District-wide $9.54 7 185 3 $18,356.62476 Head Coach Paducah Middle School $5.15 3 185
Instructional Assistant I Paducah Middle School $9.80 7 185 2 $15,692.16476 Head Coach Paducah Middle School $5.15 3 185
Instructional Monitor I Paducah Middle School $14.11 8 185 2 $23,878.16476 Safety Inspector Maintenance Operations -
Annex $5.15 2 260
MaintenanceTechnician III
Maintenance Operations -Annex
$13.48 8 260 2 $30,435.21
476 Assistant Secretary tothe Board
Administrative Office $5.15 4 260
Secretary to theSuperintendent
Administrative Office $17.76 8 260 2 $41,948.66
476 Assistant Coach II Paducah-Tilghman HighSchool
$5.15 3 185
Instructional Monitor I District-wide $14.49 8 185 2 $24,438.64476 Assistant Coach II Paducah-Tilghman High
School $5.15 1 185
Instructional Assistant I Clark Elementary School $9.66 7 185 2 $13,710.17476 Head Coach Paducah Middle School $5.15 3 185
Instructional Assistant I McNabb Elementary School $9.80 7 185 2 $15,692.16521 Bus Driver Bus Garage $5.15 4 110
Bus Driver Bus Garage $5.15 4 110 2 $4,532.00551 Food Service Assistant
IDistrict-wide $5.15 5 1
Lead Food ServiceAssistant I
District-wide $8.29 6 180 2 $9,722.73
595 Bus Monitor -Exceptional Children
BusGarage $5.15 1 158
Bus Driver Bus Garage $11.91 4 182 2 $9,484.18Source: Data compiled by LRC staff using data supplied by the Kentucky Department of Education, School FinanceTotal of 2,681 employees who are listed as working more than one job in a district
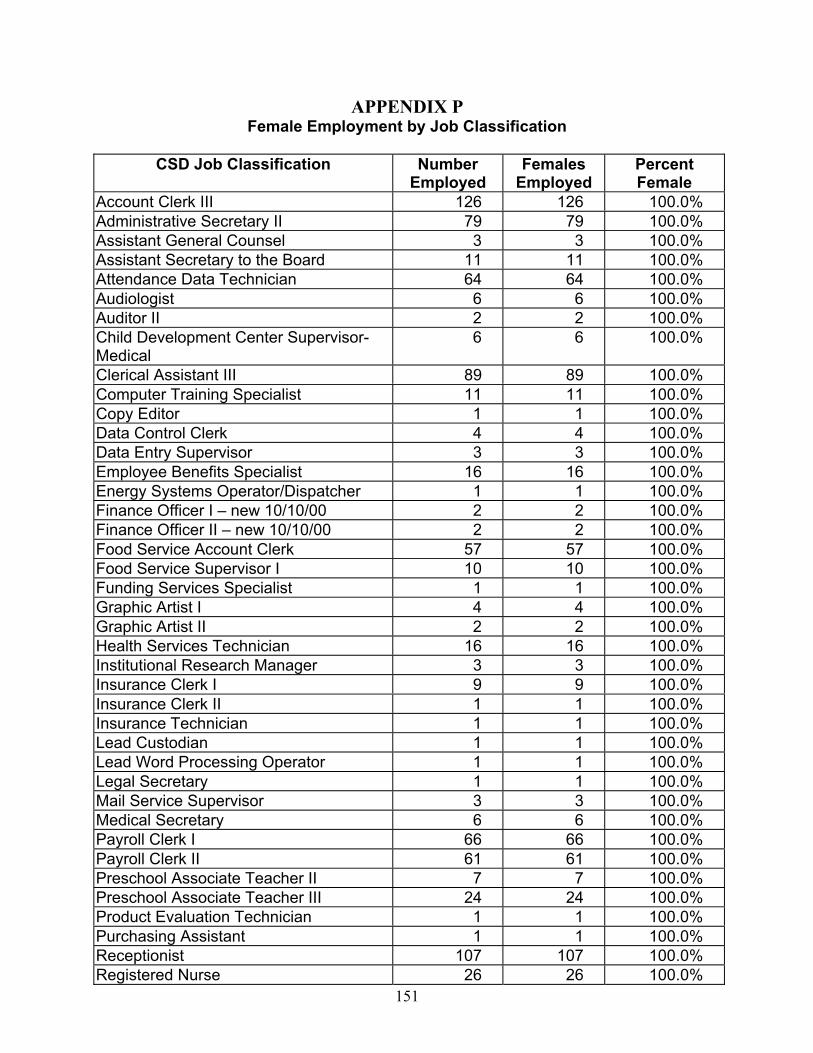
151
APPENDIX PFemale Employment by Job Classification
CSD Job Classification NumberEmployed
FemalesEmployed
PercentFemale
Account Clerk III 126 126 100.0%Administrative Secretary II 79 79 100.0%Assistant General Counsel 3 3 100.0%Assistant Secretary to the Board 11 11 100.0%Attendance Data Technician 64 64 100.0%Audiologist 6 6 100.0%Auditor II 2 2 100.0%Child Development Center Supervisor-Medical
6 6 100.0%
Clerical Assistant III 89 89 100.0%Computer Training Specialist 11 11 100.0%Copy Editor 1 1 100.0%Data Control Clerk 4 4 100.0%Data Entry Supervisor 3 3 100.0%Employee Benefits Specialist 16 16 100.0%Energy Systems Operator/Dispatcher 1 1 100.0%Finance Officer I – new 10/10/00 2 2 100.0%Finance Officer II – new 10/10/00 2 2 100.0%Food Service Account Clerk 57 57 100.0%Food Service Supervisor I 10 10 100.0%Funding Services Specialist 1 1 100.0%Graphic Artist I 4 4 100.0%Graphic Artist II 2 2 100.0%Health Services Technician 16 16 100.0%Institutional Research Manager 3 3 100.0%Insurance Clerk I 9 9 100.0%Insurance Clerk II 1 1 100.0%Insurance Technician 1 1 100.0%Lead Custodian 1 1 100.0%Lead Word Processing Operator 1 1 100.0%Legal Secretary 1 1 100.0%Mail Service Supervisor 3 3 100.0%Medical Secretary 6 6 100.0%Payroll Clerk I 66 66 100.0%Payroll Clerk II 61 61 100.0%Preschool Associate Teacher II 7 7 100.0%Preschool Associate Teacher III 24 24 100.0%Product Evaluation Technician 1 1 100.0%Purchasing Assistant 1 1 100.0%Receptionist 107 107 100.0%Registered Nurse 26 26 100.0%
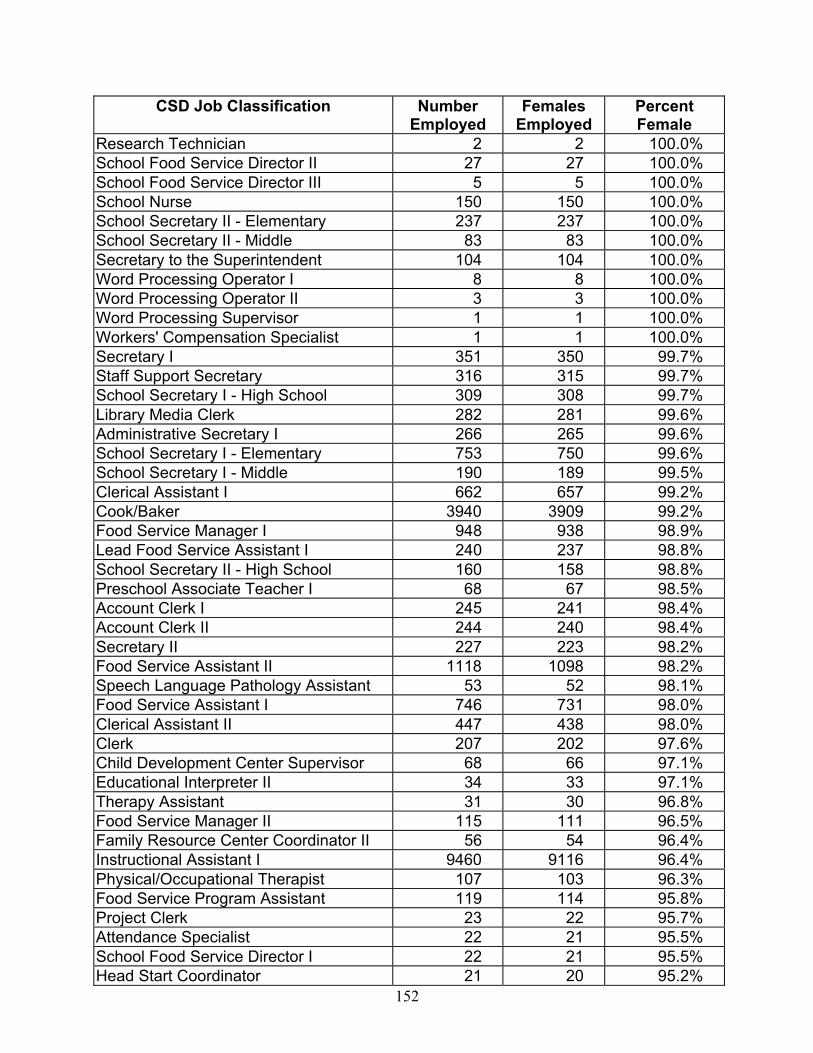
152
CSD Job Classification NumberEmployed
FemalesEmployed
PercentFemale
Research Technician 2 2 100.0%School Food Service Director II 27 27 100.0%School Food Service Director III 5 5 100.0%School Nurse 150 150 100.0%School Secretary II - Elementary 237 237 100.0%School Secretary II - Middle 83 83 100.0%Secretary to the Superintendent 104 104 100.0%Word Processing Operator I 8 8 100.0%Word Processing Operator II 3 3 100.0%Word Processing Supervisor 1 1 100.0%Workers' Compensation Specialist 1 1 100.0%Secretary I 351 350 99.7%Staff Support Secretary 316 315 99.7%School Secretary I - High School 309 308 99.7%Library Media Clerk 282 281 99.6%Administrative Secretary I 266 265 99.6%School Secretary I - Elementary 753 750 99.6%School Secretary I - Middle 190 189 99.5%Clerical Assistant I 662 657 99.2%Cook/Baker 3940 3909 99.2%Food Service Manager I 948 938 98.9%Lead Food Service Assistant I 240 237 98.8%School Secretary II - High School 160 158 98.8%Preschool Associate Teacher I 68 67 98.5%Account Clerk I 245 241 98.4%Account Clerk II 244 240 98.4%Secretary II 227 223 98.2%Food Service Assistant II 1118 1098 98.2%Speech Language Pathology Assistant 53 52 98.1%Food Service Assistant I 746 731 98.0%Clerical Assistant II 447 438 98.0%Clerk 207 202 97.6%Child Development Center Supervisor 68 66 97.1%Educational Interpreter II 34 33 97.1%Therapy Assistant 31 30 96.8%Food Service Manager II 115 111 96.5%Family Resource Center Coordinator II 56 54 96.4%Instructional Assistant I 9460 9116 96.4%Physical/Occupational Therapist 107 103 96.3%Food Service Program Assistant 119 114 95.8%Project Clerk 23 22 95.7%Attendance Specialist 22 21 95.5%School Food Service Director I 22 21 95.5%Head Start Coordinator 21 20 95.2%
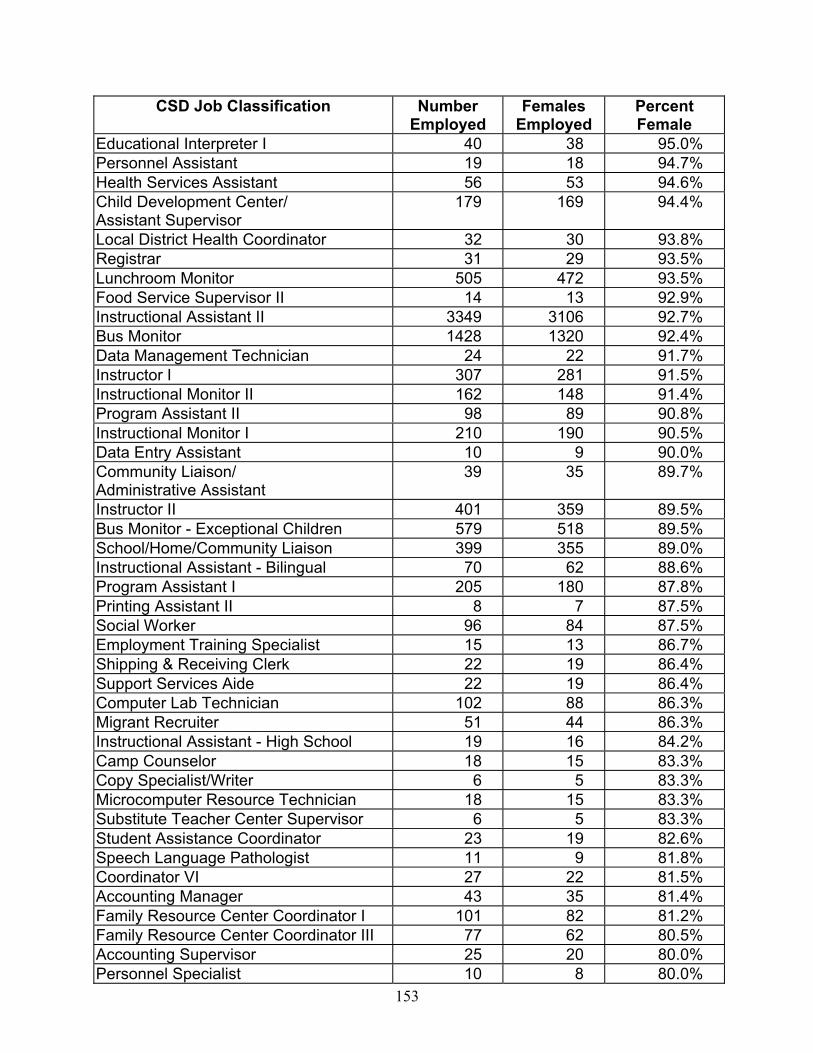
153
CSD Job Classification NumberEmployed
FemalesEmployed
PercentFemale
Educational Interpreter I 40 38 95.0%Personnel Assistant 19 18 94.7%Health Services Assistant 56 53 94.6%Child Development Center/Assistant Supervisor
179 169 94.4%
Local District Health Coordinator 32 30 93.8%Registrar 31 29 93.5%Lunchroom Monitor 505 472 93.5%Food Service Supervisor II 14 13 92.9%Instructional Assistant II 3349 3106 92.7%Bus Monitor 1428 1320 92.4%Data Management Technician 24 22 91.7%Instructor I 307 281 91.5%Instructional Monitor II 162 148 91.4%Program Assistant II 98 89 90.8%Instructional Monitor I 210 190 90.5%Data Entry Assistant 10 9 90.0%Community Liaison/Administrative Assistant
39 35 89.7%
Instructor II 401 359 89.5%Bus Monitor - Exceptional Children 579 518 89.5%School/Home/Community Liaison 399 355 89.0%Instructional Assistant - Bilingual 70 62 88.6%Program Assistant I 205 180 87.8%Printing Assistant II 8 7 87.5%Social Worker 96 84 87.5%Employment Training Specialist 15 13 86.7%Shipping & Receiving Clerk 22 19 86.4%Support Services Aide 22 19 86.4%Computer Lab Technician 102 88 86.3%Migrant Recruiter 51 44 86.3%Instructional Assistant - High School 19 16 84.2%Camp Counselor 18 15 83.3%Copy Specialist/Writer 6 5 83.3%Microcomputer Resource Technician 18 15 83.3%Substitute Teacher Center Supervisor 6 5 83.3%Student Assistance Coordinator 23 19 82.6%Speech Language Pathologist 11 9 81.8%Coordinator VI 27 22 81.5%Accounting Manager 43 35 81.4%Family Resource Center Coordinator I 101 82 81.2%Family Resource Center Coordinator III 77 62 80.5%Accounting Supervisor 25 20 80.0%Personnel Specialist 10 8 80.0%
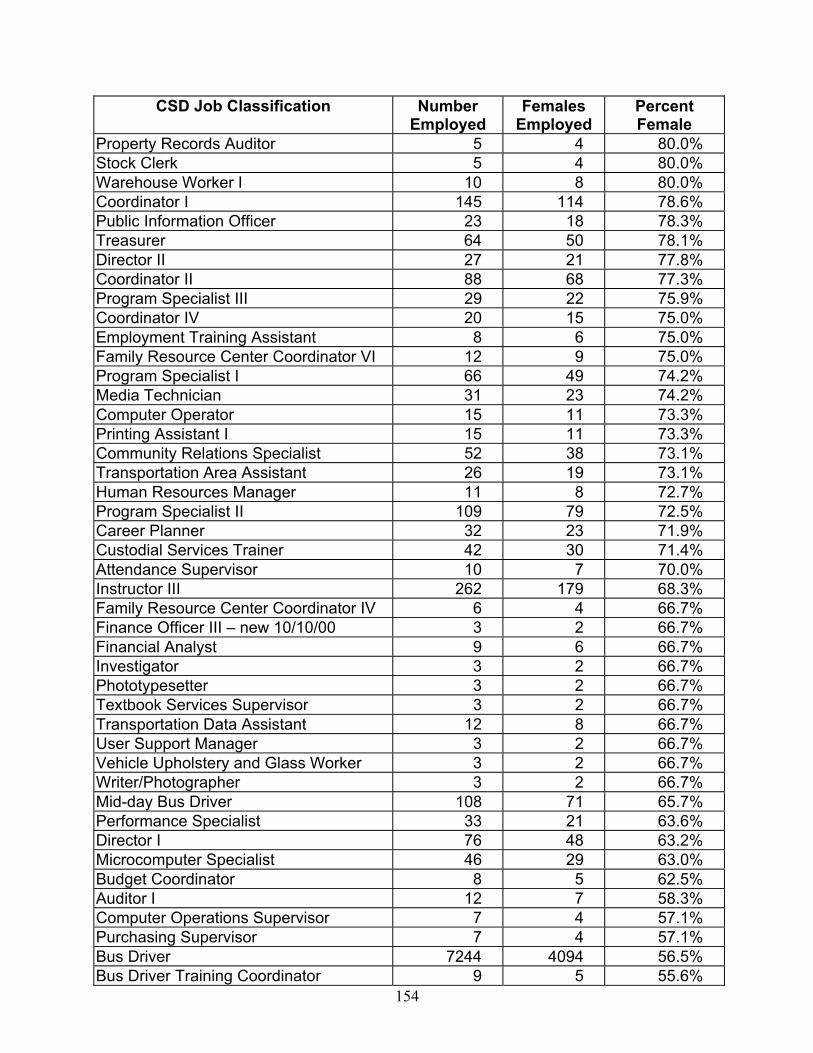
154
CSD Job Classification NumberEmployed
FemalesEmployed
PercentFemale
Property Records Auditor 5 4 80.0%Stock Clerk 5 4 80.0%Warehouse Worker I 10 8 80.0%Coordinator I 145 114 78.6%Public Information Officer 23 18 78.3%Treasurer 64 50 78.1%Director II 27 21 77.8%Coordinator II 88 68 77.3%Program Specialist III 29 22 75.9%Coordinator IV 20 15 75.0%Employment Training Assistant 8 6 75.0%Family Resource Center Coordinator VI 12 9 75.0%Program Specialist I 66 49 74.2%Media Technician 31 23 74.2%Computer Operator 15 11 73.3%Printing Assistant I 15 11 73.3%Community Relations Specialist 52 38 73.1%Transportation Area Assistant 26 19 73.1%Human Resources Manager 11 8 72.7%Program Specialist II 109 79 72.5%Career Planner 32 23 71.9%Custodial Services Trainer 42 30 71.4%Attendance Supervisor 10 7 70.0%Instructor III 262 179 68.3%Family Resource Center Coordinator IV 6 4 66.7%Finance Officer III – new 10/10/00 3 2 66.7%Financial Analyst 9 6 66.7%Investigator 3 2 66.7%Phototypesetter 3 2 66.7%Textbook Services Supervisor 3 2 66.7%Transportation Data Assistant 12 8 66.7%User Support Manager 3 2 66.7%Vehicle Upholstery and Glass Worker 3 2 66.7%Writer/Photographer 3 2 66.7%Mid-day Bus Driver 108 71 65.7%Performance Specialist 33 21 63.6%Director I 76 48 63.2%Microcomputer Specialist 46 29 63.0%Budget Coordinator 8 5 62.5%Auditor I 12 7 58.3%Computer Operations Supervisor 7 4 57.1%Purchasing Supervisor 7 4 57.1%Bus Driver 7244 4094 56.5%Bus Driver Training Coordinator 9 5 55.6%
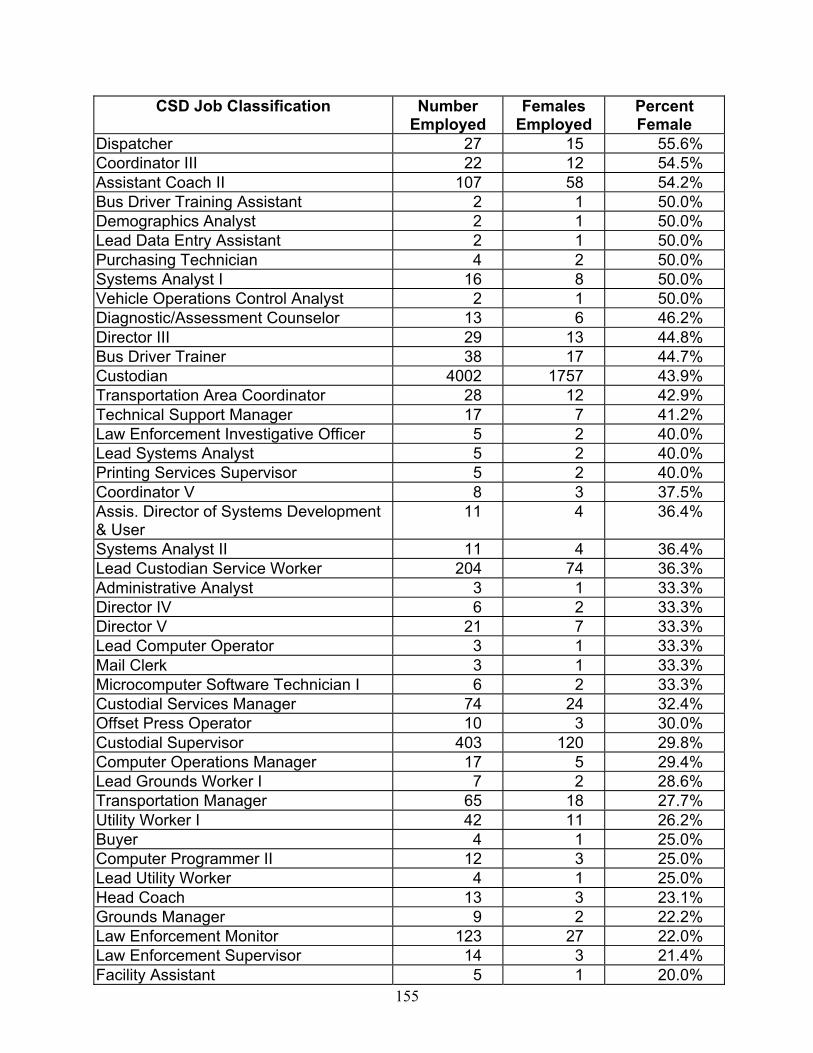
155
CSD Job Classification NumberEmployed
FemalesEmployed
PercentFemale
Dispatcher 27 15 55.6%Coordinator III 22 12 54.5%Assistant Coach II 107 58 54.2%Bus Driver Training Assistant 2 1 50.0%Demographics Analyst 2 1 50.0%Lead Data Entry Assistant 2 1 50.0%Purchasing Technician 4 2 50.0%Systems Analyst I 16 8 50.0%Vehicle Operations Control Analyst 2 1 50.0%Diagnostic/Assessment Counselor 13 6 46.2%Director III 29 13 44.8%Bus Driver Trainer 38 17 44.7%Custodian 4002 1757 43.9%Transportation Area Coordinator 28 12 42.9%Technical Support Manager 17 7 41.2%Law Enforcement Investigative Officer 5 2 40.0%Lead Systems Analyst 5 2 40.0%Printing Services Supervisor 5 2 40.0%Coordinator V 8 3 37.5%Assis. Director of Systems Development& User
11 4 36.4%
Systems Analyst II 11 4 36.4%Lead Custodian Service Worker 204 74 36.3%Administrative Analyst 3 1 33.3%Director IV 6 2 33.3%Director V 21 7 33.3%Lead Computer Operator 3 1 33.3%Mail Clerk 3 1 33.3%Microcomputer Software Technician I 6 2 33.3%Custodial Services Manager 74 24 32.4%Offset Press Operator 10 3 30.0%Custodial Supervisor 403 120 29.8%Computer Operations Manager 17 5 29.4%Lead Grounds Worker I 7 2 28.6%Transportation Manager 65 18 27.7%Utility Worker I 42 11 26.2%Buyer 4 1 25.0%Computer Programmer II 12 3 25.0%Lead Utility Worker 4 1 25.0%Head Coach 13 3 23.1%Grounds Manager 9 2 22.2%Law Enforcement Monitor 123 27 22.0%Law Enforcement Supervisor 14 3 21.4%Facility Assistant 5 1 20.0%
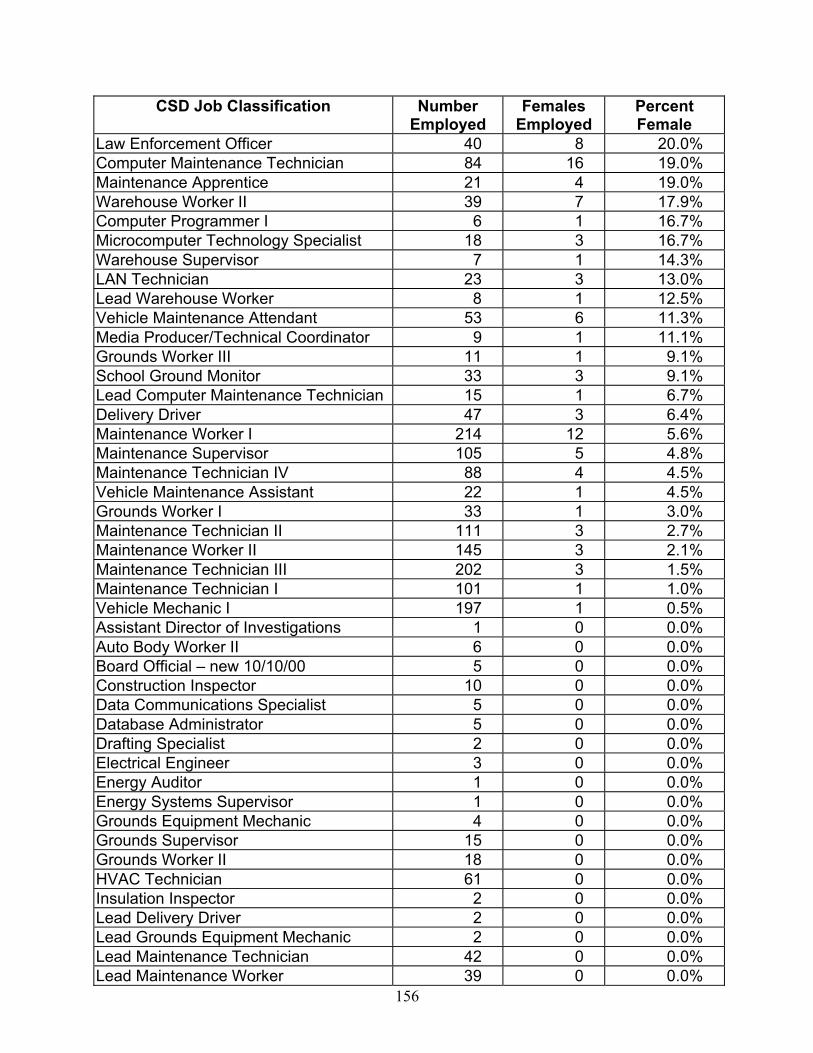
156
CSD Job Classification NumberEmployed
FemalesEmployed
PercentFemale
Law Enforcement Officer 40 8 20.0%Computer Maintenance Technician 84 16 19.0%Maintenance Apprentice 21 4 19.0%Warehouse Worker II 39 7 17.9%Computer Programmer I 6 1 16.7%Microcomputer Technology Specialist 18 3 16.7%Warehouse Supervisor 7 1 14.3%LAN Technician 23 3 13.0%Lead Warehouse Worker 8 1 12.5%Vehicle Maintenance Attendant 53 6 11.3%Media Producer/Technical Coordinator 9 1 11.1%Grounds Worker III 11 1 9.1%School Ground Monitor 33 3 9.1%Lead Computer Maintenance Technician 15 1 6.7%Delivery Driver 47 3 6.4%Maintenance Worker I 214 12 5.6%Maintenance Supervisor 105 5 4.8%Maintenance Technician IV 88 4 4.5%Vehicle Maintenance Assistant 22 1 4.5%Grounds Worker I 33 1 3.0%Maintenance Technician II 111 3 2.7%Maintenance Worker II 145 3 2.1%Maintenance Technician III 202 3 1.5%Maintenance Technician I 101 1 1.0%Vehicle Mechanic I 197 1 0.5%Assistant Director of Investigations 1 0 0.0%Auto Body Worker II 6 0 0.0%Board Official – new 10/10/00 5 0 0.0%Construction Inspector 10 0 0.0%Data Communications Specialist 5 0 0.0%Database Administrator 5 0 0.0%Drafting Specialist 2 0 0.0%Electrical Engineer 3 0 0.0%Energy Auditor 1 0 0.0%Energy Systems Supervisor 1 0 0.0%Grounds Equipment Mechanic 4 0 0.0%Grounds Supervisor 15 0 0.0%Grounds Worker II 18 0 0.0%HVAC Technician 61 0 0.0%Insulation Inspector 2 0 0.0%Lead Delivery Driver 2 0 0.0%Lead Grounds Equipment Mechanic 2 0 0.0%Lead Maintenance Technician 42 0 0.0%Lead Maintenance Worker 39 0 0.0%

157
CSD Job Classification NumberEmployed
FemalesEmployed
PercentFemale
Lead Vehicle Mechanic 80 0 0.0%Maintenance Manager - Electronics 2 0 0.0%Maintenance Manager - General 27 0 0.0%Maintenance Manager - Mechanical 2 0 0.0%Maintenance Scheduling Specialist 3 0 0.0%Microcomputer Software Technician II 2 0 0.0%Operating System Administrator 4 0 0.0%Parts Clerk 6 0 0.0%Preventive Maintenance Technician-HVAC
4 0 0.0%
Real Estate Manager 1 0 0.0%Safety Inspector 4 0 0.0%Supply Services Supervisor 3 0 0.0%Third Party Examiner 1 0 0.0%Utility Services Supervisor 2 0 0.0%Utility Worker II 24 0 0.0%Vehicle Maintenance Manager 25 0 0.0%Vehicle Maintenance Supervisor 29 0 0.0%Vehicle Mechanic II 116 0 0.0%Voice and Data CommunicationsSpecialist
1 0 0.0%
Waste Management Coordinator 6 0 0.0%Total 48,470 38,368 79.2%

158
159
APPENDIX Q
ACTIONS BY THE 2002 GENERAL ASSEMBLYRELATING TO COMPENSATION AND BENEFITS FOR SCHOOL EMPLOYEES
HB 402
• Amends KRS 157.420 to provide that beginning in 2004-2006 teachers receive an annualcost of living increase at least equal to that granted to state workers in the biennialbudget. Provides that funds for salary increases be included in the SEEK base;
• Creates a new section of KRS Chapter 157 to specify that local districts may providedifferentiated compensation programs that provide additional compensation above thesingle salary schedule, although no funds were appropriated during this next biennium;
• Creates a professional compensation fund in the State Treasury to be used to providegrants to school districts to pilot differentiated compensation programs, although nofunds were appropriated during this biennium;
• Creates a new section of KRS 164.740-164.785 to establish a district teacher certificationloan program in the State Treasury to provide forgivable loans to emergency certifiedpersonnel, full certified teachers who are willing to seek additional certification in hard-to-fill or critical shortage areas, and paraprofessionals to become fully certified teachersand to continue service within the local district. Unfortunately, no funds were availablefor this initiative for the next biennium;
• Amends KRS 156.533 to make the Teachers’ Professional Growth Fund more flexible andto meet the needs that have been determined by the Kentucky Department of Education;and
• Requires a legislative study of the principal and teacher internship programs between July15, 2002, and August 31, 2002.
HB 332
• Provides that each teacher who holds a contract valid for a succeeding school year shallreceive notice not later than forty-five (45) days before the first student attendance day ofthe succeeding school year stating the best estimate as to the salary the teacher willreceive.
• Provides reduction of responsibility for a teacher may be accompanied by a correspondingreduction in salary provided written notice stating the specific reason for the reduction isfurnished not later than ninety (90) days before the first student attendance day of theschool year.

160
HB 309
Provides that classified employees in the County Employees Retirement System shall be entitledto service credit based on the total paid calendar days and may choose the preferredservice credit calculation if they retired between July 1, 2000, and August 1, 2001, uponnotice to the system within one year of their retirement. School boards shall compensateunused sick leave days in accordance with KRS 161.155.
HB 637
• A cost of living adjustment for retired teachers shall be provided in the amounts of 2.9 %for FY 2003 and 3.0 % for FY 2004.
• An increase in the minimum benefit for the oldest retirees, those who are currentlydrawing less than $11,500 a year, shall be provided as follows: the minimum value foreach year of service for these retirees is to be raised from $335 per year of service to$400 in the first year and $440 in the second year.
• A 3.0 multiplier shall be provided for all service after 30 years service for teachers whoretire after July 1, 2002, rather than the 2.5 multiplier that is currently in place.
• The 100-day limit on re-employment shall be eliminated by adding a salary limit on re-employment that is to be phased in over a 5 year period concluding June 30, 2002.
• For persons retiring after June 30, 2002, a salary limit on re-employment shall be no morethan 75% of the last contract salary for retirees with thirty years of service and no morethan 65% of the last contract salary for retirees with less than 30 years service. Allretirees returning to work in full-time or part-time positions and all others filling teachingpositions shall contribute to the retirement system.
HB 282
• Provides that a high school certificate of completion shall be an acceptable credential tomeet qualifications as a classified employee.

161