data driven visualization tool for game telemetry1169026/fulltext01.pdfanyone to read, to download,...
TRANSCRIPT

Department of Science and Technology Institutionen för teknik och naturvetenskap Linköping University Linköpings universitet
gnipökrroN 47 106 nedewS ,gnipökrroN 47 106-ES
LiU-ITN-TEK-A--17/055--SE
Data Driven Visualization Toolfor Game Telemetry
Martin Engelbrektsson
Marcus Lilja
2017-10-20

LiU-ITN-TEK-A--17/055--SE
Data Driven Visualization Toolfor Game TelemetryExamensarbete utfört i Medieteknik
vid Tekniska högskolan vidLinköpings universitet
Martin EngelbrektssonMarcus Lilja
Handledare Henry FröcklinExaminator Stefan Gustavson
Norrköping 2017-10-20

Upphovsrätt
Detta dokument hålls tillgängligt på Internet – eller dess framtida ersättare –under en längre tid från publiceringsdatum under förutsättning att inga extra-ordinära omständigheter uppstår.
Tillgång till dokumentet innebär tillstånd för var och en att läsa, ladda ner,skriva ut enstaka kopior för enskilt bruk och att använda det oförändrat förickekommersiell forskning och för undervisning. Överföring av upphovsrättenvid en senare tidpunkt kan inte upphäva detta tillstånd. All annan användning avdokumentet kräver upphovsmannens medgivande. För att garantera äktheten,säkerheten och tillgängligheten finns det lösningar av teknisk och administrativart.
Upphovsmannens ideella rätt innefattar rätt att bli nämnd som upphovsman iden omfattning som god sed kräver vid användning av dokumentet på ovanbeskrivna sätt samt skydd mot att dokumentet ändras eller presenteras i sådanform eller i sådant sammanhang som är kränkande för upphovsmannens litteräraeller konstnärliga anseende eller egenart.
För ytterligare information om Linköping University Electronic Press seförlagets hemsida http://www.ep.liu.se/
Copyright
The publishers will keep this document online on the Internet - or its possiblereplacement - for a considerable time from the date of publication barringexceptional circumstances.
The online availability of the document implies a permanent permission foranyone to read, to download, to print out single copies for your own use and touse it unchanged for any non-commercial research and educational purpose.Subsequent transfers of copyright cannot revoke this permission. All other usesof the document are conditional on the consent of the copyright owner. Thepublisher has taken technical and administrative measures to assure authenticity,security and accessibility.
According to intellectual property law the author has the right to bementioned when his/her work is accessed as described above and to be protectedagainst infringement.
For additional information about the Linköping University Electronic Pressand its procedures for publication and for assurance of document integrity,please refer to its WWW home page: http://www.ep.liu.se/
© Martin Engelbrektsson, Marcus Lilja

LINKOPING UNIVERSITY
Abstract
ITN
Linkoping University
Master of Science Thesis
by Martin Engelbrektsson and Marcus Lilja
This thesis describes and evaluates the implementation of a telemetry tool prototype for
the game engine Stingray. Arbitrary data can be chosen from a database and visualized
in an interactive 3D viewport in the program. The implemented visualization method is
a scatter plot with optional color mapping. A MongoDB server communicates with the
editor via a native DLL written in C/C++ which in turn can send data to the rendering
engine via JavaScript-Lua communication.
Several implemented and continuously improved pipelines are discussed and analyzed
throughout the report. The tool is designed to be data driven. Advantages and disad-
vantages of doing so are discussed. In the final chapter future improvements and ideas
of expanding the plug-in are discussed.

Acknowledgements
We would like to thank our thesis examiner Stefan Gustavson and assistant Henry
Frocklin at Linkoping University, for giving general directions and guidance for this
master thesis and report.
A big thank you goes to our supervisors Dan Engelbrecht and Andreas Asplund at Au-
todesk for more project related advice and encouragement. We must of course also thank
Jim Sagevid for all practical assistance with programming and interesting philosophical
discussions.
We would also like to thank Jonathan Schmidt and Sebastien Phaneuf from the Montreal
team for their help with plug-in development. An extra thank you to Jonathan for his
excellent plug-in tutorial - without which this project would have been much more
difficult.
ii

Contents
Abstract i
Acknowledgements ii
List of Figures v
Abbreviations and Terminology vi
1 Introduction 1
1.1 Telemetry Tool for Autodesk Stingray . . . . . . . . . . . . . . . . . . . . 1
1.2 Limitations . . . . . . . . . . . . . . . . . . . . . . . . . . . . . . . . . . . 1
1.3 Research Questions . . . . . . . . . . . . . . . . . . . . . . . . . . . . . . . 2
2 Related Work 3
2.1 Information Visualization for Archipelago Navigation (Visualisering avinformation vid navigering i skargrd) . . . . . . . . . . . . . . . . . . . . 3
2.2 Software Development of Visualization Tool for 3D Cameras . . . . . . . . 3
2.3 Game Telemetry with DNA Tracking on Assassin’s Creed . . . . . . . . . 4
2.4 Game Development Telemetry (BioWare) . . . . . . . . . . . . . . . . . . 5
2.5 Autodesk presents Warhammer: The End Times - Vermintide . . . . . . . 5
3 Background 7
3.1 Game Telemetry . . . . . . . . . . . . . . . . . . . . . . . . . . . . . . . . 7
3.2 Visualization . . . . . . . . . . . . . . . . . . . . . . . . . . . . . . . . . . 8
3.3 Stingray . . . . . . . . . . . . . . . . . . . . . . . . . . . . . . . . . . . . . 9
3.4 Editor . . . . . . . . . . . . . . . . . . . . . . . . . . . . . . . . . . . . . . 10
3.4.1 Implementation in JavaScript . . . . . . . . . . . . . . . . . . . . . 11
3.4.2 Mithril.js . . . . . . . . . . . . . . . . . . . . . . . . . . . . . . . . 11
3.4.3 View-Model Structure . . . . . . . . . . . . . . . . . . . . . . . . . 12
3.4.4 User Interface Components . . . . . . . . . . . . . . . . . . . . . . 12
3.4.5 JavaScript to C Communication . . . . . . . . . . . . . . . . . . . 13
3.5 Engine . . . . . . . . . . . . . . . . . . . . . . . . . . . . . . . . . . . . . . 13
3.5.1 Lua to C Communication . . . . . . . . . . . . . . . . . . . . . . . 14
3.6 Plug-ins . . . . . . . . . . . . . . . . . . . . . . . . . . . . . . . . . . . . . 15
iii

Contents iv
4 Implementation 17
4.1 Pipeline . . . . . . . . . . . . . . . . . . . . . . . . . . . . . . . . . . . . . 17
4.2 Editor . . . . . . . . . . . . . . . . . . . . . . . . . . . . . . . . . . . . . . 18
4.2.1 Database Connection . . . . . . . . . . . . . . . . . . . . . . . . . . 18
4.2.2 Fetching Data . . . . . . . . . . . . . . . . . . . . . . . . . . . . . . 19
4.2.3 Visualization Options . . . . . . . . . . . . . . . . . . . . . . . . . 21
4.3 Engine . . . . . . . . . . . . . . . . . . . . . . . . . . . . . . . . . . . . . . 21
4.4 Data Visualization . . . . . . . . . . . . . . . . . . . . . . . . . . . . . . . 22
5 Results 23
5.1 General Results . . . . . . . . . . . . . . . . . . . . . . . . . . . . . . . . . 23
5.2 Fatshark-Specific Results . . . . . . . . . . . . . . . . . . . . . . . . . . . 25
6 Discussion 28
6.1 The Work Process . . . . . . . . . . . . . . . . . . . . . . . . . . . . . . . 28
6.2 Design Changes . . . . . . . . . . . . . . . . . . . . . . . . . . . . . . . . . 30
6.2.1 MongoDB with Node.js Server or C API . . . . . . . . . . . . . . . 30
6.2.2 Data Driven Tool . . . . . . . . . . . . . . . . . . . . . . . . . . . . 32
6.3 Future Work . . . . . . . . . . . . . . . . . . . . . . . . . . . . . . . . . . 32
6.3.1 Finding Unique Keys in a Collection . . . . . . . . . . . . . . . . . 32
6.3.2 Filtering . . . . . . . . . . . . . . . . . . . . . . . . . . . . . . . . . 33
6.3.3 Supporting Different Database Systems . . . . . . . . . . . . . . . 33
6.3.4 Database Optimization . . . . . . . . . . . . . . . . . . . . . . . . 33
6.3.5 UX and Visualization Methods . . . . . . . . . . . . . . . . . . . . 34
7 Conclusion 35
7.1 How should the data pipeline be design for the tool? . . . . . . . . . . . . 35
7.2 How generalized and data driven can a visualization tool be? What arethe limitations? . . . . . . . . . . . . . . . . . . . . . . . . . . . . . . . . . 36
Bibliography 37

List of Figures
3.1 Simplified illustration of Stingray’s structure. . . . . . . . . . . . . . . . . 10
3.2 Overview of how the engine interacts with plug-ins. . . . . . . . . . . . . . 14
3.3 The Stingray program. Notice how all panels are separate plug-ins. . . . . 15
3.4 Overview of Stingrays plug-in communication for the editor. . . . . . . . . 16
4.1 The first pipeline design of the plugin. . . . . . . . . . . . . . . . . . . . . 17
4.2 This list displays the available fields in the database for a certain collection. 20
5.1 The resulting design of the plugin. . . . . . . . . . . . . . . . . . . . . . . 23
5.2 A list of up to 1000 documents with all the values to the fields keys inthe collection. . . . . . . . . . . . . . . . . . . . . . . . . . . . . . . . . . . 24
5.3 A sample of the test database with the keys id, position and scalar. . . . . 24
5.4 The Visualization GUI component with the different options. . . . . . . . 25
5.5 Scatter plot visualization with the test database. . . . . . . . . . . . . . . 25
5.6 Scatter plot visualization with the test database and color scaling. . . . . 26
5.7 How the GUI looks when it is modified to work with the Fatshark database. 26
5.8 Scatter plot with Fatshark’s level Man the Ramparts and correspondingtelemetry. . . . . . . . . . . . . . . . . . . . . . . . . . . . . . . . . . . . . 27
5.9 A scatter plot with color scaling enabled. . . . . . . . . . . . . . . . . . . 27
5.10 The default color of the boxes when the engine does not receive a validscalar value. . . . . . . . . . . . . . . . . . . . . . . . . . . . . . . . . . . . 27
6.1 The pipeline when using an external Node.js server. . . . . . . . . . . . . 30
6.2 The pipeline using native DLL:s instead of an external Node.js dependency. 31
6.3 The resulting data-driven pipeline. . . . . . . . . . . . . . . . . . . . . . . 32
v

Abbreviations and Terminology
IP Internet Protocol
DLL Dynamic-Link Library
API Application Programming Interface
EULA End-User Licence Agreement
Ad hoc A non-generalized solution designed for one specific application or purpose
AAA Informal classification of video game productions with high budgets
VR Virtual Reality
DOM Document Object Model. HTML document interface
MVC Model-View Controller. A design pattern
UI User Interface
UX User Experience
JSON JavaScript Object Notation
BSON Binary JSON
OOP Object Oriented Programming
DOD Data Oriented Design
vi

Chapter 1
Introduction
1.1 Telemetry Tool for Autodesk Stingray
When developing a video game it is crucial to optimize both technology and design. It
is critical to properly allocate resources performance-wise. A too detailed object might
weight the performance down unnecessarily. It is also vital to design-wise understand
player behaviour and how users interact with the game. Are certain areas to challenging
or easy? Does the users do what the developers intended?
Telemetry is the process of collecting data from users in game development and game
research fields. It is used to analyze technical and design related questions such as the
aforementioned. Large quantities of data are usually accumulated from many users for
analysis.
This Master Thesis was done at Autodesk in Stockholm with the game engine Stingray.
Stingray does not currently have a built-in telemetry system or functionality to visualize
telemetry. The goal of this Master Thesis is to develop a prototype for a interactive
visualization tool for game telemetry.
1.2 Limitations
Since visualization is a broad subject and a tool can be implemented in different ways
several limitations have been made. There already exists tools for business intelligence
and game telemetry created by third parties. One limitation for this Master Thesis is
that the visualization tool is an internal plug-in which is run inside Stingray.
1

Introduction 2
The tool will only visualize stored data. It will not collect and store data from game
sessions. Developing a generalized data collection system is a large task. It would
certainly be possible to create an ad hoc collection system, but the problems lies within
generalization, performance and scalability. Not only must the data be sampled in a
way that does not impact performance significantly. There is also the question of what
data that can be saved, since this is supposed to be a generalized system which should
work for various game types of different scales. Collecting telemetry data is certainly
interesting, but would detract from the scope of this master thesis.
The plug-in is only guarantied to support with the current latest version of Stingray
which it 1.9.0 during the time work on the master thesis began. It may support newer
versions of Stingray but not older because of API changes.
The visualization plug-in will result in a prototype, not a final product for developer
use. It would be a far too massive project to generalize the tool to work with multiple
different database systems. The data provided by Fatshark is stored in a MongoDB
database. A restriction is therefore to limit the database to MongoDB.
There is no set limitation on what kind of visualization methods that can be used more
than that it must be possible to visualize on the level. More abstract visualization
methods like pie charts, tables and likewise will not be considered. The data used for
the visualizations has to include at least a spatial component, i.e. a position. Otherwise
it would not be possible to visualize it on the level. Both two dimensional and three
dimensional approaches are to be considered.
1.3 Research Questions
The master thesis will try to answer the following questions:
• How should the data pipeline be design for the tool?
• How generalized and data driven can a visualization tool be? What are the limi-
tations?

Chapter 2
Related Work
2.1 Information Visualization for Archipelago Navigation
(Visualisering av information vid navigering i skargrd)
A Master Thesis was done at Combitech AB in cooperation with Linkping University
[1]. The purpose of the Master Thesis was to develop a prototype for a boat navigation
system. Two prototypes were ultimately achieved, one paper based concept and one
interactive 3D visualization. Augmented Reality was incorporated into the interactive
prototype and explored as well.
For this project usability was the primary focus. The prototypes were created using four
steps: user study, concept development, prototype development and user evaluation.
During the prototype stage both high-fidelity and low-fidelity models were developed. A
low-fidelity prototype is usually mock-up based and used for exploring different design
alternatives. A high-fidelity prototype is more in line with the end-result, which for this
Master Thesis was a interactive prototype implemented in the game engine Unity and
programmed using C#.
2.2 Software Development of Visualization Tool for 3D
Cameras
A Master Thesis was done at SICK IVP in which a three-dimensional visualization
system for camera data was developed [2]. The cameras could export data in various
3D formats which had to be supported in the application. The UI of the application
was built with the .NET-based system WPF (Windows Presentation Foundation) and
developed in C#.
3

Related Work 4
In the report it is stated that the importance of visualization is rapidly increasing since
it is possible to collect large quantities of data. The raw data is often difficult to present
to developers and customers on its own. A visual representation of the data can help
greatly with this. Visualization has the ability to display context and several different
data sets at once. Animation can also be used to display change over time. Different
colors may be used to denote scalar values.
The application was split into three components; A visualization class library, user con-
trol and application. This was done to achieve a modular structure. A visualization
class library was implemented which had functionality to extract, sample and transform
data. The user control interface offered interactive functionality which ties the visual-
ization library together with the application. The application component is the base for
the program in which the graphics and user interface is displayed.
2.3 Game Telemetry with DNA Tracking on Assassin’s
Creed
Ubisoft have invested heavily in the use of telemetry tools in order to improve current and
future titles. Such tools have been used both during and after production of titles in the
widely successful Assassin’s Creed series. Telemetry studies during production included
among other things monitoring tester gameplay and difficulty balancing. Post-launch
telemetry studies was vital for patching, direction of expansion packs and downloadable
content and even finding out what players experienced different moments which also can
direct future productions. It was critical to not collect sensitive data from an ethical
perspective. The EULA states that only non-intrusive information is collected with the
intention of improving current and future titles.
New knowledge was obtained from visualization which otherwise would not have been
possible [3]. Comprehensive visualization methods are important for these telemetry
studies. Game analysts and gameplay designers need a responsive an interactive system
to better visualize the huge quantities of data collected from users. The goals is to
identify patterns, correlations, distributions, statistical outliers and most importantly
reasons why. Both 2D and 3D methods were utilized.
The 2D methods were usually various graphs and plots. The 3D methods used actual
meshes from the game to give an exact representation of the game’s dimensions. The
telemetry data was visualized with various overlays on top of the geometry. On example
of this are curves that represented each player’s path. The aggregation of many paths
showed how well the player base follows the intended structure of the level.

Related Work 5
2.4 Game Development Telemetry (BioWare)
BioWare’s productions Mass Effect, Dragon Age and Star Wars: The Old Republic are
role playing games of such scale that it is impossible to only rely on manual testing for
quality assurance and analysis. BioWare has developed an extensive telemetry system
called Skynet [4]. On Dragon Age: Origins alone 250 GB of data was recorded from
millions of sessions [4].
Spatial data such as positions were sampled every six seconds together with a time stamp
and various measurement values and displayed as a point cloud or heat map layer over a
representation of the level. The heat map could either be displayed for a singular session
or as an aggregate of several player sessions.
For Dragon Age: Origins a two dimensional bitmap was used. For Star Wars: The Old
Republic a three dimensional representation of the map was used which opened up for
new possibilities such as zooming without losing resolution, improved readability (espe-
cially for non-testers) and improved layering options. The game is three dimensional as
well, so vertical gameplay is represented in a more spatially accurate manner.
Bioware found that different telemetry systems does not mix well. It is more desirable for
game companies to create their own telemetry systems that samples and visualizes data
customized to games rather than using off-the-shelf software for business intelligence.
2.5 Autodesk presents Warhammer: The End Times - Ver-
mintide
Stingray is used for the video game Warhammer: The End Times - Vermintide which
is developed by Fatshark Games in Stockholm. Production began in 2013 and increased
in 2014 right before the Bitsquid engine was acquired by Autodesk and re-branded
as Stringray. Several components of the game engine was altered by Autodesk such
as switching sound system, integrating a physically based renderer, new shader graph
system and more.
Stingray’s modular and data-driven approach to its source code and functionality greatly
helped the production [5]. Systems could be switched out and replaced by others. During
Vermintide’s production Stingray’s new UI system was yet to be finished, so a home-
brew version was used instead. The rendering engine overhaul was not as time-consuming
as the developers of Fatshark expected, much because of the data-driven layout. The
rendering settings were treated as data files, so they could easily be transferred and

Related Work 6
switched out. The largest problem was not the technical aspects of transfer the rendering
settings themselves but to balance the looks from between the two renderers, a task which
could be delegated to the artists.

Chapter 3
Background
3.1 Game Telemetry
Business Intelligence is a commonly practiced set of strategies and applications for data
collection and analysis in the business and financial sector. By analyzing large amounts
of data, correlations can be found to help the decision making process for a company or
community.
Telemetry is a term for data obtained by distance [6]. Game telemetry is the video
game equivalency of business intelligence. There are many different questions that are
highly relevant for game developers from design, performance and business perspectives
[7]. Examples of these questions are;
• How do players interact with the game?
• What content, features and modes are used?
• When do players quit and why?
Before game telemetry was widely practiced Quality Assurance (QA) and play testers
had the sole responsibility for testing the games and finding gameplay bottlenecks as
well as technical bugs and glitches. This process heavily relied on qualitative analysis.
Qualitative analysis such as play tests, quizzes, observation and thinking aloud can be
useful for determining how well users grasp and understand the game mechanics.
However when it comes to more specific questions such as Was the level hard enough?
or Did the weapons feel overpowered? the answers are are more divergent and not as
clear-cut. Often or not the end-users does not really know what they want (section
7

Related Work 8
2.4). Forms and manual error reports are often ineffective, unreliable or even ignored
by end-users (section 2.4). Telemetry offers quantitative measurements which can be
more suitable for certain questions, especially where large amounts of data is involved.
Quantitative measurements are naturally better for analyzing technical aspects such as
performance.
By implementing telemetry supported game design all users can become valuable play-
testers. It is important for the data sampling to be non-invasive from an ethical per-
spective.
Telemetry has been used efficiently in many AAA game products such as the Assassins
Creed series and Star Wars: The Old Republic for finding performance and design
bottlenecks. In the Star Wars game designers found that a certain class was unbalanced
for an early mandatory mission by mapping player deaths to a heat map. This was
adjusted in a later patch [4].
3.2 Visualization
It is not enough to only gather telemetry data. Such large quantities of data are sampled
from so many sources that it is difficult if not impossible to derive any conclusions by
going through it manually. It also has to be visualized in a representative way depending
on its context. Given that the database contains a lot of variables there are many
correlations that can be made. It is easy to get false correlations by looking at a faulty
visualization.
There are several visualization methods that are frequently used in game telemetry.
Diagrams, pie charts and other similar illustrations are often too abstract to give a rep-
resentative picture of what is happening. Heat maps can link spatial and temporal data
with other events such as player deaths, performance drops and much more. Heat maps
are often two-dimensional. For complex levels with depth three dimensional visualiza-
tion methods are preferred in order not to give rise to false correlations and misleading
conclusions.
When the database is scaled up in size several problems can occur. The visualizations
can contain too much information which makes it difficult to illustrate any patterns.
The illustration loses its meaning consequently. Another problem is when the database
becomes too large to use for practical purposes. Too much data will undoubtedly require
more space and time to process. It is then required to use a filters or data mining
algorithm to derive a subset of the data without introducing a biased result.

Related Work 9
There are multiple three dimensional visualization methods that are useful to render on
a level. One of the most simple method is to simply display the positions of the data
in the three dimensional world as a point cloud. Different icons can be used as markers
to display certain data types or events. Geometric primitives of different colors can be
used in this regard as well.
Markers and geometric primitives can be obscured by the level geometry. This can be
solved by either ignoring the z-depth occlusion or applying a transparency to the level
geometry.
Color can also be used to denote the intensity of a scalar value associated with the
position. Such values can for example be frame rate, player health and such. The color
scale must be normalized after the data values as well, in order for data not to become
truncated. One cannot simply take the highest and lowest sampled values for normalizing
the color and expect it to be unbiased. Statistical outliers and faulty data may interfere
with the normalization process. It is important to filter out certain anomalies that would
otherwise erroneously weigh the data.
Opacity can also be incorporated as a visualization method for intensity. The same
concepts with normalization are applicable here. A base opacity can be given each item
as well. The more overlapping items the more the area appears opaque.
Time is another attribute which is often associated with each data item. The data can
be sorted by time or be filtered with different time intervals. Data which is sorted by
time can for example have lines drawn between points to approximate movement. A too
large sampling interval may lead to lines that clips geometry and is not representative
of the actual path.
3.3 Stingray
Stingray (formally known as Bitsquid) is a game development software used for game
creation, design and architecture visualization as well as VR experience creation and
is developed by Autodesk. One of Stingrays primary selling points is the seamless
interoperability between various Autodesk Software. Currently Stingray is only available
for Windows. Projects can be cross-compiled to various platforms and consoles including
mobile devices.
Stingray features a graphics engine, physics engine, material editor, level editor, scripting
tools and more. Stingray has a data oriented design and data driven architecture, which
means the program is decoupled from the data and resource files. Stingray is able

Related Work 10
to remain running while altering the data and reload it during run-time. One of the
founders, Niklas Gray, is a proponent of DOD instead of OOP-design [8].
Stingray is a combination of an editor and an engine, which are two applications that
are run simultaneously. This is illustrated in figure 3.1.
Figure 3.1: Simplified illustration of Stingray’s structure.
The editor is used for manipulating assets, handling input and displaying graphical
components from running projects. The engine is used to render the scene and various
preview windows. The editor and the engine communicates with each other by com-
mands and logging information via web-sockets. The engine renders the complied data
from the project content.
3.4 Editor
The editor is a Chromium application which is built using mostly HTML and JavaScript.
Some legacy features still uses a C# back-end, but the development in C# is discontin-
ued.
As previously mentioned, the editor is mostly used for asset management and editing.
When content is altered or edits are made the viewport, which is powered by the engine,
should be updated. This communication is mostly done by calling Lua snippets on the
engine from JavaScript.
It is also possible to define C functions in DLL files and call them from JavaScript. This
is known as a native extension. Native extensions are useful for performance demanding
tasks that would be too costly to do in JavaScript. Third party libraries can be used on
the native side as well for implementing new functionality.

Related Work 11
3.4.1 Implementation in JavaScript
The front-end of the plug-in is programmed in JavaScript which is a scripting language.
It is interpreted at run-time via a JavaScript engine. JavaScript is a prototype-based
language. All data types in JavaScript are objects with the notable exception of prim-
itive data types such as booleans, numbers, strings and undefined/null values. Arrays,
functions, classes are objects. Each object in JavaScript is in actuality a function ob-
ject which contains a member called prototype [9] which contains several built-in object
mechanisms. Each property in an object consists of a key-value pair.
During the development of the plug-in JavaScript scoping was considered. Without
using any keyword before initializing a variable in JavaScript it becomes public. It is
not desirable to have all properties of an object in the public scope since it can lead
to spaghetti-like structure with cross-object references and unpredictable behavior. In
order to give variables private or scoped visibility in JavaScript the keywords var and let
are used [10]. Before let was introduced with the ECMAScript 6 standard in 2015 the
keyword var was often used to define local scoping. The difference between var and let is
within scoping. var is scooped to the nearest function block (even if it is defined within
an enclosing block within a function block) and let is scoped to the nearest enclosing
block. Therefore let is less accessible and may appear to be scoped more intuitively.
In order to avoid scoping confusion and maintaining an intuitive structure var was not
used in the implementation of the master thesis.
3.4.2 Mithril.js
The front-end of the editor uses web-based tools such as HTML, CSS and JavaScript.
Plain HTML is designed to create static DOM:s which falters when it is used for creating
dynamic views and content. This makes it difficult to dynamically place different kinds
of contextual components depending on user input.
Therefore Stingray and its plug-ins uses Mithril.js. Mithril is a modern client-side
JavaScript framework for building dynamic Single Page applications. It allows for cre-
ation and manipulation of HTML components directly from the JavaScript code. An-
gular.js is a similar framework which is also available in Stingray, but used in a lesser
extent.

Related Work 12
3.4.3 View-Model Structure
The classic MVC is a common architecture pattern in software engineering. In larger
applications it can be viable to use such a pattern to separate the data (model) from
the presentation (view) and the input logic (controller). By doing so a more modular
structure is achieved. The model stores and manipulates data. The view renders a
model with a suitable graphical component. The controller handles user interactions
and can elicit changes in the model or view. An example related to this plug-in is web
pages, where the HTML components represents the view and the JavaScript code which
handles data represents the model.
Mithril uses a view-model structure which is a specialization of the MVC-pattern for UI
components [11]. A view-model stores the state of a UI component, which is separated
from the actual component. Each component is initialized with a model that contains
data and behavior. The models are usually designed as so called properties which is a
function object that acts like a getter-setter.
3.4.4 User Interface Components
Stingray has a number of Mithril-based user interface components. Such components
include buttons, text fields, drop-down menus, check-boxes and more. Each component
is initialized with an object which contains settings such as what model to bind to
the component’s view with and various other component specific options. Stingray
has a number of helper functions that can generate property models for each type of
component.
The component specific options varies from different components. Such options may
determine behavior and look such as color options, on-click actions, placeholder texts
and more. The documentation of the components is written in their source code. The
components are integrated in Stingray’s source code and are visible but not editable.
Because of the components being part of the source code, they have a set number of op-
tions. This means plug-in developers cannot change the component’s internal structure
and re-write functionality. Overriding functionality must hence be done externally.
Textbox.component ({ model: levelModel , placeholder: "Enter level name" })
This is example of how a user interface component is generated. The model field is set to
reference a user-defined property model which stores the string entered in the text box.
The placeholder field is a specific field for text boxes which determines what message is
displayed when the text box is empty.

Related Work 13
3.4.5 JavaScript to C Communication
The telemetry plug-in uses a DLL for database communication. By exposing certain
functions in the C code they can be called from JavaScript. Because of the radical
differences between C and JavaScript data cannot be implicitly converted. Stingray
has a system for converting data between C and JavaScript called ConfigValues. A
ConfigValue is a pointer to the memory address of a JavaScript object. Stingray has a
ConfigValue API which can read data and interpret data from ConfigValues.
A typical C function which can be called from JavaScript may look like the following:
ConfigValue foo(ConfigValueArgs args , int num)
All parameters sent from JavaScript to a C function are interpreted as an array of
ConfigValue arguments. An integer is implicitly passed into the function which denotes
how many parameters are passed as arguments. Each ConfigValue element represents
one input parameter. The ConfigValue API has a function which can determine what
JavaScript data type a ConfigValue has. The API also has functions for extracting
keys and values from a ConfigValue. Keys are interpreted as C-strings. Values can be
interpreted as basic data types such as integers, floating point numbers, booleans and
C-strings.
Data can be sent from the DLL to JavaScript as well. Every C function which is exposed
to JavaScript returns a ConfigValue. In this implementation the returned ConfigValue
usually has the type object or null. New ConfigValues can be appended to this Config-
Value as a key-value pair, much like how a JavaScript object is structured. Memory for
new ConfigValues can be allocated with the API. These allocated ConfigValues can be
set as certain data types and store values.
3.5 Engine
The engine is used for rendering scenes in viewports as well as executing game logic.
It is written in C and uses Lua as a scripting language layer. Lua is a lightweight
scripting language designed for prototyping or running less expensive operations. Lua is
a dynamic programming language which makes it possible to update the project during
run-time without the need to re-compile. Lua is used for gameplay programming and
logic within Stingray projects. Another way to create game logic is to use Flow. Flow
is a visual programming node-based system and can be used without any programming
knowledge.

Related Work 14
Native DLL:s written in C are used when extra performance is needed to avoid bottle-
necks, much like its equivalency on the editor side. The native DLL:s can be extended
with external DLL:s for third-party functionality.
3.5.1 Lua to C Communication
The Lua to C communication is much like the JavaScript to C. Functions can be reg-
istered in C to expose them to Lua. A built-in Lua-API is used to convert data from
Lua to C and vice versa. An abstract stack is used to exchange values between the two
languages. Each slot in this stack holds a Lua value. When a value is read it is popped
from the stack. In order to send a value from C to Lua the value must be pushed into
the stack. The pipeline is illustrated in figure 3.2.
Figure 3.2: Overview of how the engine interacts with plug-ins.
A function which is exposed to Lua takes in one Lua state parameter and returns the
amount of return values.
int foo(struct lua_State *L)

Related Work 15
The amount of return values is manually defined. The built-in Lua-API has functionality
for pushing fundamental data types and tables to the stack. A table is an object with
key-value pairs.
3.6 Plug-ins
Stingray is built on a modular structure. All panels are in fact separate plug-ins that can
be developed separately from each other with minimal amount of cross-dependencies,
as can be seen in figure 3.3. This makes it possible for developers to update features
and functionality independently from other tools. If all panels are closed down, only an
empty canvas with upper toolbar remains.
Figure 3.3: The Stingray program. Notice how all panels are separate plug-ins.
Plug-ins can be dynamically loaded into Stingray via the Plug-in Manager. Because of
Stingrays modular structure they can be reloaded as well without restarting the program.
Custom plug-ins can be written to alter the behaviour of the editor and engine and
to add new functionality. Primarily there are two different types of plug-ins; editor
and engine plug-ins. Cross-communication between custom editor and engine plug-ins
is possible. The native plug-ins are compiled to DLL-files that can be included and
automatically loaded with the plug-in. The pipeline is illustrated in figure 3.4.

Related Work 16
Figure 3.4: Overview of Stingrays plug-in communication for the editor.
Chapter 4
Implementation
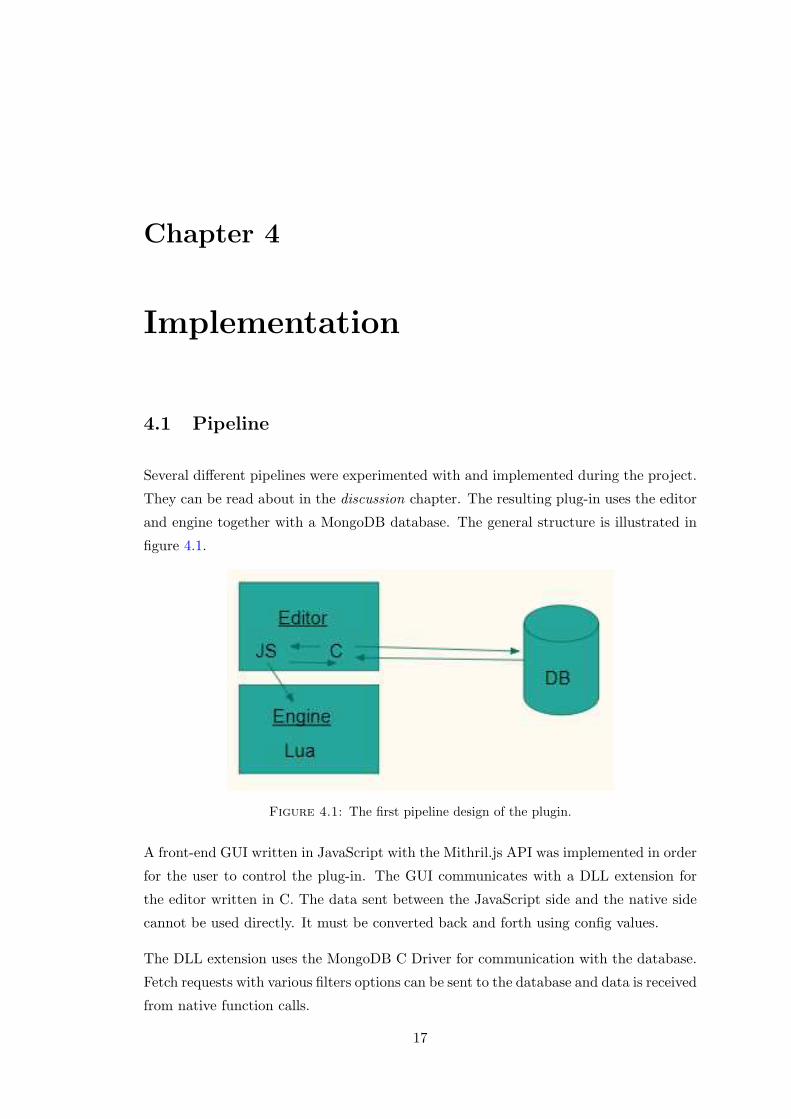
4.1 Pipeline
Several different pipelines were experimented with and implemented during the project.
They can be read about in the discussion chapter. The resulting plug-in uses the editor
and engine together with a MongoDB database. The general structure is illustrated in
figure 4.1.
Figure 4.1: The first pipeline design of the plugin.
A front-end GUI written in JavaScript with the Mithril.js API was implemented in order
for the user to control the plug-in. The GUI communicates with a DLL extension for
the editor written in C. The data sent between the JavaScript side and the native side
cannot be used directly. It must be converted back and forth using config values.
The DLL extension uses the MongoDB C Driver for communication with the database.
Fetch requests with various filters options can be sent to the database and data is received
from native function calls.
17

Implementation 18
4.2 Editor
As previously mentioned, the purpose of the editor is mainly to communicate with the
database, handle data and provide an interface for user interaction. The front-end view
consists of a window with two panels; one for the GUI and one for a viewport.
The DLL extension for the editor is loaded on start-up. An connection between the
JavaScript front-end and the back-end can be established when then DLL is loaded.
A connection is made between the editor and the engine via JavaScript to Lua interoper-
ability. Lua functions can be exposed and called from the editor to change the behavior
of the engine. Functions defined in Lua can be called from JavaScript by using the raise
function with the Lua function name as its first argument. Functionality for loading and
displaying a Stingray level in the viewport has been implemented. By either manually
entering a path or browsing any level in the open project can be loaded. The request to
load a level is sent from the editor to the engine.
All GUI components are initialized on start up. Because of the data oriented nature
of the program many of the lists and drop-down menus are initialized with null values
or empty model objects since their values are not hard coded. Certain components are
disabled until data has been received from the database. Their values are determined
by data fetched from the database later.
4.2.1 Database Connection
To establish a client-server connection to a MongoDB server an IP address together
with a port number is needed. localhost is used as default value which represents the
local address of the computer. The default port number is 27017. Pressing the connect
button triggers a DLL function that attempts to establish a client-server connection. If
the IP and port numbers are valid MongoDB a new client object is initialized which
can communicate with the local server. Special checks have been implemented which
discards attempts to connect to the same address twice or invalid addresses.
The plug-in can connect and disconnect to different databases during the same session.
A toolbar has been implemented for letting the user connect to a database. A DLL
function is called when a database connection attempt is made. If both client-server
and database connections are successful everything is set up for using MongoDB. When
a connection between a client and a server have been established, a DLL function is called
to fetch a list of the collections in the database. The collection names are passed back
to the front-end and added to the drop down menu for selecting collections collections.

Implementation 19
4.2.2 Fetching Data
A MongoDB database has one or more collection. Each collection stores objects know as
documents. Each document represents one data record and has various key-value pairs.
A key is a name and a document can also have sub-documents, which in turn have their
own field-value pairs.
Different data types can be stored in the database. In the database acquired from
Fatshark fundamental data types such as booleans, floats and strings are used to store
values. Most of these field values can be read and parsed directly. An exception is
three-dimensional vectors which uses the formatting Vector3(x,y,z) which have been
serialized to strings. The strings is parsed with a custom parser in order to retrieve their
values. However this vector formatting is specific for Fatshark. Other databases might
use different types of formatting. In order to make the plug-in data driven a specific
formatting cannot be assumed.
The model of the drop-down list for choosing a collection triggers a native function call
when an option is selected. The function acquires the selected collection name as an
input parameter. The keys from the documents in this collection is requested. This is
done by iterating through the different keys in the first document. Problems will arise if
the first document has a different structure and does not contain all desired keys. One
collection in the Fatshark database has a varying document structure. This special case
was solved by picking the sixth document which contains all keys.
The obtained keys are pushed into a config value array and sent back to the front-end.
The keys are then passed into the model of a list component. The purpose of this list
is to let the user define a filter for what keys that should be fetched from the database.
The list model has been implemented so that it can display any number of keys. The
user can freely choose what keys to include and which should be sorted.
Two integer input fields have been added to let the user define what index to start the
fetch from (also known as skip) and how many documents that should be included. As
can be seen in figure 4.2.
The keys that are marked for inclusion together with sorting options, start index and
amount are used to specify a query for the database. These parameters are composed into
JavaScript objects, where the keys specifies what parameter the value represents. The
different keys are limit, skip, fields and sort. These object are sent as input parameters
to a native function that queries the database. The native function recognizes the keys
and matches the data accordingly. This makes it possible to send the input parameters
in any order, as long as they are all included.

Implementation 20
Figure 4.2: This list displays the available fields in the database for a certain collec-tion.
A database query is constructed using BSON objects. A BSON object can represent
the inclusion of a specified key or be used as logic operators such as exists, and or or.
Multiple BSON objects are appended to each other to more complex filtering.
The data in the Fatshark database was not sorted based on what level it was collected
from. Each document has a session id that indicates from what session the data was
recorded and corresponds to a certain level. One collection includes game initialization
data which holds information about what session is related with what level. The sessions
which corresponds to a certain level can be isolated by querying the game initialization
collection for unique session id:s for that particular level key. These sessions are bundled
together with an or filter and applied to the user-specified filter. The or filter is equiv-
alent to a union - all sessions are iterated through in the filter. All documents without
a position is ignored.
Since only keys which have been marked for inclusion should be considered, it is desired
to only include these key values in the returned data after querying the database. An
options BSON object was defined which is used to define what subset of data a returned
document should contain. The selected keys were appended to the options object with
an and operator.
The database is queried by calling a fetch function witch takes the desired collection,
filter and document options into account. An iterator to the fetched documents is
returned. This iterator is called cursor and is used for stepping through all obtained
documents. All keys are iterated through in each document. The values of the keys

Implementation 21
are stored in separate separate arrays. All arrays are bundled together in a config value
object and sent to JavaScript.
The key values are displayed in a list. Each row represents a document and each column
represents a key. A check box was added to let the user decide what documents to
include in the visualization. The documents whose check boxes are marked are to be
used in the visualization step.
4.2.3 Visualization Options
With the pipeline communication between the editor, engine and database established
all pieces are in place in order to visualize the data in a viewport. The telemetry plug-
in was designed so developers can define their own visualization techniques given the
JavaScript and Lua code.
Different data types are needed depending on what visualization type the user has
chosen. For instance a point cloud needs at least a position in numbers and optionally
a scalar value to display a magnitude. Other visualization types might need a different
set-up of data types. Because of the data driven approach, assumptions of which data
type corresponds to a document key cannot be made. Instead the user has to select
which collection key value pair to map to which visualization field. This was done by
creating a specific GUI panel for each visualization type. These panels have different
drop-down menus for mapping collection fields to visualization properties. The plug-in
source code is structured and documented so that new visualization types can be added
by user.
4.3 Engine
When the engine receives the data from the editor it is in a raw format. Raw data means
that it has not been transformed in any way. It is in the same format and is represented
as the same data types as in the database. The render functions in the engine expects
the visualization data to be of certain data types. Because the plug-in is data driven no
assumptions can be made about the structure of the database. Special converters and
parsers are used to transform the data before use. As mentioned in the previous section,
three-dimensional vectors are sent to Lua-layer as strings with a certain formatting. It
is up to the user to write their own passers to fit their database format. An parser for
the Fatshark structure was implemented in this case.

Implementation 22
Each visualization type must have its respective Lua-layer counterpart which defines the
engine and rendering behaviour of the visualization.
The data is used in the render loop to render the results. LineObject:s are used to draw
debug lines, geometric primitives and gizmos in the game world. There are a couple of
different geometric primitives such as lines, spheres, boxes and capsules to use. They are
rendered with one RGBA-color and does not receive any shadows or lighting effects. The
line objects have an optional z-depth culling option that hides objects that are obscured
by geometry. The z-depth culling option is disabled in order not to hide objects in
buildings and behind walls.
4.4 Data Visualization
The only implemented visualization is a point cloud with two modes. It is mapped to
a three-dimensional Cartesian coordinate system with or without color mapping. The
visualization without color mapping uses the data position with white as default color.
When color mapping is enabled, the data set requires a scalar value for each item in
order to compute the tint of the color. The color varies from red to black or black to
green. The determination of the color value is set by a linear interpolation together
with three user selected values, minimum, middle and maximum. The mathematical
functions that was used can be seen at equation 4.1 and 4.2.
cgreen = 255(cvalue − cmiddle)/(cmax − cmiddle) (4.1)
cred = 255− 255(cvalue − cmin)/(cmiddle − cmin) (4.2)
Depending on whether the scalar value is lower or higher then the middle value, the
geometric object will have a red or a green color. A lower the scalar value will result in
a red to black color scale. A higher value will result in a black to green color scale. If
the user have chosen to render a point cloud with color mapping and the scalar value is
missing from an item, the linear function will set the color to the default color.

Chapter 5
Results
5.1 General Results
The final result of the tool can be seen in figure 5.1. The left panel contains all the GUI
components and the right panel contains the viewport.
Figure 5.1: The resulting design of the plugin.
The GUI is separated in accordion components that can either be in a maximize or
minimize mode. The first accordion contains functionality to connect to a MongoDB
address and database. The accordion called Load level can open a list of available levels
23

Results 24
in the current project and load the selected level into the viewport. The levels are listed
in a separate window with a filter function which can exclude levels based on names.
When the tool is connected to a database a drop down list if shown with a list of the
collections.
Figure 5.2: A list of up to 1000 documents with all the values to the fields keys inthe collection.
The following database contains the field’s id, position and scalar. This can be seen in
figure 5.3. The id is an index created by MongoDB when a new document is inserted
into the collection and will not appear in the list. The list will be updated when a new
collection is selected. The user can select one or more keys to be listed. It is possible to
have each field sorted before fetching the data. The columns can be sorted in ascending
or descending order. The user can select how many documents to skip (relative to the
first document in the collection) and the amount of documents that should be listed.
Figure 5.3: A sample of the test database with the keys id, position and scalar.

Results 25
The visualization type that should be rendered can be selected from a drop-down menu
in the visualization options. Point cloud is currently the only implemented visualization
in the tool. A point cloud requires a position, with or without a scalar value. If Use
color scale is enabled three more fields is required, a minimum, desired and a maximum
value. The GUI component can be seen in figure 5.4.
Figure 5.4: The Visualization GUI component with the different options.
The point cloud visualization is shown figure 5.5. The only modification that was needed
for this particular database was a parser to extract the position values from strings.
Figure 5.6 illustrates the results when color scaling is enabled.
Figure 5.5: Scatter plot visualization with the test database.
5.2 Fatshark-Specific Results
The modified version of the tool for the Fatshark database is changed in several ways.
An additional GUI component labeled Fatshark Mode was added. This gives the user
the ability to filter the query by a level key. The GUI with the additional component is
shown in figure 5.7.

Results 26
Figure 5.6: Scatter plot visualization with the test database and color scaling.
Figure 5.7: How the GUI looks when it is modified to work with the Fatsharkdatabase.
Figure 5.8 and 5.9 shows a point cloud for the Fatshark database and the level Man the
Ramparts, with or without color scaling.
Figure 5.10 displays the the result when color scaling is enabled and the data set is
missing scalar values. The objects will then be rendered with a default color to indicate
missing or corrupt data.

Results 27
Figure 5.8: Scatter plot with Fatshark’s level Man the Ramparts and correspondingtelemetry.
Figure 5.9: A scatter plot with color scaling enabled.
Figure 5.10: The default color of the boxes when the engine does not receive a validscalar value.

Chapter 6
Discussion
6.1 The Work Process
Overall the progression of the project was on point with the time schedule. Although
there are many improvements that can be made, especially within usability and ex-
tending the visualization possibilities, the primary goals, which were more technically
oriented, were reached in time. Much time had to be allocated to understanding the in-
ner workings of Stingray and its various API:s due to our inexperience with the systems
involved. At least two months were spent on understanding the basics of the editor and
engine before any serious work on the resulting application could begin.
Due to the fact that this project became quite technology heavy one high-fidelity pro-
totype had to suffice. Low-concept prototypes on both the pipeline and the front-end
GUI were drawn on paper and used as discussion material when making decisions.
The research/learning phase could potentially have gone faster if Stingray had more
beginner-friendly documentation and more examples on how to create plug-ins. There
are basic tutorials available [12], but they are quite basic and mostly covers the theo-
retical aspects of Stingray’s structure and how to get started with plug-in development.
Tutorials and documentation were mostly sparse as the API:s were currently being
worked on and updated continuously.
Fortunately quite early in the project a thorough tutorial by Autodesk developer Jonathan
Schmidt from the Montreal team was discovered [13]. This tutorial covered all steps in
creating a plug-in for creating in-game animated gif textures. This covered aspects
like the initial set-up, editor and engine development. The tutorial served as a primary
reference during the research phase.
28

Discussion 29
The editor front-end uses Mithril.js which has it’s own API documentation and tutorials.
However it was the usage of Mithril.js in the context of a Stingray plug-in which was
primarily needed during the project. Autodesk had developed several UI components
which were intended to be used within plug-ins. These components were unfortunately
not documented by Autodesk on the Stingray developer reference website. However the
source code of each UI component was available and which in most cases was rather
concise and well documented. After gaining some initial experience with the API, the
source code could be used as documentation in and of itself. There were also a couple of
simple example plug-ins which were available in Stingray. These were studied and used
as references for implementing various behaviors.
Some documentation of the C API existed on the developer web reference, albeit due
to the scale not very beginner friendly [14]. One problem was understanding how to
expose C functions through the DLL to JavaScript. There was one code example which
covered this subject which we followed thoroughly [15]. As the API was currently being
developed and changed the config value structure had been changed and did not work
according to the code example. At first we believed the documentation was obsolete.
We then realized that the Stingray build we ran from February was obsolete and the
config value structure had been changed shortly thereafter. After re-building Stingray
the C API was updated and matched with the current documentation.
When the Node.js part of the front-end was replaced with the MongoDB C Driver prob-
lems arose when trying to incorporate the drivers into the plug-in. This was mostly be-
cause of our relative inexperience with the build system and writing custom CMake files.
Jonathan Schmidt eventually helped with creating a working CMake file which linked
the MongoDB C driver correctly. The official documentation for MongoDB C was sparse
in certain aspects, but there was a basic example which helped getting started [16]. Most
functionality had to be looked up on the internet, especially on www.Stackoverflow.com.
The Lua documentation for Stingray was way more well-documented and verbose [17].
This is probably because most Stingray users primarily use Lua (and the node based
Flow system) for gameplay programming and interaction with the engine. The well
structured documentation simplified the learning process much.
During the development process the work was split into smaller tasks which were man-
aged on www.Trello.com. The work was usually split between us so that front-end and
back-end tasks were being solved simultaneously. This was effective, since there needed
to be much back-and-forth communication between the front-end and the back-end in
the data driven application.

Discussion 30
6.2 Design Changes
This section discusses the changes that were made during the development of the tool.
There have been both minor and major changes to already implemented features which
have taken time and effort to refactor. The result of those changes have both improved
the structure and simplified further development.
6.2.1 MongoDB with Node.js Server or C API
The only thing which was certain when development started was to use MongoDB for
communication between the tool and the database. This was certain because Fatshark’s
database was created with MongoDB. MongoDB has several API:s available for devel-
opers. The most obvious choice in the beginning was to use JavaScript in some form as
Stingray uses JavaScript as editor scripting language. The engine front-end uses Lua,
there existed no official Lua API for MongoDB at the time.
The MongoDB JavaScript API uses Node.js as an external back-end. This was in the
beginning of the development when DLL extensions were not used and therefore the C
or C++ API:s were not considered to be an option. An illustration of the data pipeline
after implementing Node.js can be seen in figure 6.1.
Figure 6.1: The pipeline when using an external Node.js server.
Problems occurred when attempts were made to integrate Node.Js into the Stingray
structure. Due to our inexperience with the build system this was unsuccessful. Instead
Node.js was used as an external dependency, which was not desirable since the goal
was to create a plugin that worked out-of-the-box without the user having to configure
external parts.

Discussion 31
As our experience with developing plug-ins for Stingray increased, more possibilities
were explored and the use of DLL:s were considered for the the editor and engine. This
meant that the plug-in could be expended with functions in DLL files and directly use
C/C++ to optimize and avoid bottlenecks in the pipeline.
The positive and negative aspects by adding native extensions and refactoring the code
to accommodate this were discussed. By using DLL:s instead of an external Node.js
server made it possible to removed it from the pipeline and replaced with functionality
from MongoDB’s C or C++ API. This removed the problem with having Node.js as
an external dependency. The conclusion was to change the pipeline was reached and
development started on DLL:s.
There were possibilities to use either MongoDB’s C or C++ API. A decision had to be
made. The C API was chosen in order to avoid external libraries such as Boost which
the C++ API depended on. The more external dependencies that are added the harder
the code may become to maintain and update in the future. The pipeline’s structure
using native DLL:s can be seen in figure 6.2
Figure 6.2: The pipeline using native DLL:s instead of an external Node.js depen-dency.
From the beginning of development the tool was designed to work with Fatshark’s
database. The idea to generalize the plug-in was there but not yet expanded upon.
The development came so far in this phase that the plug-in could filter out telemetry for
a specific level and could be rendered as a scatter plot. Thus a result, albeit a specific
one, was reached.

Discussion 32
6.2.2 Data Driven Tool
After some discussion with employees at Autodesk, the direction of the master thesis
changed. Stingray is data driven and if a visualization tool would be useful for a larger
user base it could not be developed according to a specific database layout. It had to
be generalized.
Employees at the office had experience with data driven development and would gladly
give advice if needed. A re-factoring phase was started with the aim of rewriting the
plug-in to a data driven structure. The result was a generalized visualization tool where
the user can select any type of data and couple it with visualization properties. Some
minor modifications in the code might be needed, such as unique parsers for special data
types such as vectors. The final data driven structure is illustrated in figure 6.3.
Figure 6.3: The resulting data-driven pipeline.
6.3 Future Work
6.3.1 Finding Unique Keys in a Collection
The solution for listing all available field keys in the database does not work with all
database configurations. The current solution will only look at one document in the
database and return a list of its field keys. The case may be that this document is
missing one or more keys depending of how the data is stored in the database. This was
the case with the database from Fatshark. Some of the documents were also missing a
key-value pair because no value could be found.
This can be solved in numerous ways. One solution is to iterate through all the docu-
ments the in database and list the unique keys. This approach is not scale friendly when
the database grows in size, so a viable solution has to be more elegant.

Discussion 33
MongoDB has a feature that may solve the problem. Map-Reduce [18] is a data pro-
cessing method for condensing large volume of data into an aggregated result.
Another limitation is the maximum number of layers the field keys can be found in. The
current solution is limited to the maximum of two layers and will not list keys beyond
that. It might be rare to have more than two layers but not impossible. A generalized
solution should not have a set number of sub-documents. This can be solved by changing
the implementation from an iterative to a recursive solution.
6.3.2 Filtering
The prototype is lacking the ability to filter data which can lead to false correlations and
most certainly longer processing times for the database. Useful applications of filters can
for example be filtering data by a certain level level or difficulty. Fields with a number
type could be filtered by a minimum and maximum value to limit the data, in order
to for example find problematic areas in the levels. If a bug report is reported with a
logged time stamp and a session id filtering can make it easy to find the corresponding
data by only including the specific session and limit the time span to the specific time.
6.3.3 Supporting Different Database Systems
The tool is currently limited to function with MongoDB databases only. In reality there
are numerous database solutions and it is important to at least support the types with
most users. The tool will need to support a range of databases which must be integrated
into the plug-in in some way.
6.3.4 Database Optimization
The time it takes for a small database to process a query is quite short but when the
database grows in size the process time for a query will most likely become cumbersome
at some point. New ways to optimize the query must be implemented in order to reduce
the workload. Tools such as profilers can be used to find bottlenecks in the data pipeline.
If a future version of the tool will support several databases, each database could po-
tentially have different bottlenecks which would need a separate database profiling tool
in order to optimize.

Discussion 34
6.3.5 UX and Visualization Methods
The tool is a prototype of how it is possible to design a data driven visualization tool for
telemetry. Two common visualization methods with a GUI are available in the current
result. The colors are currently pre-set and not changeable. The red-black-green scale
might not be very clear against all backgrounds. In a further expansion the color scale
might be editable. One future work aspect is to design it with usability in mind. UX is
its own field and is big enough to be explored as a separate project, which also includes
designing user friendly visualizations.
With three dimension available, the depth perspective can be utilized, but it also adds
another dimension of difficulty. For example the problem of visualizing data inside of
meshes. For this project, the z-depth test was ignored so that the data markers were
rendered on top of the geometry. This aspect may need to be explored and evaluated
further in order to not give the user a misleading representation of the data.

Chapter 7
Conclusion
A prototype of a visualization tool for telemetry has been successfully created. The
prototype can be seen as a potential foundation for how to design a real visualization
tool. There are many features missing which are necessary for the tool to become a
useful, and features that can be improved upon.
7.1 How should the data pipeline be design for the tool?
The final pipeline, which can be seen in figure 6.3 consists of one connection between
the database and the editor and a one-way connection from the editor to the engine.
In the original pipeline concept the engine had a connection to the database. In that
approach the actual telemetry data was not sent from editor to engine. Instead different
fetch queries were considered to be sent from editor to engine in order to give the engine
instructions on what data to fetch from the database.
Because of the data-driven approach the information from the database needs to be dis-
played in the editor so that the user may choose what data to include in a visualization.
In the final pipeline the user can compose fetch queries from the editor front-end which
are then handled on the back-end. The back-end communicates with the database,
fetches the telemetry data according to the query and sends relevant information back
to the user interface. The JavaScript-Lua connection between the editor front-end and
engine-front-end can manage to transfer large quantities of data in real time. This meant
that implementing engine back-end to database communication was unnecessary. In the
end the entire back-end of the engine was not needed for this plug-in.
35

Conclusion 36
7.2 How generalized and data driven can a visualization
tool be? What are the limitations?
The final result is a rather generalized plug-in which, with a few exceptions, was invariant
to the data and database structure. The plug-in can parse different types of data from
the database into relevant data types such as floating point numbers, booleans, strings,
vectors and more to use in the visualizations. There are limitations on how generalized
the plug-in is. One primary limitation are three-dimensional vectors which are usually
stored as strings in the database which have to be parsed. The formatting of these vector
types may vary from different databases. A number of pre-set parsers are included in
this plug-in for the user to choose from in the GUI without having to alter the source
code. Other limitations are discussed in the future work section.
A visualization needs certain parameters to make sense. Scalar values requires floating
point numbers and positions require 3D vectors for instance. It should not be possible to
couple a visualization parameter with an irrelevant data type. For instance, a boolean
value cannot be used as a position. No other assumptions on the meaning of the data
is made. This is left to the user.

Bibliography
[1] Anna Olofsson. Visualisering av information vid navigering i skargard. http:
//liu.diva-portal.org/smash/get/diva2:823497/FULLTEXT01.pdf, 2015.
[2] Martin Stenmarck. Software development of visualization tool for 3d cam-
eras. http://liu.diva-portal.org/smash/get/diva2:417104/FULLTEXT02.
pdf, 2001.
[3] Jonathan Dankoff. Game telemetry with dna tracking on assassin’s
creed. http://www.gamasutra.com/blogs/JonathanDankoff/20140320/213624/
Game_Telemetry_with_DNA_Tracking_on_Assassins_Creed.php, 2014. [Online;
accessed 27-07-2017.].
[4] Georg Zoeller. Development telemetry in video game projects, (video presentation).
www.gdcvault.com/play/1012227/Development-Telemetry-in-Video-Games,
2010. [Online; accessed 26-07-2017.].
[5] Mikael Hansson Rikard Blomberg. Autodesk presents warhammer - the end
times: Vermintide - a technical postmortem). www.gdcvault.com/play/1023514/
Autodesk-presents-Warhammer-The-End, 2016. [Online; accessed 26-07-2017.].
[6] Anders Drachen. What is game telemetry. www.gameanalytics.com/blog/
what-is-game-telemetry.html, 2012. [Online; accessed 26-07-2017.].
[7] Magy Seif El-Nasr Anders Drachen, Alessandro Canossa. Intro to user
analytics. http://www.gamasutra.com/view/feature/193241/intro_to_user_
analytics.php, 2013. [Online; accessed 27-07-2017].
[8] Niklas Gray. An example in data-oriented design: Sound parameters. http://
bitsquid.blogspot.se/2011/11/example-in-data-oriented-design-sound.
html, 2011. [Online; accessed 31-07-2017.].
[9] Mozilla. Object.prototype. https://developer.mozilla.org/en/docs/Web/
JavaScript/Reference/Global_Objects/Object/prototype, 2017. [Online; ac-
cessed 26-07-2017.].
37
Bibliography 38
[10] Mozilla. Let. https://developer.mozilla.org/en/docs/Web/JavaScript/
Reference/Statements/let, 2016. [Online; accessed 26-07-2017.].
[11] Microsoft. Model-view-controller. https://msdn.microsoft.com/en-us/
library/ff649643.aspx. [Online; accessed 26-07-2017.].
[12] Autodesk Knowledge Network. Extend the editor. http://help.autodesk.com/
view/Stingray/ENU/?guid=__sdk_help_extend_editor_html, 2017. [Online; ac-
cessed 24-09-2017.].
[13] Jonathan Schmidt. How to create a cool plugin using stingray. https:
//jschmidt42.github.io/stingray/2017/01/01/stingray-plugin.html, 2017.
[Online; accessed 23-09-2017.].
[14] Autodesk Knowledge Network. Stingray editor c api reference. http://help.
autodesk.com/view/Stingray/ENU/?guid=__editor_c_index_html, 2017. [On-
line; accessed 23-09-2017.].
[15] Autodesk Knowledge Network. Stingray editor c api reference. http:
//help.autodesk.com/view/Stingray/ENU/?guid=__editor_c_editor_
native_code_2src_2editor_native_plugin_8h_example_html, 2017. [On-
line; accessed 23-09-2017.].
[16] MongoDB Inc. Mongodb c driver tutorial. http://mongoc.org/libmongoc/
current/tutorial.html, 2017. [Online; accessed 23-09-2017.].
[17] Autodesk Knowledge Network. Data-driven design. https://help.autodesk.com/
view/Stingray/ENU/?guid=__lua_ref_index_html, 2017. [Online; accessed 01-
08-2017.].
[18] MongoDB. Map reduce. https://docs.mongodb.com/manual/core/
map-reduce/. [Online; accessed 26-07-2017.].