mobile analytics mit elasticsearch und kibana … analytics mit elasticsearch und kibana dominik...
TRANSCRIPT
Mobile Analytics
mit Elasticsearch und Kibana
Dominik Helleberg
Speaker
Dominik Helleberg
Mobile Development
Android / Embedded
Tools
http://dominik-helleberg.de/+
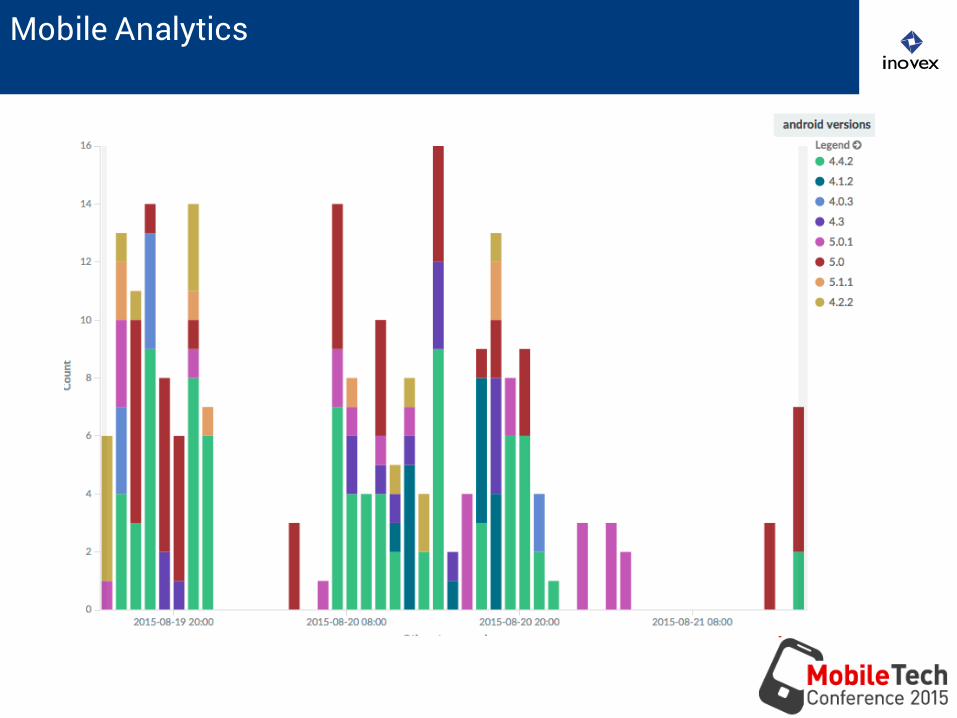
Mobile Analytics
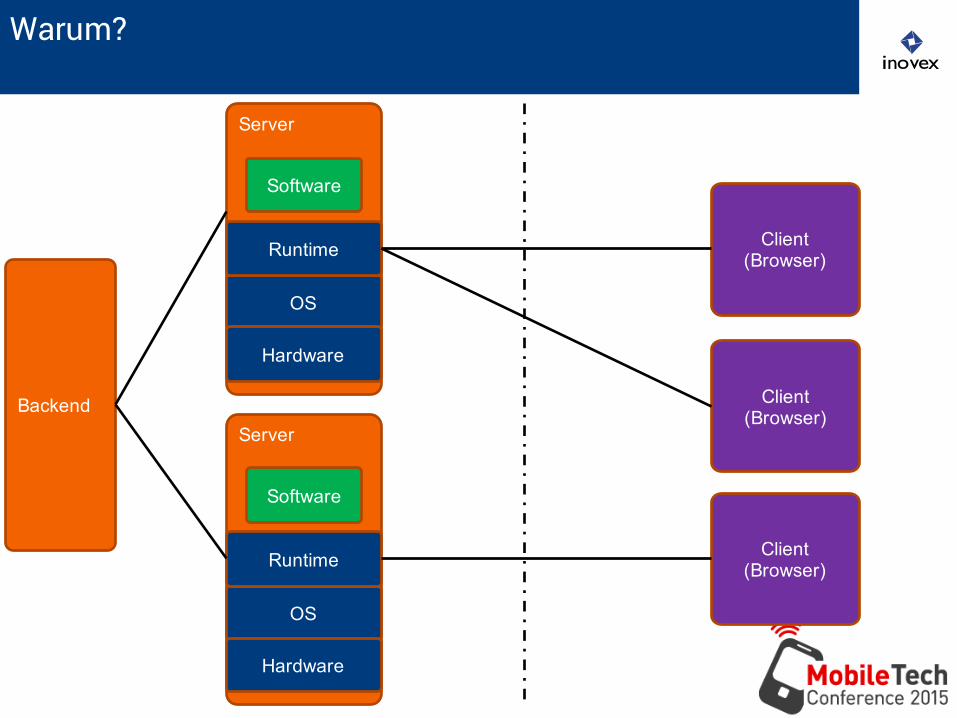
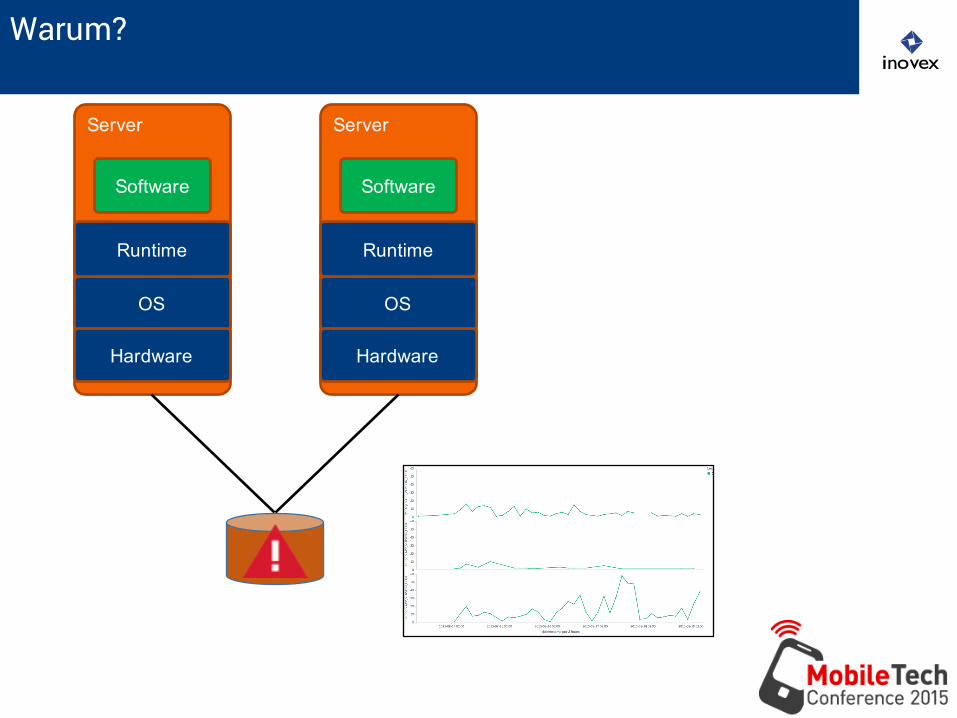
Warum?
Server
OS
Hardware
Runtime
Software
Client (Browser)
BackendServer
OS
Hardware
Runtime
Software
Client (Browser)
Client (Browser)
Warum?
Server
OS
Hardware
Runtime
Software
Server
OS
Hardware
Runtime
Software
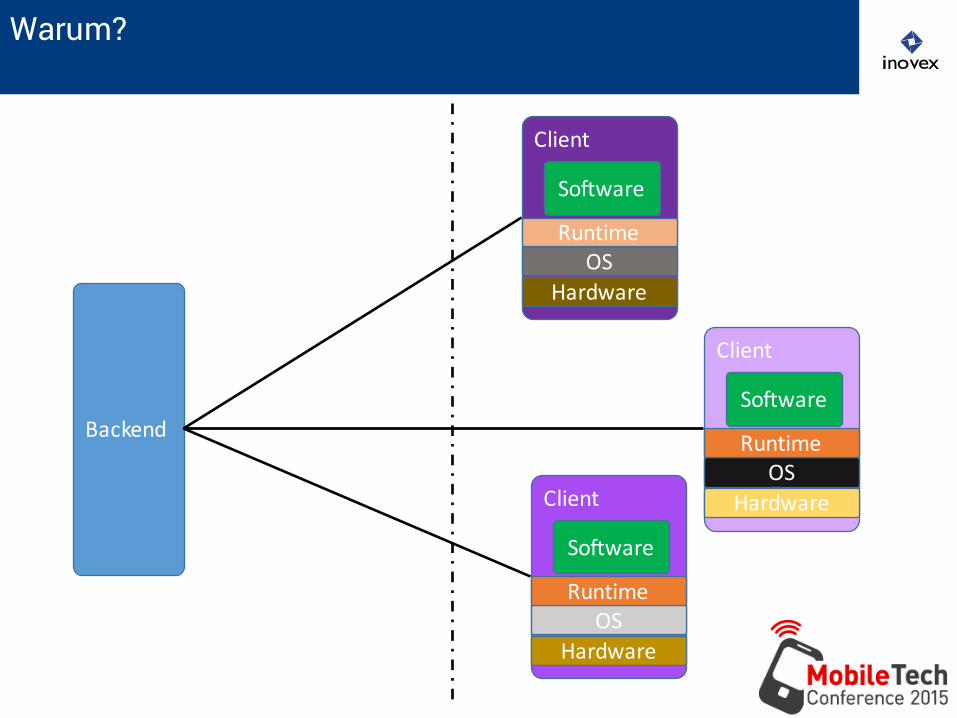
Warum?
Client
OSHardware
Runtime
Software
Backend
Client
OSHardware
Runtime
Software
Client
OSHardware
Runtime
Software
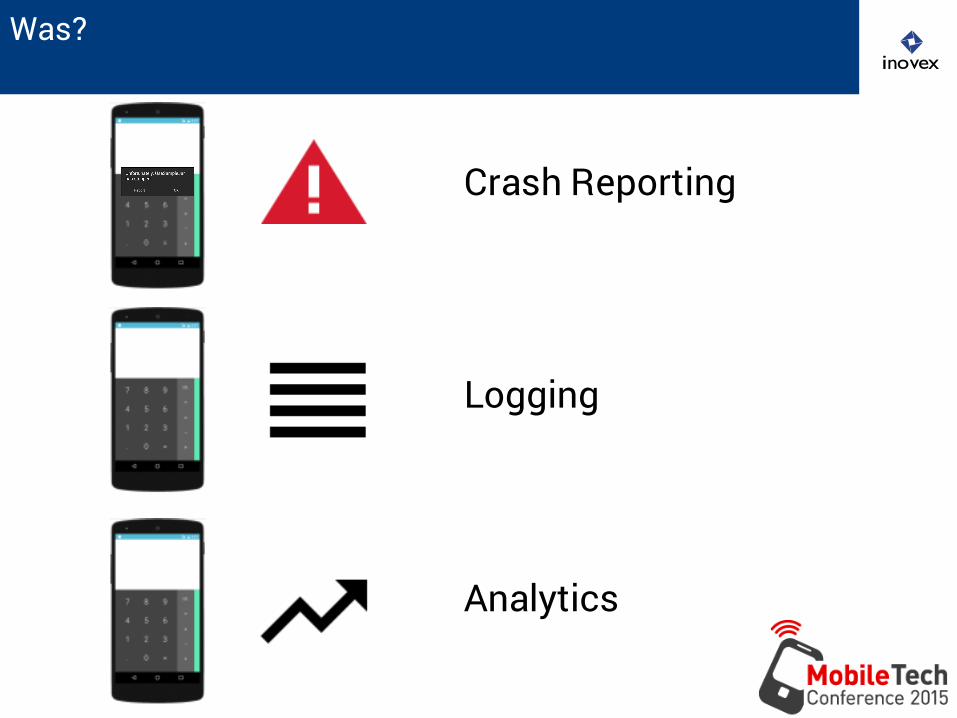
Was?
Crash Reporting
Logging
Analytics
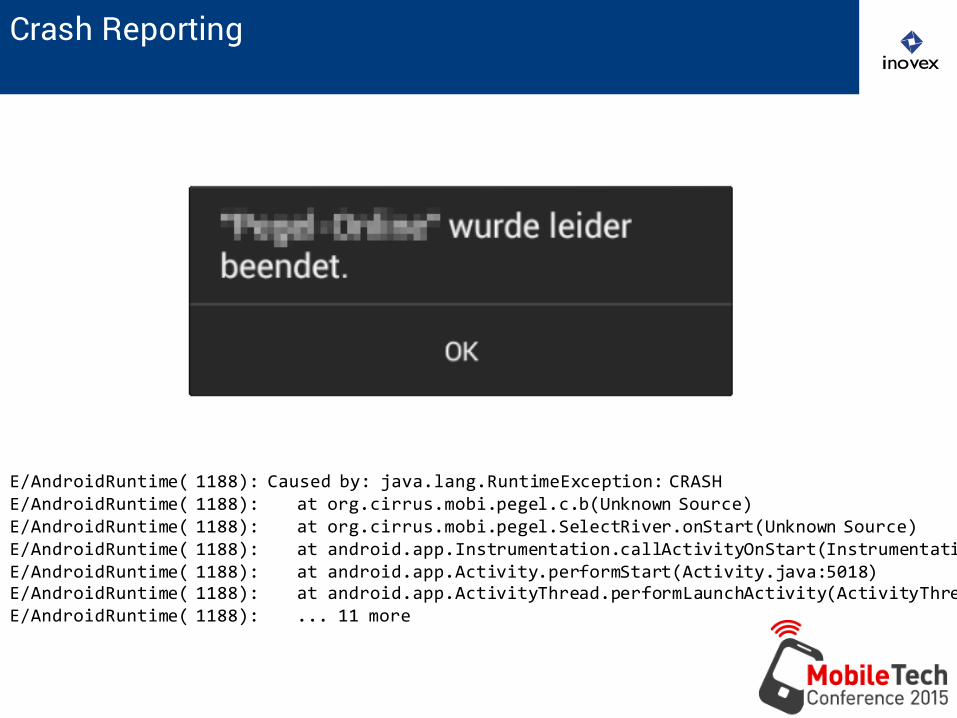
Crash Reporting
E/AndroidRuntime( 1188): Caused by: java.lang.RuntimeException: CRASHE/AndroidRuntime( 1188): at org.cirrus.mobi.pegel.c.b(Unknown Source)E/AndroidRuntime( 1188): at org.cirrus.mobi.pegel.SelectRiver.onStart(Unknown Source)E/AndroidRuntime( 1188): at android.app.Instrumentation.callActivityOnStart(Instrumentation.java:1163E/AndroidRuntime( 1188): at android.app.Activity.performStart(Activity.java:5018)E/AndroidRuntime( 1188): at android.app.ActivityThread.performLaunchActivity(ActivityThread.java:2032E/AndroidRuntime( 1188): ... 11 more
Crash Reporting
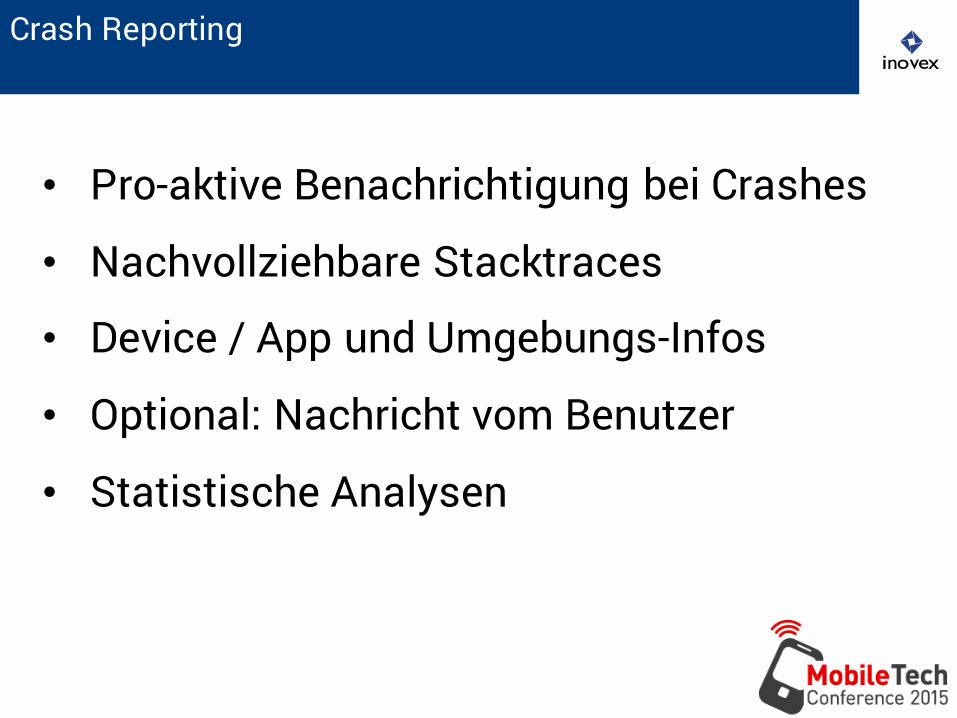
Crash Reporting
• Pro-aktive Benachrichtigung bei Crashes
• Nachvollziehbare Stacktraces
• Device / App und Umgebungs-Infos
• Optional: Nachricht vom Benutzer
• Statistische Analysen
Crash Reporting
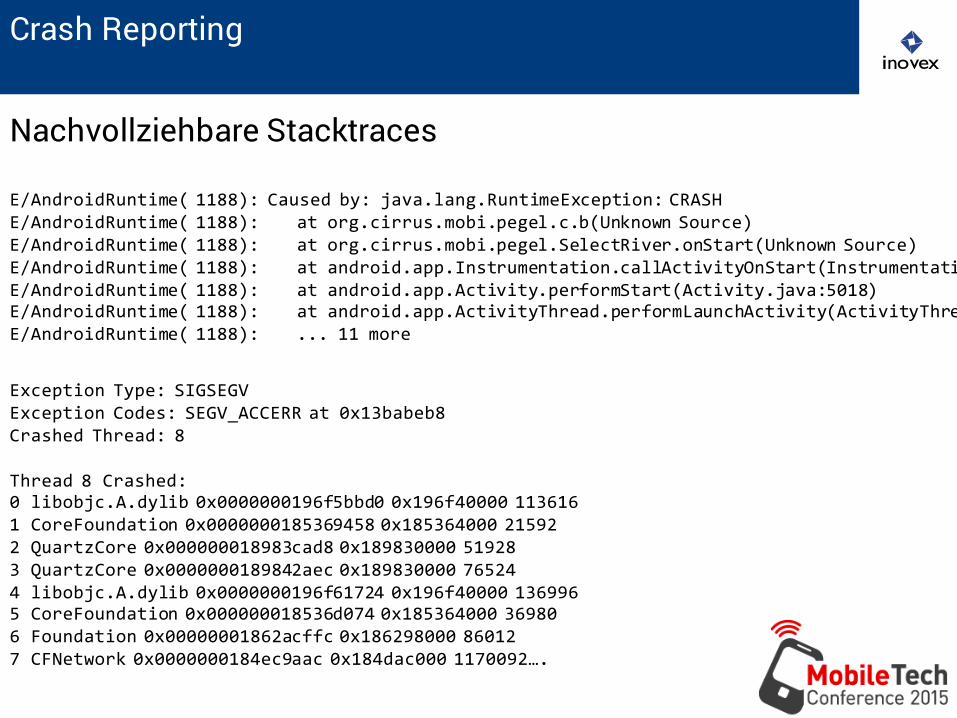
Nachvollziehbare Stacktraces
E/AndroidRuntime( 1188): Caused by: java.lang.RuntimeException: CRASHE/AndroidRuntime( 1188): at org.cirrus.mobi.pegel.c.b(Unknown Source)E/AndroidRuntime( 1188): at org.cirrus.mobi.pegel.SelectRiver.onStart(Unknown Source)E/AndroidRuntime( 1188): at android.app.Instrumentation.callActivityOnStart(Instrumentation.java:1163E/AndroidRuntime( 1188): at android.app.Activity.performStart(Activity.java:5018)E/AndroidRuntime( 1188): at android.app.ActivityThread.performLaunchActivity(ActivityThread.java:2032E/AndroidRuntime( 1188): ... 11 more
Exception Type: SIGSEGV Exception Codes: SEGV_ACCERR at 0x13babeb8 Crashed Thread: 8
Thread 8 Crashed: 0 libobjc.A.dylib 0x0000000196f5bbd0 0x196f40000 113616 1 CoreFoundation 0x0000000185369458 0x185364000 21592 2 QuartzCore 0x000000018983cad8 0x189830000 51928 3 QuartzCore 0x0000000189842aec 0x189830000 76524 4 libobjc.A.dylib 0x0000000196f61724 0x196f40000 136996 5 CoreFoundation 0x000000018536d074 0x185364000 36980 6 Foundation 0x00000001862acffc 0x186298000 86012 7 CFNetwork 0x0000000184ec9aac 0x184dac000 1170092….
Crash Reporting
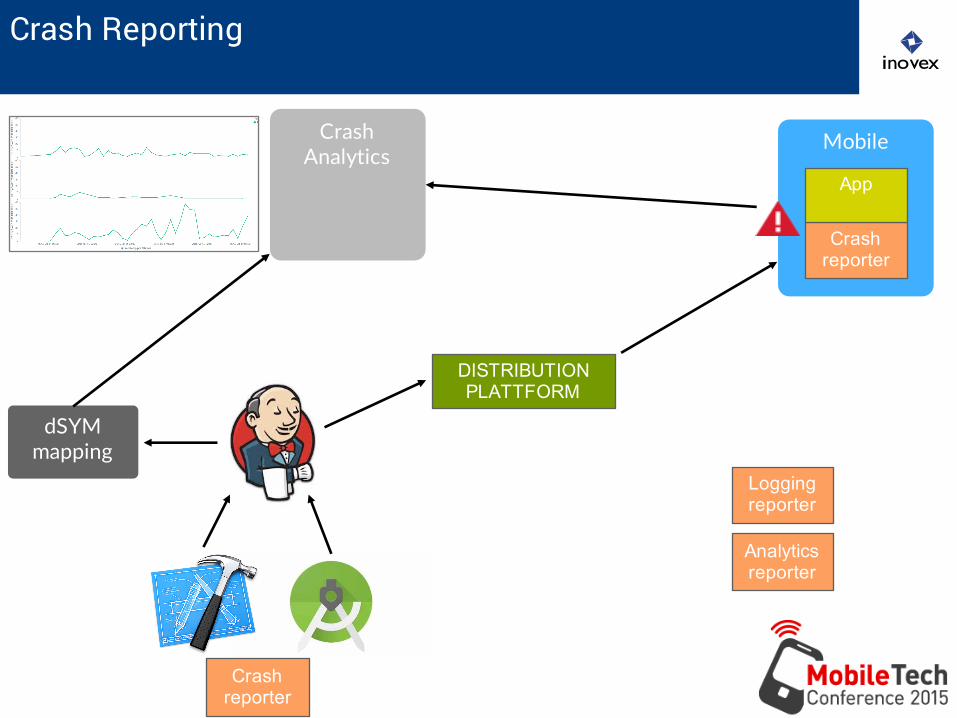
Crashreporter
DISTRIBUTIONPLATTFORM
dSYMmapping
Mobile
Crashreporter
App
Crash Analytics
Loggingreporter
Analyticsreporter
Crash Reporting
• App-Stores
• 3rd Party
• Custom inhouse
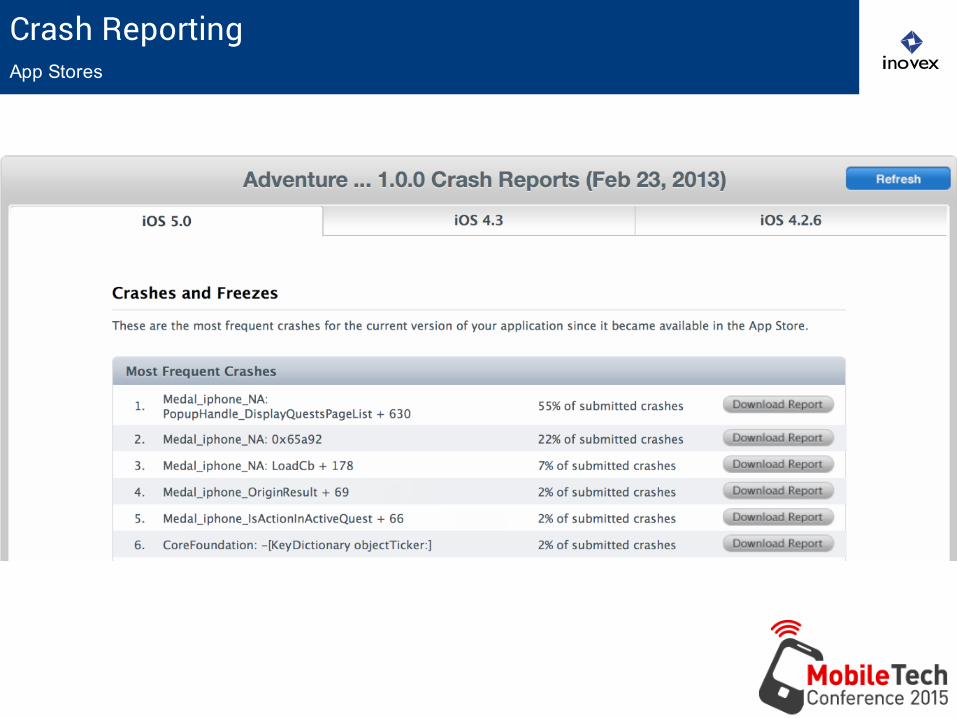
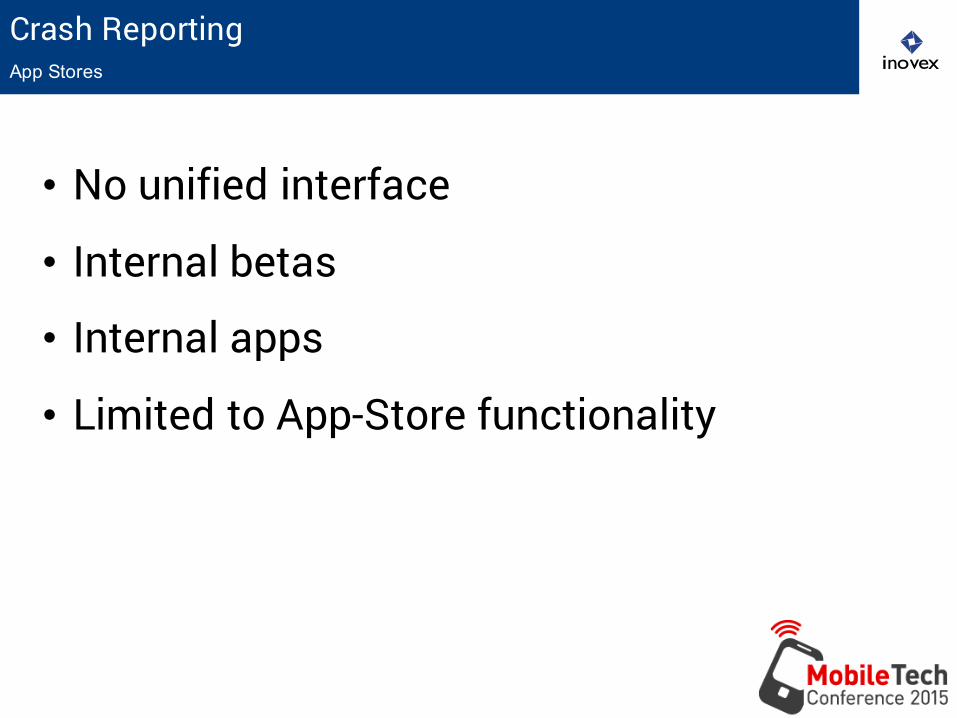
Crash ReportingApp Stores
Crash ReportingApp Stores
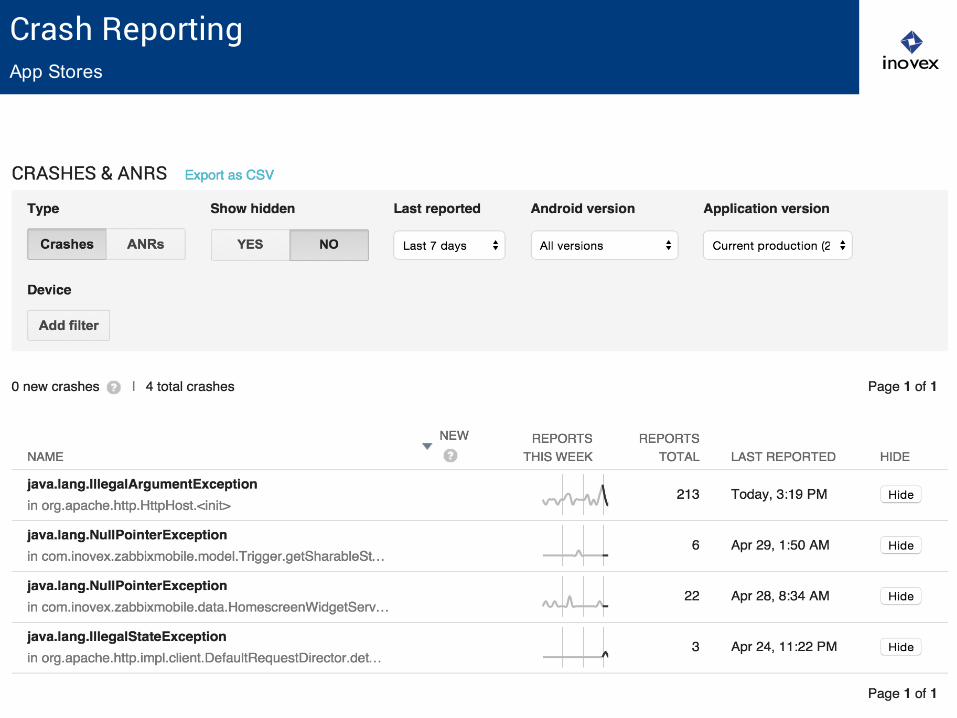
Crash ReportingApp Stores
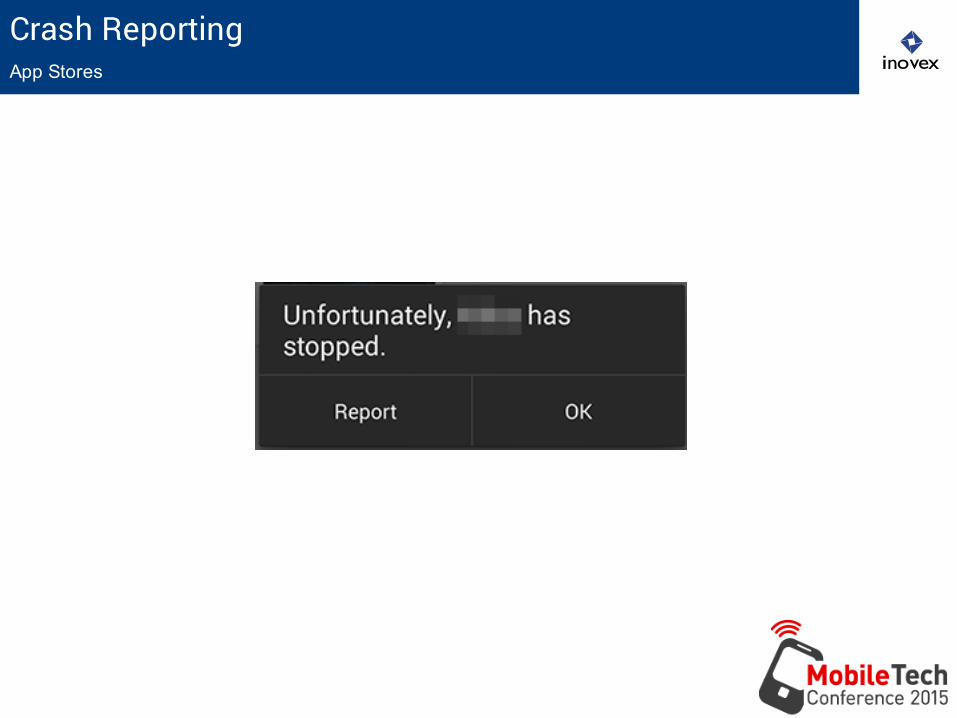
Crash ReportingApp Stores
• No unified interface
• Internal betas
• Internal apps
• Limited to App-Store functionality
Crash Reporting3rd Party Solutions
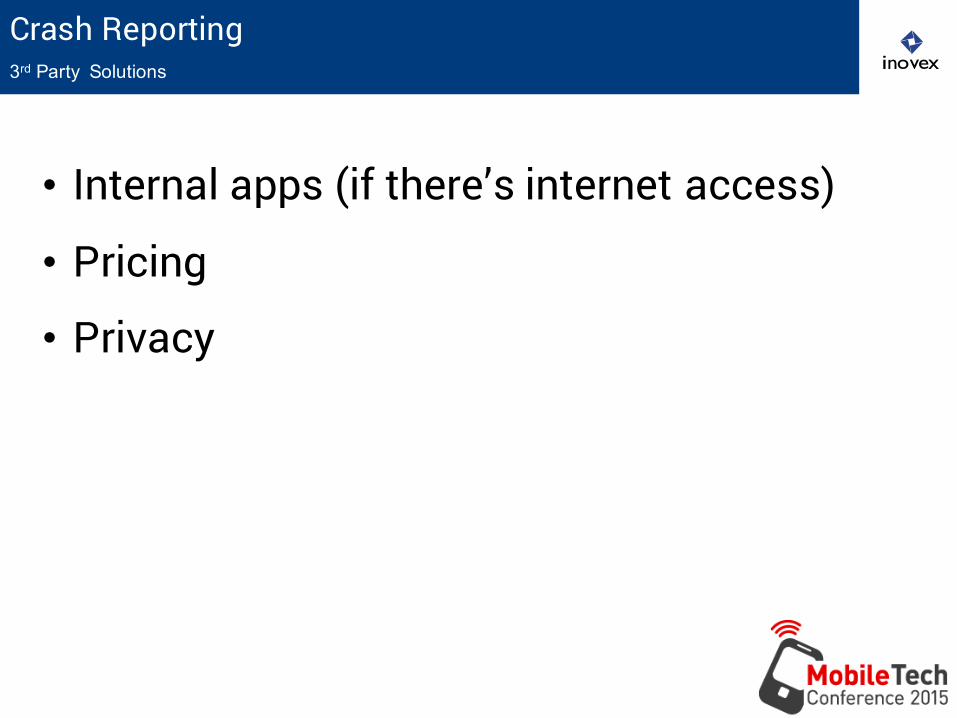
Crash Reporting3rd Party Solutions
• Internal apps (if there’s internet access)
• Pricing
• Privacy
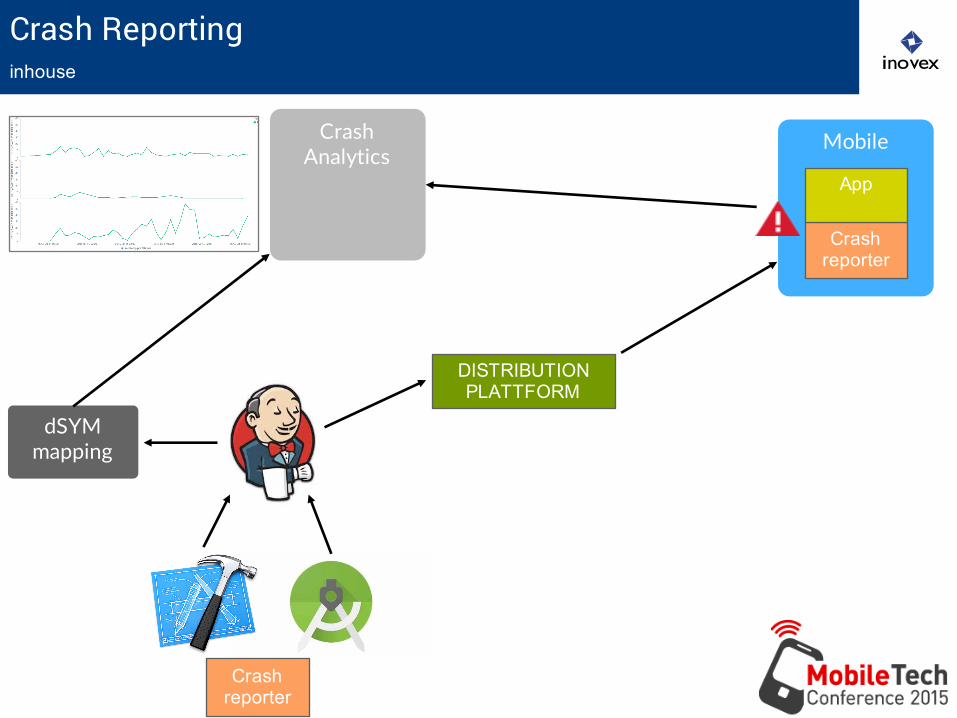
Crash Reportinginhouse
Crashreporter
DISTRIBUTIONPLATTFORM
dSYMmapping
Mobile
Crashreporter
App
Crash Analytics
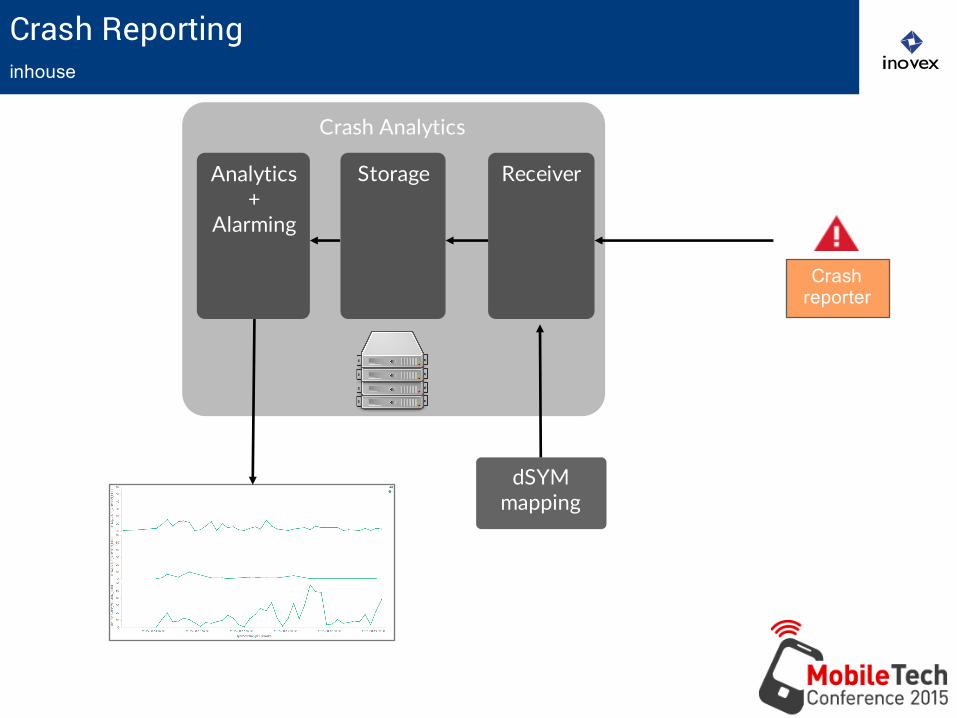
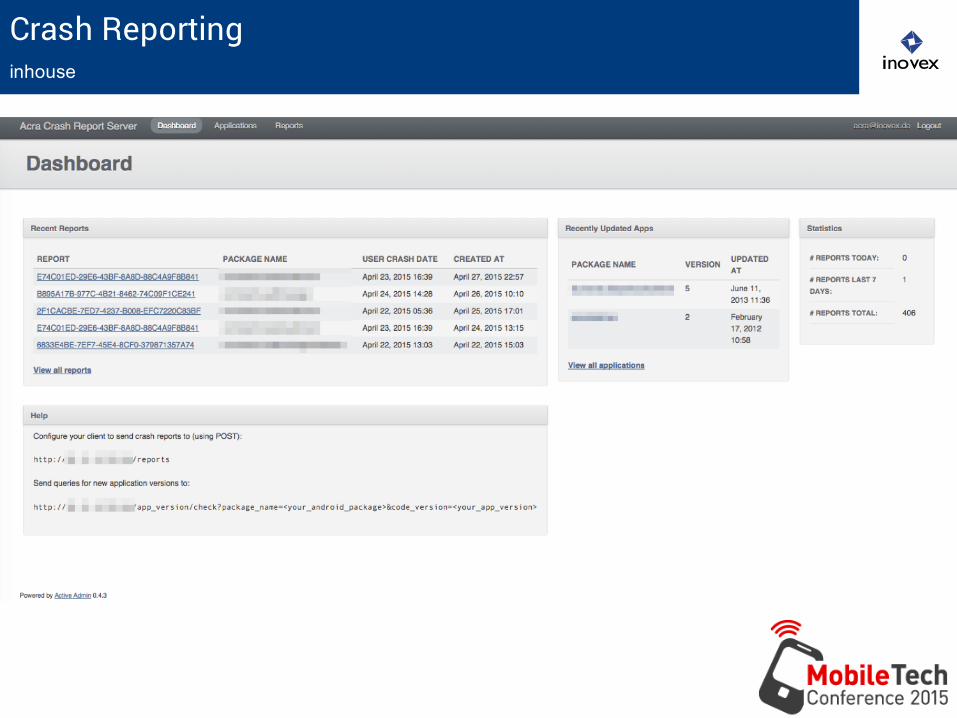
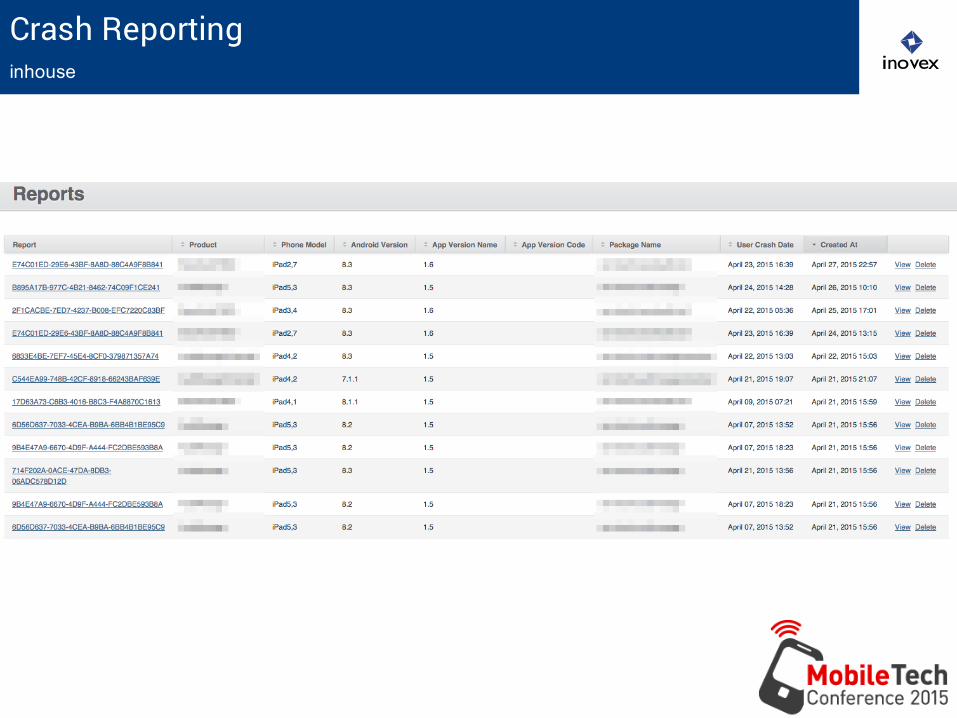
Crash Reportinginhouse
Crashreporter
dSYMmapping
Crash Analytics
ReceiverStorageAnalytics +
Alarming
Crash Reportinginhouse
Crash Reportinginhouse
Crash Reportinginhouse
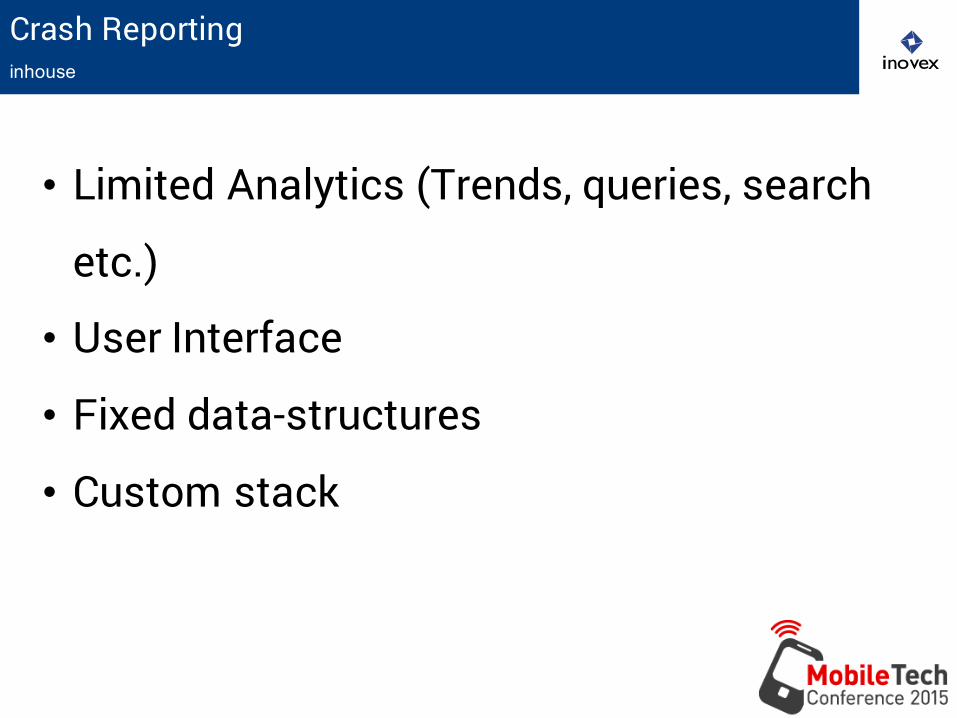
• Limited Analytics (Trends, queries, search
etc.)
• User Interface
• Fixed data-structures
• Custom stack
Crash Reporting – with ELKinhouse 2.0
ELK?
https://pixabay.com/p-145930/
Crash Reporting – with ELKinhouse 2.0
Elasticsearch
Logstash
Kibana
Crash Reporting – with ELKinhouse 2.0
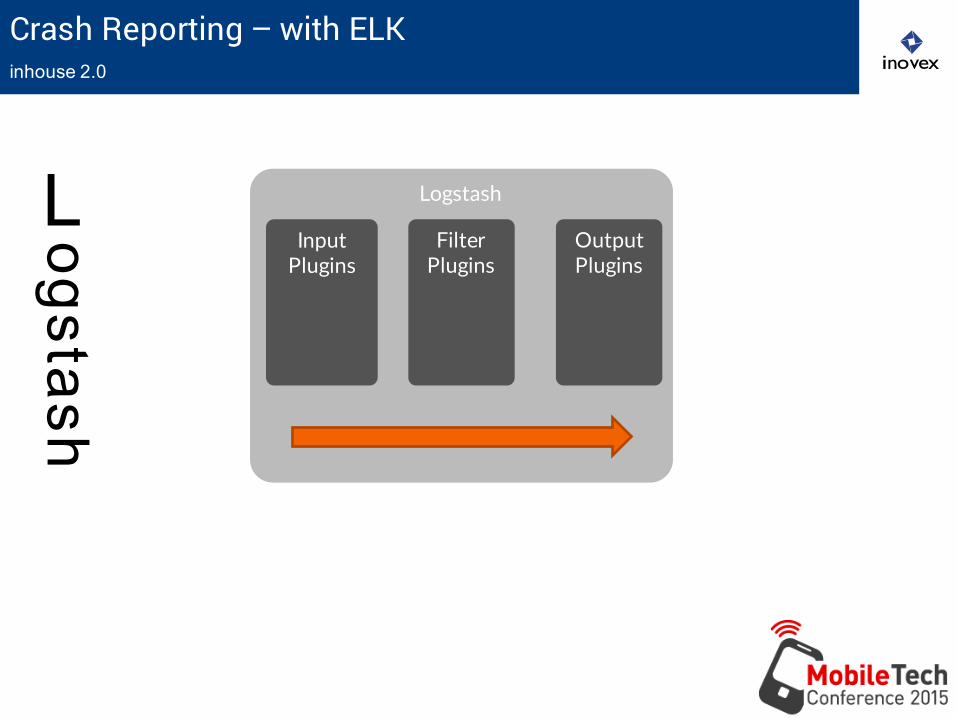
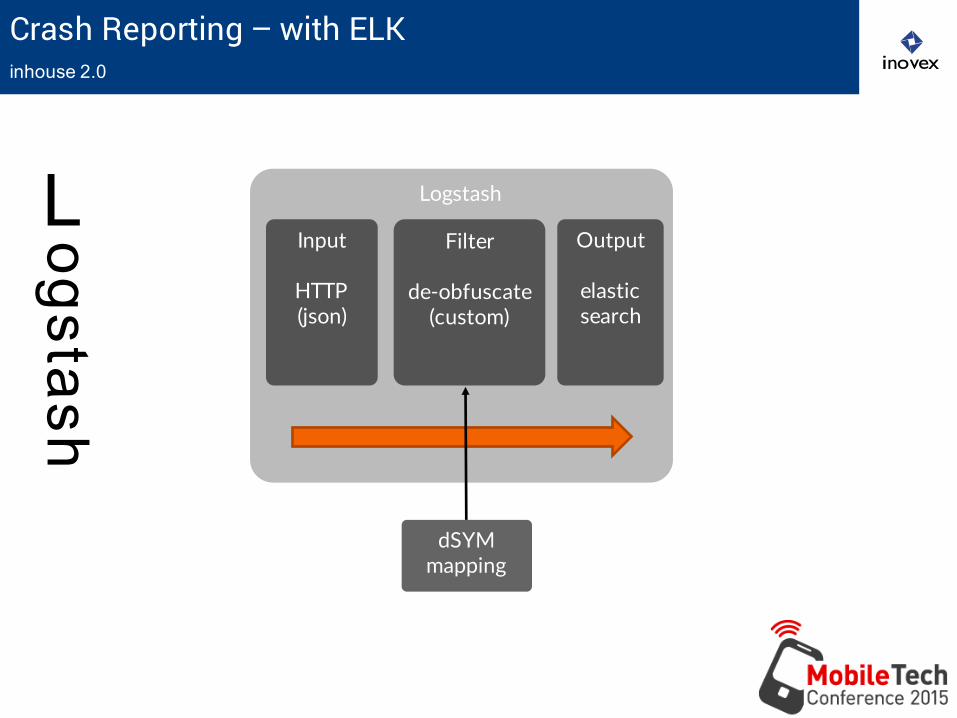
Logstash
Crash Reporting – with ELKinhouse 2.0
Logstash
“Logstash is a data pipeline that helps you process logs and other event data from a variety of systems. With 165 plugins and counting, Logstash can connect to a variety of sources and stream data at scale to a central analytics system.”
https://www.elastic.co/products/logstash
Crash Reporting – with ELKinhouse 2.0
Logstash
Logstash
OutputPlugins
FilterPlugins
InputPlugins
Crash Reporting – with ELKinhouse 2.0
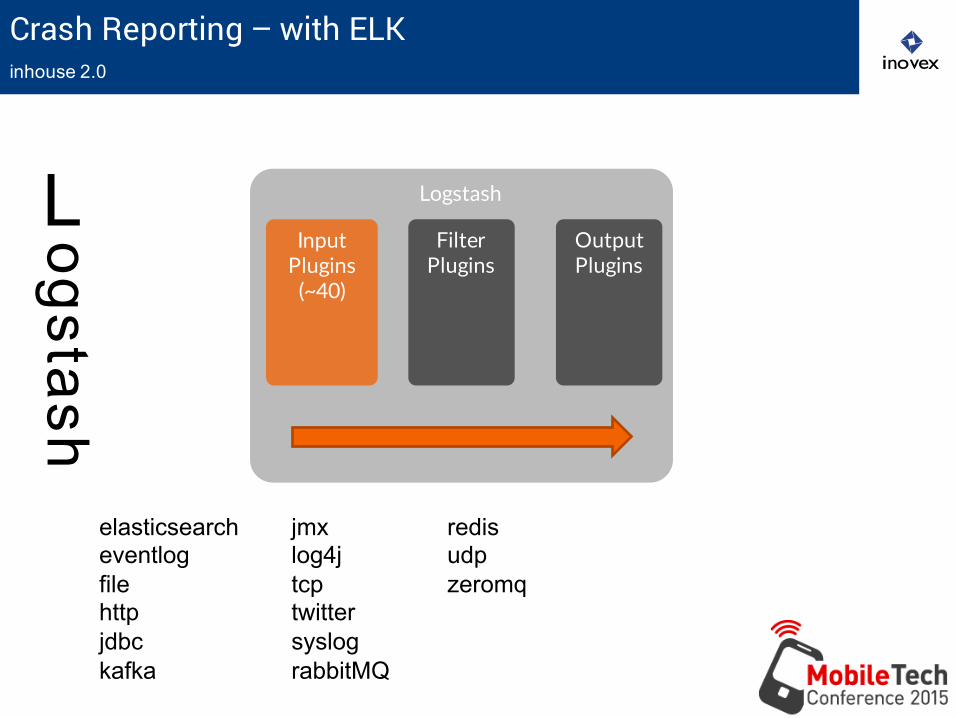
Logstash
Logstash
OutputPlugins
FilterPlugins
InputPlugins(~40)
elasticsearcheventlogfilehttpjdbckafka
jmxlog4jtcptwittersyslograbbitMQ
redisudpzeromq
Crash Reporting – with ELKinhouse 2.0
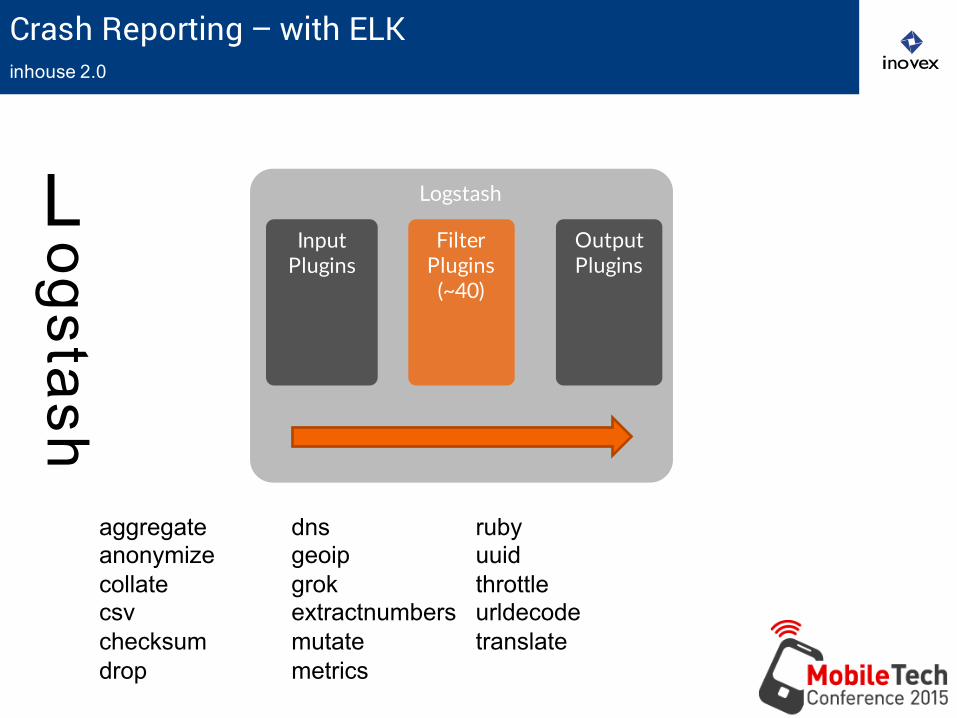
Logstash
Logstash
OutputPlugins
FilterPlugins(~40)
InputPlugins
aggregateanonymizecollatecsvchecksumdrop
dnsgeoipgrokextractnumbersmutatemetrics
rubyuuidthrottleurldecodetranslate
Crash Reporting – with ELKinhouse 2.0
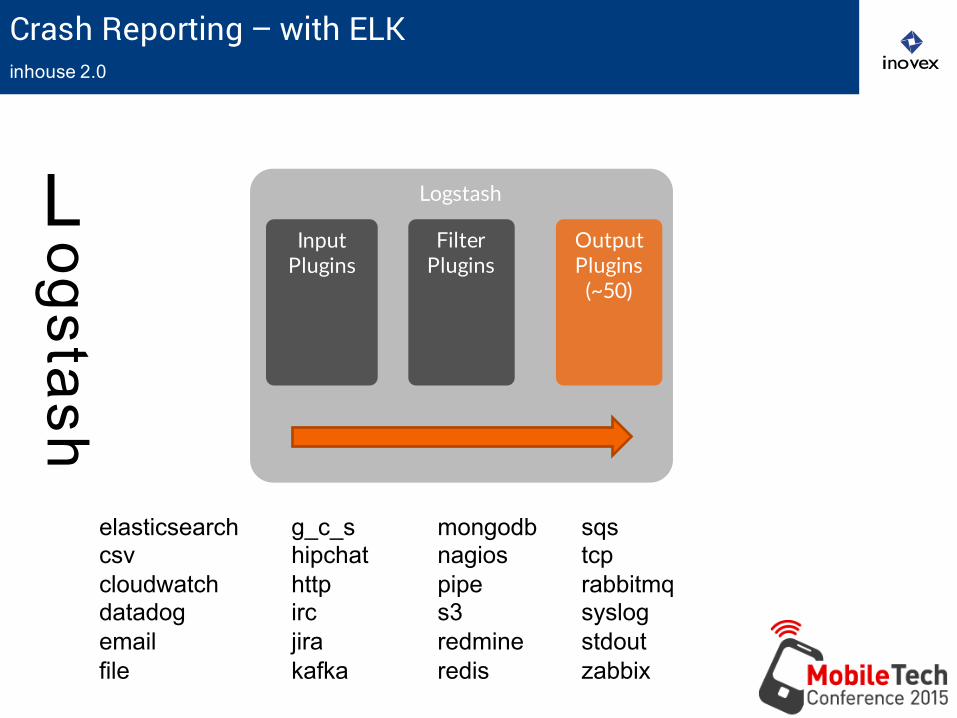
Logstash
Logstash
OutputPlugins(~50)
FilterPlugins
InputPlugins
elasticsearchcsvcloudwatchdatadogemailfile
g_c_shipchathttpircjirakafka
mongodbnagiospipes3redmineredis
sqstcprabbitmqsyslogstdoutzabbix
Crash Reporting – with ELKinhouse 2.0
Logstash
Logstash
Output
elasticsearch
Filter
de-‐obfuscate(custom)
Input
HTTP(json)
dSYMmapping
Crash Reporting – with ELKinhouse 2.0
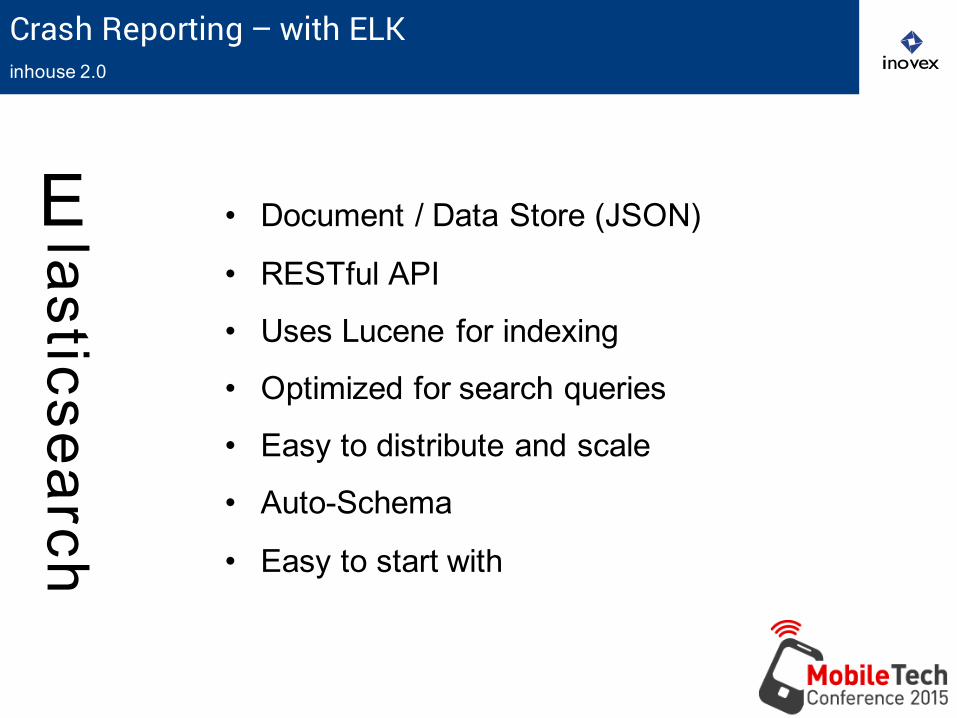
Elasticsearch
• Document / Data Store (JSON)
• RESTful API
• Uses Lucene for indexing
• Optimized for search queries
• Easy to distribute and scale
• Auto-Schema
• Easy to start with
Crash Reporting – with ELKinhouse 2.0
Elasticsearch
Terms:
• Index
• Type
• Document
• Field
• Mapping
Crash Reporting – with ELKinhouse 2.0
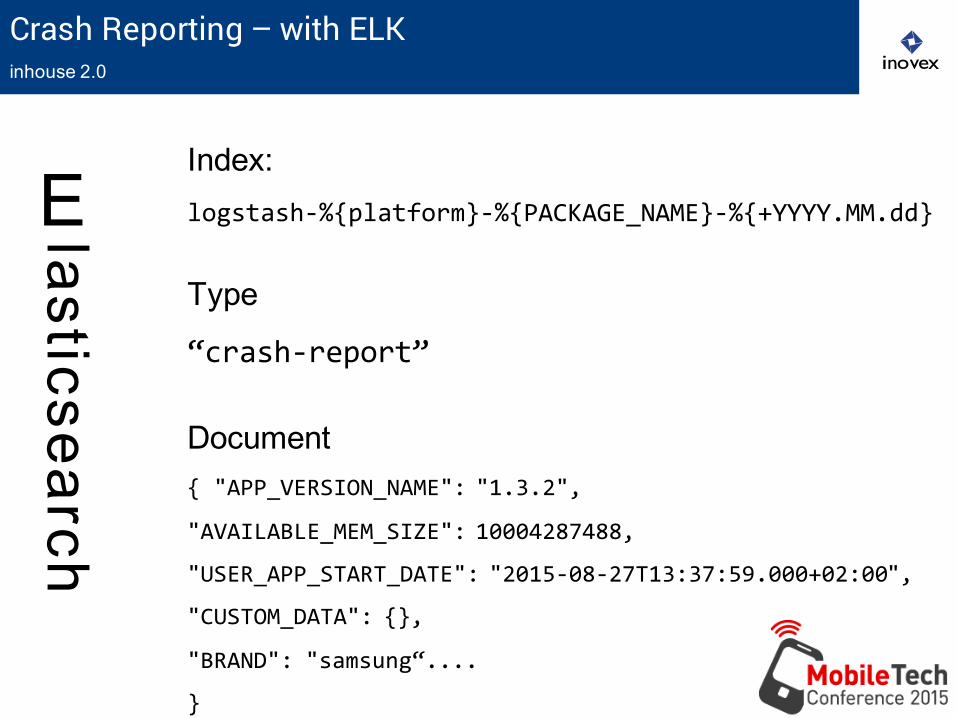
Elasticsearch
Index: logstash-‐%{platform}-‐%{PACKAGE_NAME}-‐%{+YYYY.MM.dd}
Type
“crash-‐report”
Document{ "APP_VERSION_NAME": "1.3.2",
"AVAILABLE_MEM_SIZE": 10004287488,
"USER_APP_START_DATE": "2015-‐08-‐27T13:37:59.000+02:00",
"CUSTOM_DATA": {},
"BRAND": "samsung“....
}
Crash Reporting – with ELKinhouse 2.0
Kibana
Kibana is an open source analytics and visualizationplatform designed to work with Elasticsearch. You use Kibana to search, view, and interact with datastored in Elasticsearch indices.You can easily perform advanced data analysis and visualize your data in a variety of charts, tables, and maps.Kibana makes it easy to understand large volumes of data. Its simple, browser-based interface enables you to quickly create and share dynamic dashboards that display changes to Elasticsearch queries in real time.
https://www.elastic.co/guide/en/kibana/current/introduction.html
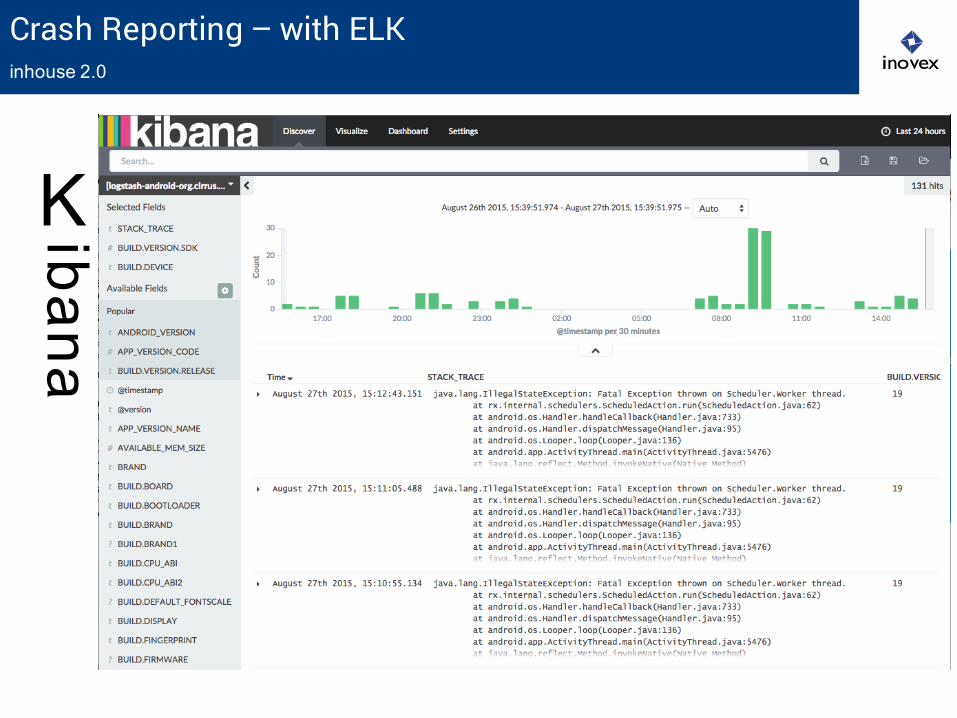
Crash Reporting – with ELKinhouse 2.0
Kibana
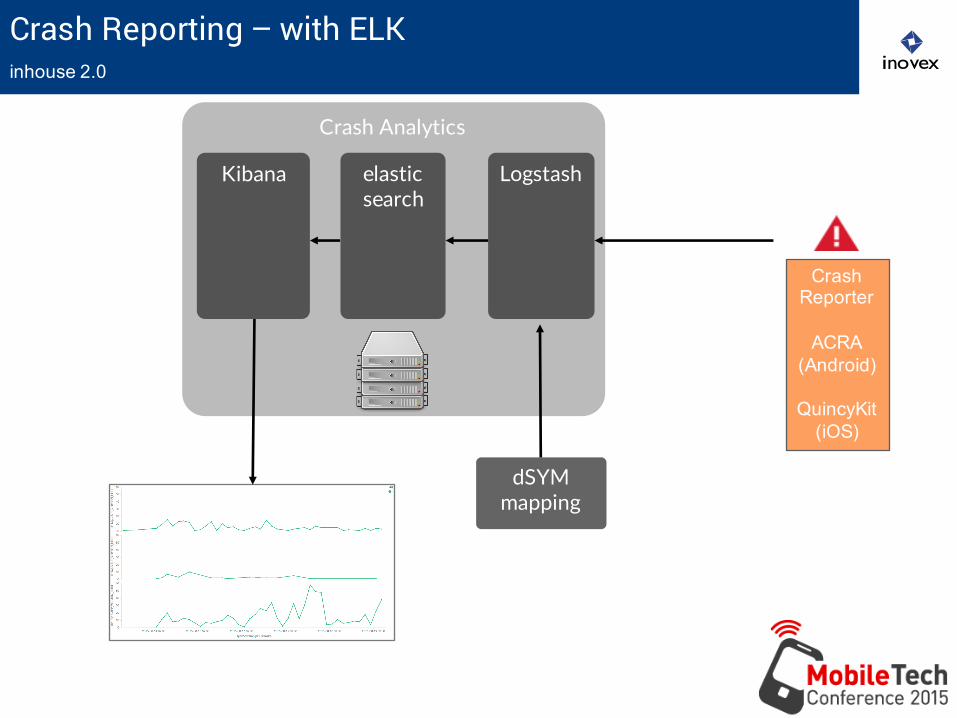
Crash Reporting – with ELKinhouse 2.0
CrashReporter
ACRA (Android)
QuincyKit(iOS)
dSYMmapping
Crash Analytics
Logstashelasticsearch
Kibana
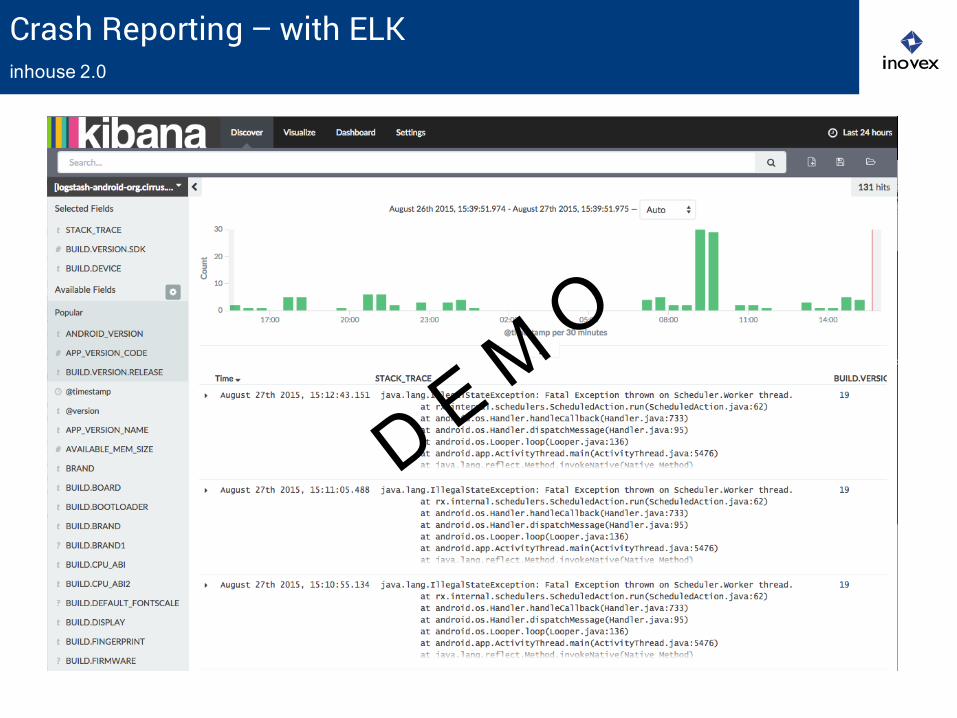
Crash Reporting – with ELKinhouse 2.0
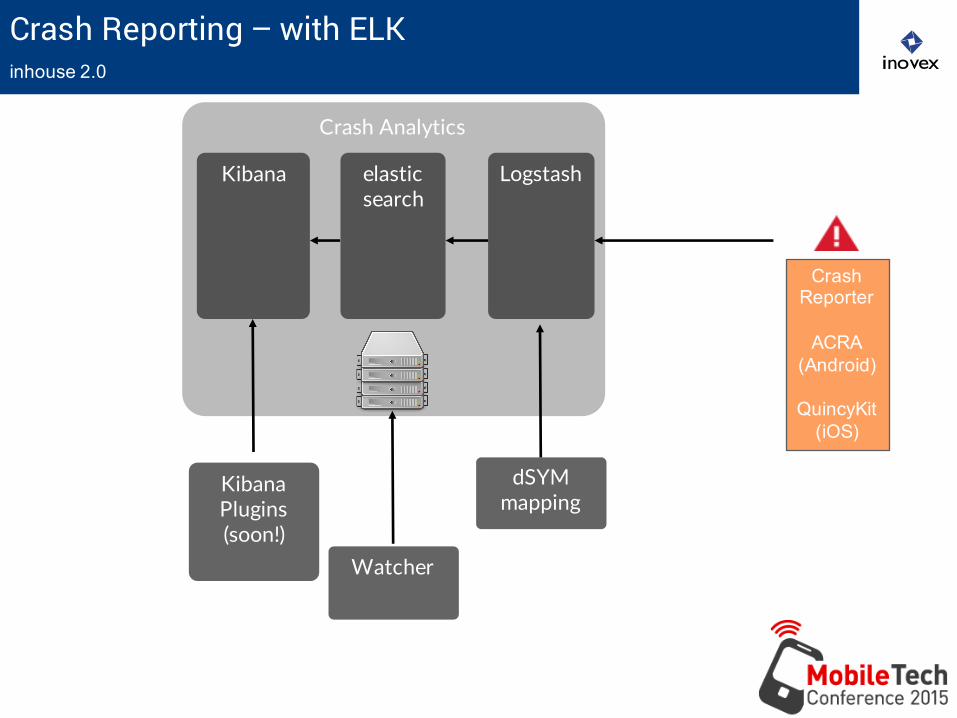
Crash Reporting – with ELKinhouse 2.0
CrashReporter
ACRA (Android)
QuincyKit(iOS)
dSYMmapping
Crash Analytics
Logstashelasticsearch
Kibana
Watcher
KibanaPlugins (soon!)
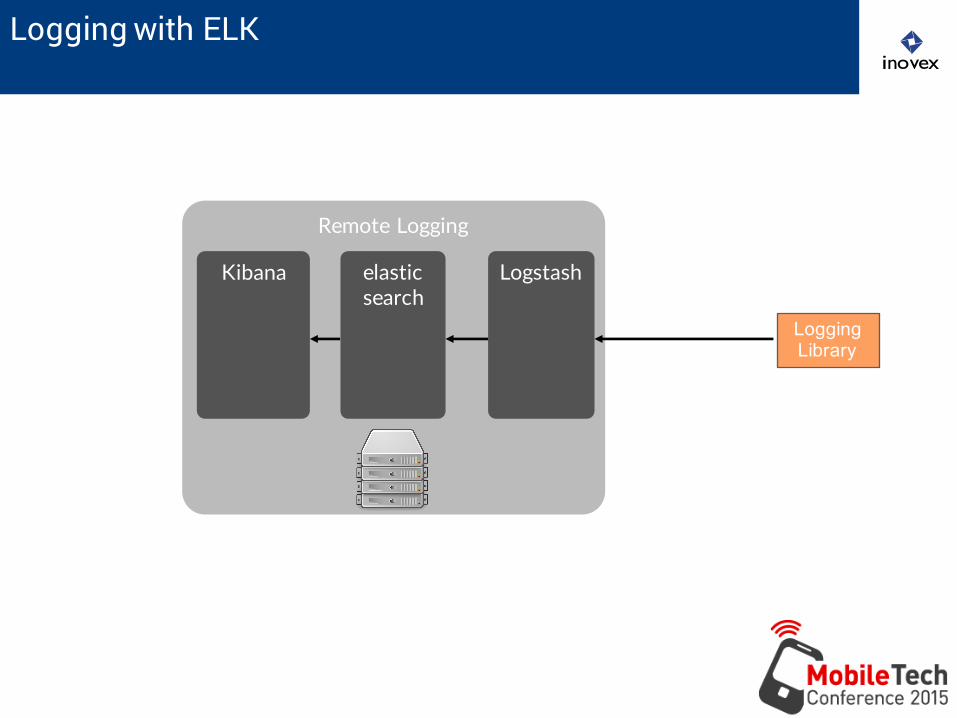
Logging with ELK
LoggingLibrary
Remote Logging
Logstashelasticsearch
Kibana
Analytics
A bit more complicated then crash reporting and
logging…
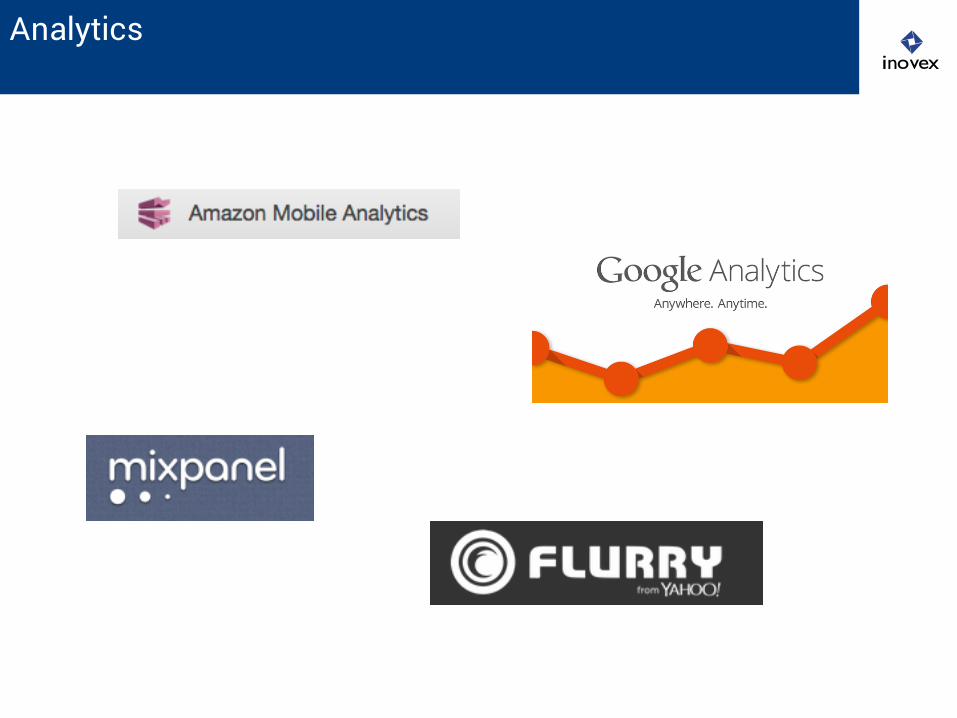
Analytics
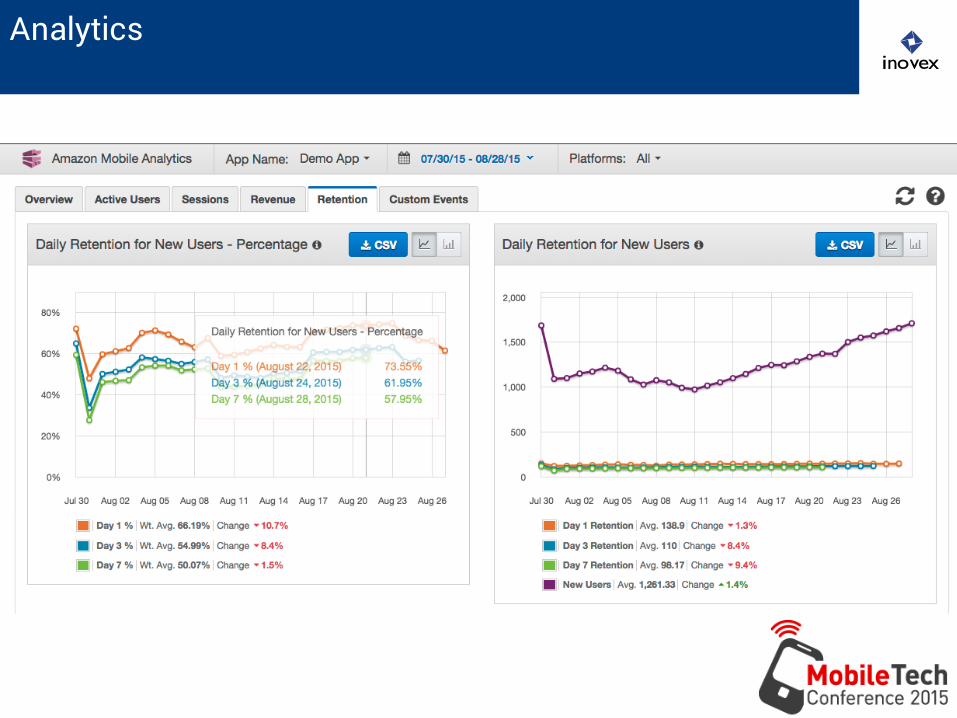
Analytics
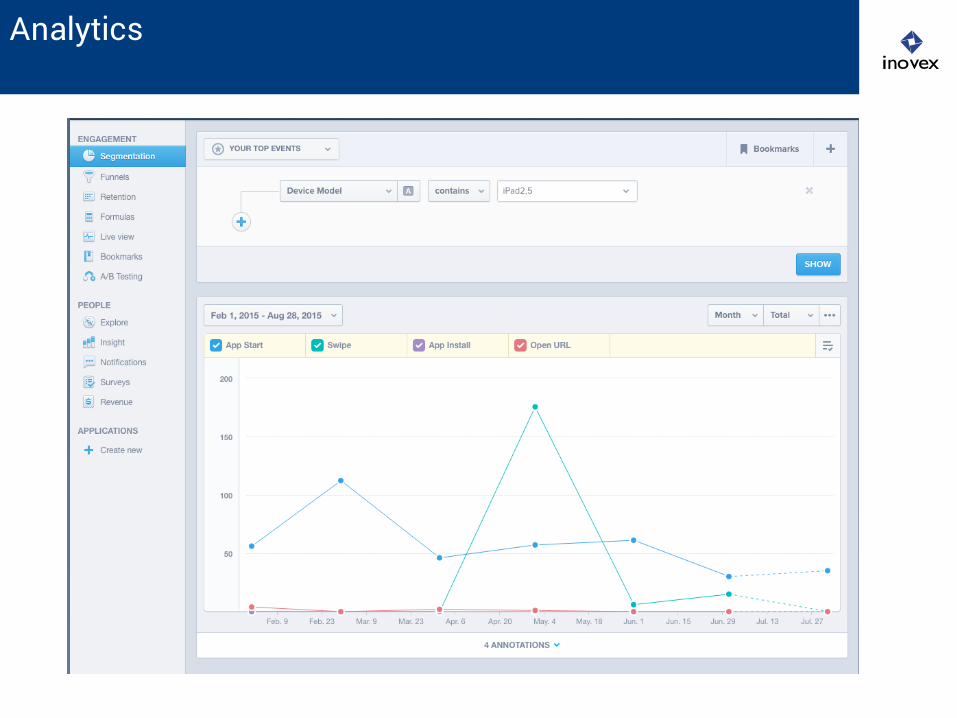
Analytics
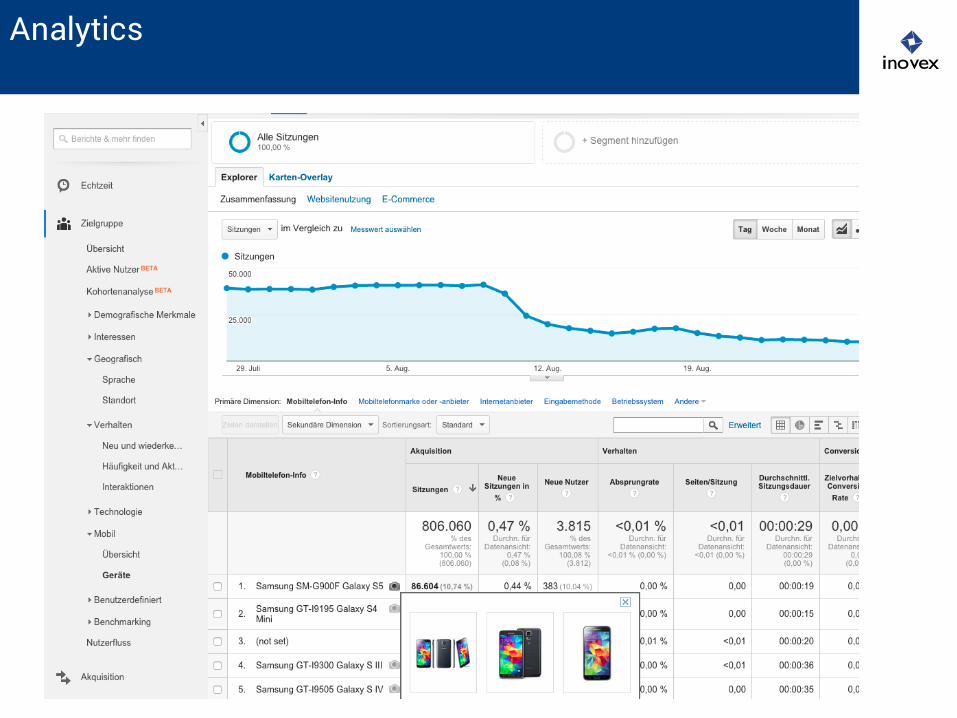
Analytics
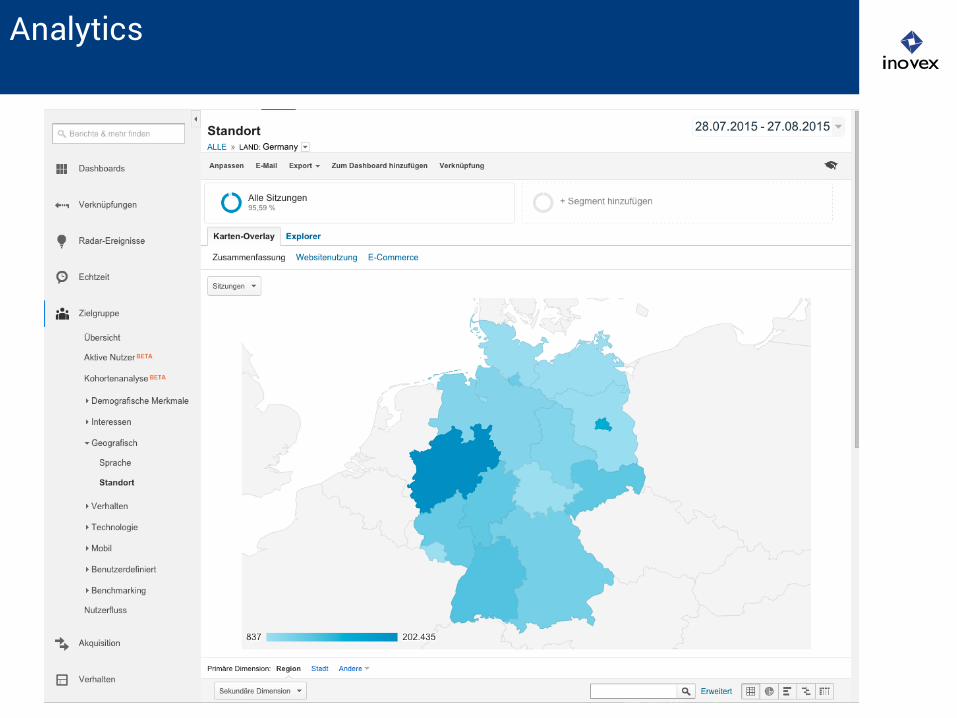
Analytics
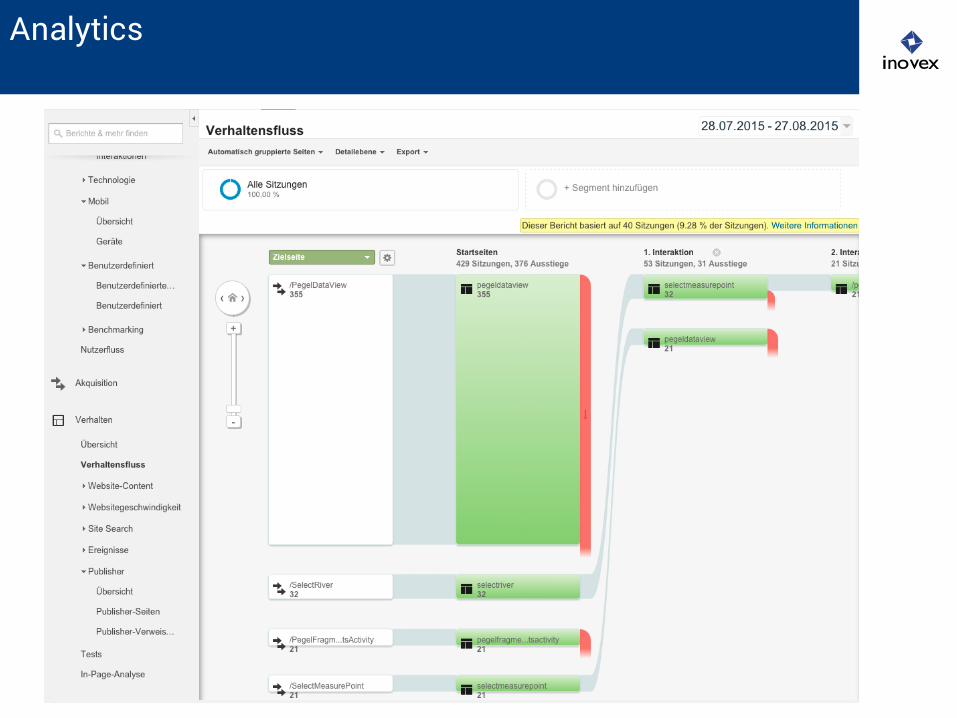
Analytics
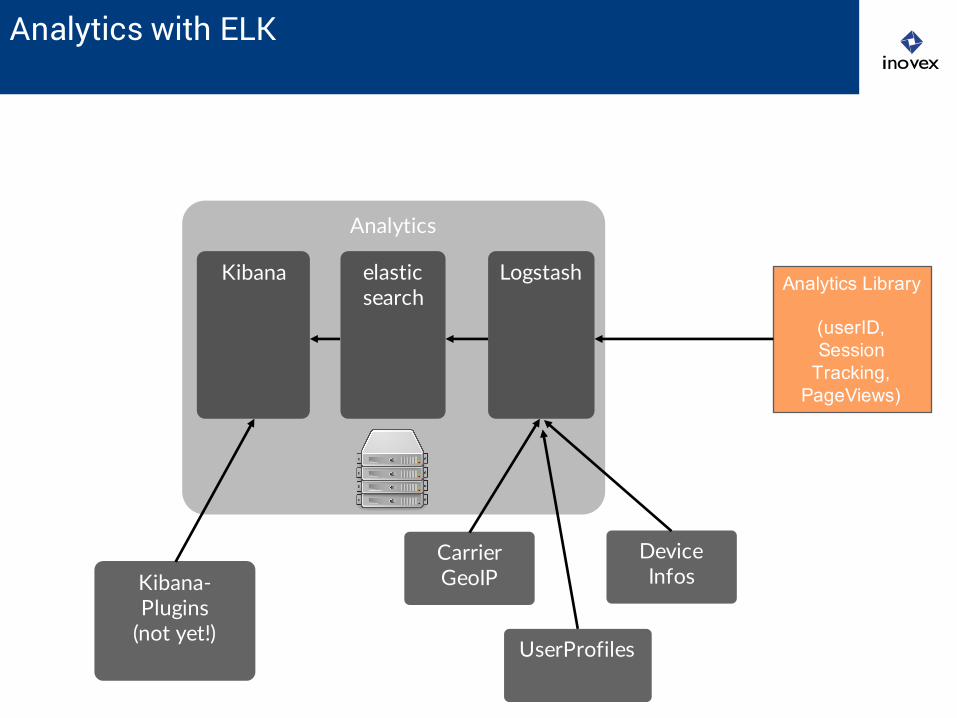
Analytics with ELK
Analytics Library
(userID, Session Tracking, PageViews)
Analytics
Logstashelasticsearch
Kibana
Device Infos
CarrierGeoIP
UserProfiles
Kibana-‐Plugins(not yet!)
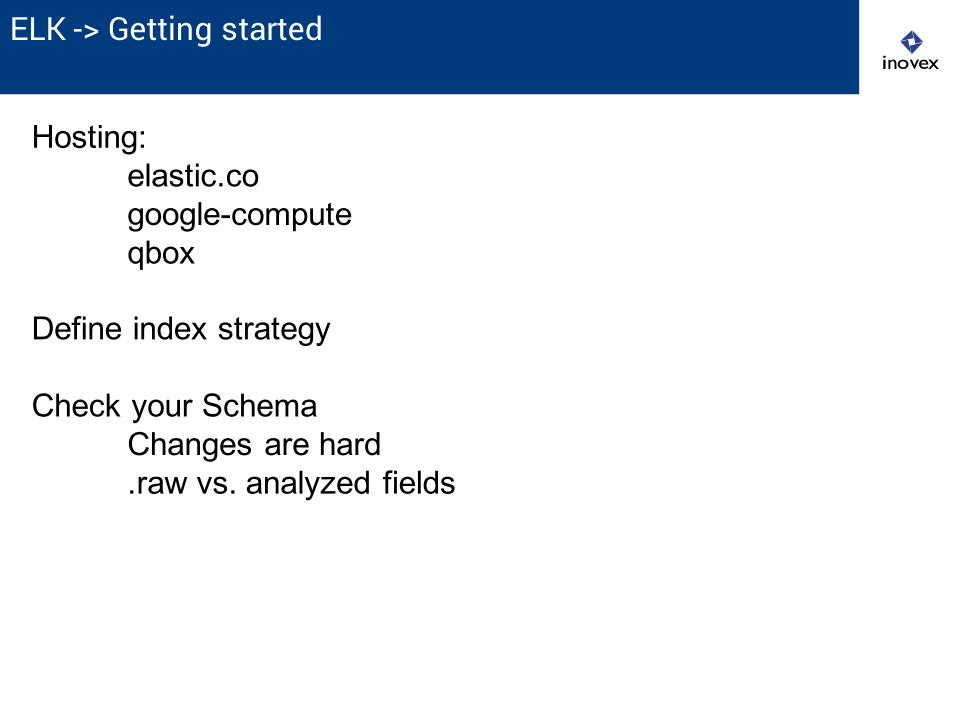
ELK -> Getting started
Hosting:elastic.cogoogle-compute qbox
Define index strategy
Check your SchemaChanges are hard.raw vs. analyzed fields
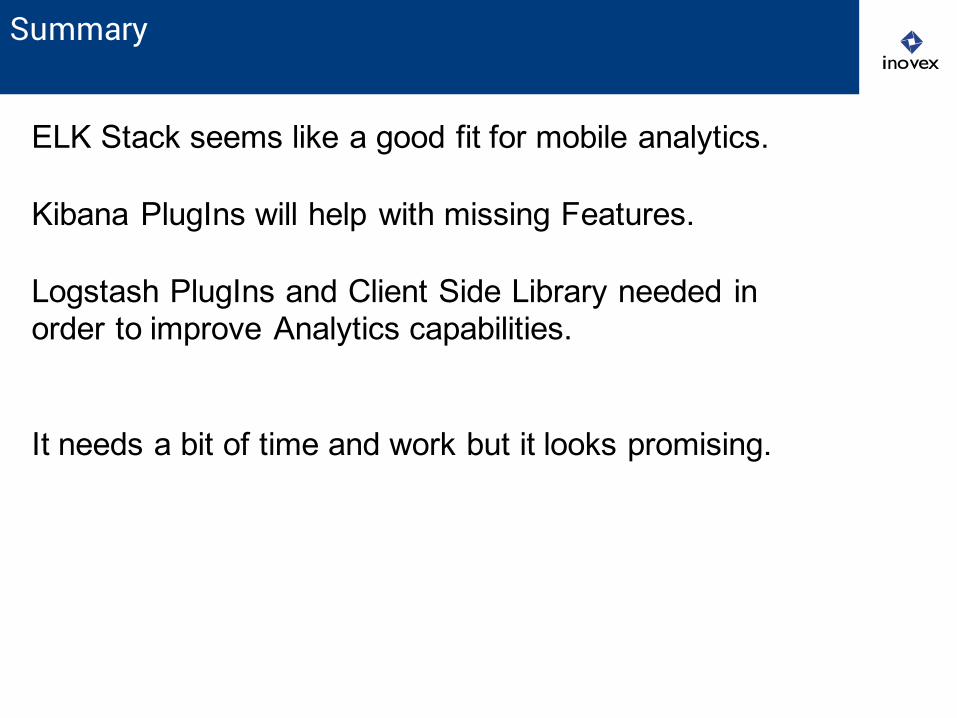
Summary
ELK Stack seems like a good fit for mobile analytics.
Kibana PlugIns will help with missing Features.
Logstash PlugIns and Client Side Library needed in order to improve Analytics capabilities.
It needs a bit of time and work but it looks promising.
Danke!
Danke!