perception of swedish consumers …324103/attachment01.pdfperception of swedish consumers towards...
TRANSCRIPT

PERCEPTION OF SWEDISH CONSUMERS
TOWARDS TAPAL TEA
MUHAMMAD ADNAN (840630)
ZAIGHAM SHABBIR KHAN (821206)
Group # 2498
This Thesis is presented as part of Degree
“MS in International Marketing”
Mälardalen University
June 2010
Mälardalen University, Sweden
School of Sustainable Development of Society and Technology
Tutor: TOBIAS ELTEBRANDT
Examiner: OLE LILJEFORS EFO705 Master Thesis
Västerås VT 2010

ABSTRACT
Date: 01/06/2010
Course: Master Thesis (International Marketing)
Institution: School of Sustainable Development of Society and Technology, Mälardalen
University, Västerås (Sweden)
Authors: Muhammad Adnan Zaigham Shabbir Khan
840630 821206
[email protected] [email protected]
Tutor: Tobias Eltebrandt
Title: Perception of Swedish Consumers Towards Tapal Tea
Research Question: What is the perception of Swedish customers regarding taste of Tapal tea?
Objective: The objective of this research is to study the perception of Swedish Customers
towards the taste of Tapal tea.
Method: This thesis report is based on primary data which is collected through questionnaire in
a way of experiment of tea taste to consumer. We used secondary data from books, articles, and
Internet to support our conceptual model.
Conceptual Framework: The conceptual framework consists of different consumer behavior
models to examine the following elements:
Consumer Attitude
o Taste
o Perception
Product Price and Packaging
Culture
Demographics
Segmentation
Conclusion: On the basis of findings we came to the conclusion that most of the Swedish
customers like flavored tea as compared to grey & green tea. On the other hand they also prefer
tea taste over price & brand. This shows that Swedish market has potential for products with
good taste. So the good thing about the Tapal is that the majority of the customer responded that
the taste of tapal tea is good and excellent respectively. Mostly, customers think that the taste of
Tapal tea is better than others.
Keywords: Sweden, Tapal Tea, Consumer Behavior, Perception, Demographics.
ACKNOWLEDGEMENTS
All praises for almighty Allah to let us accomplish this thesis work.
This thesis work enables us to perceive consumer behavior from experimental perspective which
allows us to examine in closer to the reality of consumer behaviors. We would like to gratify
particularly the Faculty of HST Department of Mälardalen University, Sweden, who has always
been a source of knowledge and motivation.
Especially we would like to convey a sincere gratitude to our tutor Tobias Eltebrandt for his
knowledge, advices and assistance in writing this research study.
We would also like to thanks our parents for wonderful appreciation and motivation for the
entire period of this degree. We would also like to thanks all the respondents, who answered our
questionnaire.
Finally, we would like to thanks our classmates for their comprehension, recommendations and
criticism in writing this thesis work.

Table of Contents Pages
1. Introduction ............................................................................................................................. 1
1.1 Introduction of the Topic: ........................................................................................................ 1
1.2 Tapal Tea Background: ........................................................................................................... 2
1.3 Problem Statement:.................................................................................................................. 2
1.4 Target Audience: ..................................................................................................................... 3
1.5 Objective of the Study: ............................................................................................................ 3
2. Literature Review .................................................................................................................... 4
2.1 Consumer Behavior: ................................................................................................................ 4
2.2 Consumer Perception:.............................................................................................................. 5
2.2.1 Perceived Quality: ............................................................................................................ 5
2.3 Consumer Attitude and Taste: ................................................................................................. 5
2.4 Shepherd Model:...................................................................................................................... 6
2.5 Lens Model: ............................................................................................................................. 7
2.6 A Model of Consumer Behavior with respect to Foods: ......................................................... 8
2.7 Conceptual Framework: .......................................................................................................... 9
3. Research Methodology .......................................................................................................... 11
3.1 Preconceptions: ...................................................................................................................... 11
3.2 Scientific Approach: .............................................................................................................. 12
3.3 Choice of Method: ................................................................................................................. 12
3.4 Research Design: ................................................................................................................... 13
3.5 Secondary Data Sources: ....................................................................................................... 13
3.6 Formulation of Questionnaire:............................................................................................... 14
Questions: Variable (Consumers’ Attitude).................................................................................. 14
Questions: Variable (Product Price & Packing) ........................................................................... 14
Questions: Variable (Person Related Factors) .............................................................................. 15
Question: Variable (Environmental Factor) .................................................................................. 15
3.7 Limitations: ............................................................................................................................ 15
4. Presentation of Data ............................................................................................................... 16
4.1 Questionnaire Results: ........................................................................................................... 16
4.1.1 Gender: ........................................................................................................................... 16
4.1.2 Age Group: ..................................................................................................................... 17

4.1.3 What is your Occupation? .............................................................................................. 17
4.1.4 Do you live in Sweden permanently? ............................................................................ 18
4.1.5 How Often Do You Drink Tea? ..................................................................................... 19
4.1.6 Which Tea Do You Like The Most? .............................................................................. 19
4.1.7 Factor Affect More While Purchasing Tea? .................................................................. 20
4.1.8 Preferred Packing? ......................................................................................................... 21
4.1.9 Number of Households Drinks Tea? .............................................................................. 21
4.1.10 Taste of Tapal Tea? ........................................................................................................ 22
4.1.11 How Much You Spend on Tea Every Month? ............................................................... 23
4.1.12 Taste of Tapal Tea better than Other Tea? ..................................................................... 23
4.1.13 Price Is Important factor While Purchasing Tea? .......................................................... 24
5. Analysis of Findings .............................................................................................................. 25
5.1 Relationship between empirical data and gender: ................................................................. 25
5.2 Relationship between empirical data and age group: ............................................................ 26
5.3 Relationship between empirical data and living Status: ........................................................ 27
6. Conclusion ............................................................................................................................. 29
6.1 Taste & Sensory attributes ..................................................................................................... 29
6.2 Product, price & packaging ................................................................................................... 29
6.3 Culture ................................................................................................................................... 29
6.4 Recommendations ................................................................................................................. 31
7. References ............................................................................................................................. 32
Appendix A: Questionnaire .......................................................................................................... 35

LIST OF FIGURES AND TABLES
Figure 1: Some factors affecting food choice and intake (Shepherd, 1985)………………..7
Figure 2: Lens Model (Hauser, 1993)……………………………………………………....7
Figure 3: Conceptual Model of Consumer Behavior……………………………………….8
Figure 4: Conceptual Model………………………………………………………………...9
Table I: Gender……………………………………………………………………….........16
Table II: Age Group………………………………………………………………………..17
Table III: Occupation………………………………………………………………………17
Table IV: Living status in sweden………………………………………………………....18
Table V: Drinking tea..........................................................................................................19
Table VI: Liking tea………………………………………………………………………..19
Table VII: Factor affect for purchasing tea………………………………………………..20
Table VIII: Preferred packing……………………………………………………………..21
Table IX: Household drink tea…………………………………………………………….21
Table X: Taste of Tapal tea………………………………………………………………..22
Table XI: Spending on tea…………………………………………………………………23
Table XII: Which Tea is better…………………………………………………………….23
Table XIII: Price…………………………………………………………………………..24
Table A…………………………………………………………………………………….25
Table B…………………………………………………………………………………….26
Table C…………………………………………………………………………………….26
Table D…………………………………………………………………………………….27
Table E……………………………………………………………………………………..27
Table F……………………………………………………………………………………..28

1
1. Introduction
This chapter describes the introduction to the study and provides the background knowledge for
the research work. This introduction is follows by strategic and research question to the
problem. The chapter ends with the purpose of the study.
1.1 Introduction of the Topic
This study is about “perception of Swedish consumers towards Tapal tea”. Tapal is locally
owned Tea Company in Pakistan. Tapal is also working internationally and is the first national
tea company to export tea to Saudi Arabia, Oman, Spain, Italy, Greece, U.A.E, Canada and
U.S.A (Tapal Tea, n.d.). They already have the existence in Europe so that is why we have
selected Swedish market. According to General Manager of Tapal Mr. Thara, company is
targeting many other markets in America and Europe (Syed M.A., 2000).
In early ages, more than 5000 years ago, people became delighted with tea in China. According
to the legend emperor of China Shen Nung “a scientist and arts patron - dictated that all
drinking water be boiled as a hygienic precaution. One summer day while visiting a distant
province, his servants began boiling the water. Dried leaves from a nearby bush fell into the pot,
and a brown liquid was infused. As a scientist, Shen Nung was intrigued. He drank some of the
strange liquid and found it refreshing. Legend says the drinking of tea was therefore born”. This
fairy tale narration described practically, most of the mythologists think that this may be nearly
narrated to the actual happenings but now disappear in old-ages history. After the legend Shen
Nung, the tea history is packed with exploration, innovation, practice and deep contentment. The
tea consumption is stuffed from the east to the “coffee houses of Shakespeare’s day and from the
Imperial Russian court to America’s Boston Tea Party”. (Stash Tea Company, 2009)
At present, the utilization of tea has become equally important as compared to the utilization of
drinking water. Worldwide, there is estimation that an average 2.5million metric ton of tea is
produced every year. The tea producing countries preserved some of the tea for their internal
usage, rest they trade directly to the resellers across the border/countries or purchased through
open market auctions. They consumed mainly from internal production. (Teaconnexions, 2009)
The worldwide tea market is controlled by four major exporters of tea, namely India, Srilanka
China and Kenya. There are other four leading tea importers as well, namely UK, USA, Pakistan
and Egypt. Pakistan is mostly importing tea from Indonesia, Bangladesh and Kenya with the
variations of type of tea supplied to Pakistan for example grey tea or green tea. However, Kenya
and Vietnam are the main exporters of Black and Green Tea so, importers can categorized their
import based on the availability. (Scribd, 2008, p. 2)
2
Pakistan’s hot drinks industry is firmly established. Pakistan is one of the world’s highest tea
consumers. Unilever is one of the main multinational players in the market. According to recent
surveys tea industry will not slow down soon. Tea value sales are expected to increase 29.80%
and reach PKR (Pakistani Rupees) 67.69 billion between 2009 and 2014. Unilever plays second
fiddle to the market leader, Tapal Tea with an annual turnover estimated at about US$100
million. The coffee segment will remain peripheral. Despite promising forecast value sales
growth of 20.94% to PKR 410 million to 2014 .The tea segment is expected to be about 165
times greater than that of the coffee segment by that time. (Pakistan Food and Drink Report Q2,
2010)
In Sweden the market share of tea bags is about 50% by volume. The tea bags' share of the
market has been growing slowly over the past several years. There are four large importers with
over 80% of the market share who dominates the Swedish market. Three big international brands
are the market leaders in the Swedish market. They are imported by three importers/wholesalers
and come packed in retail packs. Two of the international brands still pack some tea in Sweden,
but most of the branded teas are packed in Belgium, England, Germany or Denmark. These
importers of tea are selling most of their products through 3 large central organizations of
retail/wholesale in Sweden, Coop Sverige, ICA Handlarna AB and Axfood AB. (Tea Market in
Sweden, n.d.)
1.2 Tapal Tea Background
Tapal is 100% locally owned tea company in Pakistan. It is the largest tea company in Pakistan.
It has modern tea blending and packaging factories. Their warehouses are equipped with latest
machinery. It has team of highly dedicated and dynamic professionals. The journey of Tapal
started back in 1947 from its retail Outlet in Jodia Bazaar, Karachi under the supervision of its
founder Adam Ali Tapal. (Tapal Tea, n.d.)
Tapal is the leading brand in tea industry and is known because of its quality and taste and thus
has left behind many competitors in the tea industry. Lipton is the leading international
competitor of Tapal apart from some of the local competitors Isphani, Tetley and Brooke bond.
There are different brands of Tapal like Danedar, family mixture, Safari chai, Mezban premier
dust, Chenak dust, special tea Bags, jasmine Green tea, and Gulbahar green tea. They had also
introduced Ice Tea in Pakistan in 2007 which is a very popular product in the foreign market.
(Tapal Tea, n.d.)
1.3 Problem Statement
This part of the report discusses the strategic and research question for this study.
3
Strategic Question
Would Tapal tea enter Swedish market based on the perception of Swedish customers or
is it not advisable for Tapal to enter Swedish market?
Research Question
What is the perception of Swedish customers regarding taste of Tapal tea?
1.4 Target Audience
For our research we are mainly focusing the tea drinkers in the Swedish market. Swedish people
are not great tea drinkers. There is no real tea tradition in Sweden. Most of the people in Sweden
drink tea occasionally, usually as an alternative to coffee. (Tea Market in Sweden, n.d.)
Scandinavians are known as the coffee friends and they are the world´s biggest coffee drinkers
(foodnavigator, 2003). They are not very fond of drinking tea.
We mainly targeted the tea drinkers in the Swedish market. First they tried the Tapal tea and then
we asked them to fill the questionnaires.
1.5 Objective of the Study
The objective of this research is to study the perception of Swedish Customers towards the taste
of Tapal tea. On the basis of our finding about the Swedish customers´ perception we have given
the suggestions to the company if it is feasible for them to enter in Swedish market.

4
2. Literature Review
In this chapter the appropriate theories for the research question will be described. The chapter
begins with the definitions of keywords, then continues with the description of consumer
behavior, consumer perception, and consumer’s models and ends up with the conceptual
framework.
2.1 Consumer Behavior
Consumer behavior is the learning of the process implication when singles’ or cluster choose,
buy, or use the products, services, or experiences to persuade wants and needs (Solomon, M.,
2006).
Consumer behavior is a process that creates different phases and there are two players in this
process: consumer and marketer. The consumer rectifies the demand or desire, then creates a
purchase and finally arranges the product between three phases during consumption process. The
three different phases are: purchase, pre-purchase and post-purchase issues (Solomon, M., p. 7,
2006).
Pre-purchase: In pre purchase issue the consumer perspective is to look for the
good sources of information then study the best alternatives of selected product.
On the other hand marketers look for the consumer attitude towards their product.
Purchase: In purchase issue marketers observe the feedback of the consumers
through factors like time pressure or store display. In this way they can observe
either consumers react in stress or pleasant manner and what they state about
purchase.
Post-purchase: In the third and final phase, marketers would like to find rather this
product fulfilled the need or demand of the consumer and will they do the
purchase again.
When marketers identify this consumer behaviors on purchase then perhaps they may fulfill the
consumer’s needs better.
We have to consider this in our study that consumer behavior is generally not the same and each
consumer has a different buying behavior. We used segmentation in order to recognize the
different groups with different features according to the wants or desires (Solomon, M., p. 10-11,
2006).
In our study of Tapal tea in Sweden most likely we use segmentation. The main purpose of
segmentation is to identify the homogenous groups of customers with same attributes. In this
way there will be an easy identification of demographics variables that show consumers different
or similar to others. One of the essential attribute of consumer behavior is age, basically needs
and desires would be different for each consumer depends on their age groups. Gender also plays
a different vital role in usage of products depending on their gender for example fragrance to
5
undergarments. Family structure (single or married people) is important demographic variable
for example car selection either sports or normal depending on the structure of family. Income
and social class for example several of these groups have same behavior with same income and
social reputation. The geography has its own importance as local companies offer their products
internationally somehow some of the companies deal equally to all consumers though Danish
consumers do not have the same behavior as Somalians.
In order to deal with geographical level we are going to take concretely people who live in
Malmö. We are going to use demographic variables such as age, gender, and family structure to
obtain homogeneous groups that allow us to differentiate groups in the tea sector.
2.2 Consumer Perception
Perception is defined as “the process by which people select, organize and interpret information
to form a meaningful picture of the world” (Kotler and Armstrong, p. 186, 2001).
The perceived value, risk or quality is the feature of a brand through which consumer can be
influenced towards specific brand. The brand can be attractive by using a design as competitive
advantage in corresponding to the market and declare value in the product (Baldauf, A. et al.,
2003). According to Ulrich likings in a brand and its usage benefits are important for a consumer
to select the brand. It can also be associated to a lifestyle and therefore awareness about this
could be utilized (Ulrich R., et al. 2004).
2.2.1 Perceived Quality
The consumer evaluations of product value partially draw from the perception of product quality,
meanwhile from price, product image and brand perceptions as well. (Snoj, et al., 2004)
According to Ambler “perceived quality is an input to future performance”, (Ambler, 1997).
However, “purchase decisions and brand loyalty are directly influenced by perceived quality”
(Aaker, p.19, 1991).
Snoj and his co-authors proposed through their research work that perceived quality should be
considered as a feature connected with its attributes relatively being the attribute itself. The
quality perception draws from the knowledge of the consumer towards product or brand. They
strain on, not to reduce perceived quality objective since they are associated and therefore could
not be ignored either. At the end it depends on the opinion of consumer towards product or brand
including performance qualities. (Snoj, Et al., 2004)
2.3 Consumer Attitude and Taste
Attitudes are implicit to be associated to behavior. “This is true both in the common use of the
term attitude and within the research literature in social psychology” (Eagly and Chaiken, 1993).
According to Hoyer and McInnis, the attitudes of consumers would be less effective toward
latest information if it does not match up with them. Then they explained that it would be

6
probable for the consumer to follow the latest information and replicate the differences, likeness,
features and advantages (Hoyer and McInnis, p.71, 2001). Furthermore they explained
perception as a phase where the inward stimulus activates the five senses of vision, hearing,
taste, touch and smell. In a cross-cultural perception, vision and taste may have a huge effect on
consumers’ taste for a product (Hoyer and McInnis, p.92-95, 2001).
Product Taste is also important in this scenario and it is significantly considerable to marketing
of food or beverages (Hoyer and McInnis, p. 92-95, 2001). For example coca-cola tastes are
different based on the country or region in which they being sold. This taste changing adaption is
basically for the particular target groups.
According to Hoyer and McInnis, values can be shared within one generation while another
generation has got different values. They highlight that, it is essential to recognize and
understand consumer values since it affects consumption patterns, marketing segmentation and
product development are important factors in understanding the consumer. (Hoyer and McInnis,
2001)
According to Imram, taste and texture has been considering since long to have an effect on
consumer perception. He described that “first taste is almost always with the eye”. This happens
especially when food products are sold through its appearance without packaging. The
appearance then have nimbus effect which leads to modification of flavor perception, and food
acceptability. (Imram, N., 1999)
2.4 Shepherd Model
The complex consumer behavior for food choice is influenced by different factors. There are a
several consumer models for food behaviors in literature which enquire the effects of likely
influence for example (Pilgrim, 1957; Khan, 1981; Randall and Sanjur, 1981; Shepherd, 1985;
reviewed by Shepherd, 1989).
Fig. 1 shows the influencing aspect of food choice which is categorized to those associated with
the food. The person will make the selection based on the external economic and social
environment. In terms of sensory attributes, the person will perceive the chemical and physical
properties of food. The sensory attributes are taste, quality or flavor. However, the perception of
above mentioned sensory attributes in a particular food does not essentially means that the
person may or may not consume that food. It all depends on the choice or liking of the person for
the specific attribute for the particular food which decides the selection of food either person will
choose or not. The further elements in the foods will have effect on the person for example
developing taste. The learning alliance among food’s sensory attributes and its post ingestion
outcomes become visible as a main instrument through which preferences will be widen. The
economic, marketing, social, cultural and demographics are important factors (Marot, 1989;
Shepherd, 1989).

7
2.5 Lens Model
The lens model was developed by Hauser, J. R. in 1993.It shows that the product features and
perceptions are inter-reliant. For consumers, the product features are more important before
purchasing of any product in the market. The product features is linked with the perception in
fig. 2. with arrow facing to perception. The perception is to understand the product. After
perceiving the knowledge about product the perception then become preferences of different
products. The consumer then selects the preferred product during preference process which is
called choice. This whole process relies on the psycho-social cues and price, and availability of
the product (Hauser, 1993).
Figure 1: Some factors affecting food choice and intake (Shepherd, 1985)
acrwebsite.org
Figure 2: Lens Model (Hauser, 1993)
(dspace.hh.se/dspace/handle/2082/1803)
8
There is one more process in which psycho-social cues and perceptions are also inter-reliant
through which these two terms the consumers prefers availability, then finally do the selection
the product. The other process is that the consumer selects the product with the help of psycho-
social cues which leads to psychological influences, product perception, availability, and price of
the products (Hauser, 1993).
2.6 A Model of Consumer Behavior with respect to Foods
The behavior of individual food consumers is defined in several models. The most significant
model was projected by Pilgrim in 1957. In his model food acceptance is reliant on the food
perception. This perception is based on three different factor namely, physiological effect, of
food, perception of sensory attributes and influence from the environment. Pilgrim imagined that
these determinants relate to food choice bur he did not investigate these interrelations. Pilgrim’s
model is taken as centre of point by several models for food behavior and acceptance as
discussed by Shepherd, 1989. Though there is some difference distinguishes between three
factors, namely, properties of food, factors related to the person engaged in food consumption,
and environmental factor. The inclusive study of consumer behavior with respect to foods must
take all three factors under consideration (Wierenga, B., et al., p.144, 1997).
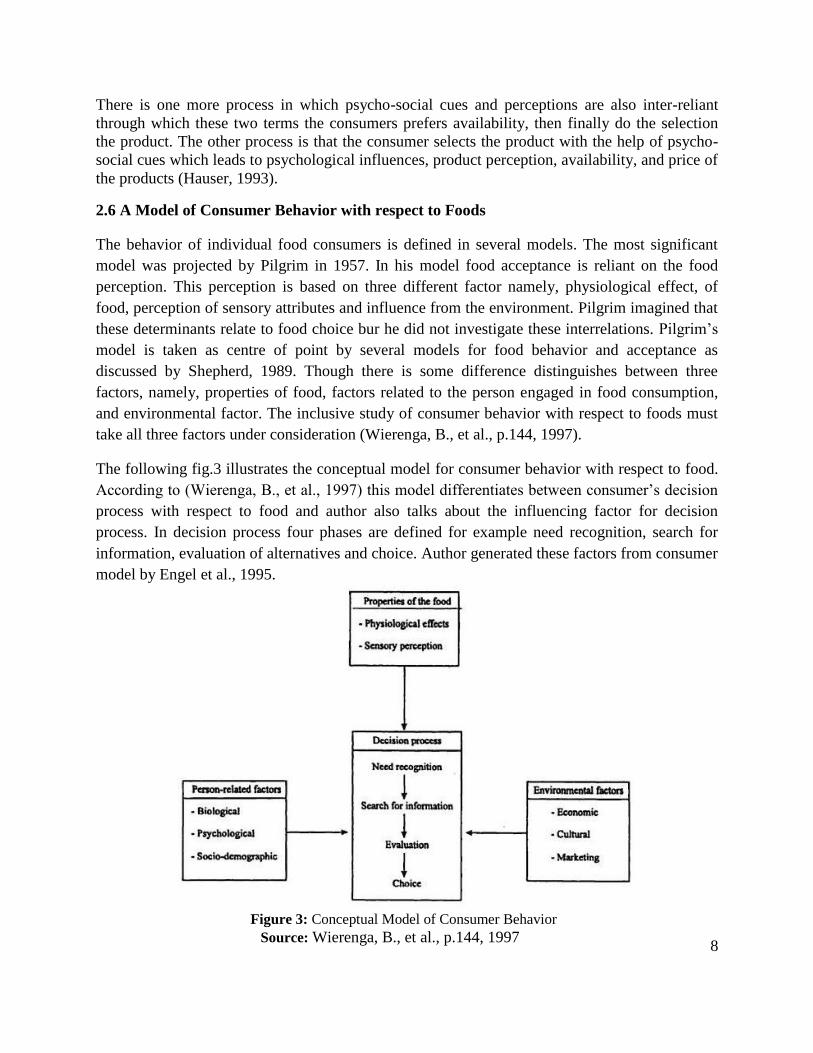
The following fig.3 illustrates the conceptual model for consumer behavior with respect to food.
According to (Wierenga, B., et al., 1997) this model differentiates between consumer’s decision
process with respect to food and author also talks about the influencing factor for decision
process. In decision process four phases are defined for example need recognition, search for
information, evaluation of alternatives and choice. Author generated these factors from consumer
model by Engel et al., 1995.
Figure 3: Conceptual Model of Consumer Behavior
Source: Wierenga, B., et al., p.144, 1997

9
Engel et al. (1995) classify three diverse kinds that influence the decision-making of consumers.
“Individual differences e.g. knowledge, attitude, motivation and personal values. The
environmental influences include e.g. culture, social class, family and situation. By situation for
example the working- and financial situation is meant. Lastly, the psychological influences are
about how consumers process new information, how they learn and what attitude they have
towards changes” (Engel et al., 1995).
The fig.3 classifies the exact variables concerning to each group of factors. Properties of the food
include nutrients contents, physical properties and chemical properties for example fiber
quantity, amount of energy in food (sugar, salt etc.) These properties of food control behavior of
food consumers’ i.e. psychological and sensory effects. The psychological are: hunger etc and
sensory are: age, sex etc. Environmental factors consist of cultural, economic and marketing
factors (Wierenga, B., et al., p.145-146, 1997).
2.7 Conceptual Framework
This conceptual model will base on the frame of references which are discussed above. In
literature review we discussed different models of consumer behaviors and perception of food
items including the theoretical concept of consumer behavior, consumer perception, and
consumer attitude and taste.
There are seven elements in this model fig. 4 including final outcome of consumer segmentation
for example age and occupation. We will examine the influence of variables like product taste,
price and packing, consumer attitude (perception), demographics and segmentation. The culture
should mostly depend on secondary data. The focus will be on Swedish consumers and market.
The consumer attitude, emphasized on sensory attributes specially product taste because our
major work is to bring the tea samples and let people taste it. In this way we will investigate the
impact of tea taste, price and availability. By having the detailed analysis of all the elements of
this model we will conclude them to the perception of consumers towards Tapal tea.
Figure 4: Conceptual Model
Source: Authors
Consumer Attitude:
Sensory attributes
Demographic
s
Environmental
Factor: Culture
Tapal Tea
Product Taste
Product Price
& Packing
Perception
Segmentation
10
Culture basically builds the values and behavior which are matched to the environment. This
may be the strength of tradition, over the time. So, tea as a culture is basically the lifestyle and
consumption of tea in our case. In this way we studied the tea drinking habit of Swedish
consumers. We understood this habit by asking them question about how often they drink tea and
the numbers of households drink tea. By getting the answers of these questions we analyzed their
tea drinking habits and culture. We also asked them question about the money they spend on tea
every month. All these answers helped us in understanding their culture.
The market segmentation is defined as the market sharing by different consumer’s homogeneous
groups. Segmentation is a factor which varies between groups. There can be four primary factors
for the segmentation of consumer market such as: geographic, demographic psychographic and
behavioral segmentation. (Market Segmentation, n.d.)
We mainly focused on the demographic segmentation that is based on four different variables
such as age, gender, occupation and status. We developed this part in questionnaire as a person
related factor.

11
3. Research Methodology
First of all we will discuss the preconceptions of theories, and then we will decide the scientific
approach. Further we will discuss choice of method and research design. After this secondary
sources will be explained. This chapter end with formulation of questionnaire and Practical and
Ethical Issue during study.
3.1 Preconceptions
Preconceptions are theories/ideas that are produced without opponent opinions and into
considerations without from the experiences (Merriam-Webster, n.d.)
Regarding Tapal tea, our presumptions or preconceptions about this topic came from the fact that
we are from Pakistan and Pakistan is an impressive country for tea. Tapal tea is one of the
famous tea companies in Pakistan and it has been introduced in some parts of Europe and USA.
Once we choose the topic in relation with tea, we decided to focus on the external market of
Pakistani tea as this is the part of Internationalization concept of our thesis work. So, we selected
the Swedish market to introduce Tapal tea.
These reasons let us decide that this topic could be a challenging for us and we could come up
with the recommendation to the Tapal tea in Pakistan. So, we decided to understand the
perception of Swedish customers to introduce the Tapal tea in this market. As we are studying in
Malardalen Hogskolan, Vasteras, Sweden, it will be easy for us for empirical study of different
methods we studied during the research including consumer behavior more appropriate for us.
Another reason for selection of this topic is that it has relationship with our careers. This thesis is
almost a real work and that could be useful for us.
Our preconceptions about Tapal tea as good tea in Pakistan region could prejudice our data
findings especially in the reality that we can modify the outcome of the marketing research in
order to improve the situation of this tea. On the other hand, we may misinform ourselves and in
worst case we may not put the Tapal tea in real place where it should be. Therefore, we attempt
to make this study as objective as probable based on the concrete findings and analysis.
Our preconceptions and professional background are associated with an interpretive position
since the major area of our study is to know the perception of Swede´s towards taste of Tapal tea
and how we can understand the human behavior and idea of social actions (Grinnell, R.M., p. 76,
2004). To attain this information we experienced that marketing research is a key issue, which
tries to understand the consumer behavior and divide people from the purpose in order to make
the worthy recommendations to Tapal tea. So, our background and preconceptions are somehow
linked with social world through epistemological orientation which is “a branch of philosophy
that investigates the origin, nature, methods, and limits of human knowledge” (Dictionary
Reference, n.d.)

12
3.2 Scientific Approach
There are two different methods used in Scientific Approach. The methods are quantitative and
qualitative research.
The main characteristics of quantitative research are: The deductive approach between theory
and research which means that to conduct the empirical study to obtain some findings and tests
some theories and hypothesis which is “an interpretation of a practical situation or condition
taken as the ground for action” (Merriam Webster, n.d.). Secondly, the epistemological track a
positivism approach, in which that data of social work is considered the procedures of natural
world. Lastly, the ontological is basically objectivism, which means that social settings are
considered without relation between the social world and people that participate in it (Bryman,
A., et al., p. 25, 2003).
The qualitative research is based on the characteristics: An inductive approach between theory
and research in order to generate new theories based on empirical study. Secondly, the
epistemological orientation is interpretivism, which is the key element to understand the social
world by respondents and social settings. Lastly, the ontological orientation is constructivism,
which attempts to give details, that how social settings are constantly changes due to the people
forms those setting (Bryman, A., et al., p. 25, 2003).
In practice the qualitative and quantitative theories are not mutually excluded. However we can
use concepts or features of one approach to develop in other. In our case of Tapal tea we will use
a quantitative approach interpretivism and epistemological orientation i.e. perception of Swedes
towards taste of Tapal tea. Now, the most important process is to develop the relationship
between research and theories that we found in literature review. Following are the steps taken to
obtain the processes of quantitative research (Grinnell, R.M. et al., p. 62-73, 2004).
Built the theoretical framework about consumer behavior, perception, attitude for
Sweden.
Developed a research design which includes who will conduct the study, who will be the
respondents and who do the empirical study.
After making a research design, we have to accumulate process and analyze the data we
collected.
After doing all this we need to extract important and appropriate information for our
conclusion. At the end we have to extract the relevant information for making the
conclusions.
Finally there will be a feedback if to modify.
3.3 Choice of Method
Based on the formulation of connection between our research question and scientific research we
have selected quantitative approach because in our research question we described that “what is
perception of Swedish customers towards Tapal tea” which means that we have done a
marketing research in order to understand the perception of Swedish tea drinkers regarding Tapal
13
tea. First we let the customers taste the Tapal tea then we asked them to fill the questionnaire. On
the basis of their feedback we have given some strategic recommendations to Tapal tea.
The reason for selection of quantitative research is that the data collection and processes are
more controlled and easier to find conclusions. Because in the qualitative research the main
objective of open questionnaire is to focus on the detail and context regarding, the research.
Therefore, to obtained an apparent knowledge and found proper conclusions, we wanted to
measure variables with close questions for example what kind of tea consumed, tea taste, price
and quality etc. which will be more complicated through qualitative research (Bryman, A., et. al.,
p. 302-303, 2003).
We asked almost 50 Swedish tea drinkers to fill up the questionnaires after trying the Tapal tea.
Since the number of tea drinkers is very small in Sweden as mentioned in the target audience
part, so that is why we have selected small sample size. We asked almost 250 numbers of people
to taste our tea but only 50 agreed to taste the tea. So, our overall respondents were 250 but for
questionnaire data analysis we only considered the respondents which tasted out tea. We
conducted this activity in the shopping centre of “Entre” in Malmö Sweden. This shopping
centre is one of the most crowded shopping centers in Malmö. We have selected Malmö because
it is a bigger city in Sweden. We conducted this activity inside the center where we let people
taste the Tapal tea and we asked customers to fill up the questionnaire after trying Tapal. In this
way we understood their perception about Tapal tea.
We had arranged the tea bags of Tapal from Pakistan. We are only restricted to Malmö city due
to the shortage of time.
3.4 Research Design
After we have clarified the scientific approach, we will focus on the research design. A research
design provides a structure for the gathering and compilation of data. The procedure used
basically to have the required date. The five different kinds of research designs are:
Experimental design.
Cross-sectional design.
Longitudinal design.
Case study design.
Comparative design.
Each kind is used according to the objective and research strategy of each study work (Green,
P.E. and Tull, D.S., p. 89, 1975).
In our study of Tapal tea we are going to study several cases means each case is one individual,
at each point to get quantitative data. We will make associations between the variables and
explain the perception of Swedes. Therefore, our research design is a cross-sectional because we
will do a tea sample (taste) survey with structured questionnaire through which we gather data.
3.5 Secondary Data Sources
Apart from the primary data collection in which we will obtain the data or information about the
perception of Swedes towards tea. On the other we also required secondary data sources to make

14
the secondary analysis of research and to improve it. The secondary data is the data found by
people that hardly contribute in the collection of data for current study (Grinnell, R.M. et al., p.
292, 2004).
The secondary sources that we used in this thesis work are mostly scientific articles that we have
found from Malardalen Hogskolan (Library databases), some are found online. The basic
information of Tapal tea collected from online newspapers, company website. We conclude
mainly books of consumer behavior, design and research method and marketing research. We
extracted consumer behavior, consumer perception, consumer attitudes and taste, consumer
models of foods from different books. We quoted the text from articles and books at different
places of this report.
3.6 Formulation of Questionnaire
The questionnaire for this thesis has been structured and based on the conceptual framework.
which relies on different theories/literatures and articles related to consumer perception,
According to Nachmias, F., & Guerrero, L., question contents, questions types, structure, format
and sequence means in which questions are ordered, must be appropriate to the objective of the
research work (Nachmias, F., & Guerrero, L., 2008).
We are using quantitative approach so, overall structure of questions are closed ended. In this
way we will get the specified answers for all question which is easy to analyze and sampling
with accurate results.
Questions: Variable (Consumers’ Attitude)
In our conceptual model fig. 4 one variable is consumer attitude which is related to the sensory
attributes of taste, smell, hear, vision and touch. This variable is separated to product taste and
price variable. The following questions are to get an idea about this variable;
Q.1 Which Tea do you like the most?
Q.2 Which factors affect you more when purchasing tea?
Q.3 What do you think about the taste of Tapal tea?
Q.4 Do you find Tapal tea better than other tea?
Questions: Variable (Product Price & Packing)
Price and availability is the choice for many consumers as there are already different brands of
tea here in Sweden;
Q.1 How much you usually spend on tea every month?
15
Q.2 Which kind of packing you prefer?
Q.3 Do you consider price as an important factor while purchasing tea?
Questions: Variable (Person Related Factors)
This variable focuses on the demographics elements of the consumer which plays a vital role to
conduct proper information of the users of the product.
Q.1 Gender
Q.2 What is your age group?
Q.3 What is your Occupation?
Q.4 Do you live in Sweden permanently?
Question: Variable (Environmental Factor)
In this variable mostly culture related questions would be ask from Swedes to know about their
tea drinking habits and family structure.
Q.1 How often do you drink tea?
Q.2 How many of your households drink tea?
3.7 Limitations
We faced some practical and ethical issues while access to public’s information. People refused
to fill the questionnaire. Time limitation was also one of the problems. It was not an easy task to
complete the research in 10 weeks which we normally get in masters program. Generally
universities use standard agreement but in some cases organization might insist that the
university for which a student is writing a dissertation should sign a confidentiality agreement
(Fisher 2007, P.64).
Due to the shortage of time we conducted our research only in Malmö. We were not able to
conduct research in other cities of Sweden. We had also faced the problem in the arrangement of
Tea bags from Pakistan due to the flight delays because of volcanic ashes. We still tried our best
to complete our thesis on time. As mentioned in the Tapal tea introduction that they have
different tea brands, also they deal in green tea and flavored tea. But due to the unavailability of
the flavored and green tea we only arranged gray tea.

16
4. Presentation of Data
Once we have arranged tea taste campaign and collected the data about the consumer behavior
of tea in Sweden, we have to identify them in order to have the perception of Swedes about tea in
general and particularly about Tapal tea. This will be helpful to construct the analysis of data
and make some conclusions about the consumer’s behavior/perception and provide some
recommendations to the Tapal tea in Pakistan.
4.1 Questionnaire Results
Analysis is defined as the analysis of variables, generally characterized in a frequency table
which is basically the respondents and their answers percentage for each category of variables
(Bryman, A., Bell, E., P. 241). We will analyze the different variables for all questions whose
frequencies and graphs have been acquired through Microsoft excel.
The findings from questionnaire will be described according to the conceptual model. We
developed the questions according to conceptual model. We will let people taste the tea first then
its start with person related factors (Demographics).
4.1.1 Gender
We tried to balance the number of male & female customers in order to get the opinion of both
genders. We filled the questionnaires from 22 males & 28 females as shown in Table I. The total
number of questionnaires was 50 so the percentage of males & females are 44 & 56 respectively
as shown in table.
Table I
Gender Frequency Percentage
Male 22 44 %
Female 28 56 %
Grand Total 50 100 %
Gender
Male
Female

17
4.1.2 Age Group
The female respondents 56% are more than males as shown in Table II. We can conclude from
the age groups results that more respondents are from age between (11-19) years old and age
above 60. The respondents between (40-49) years old are 18% and between (20-29) are 16% and
respectively in below table.
Table II
Age group Frequency Percentage
11-19 10 20 %
20-29 8 16 %
30-39 6 12 %
40-49 9 18 %
50-59 7 14 %
60 + 10 20 %
Grand Total 50 100 %
4.1.3 What is your Occupation?
According to the Table III students responded to the tea were 36%. The 26% of employed
respondents are between ages from 35 to 50. The un-employed respondents were mostly females
which are taking care of kids. We got the equal response of males and females from retired
group.
Table III
Occupation Frequency Percentage
Student 18 36 %
Employed 13 26 %
Un-employed 11 22 %
Retired 8 16 %
Grand Total 50 100 %
11-19 20-29 30-39 40-49 50-59 60 +
0
5
10
Age Group
Age Group
18
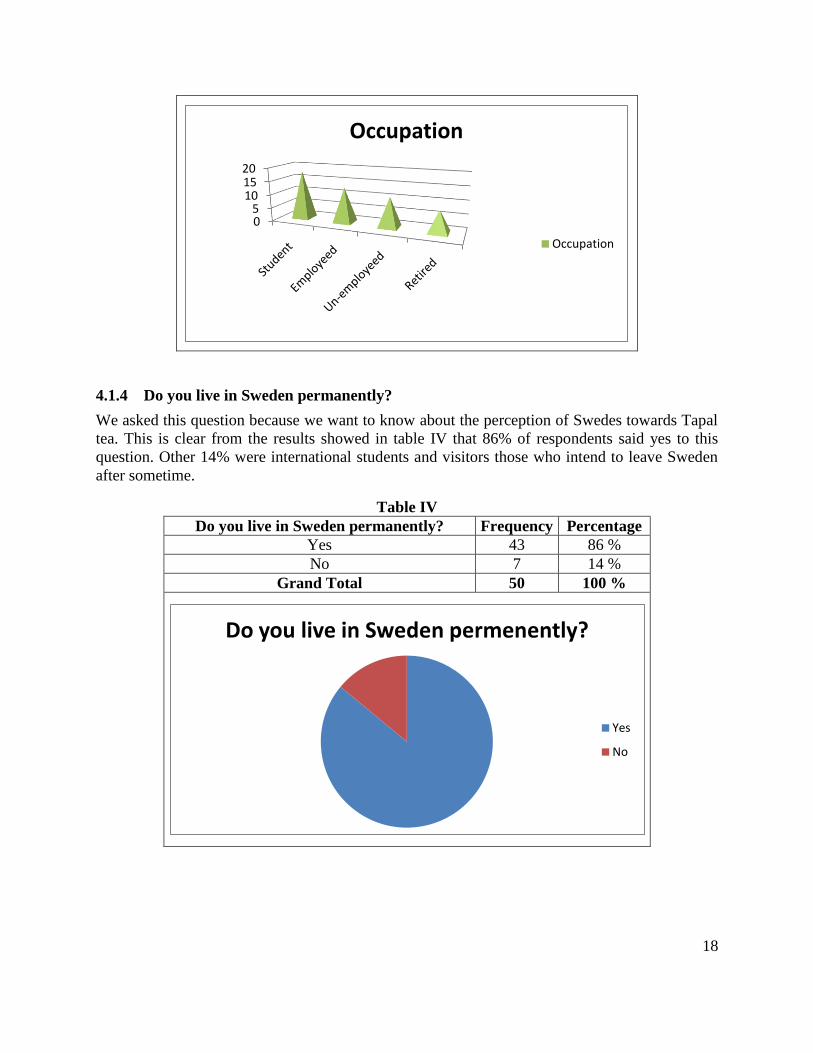
4.1.4 Do you live in Sweden permanently?
We asked this question because we want to know about the perception of Swedes towards Tapal
tea. This is clear from the results showed in table IV that 86% of respondents said yes to this
question. Other 14% were international students and visitors those who intend to leave Sweden
after sometime.
Table IV
Do you live in Sweden permanently? Frequency Percentage
Yes 43 86 %
No 7 14 %
Grand Total 50 100 %
05
101520
Occupation
Occupation
Do you live in Sweden permenently?
Yes
No

19
4.1.5 How Often Do You Drink Tea?
In order to have the Swede’s perception towards tea it is essential to know the tea drinking habit
of Swedes. We got only 28% of respondents who take tea daily in which majority is between 11
to 19 years old. The weekly 22% were from different age groups and we found 36% of
respondents who take tea on the occasions. The table V shows the frequency range of tea drinker.
Table V
How often do you drink tea? Frequency Percentage
Daily 11 22 %
Weekly 14 28 %
Monthly 7 14 %
Occasionally 18 36 %
Grand Total 50 100 %
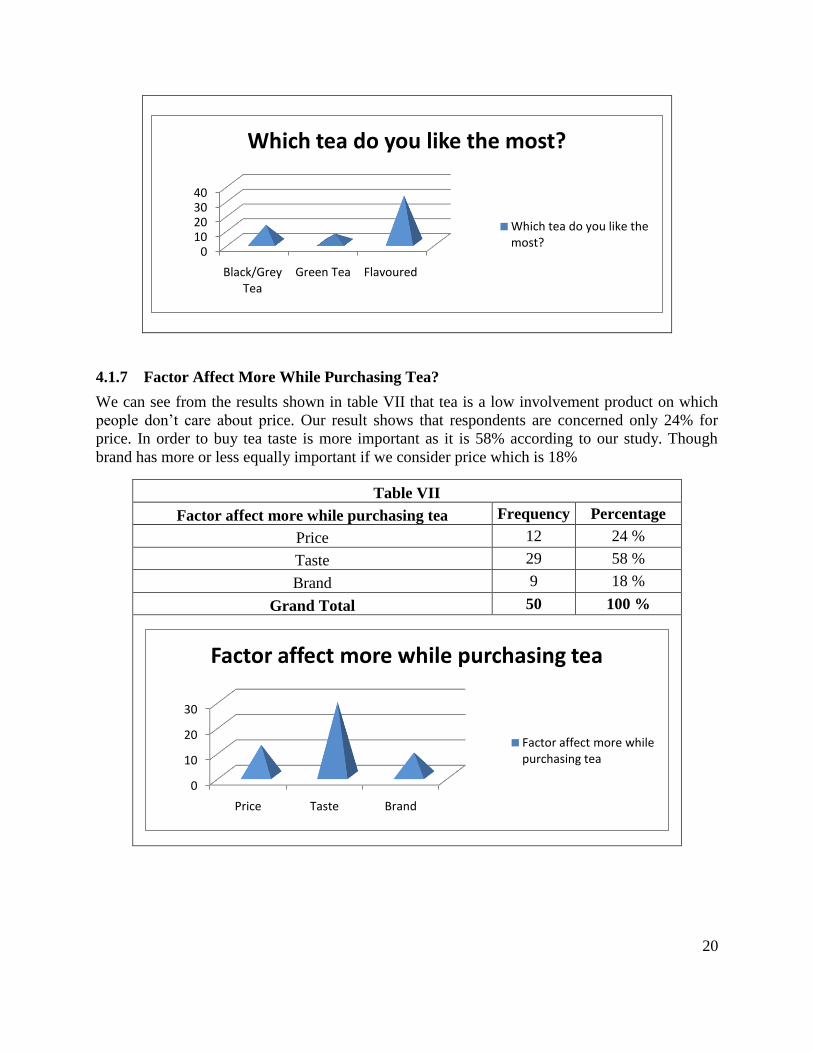
4.1.6 Which Tea Do You Like The Most?
In table VI, we can see how everybody prefers “Black/Grey tea”, “Green Tea” and flavored tea.
The most favorite one in the tea kinds “flavored tea” (64%), is mostly used as we got the answer
from respondents. So, the consumption of flavored tea is more than black tea in Sweden.
However green tea is only 12% according to our results.
Table VI
Which tea do you like the most? Frequency Percentage
Black/Grey Tea 12 24 %
Green Tea 6 12 %
Flavored 32 64 %
Grand Total 50 100 %
05
101520
How often do you drink tea?
How often do you drink tea?
20
4.1.7 Factor Affect More While Purchasing Tea?
We can see from the results shown in table VII that tea is a low involvement product on which
people don’t care about price. Our result shows that respondents are concerned only 24% for
price. In order to buy tea taste is more important as it is 58% according to our study. Though
brand has more or less equally important if we consider price which is 18%
Table VII
Factor affect more while purchasing tea Frequency Percentage
Price 12 24 %
Taste 29 58 %
Brand 9 18 %
Grand Total 50 100 %
010203040
Black/Grey Tea
Green Tea Flavoured
Which tea do you like the most?
Which tea do you like the most?
0
10
20
30
Price Taste Brand
Factor affect more while purchasing tea
Factor affect more while purchasing tea

21
4.1.8 Preferred Packing?
Just like other three elements in Table VII, packing also represents some importance about the
way of likeness in order to consume tea. In Table VIII we can see that 78% of respondents
prefer tea bags packing. However there are 22% of respondents who preferred tea in loose
packing and we observed that these respondents are lies in the group who consume tea daily.
This is because loose tea gives more quality and good taste. We emphasize that packing is
though an important feature for Tapal tea.
Table VIII
Preferred packing Frequency Percentage
Tea bags 42 84 %
Loose tea 8 16 %
Grand Total 50 100 %
4.1.9 Number of Households Drinks Tea?
In the household consumption of tea, based on statistics of table IX we can see that 46% of
respondents said that only 1 person in their house drink tea. There are 10% of respondents who
said there almost all family members drink tea. Those are basically Swedish nationality holder
but from other region where tea is regularly used by almost all family members living in a house.
We experienced the same thing as we are from the country where tea is mostly consumed by all
households. Hence, in Sweden tea is a product which is not drunk by everyone and on daily basis
even weekly.
Table IX
Number of households drink tea Frequency Percentage
1 23 46 %
2 15 30 %
3 7 14 %
Preferred packing
Tea bags
Loose tea

22
4+ 5 10 %
Grand Total 50 100 %
4.1.10 Taste of Tapal Tea?
Regarding, the taste of Tapal tea only one person answers that the tea taste is not good, being the
good 42% and normal 38% the most repeated responses as shown in Table X. We can conclude
that the perceived quality of Tapal tea is good with keep in mind that Sweden is not a good
market for tea (Tea Market in Sweden, n.d.). This shows that in limited number of tea brands
Tapal tea can become a good competitor to existing based on their quality.
Table X
Taste of Tapal tea Frequency Percentage
Excellent 9 18 %
Good 21 42 %
Normal 19 38 %
Not Good 1 2 %
Grand Total 50 100 %
0
5
10
15
20
25
1 2 3 4+
Number of households drink tea
Number of households drink tea
0
5
10
15
20
25
Excellent Good Normal Bad
Taste of Tapal tea
Taste of Tapal tea

23
4.1.11 How Much You Spend on Tea Every Month?
The results of this question in Table XI show that Swedes do not spend too much on tea as 42%
of respondents said that they only spend 0 to 50SEK (Swedish Krona) on tea. Only 16% of
respondents spend 150+ SEK on tea every month which shows only figures of regular tea
drinkers.
Table XI
How much you spend on tea every month? Frequency Percentage
0 - 50kr 21 42 %
51 - 100kr 11 22 %
101 - 150kr 10 20 %
150+ kr 8 16 %
Grand Total 50 100 %
4.1.12 Taste of Tapal Tea better than Other Tea?
Taste is always important factor in order to deal with food item. The following figures in Table
XII show the Tapal tea’s perception of respondent as compare to other tea brands. According to
56% of respondents found the taste of Tapal tea better than other tea. We did not mention the
competitors’ brands because we were not considering the competitors of Tapal tea in our study.
This question was asked to know about the Tapal taste standard.
Table XII
Taste of Tapal tea better than other tea Frequency Percentage
Yes 28 56 %
No 22 44 %
Grand Total 50 100 %
0102030
0 - 50kr 51 -100kr
101 -150kr
150+ kr
How much you spend on tea every month?
How much you spend on tea every month?

24
4.1.13 Price Is Important factor While Purchasing Tea?
The result from Table VII shows that 24% of respondents said price is an important factor for
purchasing tea. In this question 72% of respondent said that price is not important factor for
buying tea because this is low involvement product. Low involvement products are purchased
frequently but with less thoughts and minimum efforts because it do not have important concern
and larger impact on customer’s lifestyle (Low Involvement Products, n.d.). So, price strategy
for Tapal tea could not be important as compare to taste and quality.
Table XIII
Price is important while purchasing tea? Frequency Percentage
Yes 14 28 %
No 36 72 %
Grand Total 50 100 %
Tapal taste better than other tea?
Yes
No
Price is important while purchasing tea
Yes
No

25
5. Analysis of Findings
In this chapter we will do the segmentation based on our findings about the perception. We are
using demographic segmentation for this research. We will discuss the relationship between our
findings and the elements of demographic segmentation. This analysis will help us to give the
recommendations.
5.1 Relationship between empirical data and gender
In this part we will make the relationship of gender with two questions as below. We have
selected these questions to understand the tea drinking behavior of males and females separately.
Also we want understand the buying behavior of both genders by understanding their preferences
while they purchase tea.
Table-A
How often do you drink tea Males Percentage Females Percentage
Daily 6 27.3% 8 28.6%
Weekly 4 18.2% 7 25.0%
Monthly 2 9.1% 5 17.9%
Occasionally 10 45.5% 8 28.6%
Grand Total 22 100% 28 100%
On the basis of the table-A results we have analyzed that Majority of the male customers drink
tea occasionally. As mentioned in table A that 45.5% of male customers drink tea occasionally.
Whereas 27.3%, 18.2% and 9.1% male customers drink tea daily weekly and monthly
respectively. On the other hand females´ percentage of occasional tea drinkers is less as
compared to males. The percentage of females drinking tea daily, weekly and monthly is 28.6%,
25% and 17.9% respectively.
The number of males drinking tea occasionally is greater than number females. There is not a
very noticeable difference between the other figures.
Gender
How often do you drink tea?which factor affect you more when
purchasing tea?

26
Table-B
Factor affect more while purchasing tea Males Percentage Females Percentage
Price 2 9.1% 10 35.7%
Taste 18 81.8% 11 39.3%
Brand 2 9.1% 7 25%
Grand Total 22 100% 28 100%
We have analyzed from table-B that most of the males prefer taste on price and brand while they
purchase tea. On the other hand females not only go for taste but they also take care about the
price and brand. The figures in table B shows that 35.7% females prefer price and 25% prefer
brand. If we compare these figures with the males then it is quite obvious that males don´t prefer
price and brand as compare to females.
5.2 Relationship between empirical data and age group
We will discuss the relationship between our empirical data and age group. We have selected the
below questions to analyze the age group who liked Tapal tea more. Also we want to analyze the
relationship between age group and price.
Table-C
Tapal better
than other tea? 11-19 % age 20-29 % age 30-39 % age 40-49 % age 50-59 % age 60 + % age
Yes 8 80% 3 37.5% 2 33.3% 4 44.4% 5 71.4% 6 60%
No 2 20% 5 62.5% 4 66.7% 5 55.6% 2 28.6% 4 40%
Grand Total 10 100% 8 100% 6 100% 9 100% 7 100% 10 100%
On the basis of figures mentioned in table-C we have analyzed that customers from age groups
11-19, 50-59 and 60+ liked the Tapal tea more as compared to the customers from age groups
20-29, 30-39 and 40-49. 80%, 71.4% and 60% of the customers from age groups 11-19, 50-59
and 60+ liked tapal tea more than other tea brands respectively.
Age group
Do you find Tapal tea better than other tea?
Do you consider price as an important factor when purchasing tea?

27
Table-D
Price is important
while purchasing
tea
11-19 % age 20-29 % age 30-39 % age 40-49 % age 50-59 % age 60 + % age
Yes 2 20% 3 37.5% 2 33.3% 2 22.2% 2 28.6% 3 30%
No 8 80% 5 62.5% 4 66.7% 7 77.8% 5 71.4% 7 70%
Grand Total 10 100% 8 100% 6 100% 9 100% 7 100% 10 100%
In table-D we have analyzed the relationship between age groups and price. We have analyzed
from the table-D figures that customers from age group 11-19 not really care about the price
because normally people from this age group don´t shop household items like tea. We have
analyzed from the other figures that people from all age groups don´t prefer price because it is a
low involvement product.
5.3 Relationship between empirical data and living Status
We will discuss the relationship between the empirical data of tea drinking and living status. In
this way we will analyze the tea drinking culture of Swedish people with the people from other
nationalities. Basically for this research we mainly focused Swedish customers, that is why the
numbers of Swedish customers is more than non Swedish but still we want to understand the tea
drinking habits of Swedish people more.
Table-E
How often do you drink tea Living status
Permanent-yes Percentage
Living status
Permanent-No Percentage
Daily 9 20.9% 5 71.4%
Weekly 10 23.3% 1 14.3%
Monthly 7 16.3% 0 0.0%
Occasionally 17 39.5% 1 14.3%
Grand Total 43 100% 7 100%
Living status in Sweden
How often do you drink tea? How many of your households drink tea?

28
We have analyzed from table-E that 71% of non Swedish people drink tea daily, whereas only
20.9 Swedish customers drink tea daily. The number of Swedish customers drinking tea weekly,
monthly & occasionally is more than non Swedish customers. These figures made it clearer that
there is no such tea drinking culture in Sweden.
Table-F
Number of households drink tea Living status
Permanent-yes Percentage
Living status
Permanent-No
1 15 34.9% 2 28.6%
2 17 39.5% 1 14.3%
3 10 23.3% 0 0.0%
4+ 1 2.3% 4 57.1%
Grand Total 43 100% 7 100%
In table-F we have analyzed that the number of households drinking tea in non Swedish families
is more. In 57.1% non Swedish families 4+ households drink tea. Whereas in Swedish families
the number 1 and 2 households drink tea is 34.9% and 39.5% respectively. This shows that in
majority of Swedish families only 1 or 2 households drink tea.

29
6. Conclusion
This research was about the understanding the Swedish customers´ perception about the taste of
Tapal tea. In this research we studied the perception of Swedish tea drinkers by letting them try
the Tapal tea & then asked them to fill the questionnaires. We asked 50 tea drinkers to fill the
questionnaire after trying the tea. We studied their perception about the taste of Tapal tea by
asking them questions about below factors as mentioned in our conceptual model:
6.1 Taste & Sensory attributes
In our research we studied the Swedish consumers´ sensory attributes by four questions as
below:
Which Tea do you like the most?
Which factors affect you more when purchasing tea?
What do you think about the taste of Tapal tea?
Do you find Tapal tea better than other tea?
On the basis of these questions we came to the conclusion that most of the Swedish customers
like flavored tea as compared to grey & green tea. Also most of the customers prefer taste over
price & brand. This shows that Swedish market has potential for products with good taste. So the
good thing about the Tapal is that the majority of the customer responded that the taste of tapal
tea is good and excellent respectively. Also majority of the customers think that the taste of
Tapal tea is better than others.
6.2 Product, price & packaging
We also asked the questions about the product, price & packaging. The three questions are as
below:
How much you usually spend on tea every month?
Which kind of packing you prefer?
Do you consider price as an important factor while purchasing tea?
As we already mentioned above that Swedish people are not real tea drinkers, most of the people
spend only 0-50 Kr/month on tea. Only 1/6 of the customers spend 150+ Kr/month on tea. As far
as packing is concerned most of the customers prefer tea bags over loose tea. Only 16% of
customers like loose tea. Swedish customers are not really concerned about the price as far as
purchasing of tea is concerned.
6.3 Culture
We studied the tea drinking culture of Swedish customers by asking them below questions:

30
How often do you drink tea?
How many of your households drink tea?
We came to the conclusion that there is no real tea drinking culture in Sweden because there are
only 22% people who drink tea every day. Remaining 78% of respondents drink tea either
weekly, monthly or occasionally. There were only 10% respondents with 4+ numbers of
households drinking tea, whereas 46% and 30% and 14% of respondents were with only 1, 2 and
3 household drinking tea respectively. These figures show that there is no such tea drinking
culture in Sweden.
After understanding the perception of Swedish customers we did the demographic segmentation
in our analysis. We covered the elements of demographic segmentation i.e. age, gender and
status in our research
We tried to balance our research by taking equal number of male and female tea drinkers in order
to understand the perception of both genders equally. Apart from the gender we also covered
different age groups in our research in order to understand the opinion of all age groups. We also
asked the people with different occupations to fill the questionnaire. In this way we understood
the perception of customers with different occupations like students, employed, unemployed and
retired people. As we studied the perception of Swedish customers so we tried to fill the
questionnaires from more Swedish customers rather than asking immigrants and people from
other countries. In our research 86% of respondents were Swedish nationals and only 14% were
from other nationalities. In this way we understood the perception of Swedish customers better.
According to segmentation by gender we came to the conclusion that number of occasional male
tea drinkers is more than females. Also males prefer taste on price and brand. Whereas, females
go for price and brand as well along with the tast.
On the basis of segmentation by age group we concluded that customers from age group 11-19,
50-59 and 60+ liked the Tapal tea more. Secondly none of the age group not much cares about
the price while purchasing tea because it is a low involvement product.
Lastly we did the segmentation by living status and we came to the conclusion that Swedish
people don´t have tea drinking habit. Majority of the Swedish people drink tea weekly, monthly
or occasionally. On the other hand Majority of non Swedish drink tea daily. Also the number of
households drinking tea in Swedish families is low. In majority of Swedish families 1 or 2
households drink tea but in most of the non Swedish families, number of households drinking tea
is 4+.

31
6.4 Recommendations
1. As we have analyzed that Swedish market is small but it has potential because the
customers prefer good taste over price and brand. Also most the customers liked the taste
of Tapal tea. So it will be good for Tapal to enter Swedish market because it has good
and different taste due to which they are also popular in Pakistan and other countries.
2. According to the analysis of our research Swedish customers mostly prefer flavored tea.
So it is advisable for Tapal to enter Swedish market with their complete range of products
i.e. gray tea, green tea and flavored tea.
3. It is also advisable for Tapal tea to introduce their different brands of tea in tea bags
because this type of packing is mostly preferred in Swedish market.

32
7. References
Books and Articles:
[1] Aaker, D.A. (1991): Managing Brand Equity – Capitalizing on the Value of a Brand
Name, USA, New York: The Free Press.
[2] Adam, J.H. (1989). Longman Dictionary of Business English, Longman, p. 136.
[3] Ambler, T., (1997): How much of brand equity is explained by trust? Management
Decision, Vol 35, No 3-4, pp283-293.
[4] Baldauf, A., Cravens, K.S., & Binder, G., (2003):”Performance consequences of brand
Equity management: evidence from organizations in the value chain”, The Journal of
Product & Brand Management, Vol 12 no4 pp220-236.
[5] Bryman, A., Bell, E. (2003). Business Research Methods, Oxford
[6] Eagly, A. H., Chaiken, S., (1993): Attitude (Psychology); Attitude change, Harcourt
Brace Jovanovich College Publishers, 2002 Edition
[7] Fisher C., 2007, “Researching and Writing a Dissertation: A Guidebook for Business
Students”, 2nd edition, Prentice Hall
[8] Green, P.E. and Tull, D.S. (1975). Research for marketing decisions, Prentice Hall, p. 89
[9] Grinnell, R.M, Jr. and Unrau. Y.A. (2004). Social Work, Research and Evaluation,
Oxford University Press, p. 62-76
[10] Hoyer, W.D. & MacInnis, D.J. (2001): Consumer Behavior, 2nd Ed. USA: Houghton
Mifflin Company
[11] Imram, N., (1999), “The role of visual cues in consumer perception and acceptance of a
food product”, Vol: 99, Issue: 5, pp. 224 – 230.
[12] Kotler, P., Armstrong, G., Saunders, J. And Wong, V., (2002): Principles of Marketing,
3rd Ed, England: Prentice Hall.
[13] Law, J. (2006). A Dictionary of Business and Management, Oxford University Press,
Oxford Reference Online
[14] Murcott, A. (1989), "Sociological and Social Anthropological Approaches to Food and
Eating," in World Review of Nutrition and Dietetics 55, ed. G.H. Bourne, Basel: Karger,
pp. 1-40.

33
[15] Rosenau, M.D. Jr. (1996). The PDMA Handbook of New Product Development, John
Wiley & Sons, p. 230
[16] Shepherd, R (1989), "Factors Influencing Food Preferences and Choice," in Handbook of
the Psychophysiology of Human Eating, ed. R. Shepherd, Chichester: Wiley, pp. 3-24.
[17] Snoj, B., Pisnik Korda, A. & Mumel, D., (2004): “The relationships among perceived
quality, perceived risk and perceived product value” Journal of Product & Brand
Management, Vol 13, No 3, pp156-167.
[18] Solomon, M. (2006). Consumer Behaviour “Buying, having and being, Prentice Hall, p.
7
[19] Ulrich R., et al. (2004): Promoting brand benefits: the role of consumer psychographics
and lifestyle, Vol 21, No. 2, p 97-108.
[20] Urban, G. L. and J. R. Hauser (1993): Design and Marketing of New Products, Prentice-
Hall, Second Edition
[21] Wierenga, B., Tilburg, A. V., Grunert, K., Jan-Benedict E.M. Steenkamp, Wedel, M.,
1997, “Agricultural Marketing and Consumer Behavior in a Changing World”, Kluwer
Academic Publishers, USA 1997.
Internet Links
[22] Final Internship Report on Tapal (Pvt) Ltd. , [online] available at:
http://www.scribd.com/doc/24161355/Final-Internship-Report-on-Tapal-Tea-Pvt-Ltd
[accessed 03 April , 2010]
[23] Food Navigator 2003, [online] available at: http://www.foodnavigator.com/Financial-
Industry/The-demise-of-the-great-tea-drinking-tradition [accessed] 23 May, 2010]
[24] Low Involvement Products, [online] available at: http://en.mimi.hu/marketingweb/low-
involvement_products.html [accessed 06 June, 2010]
[25] Market Segmentation, [online] available at:
http://www.quickmba.com/marketing/market-segmentation/ [accessed 18 May, 2010]
[26] Pakistan Food and Drink Report Q2, 2010, [online] available at:
http://www.marketresearch.com/product/display.asp?productid=2612842 [accessed 03
April, 2010]
[27] Scribd, 2009 available at: http://www.scribd.com/doc/21519423/Analyzing-Tea-Import-
in-Pakistan [accessed] 25 March, 2010]
[28] Stash, [online] available at: www.stashea.com [accessed 24 March, 2010]

34
[29] Syed M. A., Tapal holds strong market position, 2000, [online] available le at:
http://www.pakistaneconomist.com/issue2000/issue46/i&e1.htm [accessed 02 April,
2010]
[30] Tapal – Market Trends and Opportunities, [online] available at:
http://www.scribd.com/doc/15439549/tapal [accessed 04 April, 2010]
[31] Tapal Tea “company history”, [online] available at: http:www.tapaltea.com [accessed 25
Mar, 2010]
[32] Tapal Tea, [online] available at: http://www.authorstream.com/Presentation/zufah-
310943-tapal-tea-training-ethics-business-finance-ppt-powerpoint/ [accessed 25 March,
2010]
[33] Teaconnexions, [online] available at: http://teaconnexions.com/tea_consumption.html
[accessed 24 March, 2010]
[34] Tea Market in Sweden, [online] available at:
http://www.tradeportalofindia.com/usrdata/webadmin/Section3.9/HS09_Tea_0302.htm#5
[assessed 02 April , 2010]

35
Appendix A: Questionnaire
QUESTIONNAIRE
1 Gender: Male Female
2 How often do you drink tea? Daily Weekly Monthly Occasionally
3 Which tea do you like the most? Black/Grey Tea Green Tea Flavored Tea
4 Which factor affect you more when purchasing tea?
Price Taste Brand
5 Which kind of packing you prefer? Tea bags Loose Tea
6 How many of your households drink tea ?
1 2 3 4+
7 What do you think about taste of tapal tea?
Excellent Good Normal Not Good
8 What is your Occupation? Student Employed Un-employed Retired
9 What is your age group? 11-19 20-29 30-39 40-49 50-59 60 +
10 Do you live in Sweden permanently? Yes No
11 How much you usually spend on tea every month?
0 - 50kr 51 - 100kr 101 - 150kr 151+ kr
12 Do you find Tapal tea better than other tea?
Yes No
13 Do you consider price as an important factor while purchasing tea?
Yes No