performance of thermo king reefer with yanmar 2010 … of thermo king reefer with yanmar 2010 2.1 l...
TRANSCRIPT

Performance of Thermo King Reefer with Yanmar 2010 2.1 L
Engine on Refrigerated Trailer Using Fuel Saving Unit
Vladimir McKenzie - FAU Student
Chaouki Ghenai, Ph.D. - Project Manager
Ocean and Mechanical Engineering Department
College of Engineering and Computer Science
Florida Atlantic University
Boca Raton, FL 33431
Ph: 561 297 3943
Fax: 561 297 2825
E-mail: [email protected]
July 2013

2
Table of Contents
Page number
Project Summary …………………………………………………………………………3
1. Project objectives and Goal…………………………………………………………….4
2. Technical Approach ……………………………………………………………………4
2.1 Protocol for engine testing ……………………………………………………4
2.2 Refrigerated Trailer, Reefer Engine and Fuel Saving Unit……………………….5
2.3 Fuel Consumption Measurements………………………………………………...5
2.4 Temperature measurements……………………………………………………….7
Results…………………………………………………………………………………….7
Conclusions ……………………………………………………………………………...10
Appendix…………………………………………………………………………………11
3
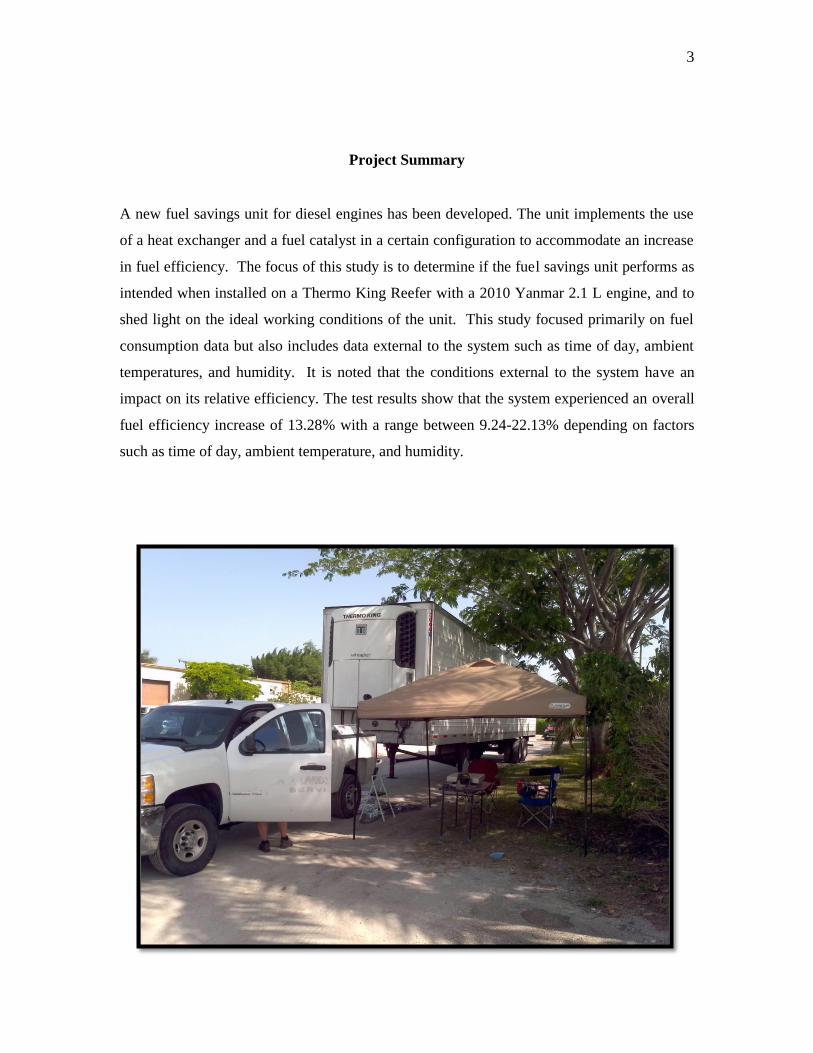
Project Summary
A new fuel savings unit for diesel engines has been developed. The unit implements the use
of a heat exchanger and a fuel catalyst in a certain configuration to accommodate an increase
in fuel efficiency. The focus of this study is to determine if the fuel savings unit performs as
intended when installed on a Thermo King Reefer with a 2010 Yanmar 2.1 L engine, and to
shed light on the ideal working conditions of the unit. This study focused primarily on fuel
consumption data but also includes data external to the system such as time of day, ambient
temperatures, and humidity. It is noted that the conditions external to the system have an
impact on its relative efficiency. The test results show that the system experienced an overall
fuel efficiency increase of 13.28% with a range between 9.24-22.13% depending on factors
such as time of day, ambient temperature, and humidity.

4
1. Objective:
The principal objective of the proposed testing is to determine the changes in the fuel
consumption of Thermo King Reefer with a 2010 Yanmar Engine for 53’ Refrigerated
Trailer owned by Cool Carriers, INC using a Vapster-Diesel RV-3300. The goal is to
improve the fuel efficiency of the Reefer Engine used in the Refrigerated Trailer.
2. Technical Approach:
The performance of the Vapster-Diesel RV-3300 Fuel Saving Unit (Retrofit System)
installed on the Yanmar Reefer Engine of Refrigerated Trailer is tested in this study. All the
proposed tests are performed off site at Delray Beach. The goal is determine the changes in
engine fuel consumption using this new Fuel Saving technology. To reach this goal, we are
proposing:
2.1 Protocol for engine testing:
In order to decrease the possibility of a bias between the base runs and test runs the protocol
for engine testing was kept identical for each.
2.1.1 Test without Fuel Savings Device- Baseline measurements
(a) Number of tests = 5
(b) Duration for each test = 0.5-1 hour
2.1.2 Repeat the same tests with the Fuel saving device
(a) Number of tests = 8
(b) Duration for each test = 1 hour
2.1.3 Repeat the same test with only heat exchanger, without fuel catalyst
(a) Number of test = 1
(b) Duration of test = 1 hour
5
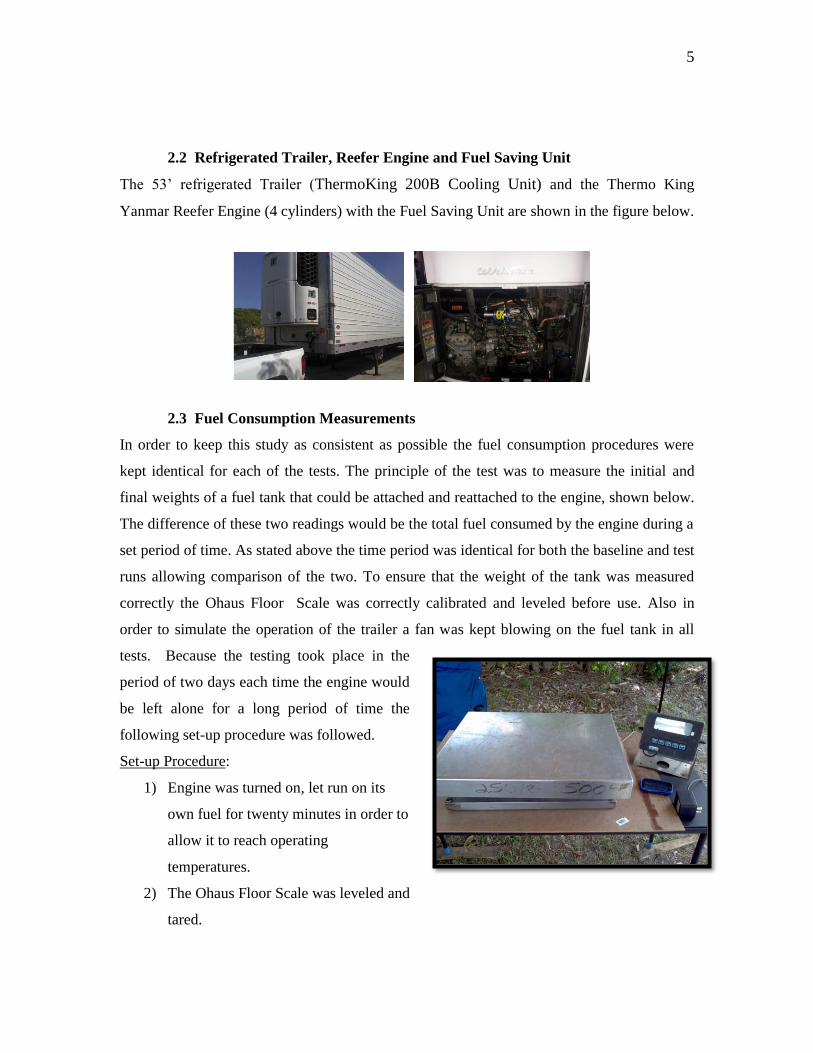
2.2 Refrigerated Trailer, Reefer Engine and Fuel Saving Unit
The 53’ refrigerated Trailer (ThermoKing 200B Cooling Unit) and the Thermo King
Yanmar Reefer Engine (4 cylinders) with the Fuel Saving Unit are shown in the figure below.
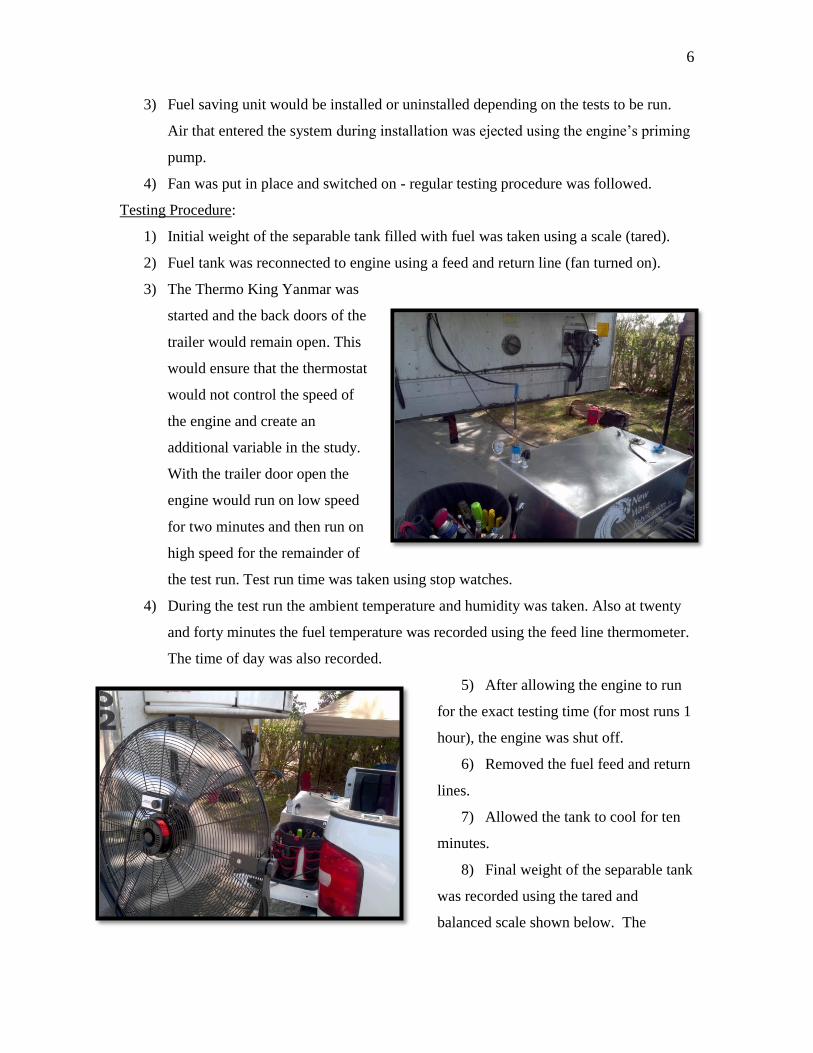
2.3 Fuel Consumption Measurements
In order to keep this study as consistent as possible the fuel consumption procedures were
kept identical for each of the tests. The principle of the test was to measure the initial and
final weights of a fuel tank that could be attached and reattached to the engine, shown below.
The difference of these two readings would be the total fuel consumed by the engine during a
set period of time. As stated above the time period was identical for both the baseline and test
runs allowing comparison of the two. To ensure that the weight of the tank was measured
correctly the Ohaus Floor Scale was correctly calibrated and leveled before use. Also in
order to simulate the operation of the trailer a fan was kept blowing on the fuel tank in all
tests. Because the testing took place in the
period of two days each time the engine would
be left alone for a long period of time the
following set-up procedure was followed.
Set-up Procedure:
1) Engine was turned on, let run on its
own fuel for twenty minutes in order to
allow it to reach operating
temperatures.
2) The Ohaus Floor Scale was leveled and
tared.
6
3) Fuel saving unit would be installed or uninstalled depending on the tests to be run.
Air that entered the system during installation was ejected using the engine’s priming
pump.
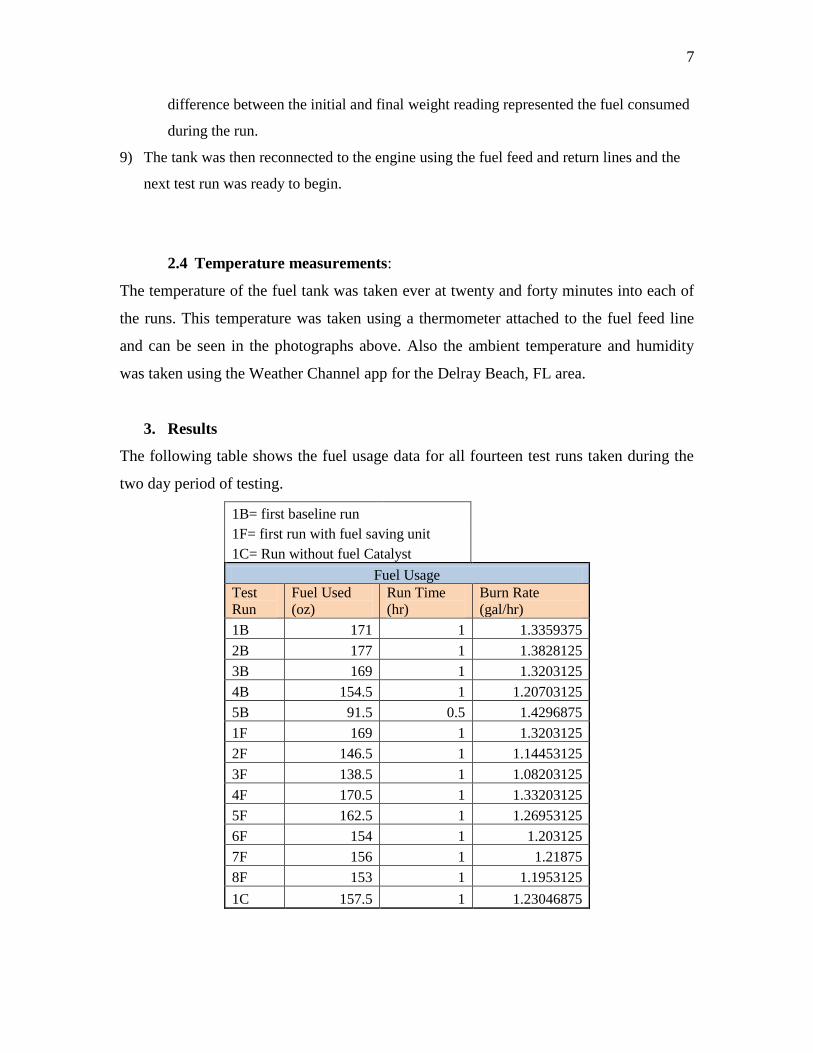
4) Fan was put in place and switched on - regular testing procedure was followed.
Testing Procedure:
1) Initial weight of the separable tank filled with fuel was taken using a scale (tared).
2) Fuel tank was reconnected to engine using a feed and return line (fan turned on).
3) The Thermo King Yanmar was
started and the back doors of the
trailer would remain open. This
would ensure that the thermostat
would not control the speed of
the engine and create an
additional variable in the study.
With the trailer door open the
engine would run on low speed
for two minutes and then run on
high speed for the remainder of
the test run. Test run time was taken using stop watches.
4) During the test run the ambient temperature and humidity was taken. Also at twenty
and forty minutes the fuel temperature was recorded using the feed line thermometer.
The time of day was also recorded.
5) After allowing the engine to run
for the exact testing time (for most runs 1
hour), the engine was shut off.
6) Removed the fuel feed and return
lines.
7) Allowed the tank to cool for ten
minutes.
8) Final weight of the separable tank
was recorded using the tared and
balanced scale shown below. The
7
difference between the initial and final weight reading represented the fuel consumed
during the run.
9) The tank was then reconnected to the engine using the fuel feed and return lines and the
next test run was ready to begin.
2.4 Temperature measurements:
The temperature of the fuel tank was taken ever at twenty and forty minutes into each of
the runs. This temperature was taken using a thermometer attached to the fuel feed line
and can be seen in the photographs above. Also the ambient temperature and humidity
was taken using the Weather Channel app for the Delray Beach, FL area.
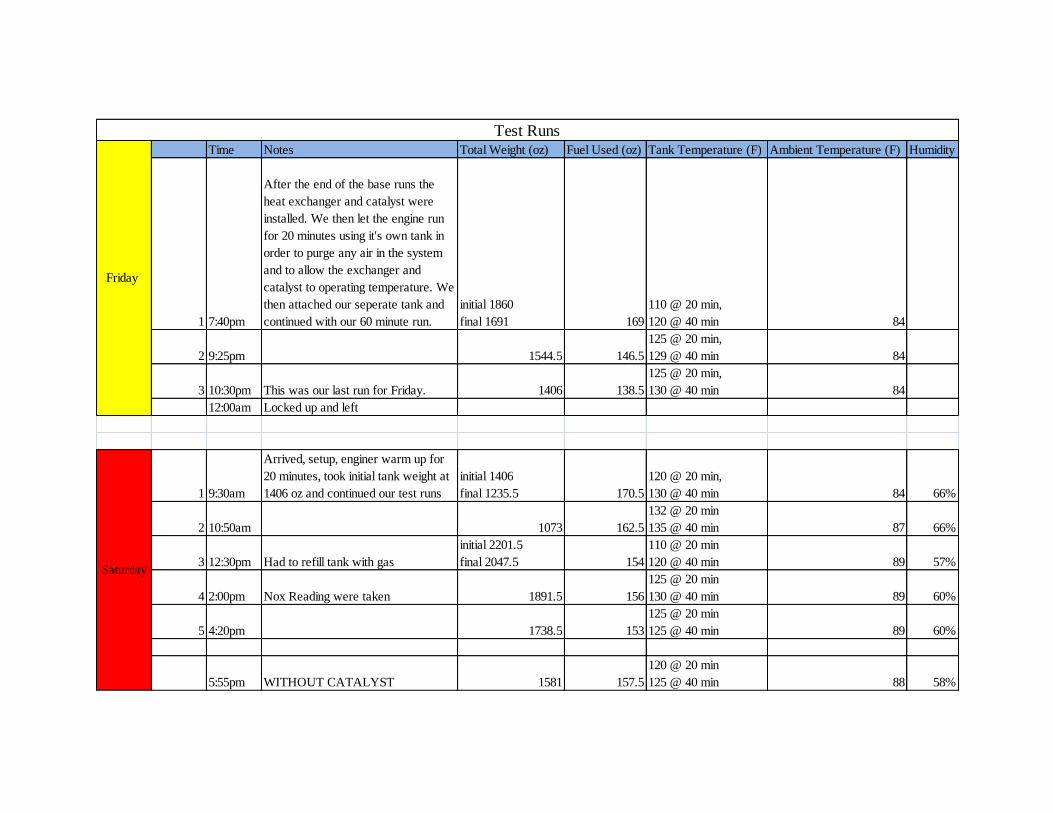
3. Results
The following table shows the fuel usage data for all fourteen test runs taken during the
two day period of testing.
1B= first baseline run
1F= first run with fuel saving unit
1C= Run without fuel Catalyst
Fuel Usage Test
Run Fuel Used
(oz) Run Time
(hr) Burn Rate
(gal/hr)
1B 171 1 1.3359375
2B 177 1 1.3828125
3B 169 1 1.3203125
4B 154.5 1 1.20703125
5B 91.5 0.5 1.4296875
1F 169 1 1.3203125
2F 146.5 1 1.14453125
3F 138.5 1 1.08203125
4F 170.5 1 1.33203125
5F 162.5 1 1.26953125
6F 154 1 1.203125
7F 156 1 1.21875
8F 153 1 1.1953125
1C 157.5 1 1.23046875

8
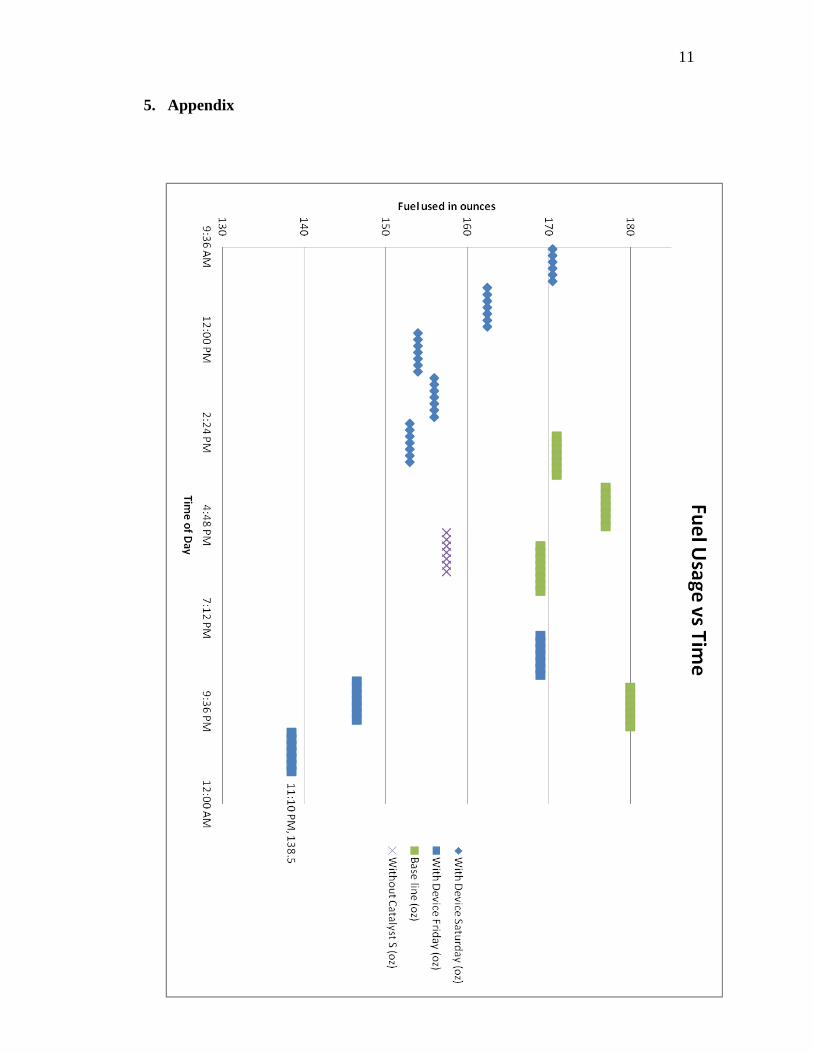
The following chart also offers an understanding of the fuel usage (oz) in relation to the
time of day and therefore ambient conditions.
It must be noted that baseline run ‘4B’ is not included in the chart above. This test run
was not considered accurate because it was performed after a series of test runs with the
fuel saving unit attached. The fuel savings unit raises the temperature of the tank to
above 115 degrees Fahrenheit whereas the basline runs all were recorded to be near the
105 degrees Fahrenheit range. Immediately before trail ‘4B’ the tank was not given
enough time to cool. For this reason the last baseline run ‘5B’ was done after ‘4B’ but
the tank was allowed to cool to close to 100 degrees Fahrenheit. Because it was late at
night and after an entire day of testing this test was only run for half an hour not an hour.
It is reasonable to presume that the fuel usage of a half hour run can be projected out to
an hour run. This is what is shown in the table above. Also test runs ‘1F’ and ‘4F’ are not
included in the following analysis because these tests were the first tests with the Fuel
Savings Unit and the Designer believes that his system had not yet achieve operating
temperatures.
If the table above is inspected the following can be deduced. First, the baseline runs all
fall between 169-180 oz/hr range and the test runs with the fuel saving unit falls between
the 138-162.5 oz/hr range. Second, the fuel usage of the fuel savings unit does not show
much of an improvement from the baseline for the first test of the day, but as the time of

9
the day (therefore number of runs) progresses the efficiencies increase. Third, there
seems to be some correlation between the time of day and the highest achievable
efficiency. In other words, the highest efficiency of 138.5 oz/hr achieved by test run ‘3F’
was completed in the middle of the night, when temperatures dropped and humidity
increased. There are several ways of viewing the data and they will be portrayed below.
First the Overall fuel efficiency data is computed below.
Over-all Baseline Average Fuel Consumption:
Over-all Fuel Savings Unit Average Consumption:
Overal Fuel Saving Percent Increase:
A second way of viewing the data is making note of the large difference between daytime
and nighttime relative efficiencies. Calculations are shown below. Daytime is considered
before sunset at 7pm and nighttime is considered after 7pm.
Daytime Baseline Average:
Daytime Fuel Savings Unit Average:
Daytime Fuel Savings Percentage Increase:
Nighttime Baseline Average: Because run ‘4B’ is not being used there is only one
reading for baseline, ‘5B’ at 183 oz/hr.
10
Nighttime Fuel Saving Unit Average:
Nighttime Fuel Saving Percentage Increase:
With these calculations in mind it can be said that the Fuel Savings Unit during these test
showed a range of efficiencies between 9.24-22.13% increase from daytime to nighttime
runs, and an over-all average fuel efficiency increase of 13.28%. Additional data
including the ambient temperatures and tank temperatures for each run can be viewed in
the appendix sections.
4. Conclusions and Recommendations
The conclusion that can be drawn from the tests perform over the two day period for this
study is that there is a fuel efficiency increase with this configuration of the fuel savings
unit and diesel engine. As noted above the relative fuel efficiency increases can be
viewed over-all, in which case the engine sees a 13.28% fuel efficiency increase. It can
also be broken into daytime and nighttime efficiencies of 9.24% and 22.13% increase,
respectively. It is also noted that the time of day and therefore ambient temperatures
and humidities play a role in the system’s efficiency. This is what is believed to cause the
9.24-22.13% range of efficiencies.
With these conclusions in mind there are the following recommendations for future
testing. It is recommendated that in future testing the ambient temperature and humidity
should be recorded using onsite instruments, which would be more accurate than those
taken during this study. It is also recommended that a long period test run should be
completed with and without the fuel savings, each an entire day at a time. Therefore this
study has resulted in fuel efficiency increases described above but it must be noted that
tests were only performed over a two day period and contain only eight fuel savings units
data points and four usable baseline data points. For these reasons additional testing is
recommended.
11
5. Appendix
Time Notes Total Weight (oz) Fuel Used (oz) Tank Temperature (F) Ambient Temperature (F) Humidity
1 7:40pm
After the end of the base runs the
heat exchanger and catalyst were
installed. We then let the engine run
for 20 minutes using it's own tank in
order to purge any air in the system
and to allow the exchanger and
catalyst to operating temperature. We
then attached our seperate tank and
continued with our 60 minute run.
initial 1860
final 1691 169
110 @ 20 min,
120 @ 40 min 84
2 9:25pm 1544.5 146.5
125 @ 20 min,
129 @ 40 min 84
3 10:30pm This was our last run for Friday. 1406 138.5
125 @ 20 min,
130 @ 40 min 84
12:00am Locked up and left
1 9:30am
Arrived, setup, enginer warm up for
20 minutes, took initial tank weight at
1406 oz and continued our test runs
initial 1406
final 1235.5 170.5
120 @ 20 min,
130 @ 40 min 84 66%
2 10:50am 1073 162.5
132 @ 20 min
135 @ 40 min 87 66%
3 12:30pm Had to refill tank with gas
initial 2201.5
final 2047.5 154
110 @ 20 min
120 @ 40 min 89 57%
4 2:00pm Nox Reading were taken 1891.5 156
125 @ 20 min
130 @ 40 min 89 60%
5 4:20pm 1738.5 153
125 @ 20 min
125 @ 40 min 89 60%
5:55pm WITHOUT CATALYST 1581 157.5
120 @ 20 min
125 @ 40 min 88 58%
Friday
Test Runs
Saturday

Time Notes Total Weight (oz) Fuel Used (oz) Tank Temperature (F) Ambient Temperature (F) Humidity
1 2:34pm
Arrived at 2pm. We let the engine
warm up using it's own tank for 20
minutes. Then weighed our separate
tank at 2377oz, connected it to the
trailer and began the first run. When
it was finished we weight the tank
again and recorded following weight 2206 171
90 @ 20 min,
105 @ 40 min 90
2 3:45pm 2029 177
115@ 20 min,
112@ 40 min 90
3 5:25pm 1860 169
115 @ 20 min,
115 @ 40 min 90
7:20pm
Saturday night base run was done
immediately after the last Test run. I
believe that this run was scewed
because the tank was not allowed to
cool down before we began. For
this reason I convinced Gerald to
run another base line for 30 minutes
after cooling down the tank to aprx
100 degrees NOx RUN
initial 1581
final 1426.5 154.5
115 @ 20 min,
115 @ 40 min 87 61%
9:00pm HALF HOUR RUN 1335 91.5 105 @ 15 min 85 68%
Friday
Saturday
Base Runs