research use of emotiv epoc - …neurofeedback.visaduma.info/emotivresearch.pdfresearch use of...
TRANSCRIPT
1
Research Use of Emotiv EPOC
P300 and Emotiv EPOC: Does Emotiv EPOC capture real
EEG?
Author: Hiran Ekanayake
Last updated: January 5, 2015
This article can be cited as follows:
Ekanayake, H. (2010). “P300 and Emotiv EPOC: Does Emotiv EPOC
capture real EEG?” Retrieved from:
http://neurofeedback.visaduma.info/emotivresearch.htm
Introduction
The Emotiv EPOC headset (http://emotiv.com/) has become one of the lead-
ing BCI equipment available today as a result of its low-cost (consumer edi-
tion for $300-400, research edition for $500) and features (14 EEG channels
plus two references, inertial sensors, wireless connectivity, etc.). Although it
has been integrated in a vast number of BCI applications, yet, its use for
research purposes is being questioned by many researchers. As a response to
such concerns, this article has been published (originally on 25-12-2010) by
including the results of an empirical evaluation of the Emotiv EPOC headset
based on an oddball paradigm and the procedure for repeating the experi-
ment for interested individuals.
Background
Event-related potentials and P300
As far as 1929, Burger has demonstrated the possibility of recording electri-
cal activity of the brain by placing electrodes on the scalp surface of the
brain (Fabiani, Gratton, & Federmeier, 2007). Although Burger and his fol-
lowers had been mainly focused on spontaneous rhythmic oscillations in
scalp voltages (called electroencephalogram, or EEG), more recent research
has shifted its focus towards time-locked electrical potentials to sensory,
motor, or cognitive events called event-related brain potentials, or ERPs
(ibid.). ERPs reflect brain activity from a pooled synchronous activity of a
large population of neurons that occurs in preparation for or in response to
discrete events which can be internal or external to a subject. ERPs can be
2
categorized into two types: exogenous and endogenous (ibid.). The exoge-
nous (or sensory) ERPs are elicited within the first 100 milliseconds from
the stimulus and its characteristics are largely depend on the physical proper-
ties of the external stimulus. In contrast, the endogenous (or cognitive) ERPs
are elicited in the latter part and its characteristics are determined by the
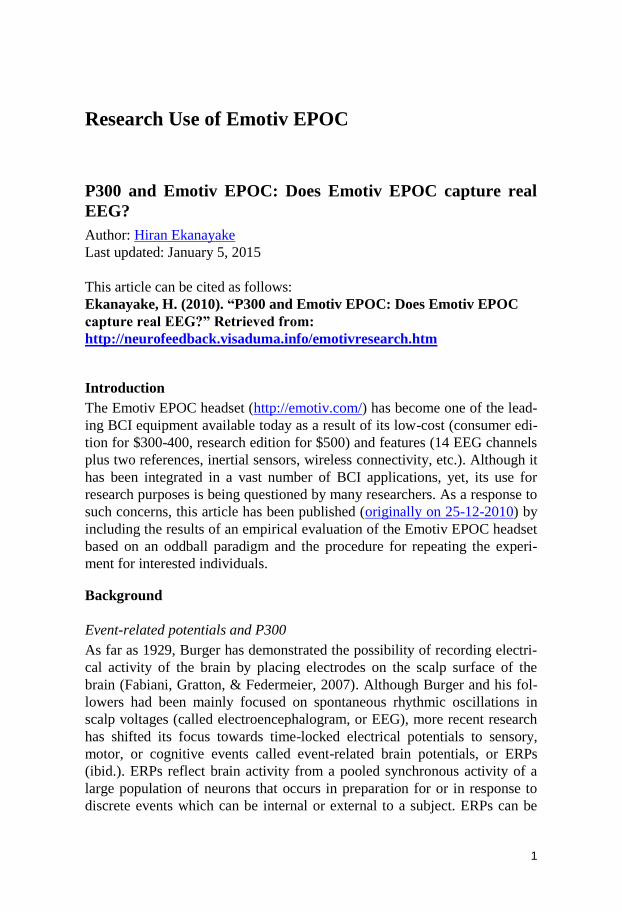
information processing activities required of the subject. Figure 1 represents
the components of a typical ERP waveform.
Figure 1. Components of a typical ERP waveform (adapted from wikipedia)
As it can be seen in Figure 1, the largest component of an ERP is called
P3, or P300, and it is considered to be associated with stimulus evaluation or
categorization (ibid.). A description about different components of ERP
waveforms can be found in Sur & Sinha (2009). This empirical study evalu-
ates the Emotiv EPOC headset on the basis of its capability to reflect the
P300 component in an experimental study called the oddball paradigm.
Deriving P300 using the oddball paradigm
According to literature (Fabiani et al., 2007; Makeig, Debener, Onton, &
Delorme, 2004; Sur & Sinha, 2009), P300 occurs as a positive deflection in
the voltage (2-5µV) with a latency range of 250-400 milliseconds from the
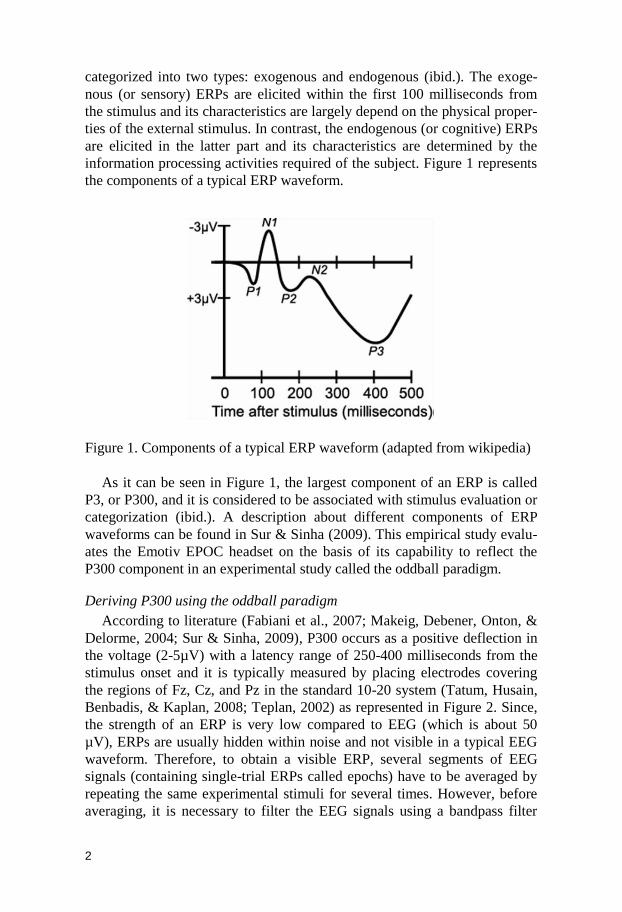
stimulus onset and it is typically measured by placing electrodes covering
the regions of Fz, Cz, and Pz in the standard 10-20 system (Tatum, Husain,
Benbadis, & Kaplan, 2008; Teplan, 2002) as represented in Figure 2. Since,
the strength of an ERP is very low compared to EEG (which is about 50
µV), ERPs are usually hidden within noise and not visible in a typical EEG
waveform. Therefore, to obtain a visible ERP, several segments of EEG
signals (containing single-trial ERPs called epochs) have to be averaged by
repeating the same experimental stimuli for several times. However, before
averaging, it is necessary to filter the EEG signals using a bandpass filter
3
having a pass band range of about 1-20 Hz and to remove artifacts resulting
from sources such as eye movements. Fortunately, there are computational
tools, such as the EEGLAB toolbox (Delorme & Makeig, 2004), to analyze
EEG data by obtaining ERPs.
Figure 2. The 64-channel electrode montage and the channels which are used
in obtaining ERPs (adapted from Krusienski, Sellers, McFarland, Vaughan,
& Wolpaw, 2008)
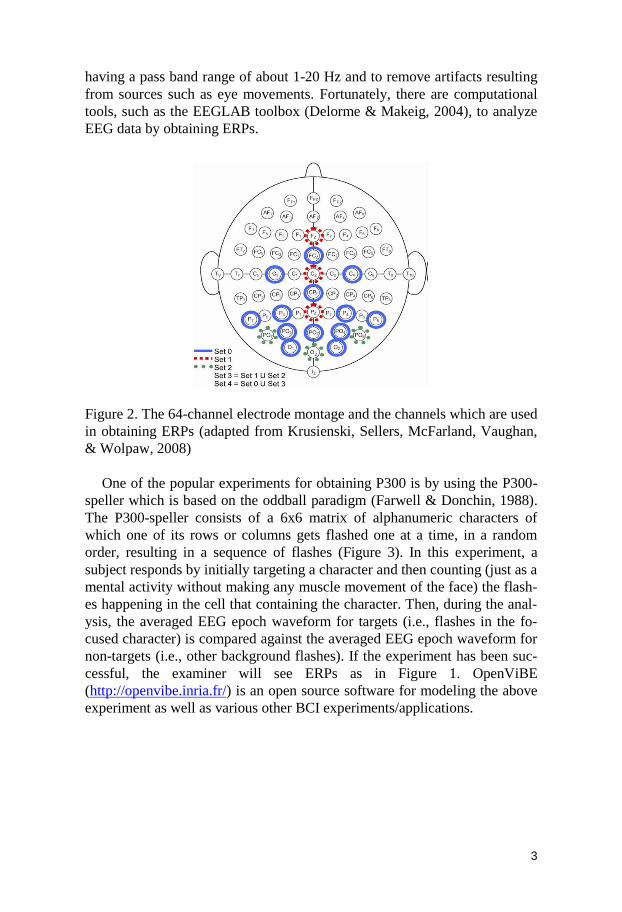
One of the popular experiments for obtaining P300 is by using the P300-
speller which is based on the oddball paradigm (Farwell & Donchin, 1988).
The P300-speller consists of a 6x6 matrix of alphanumeric characters of
which one of its rows or columns gets flashed one at a time, in a random
order, resulting in a sequence of flashes (Figure 3). In this experiment, a
subject responds by initially targeting a character and then counting (just as a
mental activity without making any muscle movement of the face) the flash-
es happening in the cell that containing the character. Then, during the anal-
ysis, the averaged EEG epoch waveform for targets (i.e., flashes in the fo-
cused character) is compared against the averaged EEG epoch waveform for
non-targets (i.e., other background flashes). If the experiment has been suc-
cessful, the examiner will see ERPs as in Figure 1. OpenViBE
(http://openvibe.inria.fr/) is an open source software for modeling the above
experiment as well as various other BCI experiments/applications.
4
Figure 3. P300-speller visualization component in OpenViBE
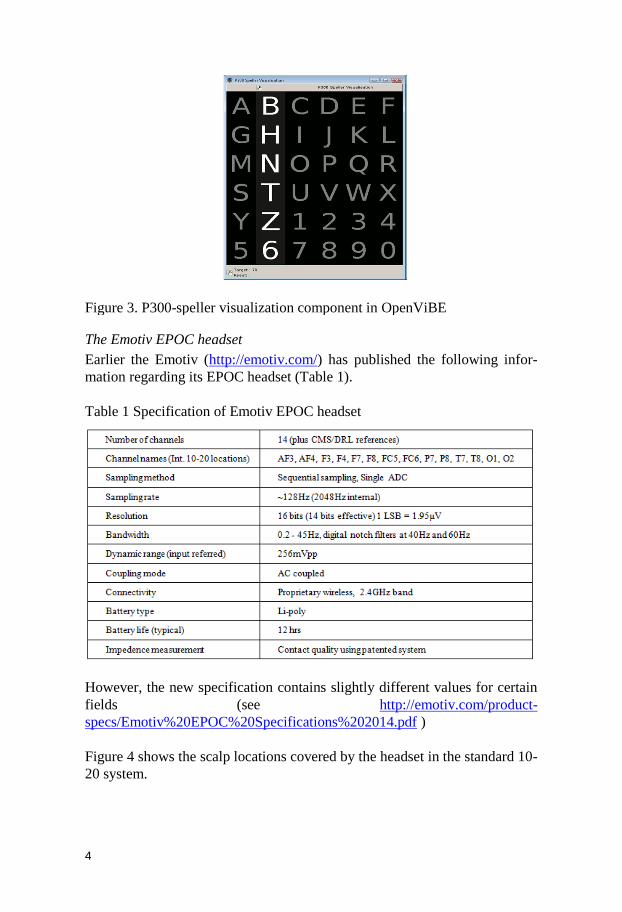
The Emotiv EPOC headset
Earlier the Emotiv (http://emotiv.com/) has published the following infor-
mation regarding its EPOC headset (Table 1).
Table 1 Specification of Emotiv EPOC headset
However, the new specification contains slightly different values for certain
fields (see http://emotiv.com/product-
specs/Emotiv%20EPOC%20Specifications%202014.pdf )
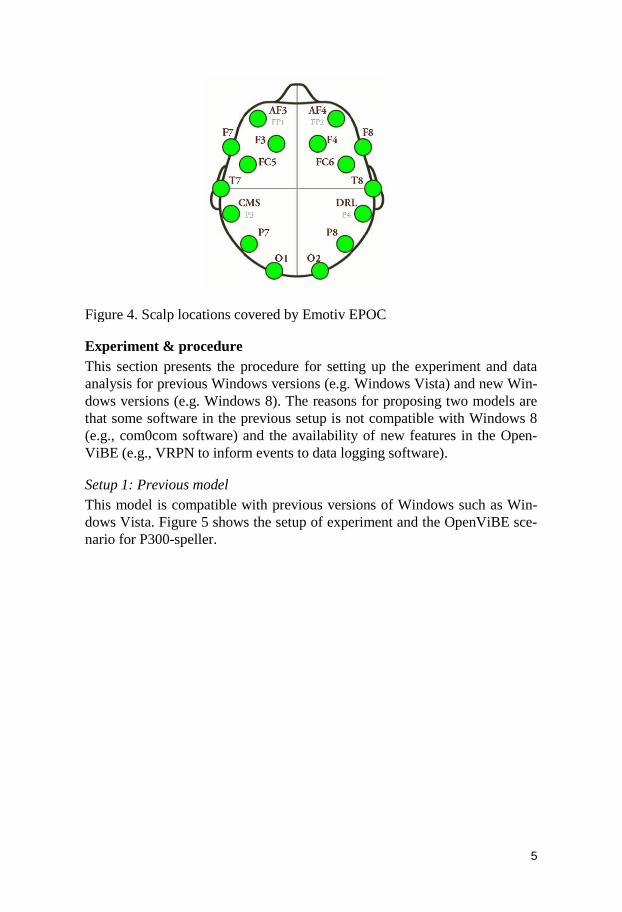
Figure 4 shows the scalp locations covered by the headset in the standard 10-
20 system.
5
Figure 4. Scalp locations covered by Emotiv EPOC
Experiment & procedure
This section presents the procedure for setting up the experiment and data
analysis for previous Windows versions (e.g. Windows Vista) and new Win-
dows versions (e.g. Windows 8). The reasons for proposing two models are
that some software in the previous setup is not compatible with Windows 8
(e.g., com0com software) and the availability of new features in the Open-
ViBE (e.g., VRPN to inform events to data logging software).
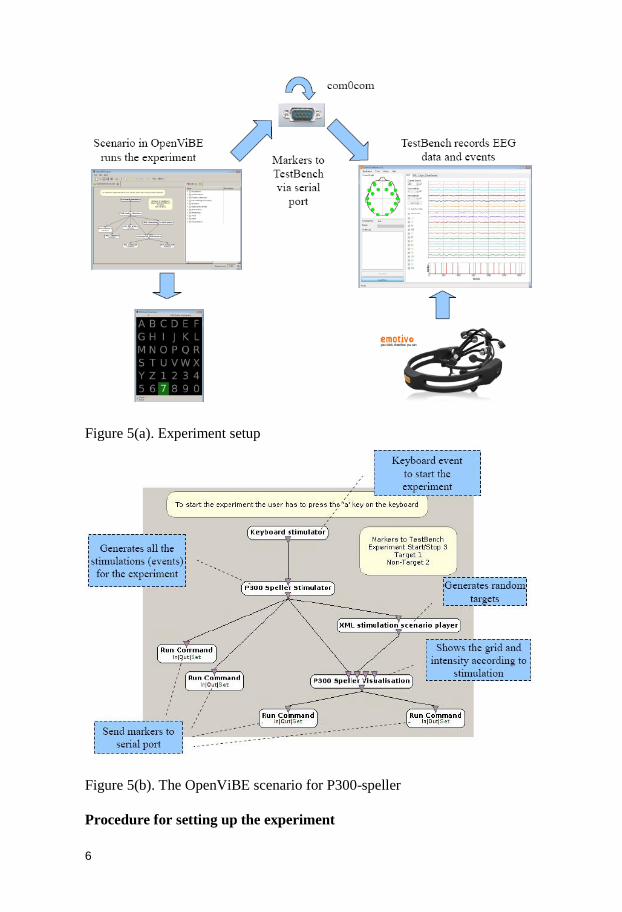
Setup 1: Previous model
This model is compatible with previous versions of Windows such as Win-
dows Vista. Figure 5 shows the setup of experiment and the OpenViBE sce-
nario for P300-speller.
6
Figure 5(a). Experiment setup
Figure 5(b). The OpenViBE scenario for P300-speller
Procedure for setting up the experiment

7
Download a previous version of OpenViBE (e.g., version 0.11.0, Aug.
2011) from http://openvibe.inria.fr/ and install
Download http://neurofeedback.visaduma.info/P300New.zip and unpack
the files
Open the file p300speller2.xml (file is in P300New) using the OpenViBE
menu
Double click on the box with the label “Target Letter Generation” and
setup the path of the Lua Script to p300-speller-target.lua which is in
P300New
Download and install the com0com null modem emulator from
http://sourceforge.net/projects/com0com/
Read the instructions and create a COM port pair in com0com, e.g.
COM1-COM2
Modify the windows environment variables’ path variable by including
the folder where the PortWrite.exe can be found (file is in P300New)
In the Emotiv TestBench (you received with the research edition) select
one of the ports in the created pair, e.g. COM1 (follow Marker > Con-
figure Serial Port)
Open the command prompt and type “PortWrite COM2 2”. If you have
successfully set up the path variable and COM port pair, you will see the
marker value 2 in the TestBench
Restart the OpenViBE and run the model p300speller2.xml (to run use the
start button in the OpenViBE designer; also you have to click on the
window with the title “keyboard stimulator” and press on the 'a' key on
the keyboard). Now, if you can see flashing rows and columns in the
OpenViBE visualization window and markers in the TestBench, your
first task is complete. Note that marker value 3 indicates the start of the
experiment; marker values 1s and 2s indicate targets and non-targets, re-
spectively.
Procedure for data analysis
The following procedure describes the steps of analyzing the EEG data using
MATLAB (tested with version 7.6.0, R2008a) and EEGLAB (downloaded
from http://sccn.ucsd.edu/eeglab/; tested with version 10.2.3.4b).
TestBench (e.g. version 1.5) records the data in an EDF file which is not
human readable. Therefore, the data needs to be converted into to CSV
format using the TestBench’s EDF to CSV converter tool in order to im-
port the data in EEGLAB for processing (Note: new versions of EE-
GLAB can import data from EDF files; however, the process is not de-
scribed here).
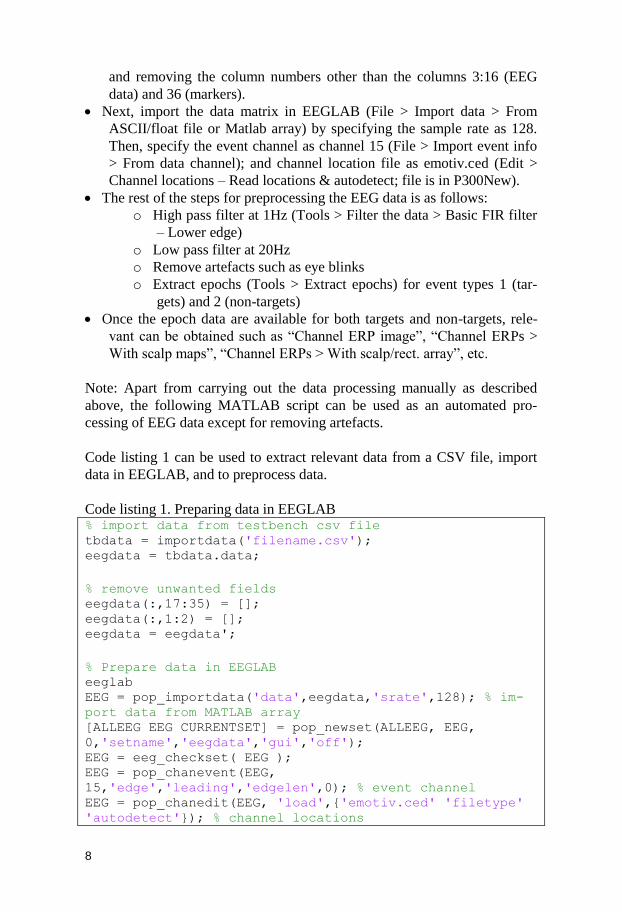
Next, it is required to extract the only the relevant fields (i.e., the 14
channels of EEG and markers) from the CSV file. This can be performed
in MATLAB by importing the data file into the workspace (as a matrix)
8
and removing the column numbers other than the columns 3:16 (EEG
data) and 36 (markers).
Next, import the data matrix in EEGLAB (File > Import data > From
ASCII/float file or Matlab array) by specifying the sample rate as 128.
Then, specify the event channel as channel 15 (File > Import event info
> From data channel); and channel location file as emotiv.ced (Edit >
Channel locations – Read locations & autodetect; file is in P300New).
The rest of the steps for preprocessing the EEG data is as follows:
o High pass filter at 1Hz (Tools > Filter the data > Basic FIR filter
– Lower edge)
o Low pass filter at 20Hz
o Remove artefacts such as eye blinks
o Extract epochs (Tools > Extract epochs) for event types 1 (tar-
gets) and 2 (non-targets)
Once the epoch data are available for both targets and non-targets, rele-
vant can be obtained such as “Channel ERP image”, “Channel ERPs >
With scalp maps”, “Channel ERPs > With scalp/rect. array”, etc.
Note: Apart from carrying out the data processing manually as described
above, the following MATLAB script can be used as an automated pro-
cessing of EEG data except for removing artefacts.
Code listing 1 can be used to extract relevant data from a CSV file, import
data in EEGLAB, and to preprocess data.
Code listing 1. Preparing data in EEGLAB % import data from testbench csv file tbdata = importdata('filename.csv'); eegdata = tbdata.data;
% remove unwanted fields eegdata(:,17:35) = []; eegdata(:,1:2) = []; eegdata = eegdata';
% Prepare data in EEGLAB eeglab EEG = pop_importdata('data',eegdata,'srate',128); % im-
port data from MATLAB array [ALLEEG EEG CURRENTSET] = pop_newset(ALLEEG, EEG,
0,'setname','eegdata','gui','off'); EEG = eeg_checkset( EEG ); EEG = pop_chanevent(EEG,
15,'edge','leading','edgelen',0); % event channel EEG = pop_chanedit(EEG, 'load',{'emotiv.ced' 'filetype'
'autodetect'}); % channel locations
9
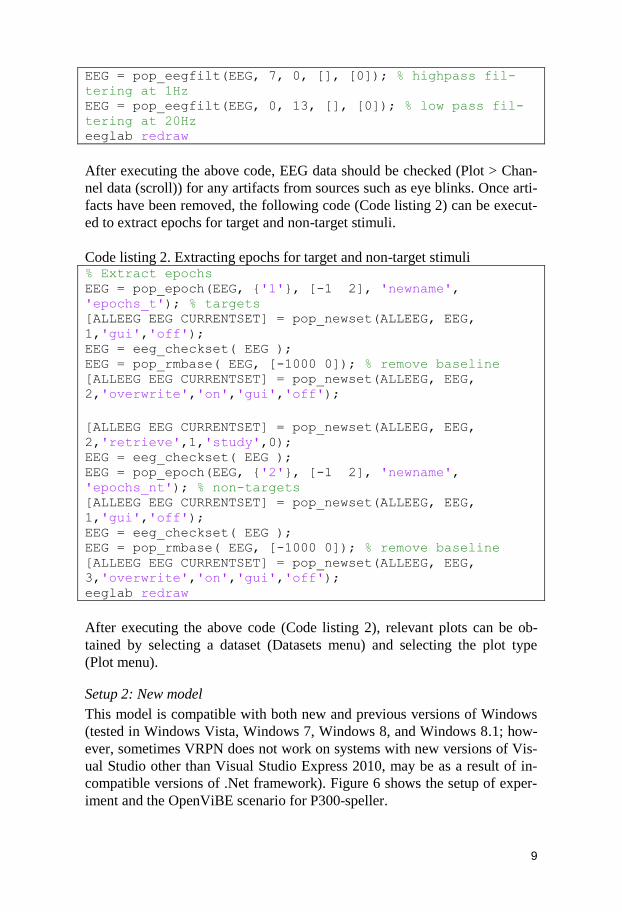
EEG = pop_eegfilt(EEG, 7, 0, [], [0]); % highpass fil-
tering at 1Hz EEG = pop_eegfilt(EEG, 0, 13, [], [0]); % low pass fil-
tering at 20Hz eeglab redraw
After executing the above code, EEG data should be checked (Plot > Chan-
nel data (scroll)) for any artifacts from sources such as eye blinks. Once arti-
facts have been removed, the following code (Code listing 2) can be execut-
ed to extract epochs for target and non-target stimuli.
Code listing 2. Extracting epochs for target and non-target stimuli % Extract epochs EEG = pop_epoch(EEG, {'1'}, [-1 2], 'newname',
'epochs_t'); % targets [ALLEEG EEG CURRENTSET] = pop_newset(ALLEEG, EEG,
1,'gui','off'); EEG = eeg_checkset( EEG ); EEG = pop_rmbase( EEG, [-1000 0]); % remove baseline [ALLEEG EEG CURRENTSET] = pop_newset(ALLEEG, EEG,
2,'overwrite','on','gui','off');
[ALLEEG EEG CURRENTSET] = pop_newset(ALLEEG, EEG,
2,'retrieve',1,'study',0); EEG = eeg_checkset( EEG ); EEG = pop_epoch(EEG, {'2'}, [-1 2], 'newname',
'epochs_nt'); % non-targets [ALLEEG EEG CURRENTSET] = pop_newset(ALLEEG, EEG,
1,'gui','off'); EEG = eeg_checkset( EEG ); EEG = pop_rmbase( EEG, [-1000 0]); % remove baseline [ALLEEG EEG CURRENTSET] = pop_newset(ALLEEG, EEG,
3,'overwrite','on','gui','off'); eeglab redraw
After executing the above code (Code listing 2), relevant plots can be ob-
tained by selecting a dataset (Datasets menu) and selecting the plot type
(Plot menu).
Setup 2: New model
This model is compatible with both new and previous versions of Windows
(tested in Windows Vista, Windows 7, Windows 8, and Windows 8.1; how-
ever, sometimes VRPN does not work on systems with new versions of Vis-
ual Studio other than Visual Studio Express 2010, may be as a result of in-
compatible versions of .Net framework). Figure 6 shows the setup of exper-
iment and the OpenViBE scenario for P300-speller.
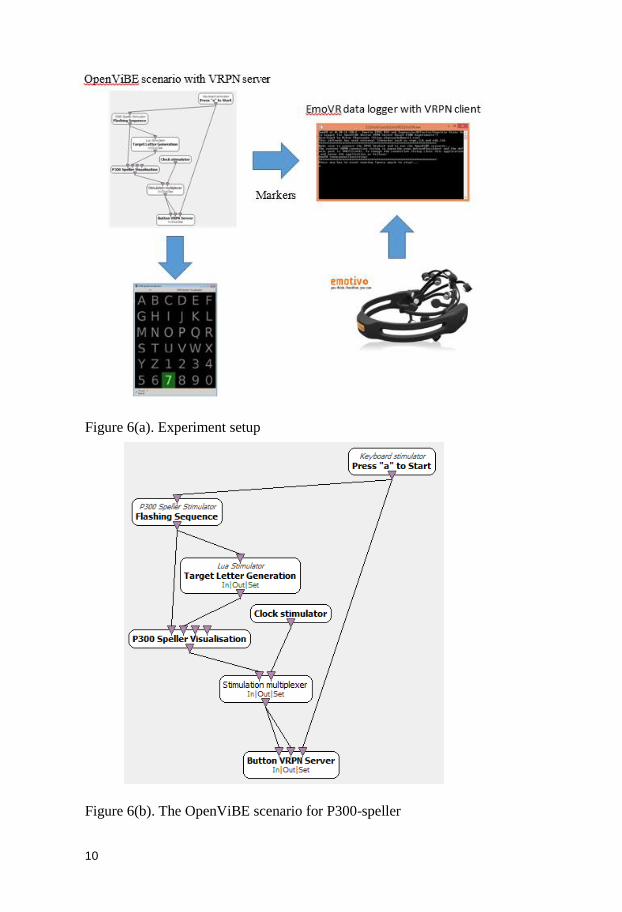
10
Figure 6(a). Experiment setup
Figure 6(b). The OpenViBE scenario for P300-speller
11
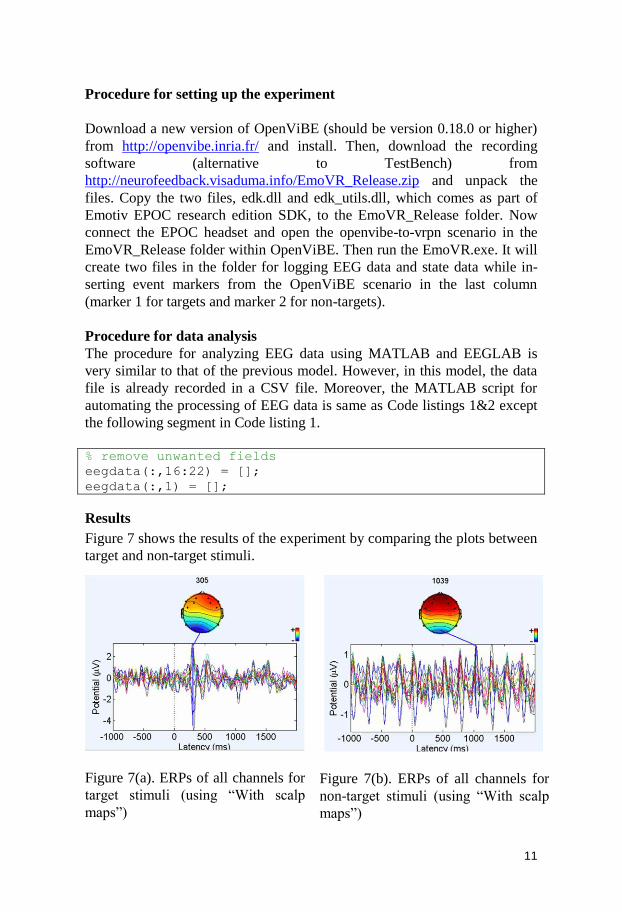
Procedure for setting up the experiment
Download a new version of OpenViBE (should be version 0.18.0 or higher)
from http://openvibe.inria.fr/ and install. Then, download the recording
software (alternative to TestBench) from
http://neurofeedback.visaduma.info/EmoVR_Release.zip and unpack the
files. Copy the two files, edk.dll and edk_utils.dll, which comes as part of
Emotiv EPOC research edition SDK, to the EmoVR_Release folder. Now
connect the EPOC headset and open the openvibe-to-vrpn scenario in the
EmoVR_Release folder within OpenViBE. Then run the EmoVR.exe. It will
create two files in the folder for logging EEG data and state data while in-
serting event markers from the OpenViBE scenario in the last column
(marker 1 for targets and marker 2 for non-targets).
Procedure for data analysis
The procedure for analyzing EEG data using MATLAB and EEGLAB is
very similar to that of the previous model. However, in this model, the data
file is already recorded in a CSV file. Moreover, the MATLAB script for
automating the processing of EEG data is same as Code listings 1&2 except
the following segment in Code listing 1.
% remove unwanted fields eegdata(:,16:22) = []; eegdata(:,1) = [];
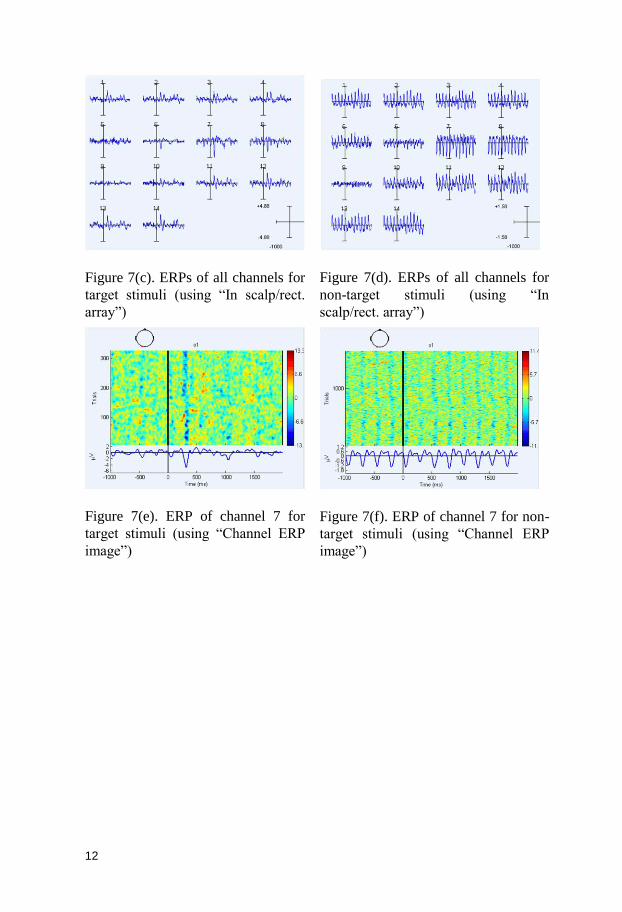
Results
Figure 7 shows the results of the experiment by comparing the plots between
target and non-target stimuli.
Figure 7(a). ERPs of all channels for
target stimuli (using “With scalp
maps”)
Figure 7(b). ERPs of all channels for
non-target stimuli (using “With scalp
maps”)
12
Figure 7(c). ERPs of all channels for
target stimuli (using “In scalp/rect.
array”)
Figure 7(d). ERPs of all channels for
non-target stimuli (using “In
scalp/rect. array”)
Figure 7(e). ERP of channel 7 for
target stimuli (using “Channel ERP
image”)
Figure 7(f). ERP of channel 7 for non-
target stimuli (using “Channel ERP
image”)
13
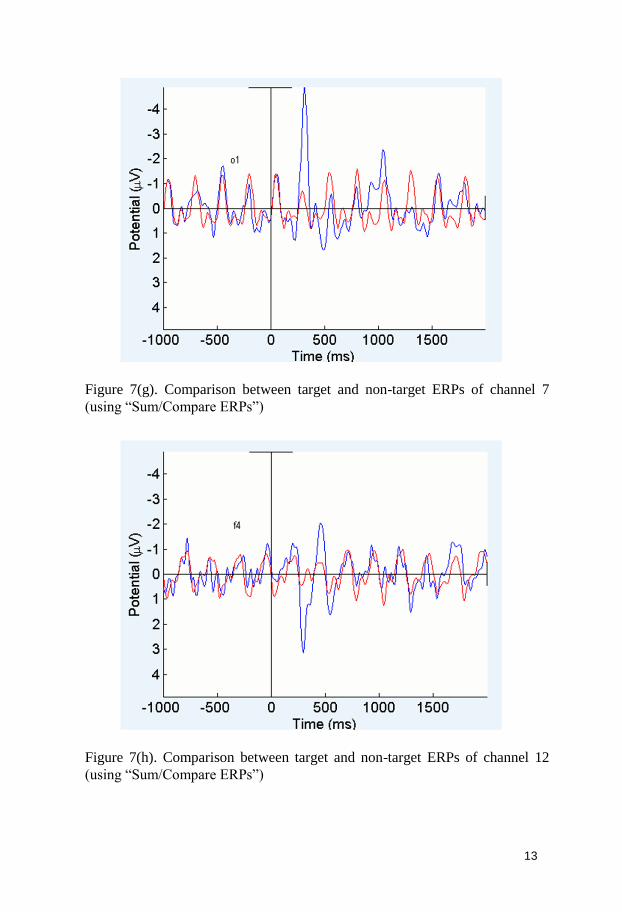
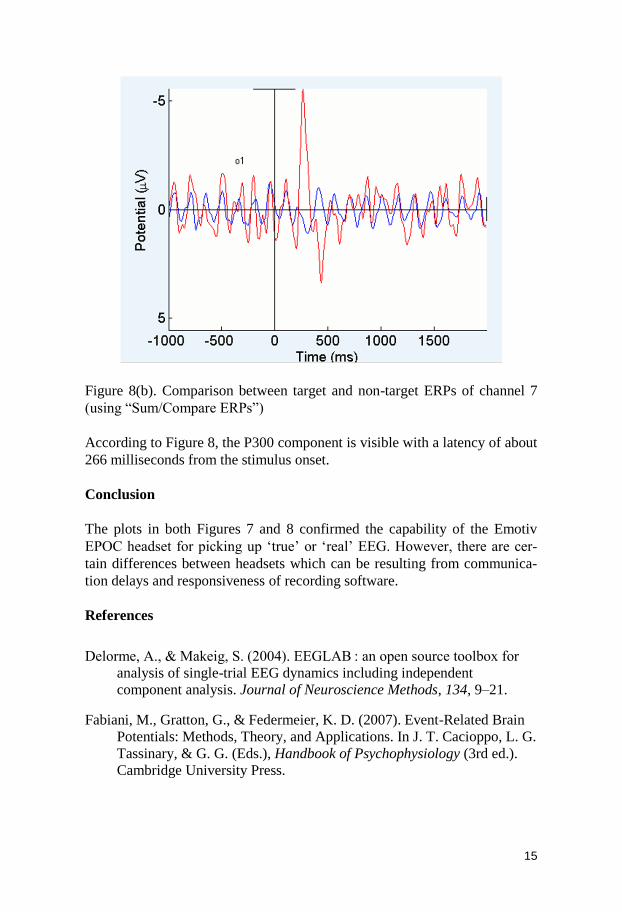
Figure 7(g). Comparison between target and non-target ERPs of channel 7
(using “Sum/Compare ERPs”)
Figure 7(h). Comparison between target and non-target ERPs of channel 12
(using “Sum/Compare ERPs”)
14
The plots in Figure 7 clearly differentiate the ERPs between target and non-
target stimuli. According to those plots, P300 component is visible with a
latency of about 305 milliseconds from the stimulus onset, and it is maxi-
mum and consistent (as in Figure 7(e)) in the regions of occipital lobe (i.e.,
o1 and o2).
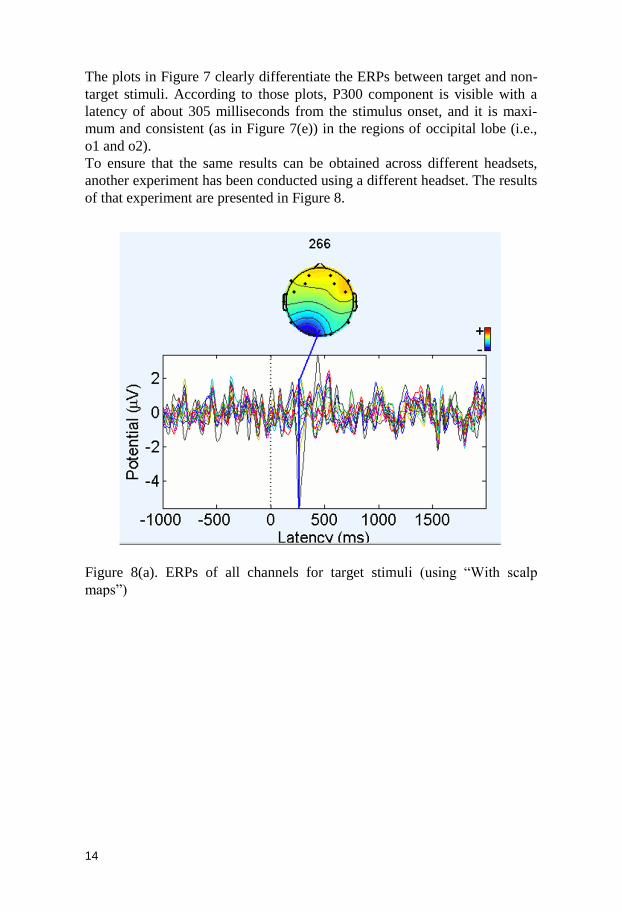
To ensure that the same results can be obtained across different headsets,
another experiment has been conducted using a different headset. The results
of that experiment are presented in Figure 8.
Figure 8(a). ERPs of all channels for target stimuli (using “With scalp
maps”)
15
Figure 8(b). Comparison between target and non-target ERPs of channel 7
(using “Sum/Compare ERPs”)
According to Figure 8, the P300 component is visible with a latency of about
266 milliseconds from the stimulus onset.
Conclusion
The plots in both Figures 7 and 8 confirmed the capability of the Emotiv
EPOC headset for picking up ‘true’ or ‘real’ EEG. However, there are cer-
tain differences between headsets which can be resulting from communica-
tion delays and responsiveness of recording software.
References
Delorme, A., & Makeig, S. (2004). EEGLAB : an open source toolbox for
analysis of single-trial EEG dynamics including independent
component analysis. Journal of Neuroscience Methods, 134, 9–21.
Fabiani, M., Gratton, G., & Federmeier, K. D. (2007). Event-Related Brain
Potentials: Methods, Theory, and Applications. In J. T. Cacioppo, L. G.
Tassinary, & G. G. (Eds.), Handbook of Psychophysiology (3rd ed.).
Cambridge University Press.
16
Farwell, L. A., & Donchin, E. (1988). Talking off the top of your head:
toward a mental prosthesis utilizing event-related brain potentials.
Electroencephalography and Clinical Neurophysiology, 70(6), 510–23.
Krusienski, D. J., Sellers, E. W., McFarland, D. J., Vaughan, T. M., &
Wolpaw, J. R. (2008). Toward enhanced P300 speller performance.
Journal of Neuroscience Methods, 167(1), 15–21.
doi:10.1016/j.jneumeth.2007.07.017
Makeig, S., Debener, S., Onton, J., & Delorme, A. (2004). Mining event-
related brain dynamics. Trends in Cognitive Sciences, 8(5), 204–10.
doi:10.1016/j.tics.2004.03.008
Sur, S., & Sinha, V. K. (2009). Event-related potential: An overview.
Industrial Psychiatry Journal, 18(1), 70–3. doi:10.4103/0972-
6748.57865
Tatum, W. O., Husain, A. M., Benbadis, S. R., & Kaplan, P. W. (2008).
Handbook of EEG interpretation. Demos Medical Publishing.
Teplan, M. (2002). Fundamentals of EEG measurement. Measurement
Science Review, 2, 1–11. Retrieved from
http://www.measurement.sk/2002/S2/Teplan.pdf