secondary one mathematics: an integrated … one mathematics: an integrated approach . get ready...
TRANSCRIPT

Secondary One Mathematics: An Integrated Approach
Get Ready Module
By
The Mathematics Vision Project: Scott Hendrickson, Joleigh Honey,
Barbara Kuehl, Travis Lemon, Janet Sutorius www.mathematicsvisionproject.org
In partnership with the Utah State Office of Education
1

© 2012 Mathematics Vision Project | MVP In partnership with the Utah State Office of Education
Licensed under the Creative Commons Attribution‐NonCommercial‐ShareAlike 3.0 Unported license.
Table of Contents – Getting Ready Module
Classroom Task: Checkerboard Borders ‐ A Develop Understanding Task Defining quantities and interpreting expressions (N.Q.2, A.SSE.1) Ready, Set, Go Homework: Getting Ready 1 Classroom Task: Building More Checkerboard Borders – A Develop Understanding Task Defining quantities and interpreting expressions (N.Q.2, A.SSE.1) Ready, Set, Go Homework: Getting Ready 2 Classroom Task: Serving Up Symbols – A Develop Understanding Task Interpreting expressions and using units to understand problems (A.SSE.1, N.Q.1) Ready, Set, Go Homework: Getting Ready 3 Classroom Task: Examining Units – A Solidify Understanding Task Using units as a way to understand problems (N.Q.1) Ready, Set, Go Homework: Getting Ready 4 Classroom Task: Cafeteria Actions and Reactions – A Develop Understanding Task Explaining each step in the process of solving an equation (A.REI.1) Ready, Set, Go Homework: Getting Ready 5 Classroom Task: Elvira’s Equations – A Solidify Understanding Task Rearranging formulas to solve for a variable (A.REI.3, A.CED.4) Ready, Set, Go Homework: Getting Ready 6 Classroom Task: Solving Equations, Literally – A Practice Understanding Task Solving literal equations (A.REI.1, A.REI.3, A.CED.4) Ready, Set, Go Homework: Getting Ready 7 Classroom Task: Cafeteria Conundrums – A Develop Understanding Task Writing inequalities to fit a context (A.REI.1, A.REI.3) Ready, Set, Go Homework: Getting Ready 8 Classroom Task: Greater Than? – A Solidify Understanding Task Reasoning about inequalities and the properties of inequalities (A.REI.1, A.REI.3) Ready, Set, Go Homework: Getting Ready 9 Classroom Task: Taking Sides – A Practice Understanding Task Solving linear inequalities and representing the solution (A.REI.1, A.REI.3) Ready, Set, Go Homework: Getting Ready 10 Classroom Task: Cafeteria Consumption and Cost – A Develop Understanding Task Organizing data into rectangular arrays or matrices (N.VM.6, N.VM.7, N.VM.8) Ready, Set, Go Homework: Getting Ready 11H
2

© 2012 Mathematics Vision Project | MVP In partnership with the Utah State Office of Education
Licensed under the Creative Commons Attribution‐NonCommercial‐ShareAlike 3.0 Unported license.
Classroom Task: Eating Up The Lunchroom Budget – A Solidify Understanding Task Multiplying matrices (N.VM.8) Ready, Set, Go Homework: Getting Ready 12H Classroom Task: The Arithmetic of Matrices – A Practice Understanding Task Practicing the arithmetic of matrices (N.VM.8) Ready, Set, Go Homework: Getting Ready 13H
3
©20
12 w
ww
.flic
kr.c
om/p
hoto
s/jim
a
Checkerboard Borders – Teacher Notes A Develop Understanding Task
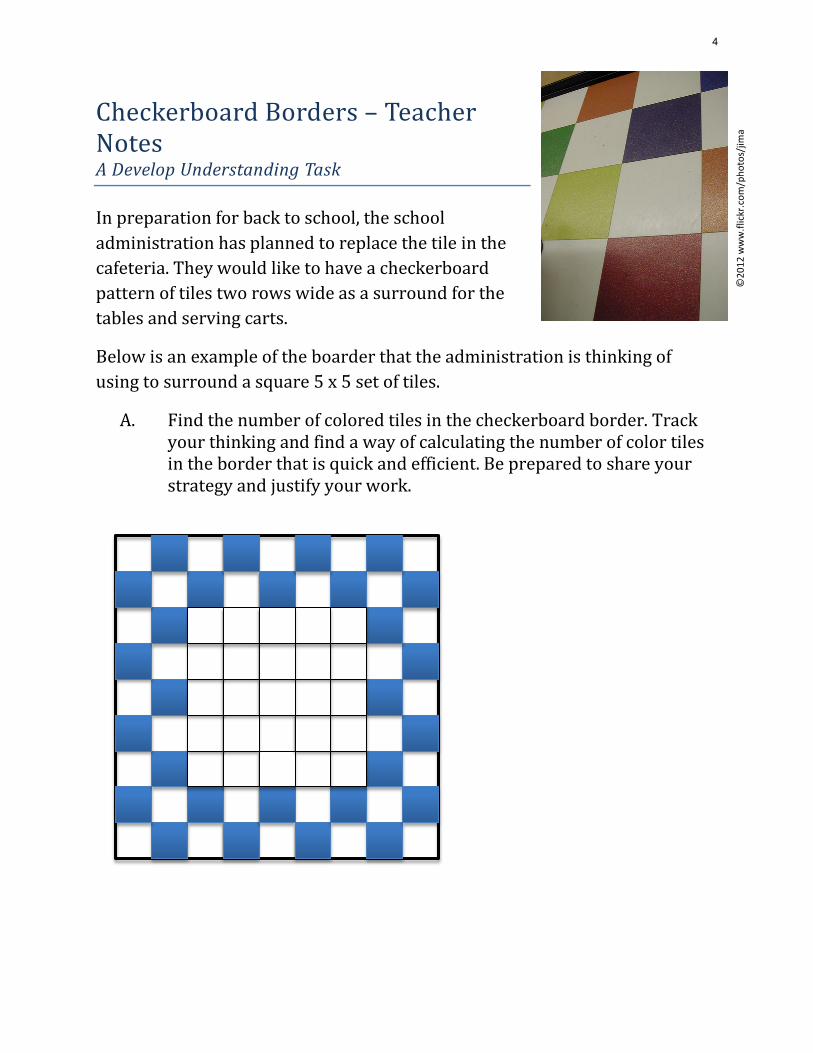
In preparation for back to school, the school administration has planned to replace the tile in the cafeteria. They would like to have a checkerboard pattern of tiles two rows wide as a surround for the tables and serving carts.
Below is an example of the boarder that the administration is thinking of using to surround a square 5 x 5 set of tiles.
A. Find the number of colored tiles in the checkerboard border. Track your thinking and find a way of calculating the number of color tiles in the border that is quick and efficient. Be prepared to share your strategy and justify your work.
4

B. The contractor that was hired to lay the tile in the cafeteria is trying to generalize a way to calculate the number of colored tiles needed for a checker board border surrounding a square of tiles with dimensions s x s. Find an expression for the number of colored border tiles needed for any s x s square center.
s
s
5
Teacher Notes
Purpose: The focus of this task is on the generation of multiple expressions that connect with the visuals provided for the checkerboard borders. These expressions will also provide opportunity to discuss equivalent expressions and review the skills students have previously learned surrounding simplifying of expressions and the use of variables.
Core Standards Focus:
N.Q.2 Define appropriate quantities for the purpose of descriptive modeling.
A.SSE.1 Interpret expressions that represent a quantity in terms of its context.★ a. Interpret parts of an expression, such as terms, factors, and coefficients. b. Interpret complicated expressions by viewing one or more of their parts as a single entity.
Related Standards: A.CED.2, A.REI.1
Launch (Whole Class):
After reading and discussing the “Checker Board Borders” scenario, challenge students to come up with a way to quickly count the number of colored tiles in the border. Have them create numeric expressions that exemplify their process and require them to connect their thinking to the visual representation of the tiles. The first phase of work should be done individually, allowing students to “see” the problem and patterns in the tiles in their own way. This will provide for more representations to be considered later. After students work individually for a few minutes on part A, then they can share with a partner and begin to develop additional ideas as a pair or assist each other in generalizing their strategy for part B.
Explore (Individual then pairs):
For students who don’t know where to begin, it may be useful to ask some starter questions like: “How many tiles are there along one side?”, “How can you count the tiles in groups rather than one-by-one?” Press on students to connect their numeric representations to the visual representation. You might ask, “How does that four in your number sentence connect to the visual representation?” Encourage students to mark on the visual or to redraw it so that it shows how they were thinking about it numerically. Watch for students who calculate the number of border tiles in different ways. Make note of their numeric strategies and the different generalized expressions that are created. The differing
6

strategies and algebraic expressions will be the focus of the discussion at the end, allowing for students to connect back to prior work from previous mathematical experiences and better understand equivalence between expressions and how to properly simplify an algebraic expression. Prompt students to calculate the number of tiles for a given side length using their expression and then to draw the visual model and check for accuracy. Require students to justify why their expression will work for any side length S of square inner region. Press them to generalize their justifications rather than just repeat the process they have been using. You might ask, “How do you know that expression will work for any side length?”, or “What is it about the nature of the pattern that suggests this will always work?”, or “What will happen if we look at a side length of six? ten? fifty-three?” Consider this both visually and in terms of the general expression. Note: Based on the student work and the difficulties they may or may not encounter, a determination will need to be made as to whether a discussion of part A of the task should be had prior to students working on part B. Working with a specific case may facilitate access to the general case for more students. However, if students are ready for whole class discussion of their general representations, then starting there will allow for more time to be spent on making connections between the different expressions and extending the task. [Teaching Practice #3: Select Student Thinking] As available, select students to present who found different ways of generalizing. Some possible ways students might “see” the colored tiles grouped are provided below. It would be good to have at least three different views to discuss and possibly more. Possible student strategies: 2 ( s + 4 ) + 2 s
4 ( s + 4 ) – 8
7
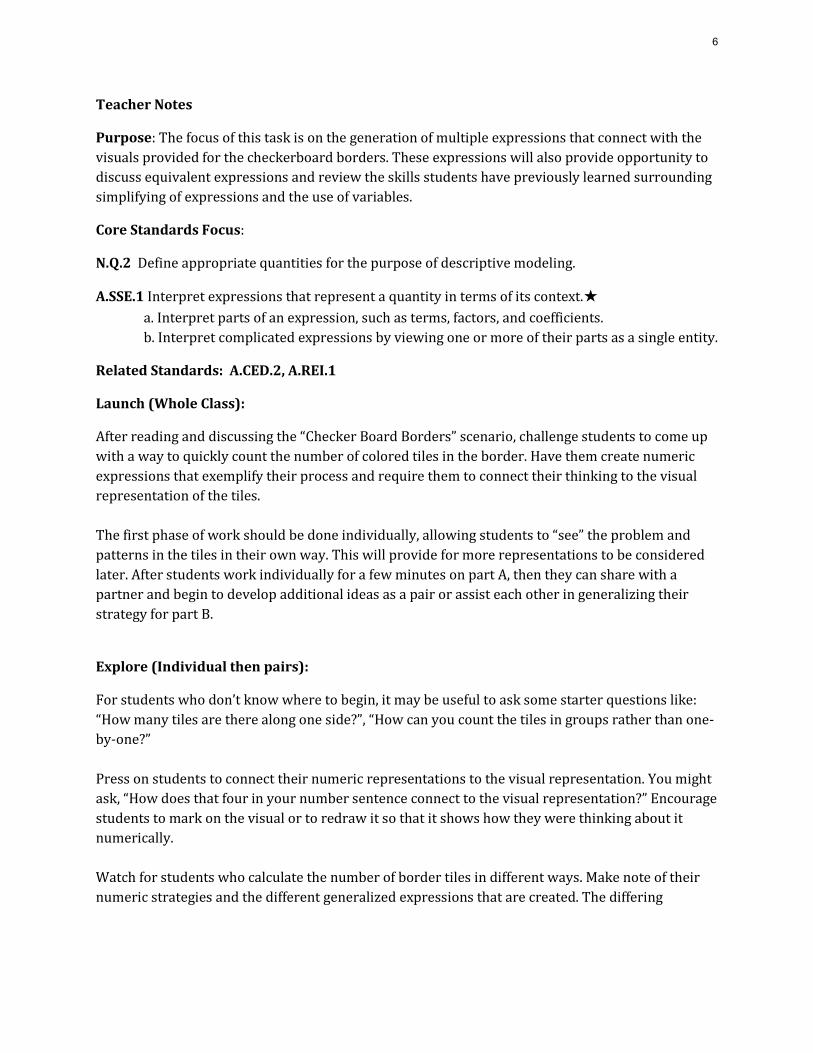
4 s + 8
Discuss (Whole Class):
Based on the student work available you will need to determine the order of the strategies to be presented. A likely progression would start with a strategy that does not provide the most simplified form of the expression. This will promote questioning and understanding from students that may have done it differently and allow for discussion about what each piece of the expression represents. After a couple of different strategies have been shared it might be good to get the most simplified form of the expression out and then look for an explanation as to how all of the expressions can be equivalent and represent the same thing in so many different ways. Aligned Ready, Set, Go: Getting Ready 1
8
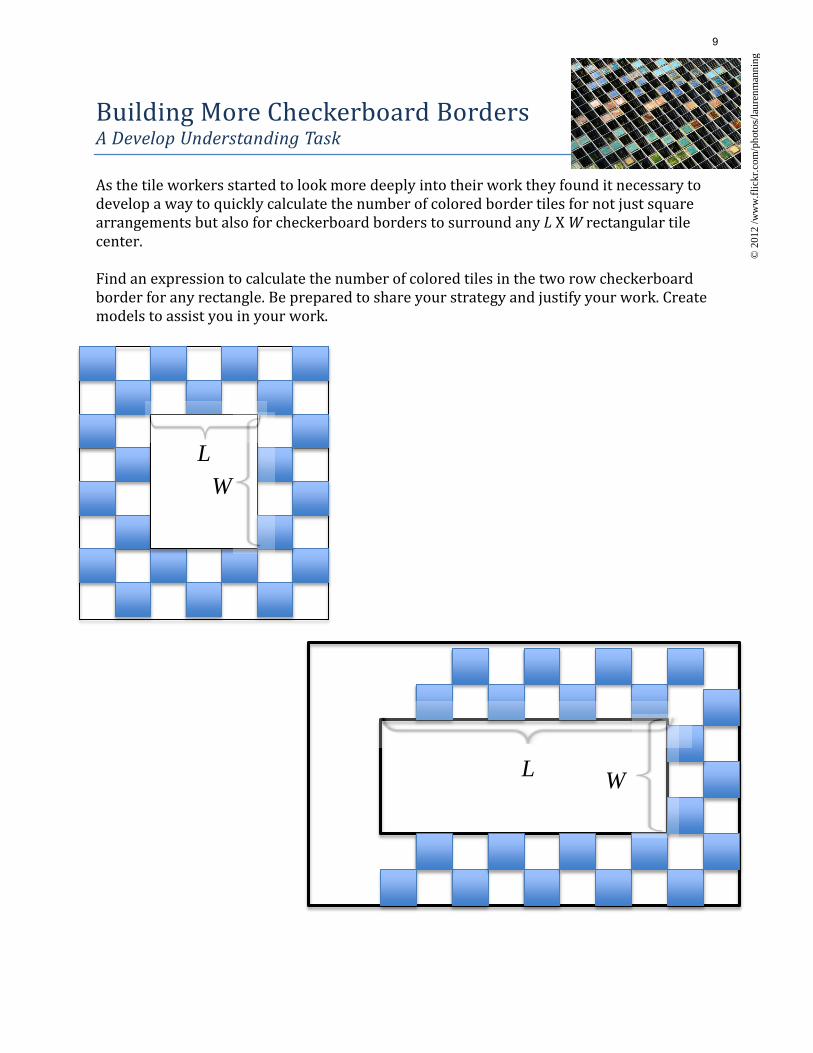
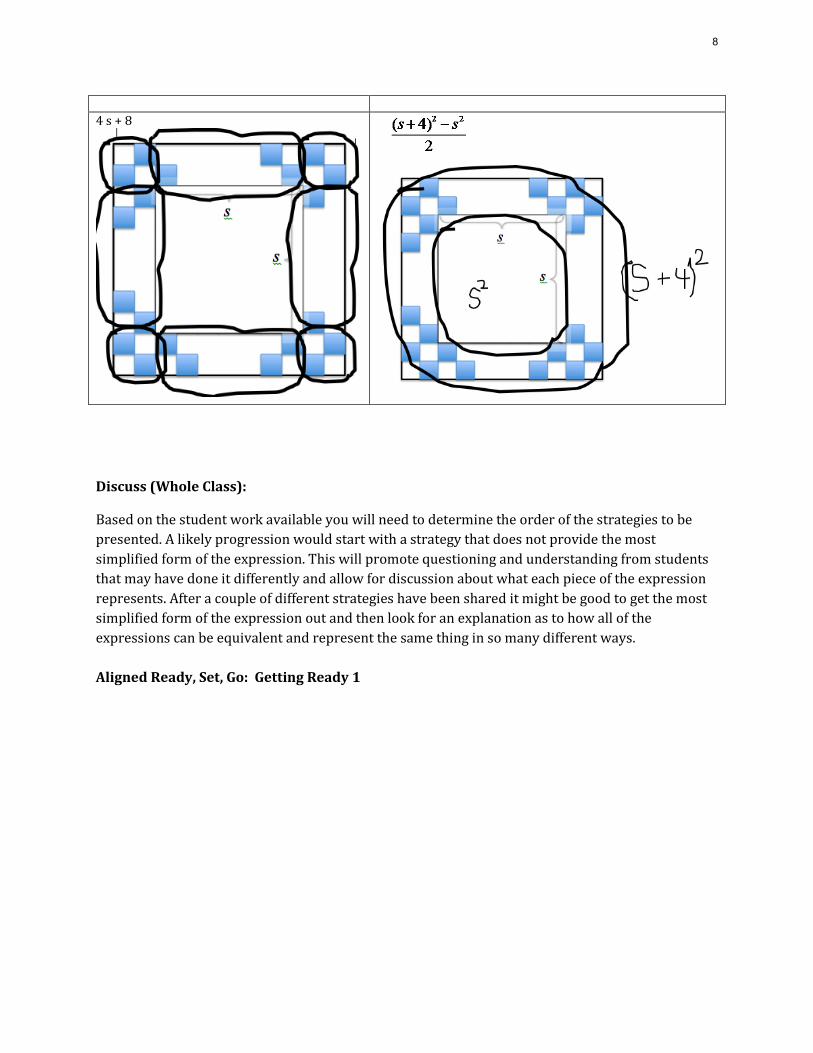
Building More Checkerboard Borders A Develop Understanding Task
As the tile workers started to look more deeply into their work they found it necessary to develop a way to quickly calculate the number of colored border tiles for not just square arrangements but also for checkerboard borders to surround any L X W rectangular tile center. Find an expression to calculate the number of colored tiles in the two row checkerboard border for any rectangle. Be prepared to share your strategy and justify your work. Create models to assist you in your work.
L W
L W ©
201
2 /w
ww
.flic
kr.c
om/p
hoto
s/la
uren
man
ning
9

More Checkerboard Borders - Teaching Notes
Purpose: Building on the previous task, the focus of this task is on the generation of multiple expressions that connect with the visuals provided for the checkerboard borders. These expressions will also provide opportunity to discuss the incorporation of two variables, in this case L and W. This task could be used the same day as the Checkerboard Borders task or the following day based on students’ needs. Core Standards Focus: CCSSM Integrated Pathway Math 1: Critical Area 2 “. . . interpret given [expressions] graphically, numerically, symbolically, and verbally, translate between representations, and understand the limitations of various representations. “ N.Q.2 Define appropriate quantities for the purpose of descriptive modeling. A.SSE.1 Interpret expressions that represent a quantity in terms of its context.★ a. Interpret parts of an expression, such as terms, factors, and coefficients. b. Interpret complicated expressions by viewing one or more of their parts as a single entity. Related Standards: A.CED.2, A.REI.1 Launch (Whole Class): After reading and discussing the “Building More Checkerboard Borders” scenario, challenge students to come up with a way to count the number of colored tiles in the border. Allow students time to work individually for a few minutes to allow them time to reflect on their work in the previous task and develop an algebraic expression. Explore (Small Group): For students who don’t know where to begin, it may be useful to ask some starter questions like, “How did you find the number of colored tiles in ‘Checkerboard Borders’?” or “How do the number of colored tiles along one side of the rectangle compare with the length of that side?” Press on students to connect their algebraic representations to the visual representation. You might ask, “How does that two in your number sentence connect to the visual representation?” Encourage students to mark on the visual or to redraw it so that it shows how they were thinking about it numerically. Watch for students who calculate the colored border tiles in different ways. Make note of their strategies and the different generalized expressions that are created. The differing strategies and algebraic expressions will be part of the discussion at the end, allowing for students to connect back to prior work from previous mathematical experiences and better understand equivalence between expressions and how to properly simplify an algebraic expression. Prompt students to calculate the number of tiles for given a length and width using their expression and then to draw the visual model and check for accuracy. Require students to justify why their expression will work for any length L and width W of square inner region. Press them to generalize their justifications rather than just repeat the process they have been using. You might ask, “How do you know that
10

expression will work for any side length?”, or “What is it about the nature of the pattern that suggests this will always work?”, “What will happen if we look at a side length of six and a width of 9? ten? fifty-three?” Consider this both visually and in terms of the general expression. Discuss (Whole Class): As available, select students to present who found different ways of generalizing. Some possible ways students might “see” the colored tiles grouped are provided below. It would be good to have at least three different views to discuss and possibly more. Possible student strategies: (these can be comparable to those in Checkerboard Borders) 2 ( L + 4 ) + 2 W
2 ( L + 4 ) + 2 ( W + 4 ) - 8
2L + 2W + 8
Aligned Ready, Set, Go: Getting Ready 2
11

© 2012 Mathematics Vision Project | MVP
In partnership with the Utah State Office of Education Licensed under the Creative Commons Attribution-NonCommercial-ShareAlike 3.0 Unported license.
Serving Up Symbols A Develop Understanding Task
As you look around your school cafeteria, you may see many things that could be counted or
measured. To increase the efficiency of the cafeteria, the cafeteria manager, Elvira, decided to take
a close look at the management of the cafeteria and think about all the components that affect the
way the cafeteria runs. To make it easy, she assigned symbols for each count or measurement that
she wanted to consider, and made the following table:
Symbol Meaning S Number of students that buy lunch in the cafeteria each
day SC Average number of students per class that eat lunch each
day SM Number of students who have passed through a line in M
minutes C Number of classes per lunch period P Number of lunch periods per day B Number of boys that buy lunch each day G Number of girls that buy lunch each day F Number of food servers in the cafeteria T Total number of food items in one lunch (Each entrée, side
dish, or beverage counts as 1 item.) M Number of minutes passed since the beginning of the lunch
period Ne Number of entrees in each lunch Ns Number of side dishes in each lunch Nb Number of beverages in each lunch Ce Cost of each entrée Cs Cost of each side dish Cb Cost of each beverage L Number of lines in the cafeteria W The number of food workers (servers) per line i Average number of food items that a worker can serve each
minute (Each entrée, side dish, or beverage counts as 1 item.)
H Number of hours each food worker works each day PL Price per lunch
©2
01
2 w
ww
.flic
kr.c
om
/ph
oto
s/sp
ecia
lkrb
12

© 2012 Mathematics Vision Project | MVP
In partnership with the Utah State Office of Education Licensed under the Creative Commons Attribution-NonCommercial-ShareAlike 3.0 Unported license.
Using the given symbols, it is possible to write many different algebraic expressions.
1. Using these symbols, what would the expression
mean?
2. Using these symbols, what would the expression S + F + L mean?
Elvira hopes to use the symbols in the chart to come up with some meaningful expressions that will
allow her to analyze her cafeteria. Your job is to help her by writing as many expressions as you
can and describe what they mean. Put each of your expressions in the following chart, adding lines
if you need to:
Expression Description
Write an expression for the average number of lunches served in a line each day.
Write an expression for the total price of the items served in a line.
13

© 2012 Mathematics Vision Project | MVP
In partnership with the Utah State Office of Education Licensed under the Creative Commons Attribution-NonCommercial-ShareAlike 3.0 Unported license.
Serving Up Symbols – Teacher Notes
Purpose: The purpose of the task is to develop understanding of the use of variables given a story
context. Students are asked to interpret expressions written with variables, which will open up
strategies for using units to analyze expressions. Students will also combine variables to make
meaningful expressions and describe the meaning of the expressions that they have written.
Core Standards:
A.SSE.1: Interpret expressions that represent a quantity in terms of its context. a. Interpret parts of an expression, such as terms, factors, and coefficients. b. Interpret complicated expressions by viewing one or more of their parts as a single entity. For example, interpret P(1+r)n as the product of P and a factor not depending on P. N.Q.1: Use units as a way to understand problems and to guide the solution of multi-step problems;
choose and interpret units consistently in formulas.
Launch (Whole Class): Start by familiarizing students with the context of the problem. Before giving the
task to students, ask them to think of some of the things that could be counted or measured in the
cafeteria. Hand out the task and ask them to read through the list of variables identified by the cafeteria
manager to see if they can find the things that they thought of. You may need to explain the use of
subscripts for some of the variables, since many students may not have used them previously.
Introduce students to the idea that variables can be combined to make meaningful expressions. Using
question #1, ask students what the expression
means. Help students to break down the various
parts of the expression. In this case, G + B represents the number of students that eat lunch in the
cafeteria each day. Since C represents the number of classes per lunch period and P represents the
number of lunch periods, C×P represents the number of classes and the expression
represents the
average number of students served lunches per class.
Give students a few minutes to think individually about the meaning of #2, S + F + L. After they have
translated each of the variables, ask what they believe the sum of these expressions means. They
should recognize that the expression formed by adding these variables doesn’t make sense.
Introduce their task, which is to write as many meaningful expressions as they can. As they have seen in
#2, they must be careful to combine the variables with operations that make sense in the context.
Explore (Small Group or Pairs): Assign students to work on the remainder of the task. Monitor their
work, pressing students to make sense of each expression they write. Encourage students to use as
many of the variables as they can in their expressions. Be prepared to record interesting expressions
and their descriptions so that they can be used later in the discussion.
14
© 2012 Mathematics Vision Project | MVP
In partnership with the Utah State Office of Education Licensed under the Creative Commons Attribution-NonCommercial-ShareAlike 3.0 Unported license.
Discuss (Whole Group): Using the expressions that students have written, facilitate the first part of the
discussion by giving several expression, one at a time, and asking the whole class to interpret them.
Switch to giving the students several descriptions that student have written and see if the class can
come up with an expression that goes with it. Ask students to volunteer the most complicated
meaningful expression they could create.
Close the discussion with the last two questions. There may be several different expressions for each of
the questions. If this occurs, ask students if the expressions are equivalent, and how they know.
Aligned Ready, Set, Go: Getting Ready 3
15

Examining Units A Solidify Understanding Task
(Note: This task refers to the same set of variables as used in Serving Up Symbols) Units in Addition and Subtraction
1. Why can you add Ne + Ns + Nb and you can add B + G, but you can’t add M + W?
2. We measure real-world quantities in units like feet, gallons, students and miles/hour (miles per hour).
a. What units might you use to measure Ne, Ns and Nb? What about the sum Ne + Ns + Nb ?
b. What units might you use to measure B? G? What about the sum B + G?
c. What units might you use to measure M? W? What about the sum M + W?
3. State a rule about how you might use units to help you think about what types of quantities can
be added. How would you use or modify your rule to fit subtraction? Units in Multiplication, scenario 1
1. Why can you multiply Ne×Ce and you can multiply L×W, but you can’t multiply G×C?
2. Units in multiplication often involve rates like miles/gallon (miles per gallon), feet/second (feet per second), or students/table (students per table).
a. What units might you use to measure Ne? Ce? What about the product Ne×Ce ?
b. What units might you use to measure L? W? What about the product L×W?
c. What units might you use to measure G? C? What about the product G×C?
3. State a rule about how you might use units to help you think about what types of quantities can
be multiplied.
© 2
012
ww
w.fl
ickr
.com
/pho
tos/
mah
iskal
i 16

Units in Multiplication, scenario 2
1. Let l represent the length of the cafeteria in feet and w represent its width in feet. What does l + w + l + w represent? What about l × w?
2. Why can we add l + w and multiply l × w? What is it about these variables that allow them to be added or multiplied?
3. How might you modify you rule for using units to guide your thinking when multiplying?
Units in Division, scenario 1
1. What are the units for the dividend (what you are dividing up), the divisor (what you are dividing by) and the quotient (the result of the division) in the following expressions:
a.
b.
c.
SF
d.
SM
M
2. State a rule about the units in division problems like those represented above. Units in Division, scenario 2
1. What are the units for the dividend (what you are dividing up), the divisor (what you are dividing by) and the quotient (the result of the division) in the following expressions:
a.
b.
PL
T
2. State a rule about the units in division problems like those represented above.
SP
FL
FW
17

Examining Units – Teacher Notes A Solidify Understanding Task
Purpose: Quantities are measured in units. When quantities are added, subtracted, multiplied or divided the units on the result of the operation may be different from the units used to measure the individual quantities. The new units formed are a consequence of the meaning of the operations. For example, if the amount of gasoline I put in my car is measured in gallons, and the distance I travel when using up that amount of gasoline is measured in miles, then a new unit of measure, miles per gallon, emerges to measure the efficiency of my car’s usage of gasoline. This is a result of dividing the number of gallons of gasoline used by the number of miles driven. In this task students solidify the use of units as a tool for understanding problems and as a guide for determining what operations make sense when combining quantities using the four basic arithmetic operations.
Core Standards Focus:
N.Q.1 Use units as a way to understand problems and to guide the solution of multi-step problems; choose and interpret units consistently in formulas.
Related Standards: N.Q.2, A.SSE.1
Launch (Whole Class):
Provide a model for the type of thinking expected of students on this task by working through the first section of the task, “Units in Addition and Subtraction”, together as a class. The key idea to emerge here is that we have to measure quantities with “like” units before we can add or subtract them. For example, we may refer to the quantities represented by Ne as “entrées”, Ns as “side dishes” and Nb as “beverages” when thought of separately, but we think of them as “items” when we consider their sum. Similarly we might refer to the quantity represented by B as “boys” and G as “girls”, but we measure the sum B+G as “students” or ”people”. In order to add or subtract quantities we have to be able to reconsider them in terms of “like” units such as people, or items, or fruits (as in 2 apples + 3 oranges = 5 fruits).
As students consider the operations of multiplication and division in the remainder of the task, encourage them to write out the units on each factor or term. They will have to carefully assign, and maybe reassign, units to the quantities being represented by the “Serving up Symbols” variables. For example, in various contexts the variable B may be measured with the units “boys”, “students” or “boys per day”.
18

Explore (Small Group):
Key issues for students to notice about units in multiplication: Unlike addition, the two factors in multiplication generally play different roles. Sometimes one factor specifies the number of groups, and the other factor specifies the amount in the group. In terms of units, the factor that represents the number of groups is generally a single unit, such as “lines” or “hours”; the unit on the factor that represents the amount in a group is generally a rate, such as “workers per line” or “items per hour”. Sometimes the two factors each represent different rates, and the product describes a third rate. Other times the factors might represent linear units, and then the product represents square units. In each case, there has to be some common unit that “cancels” or makes sense when multiplied by itself as a square or cubic unit.
• We can multiply (Ne entrées/lunch) × (Ce dollars/entrée) and the product will be measured in dollars/lunch.
• We can multiply (L lines × W workers/line) and the product will be measured in workers. • We cannot multiply (G girls/day × C classes/lunch period). • We can multiply (l feet) × (w feet) and the product is measured in square feet.
Key issues for students to notice about units in division: When a dividend is measured with a single unit such as “miles” or “students” and the divisor is measured by a single unit like “hours” or “serving lines” or “teachers” the quotient can represent a rate (miles per hour), an average (people per serving line) or a ratio (students per teacher).
We can divide a unit of measure by a rate involving that unit of measure, providing the unit of measure will “cancel”.
• We can divide S students by P lunch periods and the quotient will measure the average number of students per lunch period.
• We can divide F servers by L lines and the quotient will measure the average number of servers per line.
• We can divide S students by F food servers and the quotient will measure the ratio of students per food server.
• We can divide SM students by M minutes and the quotient will measure the rate of students per minute.
• We can divide F servers by W servers/line and the quotient will determine the number of lines. • We can divide PL dollars/lunch by T items/lunch and the quotient will give the average
dollars/item.
Discuss (Whole Class):
The discussion should examine the key issues listed above.
Aligned Ready, Set, Go: Getting Ready 4
19

© 2012 Mathematics Vision Project | MVP In partnership with the Utah State Office of Education
Licensed under the Creative Commons Attribution‐NonCommercial‐ShareAlike 3.0 Unported license.
Cafeteria Actions and Reactions A Develop Understanding Task
Elvira, the cafeteria manager has just received a shipment of new
trays with the school logo prominently displayed in the middle of the tray. After unloading 4 cartons of trays in the pizza line, she realizes that students are arriving for lunch and she will have to
wait until lunch is over before unloading the remaining cartons. The new trays are very popular and in just a couple of minutes 24 students have passed through the pizza line and are showing off the school logo on the trays. At this
time, Elvira decides to divide the remaining trays in the pizza line into 3 equal groups so she can also place some in the salad line and the sandwich line, hoping to attract students to the other lines. After doing so, she realizes that each of the three serving lines has only 12 of the new trays.
“That’s not many trays for each line. I wonder how many trays there were in each of the cartons I
unloaded?”
1. Can you help the cafeteria manager answer her question using the data in the story about each of the actions she took? Explain how you arrive at your solution.
Elvira is interested in collecting data about how many students use each of the tables during each lunch period. She has recorded some data on Post‐It Notes to analyze later. Here are the notes she has
recorded:
• Some students are sitting at the front table. (I got distracted by an incident in the back of the lunchroom, and forgot to record how many students.)
• Each of the students at the front table has been joined by a friend, doubling the number of
students at the table.
• Four more students have just taken seats with the students at the front table.
• The students at the front table separated into three equal‐sized groups and then two groups left, leaving only one‐third of the students at the table.
• As the lunch period ends, there are still 12 students seated at the front table.
©20
12 www.flickr.com
/pho
toskolya
20

© 2012 Mathematics Vision Project | MVP In partnership with the Utah State Office of Education
Licensed under the Creative Commons Attribution‐NonCommercial‐ShareAlike 3.0 Unported license.
Elvira is wondering how many students were sitting at the front table when she wrote her first note. Unfortunately, she is not sure what order the middle three Post‐It Notes were recorded in since they got
stuck together in random order. She is wondering if it matters.
2. Does it matter which order the notes were recorded in? Determine how many students were originally sitting at the front table based on the sequence of notes that appears above. Then rearrange the middle three notes in a different order and determine what the new order implies about the number of students seated at the front table at the beginning.
3. Here are three different equations that could be written based on a particular sequence of
notes. Examine each equation, and then list the order of the five notes that is represented by each equation. Find the solution for each equation.
•
•
•
21

© 2012 Mathematics Vision Project | MVP In partnership with the Utah State Office of Education
Licensed under the Creative Commons Attribution‐NonCommercial‐ShareAlike 3.0 Unported license.
Cafeteria Actions and Reactions – Teacher Notes A Develop Understanding Task
Purpose: In this task students will develop insights into how to extend the process of solving
equations—which they have examined previously for one‐ or two‐step equations—to work with multistep equations. The process of solving an equation consists of writing a sequence of equivalent equations until the value(s) that make each of the equations in the sequence true becomes evident.
Each equation in the sequence of equivalent equations is obtained by operating on the expressions on each side of the previous equation in the same way, such as multiplying both sides of the equation by the same amount, or adding the same amount to both sides of the equation. This property of equality is
often referred to as “keeping the equation in balance.” Our goal in each step of the equation solving process is to make the next equivalent equation contain fewer operations than the previous one by “un‐doing” one operation at a time. When there are multiple operations involved in an equation, the order
in which to “un‐do” the operations can be somewhat problematic. This task examines ways to determine the sequence of “un‐do‐it” steps by using the structure of the equation.
Core Standards Focus:
A.REI.1 Explain each step in solving a simple equation as following from the equality of numbers
asserted at the previous step, starting from the assumption that the original equation has a solution. Construct a viable argument to justify a solution method.
Related Standards: A.REI.3
Launch (Whole Class):
Read the initial story context about Elvira, the cafeteria manager, and the sequence of events that led to “twelve new trays in each of three serving lines” and challenge students to “un‐do” the actions that got
her to this situation to see if they can answer Elvira’s question of “how many trays were in each carton?” Give students a few minutes to work individually or with a partner to analyze this situation, then have a student share his or her thinking.
Record the steps of the explanation of how to find the number of trays in a carton for use in a few
minutes:
• Since there are now twelve trays in each of three serving lines, there must have been 36 trays before Elvira divided them up.
• Since 24 students removed trays after lunch period started, there must have been 36+24=60 trays that were unloaded.
• Since the 60 trays came from 4 cartons, there must have been 15 trays in each carton.
22

© 2012 Mathematics Vision Project | MVP In partnership with the Utah State Office of Education
Licensed under the Creative Commons Attribution‐NonCommercial‐ShareAlike 3.0 Unported license.
Now propose that the story of Elvira’s “actions” could have been represented by the following sequence of equivalent equations, and have students connect each equation in the sequence to the appropriate
action:
Let This represents the number of trays in each carton.
This would represent the number of trays unloaded from four cartons.
This would represent the remaining trays after 24 students passed through the line.
This would represent the number of trays in each of the three lines.
This last equation represents a multi‐step equation. Have students pretend that we do not know the solution for x. Have them discuss with a partner how they could look at this equation and “see” the
steps listed on the board for “un‐doing” the story, as represented by the numbers and operations in this equation. Have students share what they have noticed, then have them work on the second situation with Elvira and the Post‐It Notes.
Explore (Small Group):
Encourage students to do the same thing with the 5 Post‐It Notes that they did with the serving trays
scenario. That is, they should write out the steps of reasoning that would help them work backwards to the solution. Have them then change the order of the middle three Post‐It Notes and solve the situation
again. Ask, did the order matter?
Listen for how students are making decisions about which order the notes were arranged in for each of the three different equations listed in problem 3.
Discuss (Whole Class):
The discussion should focus on question 3 and how students can recognize the order of events that got to “still 12 students seated at the front table.” Once they can see how the sequence of events unfolded,
they should be able to determine how to reverse the sequence of events. It may be necessary to write out the list of events and “un‐do‐it” explanations for each problem, similar to what was done in the launch.
Aligned Ready, Set, Go: Getting Ready 5
23
© 2
012
ww
w.fl
ickr
.com
/pho
tos/
oreg
ondo
t
Elvira’s Equations A Solidify Understanding Task
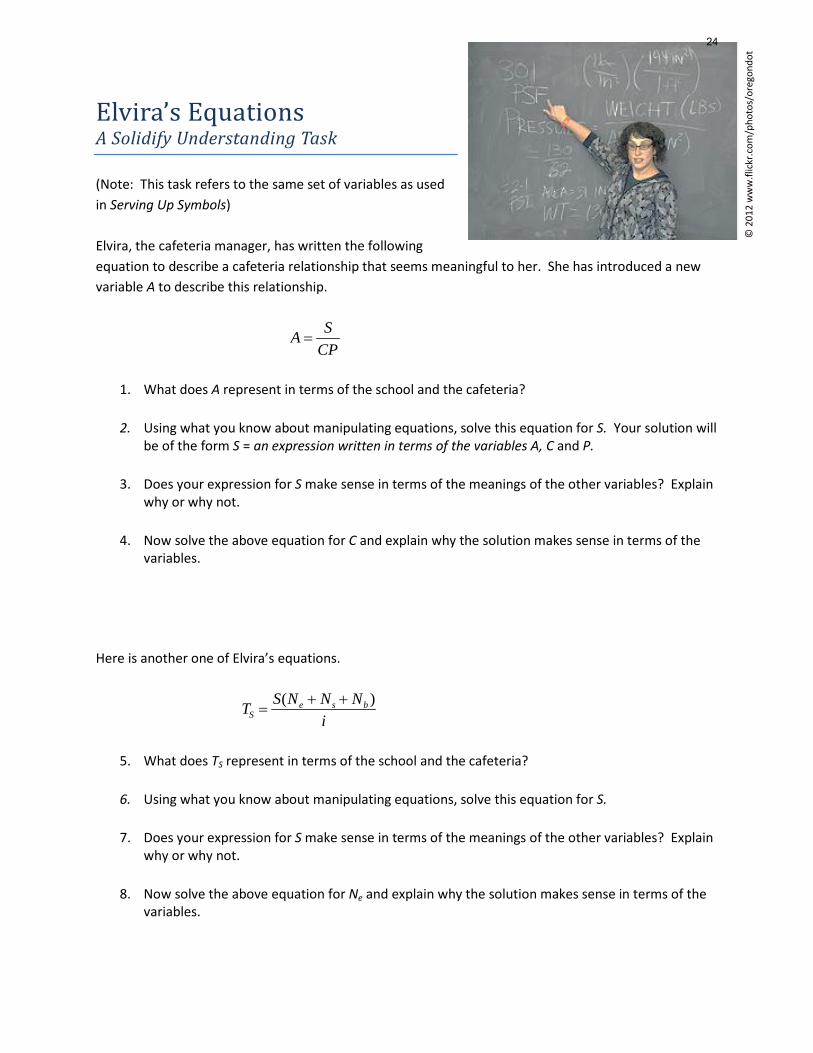
(Note: This task refers to the same set of variables as used in Serving Up Symbols) Elvira, the cafeteria manager, has written the following equation to describe a cafeteria relationship that seems meaningful to her. She has introduced a new variable A to describe this relationship.
A =S
CP
1. What does A represent in terms of the school and the cafeteria?
2. Using what you know about manipulating equations, solve this equation for S. Your solution will
be of the form S = an expression written in terms of the variables A, C and P.
3. Does your expression for S make sense in terms of the meanings of the other variables? Explain why or why not.
4. Now solve the above equation for C and explain why the solution makes sense in terms of the
variables. Here is another one of Elvira’s equations.
TS =S(Ne + Ns + Nb )
i
5. What does TS represent in terms of the school and the cafeteria?
6. Using what you know about manipulating equations, solve this equation for S.
7. Does your expression for S make sense in terms of the meanings of the other variables? Explain
why or why not.
8. Now solve the above equation for Ne and explain why the solution makes sense in terms of the variables.
24

Elvira’s Equations – Teacher Notes A Solidify Understanding Task
Purpose: The purpose of this task is to apply the equation solving process developed in the previous task to solving literal equations and formulas. Working with literal equations solidifies the notion that operations have to be “un-done” in an appropriate order by doing the inverse operation to both sides of the equation. This task also solidifies the meaning of expressions by attending to the units associated with each of the variables.
Core Standards Focus:
A.REI.3 Solve linear equations and inequalities in one variable, including equations with coefficients represented by letters.
Related Standards: A.REI.1, N.Q.1
Launch (Whole Class):
Work through problems 1-4 together as a class, then have students work on problems 5-12 with a partner. In problem 1, students need to pay attention to the units on the variables and the meaning of the parts of the expression obtained after operating with these variables. For example, multiplying C classes/lunch period times P lunch periods/day gives an expression in the denominator of the fraction that represents classes/day. Dividing S students/day by CP classes/day gives the average number of students/class as the meaning for the variable A.
Solving for S in question 2 leads to S=ACP. To verify that this makes sense, we can determine the units on S (which should be students/day) by determining the units on the product:
(A students/class) × (C classes/lunch period) × (P lunch periods/day)
The unit on the product is also students/day.
Do a similar analysis for
C =S
AP.
Explore (Small Group):
As students work on questions 5-8 listen for the meaning they are giving to the new variable TS.
Note: While S literally represents the number of students who buy lunch each day, it can be reassigned as representing the number of lunches served in a day. This is a typical issue when modeling real-world situations—identifying the meaning of the variables in a useful, yet consistent way. With this interpretation of S, as well as some carefully assigned units for the other variables, students should be
25

able to determine that TS represents the total number of minutes it takes to serve all student lunch. That is, S lunches × (Ne + Ns + Nb) items/lunch ÷ I items/minute yields TS minutes. (A more literal and complex analysis of the variables would lead to the unit worker-minutes/day for TS.) If students are getting bogged down on making sense of this variable, suggest that they work on questions 6 and 8, solving for a particular variable, and defer the discussion of the meaning of the variables until the whole class discussion. The expression for the right side of the equation was chosen to be particularly complex in order to raise issues about solving equations, rather than interpreting the meaning of the units.
Discuss (Whole Class):
Begin by focusing on how to solve Elvira’s second equation for S and for Ne. Students might find more that one correct way to write the solution for Ne depending on whether they distributed S or not. Discuss and clarify all proposed solutions.
If some students have been able to interpret the meaning of TS as minutes (or worker-minutes/day), have them present. If not, work out with students how the units on TS can be interpreted as minutes. This should assist students in checking the units for consistent meaning in the expressions they write for S and Ne.
Aligned Ready, Set, Go: Getting Ready 6
26

Solving Equations, Literally A Practice Understanding Task
Solve each of the following equations for x:
1. 2.
3. 4.
5. 6.
7. 2(3x + 4) = 4x + 12 8. Write a verbal description for each step of the equation solving process used to solve the following equations for x. Your description should include statements about how you know what to do next. For example, you might write, “First I __________________ , because _______________________. . .”
9.
10.
3x + 25
= 7
3x + 2y5
= 7
4x3
− 5 =11
4x3
− 5y =11
25
(x + 3) = 6
25
(x + y) = 6
2(3x + 4y) = 4x +12y
ax + bc
− d = e
r ⋅mxn
+ s = t
© 2
012
ww
w.fl
ickr
.com
/pho
tos/
ajax
ofsa
lam
is/
27

Solving Equations, Literally – Teacher Notes A Practice Understanding Task
Purpose: This task provides practice for solving linear equations in one variable, solving linear equations in two variables for one of its variables, and solving literal equations. The process for solving multivariable equations for one of its variables becomes more apparent when juxtaposed with similarly-formatted equations in one variable. The only difference in the solution process is the ability to carry out numerical computations to simplify the expressions in the one-variable equations.
Core Standards Focus:
A.REI.1 Explain each step in solving a simple equation as following from the equality of numbers asserted at the previous step, starting from the assumption that the original equation has a solution. Construct a viable argument to justify a solution method.
A.REI.3 Solve linear equations and inequalities in one variable, including equations with coefficients represented by letters.
Related Standards:
Launch (Whole Class):
Encourage students to note the similarities in their work on the pairs of problems in questions 1-8. Also point out that they are to write detailed explanations of their solution strategy on problems 9 and 10. One way to facilitate this would be to have students fold a piece of paper in half lengthwise. On the left side of the paper they write out their algebra steps, and on the right side they write out their justifications.
Explore (Small Group):
Monitor students while working on these problems and offer appropriate feedback, as necessary. Some of the problems have alternative strategies, such as #5 where you can distribute the 2/5 first, or multiply both sides of the equations by 5/2 first. Help students recognize the difference between changing the form of an expression on one side of an equation, vs. writing an equivalent equation by applying the same operation to both sides.
If students are having difficulties with #9 or #10, have them write a related equation in which they replace all letters with numbers except for the x. See if they can solve the related equation for x and if that work can help them solve the original literal equation. Problem 10 involves a square root in order to emphasize that one of the key issues in solving an equation is to “un-do” an operation by applying the inverse operation to both sides. Help students think about how that would play out in problem 10. That is, how might they “un-do” a square root?
28

Discuss (Whole Class):
Have students present their solution process for any problems that may have been difficult for a number of students. You might also want to have students critique each other’s explanations on problems 9 and 10 by having students exchange papers. They should fold their partner’s paper in half, so that only the right side with the written explanation is showing. On a separate sheet of paper they should write-out the algebra steps they would take to solve each problem, based only on the wording of their partners’ explanation. They should discuss any explanations that are unclear with their partner.
Aligned Ready, Set, Go: Getting Ready, 7
29

© 2
012
ww
w.fl
ickr
.com
/pho
tos/
usda
gov/
Cafeteria Conundrums A Solidify Understanding Task
Between serving and preparing delicious school lunches, our cafeteria manager, Elvira, is busy analyzing the business of running the cafeteria. We previously saw the symbols for some of the things that she measured. Now she plans to use those symbols. Help Elvira to consider the pressing questions of the lunch room.
Symbol Meaning S Number of students that buy lunch in the cafeteria each
day SC Average number of students per class that eat lunch each
day Sm Number of students who have passed through a line in m
minutes C Number of classes per lunch period P Number of lunch periods per day B Number of boys that buy lunch each day G Number of girls that buy lunch each day F Number of food servers in the cafeteria T Total number of food items in one lunch (Each entrée, side
dish, or beverage counts as 1 item.) M Number of minutes passed since the beginning of the lunch
period Ne Number of entrees in each lunch Ns Number of side dishes in each lunch Nb Number of beverages in each lunch Ce Cost of each entrée Cs Cost of each side dish Cb Cost of each beverage L Number of lines in the cafeteria W The number of food workers (servers) per line i Average number of food items that a worker can serve each
minute (Each entrée, side dish, or beverage counts as 1 item.)
H Number of hours each food worker works each day PL Price per lunch
Write equations or inequalities to express some of the conditions that Elvira sees in the cafeteria.
30

1. Each lunch can have no more than 3 side dishes.
2. More boys eat school lunch than girls.
3. There can be no more than 7 food items in each lunch.
4. In each lunch, there are 3 more side dishes than entrees and twice as many beverages as entrees. Write an inequality in one variable that shows that the total number of food items in a lunch cannot be more than 7.
5. The cost of food in the lunch is the total of the cost of the entrée, the side dishes, and the beverages. Write an inequality that shows that the cost of the food in the lunch must be less than $1.50.
6. To meet district guidelines, the total price of a lunch must be more than $2.25, but less than $3.50.
7. Elvira knows that the number of lines that she can open in the cafeteria depends on how many food servers she has in the cafeteria each day and how many workers are needed in each line. Write an inequality that shows this relationship.
8. Food workers are paid $11.50 per hour. Elvira can’t spend more than $500 per day on employees. Write an inequality that relates the number of food workers to the amount spent each day on employees.
9. Elvira knows that the money she gets from selling lunches has to be greater than her costs. a. Write an expression for the cost of employees each day b. Write an expression for the cost of food each day c. Write an expression that shows that the total cost of food and employees each day
must be less than the amount she brings in from selling lunches.
31

Cafeteria Conundrums – Teacher Notes
Purpose: This is the first task in a series of three that works with the ideas of inequalities. Most students have been introduced to solving inequalities in their earlier experiences in mathematics. Each of the inequalities tasks in the unit emphasis reasoning with variables and symbols, and the use of inequalities in a context. This task extends the work that students have previously done with symbols and equations to setting up inequalities. The Ready, Set, Go homework that coordinates with the task reviews and practices skills for solving inequalities.
Core Standards Focus: A.REI.1 Explain each step in solving a simple equation as following from the equality of numbers asserted at the previous step, starting from the assumption that the original equation has a solution. Construct a viable argument to justify a solution method. Solve equations and inequalities in one variable. A.REI.3 Solve linear equations and inequalities in one variable, including equations with coefficients represented by letters. Extend earlier work with solving linear equations to solving linear inequalities in one variable and to solving literal equations that are linear in the variable being solved for.
Launch (Whole Class): Remind students of the work that they have done with previous task that have been set in the school cafeteria, starting with Serving Up Symbols. This task uses all the same symbols that they are already familiar with. You may also with to review the use of each of the inequality symbols, ≠,≤, <,≥,𝑎𝑛𝑑 > before getting into the task. Start by asking students to work problem 1 on their own. Ask students which symbol they used for the phrase “no more than” and how they know it was ≤ rather than <. Tell student that in this task they will need to consider both the variable to use and the correct symbol to describe the relationship.
Explore (Small Group or Pairs): Ask students to complete the task. Circulate around the room, initially watching for their work with problems 3 and 4. These are related problems with #4 requiring substitution into the inequality that students write for #3. The context in problem 6 suggests writing a compound inequality, which students may not have seen previously. They may choose to write two inequalities for this problem, which would be an interesting topic for the class discussion. Throughout the course of the exploration, watch for problems that are generating controversy, challenge, or interesting thinking so that they can be highlighted during the class discussion.
Discuss (Whole Class): Start the discussion with any problem that has been identified during the exploration phase. Then turn the attention to problem 9. Ask a different student to explain each
32

part, a, b, and c. Ask students why the total cost of food and employees each day must be less than the amount she brings in from selling lunches. What would it mean in we wrote an equation, rather than an inequality for these two expressions?
Aligned Ready, Set, Go: Getting Ready 8
33

© 2
012
ww
w.fl
ickr
.com
/pho
tos/
mar
inac
ast
Greater Than? A Solidify Understanding Task
For each situation you are given a mathematical statement and two expressions beneath it.
1. Decide which of the two expressions is greater, if the expressions are equal, or if the relationship cannot be determined from the statement.
2. Write an equation or inequality that shows your answer. 3. Explain why your answer is correct.
Watch out—this gets tricky!
Example: Statement: 𝑥 = 8 Which is greater? 𝑥 + 5 or 3𝑥 + 2 Answer: 3𝑥 + 2 > 𝑥 + 5 because if 𝑥 = 8, 3𝑥 + 2 = 26, 𝑥 + 5 = 13 and 26 > 13.
Try it yourself:
1. Statement: 𝑦 < 𝑥 Which is greater? 𝑥 − 𝑦 or 𝑦 − 𝑥
2. Statement: 𝑎 > 0, 𝑏 < 0 Which is greater? 𝑎𝑏 𝑜𝑟 𝑎
𝑏
3. Statement: 2𝑥 − 3 > 7 Which is greater? 5 or 𝑥
4. Statement: 10 − 2𝑥 < 6 Which is greater? 𝑥 or 2
5. Statement: 4𝑥 = 0
Which is greater? 1 or 𝑥
34

6. Statement: n is an integer Which is greater? 𝑛 or − 𝑛
7. Statement:
Which is greater? 1 or 𝑦𝑧
8. Statement: Use the number line in #7 and 𝑥 < 𝑤 < 𝑦 Which is greater? 𝑤 or − 𝑦
9. Statement: 0 < 𝑥 < 10 and 0 < 𝑦 < 12 Which is greater? 𝑥 or 𝑦
10. Statement: 3𝑛+2 = 27 Which is greater? 𝑛 or 3
11. Statement: 𝑥 > 0,𝑦 > 0 𝑎𝑛𝑑 𝑥𝑦
> 2
Which is greater? 2𝑦 or 𝑥
12. Statement: 5 > 4 Which is greater? 5𝑥 or 4𝑥
13. Statement 𝑥 > 𝑦 Which is greater? 𝑥 + 𝑎 𝑜𝑟 𝑦 + 𝑎
14. Statement: 5 > 4
Which is greater? 5𝑥
or 4𝑥
15. Statement: 𝑥 > 𝑦 and 𝑎 > 𝑏 Which is greater? 𝑥 − 𝑎 or 𝑦 − 𝑏
x y z
35

Greater Than? – Teacher Notes
Purpose: The purpose of this task is to challenge students to think deeply about inequality relationships and to understand the properties of inequalities. Each of the problems in the require reasoning about numbers, including negative numbers and fractions, and thinking mathematically about the various possibilities in the given problem situation.
Core Standards Focus: A.REI.1 Explain each step in solving a simple equation as following from the equality of numbers asserted at the previous step, starting from the assumption that the original equation has a solution. Construct a viable argument to justify a solution method. Solve equations and inequalities in one variable. A.REI.3 Solve linear equations and inequalities in one variable, including equations with coefficients represented by letters. Extend earlier work with solving linear equations to solving linear inequalities in one variable and to solving literal equations that are linear in the variable being solved for. Launch (Whole Class): Explain to students that this task is a big logic puzzle. All of the problems require thinking about all the different possibilities to decide which expression is greater. There are some that cannot be determined from the information given. You may choose not to tell students this in advance so that they have an opportunity to wrestle with the ideas and to justify their position. Start by asking students to read the example given. To confirm the instructions, ask how they see the 3 required parts of the explanation in the answer. Next, refer students to problem #1. Give them a few minutes to answer and write their own explanation. Ask the class for their answers and explanation and model how to write an answer with a complete explanation. You may also want to model thinking about possible value for x and y, like: “If x is a negative number, then y must also be a negative number because it is less than x.” Explore (Small Group or Pairs): Monitor students as they work. Encourage them to think about the various possibilities for x and y in each case. Be sure that their written explanations adequately communicate their logic. Watch for problems that generate disagreement or difficulty for the class discussion. Also look for students’ explanations that demonstrate sound mathematical logic or good communication to be highlighted in the discussion. If you notice a common misconception occurring during the exploration, plan to raise it as an issue in the discussion. Discuss (Whole Class): Start the discussion with problems 12, 13, 14. Ask previously-selected students to give their explanations for each of these problems. Highlight for the class that these three problems are asking them to justify the properties of inequalities. Write each of the properties of inequalities (addition, subtraction, multiplication, and division), and ask students to state them in their own words.
36

After going through each of these, turn the discussion to any misconceptions or provocative problems that were selected during the exploration phase. Aligned Ready, Set, Go Homework: Getting Ready 9
37

© 2
012
ww
w.fl
ickr
.com
/pho
tos/
tony
jcas
e
Taking Sides A Practice Task
Joaquin and Serena work together productively in their math class. They both contribute their thinking and when they disagree, they both give their reasons and decide together who is right. In their math class right now, they are working on inequalities. Recently they had a discussion that went something like this:
The situations below are a few more of the disagreements and questions that Joaquin and Serena have. Your job is to decide is to answer their questions, decide who is right and give a mathematical explanation of your reasoning.
1. Joaquin and Serena are assigned to graph the inequality 𝑥 ≥ −7. Joaquin thinks the graph should have an open dot -7. Serena thinks the graph should have a closed dot at -7.
Explain who is correct and why. 2. Joaquin and Serena are looking at the problem 3𝑥 + 1 > 0
Serena says that the inequality is always true because multiplying a number by three and then adding one to it makes the number greater than zero. Is she right? Explain why or why not.
3. The word problem that Joaquin and Serena are working on says, “4 greater than x”. Joaquin says that they should write: 4 > 𝑥. Serena says they should write: 4 + 𝑥. Explain who is correct and why. 4. Joaquin is thinking hard about equations and inequalities and comes up with this idea: If 45 + 47 = 𝑡, then 𝑡 = 45 + 47. So, if 45 + 47 < 𝑥, then 𝑥 < 45 + 47. Is he right? Explain why or why not.
Joaquin: The problem says that “6 less than a number is greater than 4.” I think that we should just follow the words and write 6 − 𝑥 > 4.
Serena: I don’t think that works because if 𝑥 is 20 and you do 6 less than that you get 20 – 6 = 14. I think we should write 𝑥 − 6 > 4.
Joaquin: Oh, you’re right. Then it makes sense that the solution will be 𝑥 > 10, which means we can choose any number greater than 10.
38

5. Joaquin’s question in #4 made Serena think about other similarities and differences in equations
and inequalities. Serena wonders about the equation −𝑥3
= 4 and the inequality −𝑥3
> 4.
Explain to Serena ways that solving these two problems are alike and ways that they are different. How are the solutions to the problems alike and different?
6. Joaquin solved −15𝑞 ≤ 135 by adding 15 to each side of the inequality. Serena said that he
was wrong. Who do you think is right and why? Joaquin’s solution was 𝑞 ≤ 150. He checked his work by substituting 150 for q in the original
inequality. Does this prove that Joaquin is right? Explain why or why not. Joaquin is still skeptical and believes that he is right. Find a number that satisfies his solution
but does not satisfy the original inequality. 7. Serena is working is checking her work with Joaquin and finds that they disagree on a problem.
Here’s what Serena wrote: 3𝑥 + 3 ≤ −2𝑥 + 5 3𝑥 ≤ −2𝑥 + 2 𝑥 ≤ 2 Is she right? Explain why or why not? 8. Joaquin and Serena are having trouble solving -4(3𝑚− 1) ≥ 2(𝑚 + 3). Explain how they should solve the inequality, showing all the necessary steps and identifying the
properties you would use.
9. Joaquin and Serena know that some equations are true for any value of the variable and some equations are never true, no matter what value is chosen for the variable. They are wondering about inequalities. What could you tell them about the following inequalities? Do they have solutions? What are they? How would you graph their solutions on a number line?
a. 4𝑠 + 6 ≥ 6 + 4𝑠
b. 3𝑟 + 5 > 3𝑟 − 2
c. 4(𝑛 + 1) < 4𝑛 − 3
10. The partners are given the literal inequality 𝑎𝑥 + 𝑏 > 𝑐 to solve for x. Joaquin says that he will solve it just like an equation. Serena says that he needs to be careful because if a is a negative number, the solution will be different. What do you say? What are the solutions for the inequality?
39

Taking Sides – Teacher Notes
Purpose: The purpose of this task is to practice the reasoning and solving of inequalities. Many common misconceptions and mistakes made when solving inequalities are addressed in the task. Students are asked to think about the differences and similarities in solving inequalities versus solving equations, including that most inequalities produce a range of solutions, that the inequality sign must be turned when multiplying or dividing by a negative number, and that the reflexive property holds only for equations.
Core Standards: A.REI.1 Explain each step in solving a simple equation as following from the equality of numbers asserted at the previous step, starting from the assumption that the original equation has a solution. Construct a viable argument to justify a solution method. Solve equations and inequalities in one variable. A.REI.3 Solve linear equations and inequalities in one variable, including equations with coefficients represented by letters. Extend earlier work with solving linear equations to solving linear inequalities in one variable and to solving literal equations that are linear in the variable being solved for.
Launch (Whole Class): Hand out the worksheet and go over the scenario given about Joaquin and Serena. Ask a student to demonstrate Serena’s argument that changed Joaquin’s mind. Before moving to problem #1, tell students that they should work on a separate piece of paper or in their journals, as there is not adequate room on the handout for their explanations. Start with #1, giving students about 3 minutes to answer the question individually, writing their best explanation in complete sentences. Ask a student to read their explanation and then model a thorough answer on the board. The explanation should be something like:
The inequality 𝑥 ≥ −7 should be graphed with a closed dot on -7 and all points to the right of -7 filled in. This is because the symbol ≥ means greater than or equal to, so -7 is a solution to the inequality. The closed dot on -7 shows that the number is included in the solution set. An open dot would indicate that -7 is not a solution.
Next, ask the class to think about #2. Give students a few minutes to talk to their neighbor about their reasoning and then ask them to write individually for a few minutes. While they are working, circulate through the room to find an exemplar to use with the class. It is important that students are first considering the logic of why Serena believes the inequality to always be true. Then, students should recognize that she is only considering nonnegative numbers. Be sure that both parts of the argument
40

are discussed to model the thinking process that will be required throughout the task and also what a complete answer will look like.
Explore (Small Group): Let student work on the remainder of the task as you monitor their thinking. Throughout the task, students will be challenged to consider whether the strategies that they have learned for equations will apply to inequalities. If you find that some groups are spending excessive time on a problem, redirect their focus to problems 4, 5, 7, and 8, which will be the focus of the whole group discussion. Identify a group to present one of each of these problems.
Discuss (Whole Group): Start the discussion with the presentation of problem #4. Be sure that the group identifies that if the two sides of an equation are switched, the equation remains true. Their explanation should also include the idea that if the sides of an inequality are switched, then the inequality sign must be turned. Ask the group to demonstrate this thinking by substituting numbers into the inequality for x. Remind students that this often comes up because the solutions to inequalities are conventionally written with the variable on the left side of the inequality. So, an expression like 4 < 𝑥 is routinely converted to 𝑥 > 4.
Next, move the discussion to #5. Again, students are asked to consider the difference between solving an equation and solving an inequality. The explanation from the group should include the idea that the steps in solving the equation and the inequality are the same. The only difference is that the inequality sign must be turned when multiplying by -3. Press students to explain why that rule holds, rather than simply stating the rule.
The explanation of #7 should include showing all the proper steps in the solution of the inequality. As students demonstrate the problem, they will see that Serena did not properly add 2x to both sides of the inequality. Ask students why this inequality seemed to be solved exactly like an equation, but other inequalities do not.
Close the discussion with question #8. Emphasize the reasons for each step and compare the properties of inequalities with the properties of equations.
Aligned Ready, Set, Go: Getting Ready 10
41

© 2012 Mathematics Vision Project | MVP In partnership with the Utah State Office of Education
Licensed under the Creative Commons Attribution‐NonCommercial‐ShareAlike 3.0 Unported license.
Cafeteria Consumption and Costs A Develop Understanding Task
Sometimes Elvira hosts after school events in the cafeteria as clubs
and teams celebrate their accomplishments. Frequently she
orders too much food for such events—and occasionally not
enough. For example, she has noticed that the chess club eats less
than the football team, but more than the cheerleaders.
Elvira has asked you to help her sort through her records for the past few years, hoping she can better
plan on how much food to order for the upcoming soccer team and drama club events. Unfortunately,
Elvira kept most of her records on Post‐It Notes, and now everything is out of order. Fortunately, she
used a different color of Post‐It Notes each year, so you at least have a place to start.
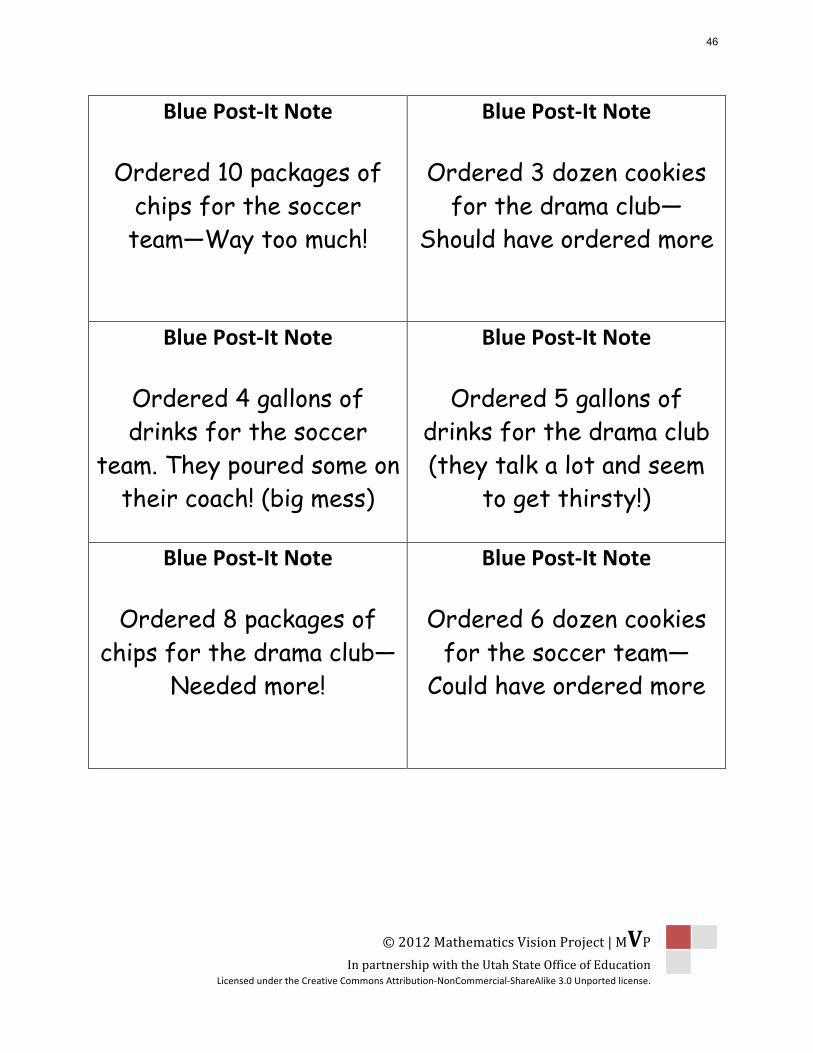
1. Here is the information you have identified from the past three years for the soccer team and drama club events. The blue Post‐It Notes are from three years ago, the yellow from two years ago, and the pink from last year’s events. Organize the data for each year in such a way that it can be combined with similar data from other years.
Blue Post‐It Note Ordered 10 packages of chips
for the soccer team— Way too much!
Yellow Post‐It Note Ordered 6 packages of chips
for the soccer team— Definitely not enough!
Blue Post‐It Note Ordered 3 dozen cookies for
the drama club— Should have ordered more
Blue Post‐It Note Ordered 4 gallons of drinks for the soccer team. They poured
some on their coach! (big mess)
Pink Post‐It Note Ordered 8 packages of chips
for the soccer team—My neighbor is on the team!
Yellow Post‐It Note Ordered 5 dozen cookies for
the drama club— I really like those kids!
Pink Post‐It Note Ordered 10 packages of chips
for the drama club—They talked a lot with fake accents
Blue Post‐It Note Ordered 5 gallons of drinks for the drama club (they talk a lot
and seem to get thirsty!)
Pink Post‐It Note Ordered 4 dozen cookies for
the drama club—Too much drama, too little character!
Blue Post‐It Note Ordered 8 packages of chips
for the drama club— Needed more!
Pink Post‐It Note Ordered 8 dozen cookies for
the soccer team—slipped a few extra to my neighbor.
Pink Post‐It Note Ordered 4 gallons of drinks for the soccer team—Watched the
players like a hawk! Pink Post‐It Note
Ordered 4 gallons of drinks for the drama club—
Seemed about right
Yellow Post‐It Note Ordered 4 gallons of drinks for the soccer team—Warned them not to repeat last year’s prank!
Yellow Post‐It Note Ordered 3 gallons of drinks for
the drama club—drinks were gone long before the chips
©20
12 www.flickr.com
/pho
tos/pe
retzp
42

© 2012 Mathematics Vision Project | MVP In partnership with the Utah State Office of Education
Licensed under the Creative Commons Attribution‐NonCommercial‐ShareAlike 3.0 Unported license.
Yellow Post‐It Note Ordered 7 dozen cookies for
the soccer team— Should I have ordered more?
Yellow Post‐It Note Ordered 12 packages of chips
for the drama club— Sent extra home with kids
Blue Post‐It Note Ordered 6 dozen cookies for
the soccer team— Could have ordered more
2. You suggest to Elvira that for each event she should order the average amount of each item based on what she has ordered over the past three years. How might you represent this year’s order in a concise, organized way? Describe in detail how you calculated the amount of each item to be ordered for each event so Elvira can follow your description when planning for future events.
3. Elvira just informed you that the soccer team won the state championship and the drama club took major awards at the Shakespearean Festival competition. Consequently, both groups have decided to allow each member of the team or club to invite two guests to accompany them to their celebration events. Elvira assumes that each of the guests will consume about the same amount of food as the team or club members they accompany. Explain to Elvira how to use your representation of the original amount of food to order to determine the new amount of food to order.
4. Elvira can order food from either Mainstreet Market or Grandpa’s Grocery, and she has given you a list of the prices at each store for each item to be purchased. She would like you to create a representation of the total cost of purchasing the recommended amount of food for each event from each store. Elvira knows that for some events it might be best to purchase the food from Mainstreet Market and for other events it may be better to purchase the food from Grandpa’s Grocery. She also realizes that it is too time consuming to purchase some items from one store and some from another. Since you will eventually want to determine a procedure Elvira can use when calculating the cost of future events, you will need to keep track of the details of your computations for the total cost of purchasing food for the soccer team from either store, and for purchasing food for the drama club from either store.
Mainstreet Market Grandpa’s Grocery Cost per package of chips $2.50 $2.00
Cost per dozen cookies $3.00 $4.00 Cost per gallon of drink $2.00 $1.50
43

© 2012 Mathematics Vision Project | MVP In partnership with the Utah State Office of Education
Licensed under the Creative Commons Attribution‐NonCommercial‐ShareAlike 3.0 Unported license.
Cafeteria Consumption and Costs – Teacher Notes A Develop Understanding Task
Purpose: This task provides opportunities for students to develop a reason for organizing data into
rectangular arrays or matrices. Each element in a matrix represents two characteristics or quantities, one by virtue of the row it is located in and one by virtue of the column it is in. Consequently, each element has units associated with it that describe both the characteristics of the row and column in
which it is located. Paying attention to these units guides ways that we can combine matrices by addition, subtraction, and scalar or matrix multiplication. In this task, students will notice that in order to add data represented by matrices, the corresponding rows and columns of each matrix need to
contain similar information. The data in a matrix can be scaled up or scaled down by multiplying each element in each row and column by the same scale factor (e.g., scalar multiplication). This task also surfaces thinking about multiplying corresponding factors and adding corresponding terms to find
desired linear combinations—an essential idea for matrix multiplication that will be examined and solidified in the following task.
Core Standards Focus:
N.VM.6 Use matrices to represent and manipulate data.
N.VM.7 Multiply matrices by scalars to produce new matrices, e.g., as when all of the payoffs in a game are doubled.
N.VM.8 Add, subtract, and multiply matrices of appropriate dimensions.
Related Standards: N.Q.1
Launch (Whole Class):
Read through the introductory paragraphs and the scenario in question 1. Distribute the blue, yellow and pink notes (see attached handouts) for students to rearrange as they consider different ways to
organize the information on the notes. (Mix up the notes similar to the task handout.)
Explore (Small Group):
As students are working on the task you may need to remind them that their goal is to organize each year’s data in such a way that “it can be combined with similar data from other years.” Watch for useful organizational schemes such as putting all of the data for the soccer team in the same row (or column)
and all of the data for the drama club in a separate row (or column) and then organizing the food items in the same order throughout both rows (or columns). This same organizational structure should be repeated for each year’s set of data. Once the data is organized in this way, it makes sense that pieces
of data that appear in corresponding rows and columns from each of the three years can be added together. Note that not every group will organize their data in the same way—rows and columns might
44

© 2012 Mathematics Vision Project | MVP In partnership with the Utah State Office of Education
Licensed under the Creative Commons Attribution‐NonCommercial‐ShareAlike 3.0 Unported license.
be interchanged, as well as the order of food items within a row or column. The essential idea is to get corresponding pieces of data to appear in the same row and column each year.
Once groups have organized their data, have them move on to discuss questions 2, 3 and 4. Questions
two and three introduce the idea of scalar multiplication. For question 2, look for students who first create a matrix (or rectangular arrangement of the data) that represents the total of the three years for each food item for each event, and then multiplies each item in their matrix by 1/3 (or divides by 3) to
get a new matrix representing the average amount of each item for each event. For question 3, look for students who multiply each element in the matrix obtained in question 2 by a factor of 3.
Question 4 is designed to lay a foundation for thinking about matrix multiplication. While students do not yet know how to organize and manipulate matrices to solve this problem, they can think through
the required multiplication of factors and sum of terms that will determine the total cost of purchasing all of the items for each event at either store. Make sure they are keeping track of their computations by recording equations that represent their work. For example, to find the total cost of buying food for
the soccer event at Mainstreet Market would carry out the following computation: (8 packages of chips × $2.50/package of chips) + (7 dozen cookies × $3.00/dozen cookies) + (4 gallons of drink × $2.00/gallon
of drink) = $49. Since the main focus of the whole class discussion will be on questions 1‐3, if students do not finish question 4 assign it as homework. A discussion of question 4 will serve as the launch of the
next task.
Select 2 or 3 groups who have organized the three years of data differently to present to the class. Give the selected groups time to glue their organizational structures of the data to chart paper, before beginning the discussion. Choose groups who have finished more quickly than others to prepare for this
presentation, while other groups continue to work on the task.
Discuss (Whole Class):
Have each of the selected groups present the ways they organized their data. Ask the class to identify similarities and differences between the organizational schemes, and to account for the similarities (e.g., it is easier to add like terms if the same types of data appears in corresponding rows and columns each
year), and explain why the differences don’t matter (e.g., one group may have used rows to represent teams and clubs and columns to represent food items, while another group might have exchanged the roles of the rows and columns; it doesn’t matter the order in which the food items are listed, as long as
the order is consistent from year to year).
As students discuss questions 2 and 3, introduce the notation of scalar multiplication of a matrix.
Depending on time and the progress of the students, you may begin a discussion of question 4 or give students additional time to work on question 4 in preparation for the next task.
Aligned Ready, Set, Go: Getting Ready 11
45
© 2012 Mathematics Vision Project | MVP In partnership with the Utah State Office of Education
Licensed under the Creative Commons Attribution‐NonCommercial‐ShareAlike 3.0 Unported license.
Blue Post‐It Note
Ordered 10 packages of chips for the soccer team—Way too much!
Blue Post‐It Note
Ordered 3 dozen cookies for the drama club—
Should have ordered more
Blue Post‐It Note
Ordered 4 gallons of drinks for the soccer
team. They poured some on their coach! (big mess)
Blue Post‐It Note
Ordered 5 gallons of drinks for the drama club (they talk a lot and seem
to get thirsty!)
Blue Post‐It Note
Ordered 8 packages of chips for the drama club—
Needed more!
Blue Post‐It Note
Ordered 6 dozen cookies for the soccer team—
Could have ordered more
46

© 2012 Mathematics Vision Project | MVP In partnership with the Utah State Office of Education
Licensed under the Creative Commons Attribution‐NonCommercial‐ShareAlike 3.0 Unported license.
Yellow Post‐It Note
Ordered 6 packages of chips for the soccer
team— Definitely not enough!
Yellow Post‐It Note
Ordered 5 dozen cookies for the drama club—
I really like those kids!
Yellow Post‐It Note
Ordered 4 gallons of drinks for the soccer
team—Warned them not to repeat last year’s prank!
Yellow Post‐It Note
Ordered 3 gallons of drinks for the drama
club—drinks were gone long before the chips
Yellow Post‐It Note
Ordered 7 dozen cookies for the soccer team— Should I have ordered
more?
Yellow Post‐It Note
Ordered 12 packages of chips for the drama club— Sent extra home with kids
47

© 2012 Mathematics Vision Project | MVP In partnership with the Utah State Office of Education
Licensed under the Creative Commons Attribution‐NonCommercial‐ShareAlike 3.0 Unported license.
Pink Post‐It Note
Ordered 8 packages of chips for the soccer
team—My neighbor is on the team!
Pink Post‐It Note
Ordered 10 packages of chips for the drama club—They talked a lot with fake
accents
Pink Post‐It Note
Ordered 4 dozen cookies for the drama club—Too much drama, too little
character!
Pink Post‐It Note
Ordered 8 dozen cookies for the soccer team—
slipped a few extra to my neighbor.
Pink Post‐It Note
Ordered 4 gallons of drinks for the soccer team—Watched the players like a hawk!
Pink Post‐It Note
Ordered 4 gallons of drinks for the drama
club— Seemed about right
48

© 2012 Mathematics Vision Project | MVP In partnership with the Utah State Office of Education
Licensed under the Creative Commons Attribution‐NonCommercial‐ShareAlike 3.0 Unported license.
Eating Up the Lunchroom Budget A Solidify Understanding Task
In Cafeteria Consumption and Costs you created a matrix to
represent the number of food items Elvira planned to order this year for the soccer team and drama club celebrations. Your matrix probably looked something like this: (Note: labels have
been added to keep track of the meaning of the rows and columns)
€
chips cookies drinksSoccerDrama
8 7 410 4 4
You were also given information about the cost of purchasing each food item at two different stores,
Mainstreet Market and Grandpa’s Grocery. That information could also be represented in a matrix like
this:
€
Mainstreet Market Grandpa's GroceryCost per package of chipsCost per dozen cookiesCost per gallon of drink
2.50 2.003.00 4.002.00 1.50
In question 4 of the previous task you were asked to determine how much each event would cost if all of
the food for the event was purchased at Mainstreet Market or Grandpa’s Grocery. These total amounts
could be recorded in a matrix that looks like this:
€
Mainstreet Market Grandpa's GrocerySoccerDrama
a bc d
1. Calculate the values of a, b, c, and d in the matrix above.
2. Explain, in detail, how you would use the numbers in the first two matrices above to obtain the values for the third matrix.
©2012 www.flickr.com/photos/holtsman/
49

© 2012 Mathematics Vision Project | MVP In partnership with the Utah State Office of Education
Licensed under the Creative Commons Attribution‐NonCommercial‐ShareAlike 3.0 Unported license.
3. In addition to the soccer team and drama club, Elvira plans to host events for the chess club, the cheerleaders and the football team. She gives you the following matrix to represent food items that need to be ordered for each of the events. Can you use matrix multiplication with the cost matrix given above to determine the total cost of each event if items are purchased at each store? If yes, show how. If no, explain why not.
€
chips cookies drinksSoccerDramaChess
CheerleadersFootball
8 7 410 4 43 4 22 3 214 12 8
4. In addition to chips, cookies and drinks, Elvira plans to add rolls and cold cuts to the events’ menu. She gives you the following matrix to represent all of the food items that need to be ordered for each of the events. Can you use matrix multiplication with the cost matrix given above to determine the total cost of each event if items are purchased at each store? If yes, show how. If no, explain why not.
€
chips cookies drinks rolls cold cutsSoccerDramaChess
CheerleadersFootball
8 7 410 4 43 4 22 3 214 12 8
6 48 52 22 212 10
50

© 2012 Mathematics Vision Project | MVP In partnership with the Utah State Office of Education
Licensed under the Creative Commons Attribution‐NonCommercial‐ShareAlike 3.0 Unported license.
Eating Up the Lunchroom Budget – Teacher Notes A Solidify Understanding Task
Purpose: The purpose of this task is to examine the row by column procedure for multiplying matrices.
Unlike with addition, where both matrix addends had to have the same number of rows and the same number of columns, the factor matrices in matrix multiplication do not need to be the same size. However, they do need to be compatible sizes. This task will help students notice that the number of
columns in the first factor matrix needs to be the same as the number of rows of the second factor matrix for multiplication to be possible. Students will also notice that the product of matrix multiplication is a matrix with the same number of rows as the first factor matrix and the same number
of columns as the second factor matrix. Each of these last two statements imply that matrix multiplication, in general, is not commutative.
Core Standards Focus:
N.VM.8 Add, subtract, and multiply matrices of appropriate dimensions.
Related Standards: N.Q.1
Launch (Whole Class):
Students should have already worked on the computations involved in the scenario represented in the
introductory paragraph during their work on question 4 of Cafeteria Consumption and Costs. If you have not had an opportunity to discuss this problem, do so now. Ask students to describe how they would compute the cost of buying all of the food items for a particular event at a particular store. For example,
how would they compute the cost of purchasing the food for the drama club event at Mainstreet Market? In doing so, point out that students have calculated the value of the variable c in the third matrix, as requested in question 1 of this task. Then set students to work on the remainder of the task.
Explore (Small Group):
While students may be able to calculate the values of a, b, c and d based on the context, they may not
immediately notice how the sum of partial products involved in these computations are related to the arrangement of the numbers in the matrices. Listen for students who can articulate that the numbers along the rows of the first matrix are being multiplied by the corresponding numbers down the columns
of the second matrix (for example, while moving across the numbers in the second row of the first matrix, you move down the numbers in the second column of the second matrix, multiply corresponding factors as you move across the row and down the column), and that the partial products are added
together and recorded in a corresponding row and column in the product matrix (e.g., row two, column two for our example).
51

© 2012 Mathematics Vision Project | MVP In partnership with the Utah State Office of Education
Licensed under the Creative Commons Attribution‐NonCommercial‐ShareAlike 3.0 Unported license.
Questions 3 and 4 are intended to help students think about conditions that need to be met in order for matrices to be multiplied. These conditions include the compatible size issues described in the purpose
statement and the observation that, in general, matrix multiplication is not commutative. In addition, the quantities and units used in the context must be compatible for matrix multiplication to make sense (see discussion below).
Discuss (Whole Class):
Work towards a good articulation of the row and column structure of matrix multiplication, by sharing
students’ descriptions of the process as written in response to question 2. Write out each of the problems as a matrix multiplication equation, without the row and column labels.
Highlight the size of the factors and product matrices, and discuss the size conditions that need to be met in order for matrices to be multiplied. In our initial example, a 2‐row, 3‐column matrix is multiplied
by a 3‐row, 2‐column matrix to obtain a 2‐row, 2‐column matrix. In question 3, a 5‐row, 3‐column matrix is multiplied by a 3‐row, 2‐column matrix to obtain a 5‐row, 2‐column matrix. In question 4, we attempt to multiply a 5‐row, 5‐column matrix by a 3‐row, 2‐column matrix, but realize that this is not
possible. Make sure that the impossibility of this last multiplication is discussed both in terms of the context (we need to know the cost of rolls and cold cuts at each of the markets) as well as in terms of a matrix equation (as we move across the numbers in the rows of the first matrix while multiplying by the
numbers in the columns of the second matrix we run out of factors from our second matrix since it does not have the same number of rows as the number of columns in the first matrix). These examples should help students articulate a compatibility rule for multiplying matrices.
Highlight the quantities and units being used in the factors and product of the matrix multiplication by
adding the row and column labels to the matrix multiplication equations. For example, in the initial problem an “event by food item matrix” is multiplied by a “cost per food item by store” matrix to obtain
an “event by store” matrix which represents the cost of purchasing all of the food items for each event at each store. Relate this idea to the size compatibility rule for multiplying matrices to indicate how the row and column arrangement of the quantities and units represented by the matrices must also be
compatible for matrix multiplication to make sense.
In the next task, students will practice arranging data from a context into matrices that can reasonably be multiplied, both by their size and by the quantities and units they represent.
Aligned Ready, Set, Go: Getting Ready 12
52

© 2012 Mathematics Vision Project | MVP In partnership with the Utah State Office of Education
Licensed under the Creative Commons Attribution‐NonCommercial‐ShareAlike 3.0 Unported license.
The Arithmetic of Matrices A Practice Understanding Task
Elvira likes the way matrices organizes information
so she can keep track of several computations simultaneously. She decides to apply these ideas to another “sticky” situation she often encounters in
the lunchroom.
Students’ favorite desert is cinnamon rolls—which they often refer to as “sticky buns”. However, not all students like their rolls with a cream cheese glaze, and some prefer rolls without raisins. Consequently, Elvira has her cooks prepare cinnamon rolls in three different varieties.
1. Organize the following information into a matrix. If helpful, label the rows and columns to show what the numbers represent.
• One dozen plain cinnamon rolls require 2 pounds of dough, and no glaze and no raisins.
• One dozen glazed cinnamon rolls require 1.5 pounds of dough, 0.5 pounds of cream cheese
glaze, and 0.25 pounds of raisins.
• One dozen plain cinnamon rolls with raisins require 1.75 pounds of dough, 0.25 pounds of raisins, and no glaze.
2. Organize the following information into a matrix. If helpful, label the rows and columns to show what the numbers represent.
• On October 31 the cooks made 20 dozen plain cinnamon rolls, 30 dozen glazed cinnamon
rolls and 20 dozen plain cinnamon rolls with raisins.
• On November 20 the cooks made 15 dozen plain cinnamon rolls, 40 dozen glazed cinnamon rolls and 10 dozen plain cinnamon rolls with raisins.
3. Use the information above to find the total amount of each ingredient that was used on October
31 and November 20. Organize your work and the results into a matrix equation.
©20
12 www.flickr.com
/pho
tos/windysydn
ey
53
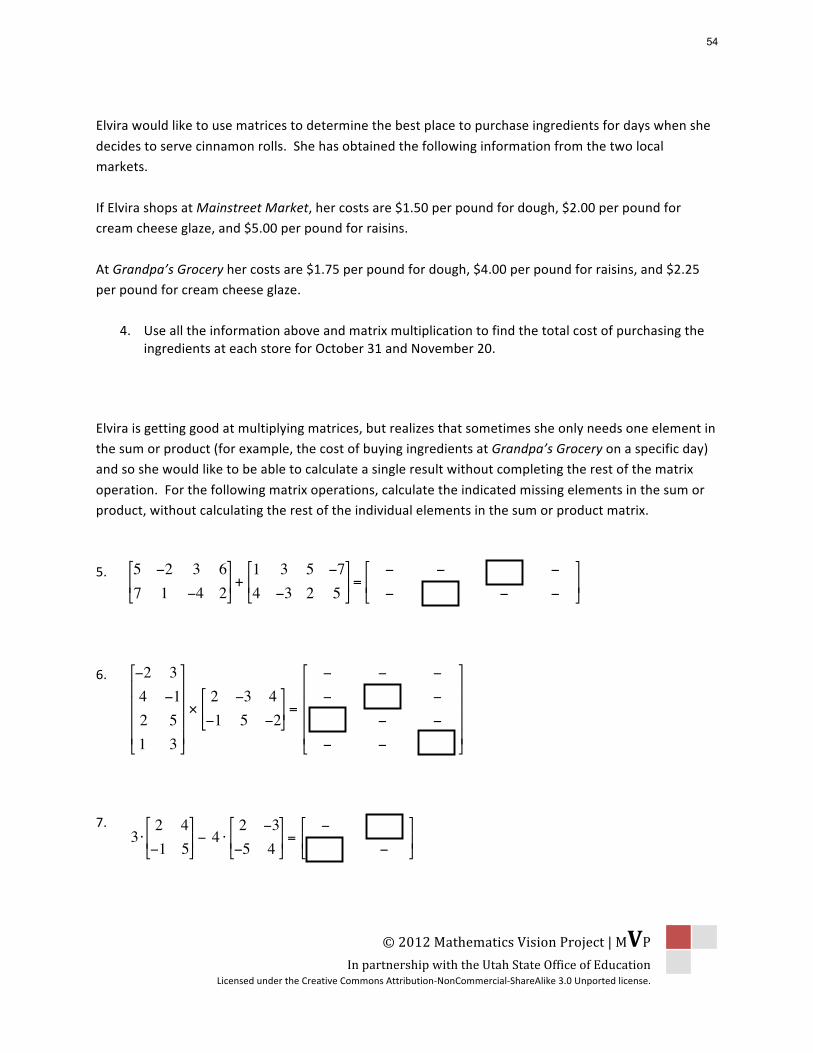
© 2012 Mathematics Vision Project | MVP In partnership with the Utah State Office of Education
Licensed under the Creative Commons Attribution‐NonCommercial‐ShareAlike 3.0 Unported license.
Elvira would like to use matrices to determine the best place to purchase ingredients for days when she
decides to serve cinnamon rolls. She has obtained the following information from the two local markets.
If Elvira shops at Mainstreet Market, her costs are $1.50 per pound for dough, $2.00 per pound for cream cheese glaze, and $5.00 per pound for raisins.
At Grandpa’s Grocery her costs are $1.75 per pound for dough, $4.00 per pound for raisins, and $2.25 per pound for cream cheese glaze.
4. Use all the information above and matrix multiplication to find the total cost of purchasing the ingredients at each store for October 31 and November 20.
Elvira is getting good at multiplying matrices, but realizes that sometimes she only needs one element in the sum or product (for example, the cost of buying ingredients at Grandpa’s Grocery on a specific day) and so she would like to be able to calculate a single result without completing the rest of the matrix
operation. For the following matrix operations, calculate the indicated missing elements in the sum or product, without calculating the rest of the individual elements in the sum or product matrix.
5.
6.
7.
€
5 −2 3 67 1 −4 2
+
1 3 5 −74 −3 2 5
=
− − −
− − −
€
−2 34 −12 51 3
×2 −3 4−1 5 −2
=
− − −
− −
− −
− −
€
3 ⋅2 4−1 5
− 4 ⋅
2 −3−5 4
=
−
−
54

© 2012 Mathematics Vision Project | MVP In partnership with the Utah State Office of Education
Licensed under the Creative Commons Attribution‐NonCommercial‐ShareAlike 3.0 Unported license.
The Arithmetic of Matrices – Teacher Notes A Practice Understanding Task
Purpose: The purpose of this task is to practice using matrices to organize information in a way that
allows several similar computations to be represented simultaneously. A particular focus is on setting up matrices in such a way that the row by column procedure for multiplying matrices make sense. Students practice carrying out the operation of matrix multiplication and interpreting the resulting
product in terms of the context. The last problems of the task remind students of the differences in the way individual elements of matrices are combined during matrix addition and matrix multiplication. Scalar multiplication and subtraction of matrices are also addressed.
Core Standards Focus:
N.VM.8 Add, subtract, and multiply matrices of appropriate dimensions.
Related Standards: N.Q.1, N.VM.6, N.VM.7
Launch (Whole Class):
Read through the scenario given in the first two paragraphs, emphasizing the idea that “matrices organize information so we can keep track of several computations simultaneously.” Ask students for examples of what that sentence means. (In the previous task we needed to calculate the cost buying
ingredients for several different events and two different stores. This work involved several different computations, but all such computations can be represented by a single matrix multiplication equation.) Make sure students are comfortable with the expectations of the first few questions on the task, then
set them to work.
Explore (Small Group):
While students can represent the data in each individual question using different matrices (e.g., exchanging rows with columns), not all arrangements of data into matrices will make the matrices compatible for multiplication. Students should draw upon their size compatibility rule as well as their
thinking about the compatibility of quantities and units while working on these questions. For example, if the first matrix is organized as a “type of cinnamon roll by ingredients” matrix and the second matrix is organized as a “type of cinnamon roll by day” matrix, then the product doesn’t have meaning in terms of
the context, even though the sizes of the matrices are compatible for multiplication. On the other hand, if the first matrix is organized as an “ingredients by type of cinnamon roll” matrix and the second is organized as a “type of cinnamon roll by day” matrix, then the product is meaningful as an “ingredient
by day” matrix. You might want to allow this dilemma to persist during the explore by identifying students who correctly structure the matrix multiplication to have meaning in the context, as well as those who do not, so that two different product matrices can be presented and discussed during a
whole class discussion. Alternatively, press students who, in question 3, have multiplied matrices
55
© 2012 Mathematics Vision Project | MVP In partnership with the Utah State Office of Education
Licensed under the Creative Commons Attribution‐NonCommercial‐ShareAlike 3.0 Unported license.
without regard to the meaning of the partial products, to explain what each element in the product matrix represents. Ask them to carry out a specific computation, based on the numbers given in the
context, and compare it to the value they found using matrix multiplication. For example, if students say that a particular element in their product matrix represents the amount of raisins needed on Oct. 31, have them calculate this amount:
(0.25 lbs of raisins per dozen glazed rolls × 30 dozen glazed rolls made on Oct. 31) + (0.25 lbs of
raisins per dozen plain cinnamon rolls with raisins × 20 dozen plain cinnamon rolls with raisins
made on Oct. 31) = 12.5 lbs of raisins required on Oct. 31
Then have students compare this amount to the value that occurs in their matrix.
To help scaffold students who are struggling with this work, suggest that they determine what the row and column labels would be on the matrix that contains the answer to the question posed in question 3.
Then have them determine what the rows and columns would be labeled in the matrices that are the factors in their matrix equation.
On the last three problems, encourage students to only find the target elements in the sum, product or difference matrices without computing the other outcomes. This will require students to think about
where the numbers in the answer matrix come from, rather than just carrying out a procedure by rote memorization.
Discuss (Whole Class):
If the issue of making the quantities and units of the rows and columns compatible has not been clarified in small groups, then make this issue the focus of a whole class discussion by having two groups
who have different matrix multiplication equations for question 3 present their work. Use the discussion outlined in the explore phase of these teacher notes to clarify this issue.
A short discussion about what students needed to attend to when finding a specific element in the sum, difference or product matrix may be helpful, particularly contrasting how the element in row 2 column 2
was found for the sum matrix in question 5 and the product matrix in question 6. It may be helpful to introduce notation such as a2,2 to represent this element.
Aligned Ready, Set, Go: Getting Ready 13
56
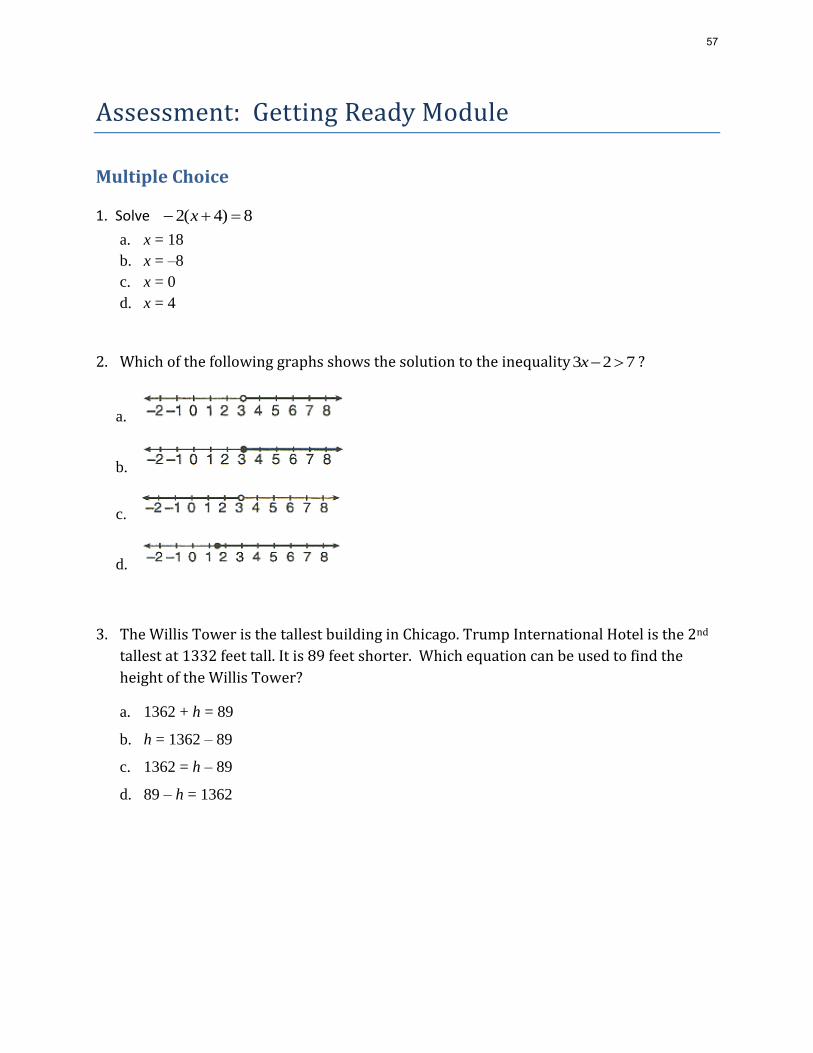
Assessment: Getting Ready Module
Multiple Choice
1. Solve 8)4(2 x
a. x = 18
b. x = –8
c. x = 0
d. x = 4
2. Which of the following graphs shows the solution to the inequality 3 2 7x ?
a.
b.
c.
d.
3. The Willis Tower is the tallest building in Chicago. Trump International Hotel is the 2nd
tallest at 1332 feet tall. It is 89 feet shorter. Which equation can be used to find the
height of the Willis Tower?
a. 1362 + h = 89
b. h = 1362 – 89
c. 1362 = h – 89
d. 89 – h = 1362
57

4. Four friends want to catch a cab from the airport. They don’t want to spend more than $50.00 for their trip. Rico’s Cab Company prices are:
$3.25 initial fee Add $1 for second passenger Add $0.50 for each additional passenger Add $1.95 per mile
Which inequality will help to find the number of miles they will be able to go? a. 5.25 + 1.95m ≥ 50
b. 5.25 + 1.95m > 50
c. 5.25 + 1.95m ≤ 50
d. 5.25 + 1.95m < 50
5. Solve the following equation for x.
3
1(18x + 12) = –3x + 40
A. x = –21
B. x = 4
C. x = 5
D. x = 12
6. If C = 2r, what is r equal to?
A. r = C 2
B. r = C + 2
C. r = 2C
D. 2
Cr
7. Solve for x:
( ) 0 5
A. 10x
B. 10x
C. 10.5x
D. 28
3x
58
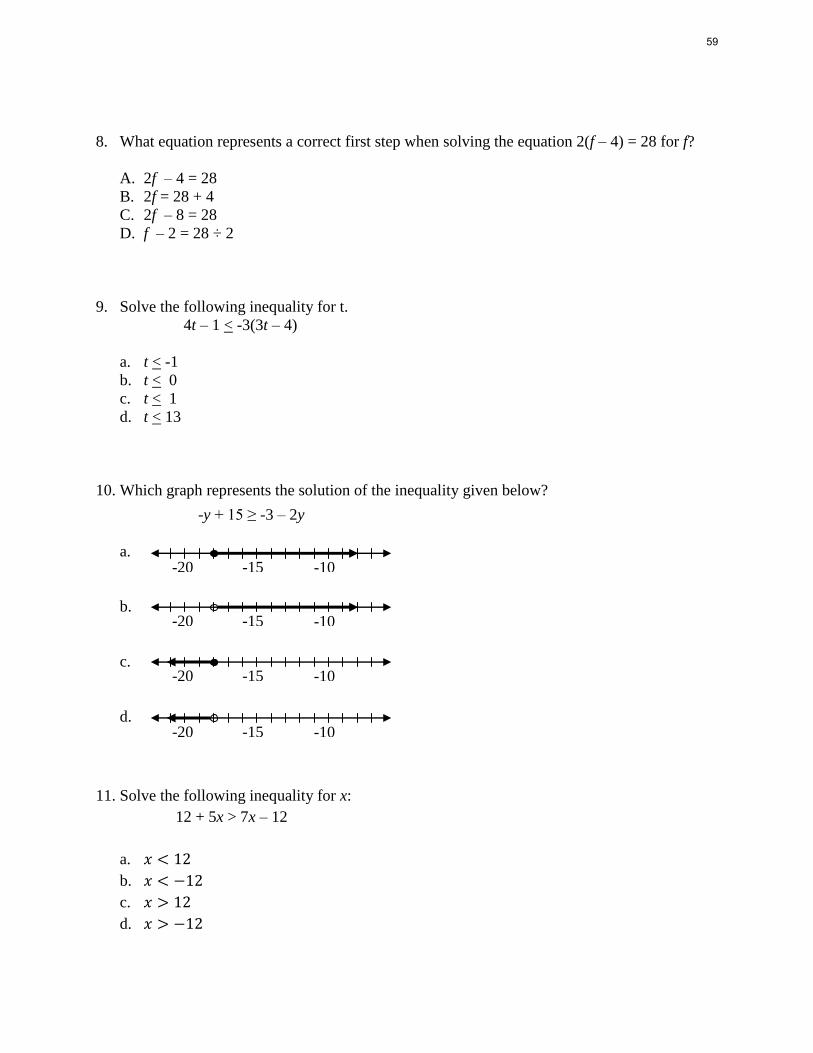
8. What equation represents a correct first step when solving the equation 2(f – 4) = 28 for f?
A. 2f – 4 = 28
B. 2f = 28 + 4
C. 2f – 8 = 28
D. f – 2 = 28 ÷ 2
9. Solve the following inequality for t.
4t – 1 < -3(3t – 4)
a. t < -1
b. t < 0
c. t < 1
d. t < 13
10. Which graph represents the solution of the inequality given below?
-y + 15 ≥ -3 – 2y
a.
b.
c.
d.
11. Solve the following inequality for x:
12 + 5x > 7x – 12
a.
b.
c.
d.
-10 -15 -20
-10 -15 -20
-10 -15 -20
-10 -15 -20
59

12. Solve for x in the following equation:
y = mx + b
a. y bx
m
b. y bx
m
c. y
x bm
d. b
x ym
13. If the distributive property was used as the next step in solving the equation below, which
equation is the correct next step?
3(x 2) 12 2(x 1)
a. 3x6122x1
b. 3x2122x1
c. 3x6122x2
d. 3x6122x2
14. Bonnie’s Beauty Supply pays its supplier $65 for each box of 12 bottles of shampoo. Bonnie
wants to determine the least amount x she can charge his customers per shampoo bottle in order
to make at least a 50% profit per box. Which inequality should she use?
a. .5( 5) b. 5 .5( ) c. 0.50( ) 5
d. 0.50( ) 5
15. Given
2 3 2
4 1 3
5 2
3 4
1 2
60

The dimensions of the product matrix formed when these two matrices are multiplied would be:
a. 3 2
b. 2 2
c. 3 3
d. It is impossible to perform this matrix multiplication, since the factor matrices have
different dimensions
Short Answer 1. Charlie solved the following equation using the steps shown below. On the lines provided, give a
justification for each step.
4(x1)7x2x5
Step 1: 4x 4 7x 2x 5
Step 2: 4x49x5
Step 3: 5x45
Step 4: 5x9
Step 5: x 9
5
2. The perimeter of a rectangle is given by P = 2W + 2L. Solve for W and restate in words the
meaning of this new formula in terms of the meaning of the other variables.
3. The service club wants to buy bracelets with the school logo on them. Each bracelet
costs $0 .75. The company also charges $3.00 for shipping. If the club spends
61

$13.50 for the purchase, how many bracelets did they buy? Show your work and explain your answer.
4. If , is
? Explain why or why not.
5. An elevator can safely hold no more than 1000 lbs. If too many people get on the
elevator, an alarm goes off to alert the passengers that the elevator is overloaded. If the average person weighs 165 pounds, how many people can enter the elevator without setting off the alarm.
Given:
A 2 5
3 4
B
3 2
5 4
Find:
6. 2A + B
7. A B
62
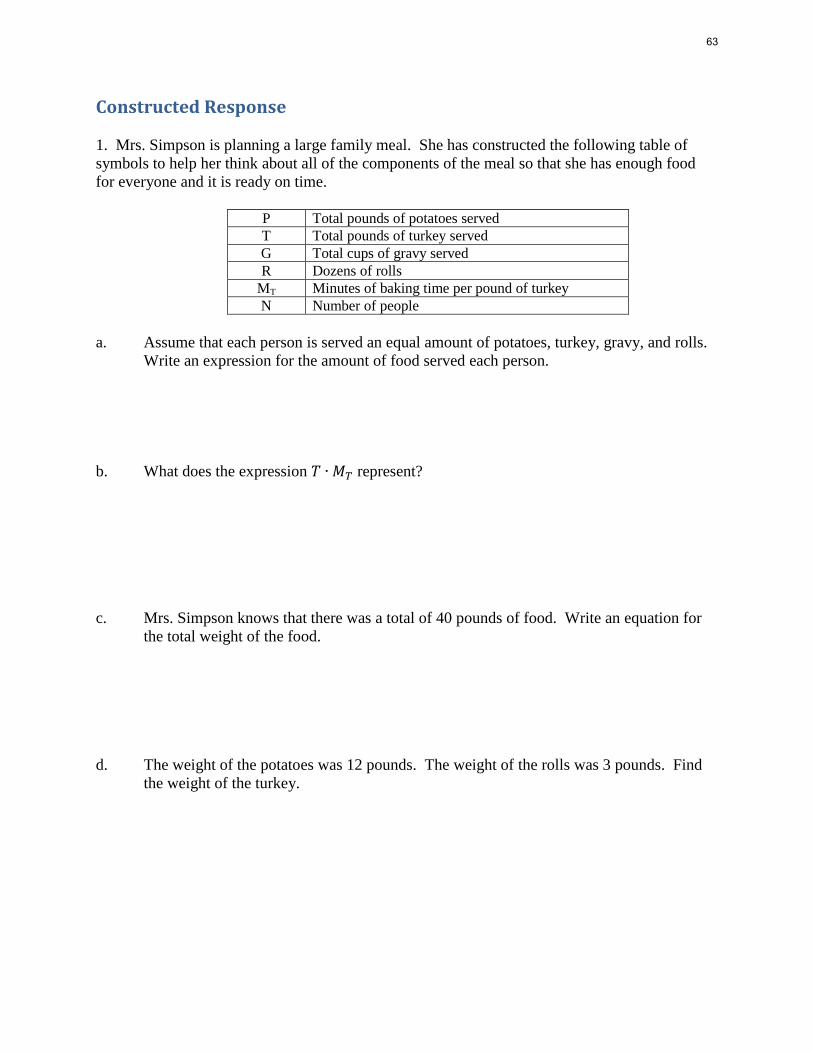
Constructed Response
1. Mrs. Simpson is planning a large family meal. She has constructed the following table of
symbols to help her think about all of the components of the meal so that she has enough food
for everyone and it is ready on time.
P Total pounds of potatoes served
T Total pounds of turkey served
G Total cups of gravy served
R Dozens of rolls
MT Minutes of baking time per pound of turkey
N Number of people
a. Assume that each person is served an equal amount of potatoes, turkey, gravy, and rolls.
Write an expression for the amount of food served each person.
b. What does the expression represent?
c. Mrs. Simpson knows that there was a total of 40 pounds of food. Write an equation for
the total weight of the food.
d. The weight of the potatoes was 12 pounds. The weight of the rolls was 3 pounds. Find
the weight of the turkey.
63

2. Chris likes to watch pay-per-view movies from his cable company. He pays $29.99 per
month for cable service and $4.99 for each movie he watches. He has budgeted $100 per
month for movies with his cable service.
a. Write an inequality that shows that the amount Chris spends for movies and cable
service must not be more than the $100 he has budgeted.
b. Graph the solution to the inequality that you have written.
c. Do all the solutions graphed on your number line make sense in Chris’ situation?
d. Is 3 a solution to the inequality? Explain why or why not.
3. Ye Olde-Fashioned Ice Cream Shoppe
64

The owners of Ye Olde-Fashioned Ice Cream Shoppe have a reputation in your community for
producing the best tasting ice cream on earth. One of the secrets of their success is that they only
use fresh dairy ingredients, which they purchase daily. Since there are now two stores in town,
the Ice Cream Shoppe owners are trying to decide where they should purchase these ingredients.
Overwhelmed with the data, they have approached you to help them make their decision.
Here is the information they have given you:
All ice cream at the Ice Cream Shoppe is made from two basic recipes, to which various
flavors, fruits, nuts and candy are added to create a variety of tastes. A batch of “light” ice
cream uses 1.5 dozen eggs, 2.5 gallons of cream, and 5.5 gallons of milk. A batch of “extra
rich” ice cream uses 2 dozen eggs, 5 gallons of cream, and 3 gallons of milk.
The owners have noticed that the demand for their ice cream is higher on weekends and
holidays. On weekdays they need to make 6 batches of “light” ice cream and 10 batches of
“extra rich.” On weekend days they need to make 6 batches of “light” ice cream and 12
batches of “extra rich.” On holidays they need to make 8 batches of “light” ice cream and 15
batches of “extra rich.”
a. How many dozen eggs, gallons of cream and gallons of milk need to be purchased each day?
Create a “shopping list for the Ice Cream Shoppe employees by organizing the above data
into matrices and then finding the product matrix. Label the rows and columns of your
matrices so the meaning of each entry is clear.
The two stores in town charge different amounts for each ingredient. At Our Town
Market eggs cost $1.25 per dozen, cream is $3.00 per gallon and milk is $2.75 per gallon.
At Neighborhood Store eggs cost $1.15 per dozen, cream is $3.25 per gallon and milk is
$2.60 per gallon.
b. Which store would you recommend purchasing the ingredients from? Use matrices to show
how you determined which store to recommend.
65