station models lab shortened - hmxearthscience -...
TRANSCRIPT

Station ModelsBEGIN

NEXT LAST HOME
In trying to understand and predict the weather, meteorologists constantly monitor a number of variables. These include (but are not limited to) the following:
• Temperature• Relative Humidity• Dew Point• Wind Speed• Wind Direction• Air Pressure
• Pressure Trend• Cloud Cover• Visibility• Precipitation Type• Precipitation Amount• Present Conditions

NEXT LAST HOME
As you can imagine, it’s extremely challenging to express and communicate this quantity of data, especially when these variables are constantly changing.

NEXT LAST HOME
To deal with this, meteorologists have devised a system of symbols and numbers to communicate weather data quickly and easily.
This system is called a station model.

Temperature
Freezingrain
Haze
Rain
FogSnow
Hail Rainshowers
Thunder-storms
Drizzle
Sleet
Smog
Snowshowers
Air Masses
cA
cP
cT
mT
mP
continental arctic
continental polar
continental tropical
maritime tropical
maritime polar
Cold
Warm
Stationary
Occluded
Present Weather Fronts Hurricane
Tornado
Pressure
196+19/
.25
28
27
12
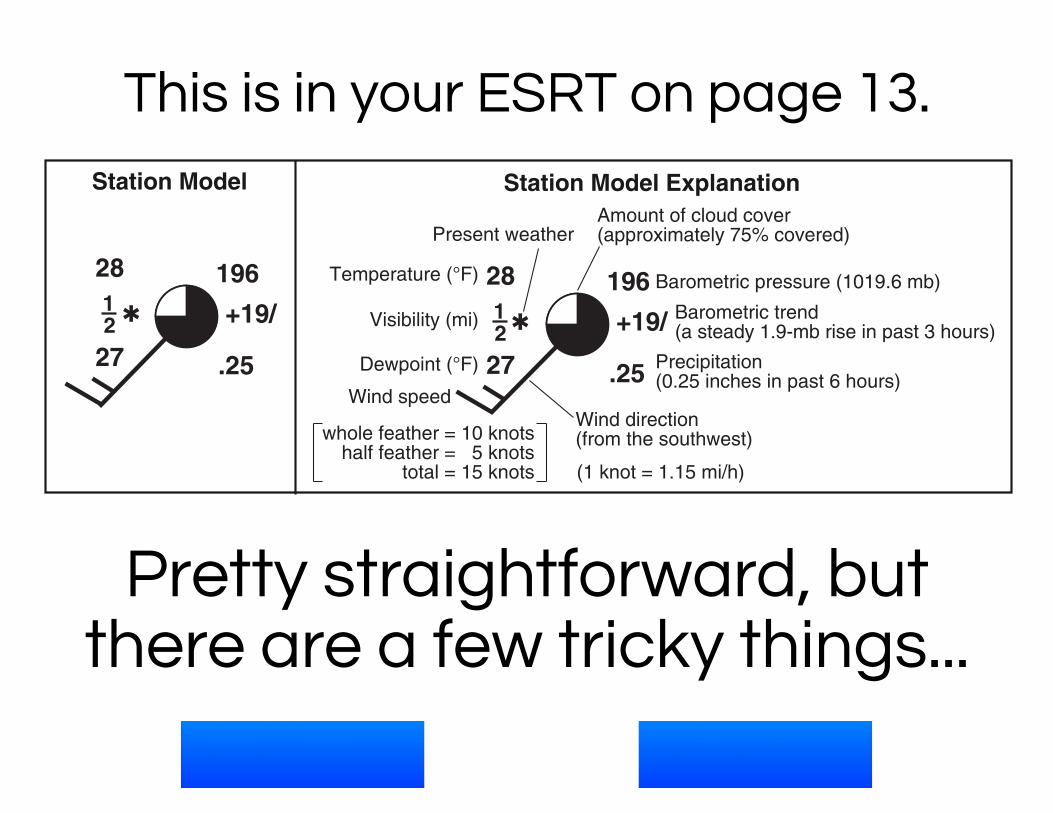
Station Model Station Model Explanation
Water boils220
200
180
160
140
120
100
80
60
40
20
0
–20
–40
–60
Room temperature
Water freezes
110
100
90
80
70
60
50
40
30
20
10
0
–10
–20
–30
–40
–50
380
370
360
350
340
330
320
310
300
290
280
270
260
250
240
230
220
One atmosphere
30.701040.0
1036.0
1032.0
1028.0
1024.0
1020.0
1016.0
1012.0
1008.0
1004.0
1000.0
996.0
992.0
988.0
984.0
980.0
976.0
972.0
968.0
30.60
30.50
30.40
30.30
30.20
30.10
30.00
29.90
29.80
29.70
29.60
29.50
29.40
29.30
29.20
29.10
29.00
28.90
28.80
28.70
28.60
28.50
Key to Weather Map Symbols
Physical Setting/Earth Science Reference Tables — 2011 Edition 13
NEXT LAST HOME
This is an example of a station model.
Let’s see what each number means.
Temperature
Freezingrain
Haze
Rain
FogSnow
Hail Rainshowers
Thunder-storms
Drizzle
Sleet
Smog
Snowshowers
Air Masses
cA
cP
cT
mT
mP
continental arctic
continental polar
continental tropical
maritime tropical
maritime polar
Cold
Warm
Stationary
Occluded
Present Weather Fronts Hurricane
Tornado
Pressure
196+19/
.25
28
27
12
Station Model Station Model Explanation
Water boils220
200
180
160
140
120
100
80
60
40
20
0
–20
–40
–60
Room temperature
Water freezes
110
100
90
80
70
60
50
40
30
20
10
0
–10
–20
–30
–40
–50
380
370
360
350
340
330
320
310
300
290
280
270
260
250
240
230
220
One atmosphere
30.701040.0
1036.0
1032.0
1028.0
1024.0
1020.0
1016.0
1012.0
1008.0
1004.0
1000.0
996.0
992.0
988.0
984.0
980.0
976.0
972.0
968.0
30.60
30.50
30.40
30.30
30.20
30.10
30.00
29.90
29.80
29.70
29.60
29.50
29.40
29.30
29.20
29.10
29.00
28.90
28.80
28.70
28.60
28.50
Key to Weather Map Symbols
Physical Setting/Earth Science Reference Tables — 2011 Edition 13NEXT LAST HOME
This is in your ESRT on page 13.
Pretty straightforward, but there are a few tricky things...

NEXT LAST HOME
Coding Air PressureAir pressure is a very important weather variable. High air pressure means clear,
dry weather while low air pressure means cloudy, humid weather.

NEXT LAST HOME
Air pressure is measured with a barometer. It is generally measured in millibars (mb).

NEXT LAST HOME
The normal range of air pressures on Earth is shown below.
LOW950.0 mb
HIGH1050.0 mb
AVERAGE1000.0 mb

NEXT LAST HOME
LOW950.0 mb
HIGH1050.0 mb
AVERAGE1000.0 mb
But we don’t want to waste space writing these long numbers on
our nice, simple station models.

NEXT LAST HOME
LOW950.0 mb
HIGH1050.0 mb
AVERAGE1000.0 mb
So, we shorten (or “code”) the pressure numbers.

NEXT LAST HOME
For example, say our air pressure is 989.6 mb.
Here’s how we shorten it...
989.6 mbDROP THE UNITS

NEXT LAST HOME
For example, say our air pressure is 989.6 mb.
Here’s how we shorten it...
989.6 mbDROP THE DECIMAL POINT

NEXT LAST HOME
For example, say our air pressure is 989.6 mb.
Here’s how we shorten it...
989.6 mbDROP THE FIRST “9” OR “10,” WHATEVER IT STARTS WITH

NEXT LAST HOME
So a pressure of 989.6 mb is written on a station model as...
896

NEXT LAST HOME
Here’s another example, say our air pressure is
1007.3 mb...
1007.3 mb

NEXT LAST HOME
So here are the rules for shortening air pressures.
1. Drop the “9” or the “10”2. Drop the decimal point3. Drop the “mb”RECORD THESE RULES FOR QUESTION #4 ON YOUR LAB
SHEET, THEN COMPLETE THE CONVERSION FOR #5.

NEXT LAST HOME
But what if we have a station model and need to know what
the pressure is?

NEXT LAST HOME
107
For example, what if we wanted to know what the air pressure at
this location actually is?

NEXT LAST HOME
1.If the number on the station model is greater than 500, add a “9” before it. If it’s less than 500, add a “10” before it.
2.Add a decimal point before the last digit.3.Add units (mb).
107
1010.7 mb

NEXT LAST HOME
1.If the number on the station model is greater than 500, add a “9” before it. If it’s less than 500, add a “10” before it.
2.Add a decimal point before the last digit.3.Add units (mb).
630
963.0 mb

NEXT LAST HOME
1.If the number on the station model is greater than 500, add a “9” before it. If it’s less than 500, add a “10” before it.
2.Add a decimal point before the last digit.3.Add units (mb).RECORD THESE RULES FOR QUESTION #6 ON YOUR LAB
SHEET, THEN COMPLETE THE CONVERSION FOR #7.

NEXT LAST HOME
The other thing that’s tricky is the barometric trend.
Temperature
Freezingrain
Haze
Rain
FogSnow
Hail Rainshowers
Thunder-storms
Drizzle
Sleet
Smog
Snowshowers
Air Masses
cA
cP
cT
mT
mP
continental arctic
continental polar
continental tropical
maritime tropical
maritime polar
Cold
Warm
Stationary
Occluded
Present Weather Fronts Hurricane
Tornado
Pressure
196+19/
.25
28
27
12
Station Model Station Model Explanation
Water boils220
200
180
160
140
120
100
80
60
40
20
0
–20
–40
–60
Room temperature
Water freezes
110
100
90
80
70
60
50
40
30
20
10
0
–10
–20
–30
–40
–50
380
370
360
350
340
330
320
310
300
290
280
270
260
250
240
230
220
One atmosphere
30.701040.0
1036.0
1032.0
1028.0
1024.0
1020.0
1016.0
1012.0
1008.0
1004.0
1000.0
996.0
992.0
988.0
984.0
980.0
976.0
972.0
968.0
30.60
30.50
30.40
30.30
30.20
30.10
30.00
29.90
29.80
29.70
29.60
29.50
29.40
29.30
29.20
29.10
29.00
28.90
28.80
28.70
28.60
28.50
Key to Weather Map Symbols
Physical Setting/Earth Science Reference Tables — 2011 Edition 13
NEXT LAST HOME
The barometric trend tells you how the air
pressure has changed over the past 3 hours.

NEXT LAST HOME
Here are some examples:
-07\
This means the air pressure has decreased by 0.7 mb during the past 3 hours.

NEXT LAST HOME
Here are some examples:
+23/
This means the air pressure has increased by 2.3 mb during the past 3 hours.

NEXT LAST HOME
OK, now for some practice.
On the next 8 slides, you will be given actual station models from past Regents exams. In the space provided in question #9 on your lab, please list all data that is
represented on these station models.

NEXT LAST HOME
STATION MODEL #1
Part B–1
Answer all questions in this part.
Directions (36–50): For each statement or question, write on your separate answer sheet the number of theword or expression that, of those given, best completes the statement or answers the question. Some questionsmay require the use of the Earth Science Reference Tables.
Base your answers to questions 36 through 38 on the weather map below, which shows a low-pressure system over the eastern United States. Letters A through D represent weather stations.
36 Which station model correctly represents the barometric pressure at station A?
37 Which weather instrument was used to measure wind speed at station D?(1) barometer (3) psychrometer(2) thermometer (4) anemometer
38 Surface winds within this low-pressure system most likely are flowing(1) toward the center in a clockwise pattern(2) toward the center in a counterclockwise pattern(3) away from the center in a clockwise pattern(4) away from the center in a counterclockwise pattern
15091 17091 1015.0 mb91 1017.0 mb91
80
( 1 )
80
( 2 )
80
( 3 )
80
( 4 )
N
Low
A
B
CD
1008
4565
80
7870
7565
1012
1016 91
1020
P.S./E. Sci.–June ’09 [11] [OVER]

NEXT LAST HOME
STATION MODEL #2
Base your answers to questions 61 through 63 on the block diagrams below, which show three types ofstreams with equal volumes.
61 Explain how the differences between the type 1 and type 3 stream channels indicatethat the average velocities of the streams are different. [1]
62 Explain why the outside of the curve of a meandering channel experiences moreerosion than the inside of the curve. [1]
63 Explain how the cobbles and pebbles that were transported by these streamsbecame smooth and rounded in shape. [1]
Base your answers to questions 64 and 65 on the station model below, which shows the weather conditionsat Rochester, New York, at 4 p.m. on a particular day in June.
64 What was the actual barometric pressure, according to the station model, to thenearest tenth of a millibar? [1]
65 The winds shown by this station model were blowing from which compass directionand at what wind speed? [1]
021
–25\
.50
83
82
Narrow, V-shapedvalley
Wider valley withsloping walls
Broad valley with wide,swampy flood plain
Levees
Straight channel Floodplain
Oxbowlake
Meanderingchannel
Windingchannel
Type 1 Type 2 Type 3
P.S./E. Sci.–June ’05 [17] [OVER]
NEXT LAST HOME
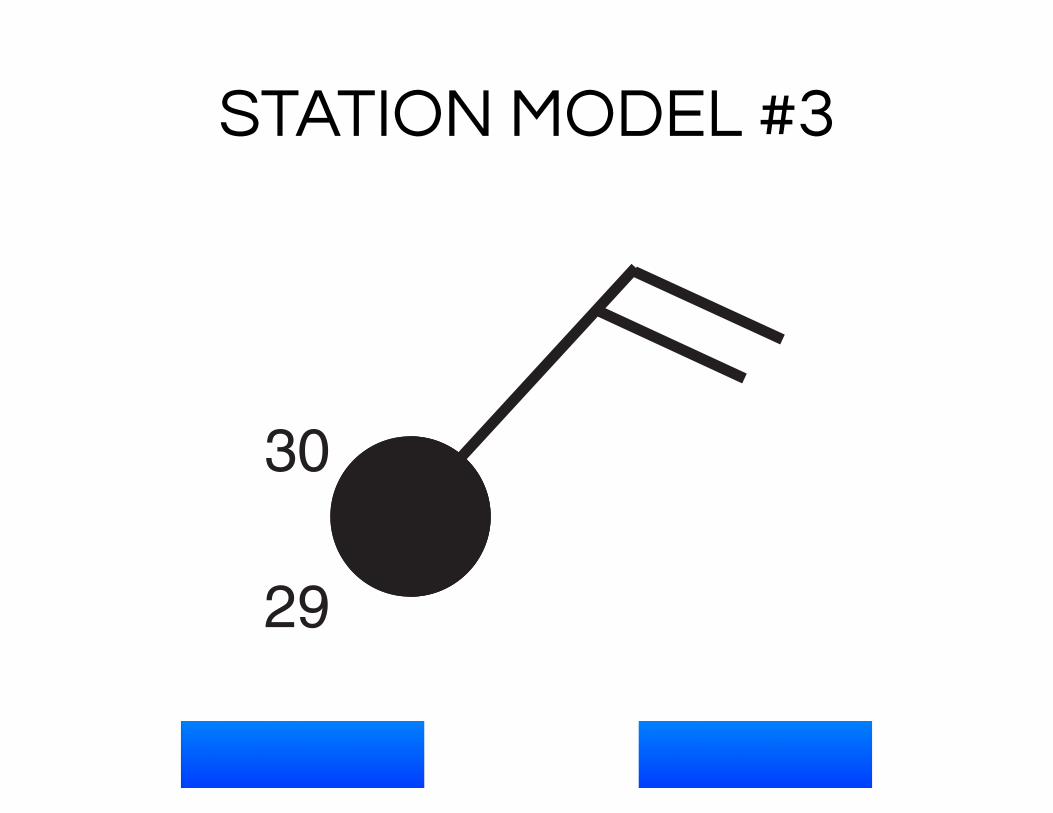
STATION MODEL #3
11 The diagrams below show apparent changes in the positions of the stars in the Big Dipper that haveoccurred in the past 200,000 years. The directions of individual star movements as seen from Earth areshown by the arrows.
Which diagram best represents how the Big Dipper will appear when viewed fromEarth in 200,000 years?
12 On which station model would the present weather symbol *most likely be found?
( 4 )
48
42
( 1 )
70
69
( 3 )
30
29
( 2 )
28
16
( 1 )
A
BC
DE F G
( 2 )
A B
C
DE
F
G
( 3 )
A
B
C DE
FG
( 4 )
A BC
D
E F
G
G
A BC
DE F
As it was 200,000 years ago As it is today
A
BC
D
E F
G
P.S./E. Sci.–Jan. ’09 [3] [OVER]

NEXT LAST HOME
STATION MODEL #4
P.S./E. Sci.–June ’07 [7] [OVER]
29 Which station model shows the correct form for indicating a northwest wind at 25 knots and an air pressureof 1023.7 mb?
30 The data table below shows the mass and volume of three samples of the same mineral. [The densitycolumn is provided for student use.]
Data Table
Which graph best represents the relationship between the density and the volume ofthese mineral samples?
( 1 ) ( 3 )
Dens
ity
Volume
Dens
ity
Volume
( 2 ) ( 4 )
Dens
ity
Volume
Dens
ity
Volume
Sample Mass (g) Volume (cm3) Density (g/cm3)A 50 25B 100 50C 150 75
237
237
( 4 )
1023.7
( 3 )( 2 )( 1 )
1023.7

NEXT LAST HOME
STATION MODEL #5
17 The cross section below shows the flow of windsover a mountain ridge.
The heaviest rainfall would most likely occur onwhich side of this mountain and in which type ofair mass?(1) on the leeward side, in a mP air mass(2) on the leeward side, in a cT air mass(3) on the windward side, in a mT air mass(4) on the windward side, in a cP air mass
18 Various weather conditions at LaGuardia Airportin New York City are shown on the station modelbelow.
What were the barometric pressure and weatherconditions at the airport at the time of the obser-vation?(1) 914.6 mb of pressure and smog(2) 914.6 mb of pressure and a clear sky(3) 1014.6 mb of pressure and smog(4) 1014.6 mb of pressure and a clear sky
19 The properties of an air mass are mostly deter-mined by the (1) rate of Earth’s rotation (2) direction of Earth’s surface winds(3) source region where the air mass formed(4) path the air mass follows along a land surface
20 Which list correctly matches each instrumentwith the weather variable it measures?(1) wind vane—wind speed
thermometer—temperatureprecipitation gauge—relative humidity
(2) wind vane—wind directionthermometer—dewpointpsychrometer—air pressure
(3) barometer—relative humidityanemometer—cloud coverprecipitation gauge—probability of
precipitation
(4) barometer—air pressureanemometer—wind speedpsychrometer—relative humidity
21 What is the difference between the dry-bulbtemperature and the wet-bulb temperature whenthe relative humidity is 28% and the dry-bulbtemperature is 0°C?(1) 11°C (3) 28°C(2) 2°C (4) 4°C
22 Based on the theory of plate tectonics, it isinferred that over the past 250 million yearsNorth America has moved toward the(1) northwest (3) southeast(2) southwest (4) northeast
23 According to tectonic plate maps, New York Stateis presently located(1) at a convergent plate boundary(2) above a mantle hot spot(3) above a mid-ocean ridge(4) near the center of a large plate
P.S./E. Sci.–Jan. ’06 [4]
MountainOcean
Wind
Windwardside
Leewardside
34
146
.06
43
40

NEXT LAST HOME
STATION MODEL #6
11 The diagrams below show apparent changes in the positions of the stars in the Big Dipper that haveoccurred in the past 200,000 years. The directions of individual star movements as seen from Earth areshown by the arrows.
Which diagram best represents how the Big Dipper will appear when viewed fromEarth in 200,000 years?
12 On which station model would the present weather symbol *most likely be found?
( 4 )
48
42
( 1 )
70
69
( 3 )
30
29
( 2 )
28
16
( 1 )
A
BC
DE F G
( 2 )
A B
C
DE
F
G
( 3 )
A
B
C DE
FG
( 4 )
A BC
D
E F
G
G
A BC
DE F
As it was 200,000 years ago As it is today
A
BC
D
E F
G
P.S./E. Sci.–Jan. ’09 [3] [OVER]

NEXT LAST HOME
STATION MODEL #7
Base your answers to questions 69 through 72 on the four weather station models, A, B, C, and D, below.
69 In your answer booklet, list the letters of the four station models, in order, from thestation with the highest air-pressure reading to the station with the lowestair-pressure reading. [1]
70 Convert the air temperature at station A into degrees Celsius. [1]
71 What evidence indicates that station C has the highest relative humidity? [1]
72 On station model D in your answer booklet, draw the proper symbol to indicate a 25-knot wind coming from the west. [1]
Base your answers to questions 73 through 75 on the map in your answer booklet, which shows the inferredposition of Earth’s landmasses at a particular time in Earth’s history. The Taconic Mountains are shown near asubduction zone where they formed after the coast of Laurentia collided with a volcanic island arc, closing thewestern part of the Iapetus Ocean.
73 On the map in your answer booklet, place an X to show the approximate location ofthe remaining part of the Iapetus Ocean. [1]
74 On the map in your answer booklet, draw an arrow on the Laurentia landmass toshow its direction of movement relative to the subduction zone. [1]
75 Identify the geologic time period represented by the map. [1]
A
82
62
012
B
56
49
999
C
78
75
978
D
32
24
002
P.S./E. Sci.–Jan. ’10 [18]

NEXT LAST HOME
STATION MODEL #8
14 The weather instrument shown below can be used to determine dewpoint.
Based on the values shown, the dewpoint is(1) –5°C (3) 8°C(2) 2°C (4) 33°C
15 Which arrangement of the Sun, the Moon, and Earth results in the highest high tides, and the lowest lowtides on Earth? (Diagrams are not drawn to scale.)
16 Which station model correctly represents the weather conditions in an area that is experiencing winds fromthe northeast at 25 knots and has had a steady drop in barometric pressure of 2.7 millibars during the lastthree hours?
( 4 )( 3 )( 1 ) ( 2 )
S E
M
S EM
S M E S E
M
( 1 ) ( 2 ) ( 3 ) ( 4 )
–27\
–27\
–27 \
–27\
Wet cloth wick
Reservoirof water
P.S./E. Sci.–June ’08 [5] [OVER]

NEXT LAST HOME
Good job...
OK, now, on the next 4 slides, you will be given weather data for four different locations. In the space provided in
question #10 on your lab, please draw complete station models to represent this
data. Be sure to use the correct format as seen in your ESRT.

NEXT LAST HOME
STATION MODEL A
Temperature: 74°F Precipitation: 0.1 inches
Dew Point: 72°F Cloud Cover: 100%
Visibility: ¼ mile Wind Direction: Southwest
Present Weather: Drizzle Wind Speed: 15 knots
Air Pressure: 987.4 mb Barometric Trend: Dropped 2 mb

NEXT LAST HOME
STATION MODEL B
Temperature: 91°F Precipitation: 1.5 inches
Dew Point: 84°F Cloud Cover: 100%
Visibility: ¾ mile Wind Direction: North
Present Weather: Thunderstorm Wind Speed: 35 knots
Air Pressure: 979.1 mb Barometric Trend: Dropped 4 mb

NEXT LAST HOME
STATION MODEL C
Temperature: 24°F Precipitation: 0.3 inches
Dew Point: 22°F Cloud Cover: 100%
Visibility: ¼ mile Wind Direction: Northeast
Present Weather: Snow Showers Wind Speed: 10 knots
Air Pressure: 989.9 mb Barometric Trend: Rose 1 mb

NEXT LAST HOME
STATION MODEL D
Temperature: 57°F Precipitation: 0 inches
Dew Point: 42°F Cloud Cover: 25%
Visibility: 2 miles Wind Direction: Southwest
Present Weather: None Wind Speed: 5 knots
Air Pressure: 1011.1 mb Barometric Trend: Rose 1.4 mb

NEXT LAST HOME
Nice job. You’re done.