tackling a level math papers 2008 revised 2 - us and … ‘a’ level h1 & h2 math ... 1....
TRANSCRIPT

Tackling ‘A’ level
H1 & H2 Math 8863 & 9740 Papers
(Oct/Nov 2008)
with
TI‐84 Plus
© Interactive Math Exploration Centre ALL RIGHTS RESERVED. No part of this document may be reproduced or transmitted in any form or by any means, electronic or mechanical, including photocopying, or by any information storage and retrieval system, without permission in writing from the Publisher. First Published August 2009 ISBN No. 978-981-08-3785-3 ISBN No. 978-981-08-3786-0
Interactive Math Exploration Centre Corresponding Office: Blk 231, Bain Street, #04-39, Bras Basah Complex, Singapore 180231 Tel: (65) 6334 6067 • Fax: (65) 6334 0475 • Email: [email protected]
© InterActive Math Exploration Centre
1
Table of Content 1. Solution to A level H2 Math Paper 1 2 –18
2. Solution to A level H2 Math Paper 2 19 – 36
3. Solution to A level H1 Math Paper 37 – 54
© InterActive Math Exploration Centre
2
Solution to A level H2 Math Paper 1
1 Since the two shaded areas are equal, we have
2
1dy x∫ =
4dy
ax∫
2 2
1dx x∫ =
4dy
ay∫
23
13x⎡ ⎤
⎢ ⎥⎣ ⎦
=
32
4
23
a
y⎡ ⎤⎢ ⎥⎢ ⎥⎣ ⎦
32
3 –
313
=
322(4)
3 –
322( )
3a
73
= 2 83× –
322( )
3a
322( )
3a = 2 8
3× – 7
3= 9
3
Thus, 32a = 9
2
and so a = 239
2⎛ ⎞⎜ ⎟⎝ ⎠
= 2.73 (to 3 sig. fig.) [Answer]
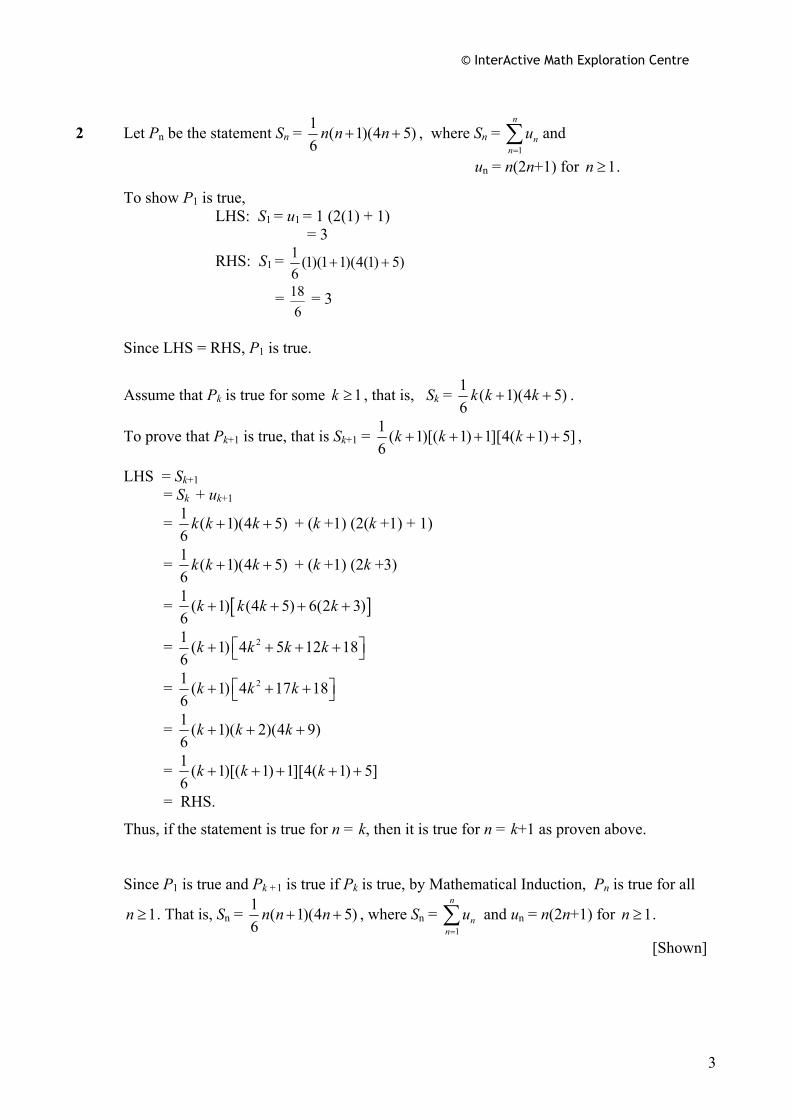
Note: If time permits, you could use the graphic calculator to check your answer by checking whether the value of
4
2.73dyy∫ is approximately equal to 7
3.
Using the graphic calculator, first press and select 9:fnInt( as shown on the left below. Next, key in the following command statements as shown on the right below and then press .
© InterActive Math Exploration Centre
3
2 Let Pn be the statement Sn = 1 ( 1)(4 5)6
n n n+ + , where Sn = 1
n
nn
u=∑ and
un = n(2n+1) for 1n ≥ . To show P1 is true, LHS: S1 = u1 = 1 (2(1) + 1) = 3
RHS: S1 = 1 (1)(1 1)(4(1) 5)6
+ +
= 186
= 3
Since LHS = RHS, P1 is true.
Assume that Pk is true for some 1k ≥ , that is, Sk = 1 ( 1)(4 5)6
k k k+ + .
To prove that Pk+1 is true, that is Sk+1 = 1 ( 1)[( 1) 1][4( 1) 5]6
k k k+ + + + + ,
LHS = Sk+1
= Sk + uk+1
= 1 ( 1)(4 5)6
k k k+ + + (k +1) (2(k +1) + 1)
= 1 ( 1)(4 5)6
k k k+ + + (k +1) (2k +3)
= [ ]1 ( 1) (4 5) 6(2 3)6
k k k k+ + + +
= 21 ( 1) 4 5 12 186
k k k k⎡ ⎤+ + + +⎣ ⎦
= 21 ( 1) 4 17 186
k k k⎡ ⎤+ + +⎣ ⎦
= 1 ( 1)( 2)(4 9)6
k k k+ + +
= 1 ( 1)[( 1) 1][4( 1) 5]6
k k k+ + + + +
= RHS.
Thus, if the statement is true for n = k, then it is true for n = k+1 as proven above. Since P1 is true and Pk +1 is true if Pk is true, by Mathematical Induction, Pn is true for all
1n ≥ . That is, Sn = 1 ( 1)(4 5)6
n n n+ + , where Sn = 1
n
nn
u=∑ and un = n(2n+1) for 1n ≥ .
[Shown]
© InterActive Math Exploration Centre
4
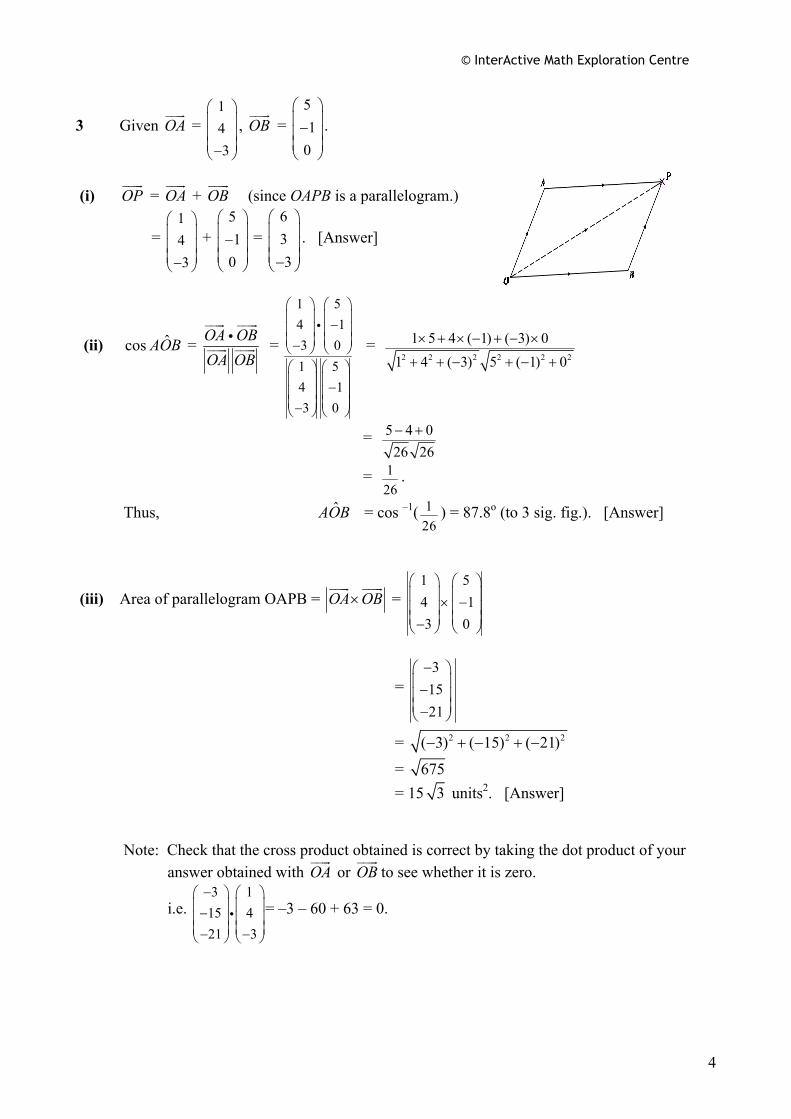
3 Given OA = 143
⎛ ⎞⎜ ⎟⎜ ⎟⎜ ⎟−⎝ ⎠
, OB = 51
0
⎛ ⎞⎜ ⎟−⎜ ⎟⎜ ⎟⎝ ⎠
.
(i) OP = OA + OB (since OAPB is a parallelogram.)
= 143
⎛ ⎞⎜ ⎟⎜ ⎟⎜ ⎟−⎝ ⎠
+ 51
0
⎛ ⎞⎜ ⎟−⎜ ⎟⎜ ⎟⎝ ⎠
= 633
⎛ ⎞⎜ ⎟⎜ ⎟⎜ ⎟−⎝ ⎠
. [Answer]
(ii) cos ˆAOB = OA OBOA OBi =
1 54 13 01 54 13 0
⎛ ⎞ ⎛ ⎞⎜ ⎟ ⎜ ⎟−⎜ ⎟ ⎜ ⎟⎜ ⎟ ⎜ ⎟−⎝ ⎠ ⎝ ⎠⎛ ⎞ ⎛ ⎞⎜ ⎟ ⎜ ⎟−⎜ ⎟ ⎜ ⎟⎜ ⎟ ⎜ ⎟−⎝ ⎠ ⎝ ⎠
i =
2 2 2 2 2 2
1 5 4 ( 1) ( 3) 01 4 ( 3) 5 ( 1) 0
× + × − + − ×
+ + − + − +
= 5 4 026 26− +
= 126
.
Thus, ˆAOB = cos –1( 126
) = 87.8o (to 3 sig. fig.). [Answer]
(iii) Area of parallelogram OAPB = OA OB× = 1 54 13 0
⎛ ⎞ ⎛ ⎞⎜ ⎟ ⎜ ⎟× −⎜ ⎟ ⎜ ⎟⎜ ⎟ ⎜ ⎟−⎝ ⎠ ⎝ ⎠
= 3
1521
−⎛ ⎞⎜ ⎟−⎜ ⎟⎜ ⎟−⎝ ⎠
= 2 2 2( 3) ( 15) ( 21)− + − + −
= 675 = 15 3 units2. [Answer]
Note: Check that the cross product obtained is correct by taking the dot product of your answer obtained with OA or OB to see whether it is zero.
i.e. 3 1
15 421 3
−⎛ ⎞ ⎛ ⎞⎜ ⎟ ⎜ ⎟−⎜ ⎟ ⎜ ⎟⎜ ⎟ ⎜ ⎟− −⎝ ⎠ ⎝ ⎠
i = –3 – 60 + 63 = 0.

© InterActive Math Exploration Centre
5
23 ln( 1) 22
y x= + +
23 ln( 1)2
y x= +
23 ln( 1) 22
y x= + −
4(i) ddyx
= 2
31
xx +
dy∫ = 2
3 d1
x xx +∫
dy∫ = 2
3 2 d2 1
x xx +∫
Thus, the general solution is: y = ( )23 ln 12
x + + C. [Answer]
(ii) When x = 0, y = 2. Thus, 2 = ( )23 ln 0 1
2+ + C
and so C = 2.
The required particular solution: y = ( )23 ln 12
x + + 2. [Answer]
(iii) ddyx
= 2
31
xx +
.
Dividing the numerator and denominator of the RHS by x2, we have
2
3
11
dy xdx
x
=+
.
Therefore, when x→±∞ , both 3x
and 2
1x
tend to zero and so ddyx→ 0. [Answer]
(iv) Answer :
Note that the graphs are symmetrical about the y-axis and the graphs become flatter when |x| becomes larger. You can obtain the required family of solution curves by using the graphic calculator. First, key in the equations after pressing as seen on the right below. Note that Y1 can be found by pressing .

© InterActive Math Exploration Centre
6
Next, press to display the standard window with the 3 graphs as shown on the right below.
5(i) 13
20
1 d1 9
xx+∫ =
13
20 19
1 9( )
dxx+∫
= ( )
13
20 213
1 1 9
dxx+
∫
=13
1
01 13 3
119 tan x−⎡ ⎤⎛ ⎞ ⎛ ⎞
⎢ ⎥⎜ ⎟ ⎜ ⎟⎝ ⎠ ⎝ ⎠⎣ ⎦
= ( )131
0
1 tan 33
x−⎡ ⎤⎣ ⎦
= ( )1 133
13
tan tan (0)− −⎡ ⎤−⎢ ⎥⎣ ⎦
= 1 03 3
π⎡ ⎤−⎢ ⎥⎣ ⎦
=9π . [Answer]
(ii) Let u = ln x, dv = xn dx. So, du = 1 dx x , v = 1
1nx
n+
+ (as n ≠ –1) .
Applying the method of integration by parts, we have
1
ln de nx x x∫ =
1
1
(ln )1
enxxn
+⎡ ⎤⎢ ⎥+⎣ ⎦
– 1
1 11 d
ne xn
xx
+
+
⎛ ⎞⎜ ⎟⎝ ⎠
∫
= 1
(ln )1
neen
+
+ –
11(ln1)1
n
n
+
+ –
1
1 d1
e nx xn + ∫
= 1
1
nen
+
+ –
1
1
11 1
n ex
n n
+⎡ ⎤⎢ ⎥+ +⎣ ⎦
= 1
1
nen
+
+ –
( )
1
21
1
nen
+ −
+
= ( )
1 1
2( 1) 1
1
n nn e en
+ ++ − +
+
= ( )
1
21
1
nnen
+ +
+. [Answer]
Note that: 1
2 21 1 tanaa x
xadx c−
+= +∫

© InterActive Math Exploration Centre
7
6(a) Using the cosine rule,
AC 2 = AB
2 + BC 2 – 2(AB)(BC) cosθ
= 12 + 32 – 2(1)(3) cosθ = 10 – 6 cosθ . When θ is a small angle, cosθ ≈1 –
2
2θ .
So, AC 2 ≈ 10 – 6 ( )2
21 θ− , if θ is a small angle
= 4 + 3 2θ .
Hence, AC ≈ ( )1224 3θ+ . [Shown]
Next, AC ≈ ( )1223
44(1 )θ+ = ( )12
1223
44 1 θ+
= ( )( )2312 42 1 .....θ+ +
= 2 + 234 θ + ….
Thus, AC≈a + b 2θ , where a = 2, b = 34 . [Shown]
(b) f(x) = tan (2x + 4
π ) f '(x) = 2 sec2 (2x + 4
π )
f ''(x) = 4 sec (2x + 4π ) ( )4 42 tan(2 + sec(2 + ) )x xπ π
= 8 tan (2x + 4π ) sec2 (2x + 4
π ). Thus, f(0) = tan ( 4
π ) = 1 f '(0) = 2 sec2 ( 4
π ) = 4 f ''(0) = 8 tan ( 4
π ) sec 2( 4π ) = 16.
Hence, f(x) = f(0) + f '(0) x + f ''(0)
2!x2 + …..
= 1 + 4x +162!
x2 + …
= 1 + 4x + 8x2 + …. [Answer]

© InterActive Math Exploration Centre
8
7 Total length of straight parts = y + x + y = 2y + x. Total length of semi-circular part = 1 (2 )
2π
2x⎛ ⎞
⎜ ⎟⎝ ⎠
= 2
xπ .
As total time taken is given to be 180, we have
180 = 3(x + 2y) + 92
xπ⎛ ⎞⎜ ⎟⎝ ⎠
180 = 3x + 6y + 92
xπ
60 = x + 2y + 32
xπ
2y = 60 – x – 32
xπ
y = 30 – 2x – 3
4xπ .------------------(1)
Let A be the area of the flower-bed. A = xy + ( )2
212
xπ
= x [30 – 2x – 3
4xπ ] +
2
8xπ
= 30x – 2
2x –
234xπ +
2
8xπ
= 30x – 2
2x –
258xπ
= 30x – 21 52 8
xπ⎛ ⎞+⎜ ⎟⎝ ⎠
Thus, ddAx
= 30 – 514
xπ⎛ ⎞+⎜ ⎟⎝ ⎠
.
Let ddAx
= 0 .
We have 30 = 514
xπ⎛ ⎞+⎜ ⎟⎝ ⎠
.
So x = 30514π
+≈ 6.0889 = 6.09 (to 3 sig fig).
Substitute x = 6.0889 into (1), we have y = 12.6 (to 3 sig fig).
As 2
2
dd
Ax
= – 514π⎛ ⎞+⎜ ⎟
⎝ ⎠< 0, A is maximum when x = 30
514π
+.
That is, when x ≈ 6.09 and y ≈ 12.6, the area of the flower-bed is maximum. [Answer]

© InterActive Math Exploration Centre
9
8(i) As |1 + 3 i| = ( )2
21 3+ = 4 = 2 and arg(1 + 3 i) = ( )1 31tan 3
π− = ,
we have z1 = 1 + 3 i = 2 3eiπ
and so z13 = (2 3e
iπ
)3
= 32 eiπ = – 8. [Answer]
If time permits, you could use your graphic calculator to check the answer, as shown on the screen shot on the right. (ii) Note that complex roots occur in conjugate pairs.
Thus, 1 – 3 i is also a root of the equation. Since (z – (1 + 3 i))(z – (1 – 3 i)) = ((z – 1) – 3 i))((z – 1) + 3 i) = (z – 1)2 – ( 3 i )2 = z2 – 2z + 4,
we have 2z3 + az2 + bz + 4 = (z2 – 2z + 4)(Az + B).
As the coefficient of z3 is 2, A = 2. Also, B = 1 as the constant term is 4.
Thus, 2z3 + az2 + bz + 4 = (z2 – 2z + 4)(2z + 1).-------------------(1) Next, expanding the RHS of (1), (z2 – 2z + 4)(2z + 1) = 2z3 + z2 – 4z2 – 2z + 8z + 4 = 2z3 – 3z2 + 6z + 4. Comparing the coefficient of z2, a = – 3. [Answer] Comparing the coefficient of z, b = 6. [Answer] Alternatively, to find the values of a and b,
Put z = 1 into (1): 2 + a + b + 4 = (12 – 2 + 4)(2 + 1) and so a + b = 3 ------------------------------(2)
Put z = –1 into (1): –2 + a – b + 4 = (12 + 2 + 4)(–2 + 1) and so a – b = –9 -----------------------------(3)
Solving (2) and (3) simultaneously, we have a = –3 and b = 6. [Answer] (iii) From 8(ii) above , we know that the two roots of 2z3– 3z2 + 6z + 4 = 0 are 1 + 3 i and 1 – 3 i. As 2z3– 3z2 + 6z + 4 = (z2 – 2z + 4)(2z + 1), the third root is 1
2− .
That is, the roots are 1 + 3 i, 1 – 3 i and 12− . [Answer]

© InterActive Math Exploration Centre
10
The Argand diagram of the roots is shown on the right.
9(i) f(x) = ax bcx d
++
, abcd ≠ 0.
f '(x) = ( )( )2
( )cx d a ax b c
cx d
+ − +
+
= ( )2
acx ad acx bccx d
+ − −
+
= ( )2ad bccx d
−
+.
Since ad – bc ≠ 0, f '(x) ≠ 0 for all real values of x.
Thus, the graph of y = f(x) has no turning points. [Shown] (ii) Dividing ax+ b by cx + d, we have the following.
Thus, f(x) = ax bcx d
++
= adba c
c cx d
−+
+
=
( )a ad bcc c cx d
−−
+.
Alternatively, f(x) = ax bcx d
++
= ( )a adcx d b
c ccx d
+ + −
+
= adba c
c cx d
−+
+ =
( )a ad bcc c cx d
−−
+.
When ad – bc = 0, f(x) = ac
. Thus, the graph is a horizontal line with equation y = ac
.
[Answer]
ac
adc
adc
cx d ax b
ax
b
+ +
+
−

© InterActive Math Exploration Centre
11
9(iii) Let f(x) = 3 72 1xx−+
. Here a = 3, b = – 7, c = 2, d = 1.
We have ad – bc = (3)(1) – (– 7)(2) = 17.
From the working of 9(i), f '(x) = ( )2ad bccx d
−
+ =
( )217
2 1x + > 0 for x ≠ 1
2− .
Thus, the graph of y = 3 72 1xx−+
has a positive gradient at all points (except x = 12− ) of the
graph. [Shown]
(iv)(a) Answer :
Asymptotes: x = 12− and y = 3
2 .
Points of intersection: (0, -7) and ( 73 , 0)
We can get the graph by using the graphic calculator. We can also use the calculator to find the x-intercept and y-intercept.
First, we key in the equations into the graphic calculator and press , then press to obtain the y-intercept.
To find the x-intercept, press for CALC menu and press to select 5:intersect. Move the cursor nearer to the x-intercept and press three times.

© InterActive Math Exploration Centre
12
9(iv)(b) Answer :
Asymptotes: x = 1
2− ,
y = 32− and y = 3
2 . Points of intersection: ( 7
3, 0)
Using the graphic calculator, key in the equations as shown on the left below and press
to get the required graph, which is shown on the right below. Note that you could get Y1 by pressing .
10.(i) Observe that 10, 13, 16, 19, … is an arithmetic progression. Its common difference is 3.
Let a = 10, d = 3
Sn= 2n (2a + (n – 1)d) > 2000
2n (2(10) + 3(n – 1)) > 2000
2n (20+3n -3) > 2000
2n (17+3n) > 2000
17n +3n2 > 4000 23 17 4000n n+ − > 0 To solve the quadratic inequality, we first find the roots of the quadratic equation 23 17 4000 0n n+ − = .
To find the roots of the quadratic equation 23 17 4000 0n n+ − = , we may use the graphic calculator.

© InterActive Math Exploration Centre
13
Step 1: Press and select 5:PlySmlt2 as shown on the left below by pressing .
Step 2: Press any key to see the MAIn MEnu shown on the right above. Select option 1:POLY ROOT FINDER by pressing or .
Step 3: Select the parameters as seen on the left screen shot below.
Step 4: Go to nEXT by pressing and type in the values as shown on the right screen shot above.
Step 5: Go to SOLVE by pressing to see the answer shown below.
Thus, (n + 39.46)(n – 33.79) >0. As + – + We have n < – 39.46 or n > 33.79.
Therefore, the least value of n is 34 months or 2 years 10 months.
Hence, she will first save over $2 000 on 1st Oct 2011. [Answer]
33.7939.46−

© InterActive Math Exploration Centre
14
10(ii)(a)
Compound interest = 0.02(10) + 0.02(1.02×10) + 0.02(1.022×10) + …. + 0.02(1.0223×10)
= 0.2 (1 + 1.02 + … + 1.0223 )
= 240.2 (1.02 1)
0.02−
= $6.08 (to 3 sig. fig.) [Answer] (b)
End of 1st month, she has (1.02)(10) in total.
End of 2nd month, she has (1.02)[10(1.02) + 10] = (1.02)2(10) + (1.02)(10) in total.
End of 3rd month, she has (1.02) [ (1.02)2(10) + (1.02)(10) + 10] = (1.02)3(10) + (1.02)2(10) + (1.02)(10) in total.
Following the pattern, at the end of two years (which is 24 months), the total amount she has is (1.02)24(10) + (1.02)23(10) + … + (1.02)(10)
= 10 [1.0224 + 1.0223 + … + 1.02]
= 10241.02(1.02 1)
1.02 1⎡ ⎤−⎢ ⎥−⎣ ⎦
= $310 (to 3 sig. fig.) [Answer]
(c)
Total amount at the end of nth month = (1.02)n(10) + (1.02)n –1(10)+ … + (1.02)(10)
= 10[1.02n + 1.02n – 1 + … + 1.02]
= 10 1.02(1.02 1)1.02 1
n⎡ ⎤−⎢ ⎥−⎣ ⎦
= 510 (1.02n – 1).
Let 510 (1.02n – 1) > 2000.
We have 1.02n > 2000 1510
⎛ ⎞+⎜ ⎟⎝ ⎠
n lg 1.02 > lg 200 151
⎛ ⎞+⎜ ⎟⎝ ⎠
n > 80.476.
Thus, the least value of n is 81 months. [Answer]

© InterActive Math Exploration Centre
15
11 p1 : 2x – 5 y + 3 z = 3 p2 : 3x + 2 y – 5 z = – 5 p3 : 5x – 20.9 y + 17z = 16.6 To solve this system of equations, we may use the graphic calculator. Step 1: Press and select 5:PlySmlt2 as shown on the left below by pressing .
Step 2: Press any key to see the MAIn MEnu shown on the right above. Select option 2:SIMULT Eqn SOLVER by pressing .
Step 3: Select the parameters as seen on the left screen shot below.
Step 4: Go to nEXT by pressing and type in the values as shown on the right screen
shot above.
Step 5: Go to SOLVE by pressing to obtain the solution as shown below.
Coordinates of the intersecting point = 4 4 7, ,
11 11 11⎛ ⎞− −⎜ ⎟⎝ ⎠
. [Answer]

© InterActive Math Exploration Centre
16
11(i) p1 : 2x – 5y + 3z = 3 p2 : 3x + 2y – 5z = –5 The coordinates of the points on the line l satisfy the system of the two equations above. To solve this system of equations, we could use the graphic calculator.
Step 1: Press and select 5:PlySmlt2 as shown on the left below by pressing . .
Step 2: Press any key to see the MAIn MEnu shown on the right above. Select option 2:SIMULT Eqn SOLVER by pressing .
Step 3: Select the parameters as seen on the left screen shot below.
Step 4: Go to nEXT by pressing and type in the values as shown on the right screen
shot above.
Step 5: Go to SOLVE by pressing to obtain the solution as shown below.
Thus, xyz
⎛ ⎞⎜ ⎟⎜ ⎟⎜ ⎟⎝ ⎠
= 11
αα
α
− +⎛ ⎞⎜ ⎟− +⎜ ⎟⎜ ⎟⎝ ⎠
, α ∈ R .
Hence, a vector equation of the line l is
r = 11
αα
α
− +⎛ ⎞⎜ ⎟− +⎜ ⎟⎜ ⎟⎝ ⎠
= 11
0
−⎛ ⎞⎜ ⎟−⎜ ⎟⎜ ⎟⎝ ⎠
+ 111
α⎛ ⎞⎜ ⎟⎜ ⎟⎜ ⎟⎝ ⎠
, α ∈ R . [Answer]

© InterActive Math Exploration Centre
17
Alternatively, we could also solve the system of equations by finding x and y in terms of z by using the method of elimination. 2x – 5y = 3 – 3z ----------(1) 3x + 2y = –5 + 5z ----------(2) 2 × (1): 4x – 10y = 6 – 6z ---------(3) 5 × (2): 15x + 10y = –25 + 25z---------(4) (3) + (4) : 19x = –19 + 19z and so x = –1 + z.
Substituting x = –1 + z into (1), we have 2(–1 + z) – 5y = 3 – 3z and so y = –1 + z.
Thus, xyz
⎛ ⎞⎜ ⎟⎜ ⎟⎜ ⎟⎝ ⎠
= 11
αα
α
− +⎛ ⎞⎜ ⎟− +⎜ ⎟⎜ ⎟⎝ ⎠
, α ∈ R .
11(ii) p3 : 5x + λ y + 17z = μ or r .5
17λ
⎛ ⎞⎜ ⎟⎜ ⎟⎜ ⎟⎝ ⎠
= μ
Since all three planes meet in the line l, the plane p3 contains the line l. Therefore, the coordinates of all the points on l must satisfy the equation of the plane p3.
Thus, 11
αα
α
− +⎛ ⎞⎜ ⎟− +⎜ ⎟⎜ ⎟⎝ ⎠
.5
17λ
⎛ ⎞⎜ ⎟⎜ ⎟⎜ ⎟⎝ ⎠
= μ , for all values of α.
–5 + 5α –λ +λ α +17α = μ (22 + λ )α = μ + 5 + λ ----------------(*) Let α = 1, then 22 + λ = μ + 5 + λ and so μ = 17.
Let α = 0, then 0 = μ + 5 + λ Asμ = 17, we have λ = –22. Hence, to have all three planes meet in the line l,λ = –22 andμ = 17. [Answer] (iii) If three planes have no point in common, then the line l does not meet the plane p3.
Therefore, there is no value of α that satisfies the equation (*) in 11(ii).
However, when λ ≠ –22, from the equation (*), α = 522μ λ
λ+ ++
exists.
Thus,λ = – 22. From the conclusion in 11(ii), we deduce that the three planes have no common point whenλ = – 22, μ ≠ 17. [Answer]

© InterActive Math Exploration Centre
18
Alternatively, when three planes have no point in common, the line l is parallel to the plane p3 and it does not meet the plane p3. When a normal vector to the plane p3 is perpendicular to a direction vector of l, the line l is parallel to the plane p3.
Thus, 5
17λ
⎛ ⎞⎜ ⎟⎜ ⎟⎜ ⎟⎝ ⎠
.111
⎛ ⎞⎜ ⎟⎜ ⎟⎜ ⎟⎝ ⎠
= 0 and soλ = –22.
From the equation (*) in 11(ii), whenλ = –22 andμ = 17, the line l meets the plane p3. Therefore, whenλ = –22, μ ≠ 17, the line l does not meet the plane p3.
11(iv) 1 11 1
3 0
−⎛ ⎞ ⎛ ⎞⎜ ⎟ ⎜ ⎟− − −⎜ ⎟ ⎜ ⎟⎜ ⎟ ⎜ ⎟⎝ ⎠ ⎝ ⎠
= 203
⎛ ⎞⎜ ⎟⎜ ⎟⎜ ⎟⎝ ⎠
n = 2 10 13 1
⎛ ⎞ ⎛ ⎞⎜ ⎟ ⎜ ⎟×⎜ ⎟ ⎜ ⎟⎜ ⎟ ⎜ ⎟⎝ ⎠ ⎝ ⎠
= 3
12
−⎛ ⎞⎜ ⎟⎜ ⎟⎜ ⎟⎝ ⎠
Thus, the vector equation of the plane is
r . 3
12
−⎛ ⎞⎜ ⎟⎜ ⎟⎜ ⎟⎝ ⎠
= 11
3
⎛ ⎞⎜ ⎟−⎜ ⎟⎜ ⎟⎝ ⎠
. 3
12
−⎛ ⎞⎜ ⎟⎜ ⎟⎜ ⎟⎝ ⎠
= 2
and so, the Cartesian equation of the required plane is –3x + y + 2z = 2. [Answer]

© InterActive Math Exploration Centre
19
Solution to A level H2 Math Paper 2
1(i) Answer:
You could obtain the graph of y = f(x) by using your graphic calculator before sketching on your answer script. Step 1: Press and type in the equation as follows, shown on the left screen shot below. Step 2: As the domain of the function considered is given as 3 3x− ≤ ≤ , we may set the window by pressing and then set Xmin = –3, Xmax = 3. Need not key in the values for Ymin and Ymax. The graphic calculator will calculate the appropriate values of Ymin and Ymax when are pressed. The graph is shown on the right screen shot below.
(ii) f(x) = ex sin x
= (1 + x + 2
2x +
3
6x + …) (x –
3
6x + …)
= 1(x –3
6x + …) + x (x –
3
6x + …) +
2
2x (x –
3
6x + …) + …
= x –3
6x + x2 +
3
2x + …
= x + x2 +3
3x + … [Answer]
© InterActive Math Exploration Centre
20
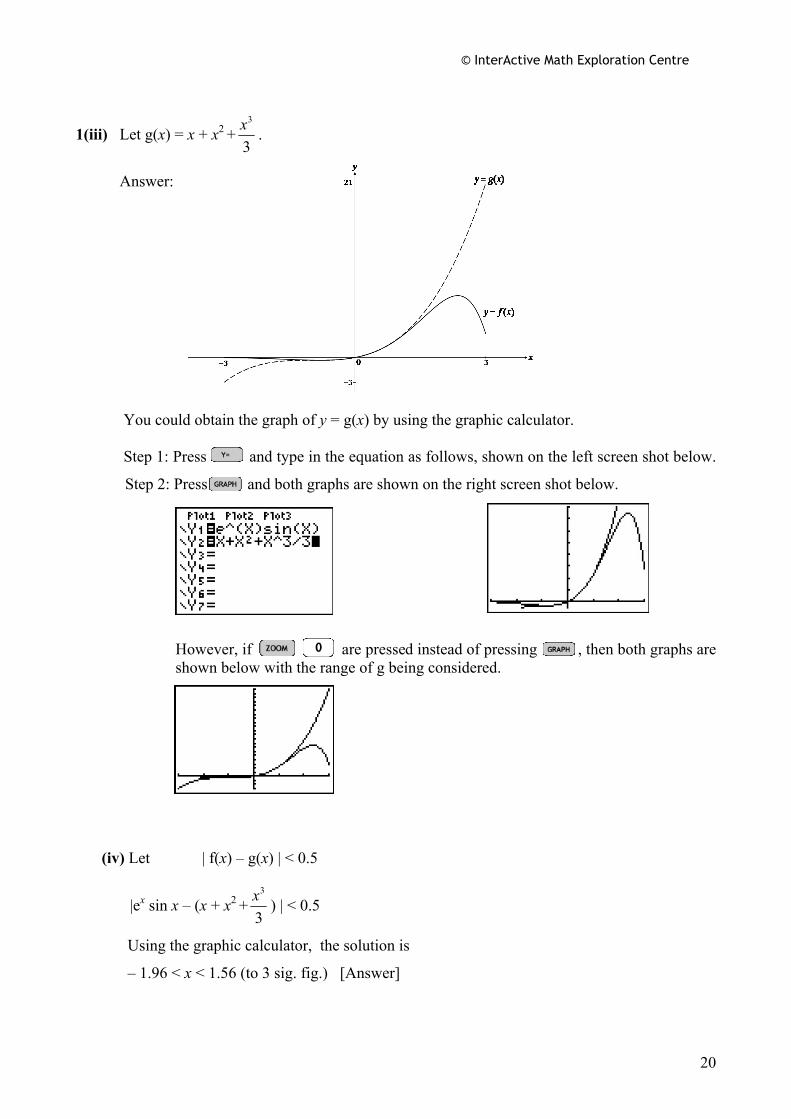
1(iii) Let g(x) = x + x2 +3
3x .
Answer:
You could obtain the graph of y = g(x) by using the graphic calculator.
Step 1: Press and type in the equation as follows, shown on the left screen shot below.
Step 2: Press and both graphs are shown on the right screen shot below.
However, if are pressed instead of pressing , then both graphs are shown below with the range of g being considered.
(iv) Let | f(x) – g(x) | < 0.5
|ex sin x – (x + x2 +3
3x ) | < 0.5
Using the graphic calculator, the solution is
– 1.96 < x < 1.56 (to 3 sig. fig.) [Answer]

© InterActive Math Exploration Centre
21
To solve the inequality by using the graphic calculator :
Step 1: Press and key in the equations as shown below. Note that abs( could be obtained from the CATALOG menu by pressing . .
Step 2: From the graphs obtained in part (iii), we observe that between x = –2 and x = 2, the two graphs are quite close to each other. Thus, we set the window with Xmin = –2 and Xmax = 2 and press for 0:ZoomFit. The graphs are shown below.
Step 3: Press to display the CALC menu and select 5:intersect. Step 4: Press and the cursor will appear on the line y = .5. Step 5: Find the points of intersection by moving the cursor nearer to the respective intersecting points and press three times.
© InterActive Math Exploration Centre
22
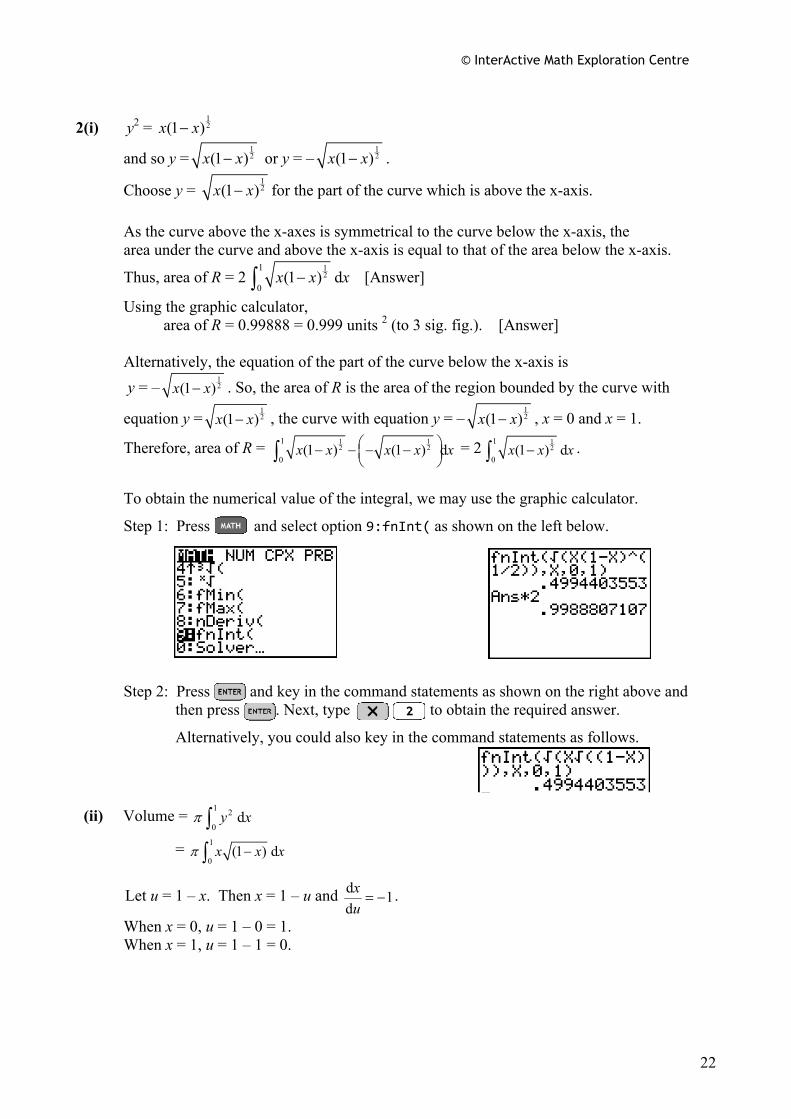
2(i) y2 =
12(1 )x x−
and so y =12(1 )x x− or y = –
12(1 )x x− .
Choose y = 12(1 )x x− for the part of the curve which is above the x-axis.
As the curve above the x-axes is symmetrical to the curve below the x-axis, the area under the curve and above the x-axis is equal to that of the area below the x-axis.
Thus, area of R = 212
1
0(1 ) dx x x−∫ [Answer]
Using the graphic calculator, area of R = 0.99888 = 0.999 units 2 (to 3 sig. fig.). [Answer]
Alternatively, the equation of the part of the curve below the x-axis is y = –
12(1 )x x− . So, the area of R is the area of the region bounded by the curve with
equation y =12(1 )x x− , the curve with equation y = –
12(1 )x x− , x = 0 and x = 1.
Therefore, area of R = 1 12 2
1
0(1 ) (1 ) dx x x x x⎛ ⎞− − − −⎜ ⎟
⎝ ⎠∫ = 2 12
1
0(1 ) dx x x−∫ .
To obtain the numerical value of the integral, we may use the graphic calculator.
Step 1: Press and select option 9:fnInt( as shown on the left below.
Step 2: Press and key in the command statements as shown on the right above and then press . Next, type to obtain the required answer.
Alternatively, you could also key in the command statements as follows. (ii) Volume = 1 2
0dy xπ ∫
= 1
0(1 ) dx x xπ −∫
Let u = 1 – x. Then x = 1 – u and d 1d
xu= − .
When x = 0, u = 1 – 0 = 1. When x = 1, u = 1 – 1 = 0.

© InterActive Math Exploration Centre
23
Thus, volume = 0
1(1 ) ( d )u u uπ − −∫
= 12
1
0(1 ) du u uπ −∫
=31
2 21
0du u uπ −∫ =
3 52 2
1
03 52 2
u uπ⎡ ⎤
−⎢ ⎥⎢ ⎥⎣ ⎦
= 2 2 03 5
π ⎡ ⎤− −⎢ ⎥⎣ ⎦
= 415π units3. [Answer]
2(iii) y2 = x 1 x−
Differentiate the above equation with respect to x, we have
2y ddyx
= x ( )12 (1 – x)
12− (– 1) + 1 x−
= – ( )12 x (1 – x)
12− + (1 – x)
12
= (– ( )12 x + (1 – x) ) 1
1 x−
= 2 32 1
xx
−−
.
Thus, ddyx
= 2 34 1
xy x−−
.
When ddyx
= 0, 2 34 1
xy x−−
= 0.
So, 2 – 3x = 0 x = 2
3.
For y > 0, ddyx
> 0 when x = ( )23
− and d
dyx
< 0 when x = ( )23
+.
Thus, the x-coordinate of the maximum point of C is x = 23
. [Answer]
3.(a) Let w = ire θ and so w* = ire θ− .
Thus, p =*
ww
= i
i
rere
θ
θ− = ( ( ))ie θ θ− − = (2 )ie θ .
Hence, | p | = 1 and arg (p) = 2θ . [Answer] Alternatively, using the facts that |w| = | w*| and arg(w*) = – arg(w) = –θ , we have
| p| =*|
| ||
ww
= 1 and arg (p) = arg (w) – arg (w*) = θ – (–θ ) = 2θ .

© InterActive Math Exploration Centre
24
p5 = (2 )5ie θ = (10 )ie θ
= cos(10θ ) + i sin(10θ ), 0 < θ < 2π .
Given that 0 < θ < 2π , we have 0 < 10θ < 10 ×
2π = 5π .
For p5 to be real, sin(10θ ) = 0, and so 10θ = π , 2π , 3π , 4π . For Re( p5 ) to be positive, cos(10θ ) > 0. For this to happen,10θ must lie in the 1st and 4th quadrants.
Thus, 10θ = 2π , 4π
and so θ = 5π , 2
5π .
3(b) Answer :
Note that the mid point between 0 and 8 + 6i is 1
2 (0+8+6i) = 4 + 3i.
Least value of arg(z) = α. From the diagram on the right, α = arg (4 + 3i) – cos-1 5
6
= tan-1 34 – cos-1 5
6
≈ 0.0578 rad = 0.058 rad (correct to 3 d.p.) [Answer]

© InterActive Math Exploration Centre
25
Greatest value of arg(z) = β. From the diagram on the right, β = arg (4 + 3i) + cos-1 5
6
= tan-1 34 + cos 5
6
≈ 1.2292 rad = 1.229 rad (correct to 3 d.p.) [Answer]
Alternatively, it can also be solved by first finding the intersecting points of the circle and the line by using the graphic calculator. Note that the equation of the circle is x2 + y2 = 62
and the equation of the line is 43 ( 4)3y x− = − − . After the point of intersection is found, say
(c, d), then arg(z) = 1tan dc
− . 4(i) Answer:
You may use the graphic calculator to check your graph.
Step 1: Press and key in the equation as shown on the left screen shot below. X > 4 is typed in as a part of the equation as shown because of the domain given in the question. The sign of greater than ( > ) can be obtained by pressing for TEST menu and then select 3:>.
Step 2: Press and type in the respective values in the window settings as shown on the right screen shot below. Step 3: Press to see the graph as shown on the right.
© InterActive Math Exploration Centre
26
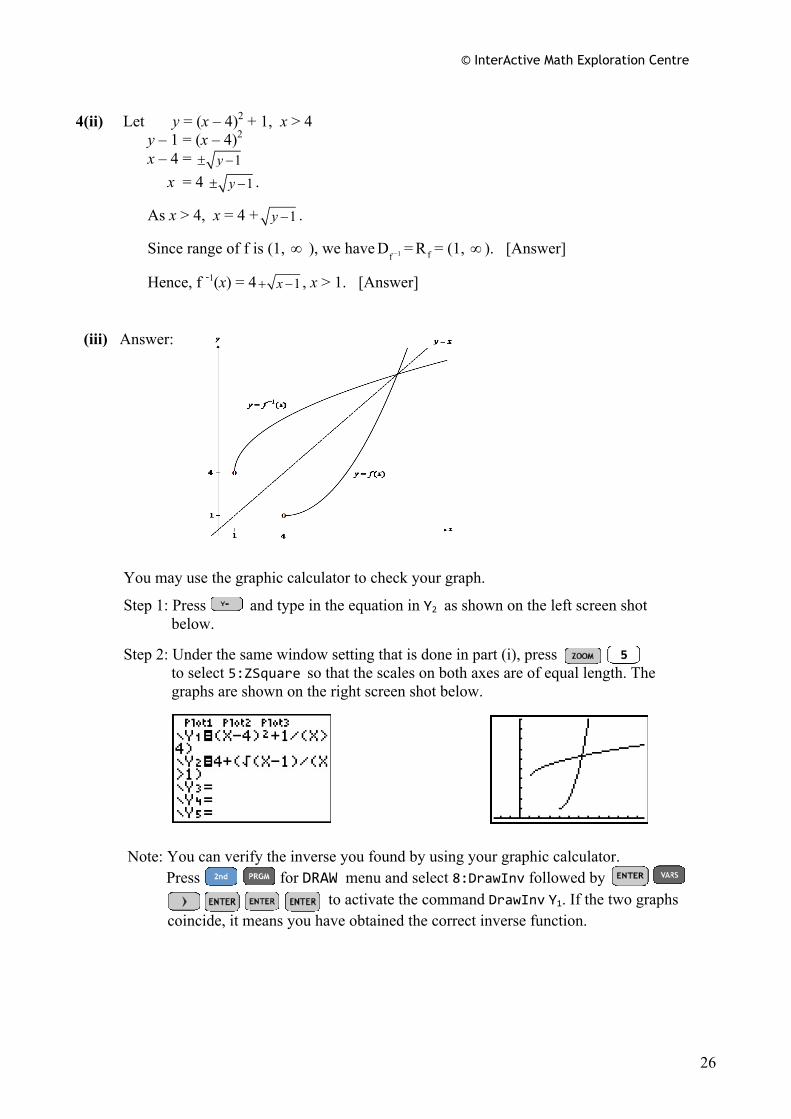
4(ii) Let y = (x – 4)2 + 1, x > 4
y – 1 = (x – 4)2 x – 4 = 1y± − x = 4 1y± − .
As x > 4, x = 4 + 1y − .
Since range of f is (1, ∞ ), we have 1fD − = fR = (1, ∞ ). [Answer]
Hence, f -1(x) = 4 1x+ − , x > 1. [Answer] (iii) Answer: You may use the graphic calculator to check your graph.
Step 1: Press and type in the equation in Y2 as shown on the left screen shot below. Step 2: Under the same window setting that is done in part (i), press to select 5:ZSquare so that the scales on both axes are of equal length. The graphs are shown on the right screen shot below.
Note: You can verify the inverse you found by using your graphic calculator. Press for DRAW menu and select 8:DrawInv followed by to activate the command DrawInv Y1. If the two graphs coincide, it means you have obtained the correct inverse function.

© InterActive Math Exploration Centre
27
4(iv) The required equation of the line of reflection is y = x. [Answer]
Note that both graphs would meet at the line y = x. Thus, solving the equation f(x) = f -1(x) is equivalent to solving the equation f(x) = x.
Let f(x) = x, x > 4
(x – 4)2 + 1 = x x2 – 8x + 17 = x x2 – 9x + 17 = 0
x = 2( 9) ( 9) 4(1)(17)
2(1)− − ± − − = 9 13
2±
i.e. x = 9 132
+ or x = 9 132
− (rejected as x > 4)
Hence, the exact solution of the equation f(x) = f -1(x) is x = 9 132
+ .
5 List out the names and number them in order from 1 to 950. Since the sample size is 50, we divide 950 by 50, i.e. 950
50 = 19. Select a number randomly, say k, from 1 to 19
inclusive and pick students that correspond to numbers which are (k + the multiple of 19). For example, if the starting number is 8, then students with the numbers 8, 27, 46, 65… etc will be picked. Alternatively, since the sample size is 50, we divide 950 by 50, i.e. 950
50 = 19. That is, group the students
into 50 blocks, where each block consists 19 students. Number the students from 1 to 19 in each block. Select a number randomly, say k, from 1 to 19 and then pick the kth student in each block. In stratified sampling, the student population is divided into non-overlapping representative groups of strata, such as different types of sports activities which use different sports facilities. Students are selected randomly from each stratum with the sample size proportional to the relative size of the stratum. Hence, this is more likely to give a representative sample of the student population and avoid any possible cyclical pattern from the systematic sampling. 6. Let X be the random variable of “The mass of calcium in mg in a 1 litre bottle”.
x = x
n∑ = 1026
15 = 68.4.
Unbiased estimate of the population variance is
2s = ( )2
211
xx
n n
⎡ ⎤⎢ ⎥−⎢ ⎥−⎣ ⎦
∑∑ = ( )21026.01 77265.9014 15
⎡ ⎤−⎢ ⎥
⎢ ⎥⎣ ⎦= 506.25.

© InterActive Math Exploration Centre
28
H0 : μ = 78 H1 : μ ≠ 78
Assuming H0 is true. Test statistic 2
78sn
xt −= ~ t(14).
Using 2-tailed t-test to test at 5% level of significance where x = 68.4, s = 506.25 and n = 15, we obtain from the graphic calculator that the p-value is 0.1207. As p-value is greater than 0.05, we do not reject H0 and conclude that there is insufficient evidence to say that the mean mass of calcium in a bottle has changed at 5% significance level. You may use your graphic calculator to help you with the hypothesis testing. Step 1: Press .
Step 2: Go to TESTS sub-menu by using the left arrow key and select option 2:T Test… as shown on the left screen shot below.
Step 3: Highlight the following options and key in the respective data as shown on the right screen shot below.
Sx = √506.25 Step 4: Select Calculate to get the t-test results as shown on the screen shot below, where the p-value can also be obtained.

© InterActive Math Exploration Centre
29
0.6
0.4
0.7
0.3
0.2
0.80.3
0.7
0.8
0.2A win
A win
B win
A win
B win
B win
B win
A win
A win
B win
1st set 2nd set 3rd set
7
(i) The probability that A wins the second set = 0.6(0.7) + 0.4(0.2) = 0.5. [Answer]
(ii) The probability that A wins the match = 0.6(0.7) + 0.6(0.3)(0.2) + 0.4(0.2)(0.7) = 0.512. [Answer]
(iii) Let F denotes the event that B won the first set and let W denotes the event that A wins the match.
P( F | W) = P( )P( )F W
W∩ = 0.4(0.2)(0.7)
0.512 = 0.056
0.512
= 764
= 0.109 (to 3 sig. fig.) [Answer]
8(i) Using the graphic calculator, the product moment correlation r = 0.970 (correct to 3 sig. fig.)
[Answer] Since r is close to 1, we may say that x and t has a strong positive linear correlation. However, a linear model is only appropriate if a linear relationship between x and t can also be observed from the scatter plot of the data points. [Answer] You may get the value of r by using your graphic calculator.
Step 1: Press , and select option 1:Edit…, as seen below by pressing . .

© InterActive Math Exploration Centre
30
Step 2: Key in the values into the list table as shown on the right below. Here, x, the independent variable, is represented by L1 and t, the dependent variable, is represented by L2.
Step 3: Press and go to CALC sub-menu. Select 4: LinReg(ax+b) (or 8: LinReg(a+bx))
Step 4: Key in the list variables in the order of independent variable and then dependent variable, as shown on the left below. Press to get the equation of the regression line of x on t, including the product moment correlation coefficient.
Note: To get the value of r, DiagnosticOn must be selected. Press to display the CATALOG menu. Scroll to DiagnosticOn and press twice.
8(ii) Answer:
You may use your graphic calculator to get the scatter diagram.
Step 1: Press to display the STAT PLOT menu as shown on the left screen shot below.

© InterActive Math Exploration Centre
31
Step 2: Press and select the respective options as shown on the left below.
Step 3: Press for 9:ZoomStat to show the graph on the right below.
8(iii) The incorrect point is P(4.8, 7.6). With point P removed, the remaining scatter diagram shows points on a curve that gradually increases in a manner that the increment of t deceases as x increases, which suggests that the data points may fit better with t = a + b ln x . [Answer]
(iv) Using the graphic calculator, we have t = 1.4247 + 4.3966 ln x = 1.42 + 4.40 ln x (to 3 sig. fig.).
Thus, a = 1.42, b = 4.40. [Answer] You may get the least square estimates of a and b for the model t = a + b ln x by using your graphic calculator. Step 1: Press , then press to select the option 1:Edit…
Step 2: Use the down arrow key to move the cursor down along the list of L1 to the number 4.8 and delete the entry by pressing . Next, move the cursor to the right using the right arrow key and delete the number 7.6 under the L2 list.
Note: Observe that the table is similar to the earlier one in 8(i), except that the point P(4.8, 7.6) has been removed from the list. Step 3: Move the cursor to the top of the next list, which is L3 and highlighted as shown. Key in (for ln L1) and press . The table is shown below.
P
© InterActive Math Exploration Centre
32
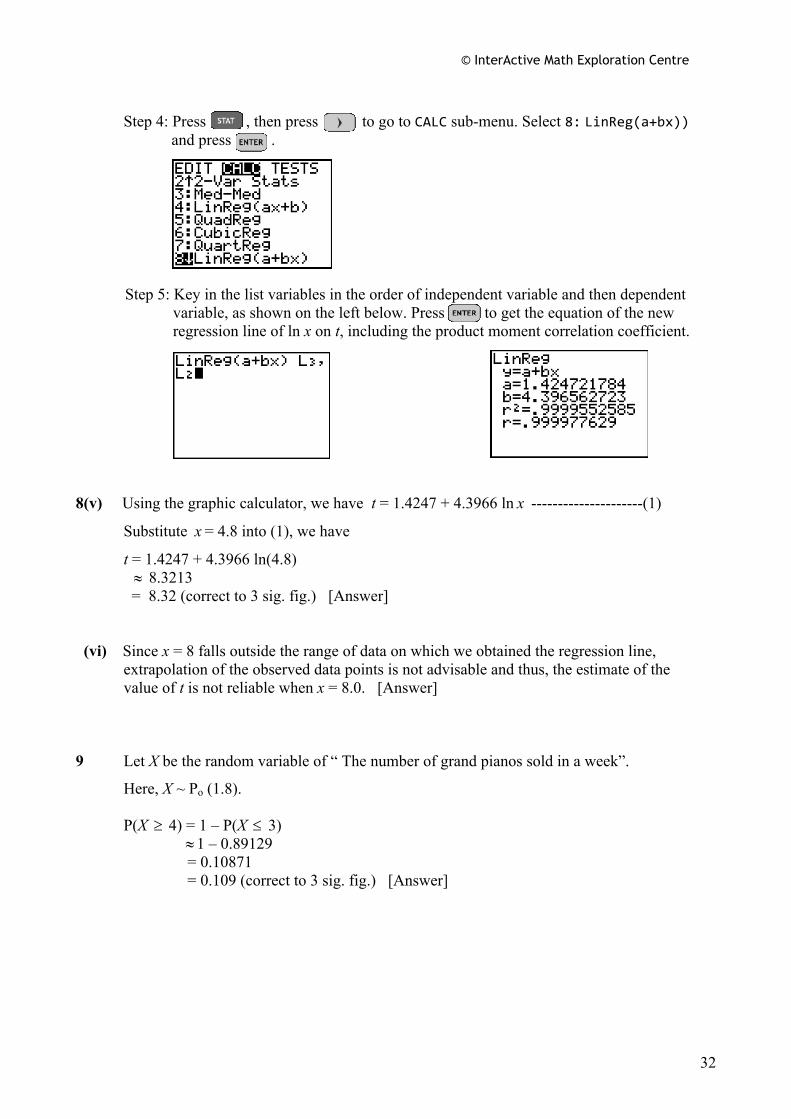
Step 4: Press , then press to go to CALC sub-menu. Select 8: LinReg(a+bx)) and press .
Step 5: Key in the list variables in the order of independent variable and then dependent variable, as shown on the left below. Press to get the equation of the new regression line of ln x on t, including the product moment correlation coefficient.
8(v) Using the graphic calculator, we have t = 1.4247 + 4.3966 ln x ---------------------(1)
Substitute x = 4.8 into (1), we have
t = 1.4247 + 4.3966 ln(4.8) ≈ 8.3213 = 8.32 (correct to 3 sig. fig.) [Answer]
(vi) Since x = 8 falls outside the range of data on which we obtained the regression line, extrapolation of the observed data points is not advisable and thus, the estimate of the value of t is not reliable when x = 8.0. [Answer] 9 Let X be the random variable of “ The number of grand pianos sold in a week”.
Here, X ~ Po (1.8). P(X ≥ 4) = 1 – P(X ≤ 3) ≈1 – 0.89129 = 0.10871 = 0.109 (correct to 3 sig. fig.) [Answer]

© InterActive Math Exploration Centre
33
To find the probability by using the graphic calculator:
Step 1: Press and under DISTR sub-menu, select D: poissoncdf(.
Step 2: Key in the data as shown on the right below.
Let Y be the random variable of “The number of upright pianos sold in a week”.
Here, Y ~ Po (2.6). Let W be the random variable of “The total number of grand and upright pianos sold in a week”. Here, W = X +Y ~ Po (1.8 + 2.6) as X and Y are independent. Thus, W ~ Po (4.4) P(W = 4)≈0.19174 = 0.192 (correct to 3 sig. fig.) [Answer]
To find the probability by using the graphic calculator:
Step 1: Type and under DISTR sub-menu, choose C: poissonpdf( .
Step 2: Key in the following data as shown on the right below.
Let V be the random variable of “The number of grand pianos sold in a year of 50 weeks”. V ~ Po (50 × 1.8) That is, V ~ Po (90). Sinceλ = 90 ( >10) is large, we use a normal distribution as an approximation to the Poisson distribution with mean = variance = 90. That is, V ~ N(90, 90) approximately. P(V < 80) = P(V 79.5≤ ) ≈ 0.13419 = 0.134 (to 3 sig. fig.) (Answer)

© InterActive Math Exploration Centre
34
To find the probability by using the graphic calculator:
Step 1: Type and under DISTR sub-menu, choose 2: normalcdf( .
Step 2: Key in the following data as shown on the right below.
The Poisson model assumes that events occur ‘uniformly’. That is, the expected number of events in a given time interval is proportional to the size of the interval. However, in real life, the mean number of grand pianos sold occur within a small fixed interval of time as it is a non-essential or luxury item, which could be sold in a seasonal manner. Thus, the Poisson distribution may not be a good model for the number of grand pianos sold in a year. [Answer]
10(i) Required number of ways = 3C2 × 4C3 × 5C3 = 120. [Answer] (ii) Required number of ways = 9C8 = 9. [Answer] (iii) Case 1: 4 diplomats from M
Then 4 diplomats have to be chosen from K and L.
So, number of ways = 5C4× 7C4 = 175
Case 2: 5 diplomats from M
Then 3 diplomats have to be chosen from K & L.
So, number of ways = 5C5× 7C3= 35 Required number of ways = 175 + 35 = 210. [Answer]
(iv) Required number of ways
= Number of unrestricted ways – (Number of ways chosen from L and M only) – (Number of ways chosen from K and M only)
– (Number of ways chosen from K and L only) = 12C8 – 9C8 – 8C8 – 0
= 495 – 9 – 1
= 485. [Answer]

© InterActive Math Exploration Centre
35
11(i) X ~ N (50, 82) X1 + X2 ~ N (50×2, 82×2) as X1 + X2 are two independent observations of X. i.e.X1 + X2 ~ N (100, 128) Thus, P(X1 + X2 >120) ≈ 0.0385499 = 0.0385 (correct to 3 sig. fig.)
To calculate the probability by using the graphic calculator:
Step 1: Press and under DISTR sub-menu, choose 2:normalcdf(.
Step 2: Key in the following data as shown on the right below. (ii) X1 – X2 ~ N (50 – 50, 82 + 82)
i.e. X1 – X2 ~ N (0, 128). P(X1 > X2 + 15) = P(X1 – X2 > 15)
≈ 0.092449 = 0.0924 (correct to 3 sig. fig.) [Answer] To find the probability by using the graphic calculator:
Step 1: Type and under DISTR sub-menu, select 2:normalcdf(.
Step 2: Key in the following data as shown on the right below.
Since Y is a linear function of X and X is normal , Y is also normal.
Since normal distribution is symmetrical about the mean and P(Y < 74) = P(Y > 146),
we have E(Y) = 74 1462+ = 110. [Answer]

© InterActive Math Exploration Centre
36
As P(Y < 74) = 0.0668, we have P(Z < 74 110
σ− ) = 0.0668 where σ 2 = Var(Y).
Using the graphic calculator, 74 110
σ− = –1.5000556
so σ = 23.9991.
Therefore, Var(Y) = σ 2 ≈ 575.96 = 576 (to 3 sig.fig). [Answer]
To find the value of c when P(Z < c) = 0.0668 by using the graphic calculator:
Step 1: Type and under DISTR sub-menu, choose 3:invNorm(.
Step 2: Key in the following data as shown on the right below.
Note that E(Y) = a E(X) + b
= 50a + b
and Var(Y) = a2 Var(X) + Var(b)
= a2 Var(X) + 0
= 64 a2 .
Thus, 110 = 50a + b -------------------(1) 575.96 = 64 a2 ------------------- (2) Solving (2), a ≈ 2.9999 or – 2.9999 (rejected as a > 0) = 3 (to 3 sig. fig) (Answer)
Substitute a = 2.9999 into (1), we have
110 = 50(2.9999)+ b b = – 39.995 = – 40 (to 3 sig.fig.) [Answer]

© InterActive Math Exploration Centre
37
Solutions to H1 Mathematics Paper 1
1 Answer: You can obtain the graph from the graphic calculator:
Step 1: Press and type in the equation as shown on the left below.
Step 2: Press and set the window as shown on the right below. We set Ymin = –2 and Ymax = 2 as 1 sin 1x− ≤ ≤ . Step 3: Press to see the graph shown on the right.
From the graph, when sin α = c, where 0 < α < 90o,
(i) sin (2π + α) = c [Answer]
(ii) sin (3π + α) = – c [Answer] One possible value of x for which sin x = – c is eitherπ α+ or 2π α− . [Answer]
© InterActive Math Exploration Centre
38
2 x + y = 20 ---------------------- (1) x2 + y2 = 300 ---------------------- (2) Rearrange (1) y = 20 – x ---------------------- (3) Substitute y = 20 – x into (2), we have
x2 + (20 – x)2 = 300 x2 + 400 – 40x + x2 = 300 2x2 – 40x + 100 = 0 Alternatively, x2 – 20x + 50 = 0 by completing the square, we have
x = 220 20 4(1)(50)
2(1)± − (x – 10)2 – 100 + 50 = 0
= 20 2002
± (x – 10)2 – 50 = 0
= 20 100 22
± × (x – 10)2 = 50
= 20 10 22
± x = 10 50±
= 10 5 2± = 10 25 2± × = 10 5 2± . Substitute the values of x into (3), we have y = 20 – (10 5 2± ) = 10 ∓ 5 2
Since x > y and10 5 2− < 10 5 2+ , we have
x = 10 5 2+ and y = 10 5 2− . [Answer] 3 y = 2x2 ------------- (1) y = x2 + k2 ------------- (2) Substitute y = 2x2 into (2): 2x2 = x2 + k2 x2 = k2 x = 2k± = k or –k. Therefore, the x –coordinates of P and Q are k and –k respectively. [Shown]

© InterActive Math Exploration Centre
39
Required area = 2 2 2( ) (2 ) d
k
kx k x x
−+ −∫
= 2 2 2 dk
kk x x
−−∫
= 2 33
k
k
xk x−
⎡ ⎤−⎢ ⎥⎣ ⎦
= 333 3 ( )
3 3kkk k −⎡ ⎤⎡ ⎤− − − −⎢ ⎥⎣ ⎦ ⎣ ⎦
= 3 32 2
3 3k k
+ = 34
3k units2. [Answer]
Alternatively, as both graphs are symmetrical about the y–axis, required area = 2 2 2 2
0( ) (2 ) d
kx k x x+ −∫
= 2 2 2
0d
kk x x−∫ = 2
32
03
kxk x
⎡ ⎤−⎢ ⎥
⎣ ⎦= 2
3 33 3 00
3 3kk
⎡ ⎤⎛ ⎞ ⎛ ⎞− − −⎢ ⎥⎜ ⎟ ⎜ ⎟
⎝ ⎠ ⎝ ⎠⎣ ⎦ =
343k units2.
4(i)(a) Answer : Graph of y = f(x) = x2 – 1
To obtain the graph from the graphic calculator:
Step 1: Press and type in the equation as shown on the left below.
Step 2: Press for 6:ZStandard and the graph is shown on the right below.
© InterActive Math Exploration Centre
40
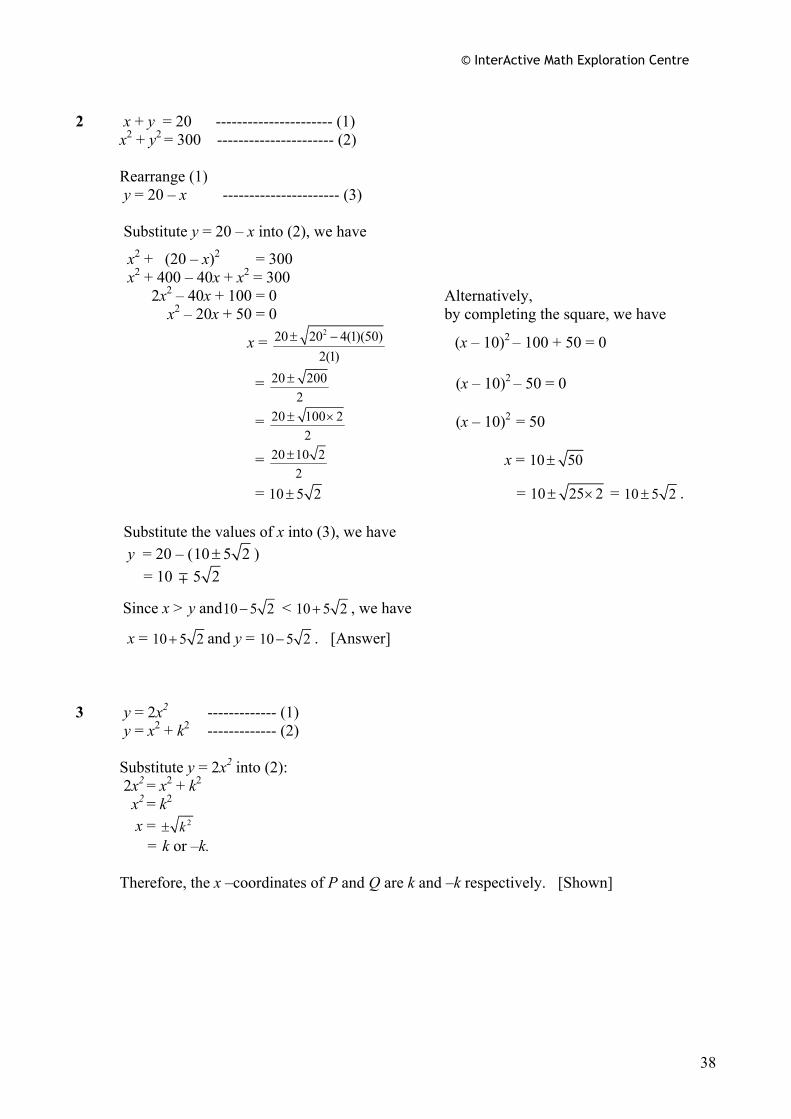
4(i)(b) Answer : Graph of y = gf(x) = g(x2 – 1) = | x2 – 1|
To obtain the graph from the graphic calculator:
Step 1: Press and type in the equation as shown on the left below. Note that abs( could be obtained from the CATALOG menu by pressing . Step 2: Press to see the graph plotted in the standard window setting as shown on the right below.
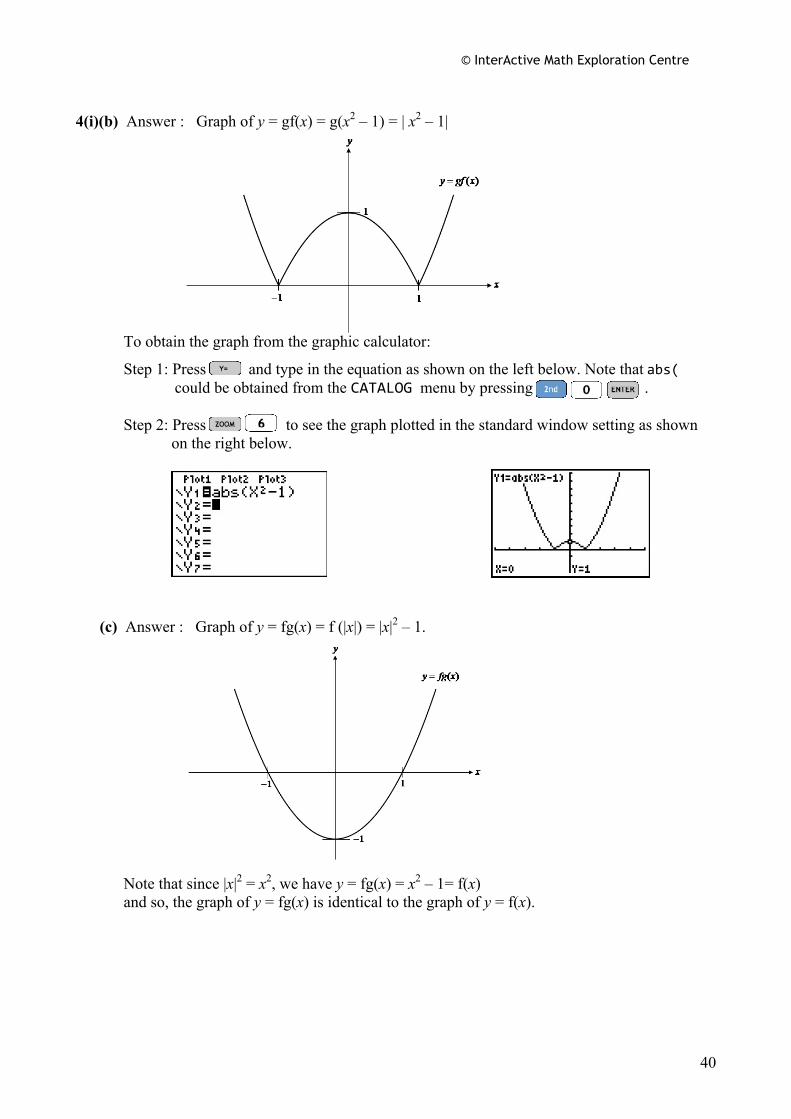
(c) Answer : Graph of y = fg(x) = f (|x|) = |x|2 – 1.
Note that since |x|2 = x2, we have y = fg(x) = x2 – 1= f(x) and so, the graph of y = fg(x) is identical to the graph of y = f(x).

© InterActive Math Exploration Centre
41
Alternatively, you can also obtain the graph from the graphic calculator:
Step 1: Press and key in the equation as shown on the left below. Note that abs( could be obtained from the CATALOG menu by pressing .
Step 2: Press to see the graph shown on the right below.
4(ii) For f -1 to exit, f has to be a one-one function. From the graph in 4(i)(a), f is a one-one function with domain restricted to x a≤ where 0a ≤ . Therefore, the greatest possible value of a is 0. [Answer] From the graph, range of f is (–1, ∞ ). Thus, we have 1f
D − = fR = (–1, ∞ ). [Answer] Let y = x2 – 1, x ≤ 0 y + 1 = x2 x = ± 1y+ As x ≤ 0, we have x = – 1y+ . Thus, f –1(x) = – 1x+ , x ≥–1. [Answer] 5 x = t 3 – 12t2 + kt
ddxt
= 3t2 – 24t + k.
When ddxt
> 0, x increases.
Let 3t2 – 24t + k > 0 for 0t ≥ . In order to have 3t2 – 24t + k > 0 for all t, its discriminant < 0.
So, (– 24)2 – 4(3)(k) < 0 576 < 12k k > 48. [Answer]

© InterActive Math Exploration Centre
42
Given that k = 36, we have x = t3 – 12 t2 + 36 t.
5(i) Answer: Graph of x = t 3 – 12 t2 + 36 t.
To obtain the graph by using the graphic calculator:
Step 1: Press and key in the equation as shown on the left below.
Step 2: As the independent variable t is positive, press to set the window such that Xmin = 0, Xmax = 10. Need not key in the values for Ymin and Ymax. The graphic calculator will calculate the appropriate values of Ymin and Ymax when are pressed. The graph is shown on the right below. You may check that the curve passes through the point (6, 0) when are pressed.
(ii) 375 = t3 – 12 t2 + 36 t
t3 – 12 t2 + 36 t – 375 = 0
Using the graphic calculator, t = 11.7 seconds (to 1 d.p.). [Answer] To solve the cubic equation by using the graphic calculator:
Step 1: Press and select 5:PlySmlt2 as shown on the left below by pressing .
Step 2: Press any key to see the MAIn MEnu shown on the right above. Select option 1:POLY ROOT FINDER by pressing or .

© InterActive Math Exploration Centre
43
Step 3: Select the parameters as seen on the left screen shot below.
Step 4: Go to nEXT by pressing and type in the values as shown on the right screen shot above.
Step 5: Go to SOLVE by pressing to see the answer shown below.
6. y = ln (2x + 4)
d
dyx
= 22 4x +
= 12x +
.
When x = 1, dd
yx
= 22(1) 4+
= 13
. Thus, the gradient of the tangent to C at x =1 is 13
.
Equation of the tangent to C at P(1, ln 6): y – y1 = m (x – x1) y – ln 6 = 1
3 (x – 1)
y = 13
x – 13
+ ln 6.
As the y-coordinate of T is 0, we let y = 0. So, 0 = 1
3x – 1
3+ ln 6
13
x = 13
– ln 6
x = l – 3 ln 6. Therefore, the exact x–coordinate of T is 1 – 3 ln 6. [Shown]
Gradient of the normal to C at x =1 is 13
1− = – 3.

© InterActive Math Exploration Centre
44
Thus, equation of the normal to C at P(1, ln 6): y – y1 = m (x – x1) y – ln 6 = – 3(x – 1) y = –3x + 3 + ln 6. As the y-coordinate of N is 0, we let y = 0. So, 0 = –3x + 3 + ln 6 3x = 3 + ln 6 x = 1 + ln 6
3.
Therefore, the exact x–coordinate of N is 1 + ln 63
. [Answer]
Length of TN = 1 + ln 63
– (1 – 3 ln 6) = 1 + ln 63
+ 3 ln 6 – 1 = 10 ln 63
.
Note that the height of triangle PTN is the y-coordinate of the point P, which is ln 6. Thus, area of triangle PTN = 1 base height
2× ×
= 1 10 ln 6 ln 62 3× ×
= ( )25 ln 63
units2. [Answer]
7 If it is normally distributed, the probability of the marks that are beyond 100 is more than 0.033 (refer to the screen shot on the right), which is not negligible. This means that at least 3% of the marks would be above 100, which is impossible. Therefore, normal distribution will not give a good approximation to the distribution of marks. Let X be the random variable of “The marks of the candidates”.
As n = 50 is relatively large, by Central Limit Theorem, we have X ~ N (72.1, 215.2
50) approximately.
Using the graphic calculator, P (70.0 < X < 75.0) = 0.747 (to 3 sig fig). [Answer] To find the probability by using the graphic calculator:
Step 1: Press to display DISTR menu. Under DISTR sub-menu, choose 2: normalcdf( by pressing . Step 2: Key in the data according to the sequence as follows: lower bound, upper bound, mean and standard deviation, as shown on the right below.

© InterActive Math Exploration Centre
45
8 Let X be the random variable denoting the number of loaves out of 6 which are ‘crusty’. Note that X ~ B (6, 0.6) So P(X = 3) = 0.27648 = 0.276 (to 3 sig. fig.). [Answer] To find the probability by using the graphic calculator:
Step 1: Press to display DISTR menu. Under DISTR sub-menu, choose A:binompdf(.
Step 2: Key in the data according to the sequence as shown on the right below.
Let Y be the random variable denoting the number of loaves out of 40 which are ‘crusty’. Note that Y ~ B (40, 0.6). Since n = 40 is large, np = 40(0.6) = 24 > 5, nq = 40 (1 – 0.6) = 16 > 5, we have
Y ~ N (np, npq) approximately. That is, Y ~ N( 24, 9.6) approximately. Thus, using the graphic calculator, P(Y ≥ 20) = P(Y > 19.5) = 0.927 (to 3 sig. fig.) [Answer] To find the probability by using the graphic calculator:
Step 1: Press for DISTR menu. Under DISTR sub-menu, choose 2: normalcdf(.
Step 2: Key in the following data according to the sequence as follows: lower bound, upper bound, mean and standard deviation, as shown on the right below. Let W be the random variable denoting the mass of a loaf of bread in kg.
Given that W ~ N (1.24, 2σ ) P(W < 1) = 0.04 P( Z < 1 1.24
σ− ) = 0.04.

© InterActive Math Exploration Centre
46
38
58
28
58
18
38
48
18
Tan’s Mui’s
Red
Red
Red
Blue
Blue
Blue
Green
Green
Using the graphic calculator, we have 0.24
σ− = –1.7507
and so σ = 0.241.7507−−
= 0.137 (to 3 sig fig). [Answer]
You can use the graphic calculator to get the value of c when P( Z < c) = 0.04 by simply pressing and select 3:invNorm(, then key in 0.04 and press .
9(i) (ii) The probability that Mui’s pen is blue, given that Tan’s pen is red = 5
8. [Answer]
(iii) The probability that Mui’s pen is red = 3 2 5 38 8 8 8× + × = 21
64. [Answer]
(iv) Let A denotes the event that Tan’s pen is red and
let B denotes the event that Mui’s pen is blue.
P( A | B) = P( )P( )A B
B∩ =
3 58 8
3 5 5 48 8 8 8
×
× + × = 3
7. [Answer]

© InterActive Math Exploration Centre
47
10 Let X be the random variable denoting the number of hours of the lifetime of a particular type of battery.
x = x
n∑
= 1031770
≈147.39
Unbiased estimate of population variance = ( )2
211
xx
n n
⎛ ⎞⎜ ⎟−⎜ ⎟−⎝ ⎠
∑∑
= ( )2103171 154023169 70
⎛ ⎞⎜ ⎟−⎜ ⎟⎝ ⎠
≈ 284.82 H0: μ = 150 H1: μ < 150
As n = 70 is large, by Central Limit Theorem, X is approximately normally distributed.
Thus, Z-test is used with x = 147.39, s = 284.82 and n = 70. Assuming H0 is true, we
obtain from the graphic calculator that the p-value = 0.0978 (to 3 sig. fig.) [Answer]
To find the p-value using the graphic calculator:
Step 1: Press , go to TESTS, choose 1: Z‐Test... as shown on the left below by pressing . Step 2: Choose the Stats option and key in the respective data as shown on the right below.
Step 3: Move the cursor to Calculate and press to see the p-value. Alternatively, we could calculate the p-value as follows:

© InterActive Math Exploration Centre
48
Under H0, X ~ N(150, 284.82
70) approximately by Central Limit Theorem as n = 70 is large.
Thus, by using the graphic calculator, p-value = P( X < x ) = P( X < 10317
70)
= 0.0978 (to 3 sig.fig.). p–value is the lowest significant level at which the null hypothesis would be rejected on the basis of the observed outcome. Hence, the p-value in this question refers to the lowest significance level at which the claim that the mean lifetime of the battery is equal to 150 hours is rejected on the basis of the observed outcome.
Let W be the random variable denoting the number of hours of lifetime of each battery in the combined sample.
n = 70 + 50 = 120 w∑ = x∑ + y∑ = 10317 + 7331 = 17 648
2w∑ = 2x∑ + 2y∑ = 1540231 + 1100565 = 2640796 w = 17648
120
≈ 147.067
Unbiased estimate of population variance = ( )2
211
ww
n n
⎛ ⎞⎜ ⎟−⎜ ⎟−⎝ ⎠
∑∑
= ( )2176481 2640796119 120
⎛ ⎞⎜ ⎟−⎜ ⎟⎝ ⎠
≈ 381.2056 H0 : μ = 150 H1 : μ < 150 Assuming H0 is true. As n = 120 is large, by the Central Limit Theorem,
test statistic 150/
wzs n−
= ~ N (0, 1) approximately.
Using 1-tail Z-test to test at 10% level of significance, where s = 381.2056 , w =17648120
and n = 120, we obtain from the graphic calculator that the p-value = 0.0499(to 3 sig.fig.).
Since p-value < 0.1, we reject H0 and conclude that there is sufficient evidence that the population mean is less than 150 at 10% significance level.

© InterActive Math Exploration Centre
49
You may use the graphic calculator to help you with the hypothesis testing.
Step 1: Press .
Step 2: Go to TESTS sub-menu by pressing the left arrow key and select option 1: Z‐Test… as shown on the left below.
Step 3: Choose the Stats option and key in the respective data as shown on the right below.
Step 4: Move the cursor to Calculate and press to get the Z-test results as shown below.
11(i) Answer :

© InterActive Math Exploration Centre
50
To obtain the scatter plot of the data by using the graphic calculator :
Step 1: Press , then press to select the option 1:Edit…
Step 2: Key in the list table as shown on the right below.
Step 3: Press to display STAT PLOT menu as shown on the left below. Press and highlight the appropriate settings as shown on the right below by using the arrow and keys. Step 4: Press for 9:ZoomStat to see the appropriate scatter diagram shown below. 11(ii) Using the graphic calculator,
x = 17, y = 343.75= 344 (to 3 sig. fig.) [Answer]
Answer:

© InterActive Math Exploration Centre
51
To find the values of x and y by using the graphic calculator:
Step 1: Press , then press to go to CALC sub-menu. Select option 2:2‐Var Stats as seen on the left below by pressing . . Step 2: Key in the appropriate list variables in the order as shown on the right above.
Step 3: Press and the value of x is shown. Press to see the value of y .
11(iii) Using the graphic calculator, the equation of the regression line of y on x is
y = 53.3 + 17.1 x (to 3 sig.fig.) [Answer]
Note that the line must be drawn to pass through the point ( , )x y .

© InterActive Math Exploration Centre
52
To find the equation of the regression line of y on x by using the graphic calculator:
Step 1: Press , then press to go to CALC sub-menu. Select 4:LinReg(ax+b) and press . . Step 2: Key in the list variables in the order of independent variable, dependent variable and Y1 as shown on the middle screen shot below. Press to get the equation of the regression line of y on x, including the product moment correlation coefficient r. Here, Y1 is typed in so that the regression line could be drawn on the screen later.
Note: To get the value of r, DiagnosticOn must be selected. Press to display CATALOG menu and scroll to DiagnosticOn, then press twice.
Step 3: Press for 9:ZoomStat to see the graph of the regression line as shown below.
11(iv) Using the graphic calculator, the product moment correlation coefficient r is 0.969 (to 3 sig. fig.). [Answer] Note that the value of r can be found on the screen shot on the extreme right above. From the scatter plot, we observe that the data points are close to the regression straight line.
In addition, as the value of r is close to 1, it shows a strong positive linear correlation between x and y.
(v) When x = 20, y = 53.333 + 17.083(20) = 394.993. The corresponding profit = $395 000 (to 3 sig. fig.) [Answer] (vi) As x = 40 is outside the range of data on which we obtained the regression line, the variables
may not be linearly correlated. Hence, the estimate may not be reliable and extrapolation must be applied with caution. [Answer]

© InterActive Math Exploration Centre
53
12 Let X be the random variable denoting the mass of an apple in kg.
Here, X ~ N (0.234, 0.0252) Let S be the random variable denoting the mass in kg, of a small bag containing 5 apples.
Then S = X1 + X2 + X3 + X4 + X5 ~ N (5× 0.234, 5× 0.0252). Thus, S ~ N(1.17, 0.003125) Let L be the random variable denoting the mass in kg, of a large bag containing 10 apples.
Then L = X1 + X2 + X3 +……+ X9 + X10 ~ N (10× 0.234, 10× 0.0252). Thus, L ~ N(2.34, 0.00625) P(S > 1.2) ≈0.29575 = 0.296 ( to 3 sig. fig.) [Answer]
Using the graphic calculator to find P(S > 1.2):
Step 1: Type and under DISTR sub-menu, choose 2:normalcdf(.
Step 2: Key in the data as shown on the right below.
S1+ S2 – L ~ N( 2(1.17) – 2.34, 2(0.003125) + 0.00625 ) Thus, S1+ S2 – L ~ N(0, 0.0125) P(| S1+ S2 – L| < 0.2)
= P( – 0.2 < S1+ S2 – L < 0.2) ≈0.92636 = 0.926 (to 3 sig. fig.) [Answer] Using the graphic calculator to find P(|S1+ S2 – L | < 0.2):
Step 1: Type and under DISTR sub-menu, choose 2:normalcdf(.
Step 2: Key in the data as shown on the right below.

© InterActive Math Exploration Centre
54
Let M be the random variable denoting the amount of money in $ that Lee pays more than Foo.
Thus, M = 1.5 (S1+ S2) – 1.2 L .
As E(M) = 1.5(1.17+1.17) – 1.2(2.34) = 3.51 – 2.808 = 0.702 and Var(M) = 1.52(0.003125 + 0.003125) + 1.22(0.00625) = 0.0140625 +0.009 = 0.0230625 we have M ~ N (0.702, 0.0230625).
Using the graphic calculator, P (M ≥0.50) ≈ 0.90826 = 0.908 (to 3 sig. fig). [Answer]
To find the probability by using the graphic calculator:
Step 1: Type and under DISTR sub-menu, choose 2:normalcdf(.
Step 2: Key in the data as shown on the right below.