the commonwealth of massachusetts accelerated … integrated facilities management (ifm) initiative...
TRANSCRIPT

Slide 1
ZNE 2015 CHARRETTES MAY 21, 2015
www.mass.gov/DCAMM/aep http://www.mass.gov/eea/leadingbyexample

Slide 2
Today’s Agenda
WELCOME & INTRODUCTIONS Carol Gladstone, DCAMM 9:00am – 9:20am Judith Judson, DOER
PURPOSE OF ZNE 2015 CHARRETTES Hope Davis, DCAMM 9:20 am – 9:30am
COMMON UNDERSTANDING 9:30am – 10:30am
- DOER Related Initiatives Eric Friedman, DOER 9:30am - 9:50am
- DCAMM New Construction & Existing Buildings Jenna Ide, DCAMM 9:50am – 10:10am
- Other policies and programs Kevin Bernier, Fort Hill 10:10am – 10:30am
BREAK
VISIONING BREAK-OUT SESSION Everyone 10:45am - 11:30pm
VISIONING REPORT OUT 11:30am - 12:15pm
LUNCH 12:15pm – 1:00pm
- Presentation on Bristol CC ZNE Lab Sasaki & BR+A 12:30pm – 12:50pm
ACTIONS BREAK-OUT SESSION Everyone 1:00 pm – 2:00 pm
PRIORITY ACTIONS REPORT OUT 2:00 pm – 2:30 pm
WRAP UP Team 2:30pm – 3:00 pm
Slide 3
Welcome & Introductions

Slide 4
Visioning Charrette (Today)
Two charrettes - one in Eastern MA, and one in Western MA.
Purpose:
1. Develop consensus of a vision for the future of state facilities in regard to energy and sustainability
2. Define actions needed to achieve this vision

Slide 5
Visioning Breakout Session (morning)
Participants will work together to answer:
What is our common vision for sustainability at state facilities?
1. What are our long term clean energy goals? ZNE, high levels of LEED, etc. Timeframe, practical and achievable Where does it apply? (new construction, existing buildings,
leased, etc.)
2. What other sustainability elements should be included? Water, waste, resiliency, transportation, etc.

Slide 6
Actions Breakout Session (afternoon)
Participants will work together to answer: 1. What is needed throughout the facility lifecycle?
New construction Existing buildings Operations and maintenance
2. What actions should be considered? Policies (laws, E.O., etc.)
Procedures Integrated long range planning Financing Innovations Training and professional development Post occupancy

Slide 7
Common Understanding Presentations

Creating A Cleaner Energy Future For the Commonwealth
Leading by Example Overview • EO 484 2020 Targets
40% ghg emission reduction 35% energy reduction 30% use of renewable power
• Mass LEED Plus New Construction standards Requires LEED certification 20% better than code Independent 3rd party
commissioning
• Partners state colleges & universities agencies & authorities across buildings and fleets

Creating A Cleaner Energy Future For the Commonwealth
Leading by Example Progress

Creating A Cleaner Energy Future For the Commonwealth
Met GHG Emissions Reduction target
2012 GHG Emissions reduced by 25% from the LBE Baseline
6%
2%
-2% -4%
-8%
-14% -15%
-25% -24% -22%
-
200
400
600
800
1,000
1,200
1,400
1,600
GHG
Em
issi
ons (
Met
ric T
onne
s)
Thou
sand
s
Fiscal Year

Creating A Cleaner Energy Future For the Commonwealth
Renewable Energy and On-site Generation
-
200
400
600
800
1,000
1,200
1,400
1,600
Consumed (kWh) Generated (kWh)
Elec
tric
ity C
onsu
mpt
ion
(kW
h)
Mill
ions
Renewable Energy Credits (additional)Total CHP generationRenewable Energy (Solar, Wind, AD, Hydro)total electricity consumptionLBE RE Target for FY2020
In 2013, 20% of state government’s total
electricity consumption came
from on-site generation
On-site generation from solar, wind, hydro, anaerobic
digestion and NG CHP

Creating A Cleaner Energy Future For the Commonwealth
Energy Reduction Progress 14% weather normalized EUI reduction 2004-2014
153 152
154 154 155 156 154
150 150 147
131
-1%
1% 1% 1% 2% 1%
-2% -2%
-4%
-14%
100
110
120
130
140
150
160
FY2004 FY2005 FY2006 FY2007 FY2008 FY2009 FY2010 FY2011 FY2012 FY2013 FY2014

Creating A Cleaner Energy Future For the Commonwealth
LBE Solar Progress Over 8 MW of solar PV installed (up from <100 kW in 2006)
additional 5+ MW to be online in 2015
2006 2007 2008 2009 2010 2011 2012 2013 2014Solar Installations 3 1 8 4 3 19 16 5 5
CumulativeInstalled
Capacity (kW)37 118 694 964 1,112 4,531 6,458 7,799 8,145
0
1,000
2,000
3,000
4,000
5,000
6,000
7,000
8,000
9,000
02468
101214161820
Cum
ulat
ive
Inst
alle
d Ca
paci
ty (k
W)
Sola
r Ins
talla
tions
Solar PV installations FY06-FY14
Creating A Cleaner Energy Future For the Commonwealth
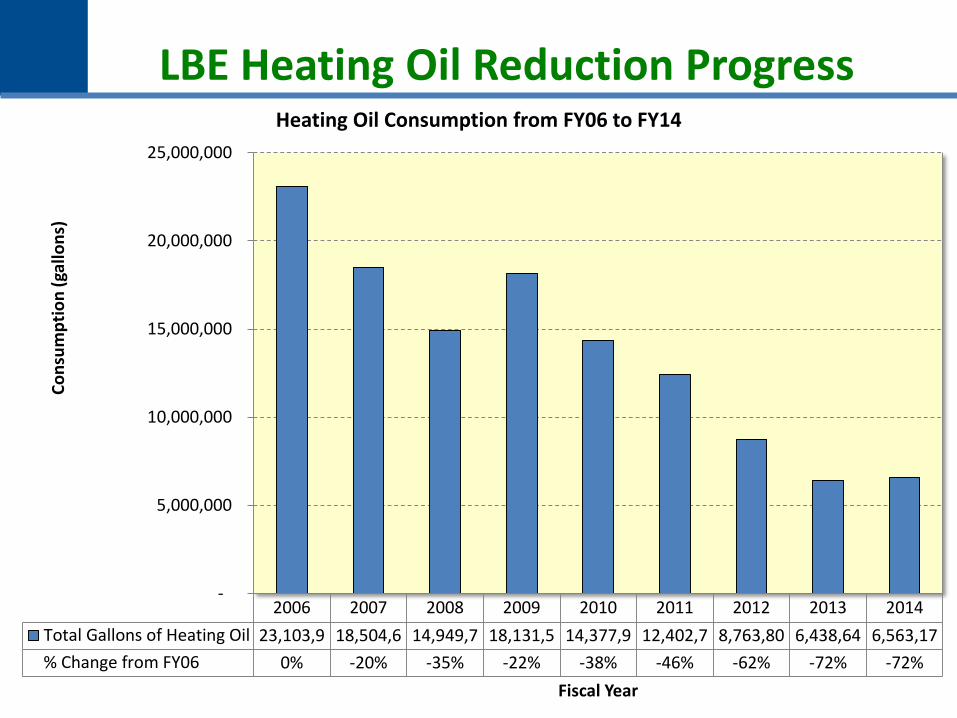
LBE Heating Oil Reduction Progress
2006 2007 2008 2009 2010 2011 2012 2013 2014Total Gallons of Heating Oil 23,103,9 18,504,6 14,949,7 18,131,5 14,377,9 12,402,7 8,763,80 6,438,64 6,563,17% Change from FY06 0% -20% -35% -22% -38% -46% -62% -72% -72%
-
5,000,000
10,000,000
15,000,000
20,000,000
25,000,000
Cons
umpt
ion
(gal
lons
)
Fiscal Year
Heating Oil Consumption from FY06 to FY14

Creating A Cleaner Energy Future For the Commonwealth
LBE New Construction Progress
• 37 LEED certified buildings • 2 zero net energy designed
buildings constructed • Other ZNEBS in design and
construction
Platinum 1
Gold 25
Silver 10
Certified 1
Creating A Cleaner Energy Future For the Commonwealth
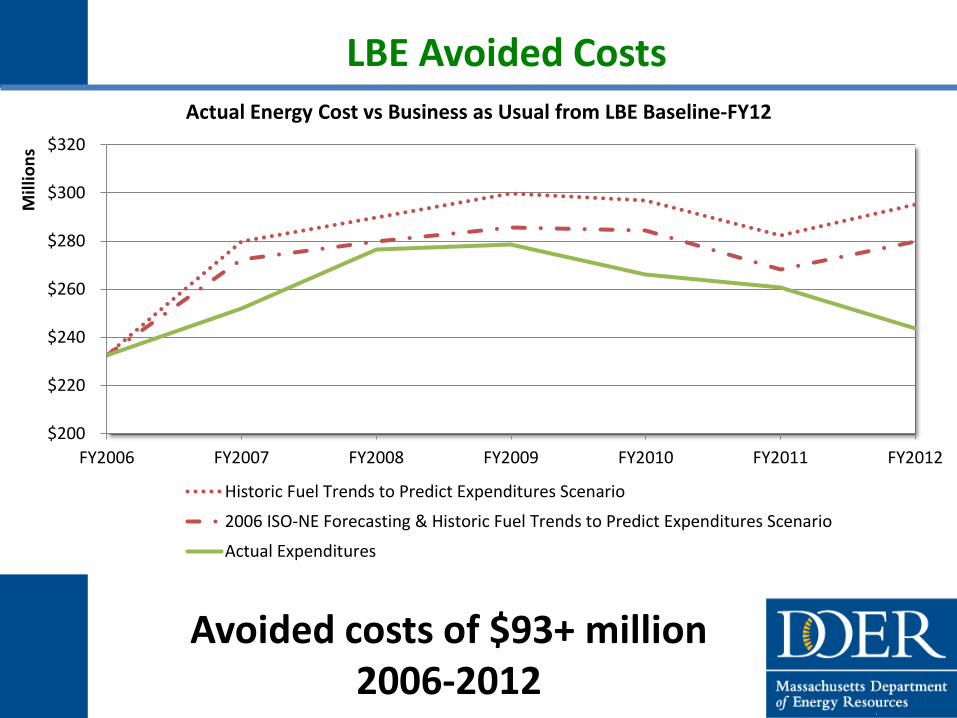
LBE Avoided Costs
Avoided costs of $93+ million 2006-2012
$200
$220
$240
$260
$280
$300
$320
FY2006 FY2007 FY2008 FY2009 FY2010 FY2011 FY2012
Mill
ions
Actual Energy Cost vs Business as Usual from LBE Baseline-FY12
Historic Fuel Trends to Predict Expenditures Scenario
2006 ISO-NE Forecasting & Historic Fuel Trends to Predict Expenditures Scenario
Actual Expenditures
Creating A Cleaner Energy Future For the Commonwealth
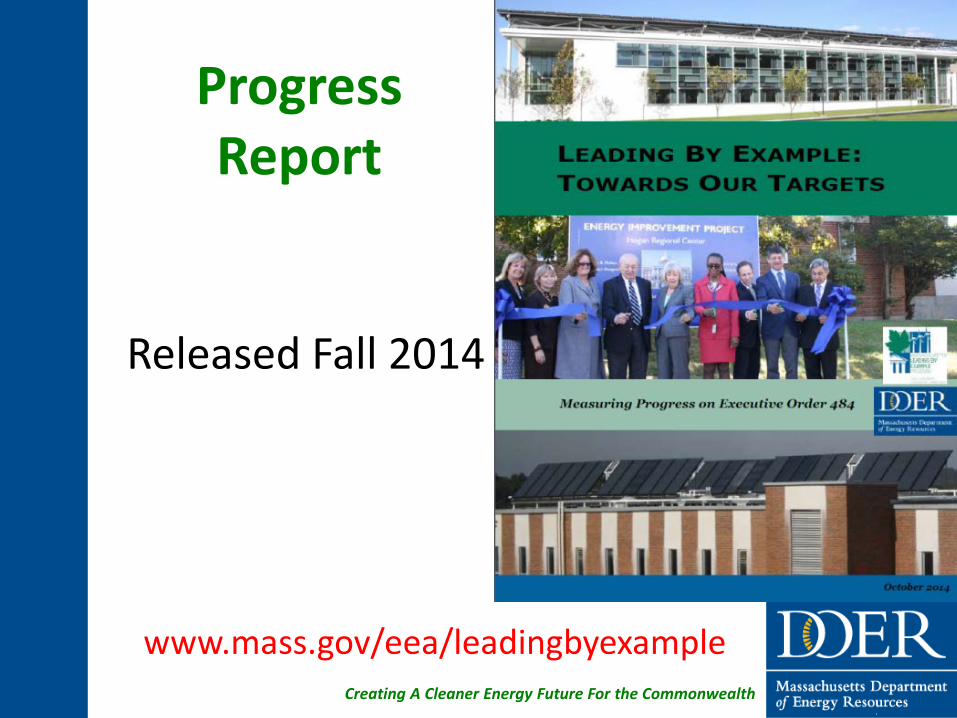
Progress Report
Released Fall 2014
www.mass.gov/eea/leadingbyexample

Creating A Cleaner Energy Future For the Commonwealth
Moving Forward

Creating A Cleaner Energy Future For the Commonwealth
Building Energy Intelligence
Targets • New contract in development with DCAMM • Continue to reduce energy use/costs using data • New approaches planned that result in value at lower costs • Target real time meter data, BMS information to drive results

Creating A Cleaner Energy Future For the Commonwealth
Solar Canopies
• Install multi- MW of new capacity at diverse range of state sites
• Reduce costs and emissions • Shelter cars, reduce auto fuel use, reduce lot
maintenance costs

Creating A Cleaner Energy Future For the Commonwealth
Fleet Fuel Efficiency
• Draft fuel efficiency standards • Minimum MPG for cars and trucks/vans • Minimum electric vehicle requirements • Minimum AFV/hybrid requirements

Creating A Cleaner Energy Future For the Commonwealth
Renewable Thermal
• Initiate feasibility studies to target institutions using significant amounts of oil
• Continue to work with smaller sites to expand use of thermal technologies
• Biomass, heat pumps, solar thermal, CHP all eligible
• Must meet efficiency and emissions criteria

Slide 23
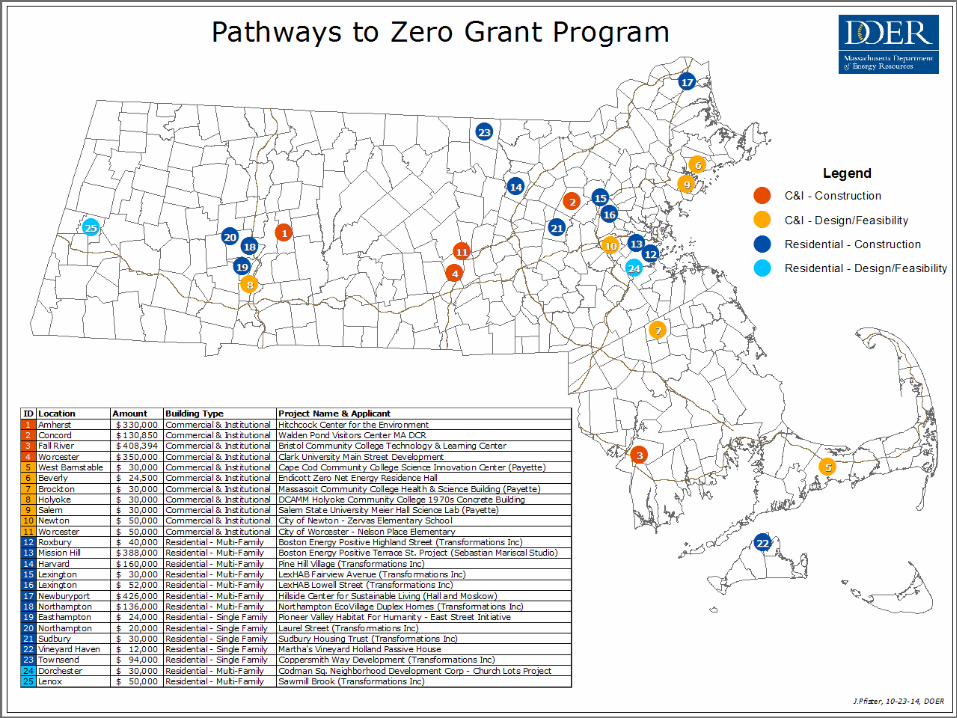
Pathway to Zero

Creating A Cleaner Energy Future For the Commonwealth
Funding & Eligibility Overview 1. $3.0M to support residential and commercial
ZNEB projects through feasibility studies, integrated design, and construction funding. $30k feasibility studies $50k integrated design $10k - $500k construction funding
2. $0.5M to support public awareness, workforce development, efforts to develop and standardize best practices, and DOER resources.
24

Creating A Cleaner Energy Future For the Commonwealth
Proposals & Awards Applications (42 totaling $7.6 million) Awards (25 totaling $3.0 million) • C&I: 11 projects – $1,462,894 (~1 million sq ft) • Multi Family: 9 projects – $1,312,000 (243 units) • Single Family: 5 projects – $180,000 (21 homes)
25
Creating A Cleaner Energy Future For the Commonwealth
26
Creating A Cleaner Energy Future For the Commonwealth
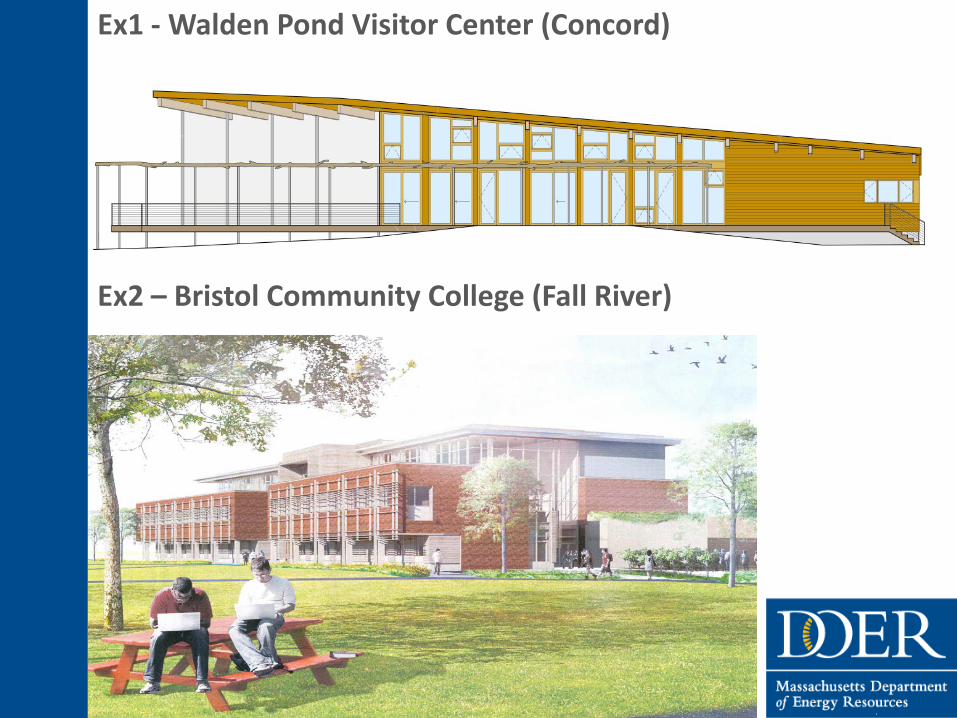
Ex1 - Walden Pond Visitor Center (Concord)
Ex2 – Bristol Community College (Fall River)

Slide 28
DCAMM • New construction • Existing buildings • Operations & maintenance Jenna Ide, DCAMM
Slide 29
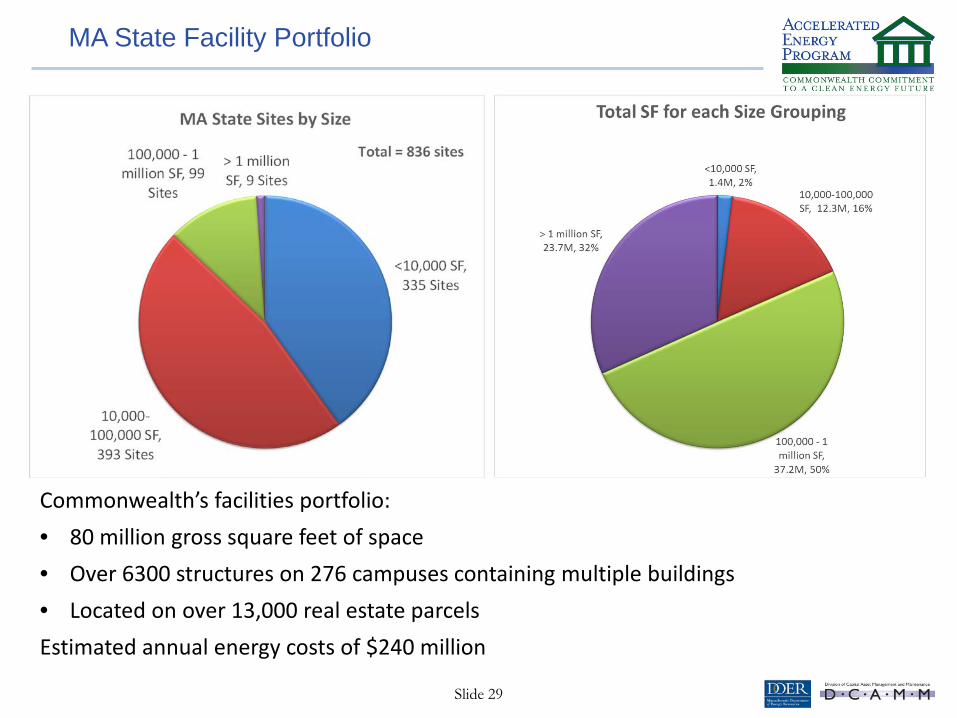
MA State Facility Portfolio
Commonwealth’s facilities portfolio: • 80 million gross square feet of space • Over 6300 structures on 276 campuses containing multiple buildings • Located on over 13,000 real estate parcels Estimated annual energy costs of $240 million
Slide 30
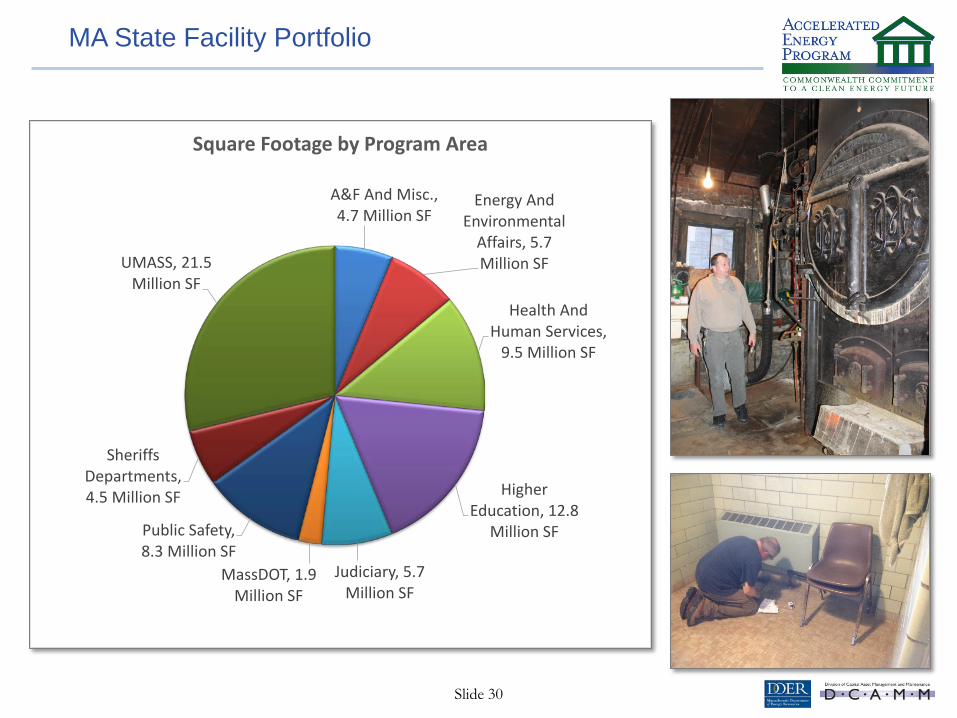
MA State Facility Portfolio
A&F And Misc., 4.7 Million SF
Energy And Environmental
Affairs, 5.7 Million SF
Health And Human Services,
9.5 Million SF
Higher Education, 12.8
Million SF
Judiciary, 5.7 Million SF
MassDOT, 1.9 Million SF
Public Safety, 8.3 Million SF
Sheriffs Departments, 4.5 Million SF
UMASS, 21.5 Million SF
Square Footage by Program Area

Slide 31
.
Zero Net Energy Buildings
Division of Fisheries and Wildlife HQ Westborough, MA
North Shore Community College Health and Student Services Building
Danvers, MA
Not shown in design/construction (Lowell Trial Court, Bristol CC)
New Construction

Slide 32
.
New Construction
Going Deeper • All new HE facilities have a goal of LEED silver
Most projects certifying LEED Gold
• Several new projects targeting higher than 20% above code
• Envelope commissioning
• Energy dashboards in development for UMass Amherst and UMass Boston See link to dashboard - http://bedashboard.com/kiosk/home/campus/46
• Measurement & verification implemented on UMass Amherst projects

Slide 33
.
New Construction
Lessons
• Coordination of innovative technologies harder than thought (i.e. GSHP, solar, etc.)
• Commissioning requires planning, strong collaboration & adequate funding
• New buildings not always operating as designed; some operating better than designed
• Confusion over current EO 484 requirements and energy modeling
• Need to provide greater clarity to designers over what is in scope of services

Slide 34
Existing Buildings
Tremendous acceleration of DCAMM’s energy retrofit program

Slide 35
TZNE 2013 Retrofit Charrette 74 participants across multiple disciplines
Existing Buildings
TZNE Retrofit Report Includes Just Do Its
(“JDIs”)

Slide 36
Existing Buildings
“Just Do It” Actions 1. Assign The Right Team
(Right Team and Right Size)
2. Define ZNE Goals and Align with Existing Conditions
3. Get Buy In At ALL levels
4. Establish Integrated Processes
5. Incorporate Innovative Solutions
6. Right Timing of Retrofits (with Deferred Maintenance)
7. Manage Post-Project Operations
TZNE Pilot Sites 1. Cape Cod Community College 2. Holyoke Community College 3. Greenfield Community College
4. Plymouth Country Correctional 5. Essex Sheriff’s Department
(Lawrence and Middleton)
6. DCR Georges Island 7. Lancaster Complex 8. North Central Correctional Institute 9. Soldiers’ Home Chelsea

Slide 37
Existing Buildings
Progress • Significant number of innovative and deep energy measures
• Several projects identifying 40-85% energy reduction
• Leverage grid operator programs to get higher savings
• Towards Zero Net Energy (TZNE) template SOW for designers
0%20%40%60%80%
100%120%
Cape CodCC
GeorgesIsland
HolyokeCC
NCCIGardner
EssexSheriff
Middleton
EssexSheriff
Lawrence
PlymouthSheriff
Energy Savings and Renewable at Pilot Sites
% Energy Savings % Renewable
Slide 38
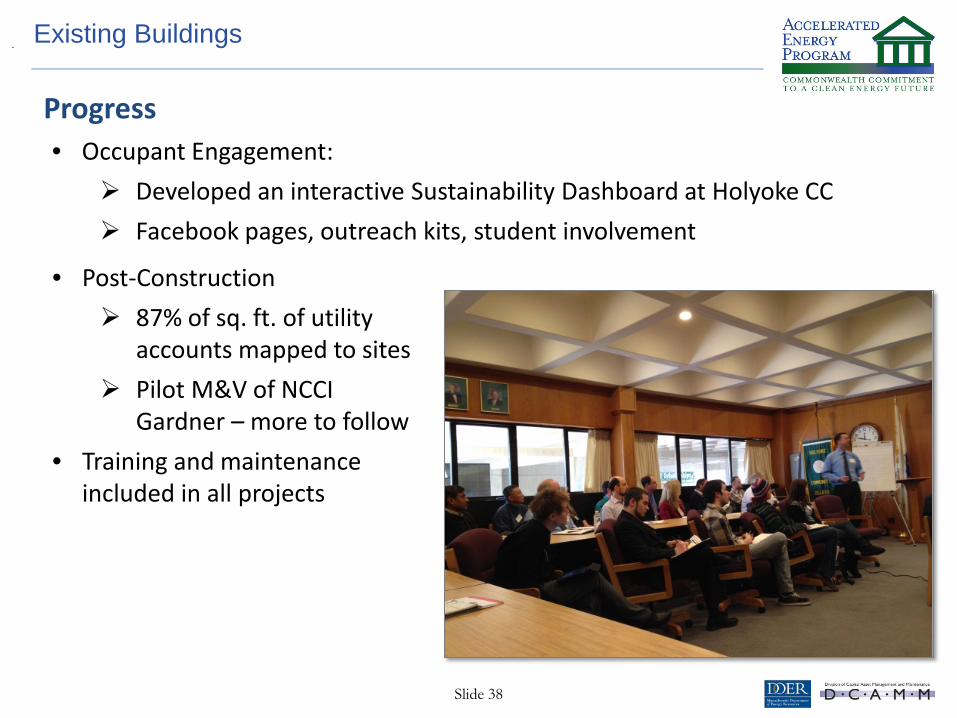
Existing Buildings
Progress • Occupant Engagement:
Developed an interactive Sustainability Dashboard at Holyoke CC Facebook pages, outreach kits, student involvement
• Post-Construction
87% of sq. ft. of utility accounts mapped to sites
Pilot M&V of NCCI Gardner – more to follow
• Training and maintenance included in all projects

Slide 39
Existing Buildings
Lessons Learned • Paradigm shift between energy retrofit
projects and TZNE programs
• Getting right team is different for every project
• Just Do Its are not things one can always just do
• Can’t do it all at once - phasing

Slide 40
Existing Buildings
Opportunities Going Forward • Further integrate team processes
• Retrofit projects (E-Team) • New construction projects (OPDC) • DOER and facility related programs
• Find and standardize best practices
• Update financial payback approach - LCCA to include more robust model of savings
• Overcome financial barriers and barriers to onsite renewables
• More operations and maintenance training for facility personnel on increasingly sophisticated systems

Slide 41
Operations and Maintenance
EO 543 [Implementing IFM in the Commonwealth] The Integrated Facilities Management (IFM) initiative improves the management of state-owned facilities using a collaborative, shared services model. • Signed in July 2012 • Directs a shared services approach • Drives greater customer satisfaction (client
agencies & public) • Requires all Agencies to use a common
technology for real estate information services, and to maintain and update this technology with current and accurate information

Slide 42
Facility Management and Maintenance Standards (FMMS)
Benchmark for management • Proposed baseline standards
for all state-owned facilities
• Represent current best practices
Some relevant standards
• Grounds and Landscape Maintenance
• Solid Waste Management
• Emergency Management
• Energy Management and Sustainability
Operations and Maintenance

Slide 43
• Ensure all equipment and appliances comply with ENERGY STAR
• Review and utilize real-time energy data, if available
• Enroll in, and meet requirements for participation in the ISO New England (ISO-NE) Demand Response Program
• Implement Grounds and Landscape programs that encourage native species, water conservation
• Use Environmentally Preferable Products wherever possible
• Comply with Waste Bans – construction, wood, recyclable materials, & now food
Operations and Maintenance
Slide 44
Other Policies and Programs
Kevin Bernier, Fort Hill Companies

Slide 45
LIVING BUILDING CHALLENGE 3.0 (initial release in 2006)
Code
Gre
en
High
Per
form
ance
Sust
aina
ble
Negative Environmental
Impact
Regenerative
Living Building
Challenge
VISION: Path to a Regenerative Future.
Transformational Advanced measure of sustainability • 7 petals • 20 imperatives such as: Net positive energy* Net positive water Car free living Biophilia
*separate certification available for Net Zero Energy

Slide 46
Architecture 2030 Challenge (issued in 2007)
NEW CONSTRUCTION • Designed to meet a fossil fuel, GHG-emitting, energy consumption performance
standard of 70% below the regional (or country) average/median for building type. EXISTING BUILDINGS • An equal amount of existing building area renovated annually to meet a fossil fuel,
GHG-emitting, energy consumption performance standard of 70% of the regional (or country) average/median for building type.
FOSSIL FUEL REDUCTION STANDARDS (for all new buildings and major renovations) 80% in 2020 90% in 2025
CARBON-NEUTRAL IN 2030 (using no fossil fuel GHG emitting energy)
VISION: Rapidly transform the built environment from the major contributor of GHG emissions to a central part of the solution to the climate crisis.

Slide 47
.
California Title 24 Code (2013 Edition) VISION: Zero Net Energy
NEW CONSTRUCTION 100% of new residential construction will be ZNE or equivalent to ZNE by 2020 100% of new commercial construction will be ZNE or equivalent to ZNE by 2030
EXISTING BUILDINGS 50% of existing buildings will be equivalent to ZNE buildings by 2030
Comprehensive Building Solutions • Utility financial incentives • Plug-in controls • Lighting revolution

Slide 48
PRIORITIES • Reduce EUI by 2.5% annually between 2015-2025 • Increase renewable electric energy to 30% • Reduce potable water consumption by 36% Net Zero Energy New Construction (by 2030)
• where feasible, Net Zero Water or Waste Existing Buildings (by 2025)
• 15% SQFT comply with revised Guiding Principles
• % be NZE, Water or Waste
EO 13693 - Federal Sustainability in the Next Decade (2015)
VISION: Reduce GHG emissions by 40% over next decade (Scope 1, 2 & 3)

Slide 49
.
Net Zero Cambridge Action Plan (2015)
ENERGY EFFICIENCY IN EXISTING BUILDINGS Reduce energy use in buildings through retrofits and improved operations
ACTION PLAN:
Achieve 70% reduction in annual emissions in 25 years (2040).
VISION: Achieve net zero emissions from buildings in Cambridge.
NET ZERO NEW CONSTRUCTION Require low carbon new construction
RENEWABLE ENERGY SUPPLY Replace fossil fuels with low carbon energy
LOCAL CARBON FUND Options to invest in a net zero community
ENGAGEMENT AND CAPACITY BUILDING Industry training and community involvement

Slide 50
.
Building Resilience in Boston
Resiliency is defined as the ability to recover from or adjust easily to misfortune or change.
stronger buildings better planning backup power essential safety

Slide 51
Resilience – State Initiatives
Current Activities A number of agencies are partnering to share resources, plan and implement solutions to climate adaptation challenges across the Commonwealth.
2008 •Global Warming Solutions Act enacted
2011 • Climate change Adaptation Committee releases
report highlighting necessary steps to integrate adaptation planning
2013 •MEMA and DCR partner to update State
Hazard Mitigation Plan
2014 •DCAMM establishes resilience workgroup
and begins discussions with MEMA
2015 • DCAMM and MEMA are exploring a partnership
to assess, prioritize and implement projects at agency facilities using DCAMM House Doctors.
NOAA Coastal Flood Exposure Mapper – Critical Assets
Image: Washington Post Image: Charles Krupa/Associated Press

Slide 52
Today’s Agenda
WELCOME & INTRODUCTIONS Carol Gladstone, DCAMM 9:00am – 9:20am Judith Judson, DOER
PURPOSE OF ZNE 2015 CHARRETTES Hope Davis, DCAMM 9:20 am – 9:30am
COMMON UNDERSTANDING 9:30am – 10:30am
- DOER Related Initiatives Eric Friedman, DOER 9:30am - 9:50am
- DCAMM New Construction & Existing Buildings Jenna Ide, DCAMM 9:50am – 10:10am
- Other policies and programs Kevin Bernier, Fort Hill 10:10am – 10:30am
BREAK
VISIONING BREAK-OUT SESSION Everyone 10:45am - 11:30pm
VISIONING REPORT OUT 11:30am - 12:15pm
LUNCH 12:15pm – 1:00pm
- Presentation on Bristol CC ZNE Lab Sasaki & BR+A 12:30pm – 12:50pm
ACTIONS BREAK-OUT SESSION Everyone 1:00 pm – 2:00 pm
PRIORITY ACTIONS REPORT OUT 2:00 pm – 2:30 pm
WRAP UP Team 2:30pm – 3:00 pm

Slide 53
Visioning Break-out Session (morning)
Participants will work together to answer: What is our common vision for sustainability at state facilities?
1. What are our long term clean energy goals? ZNE, high levels of LEED, etc. Timeframe, practical and achievable Where does it apply? (new construction, existing buildings,
leased, etc.)
2. What other sustainability aspects should be included? Water, waste, resiliency, transportation, etc.

Slide 54
Today’s Agenda
WELCOME & INTRODUCTIONS Carol Gladstone, DCAMM 9:00am – 9:20am Judith Judson, DOER
PURPOSE OF ZNE 2015 CHARRETTES Hope Davis, DCAMM 9:20 am – 9:30am
COMMON UNDERSTANDING 9:30am – 10:30am
- DOER Related Initiatives Eric Friedman, DOER 9:30am - 9:50am
- DCAMM New Construction & Existing Buildings Jenna Ide, DCAMM 9:50am – 10:10am
- Other policies and programs Kevin Bernier, Fort Hill 10:10am – 10:30am
BREAK
VISIONING BREAK-OUT SESSION Everyone 10:45am - 11:30pm
VISIONING REPORT OUT 11:30am - 12:15pm
LUNCH 12:15pm – 1:00pm
- Presentation on Bristol CC ZNE Lab Sasaki & BR+A 12:30pm – 12:50pm
ACTIONS BREAK-OUT SESSION Everyone 1:00 pm – 2:00 pm
PRIORITY ACTIONS REPORT OUT 2:00 pm – 2:30 pm
WRAP UP Team 2:30pm – 3:00 pm

Slide 55
Today’s Agenda
WELCOME & INTRODUCTIONS Carol Gladstone, DCAMM 9:00am – 9:20am Judith Judson, DOER
PURPOSE OF ZNE 2015 CHARRETTES Hope Davis, DCAMM 9:20 am – 9:30am
COMMON UNDERSTANDING 9:30am – 10:30am
- DOER Related Initiatives Eric Friedman, DOER 9:30am - 9:50am
- DCAMM New Construction & Existing Buildings Jenna Ide, DCAMM 9:50am – 10:10am
- Other policies and programs Kevin Bernier, Fort Hill 10:10am – 10:30am
BREAK
VISIONING BREAK-OUT SESSION Everyone 10:45am - 11:30pm
VISIONING REPORT OUT 11:30am - 12:15pm
LUNCH 12:15pm – 1:00pm
- Presentation on Bristol CC ZNE Lab Sasaki & BR+A 12:30pm – 12:50pm
ACTIONS BREAK-OUT SESSION Everyone 1:00 pm – 2:00 pm
PRIORITY ACTIONS REPORT OUT 2:00 pm – 2:30 pm
WRAP UP Team 2:30pm – 3:00 pm

Slide 56
Priority Actions Breakout Session (afternoon)
1. What is needed throughout the facility lifecycle? New construction Existing buildings Operations and maintenance
2. What actions should be considered? Policies (laws, E.O., etc.)
Procedures Integrated long range planning Financing Innovations Training and professional development Post occupancy Other

Slide 57
Today’s Agenda
WELCOME & INTRODUCTIONS Carol Gladstone, DCAMM 9:00am – 9:20am Judith Judson, DOER
PURPOSE OF ZNE 2015 CHARRETTES Hope Davis, DCAMM 9:20 am – 9:30am
COMMON UNDERSTANDING 9:30am – 10:30am
- DOER Related Initiatives Eric Friedman, DOER 9:30am - 9:50am
- DCAMM New Construction & Existing Buildings Jenna Ide, DCAMM 9:50am – 10:10am
- Other policies and programs Kevin Bernier 10:10am – 10:30am
BREAK
VISIONING BREAK-OUT SESSION Everyone 10:45am - 11:30pm
VISIONING REPORT OUT 11:30am - 12:15pm
LUNCH 12:15pm – 1:00pm
- Presentation on Bristol CC ZNE Lab Sasaki & BR+A 12:30pm – 12:50pm
ACTIONS BREAK-OUT SESSION Everyone 1:00 pm – 2:00 pm
PRIORITY ACTIONS REPORT OUT 2:00 pm – 2:30 pm
WRAP UP Team 2:30pm – 3:00 pm

Slide 58
Phase 2 Working Group Charrette (July 2015)
How do we organize the actions defined in these Phase I Charrettes?
How do we achieve the vision?
Are the right people engaged, or are others needed?
How do we address barriers?
How do we measure success?
Purpose 1. Refine and prioritize actions needed to achieve this vision 2. Develop a roadmap to achieve vision
Slide 59
Feedback
What worked today?
What would you improve?
What are your key takeaways?

Slide 60
Wrap Up
Survey – from Eventbrite Please provide feedback
Next Visioning charrette in Greenfield, June 11th
Contact Stephen White to participate
July Working charrette Contact Stephen White if interested
Will post presentation to website

Slide 61
THANK YOU!