the informal cross border trade survey ... report presents the estimates of the informal cross...
TRANSCRIPT
THE INFORMAL CROSS BORDER TRADE
SURVEY REPORT 2012
August, 2013
Informal Cross Border Trade Report 2012.
ii
FOREWORD
Intra-EAC trade has grown in importance over recent years, stimulated by the sustained
peace and security in areas which had previously been afflicted by civil conflict,
expansion of economic activity throughout the region and ongoing efforts to promote
regional integration. A significant share of regional trade consists of informal cross
border trade which is not captured in official trade statistics. Nevertheless, data on
informal cross border trade are necessary for both accurate balance of payments and
national account statistics.
This report presents the estimates of the informal cross border trade (ICBT) Survey for
2012 conducted by Bank of Uganda (BOU) and Uganda Bureau of Statistics (UBOS) at
all of the main border posts. The estimates indicate that informal exports amounted to
over $450 million in 2012 comprising about 16 percent of Uganda’s total exports.
The execution of ICBT surveys would not have been possible without the assistance of
Uganda Revenue Authority, the Immigration Department of Ministry of Internal Affairs,
Uganda Police, Border security, clearing agents and traders all of whom we are
thankful to.
Prof. Emmanuel Tumusiime-Mutebile Ben Paul Mungyereza
Governor Executive Director
Bank of Uganda Uganda Bureau of Statistics
Informal Cross Border Trade Report 2012.
iii
TABLE OF CONTENTS
DEFINITIONS ........................................................................................................................................... vi
ACRONYMS ......................................................................................................................................... vii
EXECUTIVE SUMMARY ....................................................................................................................... viii
Chapter 1 : INTRODUCTION .............................................................................................. 1
1.0 Introduction .............................................................................................................................. 1
1.1 Background ............................................................................................................................. 1
1.2 The global trade Situation .................................................................................................... 1
1.3 EAC trade developments .................................................................................................... 2
1.4 Survey Objectives ................................................................................................................... 2
1.5 Structure of the report ........................................................................................................... 3
Chapter 2 : METHODOLOGY ............................................................................................ 4
2.0 Introduction .............................................................................................................................. 4
2.1 Selection of Monitored Border Posts ................................................................................. 4
2.2 Trade type and Valuation Issues ........................................................................................ 5
2.3 Selection of weeks for monitoring ..................................................................................... 5
2.4 Survey Organization .............................................................................................................. 6
2.5 Data Collection Techniques ............................................................................................... 6
2.6 Data Collection Instruments ................................................................................................ 6
2.7 Data Processing and Analysis ............................................................................................. 6
2.8 Up-rating of Survey Results ................................................................................................... 7
2.9 Estimation of missing data for un-monitored months ................................................... 7
2.10 Data Limitations ...................................................................................................................... 7
Chapter 3 : SURVEY FINDINGS .......................................................................................... 8
3.0 Introduction .............................................................................................................................. 8
3.1 Comparison of Informal and Formal Trade flows......................................... 8
3.2 Direction of Informal Trade .................................................................................................. 9
3.2.1 Informal exports ...................................................................................................................... 9
3.2.2 Informal imports .................................................................................................................... 10
3.3 Trade flows by Commodity Category ............................................................................ 11
3.4 Main informal Export Commodities ................................................................................. 12
Informal Cross Border Trade Report 2012.
iv
3.5 Main Informal Import Commodities ................................................................................ 14
3.6 Trade Flows by Border Station ........................................................................................... 15
3.6.1 Informal Exports ..................................................................................................................... 15
3.6.2 Informal Imports .................................................................................................................... 15
3.7 Trade flow by Modes of Transport ................................................................................... 16
Chapter 4 : SUMMARY OF FINDINGS AND POTENTIAL POLICY IMPLICATIONS.. 18
4.0 Introduction ............................................................................................................................ 18
4.1 Summary of findings ............................................................................................................ 18
4.2 Implications of the results ................................................................................................... 19
4.3 Policy Recommendations .................................................................................................. 19
APPENDICES ........................................................................................................................ 20
Informal Cross Border Trade Report 2012.
v
LIST OF TABLES
Table 1: Border Posts Monitored during 2012 ...................................................................... 4
Table 2: Formal and Informal Trade Flows (US$ Millions), 2010-2012 ................................ 8
Table 3: Direction of Trade (US$ Millions), 2010-2012 ....................................................... 10
Table 4: Informal Trade by Commodity Category and Country (US$ Million), 2011 – 2012.
..................................................................................................................................... 12
Table 5: Main Informal Exports (US$ Million), 2010-2012. .................................................. 13
Table 6: Main Informal Imports (US$ Million) in 2010 and 2011 ....................................... 14
Table 7: Informal Trade by Country/Border Station and Value (US$ Millions) 2009-11 16
LIST OF FIGURES
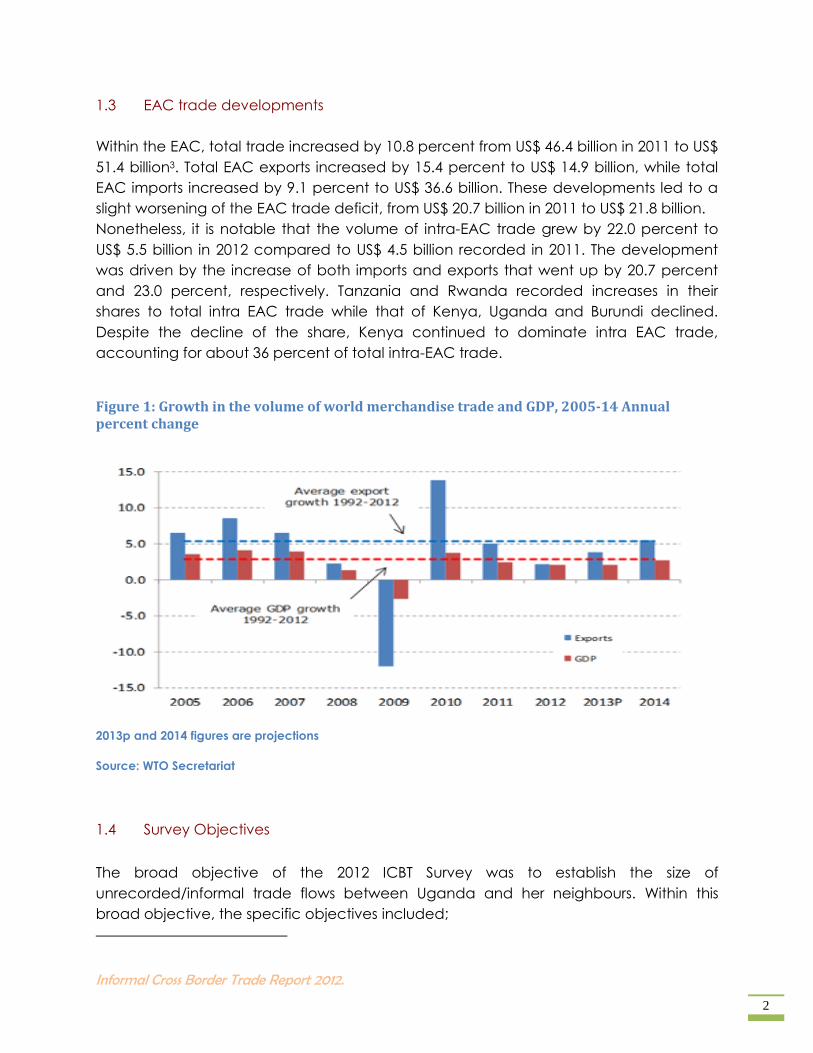
Figure 1: Growth in the volume of world merchandise trade and GDP, 2005-14 Annual
percent change ......................................................................................................... 2
Figure 2: Formal Imports, Exports and Trade Balance (US$ million), 2005-2012. ............. 9
Figure 3: Informal Imports, Exports and Trade Balance (US$ million), 2005-2012. ......... 9
Figure 4: Percentage Share of informal imports by Country of Origin, 2011 and 201211
Figure 5: Informal Exports by Mode of Transport, (Million US$) 2012 ............................. 17
Figure 6: Informal imports by Mode of Transport, (Million US$) 2012........................... 17
LIST OF APPENDICES
Appendix I: The Up-rating Model ........................................................................................ 20
Appendix II : Leading Informal Exports by Category and Value (US$ Million), 2010 – 2012 ........................................................................................................................................... 25
Appendix III: Leading Informal Imports by Category and Value (US$ Million), 2010 – 2012 ........................................................................................................................................... 26
Appendix V : ICBT Survey Team 2012 ................................................................................. 28
Appendix VI : Survey Instruments ....................................................................................... 30
Informal Cross Border Trade Report 2012.
vi
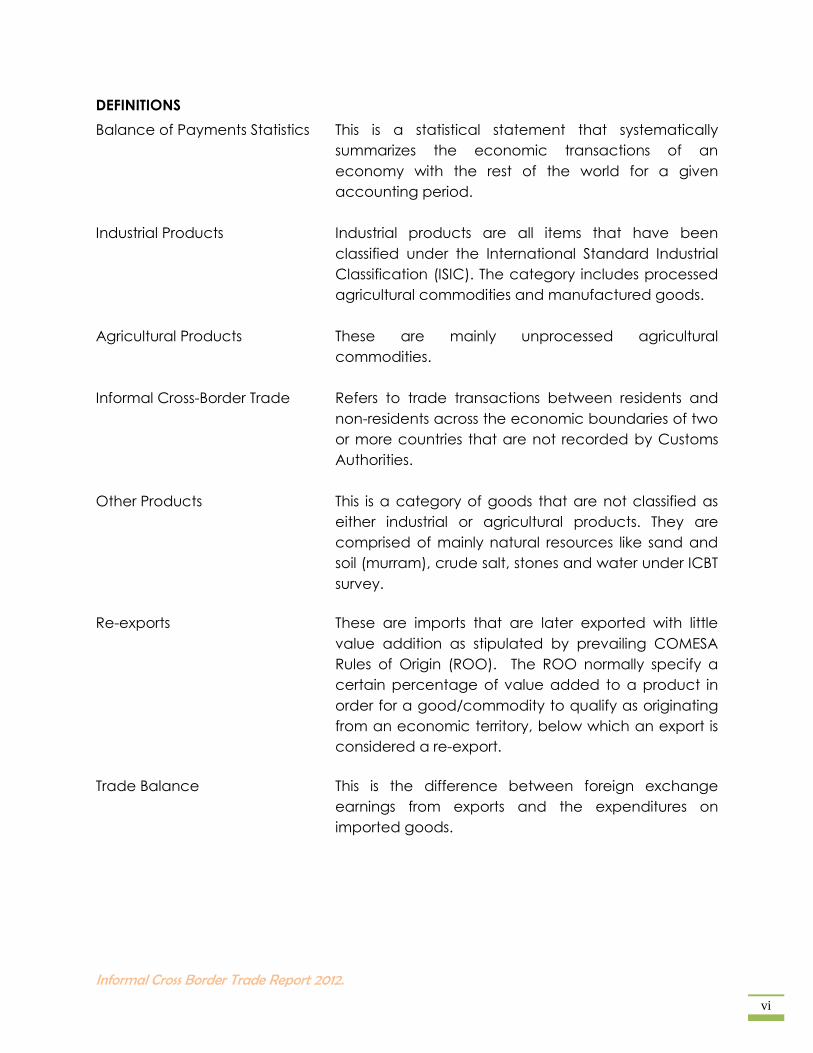
DEFINITIONS
Balance of Payments Statistics This is a statistical statement that systematically
summarizes the economic transactions of an
economy with the rest of the world for a given
accounting period.
Industrial Products Industrial products are all items that have been
classified under the International Standard Industrial
Classification (ISIC). The category includes processed
agricultural commodities and manufactured goods.
Agricultural Products These are mainly unprocessed agricultural
commodities.
Informal Cross-Border Trade Refers to trade transactions between residents and
non-residents across the economic boundaries of two
or more countries that are not recorded by Customs
Authorities.
Other Products This is a category of goods that are not classified as
either industrial or agricultural products. They are
comprised of mainly natural resources like sand and
soil (murram), crude salt, stones and water under ICBT
survey.
Re-exports These are imports that are later exported with little
value addition as stipulated by prevailing COMESA
Rules of Origin (ROO). The ROO normally specify a
certain percentage of value added to a product in
order for a good/commodity to qualify as originating
from an economic territory, below which an export is
considered a re-export.
Trade Balance This is the difference between foreign exchange
earnings from exports and the expenditures on
imported goods.
Informal Cross Border Trade Report 2012.
vii
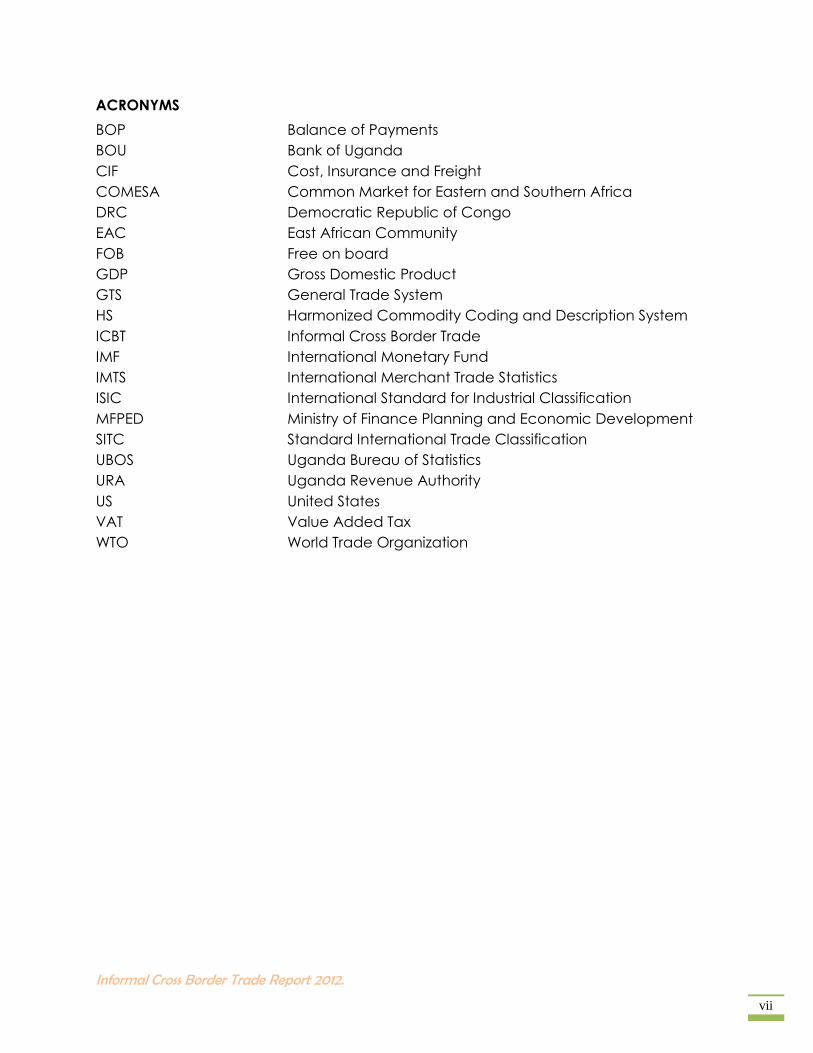
ACRONYMS
BOP Balance of Payments
BOU Bank of Uganda
CIF Cost, Insurance and Freight
COMESA Common Market for Eastern and Southern Africa
DRC Democratic Republic of Congo
EAC East African Community
FOB Free on board
GDP Gross Domestic Product
GTS General Trade System
HS Harmonized Commodity Coding and Description System
ICBT Informal Cross Border Trade
IMF International Monetary Fund
IMTS International Merchant Trade Statistics
ISIC International Standard for Industrial Classification
MFPED Ministry of Finance Planning and Economic Development
SITC Standard International Trade Classification
UBOS Uganda Bureau of Statistics
URA Uganda Revenue Authority
US United States
VAT Value Added Tax
WTO World Trade Organization
Informal Cross Border Trade Report 2012.
viii
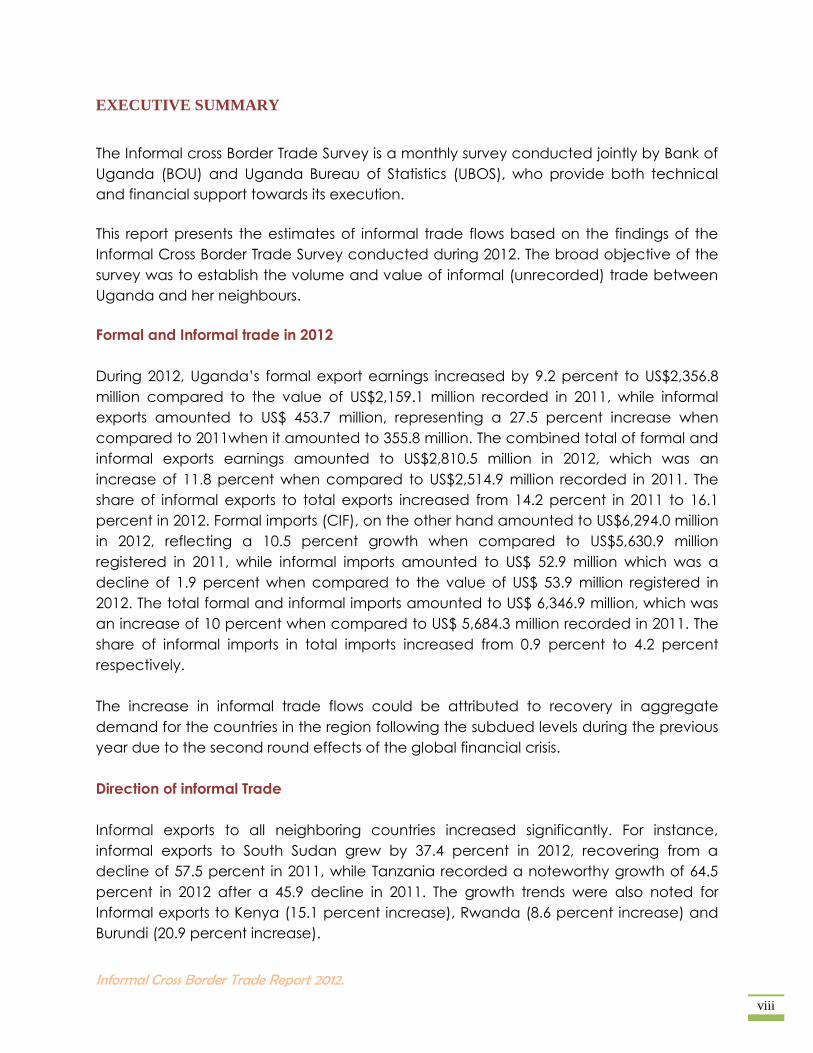
EXECUTIVE SUMMARY
The Informal cross Border Trade Survey is a monthly survey conducted jointly by Bank of
Uganda (BOU) and Uganda Bureau of Statistics (UBOS), who provide both technical
and financial support towards its execution.
This report presents the estimates of informal trade flows based on the findings of the
Informal Cross Border Trade Survey conducted during 2012. The broad objective of the
survey was to establish the volume and value of informal (unrecorded) trade between
Uganda and her neighbours.
Formal and Informal trade in 2012
During 2012, Uganda’s formal export earnings increased by 9.2 percent to US$2,356.8
million compared to the value of US$2,159.1 million recorded in 2011, while informal
exports amounted to US$ 453.7 million, representing a 27.5 percent increase when
compared to 2011when it amounted to 355.8 million. The combined total of formal and
informal exports earnings amounted to US$2,810.5 million in 2012, which was an
increase of 11.8 percent when compared to US$2,514.9 million recorded in 2011. The
share of informal exports to total exports increased from 14.2 percent in 2011 to 16.1
percent in 2012. Formal imports (CIF), on the other hand amounted to US$6,294.0 million
in 2012, reflecting a 10.5 percent growth when compared to US$5,630.9 million
registered in 2011, while informal imports amounted to US$ 52.9 million which was a
decline of 1.9 percent when compared to the value of US$ 53.9 million registered in
2012. The total formal and informal imports amounted to US$ 6,346.9 million, which was
an increase of 10 percent when compared to US$ 5,684.3 million recorded in 2011. The
share of informal imports in total imports increased from 0.9 percent to 4.2 percent
respectively.
The increase in informal trade flows could be attributed to recovery in aggregate
demand for the countries in the region following the subdued levels during the previous
year due to the second round effects of the global financial crisis.
Direction of informal Trade
Informal exports to all neighboring countries increased significantly. For instance,
informal exports to South Sudan grew by 37.4 percent in 2012, recovering from a
decline of 57.5 percent in 2011, while Tanzania recorded a noteworthy growth of 64.5
percent in 2012 after a 45.9 decline in 2011. The growth trends were also noted for
Informal exports to Kenya (15.1 percent increase), Rwanda (8.6 percent increase) and
Burundi (20.9 percent increase).
Informal Cross Border Trade Report 2012.
ix
Kenya retained its status as the leading source of Uganda’s informal imports during
2012. Informal imports from Kenya amounted to US$24.5 million accounting for a 46.3
percent share of the total informal imports in 2012, compared to US$27.0 million (50.2
percent of the total) recorded in 2011. DR Congo ranked second, with a supply of
informal imports worth US$20.3 million (38.3 percent share) compared to US$21.5 million
(39.8 percent share) registered in 2011.
Main commodities exported and imported during 2012
Informal exports and Imports have been grouped into 3 categorizes; Industrial,
Agricultural and Other products to take into account the level of processing of the
goods transacted.
During 2012, Industrial products continued to dominate both informal exports and
imports; industrial exports amounted to US$ 266.9 million which was a 15.9 percent
increase compared to US$ 230.2 reported in 2011. Most of the industrial exports were
destined for DR Congo which accounted for a share of 41.7 percent of the total during
2012 compared to 40.2 percent in 2011. Agricultural products ranked second fetching
US$184.9 million in 2012 representing 40.7 percent of the total, compared to US$124.1
million recorded in 2011. South Sudan was the main destination for agricultural
commodities accounting for about 30 percent of the total. The Other product category
comprising of mainly natural resources amounted to about US$2 million for the period
under review, registering a 27.9 percent increase in 2012.
The informal imports bill for industrial products increased from US$ 27.8 million in 2011 to
US$ 28.1 million in 2012, accounting for more than half of the total informal imports.
Agricultural commodities amounted to US$24.9 million in 2012 compared to US$27.8
million recorded in 2011, indicating a slight decline of 4.5 percent in this product
category. Kenya continued to be the main source of industrial commodities
accounting for US$ 18.6 million, while DR Congo was the main source for informal
imported agricultural commodities accounting for US$ 14.5 million.
Trade Flow by Border Station
The Informal Cross Border Trade survey covered 20 border points and 4 bus terminals
representing coverage of over 90 percent of the informal trade transactions between
Uganda and her neighbours.
In 2012, Mpondwe, Bibia, Busia, Katuna, Mutukula and Oraba border stations
accounted for largest share of the total informal exports (79.8 percent). Mpondwe
alone accounted for the largest share estimated at US$ 102.4 million (22.6 percent
share) of informal exports followed by Bibia border post with US$86.5 million (or 19.1
percent share) and Busia with US$68.5 million (or 15.1 percent share). Overall, most of
the border stations reported an increment in their export earnings with Paidha more
than doubling during the year 2012.
Informal Cross Border Trade Report 2012.
x
Busia remained the leading entry point for imports in 2012 accounting for US$15.9
million, a 30.1 percent share of the informal imports followed by Mpondwe, which
accounted for US$9.2 million (17.3 percent share).
Policy implications and recommendations
Informal export trade has continued to raise and contribute significantly to Uganda’s
merchandise trade with her neighbours and remains an important foreign exchange
earner for the economy and employer for traders and transporters. Its contribution to
employment creation extends beyond trade at the borders to inland trade, agro
processing and agriculture. Consequently this association should precipitate avenues
for widening the revenue tax base for the nation. Enhancing the competitiveness of
exports (both formal and informal) by removing infrastructural bottlenecks to lower
costs of production and distribution, and emphasizing value addition to improve quality
should be given priority. Continued investment by government in the agricultural sector
to increase output through provision of relevant and timely advisory services and
ensuring agricultural inputs and equipment, meet quality standards could further boost
productivity. Further, efforts towards promotion of private sector investment in post
harvest facilities such as silos and modern preservation methods should be undertaken
to limit price fluctuations and to address food security issues.
Informal Cross Border Trade Report 2012.
1
Chapter 1 : INTRODUCTION
1.0 Introduction
This introductory chapter provides a brief background to the Informal cross border
trade Survey, discusses the global and regional trade situation for the year under
review, and outlines the survey objective.
1.1 Background
Uganda has exploited the trade opportunity presented by the market that lies within
the Great Lakes region. The 2012 survey was the marked eighth survey since the
inception of the ICBT surveys, with the first one having been conducted in 2005. The
surveys aim at enhancing compilation of external merchandize trade statistics for the
balance of payment and national accounts.
The ICBT surveys are a joint venture between Bank of Uganda (BOU) and Uganda
Bureau of Statistics (UBOS) who provide both technical and financial support towards
their implementation. The surveys have also benefited from support at various border
posts from URA, the Immigration Department, the Uganda Police and other security
organs, the Business Community and the Local Leaders has greatly contributed to the
successful conduct of the surveys.
1.2 The global trade Situation
World trade growth fell to 2.0 percent in 2012 — down from 5.2 percent in 2011 — and is
expected to remain sluggish in 2013 at around 3.3 percent as the economic slowdown
in Europe continues to suppress global import demand. Trade developments during
2012 indicated that the structural flaws revealed by the economic crisis had not been
fully addressed, despite the important progress being made in some areas. The abrupt
deceleration of trade in 2012 was attributed to slow growth in developed economies
and recurring bouts of uncertainty over the future of the euro. Overall, output and high
unemployment in developed countries reduced imports and fed through to a lower
pace of export growth in both developed and developing economies1.
The slower growth in world trade compared was mainly due to falling prices for traded
goods. Some of the biggest price declines were recorded for commodities such as
coffee (–22 percent), cotton (–42 percent), iron ore (–23 percent) and coal (–21
percent), according to IMF commodity price statistics2.
1 WTO Press Release 688, 2013
2 WTO Press Release 688, 2013
Informal Cross Border Trade Report 2012.
2
1.3 EAC trade developments
Within the EAC, total trade increased by 10.8 percent from US$ 46.4 billion in 2011 to US$
51.4 billion3. Total EAC exports increased by 15.4 percent to US$ 14.9 billion, while total
EAC imports increased by 9.1 percent to US$ 36.6 billion. These developments led to a
slight worsening of the EAC trade deficit, from US$ 20.7 billion in 2011 to US$ 21.8 billion.
Nonetheless, it is notable that the volume of intra-EAC trade grew by 22.0 percent to
US$ 5.5 billion in 2012 compared to US$ 4.5 billion recorded in 2011. The development
was driven by the increase of both imports and exports that went up by 20.7 percent
and 23.0 percent, respectively. Tanzania and Rwanda recorded increases in their
shares to total intra EAC trade while that of Kenya, Uganda and Burundi declined.
Despite the decline of the share, Kenya continued to dominate intra EAC trade,
accounting for about 36 percent of total intra-EAC trade.
Figure 1: Growth in the volume of world merchandise trade and GDP, 2005-14 Annual percent change
2013p and 2014 figures are projections
Source: WTO Secretariat
1.4 Survey Objectives
The broad objective of the 2012 ICBT Survey was to establish the size of
unrecorded/informal trade flows between Uganda and her neighbours. Within this
broad objective, the specific objectives included;
Informal Cross Border Trade Report 2012.
3
Determining the nature and composition of commodities transacted under
informal trade
Establishing the direction of informal cross border trade (i.e. Country of
destination/origin)
Estimating volumes and values of informal trade flows;
Generating monthly, quarterly and annual ICBT estimates for balance of
payments and national accounts statistics compilation.
1.5 Structure of the report
The rest of the report is arranged as follows: Chapter 2 presents the methodology while
chapter 3 highlights the main findings. The conclusion and potential policy implications
are provided in chapter 4.
Informal Cross Border Trade Report 2012.
4
Chapter 2 : METHODOLOGY
2.0 Introduction
The selection criteria of the monitored border posts, survey organization, data collection
techniques and instruments, up-rating of survey results and limitations of the surveys is
discussed in this chapter.
2.1 Selection of Monitored Border Posts
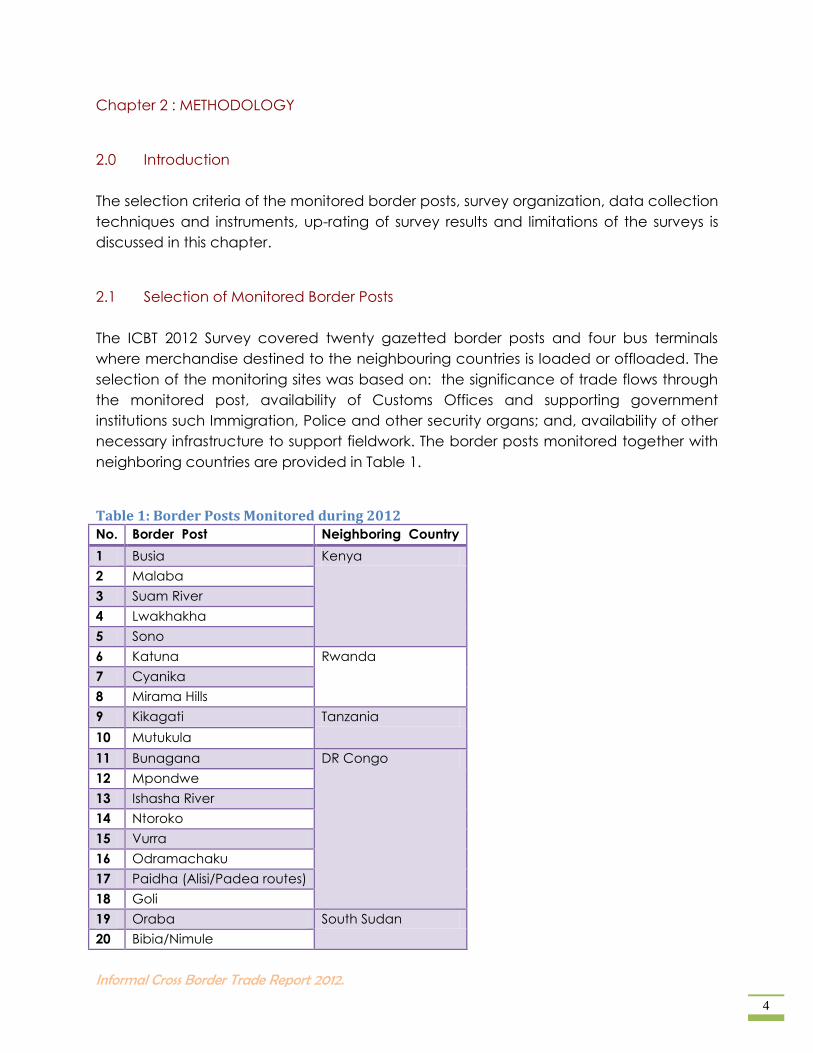
The ICBT 2012 Survey covered twenty gazetted border posts and four bus terminals
where merchandise destined to the neighbouring countries is loaded or offloaded. The
selection of the monitoring sites was based on: the significance of trade flows through
the monitored post, availability of Customs Offices and supporting government
institutions such Immigration, Police and other security organs; and, availability of other
necessary infrastructure to support fieldwork. The border posts monitored together with
neighboring countries are provided in Table 1.
Table 1: Border Posts Monitored during 2012 No. Border Post Neighboring Country
1 Busia Kenya
2 Malaba
3 Suam River
4 Lwakhakha
5 Sono
6 Katuna Rwanda
7 Cyanika
8 Mirama Hills
9 Kikagati Tanzania
10 Mutukula
11 Bunagana DR Congo
12 Mpondwe
13 Ishasha River
14 Ntoroko
15 Vurra
16 Odramachaku
17 Paidha (Alisi/Padea routes)
18 Goli
19 Oraba South Sudan
20 Bibia/Nimule
Informal Cross Border Trade Report 2012.
5
In addition to the border posts, four bus terminals were monitored comprised of
terminals for the following routes; Kampala/Kigali, Kampala/Juba, Kampala/Bujumbura
and Kampala/Bukoba/Dares-salaam. Transactions through the selected bus terminals
were included in the estimates for the respective borders of exit or entry to account for
trade items that are below the customs recording threshold.
2.2 Trade type and Valuation Issues
The collection of ICBT data follows the General Trade System (GTS) of compiling
International Merchandise Trade Statistics. The GTS requires that, all goods leaving or
entering the country are recorded as they cross the customs frontiers. During data
collection, the following are recorded:
i) All merchandise leaving/entering the country carried on foot, bicycles, push
carts, motorcycles, vehicle, wheel chairs, donkeys and boats whether in large or
small quantities that is not recorded by customs authorities;
ii) Undeclared or under declared merchandise by traders on formal customs
declaration documents.
The following items are excluded from informal trade recording:
i) Goods properly (100 percent) declared and verified by customs officials on
declaration documents
ii) Transit goods leaving or entering the country at any border post being monitored
iii) Goods smuggled into or out of the country illegally (including night time cross
border transactions)
The valuation of informal exports is based on free on board (FOB) basis of valuation,
while imports are valued at cost insurance and freight (CIF). All prices used are
collected from nearby trading centre’s/markets at the border posts where informal
trade is monitored. However, for large consignments of goods, whole sale prices are
used, while for small quantities retail prices are used.
2.3 Selection of weeks for monitoring
Ideally, ICBT data should be collected on a daily basis for the entire month. However,
due to financial and logistical resource constraints, it is not possible to monitor ICBT
activities on a daily basis. Subsequently, monitoring was done for two weeks in each
month and estimates were made for the remaining weeks. The weeks chosen for
monitoring are supposed to be randomly selected to avoid bias. However, in practice a
combination of both random and purposive selection was used to avoid costs
escalation. Consequently, two consecutive weeks were selected from each month for
continuous monitoring and trade in the remaining two weeks plus 2 or 3 days
depending on the month was estimated.
Informal Cross Border Trade Report 2012.
6
2.4 Survey Organization
The UBOS and BOU staff conduct monthly coordination and supervision of field activities
for quality control purposes and to ensure compliance to set field practices. At every
border station, a minimum of two enumerators were engaged to record data during
the monitoring weeks. The team of enumerators was composed of trained individuals
with adequate knowledge of the local languages at the respective border stations. The
training conducted for all enumerators and supervisors focused on generating the
competencies in metric system, and tactics of obtaining information from traders.
Enumerators were also trained on how to interact with the Immigration and Revenue
Officials to gather additional relevant information.
2.5 Data Collection Techniques
The recording of informal trade was based on direct observation techniques. However,
where necessary, verification was done through inquiries made to traders, clearing
agents, revenue officers and security personnel and through weighing to ascertain
quantities for some selected items. The methods used are the most cost-effective way
of gathering data at border posts where conditions are far from ideal. The direct
observation technique entails strategic positioning of enumerators at border posts to
enable them to record all merchandise entering or leaving the country. All traded
goods that are not recorded by Customs Authorities are captured at the point of
crossing the customs frontier in counter books or specially designed vehicle forms
specifying the item, quantity and mode of transport.
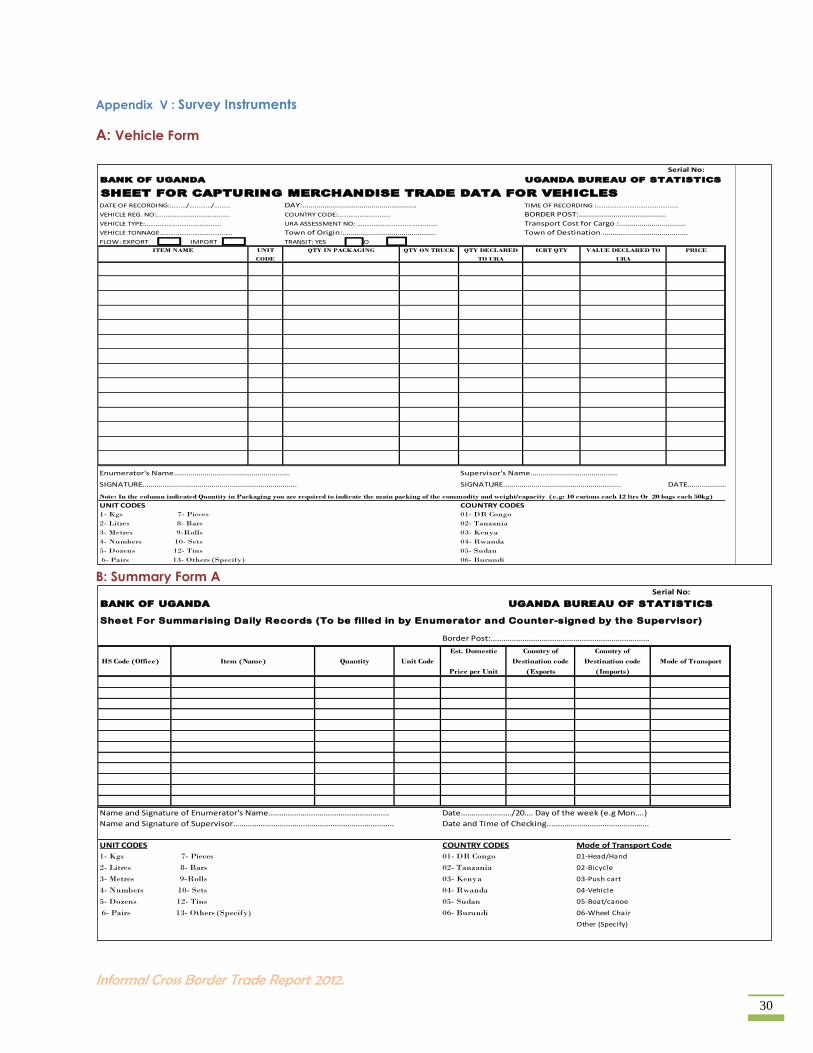
2.6 Data Collection Instruments
The instruments used by enumerators during data collection included; counter books,
list of units of measure and conversion factors, Summary Forms “A” used to summarize
daily commodity data and a Vehicle form used for capturing trade data of
commodities ferried on vehicles especially at Oraba, Bibia and Mpondwe (see
Appendix VII). Vehicles are the dominant carriers of traded goods at these border posts
and pose a major recording challenge that necessitated the introduction of a specific
form tailored to capture more details. Other materials used include calculators, rulers,
pens and weighing scales.
2.7 Data Processing and Analysis
The ICBT 2012 data processing was jointly done by UBOS and BOU after receipt of field
returns. The information was captured on a monthly basis at UBOS and edited by
officials from both institutions for accuracy. The data was also coded to facilitate its
transformation to the Harmonized Commodity Coding and Description System (HS) and
Standard International Trade Classification (SITC) Nomenclatures. The ICBT data
Informal Cross Border Trade Report 2012.
7
tabulation and analysis used, followed a predetermined tabulation scheme approved
by the technical working team in line with intended survey objectives.
2.8 Up-rating of Survey Results
up-rating of survey results is necessary in order to generate monthly estimates from data
collected during the two weeks of monitoring ICBT. The up-rating methodology was
based on the key assumption that the different days of the two weeks reflect trade
flows for similar days not covered in the same month. In addition, seasonality effects
were taken into consideration for agricultural products. (Refer to Appendix I for details
on the up-rating model).
2.9 Estimation of missing data for un-monitored months
During 2012, the month of April was not monitored and subsequently April figures were
estimated using the March and May estimates. Bunagana border post figures for
November and December were also estimated due to suspension of enumeration
activities following deterioration in the security situation across the border. in both
cases, the missing data was estimated using a linear interpolation model explained in
Appendix I.
2.10 Data Limitations
(i) Some of the border posts left out may have recorded growth during the year
leading to some under estimation;
(ii) Trade occurring at night and beyond the stipulated time of monitoring (7.00a.m
to 6.p.m) is not covered;
(iii) Difficulty in accurately estimating the quantities of some traded items especially
where assorted goods are carried in one package poses some accuracy risks.
Other estimation problems arose as a result of items being transported in
packages that are not transparent, and those in bulk like sugar canes, fruits etc.
Informal Cross Border Trade Report 2012.
8
Chapter 3 : SURVEY FINDINGS
3.0 Introduction
This chapter presents the survey findings during 2012. The indicators derived from the
survey data include levels of informal imports and exports, trade balance, direction of
trade flows, and the comparative values of formal and informal trade. Further, trade by
border station, commodity category, volume and value of major imported and
exported commodities etc is examined.
3.1 Comparison of Informal and Formal Trade flows
3.1.1 Formal and Informal Exports
During 2012, the combined exports earnings (formal and informal) amounted to US $
2,811.2 million, of which, formal exports were worth US $ 2,357.5 million, while informal
exports accounted for US $ 453.7 million. The overall export earnings rose by 11.8
percent in 2012 after an increase of 17.1 percent recorded in 2011. Both formal and
informal export earnings increased significantly in 2012. Informal exports receipts rose by
27.5 percent after having reduced by 32.7 percent in 2011(see table2 below). The
general increase in informal merchandise exports could be attributed to the
improvement of infrastructure in some border stations such as Nimule, Oraba, Cyanika
and Vurra.
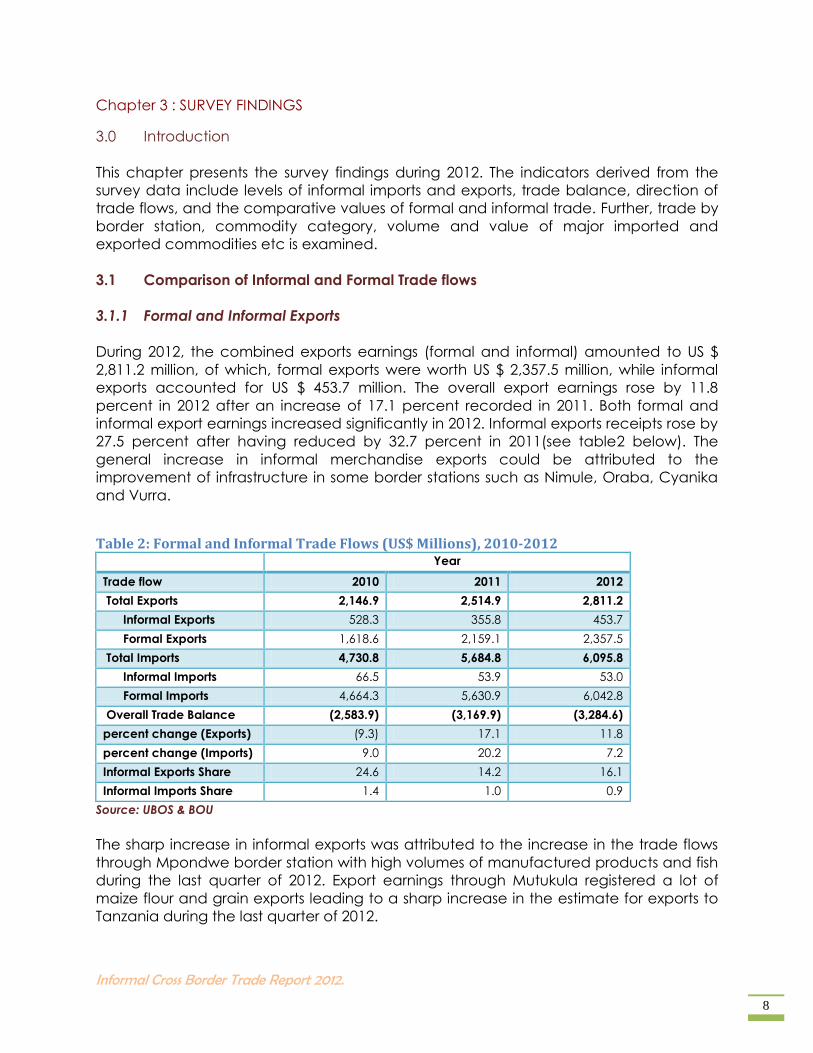
Table 2: Formal and Informal Trade Flows (US$ Millions), 2010-2012 Year
Trade flow 2010 2011 2012
Total Exports 2,146.9 2,514.9 2,811.2
Informal Exports 528.3 355.8 453.7
Formal Exports 1,618.6 2,159.1 2,357.5
Total Imports 4,730.8 5,684.8 6,095.8
Informal Imports 66.5 53.9 53.0
Formal Imports 4,664.3 5,630.9 6,042.8
Overall Trade Balance (2,583.9) (3,169.9) (3,284.6)
percent change (Exports) (9.3) 17.1 11.8
percent change (Imports) 9.0 20.2 7.2
Informal Exports Share 24.6 14.2 16.1
Informal Imports Share 1.4 1.0 0.9
Source: UBOS & BOU
The sharp increase in informal exports was attributed to the increase in the trade flows
through Mpondwe border station with high volumes of manufactured products and fish
during the last quarter of 2012. Export earnings through Mutukula registered a lot of
maize flour and grain exports leading to a sharp increase in the estimate for exports to
Tanzania during the last quarter of 2012.
Informal Cross Border Trade Report 2012.
9
3.1.2 Formal and Informal Imports
The total import bill during 2012 stood at US $ 6,095.8 million, of which, formal imports
accounted for US $ 6,042.8 million, while informal imports were estimated at US $ 53.0
million. The overall imports bill rose by 7.3 percent in 2012 compared to an increase of
20.7 percent in 2011. Although the formal imports expenditure increased during 2011
and 2012, informal imports continued to decline registering 1.7 percent reduction in the
same period (see Table 2).
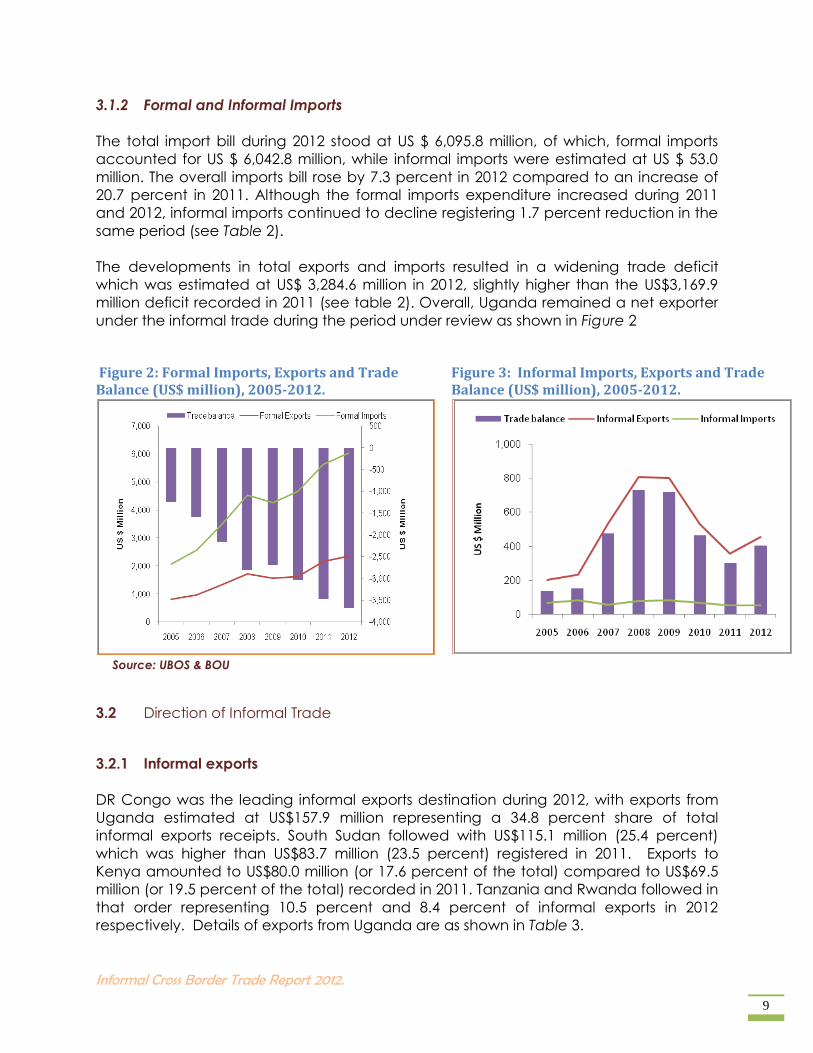
The developments in total exports and imports resulted in a widening trade deficit
which was estimated at US$ 3,284.6 million in 2012, slightly higher than the US$3,169.9
million deficit recorded in 2011 (see table 2). Overall, Uganda remained a net exporter
under the informal trade during the period under review as shown in Figure 2
3.2 Direction of Informal Trade
3.2.1 Informal exports
DR Congo was the leading informal exports destination during 2012, with exports from
Uganda estimated at US$157.9 million representing a 34.8 percent share of total
informal exports receipts. South Sudan followed with US$115.1 million (25.4 percent)
which was higher than US$83.7 million (23.5 percent) registered in 2011. Exports to
Kenya amounted to US$80.0 million (or 17.6 percent of the total) compared to US$69.5
million (or 19.5 percent of the total) recorded in 2011. Tanzania and Rwanda followed in
that order representing 10.5 percent and 8.4 percent of informal exports in 2012
respectively. Details of exports from Uganda are as shown in Table 3.
Figure 2: Formal Imports, Exports and Trade Balance (US$ million), 2005-2012.
Source: UBOS & BOU
Figure 3: Informal Imports, Exports and Trade Balance (US$ million), 2005-2012.
Informal Cross Border Trade Report 2012.
10
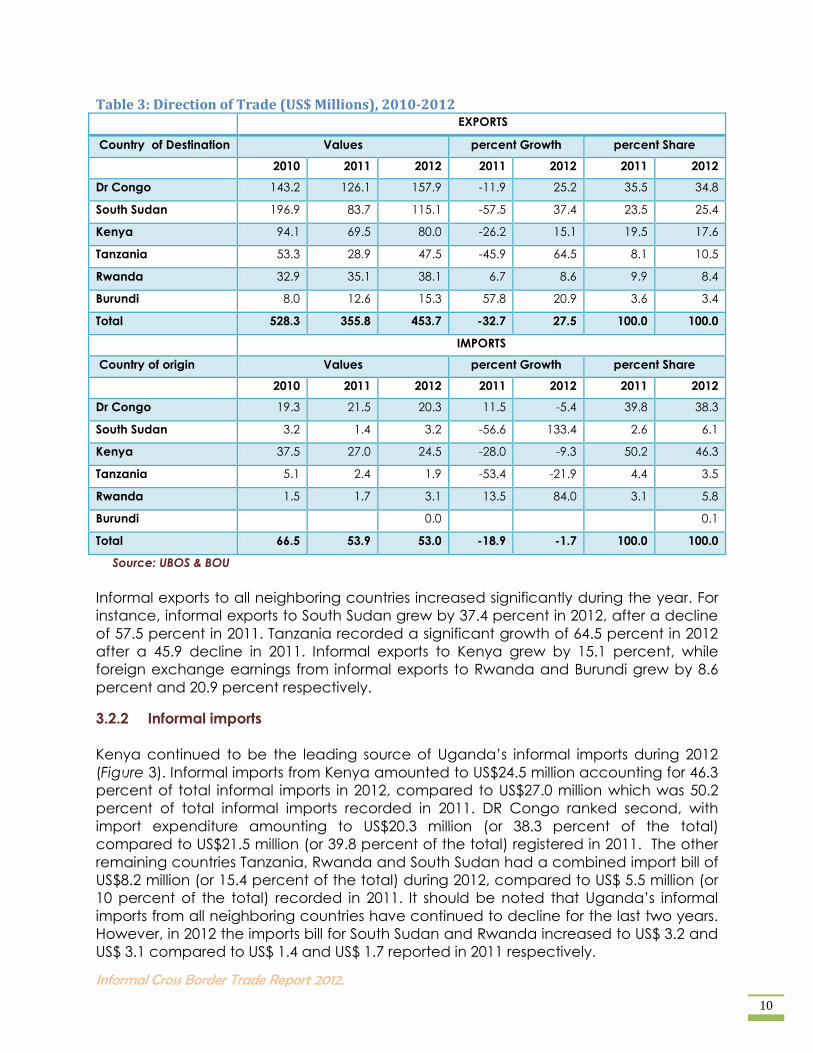
Table 3: Direction of Trade (US$ Millions), 2010-2012 EXPORTS
Country of Destination Values percent Growth percent Share
2010 2011 2012 2011 2012 2011 2012
Dr Congo 143.2 126.1 157.9 -11.9 25.2 35.5 34.8
South Sudan 196.9 83.7 115.1 -57.5 37.4 23.5 25.4
Kenya 94.1 69.5 80.0 -26.2 15.1 19.5 17.6
Tanzania 53.3 28.9 47.5 -45.9 64.5 8.1 10.5
Rwanda 32.9 35.1 38.1 6.7 8.6 9.9 8.4
Burundi 8.0 12.6 15.3 57.8 20.9 3.6 3.4
Total 528.3 355.8 453.7 -32.7 27.5 100.0 100.0
IMPORTS
Country of origin Values percent Growth percent Share
2010 2011 2012 2011 2012 2011 2012
Dr Congo 19.3 21.5 20.3 11.5 -5.4 39.8 38.3
South Sudan 3.2 1.4 3.2 -56.6 133.4 2.6 6.1
Kenya 37.5 27.0 24.5 -28.0 -9.3 50.2 46.3
Tanzania 5.1 2.4 1.9 -53.4 -21.9 4.4 3.5
Rwanda 1.5 1.7 3.1 13.5 84.0 3.1 5.8
Burundi 0.0 0.1
Total 66.5 53.9 53.0 -18.9 -1.7 100.0 100.0
Source: UBOS & BOU
Informal exports to all neighboring countries increased significantly during the year. For
instance, informal exports to South Sudan grew by 37.4 percent in 2012, after a decline
of 57.5 percent in 2011. Tanzania recorded a significant growth of 64.5 percent in 2012
after a 45.9 decline in 2011. Informal exports to Kenya grew by 15.1 percent, while
foreign exchange earnings from informal exports to Rwanda and Burundi grew by 8.6
percent and 20.9 percent respectively.
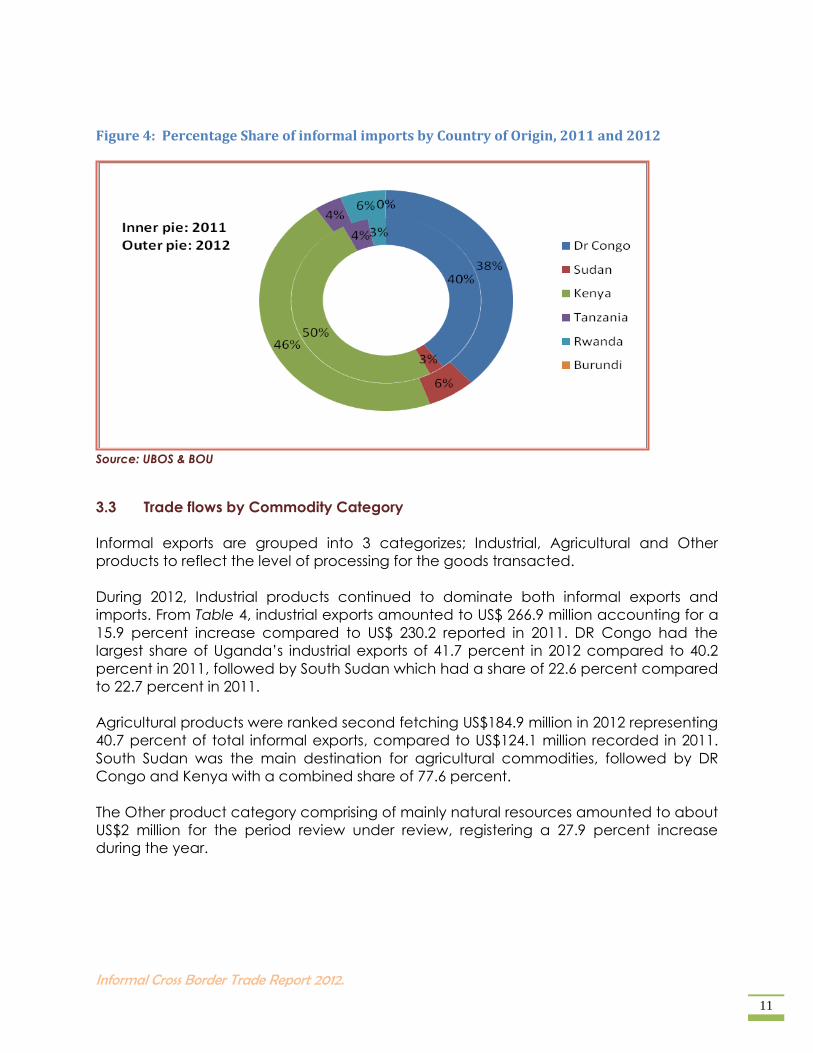
3.2.2 Informal imports
Kenya continued to be the leading source of Uganda’s informal imports during 2012
(Figure 3). Informal imports from Kenya amounted to US$24.5 million accounting for 46.3
percent of total informal imports in 2012, compared to US$27.0 million which was 50.2
percent of total informal imports recorded in 2011. DR Congo ranked second, with
import expenditure amounting to US$20.3 million (or 38.3 percent of the total)
compared to US$21.5 million (or 39.8 percent of the total) registered in 2011. The other
remaining countries Tanzania, Rwanda and South Sudan had a combined import bill of
US$8.2 million (or 15.4 percent of the total) during 2012, compared to US$ 5.5 million (or
10 percent of the total) recorded in 2011. It should be noted that Uganda’s informal
imports from all neighboring countries have continued to decline for the last two years.
However, in 2012 the imports bill for South Sudan and Rwanda increased to US$ 3.2 and
US$ 3.1 compared to US$ 1.4 and US$ 1.7 reported in 2011 respectively.
Informal Cross Border Trade Report 2012.
11
Figure 4: Percentage Share of informal imports by Country of Origin, 2011 and 2012
Source: UBOS & BOU
3.3 Trade flows by Commodity Category
Informal exports are grouped into 3 categorizes; Industrial, Agricultural and Other
products to reflect the level of processing for the goods transacted.
During 2012, Industrial products continued to dominate both informal exports and
imports. From Table 4, industrial exports amounted to US$ 266.9 million accounting for a
15.9 percent increase compared to US$ 230.2 reported in 2011. DR Congo had the
largest share of Uganda’s industrial exports of 41.7 percent in 2012 compared to 40.2
percent in 2011, followed by South Sudan which had a share of 22.6 percent compared
to 22.7 percent in 2011.
Agricultural products were ranked second fetching US$184.9 million in 2012 representing
40.7 percent of total informal exports, compared to US$124.1 million recorded in 2011.
South Sudan was the main destination for agricultural commodities, followed by DR
Congo and Kenya with a combined share of 77.6 percent.
The Other product category comprising of mainly natural resources amounted to about
US$2 million for the period review under review, registering a 27.9 percent increase
during the year.
Informal Cross Border Trade Report 2012.
12
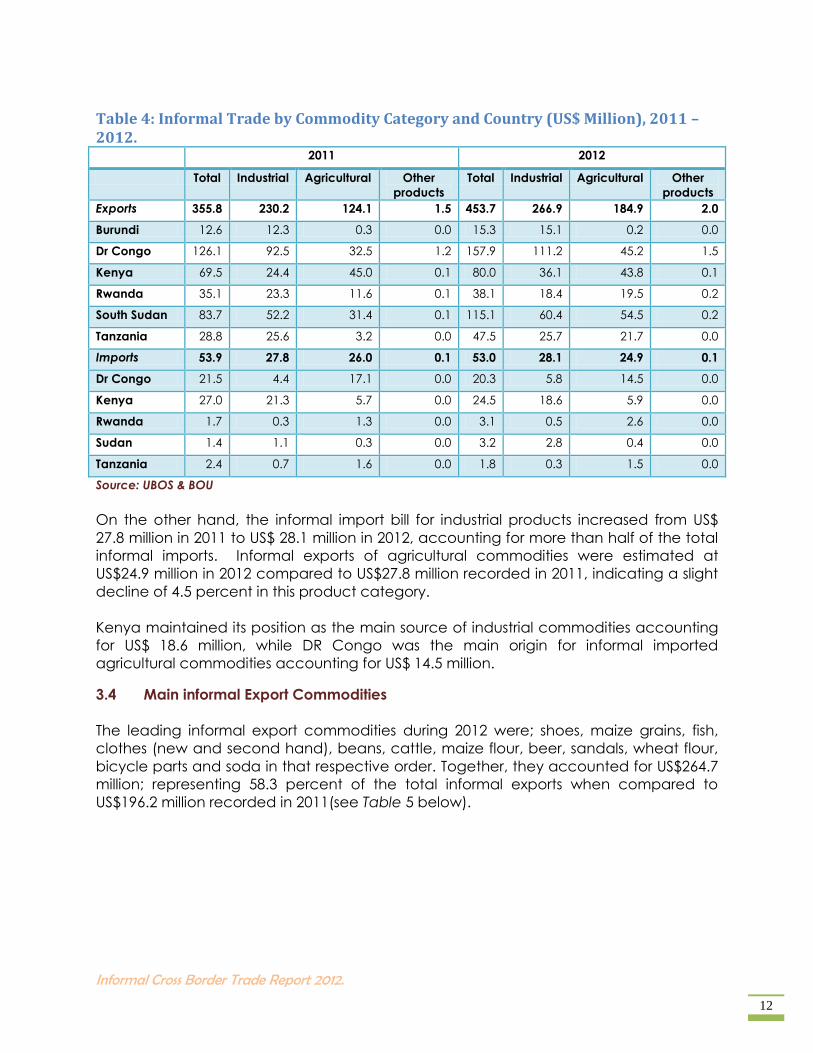
Table 4: Informal Trade by Commodity Category and Country (US$ Million), 2011 – 2012. 2011 2012
Total Industrial Agricultural Other
products
Total Industrial Agricultural Other
products
Exports 355.8 230.2 124.1 1.5 453.7 266.9 184.9 2.0
Burundi 12.6 12.3 0.3 0.0 15.3 15.1 0.2 0.0
Dr Congo 126.1 92.5 32.5 1.2 157.9 111.2 45.2 1.5
Kenya 69.5 24.4 45.0 0.1 80.0 36.1 43.8 0.1
Rwanda 35.1 23.3 11.6 0.1 38.1 18.4 19.5 0.2
South Sudan 83.7 52.2 31.4 0.1 115.1 60.4 54.5 0.2
Tanzania 28.8 25.6 3.2 0.0 47.5 25.7 21.7 0.0
Imports 53.9 27.8 26.0 0.1 53.0 28.1 24.9 0.1
Dr Congo 21.5 4.4 17.1 0.0 20.3 5.8 14.5 0.0
Kenya 27.0 21.3 5.7 0.0 24.5 18.6 5.9 0.0
Rwanda 1.7 0.3 1.3 0.0 3.1 0.5 2.6 0.0
Sudan 1.4 1.1 0.3 0.0 3.2 2.8 0.4 0.0
Tanzania 2.4 0.7 1.6 0.0 1.8 0.3 1.5 0.0
Source: UBOS & BOU
On the other hand, the informal import bill for industrial products increased from US$
27.8 million in 2011 to US$ 28.1 million in 2012, accounting for more than half of the total
informal imports. Informal exports of agricultural commodities were estimated at
US$24.9 million in 2012 compared to US$27.8 million recorded in 2011, indicating a slight
decline of 4.5 percent in this product category.
Kenya maintained its position as the main source of industrial commodities accounting
for US$ 18.6 million, while DR Congo was the main origin for informal imported
agricultural commodities accounting for US$ 14.5 million.
3.4 Main informal Export Commodities
The leading informal export commodities during 2012 were; shoes, maize grains, fish,
clothes (new and second hand), beans, cattle, maize flour, beer, sandals, wheat flour,
bicycle parts and soda in that respective order. Together, they accounted for US$264.7
million; representing 58.3 percent of the total informal exports when compared to
US$196.2 million recorded in 2011(see Table 5 below).
Informal Cross Border Trade Report 2012.
13
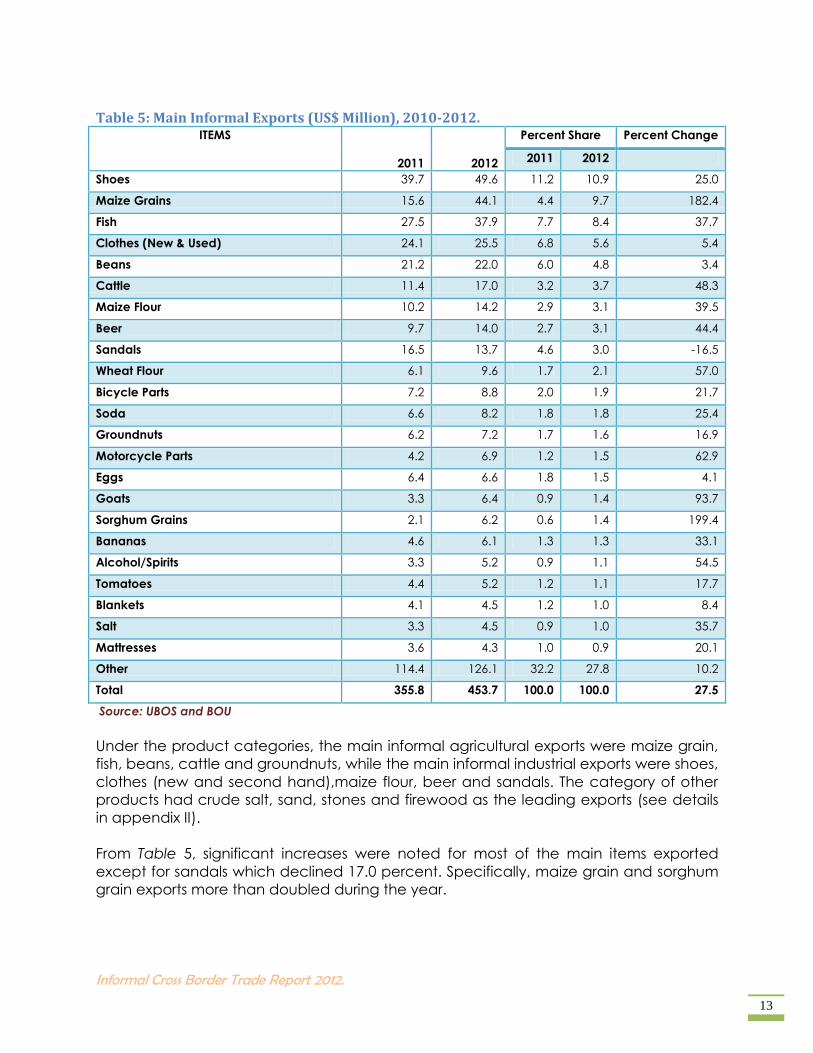
Table 5: Main Informal Exports (US$ Million), 2010-2012. ITEMS
2011 2012
Percent Share Percent Change
2011 2012
Shoes 39.7 49.6 11.2 10.9 25.0
Maize Grains 15.6 44.1 4.4 9.7 182.4
Fish 27.5 37.9 7.7 8.4 37.7
Clothes (New & Used) 24.1 25.5 6.8 5.6 5.4
Beans 21.2 22.0 6.0 4.8 3.4
Cattle 11.4 17.0 3.2 3.7 48.3
Maize Flour 10.2 14.2 2.9 3.1 39.5
Beer 9.7 14.0 2.7 3.1 44.4
Sandals 16.5 13.7 4.6 3.0 -16.5
Wheat Flour 6.1 9.6 1.7 2.1 57.0
Bicycle Parts 7.2 8.8 2.0 1.9 21.7
Soda 6.6 8.2 1.8 1.8 25.4
Groundnuts 6.2 7.2 1.7 1.6 16.9
Motorcycle Parts 4.2 6.9 1.2 1.5 62.9
Eggs 6.4 6.6 1.8 1.5 4.1
Goats 3.3 6.4 0.9 1.4 93.7
Sorghum Grains 2.1 6.2 0.6 1.4 199.4
Bananas 4.6 6.1 1.3 1.3 33.1
Alcohol/Spirits 3.3 5.2 0.9 1.1 54.5
Tomatoes 4.4 5.2 1.2 1.1 17.7
Blankets 4.1 4.5 1.2 1.0 8.4
Salt 3.3 4.5 0.9 1.0 35.7
Mattresses 3.6 4.3 1.0 0.9 20.1
Other 114.4 126.1 32.2 27.8 10.2
Total 355.8 453.7 100.0 100.0 27.5
Source: UBOS and BOU
Under the product categories, the main informal agricultural exports were maize grain,
fish, beans, cattle and groundnuts, while the main informal industrial exports were shoes,
clothes (new and second hand),maize flour, beer and sandals. The category of other
products had crude salt, sand, stones and firewood as the leading exports (see details
in appendix II).
From Table 5, significant increases were noted for most of the main items exported
except for sandals which declined 17.0 percent. Specifically, maize grain and sorghum
grain exports more than doubled during the year.
Informal Cross Border Trade Report 2012.
14
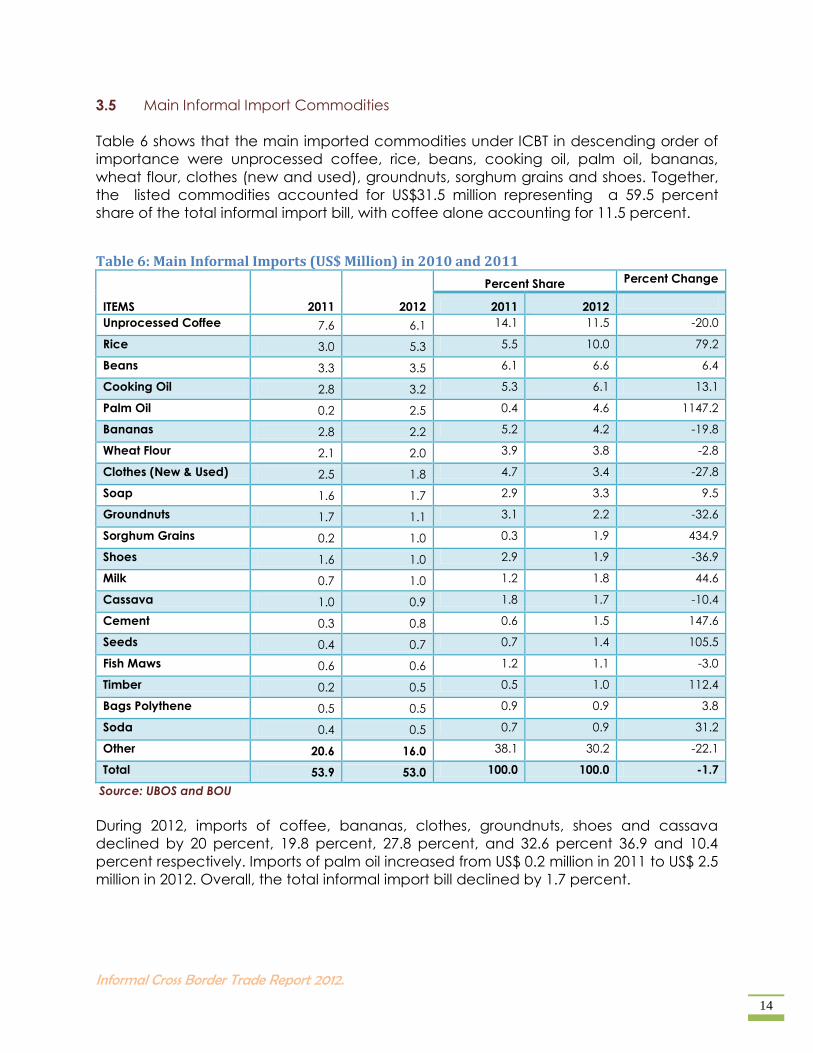
3.5 Main Informal Import Commodities
Table 6 shows that the main imported commodities under ICBT in descending order of
importance were unprocessed coffee, rice, beans, cooking oil, palm oil, bananas,
wheat flour, clothes (new and used), groundnuts, sorghum grains and shoes. Together,
the listed commodities accounted for US$31.5 million representing a 59.5 percent
share of the total informal import bill, with coffee alone accounting for 11.5 percent.
Table 6: Main Informal Imports (US$ Million) in 2010 and 2011
ITEMS 2011 2012
Percent Share Percent Change
2011 2012
Unprocessed Coffee 7.6 6.1 14.1 11.5 -20.0
Rice 3.0 5.3 5.5 10.0 79.2
Beans 3.3 3.5 6.1 6.6 6.4
Cooking Oil 2.8 3.2 5.3 6.1 13.1
Palm Oil 0.2 2.5 0.4 4.6 1147.2
Bananas 2.8 2.2 5.2 4.2 -19.8
Wheat Flour 2.1 2.0 3.9 3.8 -2.8
Clothes (New & Used) 2.5 1.8 4.7 3.4 -27.8
Soap 1.6 1.7 2.9 3.3 9.5
Groundnuts 1.7 1.1 3.1 2.2 -32.6
Sorghum Grains 0.2 1.0 0.3 1.9 434.9
Shoes 1.6 1.0 2.9 1.9 -36.9
Milk 0.7 1.0 1.2 1.8 44.6
Cassava 1.0 0.9 1.8 1.7 -10.4
Cement 0.3 0.8 0.6 1.5 147.6
Seeds 0.4 0.7 0.7 1.4 105.5
Fish Maws 0.6 0.6 1.2 1.1 -3.0
Timber 0.2 0.5 0.5 1.0 112.4
Bags Polythene 0.5 0.5 0.9 0.9 3.8
Soda 0.4 0.5 0.7 0.9 31.2
Other 20.6 16.0 38.1 30.2 -22.1
Total 53.9 53.0 100.0 100.0 -1.7
Source: UBOS and BOU
During 2012, imports of coffee, bananas, clothes, groundnuts, shoes and cassava
declined by 20 percent, 19.8 percent, 27.8 percent, and 32.6 percent 36.9 and 10.4
percent respectively. Imports of palm oil increased from US$ 0.2 million in 2011 to US$ 2.5
million in 2012. Overall, the total informal import bill declined by 1.7 percent.
Informal Cross Border Trade Report 2012.
15
3.6 Trade Flows by Border Station
3.6.1 Informal Exports
In 2012, the leading exit borders for informal exports were Mpondwe, Bibia, Busia,
Katuna, Mutukula and Oraba which had a combined share of 79.8 percent of the total.
Mpondwe alone accounted for US$ 102.4 million (22.6 percent) of informal exports
representing a 31.6 percent increase when compared to US$77.8 million recorded
during 2011(see Table 7). Bibia border post ranked second with informal exports worth
US$86.5 million (19.1 percent) compared to US$65.3 million recorded in 2011, indicating
a 32.5 percent increase. Busia followed with a total of informal exports amounting to
US$68.5 million accounting for 15.1 percent of the total. This was an increase of14.3
percent when compared to the value of US$59.9 million registered in 2011.
Exports through Malaba border grew by 47.8 percent accounting for US$ 7.5 million in
2012. Overall, most of the border stations reported an increment in their export earnings
with Paidha more than doubling during the year 2012.
On the other hand, Bunagana, Ishasha River, Goli, Lwakhakha, Sono and Mirama hills
customs recorded a decline during the year.
3.6.2 Informal Imports
Busia remained the leading entry point for imports in 2012 accounting for US$15.9
million, a share of 30.1 percent of the informal import bill. However, the estimate was a
decrease of 15.7 percent when compared to US$18.9 million registered in 2011.
Mpondwe ranked second accounting for US$9.2 million (or 17.3 percent), reflecting a
slight increase of 2 percent when compared to US$9.0 million recorded during 2011.
Malaba and Paidha followed with US$4.9 million (9.2 percent) and US$4.6 million (8.7
percent) respectively. Overall, most border stations recorded significant declines in
informal imports with the most notable ones being Ntoroko (49.3 percent), Goli (44.4
percent), Odramachaku (35.3 percent), Sono (36.7 percent) and Mutukula (33.2
percent) as shown in table 7 below.
Informal Cross Border Trade Report 2012.
16
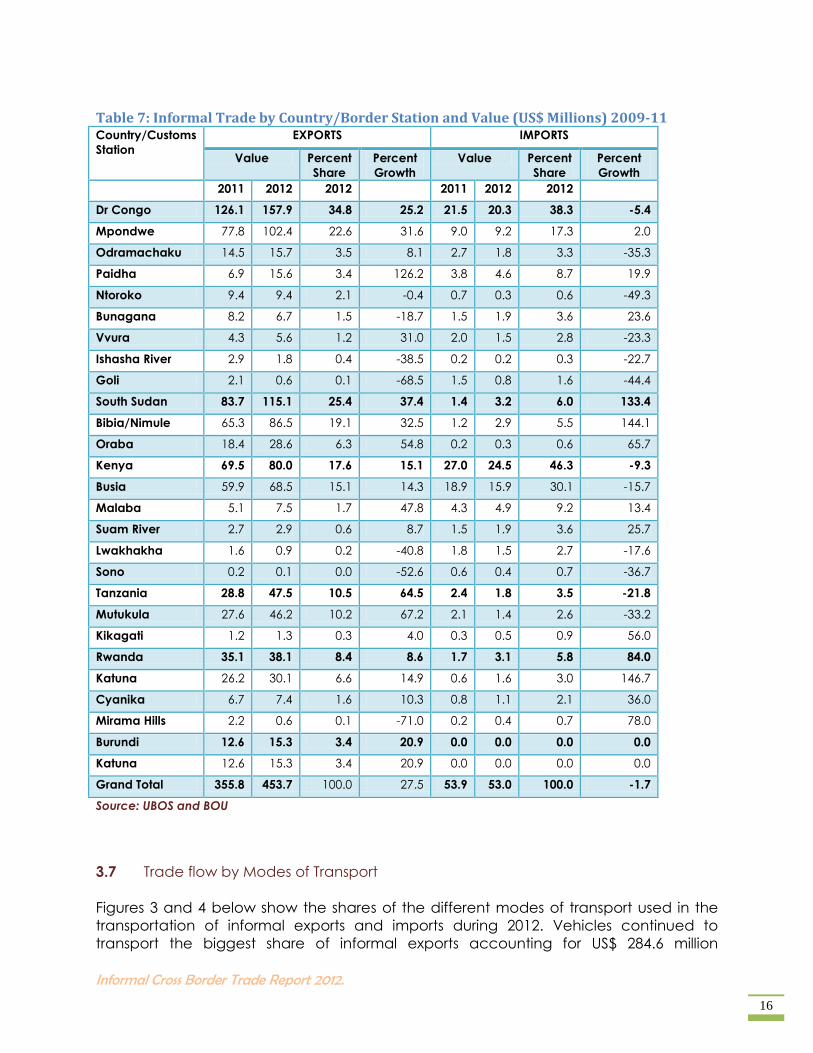
Table 7: Informal Trade by Country/Border Station and Value (US$ Millions) 2009-11 Country/Customs
Station
EXPORTS IMPORTS
Value Percent
Share
Percent
Growth
Value Percent
Share
Percent
Growth
2011 2012 2012 2011 2012 2012
Dr Congo 126.1 157.9 34.8 25.2 21.5 20.3 38.3 -5.4
Mpondwe 77.8 102.4 22.6 31.6 9.0 9.2 17.3 2.0
Odramachaku 14.5 15.7 3.5 8.1 2.7 1.8 3.3 -35.3
Paidha 6.9 15.6 3.4 126.2 3.8 4.6 8.7 19.9
Ntoroko 9.4 9.4 2.1 -0.4 0.7 0.3 0.6 -49.3
Bunagana 8.2 6.7 1.5 -18.7 1.5 1.9 3.6 23.6
Vvura 4.3 5.6 1.2 31.0 2.0 1.5 2.8 -23.3
Ishasha River 2.9 1.8 0.4 -38.5 0.2 0.2 0.3 -22.7
Goli 2.1 0.6 0.1 -68.5 1.5 0.8 1.6 -44.4
South Sudan 83.7 115.1 25.4 37.4 1.4 3.2 6.0 133.4
Bibia/Nimule 65.3 86.5 19.1 32.5 1.2 2.9 5.5 144.1
Oraba 18.4 28.6 6.3 54.8 0.2 0.3 0.6 65.7
Kenya 69.5 80.0 17.6 15.1 27.0 24.5 46.3 -9.3
Busia 59.9 68.5 15.1 14.3 18.9 15.9 30.1 -15.7
Malaba 5.1 7.5 1.7 47.8 4.3 4.9 9.2 13.4
Suam River 2.7 2.9 0.6 8.7 1.5 1.9 3.6 25.7
Lwakhakha 1.6 0.9 0.2 -40.8 1.8 1.5 2.7 -17.6
Sono 0.2 0.1 0.0 -52.6 0.6 0.4 0.7 -36.7
Tanzania 28.8 47.5 10.5 64.5 2.4 1.8 3.5 -21.8
Mutukula 27.6 46.2 10.2 67.2 2.1 1.4 2.6 -33.2
Kikagati 1.2 1.3 0.3 4.0 0.3 0.5 0.9 56.0
Rwanda 35.1 38.1 8.4 8.6 1.7 3.1 5.8 84.0
Katuna 26.2 30.1 6.6 14.9 0.6 1.6 3.0 146.7
Cyanika 6.7 7.4 1.6 10.3 0.8 1.1 2.1 36.0
Mirama Hills 2.2 0.6 0.1 -71.0 0.2 0.4 0.7 78.0
Burundi 12.6 15.3 3.4 20.9 0.0 0.0 0.0 0.0
Katuna 12.6 15.3 3.4 20.9 0.0 0.0 0.0 0.0
Grand Total 355.8 453.7 100.0 27.5 53.9 53.0 100.0 -1.7
Source: UBOS and BOU
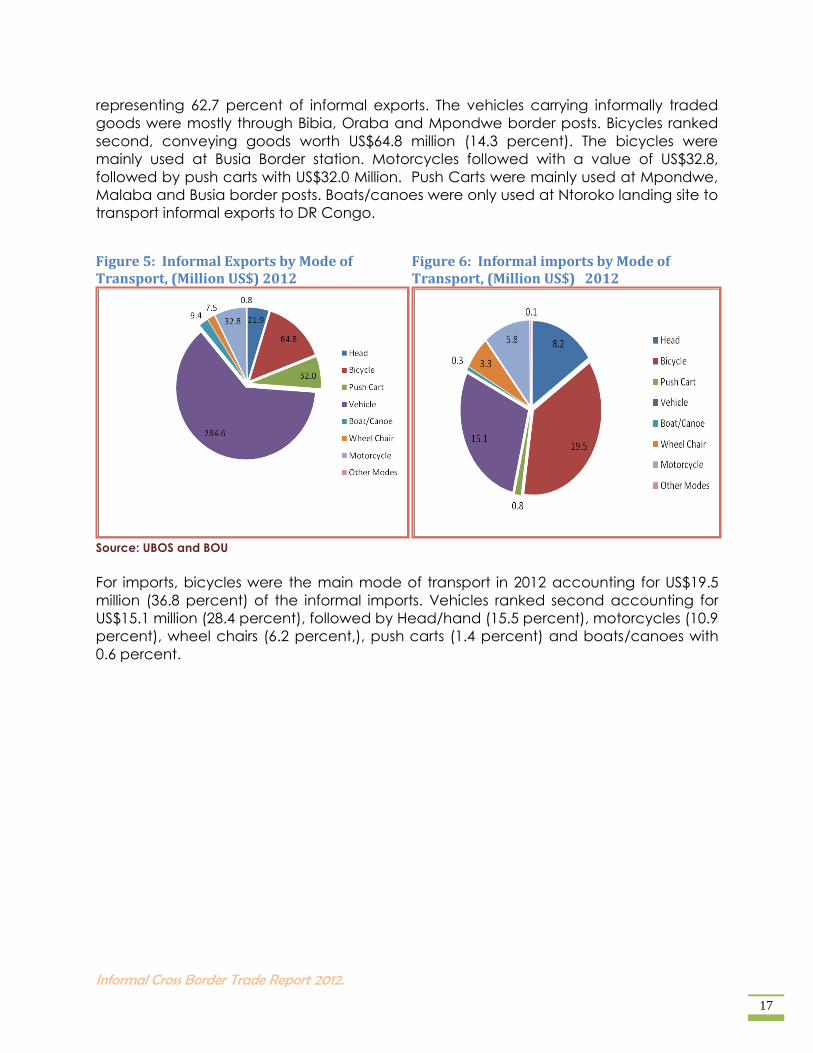
3.7 Trade flow by Modes of Transport
Figures 3 and 4 below show the shares of the different modes of transport used in the
transportation of informal exports and imports during 2012. Vehicles continued to
transport the biggest share of informal exports accounting for US$ 284.6 million
Informal Cross Border Trade Report 2012.
17
representing 62.7 percent of informal exports. The vehicles carrying informally traded
goods were mostly through Bibia, Oraba and Mpondwe border posts. Bicycles ranked
second, conveying goods worth US$64.8 million (14.3 percent). The bicycles were
mainly used at Busia Border station. Motorcycles followed with a value of US$32.8,
followed by push carts with US$32.0 Million. Push Carts were mainly used at Mpondwe,
Malaba and Busia border posts. Boats/canoes were only used at Ntoroko landing site to
transport informal exports to DR Congo.
Figure 5: Informal Exports by Mode of Transport, (Million US$) 2012
Figure 6: Informal imports by Mode of Transport, (Million US$) 2012
Source: UBOS and BOU
For imports, bicycles were the main mode of transport in 2012 accounting for US$19.5
million (36.8 percent) of the informal imports. Vehicles ranked second accounting for
US$15.1 million (28.4 percent), followed by Head/hand (15.5 percent), motorcycles (10.9
percent), wheel chairs (6.2 percent,), push carts (1.4 percent) and boats/canoes with
0.6 percent.
Informal Cross Border Trade Report 2012.
18
Chapter 4 : SUMMARY OF FINDINGS AND POTENTIAL POLICY IMPLICATIONS
4.0 Introduction
This chapter presents a summary of the survey findings, and highlights the implications
of the findings to trade and general macro-economy including some
recommendations.
4.1 Summary of findings
The main findings of the survey were as follows:
(i) Informal Cross Border Trade rebounded in 2012 following a sharp decline in 2011,
in line with overall trade flows. This was in part attributed to of improved
infrastructure at a number of border posts including Nimule, Oraba, Cyanika and
Vura.
(ii) Both formal and informal export earnings increased significantly in 2012, to US $
2,811.2 million, of which, formal exports were worth US $ 2,357.5 million. Informal
exports receipts rose by 27.5 percent to US$ 453.7 million from US$355.8 million
recorded in 2011.
(iii) Informal imports were estimated at US $ 53.0 million, representing a slight decline
of 1.7 percent, in contrast with the increase in the overall imports bill of 7.3
percent, to US$ US $ 6,095.8 million.
(iv) Industrial products continued to dominate both informal exports and imports,
followed by agricultural products. The leading informal export commodities
during 2012 were; shoes, maize grains, fish, clothes (new and second hand),
beans, cattle, maize flour, beer, sandals, wheat flour, bicycle parts and soda in
that respective order, while the main informal import items were; unprocessed
coffee, rice, beans, cooking oil, palm oil, bananas, wheat flour, clothes (new
and used), groundnuts, sorghum grains and shoes.
(v) Informal exports to all neighboring countries increased significantly during the
year, but DR Congo and South Sudan remained the main destinations jointly
accounting for 60.2 percent of the total informal exports in 2012. They individually
accounted for US$157.9 million and US$115.1 million, respectively. Similarly, Kenya
was the main source of informal imports and accounted for 46.3 percent of the
total informal imports in 2012.
(vi) The leading exit borders for informal exports were Mpondwe, Bibia, Busia,
Katuna, Mutukula and Oraba with a combined share of 79.8 percent of the total.
Busia, Mpondwe, Malaba and Paidha were the main entry borders posts for
informal imports.
Informal Cross Border Trade Report 2012.
19
(vii) Vehicles and bicycles were the major mode of transportation accounting for 60
percent and 14 percent of all informal exports respectively, while the bulk of
informal imports were transported on bicycles.
4.2 Implications of the results
There is no doubt that informal export trade constitutes a significant share of Uganda’s
merchandise trade with her neighbours and is therefore an important foreign exchange
earner for the economy. Such trade can further support the country’s balance of
payments particularly in times of crises in the traditional export destination countries
such as the Euro area. ICBT also makes a significant contribution to employment
creation both directly, for persons engaged in the business and indirectly, by boosting
sectors producing goods and services for export.
Although the high demand for agricultural produce from neighbouring countries such
as South Sudan and DRC may pose a threat to food security, it also offers benefits such
as demand for goods and employment which contribute to growth.
4.3 Policy Recommendations
To harness the benefits of ICBT, government could consider the following:
1. Improving competitiveness of exports by addressing remaining infrastructure
bottlenecks to lower costs of production and distribution, and promoting value
addition to improve quality.
2. Increase its investment in the agricultural sector in form of advisory services, and
by putting in place measures to ensure that agricultural inputs and equipment
meet set minimum quality standards.
3. Promotion of private sector investment in after-harvest facilities such as silos and
modern preservation methods. This will ensure harnessing of agricultural
commodities which constitute a big share of informal exports trade that poses a
food security threat to the country. Furthermore, inflationary pressure driven by
food prices would be eased with strategic investments in agricultural sector.
4. Undertake sensitization of informal traders through the URA Customs Department
about the customs procedures and the need for proper declaration of goods.

Informal Cross Border Trade Report 2012.
20
APPENDICES
Appendix I: The Up-rating Model
The up rating process is based on the following Assumptions;
(a) The supply for industrial and other products from either side of the borders is fairly
constant throughout the month while the supply of Agricultural products
fluctuate depending on season and on whether a given day is a market day or
not.
(b) Trade transactions through the other unmonitored crossing points in the
neighborhood of the monitored border stations are estimated individually based
on qualitative monthly reports that are compiled by supervisors.
(c) The average value of flows (imports/exports) for a day of the week, say Tuesday
is multiplied by the number of times Tuesday occurs in a month. The procedure is
repeated for all the days of the week and a sum of the values estimated to get
the monthly estimates. The maximum number a day say Tuesday occurs in a
month is 5 times while the least is 4 times.
Under assumption (a) above, for industrial and other products with constant trade flows,
consider a given month having n days with a daily average value of industrial and
other products of µi. The total value of inflows/outflows of industrial and other products
in a month are therefore mathematically presented as:
Ai= n µi ------------------------------------------------------------------------------------------------------------------
(1)
Equation (1) states that to get the monthly value estimates for the months in
question/consideration, the average daily values of industrial and other products from
survey figures are multiplied by number of days in a given month.
Therefore, the aggregate estimated value of inflows/outflows during the survey period is
the sum of the estimates of the twelve months monitored.
Mathematically,
)2(A12
1
T
i
i
n

Informal Cross Border Trade Report 2012.
21
Where i = month monitored and AT are total export/imports flows for industrial and other
product categories.
Equation (2) represents estimated total value of informal exports/ imports of the
industrial and other products traded during the 12 months of border monitoring.
These are informal trade flows (exports and imports) of goods in industrial products and
other products category that passed through the monitored borders during the full days
of twelve months of monitoring.
To up-rate informal trade flows of agricultural and other agricultural products during the
twelve months of the survey, assumption (b) is taken into consideration. The monthly
aggregate of agricultural trade flows can be expressed as the sum of product of the
number of particular days in a month and the average imports/exports for the day of
the week.
Let dj represent the number of particular days in a month, say four Mondays in March
2010 and ¥j the daily average value of agricultural exports/imports of a given day
computed from the observed trade figures. Then,
B = jd ¥j-------------------------------------------------------------------------------------------------------------------
(3)
Where B, stands for the monthly total value of trade for a given day, say Monday in a
month of agricultural exports/imports (i.e. total of all Mondays). Note that, the maximum
number of times a day of the week appears in a month is 5 times.
Therefore, the monthly informal agricultural exports/imports aggregates for all days in a
month are estimated as;
BT=
)4(¥ -----------------------------------------------------------------------------------------j
7
1
j
j
d
Where j represents day of the week, i.e. Monday, Tuesday…Sunday. Adding the
monthly totals for 12 months we get the aggregate informal (unrecorded) agricultural
flows as;
)5(¥ -------------------------------------------------------------------------------------j
7
1
12
1
j
jk
d
Where k, stands for the months monitored which were twelve in our case.
Informal Cross Border Trade Report 2012.
22
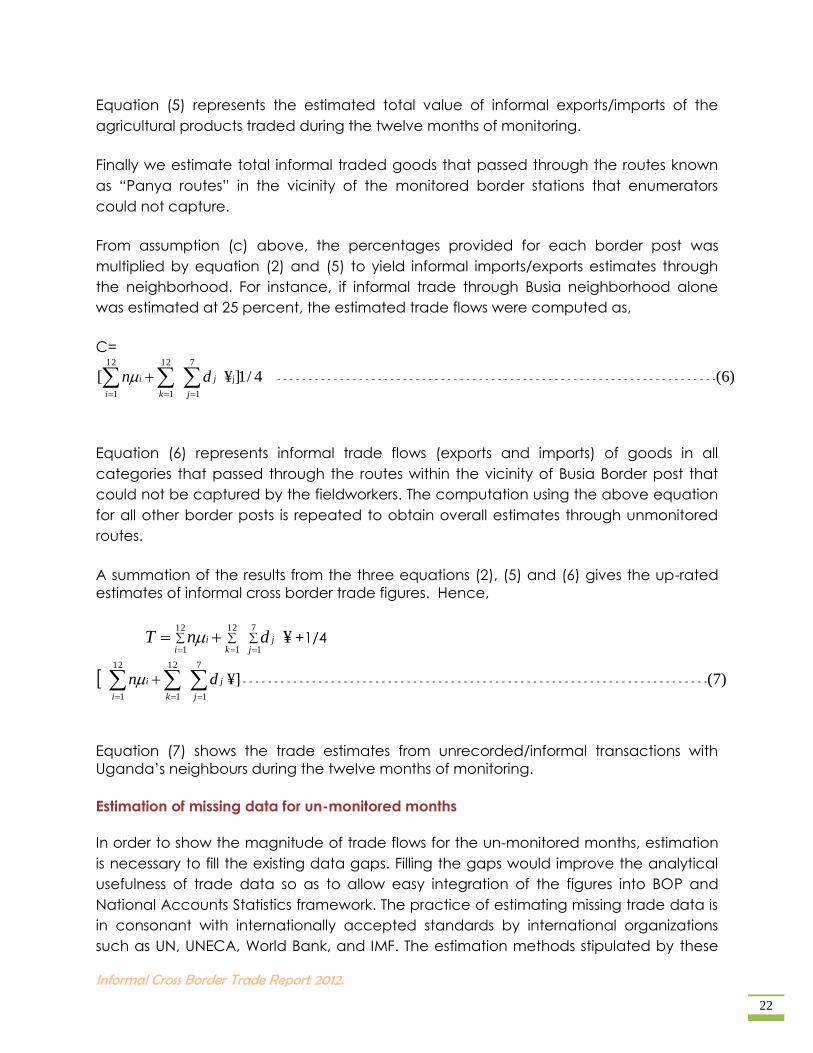
Equation (5) represents the estimated total value of informal exports/imports of the
agricultural products traded during the twelve months of monitoring.
Finally we estimate total informal traded goods that passed through the routes known
as “Panya routes” in the vicinity of the monitored border stations that enumerators
could not capture.
From assumption (c) above, the percentages provided for each border post was
multiplied by equation (2) and (5) to yield informal imports/exports estimates through
the neighborhood. For instance, if informal trade through Busia neighborhood alone
was estimated at 25 percent, the estimated trade flows were computed as,
C=
)6(4/1]¥ [ ----------------------------------------------------------------------j
7
1
12
1
12
1
j
jk
i
i
dn
Equation (6) represents informal trade flows (exports and imports) of goods in all
categories that passed through the routes within the vicinity of Busia Border post that
could not be captured by the fieldworkers. The computation using the above equation
for all other border posts is repeated to obtain overall estimates through unmonitored
routes.
A summation of the results from the three equations (2), (5) and (6) gives the up-rated
estimates of informal cross border trade figures. Hence,
¥ 7
1
12
1
12
1j
jki
idnT
+1/4
)7(¥] --------------------------------------------------------------------------
7
1
12
1
12
1
j
jk
i
i
dn
Equation (7) shows the trade estimates from unrecorded/informal transactions with
Uganda’s neighbours during the twelve months of monitoring.
Estimation of missing data for un-monitored months
In order to show the magnitude of trade flows for the un-monitored months, estimation
is necessary to fill the existing data gaps. Filling the gaps would improve the analytical
usefulness of trade data so as to allow easy integration of the figures into BOP and
National Accounts Statistics framework. The practice of estimating missing trade data is
in consonant with internationally accepted standards by international organizations
such as UN, UNECA, World Bank, and IMF. The estimation methods stipulated by these
Informal Cross Border Trade Report 2012.
23
organizations are documented in the book entitled, “Manual on Methods of Estimation
of Missing International Trade Data in Africa (UNECA 1995).”
It is necessary to estimate monthly flows that were missed out due to logistical
constraints using linear interpolation and extrapolation models.
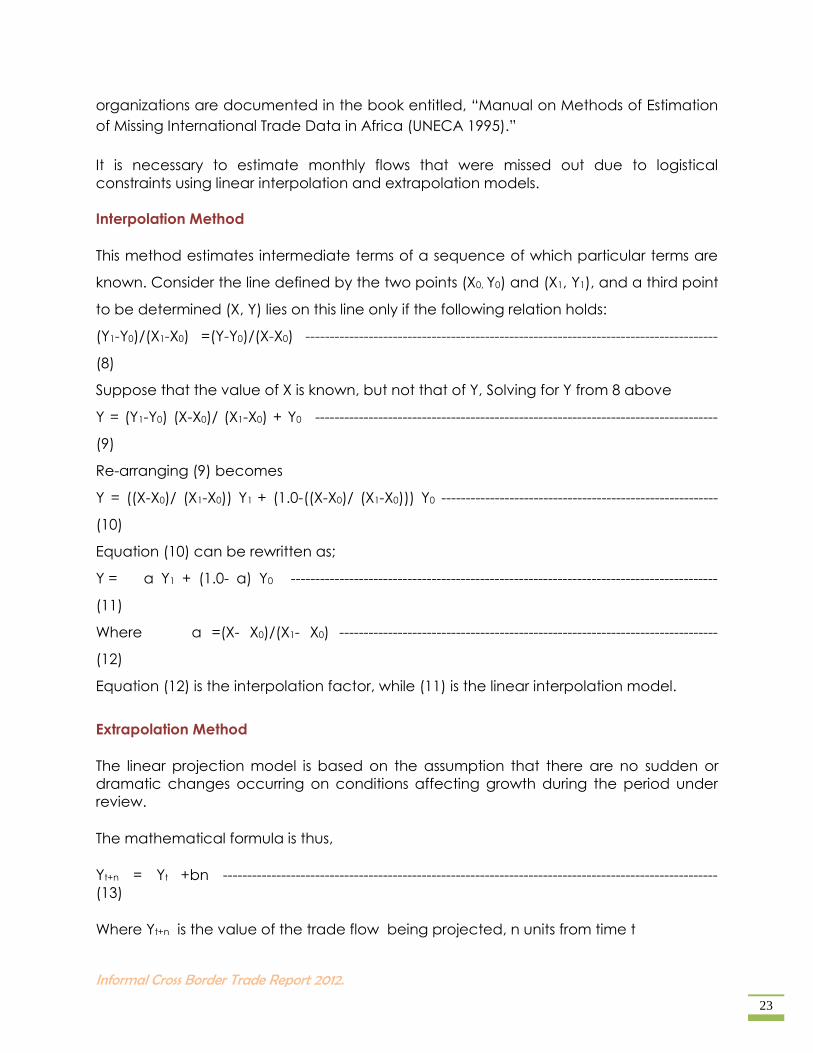
Interpolation Method
This method estimates intermediate terms of a sequence of which particular terms are
known. Consider the line defined by the two points (X0, Y0) and (X1, Y1), and a third point
to be determined (X, Y) lies on this line only if the following relation holds:
(Y1-Y0)/(X1-X0) =(Y-Y0)/(X-X0) -------------------------------------------------------------------------------------
(8)
Suppose that the value of X is known, but not that of Y, Solving for Y from 8 above
Y = (Y1-Y0) (X-X0)/ (X1-X0) + Y0 -----------------------------------------------------------------------------------
(9)
Re-arranging (9) becomes
Y = ((X-X0)/ (X1-X0)) Y1 + (1.0-((X-X0)/ (X1-X0))) Y0 ---------------------------------------------------------
(10)
Equation (10) can be rewritten as;
Y = α Y1 + (1.0- α) Y0 ----------------------------------------------------------------------------------------
(11)
Where α =(X- X0)/(X1- X0) ------------------------------------------------------------------------------
(12)
Equation (12) is the interpolation factor, while (11) is the linear interpolation model.
Extrapolation Method
The linear projection model is based on the assumption that there are no sudden or
dramatic changes occurring on conditions affecting growth during the period under
review.
The mathematical formula is thus,
Yt+n = Yt +bn ------------------------------------------------------------------------------------------------------
(13)
Where Yt+n is the value of the trade flow being projected, n units from time t
Informal Cross Border Trade Report 2012.
24
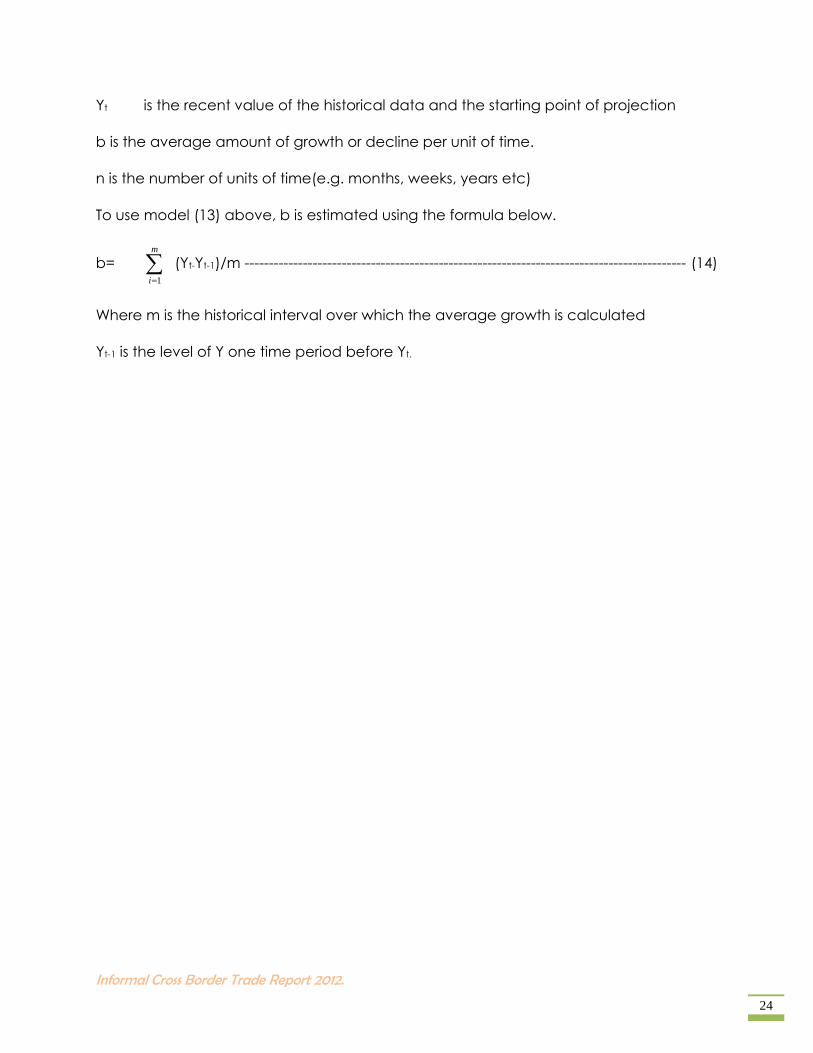
Yt is the recent value of the historical data and the starting point of projection
b is the average amount of growth or decline per unit of time.
n is the number of units of time(e.g. months, weeks, years etc)
To use model (13) above, b is estimated using the formula below.
b=
m
i 1
(Yt-Yt-1)/m ------------------------------------------------------------------------------------------- (14)
Where m is the historical interval over which the average growth is calculated
Yt-1 is the level of Y one time period before Yt.
Informal Cross Border Trade Report 2012.
25
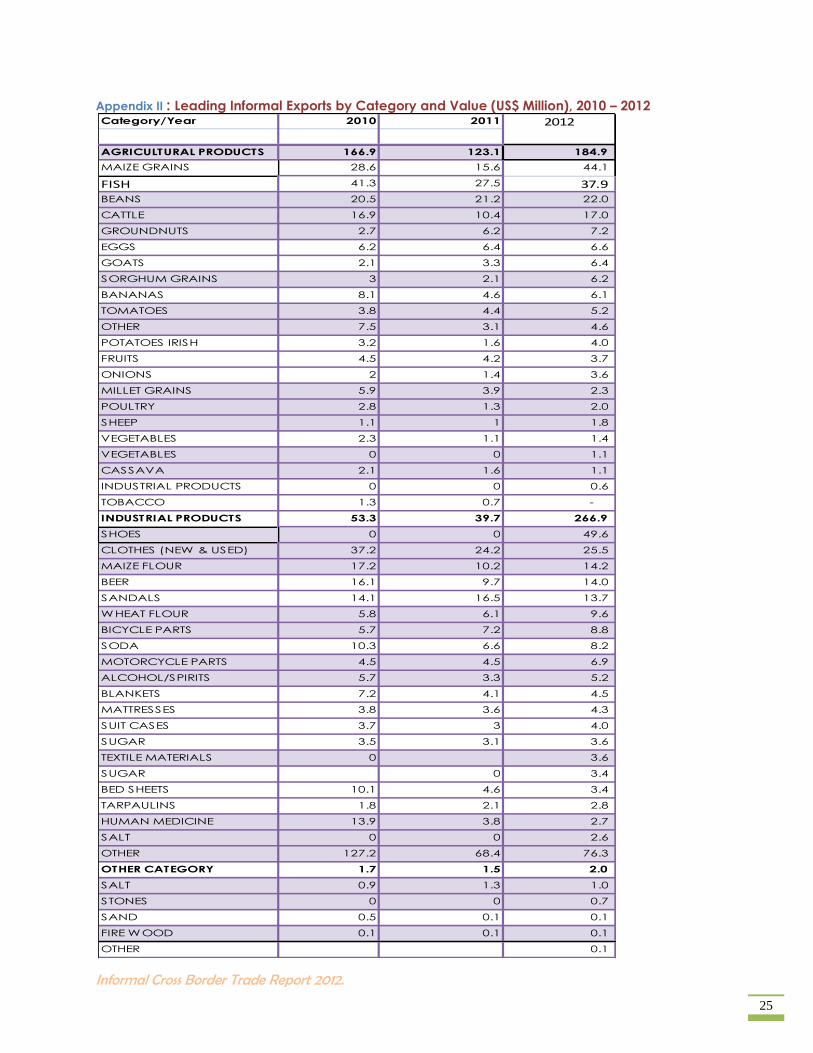
Appendix II : Leading Informal Exports by Category and Value (US$ Million), 2010 – 2012
Category/Year 2010 2011
AGRICULTURAL PRODUCTS 166.9 123.1 184.9
MAIZE GRAINS 28.6 15.6 44.1
FISH 41.3 27.5 37.9
BEANS 20.5 21.2 22.0
CATTLE 16.9 10.4 17.0
GROUNDNUTS 2.7 6.2 7.2
EGGS 6.2 6.4 6.6
GOATS 2.1 3.3 6.4
SORGHUM GRAINS 3 2.1 6.2
BANANAS 8.1 4.6 6.1
TOMATOES 3.8 4.4 5.2
OTHER 7.5 3.1 4.6
POTATOES IRISH 3.2 1.6 4.0
FRUITS 4.5 4.2 3.7
ONIONS 2 1.4 3.6
MILLET GRAINS 5.9 3.9 2.3
POULTRY 2.8 1.3 2.0
SHEEP 1.1 1 1.8
VEGETABLES 2.3 1.1 1.4
VEGETABLES 0 0 1.1
CASSAVA 2.1 1.6 1.1
INDUSTRIAL PRODUCTS 0 0 0.6
TOBACCO 1.3 0.7 -
INDUSTRIAL PRODUCTS 53.3 39.7 266.9
SHOES 0 0 49.6
CLOTHES (NEW & USED) 37.2 24.2 25.5
MAIZE FLOUR 17.2 10.2 14.2
BEER 16.1 9.7 14.0
SANDALS 14.1 16.5 13.7
WHEAT FLOUR 5.8 6.1 9.6
BICYCLE PARTS 5.7 7.2 8.8
SODA 10.3 6.6 8.2
MOTORCYCLE PARTS 4.5 4.5 6.9
ALCOHOL/SPIRITS 5.7 3.3 5.2
BLANKETS 7.2 4.1 4.5
MATTRESSES 3.8 3.6 4.3
SUIT CASES 3.7 3 4.0
SUGAR 3.5 3.1 3.6
TEXTILE MATERIALS 0 3.6
SUGAR 0 3.4
BED SHEETS 10.1 4.6 3.4
TARPAULINS 1.8 2.1 2.8
HUMAN MEDICINE 13.9 3.8 2.7
SALT 0 0 2.6
OTHER 127.2 68.4 76.3
OTHER CATEGORY 1.7 1.5 2.0
SALT 0.9 1.3 1.0
STONES 0 0 0.7
SAND 0.5 0.1 0.1
FIRE WOOD 0.1 0.1 0.1
OTHER 0.1
2012
Informal Cross Border Trade Report 2012.
26
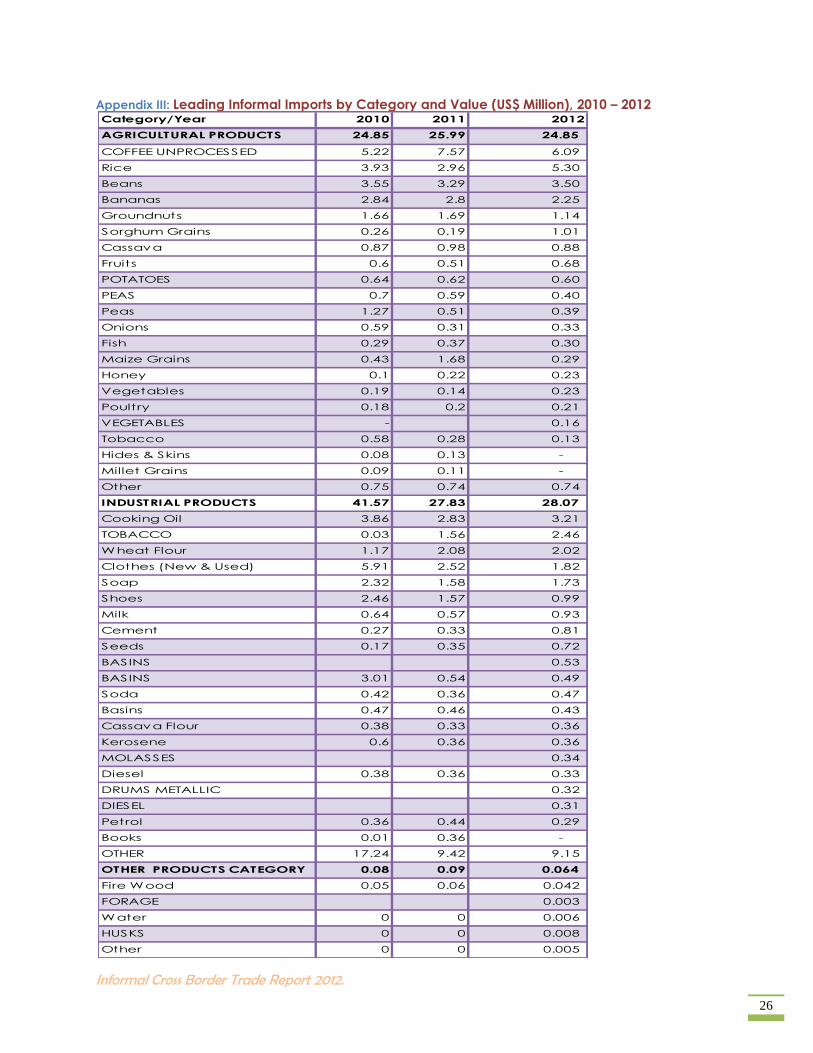
Appendix III: Leading Informal Imports by Category and Value (US$ Million), 2010 – 2012
Category/Year 2010 2011 2012
AGRICULTURAL PRODUCTS 24.85 25.99 24.85
COFFEE UNPROCESSED 5.22 7.57 6.09
Rice 3.93 2.96 5.30
Beans 3.55 3.29 3.50
Bananas 2.84 2.8 2.25
Groundnuts 1.66 1.69 1.14
Sorghum Grains 0.26 0.19 1.01
Cassava 0.87 0.98 0.88
Fruits 0.6 0.51 0.68
POTATOES 0.64 0.62 0.60
PEAS 0.7 0.59 0.40
Peas 1.27 0.51 0.39
Onions 0.59 0.31 0.33
Fish 0.29 0.37 0.30
Maize Grains 0.43 1.68 0.29
Honey 0.1 0.22 0.23
Vegetables 0.19 0.14 0.23
Poultry 0.18 0.2 0.21
VEGETABLES - 0.16
Tobacco 0.58 0.28 0.13
Hides & Skins 0.08 0.13 -
Millet Grains 0.09 0.11 -
Other 0.75 0.74 0.74
INDUSTRIAL PRODUCTS 41.57 27.83 28.07
Cooking Oil 3.86 2.83 3.21
TOBACCO 0.03 1.56 2.46
Wheat Flour 1.17 2.08 2.02
Clothes (New & Used) 5.91 2.52 1.82
Soap 2.32 1.58 1.73
Shoes 2.46 1.57 0.99
Milk 0.64 0.57 0.93
Cement 0.27 0.33 0.81
Seeds 0.17 0.35 0.72
BASINS 0.53
BASINS 3.01 0.54 0.49
Soda 0.42 0.36 0.47
Basins 0.47 0.46 0.43
Cassava Flour 0.38 0.33 0.36
Kerosene 0.6 0.36 0.36
MOLASSES 0.34
Diesel 0.38 0.36 0.33
DRUMS METALLIC 0.32
DIESEL 0.31
Petrol 0.36 0.44 0.29
Books 0.01 0.36 -
OTHER 17.24 9.42 9.15
OTHER PRODUCTS CATEGORY 0.08 0.09 0.064
Fire Wood 0.05 0.06 0.042
FORAGE 0.003
Water 0 0 0.006
HUSKS 0 0 0.008
Other 0 0 0.005

Informal Cross Border Trade Report 2012.
27
Appendix IV: Trade flows by border stations 2012
Export IMPORT
Value Value
2011 2012 2011 2012
DR Congo 126.10 157.81 21.40 20.31
Mpondwe 77.8 102.40 9 9.19
Odramachaku 14.5 15.73 2.7 1.76
Ntoroko 9.4 9.39 0.7 0.34
Bunagana 8.2 6.66 1.5 1.89
Paidha 6.9 15.55 3.8 4.61
Vvura 4.3 5.64 2 1.50
Ishasha River 2.9 1.80 0.2 0.18
Goli 2.1 0.65 1.5 0.84
South Sudan 83.7 115.16 1.4 3.20
Bibia/Nimule 65.3 86.51 1.2 2.89
Oraba 18.4 28.65 0.2 0.31
Kenya 69.5 79.97 27 24.53
Busia 59.9 68.49 18.9 15.93
Malaba 5.1 7.55 4.3 4.88
Suam River 2.7 2.89 1.5 1.91
Lwakhakha 1.6 0.94 1.8 1.46
Sono 0.2 0.10 0.6 0.35
Rwanda 35.1 53.35 1.7 3.10
Katuna 26.2 45.31 0.6 1.62
Cyanika 6.7 7.41 0.8 1.10
Mirama Hills 2.2 0.63 0.2 0.38
- -
Tanzania 28.8 47.46 2.4 1.85
Mutukula 27.6 46.19 2.1 1.38
Kikagati 1.2 1.27 0.3 0.47
Burundi 12.6 - 0 -
Katuna 12.6 - -
Grand Total 355.9 453.74 53.9 52.99
Trade flows By Border Stations

Informal Cross Border Trade Report 2012.
28
Appendix IV : ICBT Survey Team 2012
Co-coordinators
NO. Name
1 Mr. Kenneth Egesa
2 Dr. C N Mukiiza
3 Mr. Emmanuel Ssemambo
4 Mr. John Mayende
5 Mr. Nicholas Okot
6 Ms. Jane Namaaji
Report writing
1 Dr. C N Mukiiza
2 Mr. Kenneth Egesa
3 Mr. John Mayende
4 Mr. Peter Kagumya
5 Mrs. Aliziki Lubega
6 Mr. Ivan James Ssettimba
7 Ms. I Namugenze
Supervisors
1 Mr. Edward Twinomugisha
2 Mr. Micheal Magala
3 Mr. Theophillus Onesmus Musiimenta
4 Mrs. Olivia Rukundo
5 Mr. Ivan James Ssettimba
6 Mrs. Aliziki Lubega
7 Mrs. Margaret B. Makanga
8 Ms. I Namugenze
9 Mr. Sulaiman Nyanzi
10 Mrs. Yoyeta Jane Magoola Data Editors
1 Mr. James Peter Ssemambo
2 Ms. Audrey Kemigisha
3 Ms. Lydia Nyirabasabose
4 Ms. Farida Yapsoyekwo
Data Entrants
1 Ms. Winfred Nante
2 Ms. P. Nambalirwa
3 Ms. Rachael Wambi
4 Ms. Irene Tibanganya
Informal Cross Border Trade Report 2012.
29
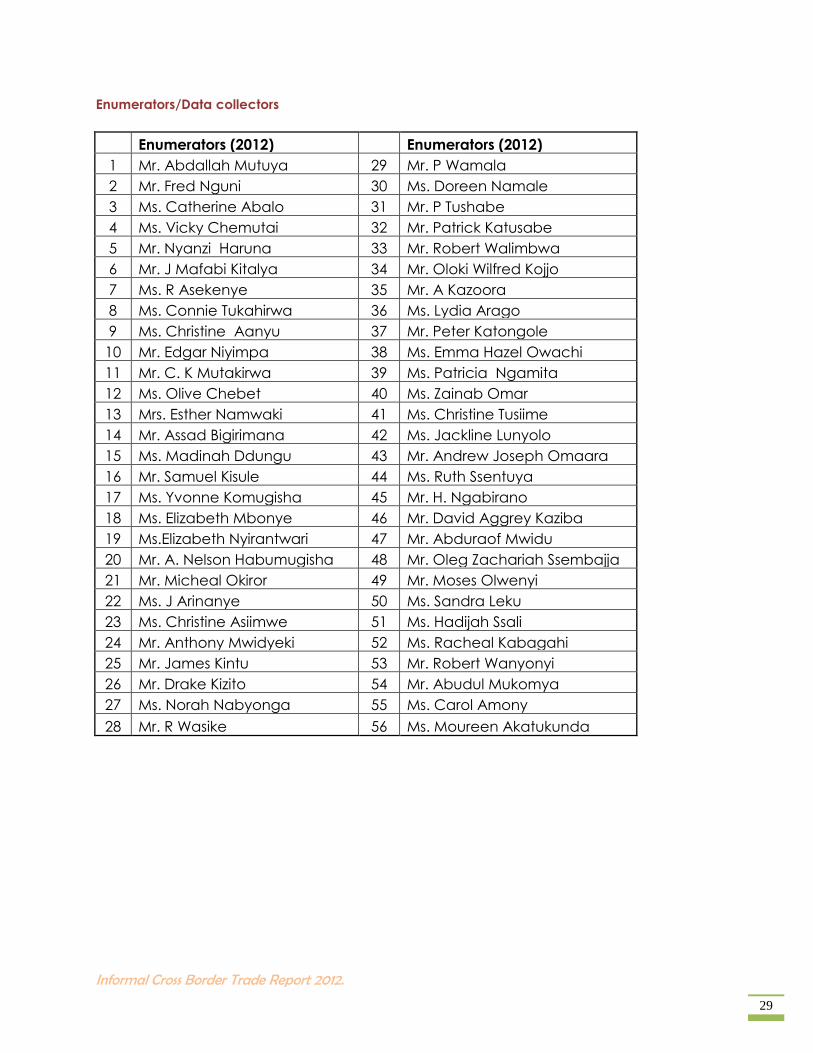
Enumerators/Data collectors
Enumerators (2012) Enumerators (2012)
1 Mr. Abdallah Mutuya 29 Mr. P Wamala
2 Mr. Fred Nguni 30 Ms. Doreen Namale
3 Ms. Catherine Abalo 31 Mr. P Tushabe
4 Ms. Vicky Chemutai 32 Mr. Patrick Katusabe
5 Mr. Nyanzi Haruna 33 Mr. Robert Walimbwa
6 Mr. J Mafabi Kitalya 34 Mr. Oloki Wilfred Kojjo
7 Ms. R Asekenye 35 Mr. A Kazoora
8 Ms. Connie Tukahirwa 36 Ms. Lydia Arago
9 Ms. Christine Aanyu 37 Mr. Peter Katongole
10 Mr. Edgar Niyimpa 38 Ms. Emma Hazel Owachi
11 Mr. C. K Mutakirwa 39 Ms. Patricia Ngamita
12 Ms. Olive Chebet 40 Ms. Zainab Omar
13 Mrs. Esther Namwaki 41 Ms. Christine Tusiime
14 Mr. Assad Bigirimana 42 Ms. Jackline Lunyolo
15 Ms. Madinah Ddungu 43 Mr. Andrew Joseph Omaara
16 Mr. Samuel Kisule 44 Ms. Ruth Ssentuya
17 Ms. Yvonne Komugisha 45 Mr. H. Ngabirano
18 Ms. Elizabeth Mbonye 46 Mr. David Aggrey Kaziba
19 Ms.Elizabeth Nyirantwari 47 Mr. Abduraof Mwidu
20 Mr. A. Nelson Habumugisha 48 Mr. Oleg Zachariah Ssembajja
21 Mr. Micheal Okiror 49 Mr. Moses Olwenyi
22 Ms. J Arinanye 50 Ms. Sandra Leku
23 Ms. Christine Asiimwe 51 Ms. Hadijah Ssali
24 Mr. Anthony Mwidyeki 52 Ms. Racheal Kabagahi
25 Mr. James Kintu 53 Mr. Robert Wanyonyi
26 Mr. Drake Kizito 54 Mr. Abudul Mukomya
27 Ms. Norah Nabyonga 55 Ms. Carol Amony
28 Mr. R Wasike 56 Ms. Moureen Akatukunda
Informal Cross Border Trade Report 2012.
30
Appendix V : Survey Instruments
A: Vehicle Form
B: Summary Form A
Serial No:
BANK OF UGANDA UGANDA BUREAU OF STATISTICS
SHEET FOR CAPTURING MERCHANDISE TRADE DATA FOR VEHICLES
DATE OF RECORDING:………/…………/……… DAY:……………………………………………….. TIME OF RECORDING :………………………………………
VEHICLE REG. NO:…………………………………. COUNTRY CODE:……………………….. BORDER POST:…………………………………….
VEHICLE TYPE:…………………………………… URA ASSESSMENT NO: …………………………………….. Transport Cost for Cargo :……………………………
VEHICLE TONNAGE…………………………………. Town of Origin:………………………………………. Town of Destination ……………………………………
FLOW: EXPORT IMPORT TRANSIT: YES NO
ITEM NAME UNIT
CODE
QTY IN PACKAGING QTY ON TRUCK QTY DECLARED
TO URA
ICBT QTY VALUE DECLARED TO
URA
PRICE
Enumerator's Name………………………………………………… Supervisor's Name…………………………………….
SIGNATURE…………………………………………………………………. SIGNATURE…………………………………………………. DATE……………….
Note: In the column indicated Quantity in Packaging you are required to indicate the main packing of the commodity and weight/capacity (e.g: 10 cartons each 12 ltrs Or 20 bags each 50kg)
UNIT CODES COUNTRY CODES
1- Kgs 7- Pieces 01- DR Congo
2- Litres 8- Bars 02- Tanzania
3- Metres 9-Rolls 03- Kenya
4- Numbers 10- Sets 04- Rwanda
5- Dozens 12- Tins 05- Sudan
6- Pairs 13- Others (Specify) 06- Burundi
Serial No:
BANK OF UGANDA UGANDA BUREAU OF STATISTICS
Sheet For Summarising Daily Records (To be filled in by Enumerator and Counter-signed by the Supervisor)
Border Post:…………………………………………………………………
HS Code (Office) Item (Name) Quantity Unit Code
Est. Domestic
Price per Unit
Country of
Destination code
(Exports
Country of
Destination code
(Imports)
Mode of Transport
Name and Signature of Enumerator's Name………………………………………………… Date……………………/20…. Day of the week (e.g Mon….)
Name and Signature of Supervisor…………………………………………………………………. Date and Time of Checking..……………………………………….
UNIT CODES COUNTRY CODES Mode of Transport Code
1- Kgs 7- Pieces 01- DR Congo 01-Head/Hand
2- Litres 8- Bars 02- Tanzania 02-Bicycle
3- Metres 9-Rolls 03- Kenya 03-Push cart
4- Numbers 10- Sets 04- Rwanda 04-Vehicle
5- Dozens 12- Tins 05- Sudan 05-Boat/canoe
6- Pairs 13- Others (Specify) 06- Burundi 06-Wheel Chair
Other (Specify)