thermal and nuclear power generation cost …eneken.ieej.or.jp/data/4103.pdfthermal and nuclear...
TRANSCRIPT
IEEJ: 2011 October All Rights Reserved
1
Thermal and Nuclear Power Generation Cost Estimates Using Corporate Financial Statements
Yuhji Matsuo,1 Yu Nagatomi2 and Tomoko Murakami3
Summary There are two generally accepted methods for estimating power generation costs: so-called “model plant” method
and the method using corporate financial statements. The method using corporate financial statements, though under some
constraints, can provide useful information for comparing thermal and nuclear power generation costs. This study used this
method for estimating thermal and nuclear power generation costs in Japan for the past five years, finding that the nuclear
power generation cost remained stable at around 7 yen per kilowatt-hour (kWh) while the thermal power generation cost
moved within a wide range of 9 to 12 yen/kWh in line with wild fluctuations in primary energy prices.
The cost of nuclear power generation is expected to increase due to the enhancement of safety measures and accident
damage compensation in the future, while there are reactor decommissioning, backend and many other costs that the financial
statement-using approach cannot accurately estimate. In the future, efforts should be continued to comprehensively and
accurately estimate total costs.
1. Introduction
The Fukushima Daiichi nuclear plant accident triggered by the Great East Japan Earthquake has led to serious
developments of massive radiation leaks and residents’ long-term evacuation, exerting great impacts on nuclear energy policies
in Japan and other countries. The Strategic Energy Plan1) calls for building nine new commercial nuclear reactors by 2020, and
5 more by 2030. In response to the accident, however, the Prime Minister instructed that the plan be reformed. Japan’s nuclear
energy policy may have to be dramatically reformed. Irrespective of the Fukushima nuclear plant accident, however, Japan will
remain required internationally to reduce greenhouse gas emissions. In resources-poor Japan, nuclear energy viewed as a
quasi-domestic energy resource will remain important for stable energy supply. How nuclear energy would be positioned under
such situation is still uncertain.
Power generation costs are important for considering the use of nuclear energy. Nuclear power generation has been
promoted in many countries as a power generation method that emits no carbon dioxide and allows massive electricity to be
generated cheaply. Even at present after the Fukushima Daiichi nuclear plant accident, nuclear energy development leaders
such as the United States, France and Russia, and emerging countries like China and India have not changed their basic nuclear
energy promotion policies. It may be needless to note that safety and nuclear nonproliferation are the most important
preconditions for the use of nuclear energy. Apart from these problems, however, the estimation of nuclear power generation
costs should be very important for assessing future nuclear policies in Japan and the world.
In Japan, the Subcommittee to Study Costs and Other Issues in the government’s Advisory Committee for Natural
Resources and Energy released hydro, thermal and nuclear power generation cost estimation results2) in 2004. Given a service
life of 40 years, a capacity factor of 80% for thermal and nuclear and 45% for hydro power plants, and a discount rate of 3%,
the unit cost was estimated at 11.9 yen/kWh for conventional hydro power generation, 10.7 yen/kWh for oil thermal generation,
6.2 yen/kWh for LNG thermal generation, 5.7 yen/kWh for coal thermal generation and 5.3 yen/kWh for nuclear generation.
Nuclear energy was thus viewed as a lower-cost electricity source.
Meanwhile, U.S. estimates frequently indicate that the unit cost for nuclear power generation is higher than for
thermal power generation3)4)5)6). This is mainly because a discount rate viewed as appropriate in Japan is lower than those in the
1 Senior Researcher, Nuclear Energy Group, the Institute of Energy Economics, Japan 2 Researcher, Energy Data and Modelling Center, the Institute of Energy Economics, Japan 3 Group Manager, Nuclear Energy Group, the Institute of Energy Economics, Japan
IEEJ: 2011 October All Rights Reserved
2
United States7). As well as such difference, however, we may have to consider nuclear plant construction costs that have risen
on various factors including building material and equipment price hikes4)5). Therefore, our urgent challenge is to estimate costs
for various power generation methods as accurately as possible based on up-to-date data.
The “model plant” approach and the method using corporate financial statements are widely used for estimating
power generation costs. The former approach sets the unit construction cost, fuel cost, operation and maintenance cost and
other costs for a power generating plant and estimates the unit generation cost based on a certain discount rate and
revenue/outlay balance for long-term plant operation. The financial statement-using approach estimates actual power
generation costs based on data as specified in electric utilities’ financial statements8). This study, building on past studies,
attempted to use the latter approach for estimating thermal and nuclear power generation costs.
2. Calculation methods
2-1 Kunitake et al. (1999)
Kunitake et al. used corporate financial statements of nine Japanese electric power utility companies to compute
nuclear power generation costs and their breakdown based on actual data and estimated the future outlook of the costs9)10).
Their approach is as follows:
They computed unit power generation costs by dividing a fiscal year’s hydro, thermal and nuclear power generation
costs by power output. Power generation costs here cover electric utility operating expenses and interest payments in
profit-and-loss statements. While electric utility operating expenses are broken down for hydro, thermal and nuclear power
generation in profit-and-loss statements, interest payments are not. Kunitake estimated interest payments for each power
generation method by allocating interest payments for overall electric utility operations to each power generation method based
on the share of electric utility fixed assets and construction in progress account.
Kunitake used gross output specified in financial statements as the denominator of the division to compute unit costs.
Generally, net output is several percent less than gross output due to power plants’ in-house electricity consumption. If net
output is used for the division to compute unit costs, any unit cost may be higher than for a case where gross output is used.
Furthermore, Kunitake used detailed lists of electric utility operating expenses to classify power generation expenses
into three categories – capital, operation and maintenance, and fuel cycle costs – based on which unit power generation costs
were broken down. The capital cost here covers the above-mentioned interest payments as well as such expenses as fixed asset
tax and amortization expenses, indicating the cost for power generation equipment construction and the like. It also covers the
cost for dismantling nuclear power facilities. Operation and maintenance expenses include such personnel expenses as wages
and benefits, repair costs and supplies expenses. Fuel cycle costs cover spent fuel reprocessing costs as well as fuel expenses
(fossil and nuclear fuels).
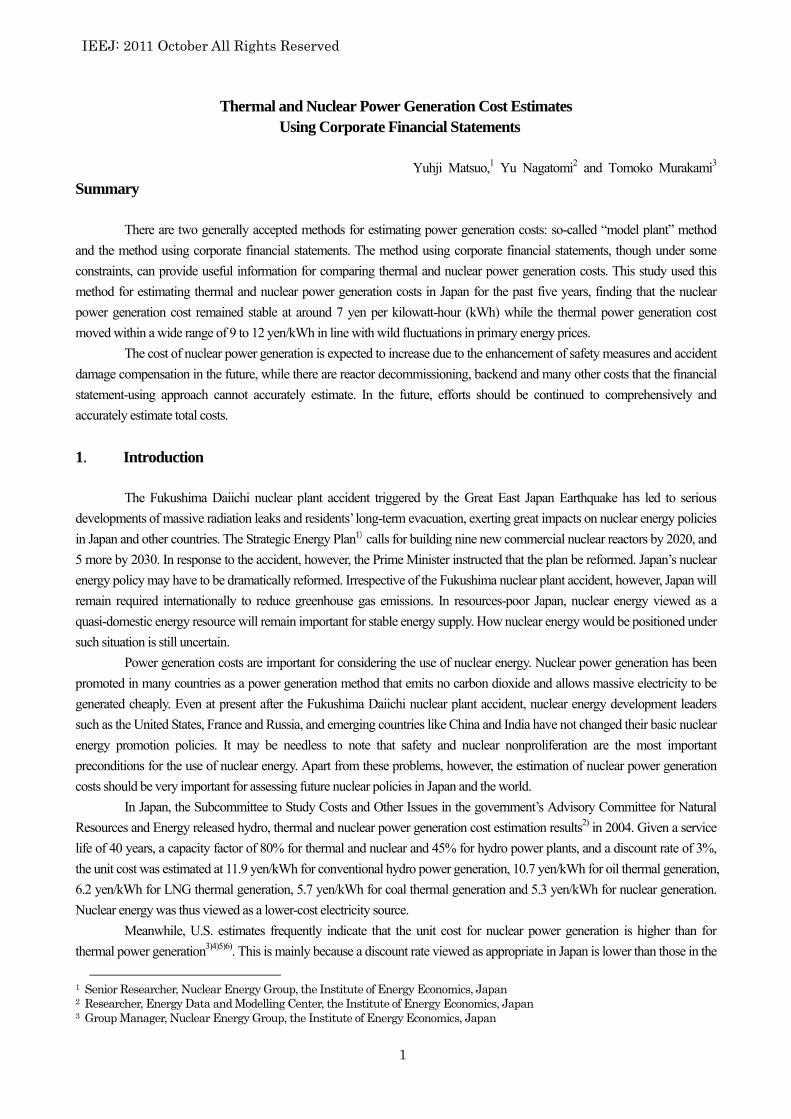
The results of this estimation in Figure 2-1 indicate that the unit cost for thermal power generation rose substantially
in 1974 and 1980 after the respective oil crises and fell to almost the same as nuclear or hydro power generation cost levels in
line with crude oil price drops. Meanwhile, the unit nuclear power generation cost fluctuated widely in the first half of the
1970s just after Japan’s introduction of nuclear power generation. It later remained relatively stable. Rather, it has indicated a
modest downward trend since the 1980s. Various factors behind the downward trend are conceivable. Cited as a major factor is
an interest payment fall indicated by a drop of the long-term lending rate for electric power utilities from more than 8% in 1971
to around 3% in 1996. In fact, interest payments’ share of the unit nuclear power generation cost has been large and dropped
persistently from the 1970s to 1996, as shown in Figure 2-1. Anyway, a major characteristic point of nuclear power generation
is that the capital cost accounted for about half of the total unit cost even in 1996.
IEEJ: 2011 October All Rights Reserved
3
Figure 2-1 Hydro, Thermal and Nuclear Power Generation Costs Estimated from Financial Statements (Kunitake,
1999)
2-2 Oshima (2010) , etc.
Oshima improved the Murota11)12) approach to use corporate financial statements of nine electric power utility
companies to estimate power generation costs13).
Murota’s approach calculates power generation costs according to the rules for calculation of charges under electricity
supply contracts. The costs consist of the operating expenses and business return. The former is the same as the above electric
utility operating expenses. The latter is calculated by multiplying the rate base including fixed electric utility assets by rate of
return. Murota’s approach differs from Kunitake’s approach in that it covers the rate of return instead of interest payments
adopted for Kunitake’s approach.
In response to Murota’s approach, Oshima made new estimates for the FY1970-2007 period, newly considering the
following points:
(1) Treatment of pumping-up hydro power generation
Murota’s approach12) divided hydro power generation into conventional hydro generation and pumped hydro
generation and added the unit cost for pumped hydro power generation to that of nuclear power generation. Oshima fine-tuned
Murota’s approach, dividing pumped hydro generation into natural flow generation and pumping-up generation and adding
only the latter to nuclear power generation.
(2) Treatment of development and siting costs
Oshima named costs for technology development and management of relevant organizations for electricity sources as
“development costs” and costs for siting power stations as “siting costs.” Development costs divided by power output are
called “the unit development cost” and siting costs divided by power output are named “the unit siting cost.” Specifically,
Oshima classified expenses for the relevant energy sources (hydro, thermal and nuclear) in the National Special Account for
Hydro
Thermal
Nuclear
(yen
/kW
h)
(Year)
Figure 1 Power Generation Costs Calculated form Financial Statements
Fuel cycle cost
Operation and maintenance cost
Capital cost (without interest payment)
Capital cost (interest payment alone)
(Year)
Figure 2 Composition of Nuclear Power Generation Cost
IEEJ: 2011 October All Rights Reserved
4
Electric Power Development Promotion and the General Account (science & technology promotion and energy measures
expenses) as “development costs” and all electricity siting measures expenses as “siting costs.” Oshima then calculated the
“unit development cost” and the “unit siting cost” by dividing development and siting costs by power output at nine electric
utilities (excluding output at Okinawa Electric Power Co., Electric Power Development Co. (J-Power) and the Japan Atomic
Power Co.).
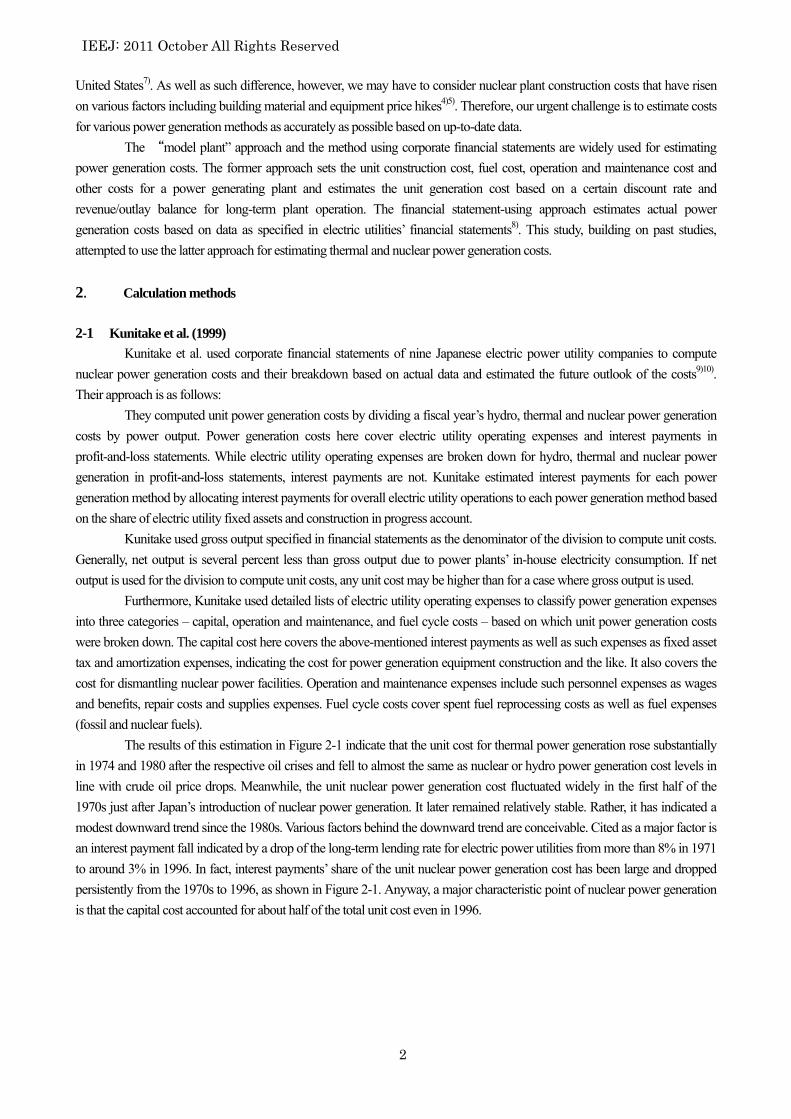
Oshima’s estimation used net output as the denominator. The relevant cost increase differentiates Oshima’s
estimation from Kunitake’s approach. Estimation results for hydro, thermal and nuclear power generation under Oshima’s
approach are similar to those under Kunitake’s approach, as indicated in Figure 2-2. The unit thermal power generation cost has
been generally higher than the unit nuclear or hydro cost since 2000, and since 2005 the unit cost of thermal generation has
increased in line with fossil fuel price hikes.
Figure 2-2 Unit Power Generation Cost Estimates Based on Corporate Financial Statements (Oshima 2010)
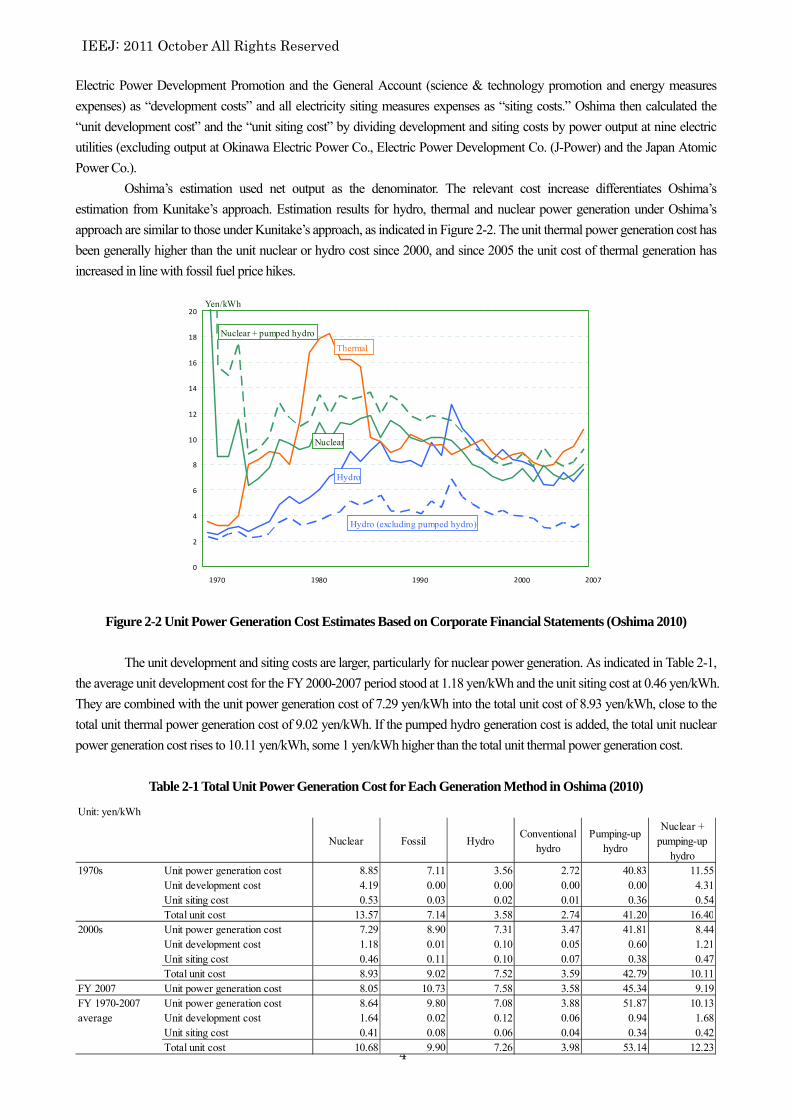
The unit development and siting costs are larger, particularly for nuclear power generation. As indicated in Table 2-1,
the average unit development cost for the FY 2000-2007 period stood at 1.18 yen/kWh and the unit siting cost at 0.46 yen/kWh.
They are combined with the unit power generation cost of 7.29 yen/kWh into the total unit cost of 8.93 yen/kWh, close to the
total unit thermal power generation cost of 9.02 yen/kWh. If the pumped hydro generation cost is added, the total unit nuclear
power generation cost rises to 10.11 yen/kWh, some 1 yen/kWh higher than the total unit thermal power generation cost.
Table 2-1 Total Unit Power Generation Cost for Each Generation Method in Oshima (2010)
Unit: yen/kWh
Nuclear Fossil HydroConventional
hydroPumping-up
hydro
Nuclear +pumping-up
hydro1970s Unit power generation cost 8.85 7.11 3.56 2.72 40.83 11.55
Unit development cost 4.19 0.00 0.00 0.00 0.00 4.31Unit siting cost 0.53 0.03 0.02 0.01 0.36 0.54Total unit cost 13.57 7.14 3.58 2.74 41.20 16.40
2000s Unit power generation cost 7.29 8.90 7.31 3.47 41.81 8.44Unit development cost 1.18 0.01 0.10 0.05 0.60 1.21Unit siting cost 0.46 0.11 0.10 0.07 0.38 0.47Total unit cost 8.93 9.02 7.52 3.59 42.79 10.11
FY 2007 Unit power generation cost 8.05 10.73 7.58 3.58 45.34 9.19FY 1970-2007 Unit power generation cost 8.64 9.80 7.08 3.88 51.87 10.13average Unit development cost 1.64 0.02 0.12 0.06 0.94 1.68
Unit siting cost 0.41 0.08 0.06 0.04 0.34 0.42Total unit cost 10.68 9.90 7.26 3.98 53.14 12.23
0
2
4
6
8
10
12
14
16
18
20
1970 1980 1990 2000 2007
Yen/kWh
Nuclear + pumped hydro
Nuclear
Thermal
Hydro
Hydro (excluding pumped hydro)

IEEJ: 2011 October All Rights Reserved
5
As noted above, the unit thermal power generation cost has increased rapidly in line with fossil fuel price hikes since
2005. Oshima estimated the unit power generation cost at 8.05 yen/kWh for nuclear, 10.73 yen/kWh for thermal and 9.19
yen/kWh for nuclear plus pumped hydro in FY2007. The unit thermal generation cost is remarkably higher than the unit
nuclear generation cost. Although no specific unit development or siting cost in FY2007 is found in Oshima’s estimates, the
average development and siting costs for the FY2000-2007 period combined with the FY 2007 unit generation costs makes
10.9 yen/kWh for both thermal and nuclear plus pumped hydro total unit costs.
According to Oshima’s estimates, the total unit cost for nuclear plus pumped hydro averaged 10.11 yen/kWh in the
2000s and 12.23 yen/kWh in the FY1970-2007 period. The latter average is over 2 yen/kWh higher than the former average.
Various factors are conceivable behind the gap. Particularly, a major factor may be that the rate of return in FY1988 had been
7.2%, far higher than 3.0% at present. (Similarly, Kunitake et al. in Section 2-1 showed that the unit nuclear power generation
cost levels in the 1970s and 1980s had been higher than the present level due to far higher long-term lending rates.) In order to
assess more realistic power generation costs, we should adopt estimates close to the present levels.
2-3 Key points of the estimation approach using corporate financial statements
2-3-1 Comparison of the model plant and financial statement-using approaches
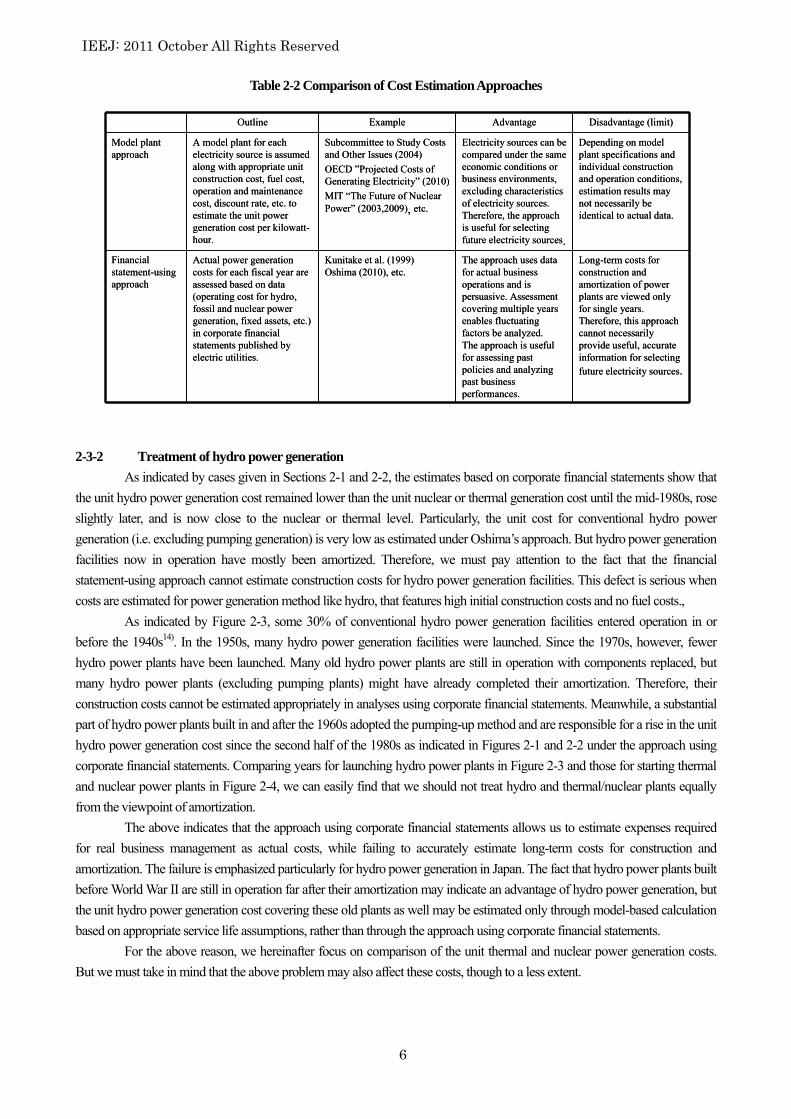
Table 2-2 indicates features of the cost estimation approach using corporate financial statements as compared with the
approach using model plants. The financial statement-using approach’s advantage is that the approach uses expenses required
for actual electric utility business operations to estimate securer costs including less estimation or assumption. Since actual
power generation facilities are constructed, amortized and operated over a long time, however, it is difficult to comprehensively
estimate power generation costs based on corporate financial statements that specify actual single-year data alone. Financial
statements for multiple years may be used to mitigate this disadvantage to some extent. But it is very difficult to estimate all the
past costs since the construction of the first hydro power plant in 1880s consistently with price fluctuations taken into account.
We must also note that various electricity sources are mixed appropriately in actual electricity supply to minimize
total system costs while meeting ever-changing demand. Estimates based on corporate financial statements reflect optimum
systematic operations as capacity factors and operating costs but do not necessarily indicate indigenous costs for each
electricity source.
Meanwhile, this approach is based on past actual data and conceived as useful for estimating past policies and
analyzing business performances. If the above-mentioned constraints are acknowledged, the financial statement-using
approach may be found as useful for providing important information for considering future electricity source choices. At the
same time, we may then be required to use model plant method to compare source-by-source power generation costs and
conduct sensitivity analyses under the same conditions.
It may be needless to say that a longer period for estimation may provide more information. When data in the far past
are used, however, monetary value changes may have to be appropriately taken into account. In order to ascertain future
implications, we may have to estimate the costs for the latest years, with recent fossil fuel price fluctuations and other
developments taken into account.
IEEJ: 2011 October All Rights Reserved
6
Table 2-2 Comparison of Cost Estimation Approaches
2-3-2 Treatment of hydro power generation
As indicated by cases given in Sections 2-1 and 2-2, the estimates based on corporate financial statements show that
the unit hydro power generation cost remained lower than the unit nuclear or thermal generation cost until the mid-1980s, rose
slightly later, and is now close to the nuclear or thermal level. Particularly, the unit cost for conventional hydro power
generation (i.e. excluding pumping generation) is very low as estimated under Oshima’s approach. But hydro power generation
facilities now in operation have mostly been amortized. Therefore, we must pay attention to the fact that the financial
statement-using approach cannot estimate construction costs for hydro power generation facilities. This defect is serious when
costs are estimated for power generation method like hydro, that features high initial construction costs and no fuel costs.,
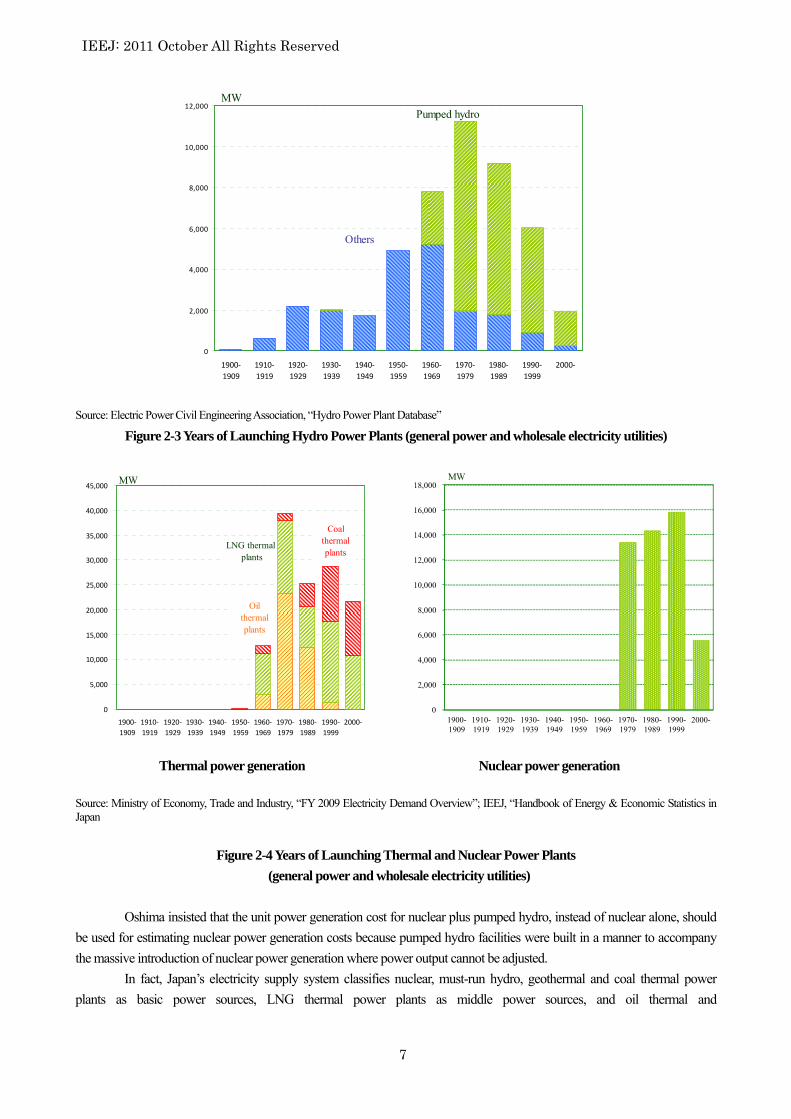
As indicated by Figure 2-3, some 30% of conventional hydro power generation facilities entered operation in or
before the 1940s14). In the 1950s, many hydro power generation facilities were launched. Since the 1970s, however, fewer
hydro power plants have been launched. Many old hydro power plants are still in operation with components replaced, but
many hydro power plants (excluding pumping plants) might have already completed their amortization. Therefore, their
construction costs cannot be estimated appropriately in analyses using corporate financial statements. Meanwhile, a substantial
part of hydro power plants built in and after the 1960s adopted the pumping-up method and are responsible for a rise in the unit
hydro power generation cost since the second half of the 1980s as indicated in Figures 2-1 and 2-2 under the approach using
corporate financial statements. Comparing years for launching hydro power plants in Figure 2-3 and those for starting thermal
and nuclear power plants in Figure 2-4, we can easily find that we should not treat hydro and thermal/nuclear plants equally
from the viewpoint of amortization.
The above indicates that the approach using corporate financial statements allows us to estimate expenses required
for real business management as actual costs, while failing to accurately estimate long-term costs for construction and
amortization. The failure is emphasized particularly for hydro power generation in Japan. The fact that hydro power plants built
before World War II are still in operation far after their amortization may indicate an advantage of hydro power generation, but
the unit hydro power generation cost covering these old plants as well may be estimated only through model-based calculation
based on appropriate service life assumptions, rather than through the approach using corporate financial statements.
For the above reason, we hereinafter focus on comparison of the unit thermal and nuclear power generation costs.
But we must take in mind that the above problem may also affect these costs, though to a less extent.
Outline Example Advantage Disadvantage (limit)
Model plantapproach
A model plant for each electricity source is assumed along with appropriate unit construction cost, fuel cost, operation and maintenance cost, discount rate, etc. to estimate the unit power generation cost per kilowatt-hour.
Subcommittee to Study Costs and Other Issues (2004)
OECD ”Projected Costs of Generating Electricity” (2010)
MIT “The Future of Nuclear Power” (2003,2009), etc.
Electricity sources can be compared under the same economic conditions or business environments, excluding characteristics of electricity sources. Therefore, the approach is useful for selecting future electricity sources.
Depending on model plant specifications and individual construction and operation conditions, estimation results may not necessarily be identical to actual data.
Financial statement-using approach
Actual power generation costs for each fiscal year are assessed based on data (operating cost for hydro, fossil and nuclear power generation, fixed assets, etc.) in corporate financial statements published by electric utilities.
Kunitake et al. (1999)Oshima (2010), etc.
The approach uses data for actual business operations and is persuasive. Assessment covering multiple years enables fluctuating factors be analyzed. The approach is useful for assessing past policies and analyzing past business performances.
Long-term costs for construction and amortization of power plants are viewed only for single years. Therefore, this approach cannot necessarily provide useful, accurate information for selecting future electricity sources.
IEEJ: 2011 October All Rights Reserved
7
Source: Electric Power Civil Engineering Association, “Hydro Power Plant Database”
Figure 2-3 Years of Launching Hydro Power Plants (general power and wholesale electricity utilities)
Thermal power generation Nuclear power generation
Source: Ministry of Economy, Trade and Industry, “FY 2009 Electricity Demand Overview”; IEEJ, “Handbook of Energy & Economic Statistics in Japan
Figure 2-4 Years of Launching Thermal and Nuclear Power Plants
(general power and wholesale electricity utilities)
Oshima insisted that the unit power generation cost for nuclear plus pumped hydro, instead of nuclear alone, should
be used for estimating nuclear power generation costs because pumped hydro facilities were built in a manner to accompany
the massive introduction of nuclear power generation where power output cannot be adjusted.
In fact, Japan’s electricity supply system classifies nuclear, must-run hydro, geothermal and coal thermal power
plants as basic power sources, LNG thermal power plants as middle power sources, and oil thermal and
0
2,000
4,000
6,000
8,000
10,000
12,000
14,000
16,000
18,000
1900-1909
1910-1919
1920-1929
1930-1939
1940-1949
1950-1959
1960-1969
1970-1979
1980-1989
1990-1999
2000-
MW
0
2,000
4,000
6,000
8,000
10,000
12,000
1900‐
1909
1910‐
1919
1920‐
1929
1930‐
1939
1940‐
1949
1950‐
1959
1960‐
1969
1970‐
1979
1980‐
1989
1990‐
1999
2000‐
MW
Pumped hydro
Others
0
5,000
10,000
15,000
20,000
25,000
30,000
35,000
40,000
45,000
1900‐
1909
1910‐
1919
1920‐
1929
1930‐
1939
1940‐
1949
1950‐
1959
1960‐
1969
1970‐
1979
1980‐
1989
1990‐
1999
2000‐
MW
LNG thermal plants
Oilthermalplants
Coalthermalplants
IEEJ: 2011 October All Rights Reserved
8
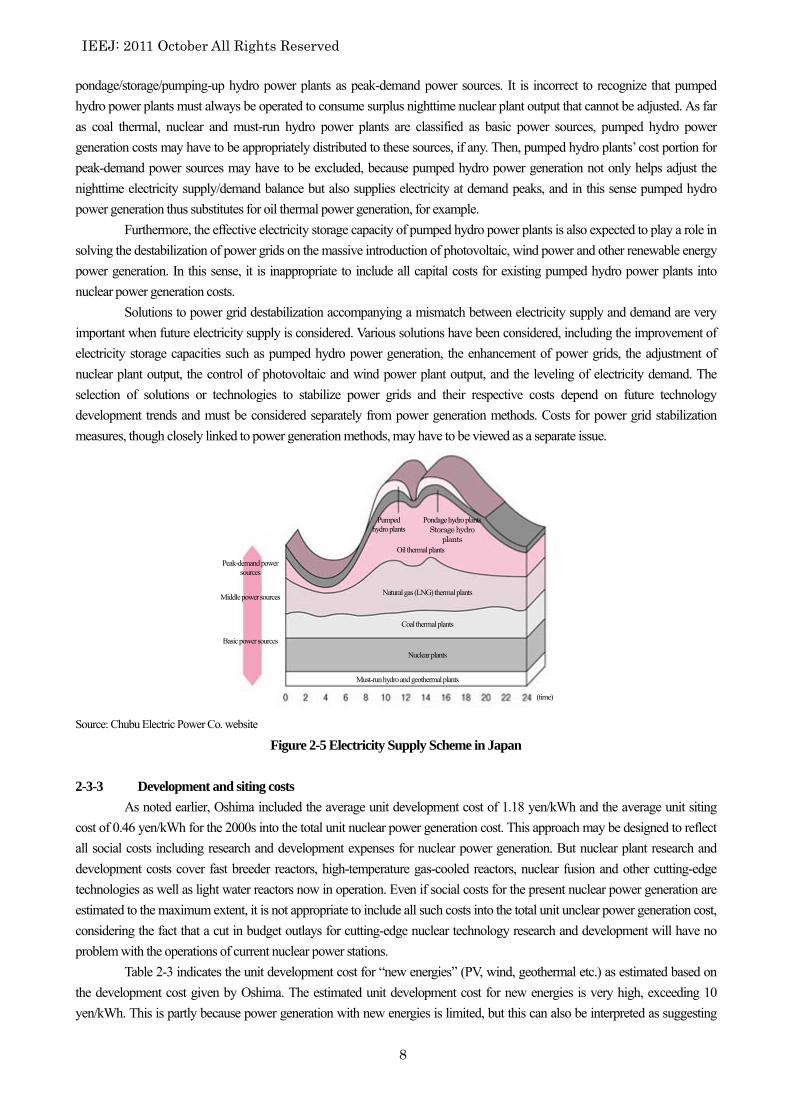
pondage/storage/pumping-up hydro power plants as peak-demand power sources. It is incorrect to recognize that pumped
hydro power plants must always be operated to consume surplus nighttime nuclear plant output that cannot be adjusted. As far
as coal thermal, nuclear and must-run hydro power plants are classified as basic power sources, pumped hydro power
generation costs may have to be appropriately distributed to these sources, if any. Then, pumped hydro plants’ cost portion for
peak-demand power sources may have to be excluded, because pumped hydro power generation not only helps adjust the
nighttime electricity supply/demand balance but also supplies electricity at demand peaks, and in this sense pumped hydro
power generation thus substitutes for oil thermal power generation, for example.
Furthermore, the effective electricity storage capacity of pumped hydro power plants is also expected to play a role in
solving the destabilization of power grids on the massive introduction of photovoltaic, wind power and other renewable energy
power generation. In this sense, it is inappropriate to include all capital costs for existing pumped hydro power plants into
nuclear power generation costs.
Solutions to power grid destabilization accompanying a mismatch between electricity supply and demand are very
important when future electricity supply is considered. Various solutions have been considered, including the improvement of
electricity storage capacities such as pumped hydro power generation, the enhancement of power grids, the adjustment of
nuclear plant output, the control of photovoltaic and wind power plant output, and the leveling of electricity demand. The
selection of solutions or technologies to stabilize power grids and their respective costs depend on future technology
development trends and must be considered separately from power generation methods. Costs for power grid stabilization
measures, though closely linked to power generation methods, may have to be viewed as a separate issue.
Source: Chubu Electric Power Co. website
Figure 2-5 Electricity Supply Scheme in Japan
2-3-3 Development and siting costs
As noted earlier, Oshima included the average unit development cost of 1.18 yen/kWh and the average unit siting
cost of 0.46 yen/kWh for the 2000s into the total unit nuclear power generation cost. This approach may be designed to reflect
all social costs including research and development expenses for nuclear power generation. But nuclear plant research and
development costs cover fast breeder reactors, high-temperature gas-cooled reactors, nuclear fusion and other cutting-edge
technologies as well as light water reactors now in operation. Even if social costs for the present nuclear power generation are
estimated to the maximum extent, it is not appropriate to include all such costs into the total unit unclear power generation cost,
considering the fact that a cut in budget outlays for cutting-edge nuclear technology research and development will have no
problem with the operations of current nuclear power stations.
Table 2-3 indicates the unit development cost for “new energies” (PV, wind, geothermal etc.) as estimated based on
the development cost given by Oshima. The estimated unit development cost for new energies is very high, exceeding 10
yen/kWh. This is partly because power generation with new energies is limited, but this can also be interpreted as suggesting
Pumped hydro plants
Pondage hydro plants Storage hydro
plants Oil thermal plants
Peak-demand power sources
Middle power sources
Basic power sources
Natural gas (LNG) thermal plants
Coal thermal plants
Nuclear plants
Must-run hydro and geothermal plants
(time)

IEEJ: 2011 October All Rights Reserved
9
that technology development for the future should be considered as a matter separate from costs for power generation using
existing technologies. For example, it is difficult to conclude that the inclusion of research and development outlays for space
photovoltaic power generation and other cutting-edge technologies into the unit power generation cost for solar panels
contributes to an accurate assessment of photovoltaic power generation costs. This may be the same case with nuclear power
generation. Most nuclear research and development outlays may be designed for cutting-edge technologies that are different
from long-existing nuclear power generation technologies, and it is not easy to give any specific ground for assessing the extent
to which these outlays should be included into the unit nuclear power generation cost.
Table 2-3 Unit Development Cost for Nuclear and “New Energies”
Note: We calculated the unit development cost for new energies by dividing development costs by the total output of geothermal, wind power and photovoltaic power plants. Source: Prepared by the author from Oshima (2010), etc.
2-4 Estimation approach for this study
As noted in Section 2-3-1, the approach using corporate financial statements has difficulties estimating overall power
generation costs consistently over a long period of time, while featuring an advantage that securer costs including less
estimation can be calculated based on actual data for relevant business years.
As indicated by Figure 2-1, interest payments’ contributions to the unit power generation costs may not be negligible
but may be indispensable for estimating accurate costs. Meanwhile, the approach indicated in Section 2-2 included a rate base
multiplied by a rate of return into the unit power generation cost, based on power utilities’ cost calculations. By using the
assumed rate of return to calculate the business return indicating social costs for power generation, this approach apparently
affects the above-mentioned advantage of the financial statement-using approach. (Calculations using such assumed or
presumed values belong to model estimation and should be done with a model plant calculation method.)
For the above reasons, this study estimated a combination of electric utility operating expenses and interest payments
mainly in accordance with Kunitake’s approach given in Section 2-1. Secondarily, some estimations according to Oshima’s
approach described in Section 2-2 are conducted.
In line with Kunitake’s approach, interest payments are distributed to power generation methods according to each
method’s share of electric utility fixed assets and construction in progress account. As the denominator of the division to
compute unit costs, the net output excluding utilities’ on-site consumption is used, instead of the gross output adopted by
Kunitake et al.
As detailed lists of electric utility operating expenses specify details of expenses, we can classify expenses into
several categories. We classify these expenses here in accordance with Table 2-4. Distributed interest payments are included
into capital costs.
Nuclear New energies1970s 4.19 10.211980s 2.26 25.131990s 1.49 15.882000s 1.18 11.11
Unit: yen/kWh

IEEJ: 2011 October All Rights Reserved
10
Table 2-4 Classification of Power Generation Costs Specified in Detailed Lists of Electric Utility Operating Expenses
Subjected to the estimation were 12 general and wholesale power utilities. In a bid to assess more realistic power
generation costs, we estimated average values for the five latest years (FY2006-2010). Authors’ estimation thus reflects fossil
fuel price spikes in FY 2008 and later developments, allowing us to analyze the relationship between fossil fuel price
fluctuations and power generation costs to ascertain future implications.
These companies’ financial statements specify power output covering consolidated subsidiaries, while
source-by-source electric utility operating expenses are given only in unconsolidated financial statements. The
above-mentioned approach thus fails to cover expenses at consolidated subsidiaries, leading thermal and hydro power
generation costs underestimated. Here, we excluded power output at consolidated subsidiaries from the total output according
to their power generation capacity shares, only for cases where the capacities are specified.
We used the same approach to estimate the unit power generation cost for “new energies” as financial statements of
these firms specified expenses for this kind of power generation in addition to hydro, thermal and nuclear energies in FY 2009
and 2010. New energies here include geothermal, wind power, solar energies, etc, but because of the amount of the electricity
generated, the “new energy” generating cost calculated here is considered to represent that of geothermal energy. Therefore, we
will hereinafter call this category “geothermal, etc.”
J-Power had 15 MW in geothermal power generation capacity with consolidated subsidiaries’ wind power generation
capacity at 352.9 MW in FY 2010. It may be needless to say that straightforward calculations will lead us to substantially
underestimate new energy-based power generation costs as stated above. But if consolidated subsidiaries’ power output is
excluded according to their capacity shares, the gap in capacity factor between geothermal and wind power plants may lead us
to overestimate the generation costs. In estimating power generation costs for “geothermal, etc.”, therefore, we excluded
J-Power and adopted an average for 10 general power utilities alone.
Category Classification in the Detailed List
Capital costFixed asset tax, amortization expenses, losses on
retirement of fixed assets, contributions for shared
Fuel cost Fuel expenses
Backend cost
Spent fuel reprocessing expenses, spent fuel
reprocessing preparation expenses, waste disposal
expenses, specified radioactive waste disposal expensesDecommissioning
cost
Nuclear power generation facility dismantlement
expensesOperational and
maintenance costAll expenses other than the above

IEEJ: 2011 October All Rights Reserved
11
3. Estimation Results The average unit power generation cost for the FY2006-2010 period for the 12 companies (J-Power is excluded for
geothermal, etc.) came to 10.2 yen/kWh for thermal, 7.2 yen/kWh for nuclear and 8.9 yen/kWh for geothermal etc. as shown
in Figure 3-1. The thermal power generation cost was the highest. Fuel cost accounted for 7.5 yen/kWh or 74% of the thermal
power generation cost. The reason for the high cost is undoubtedly a fuel price hike accompanying a crude oil price spike.
The unit nuclear power generation cost of 7.2 yen/kWh includes 1.9 yen/kWh in capital cost, 0.6 yen/kWh in fuel
cost, 2.7 yen/kWh in operation and maintenance cost, 1.8 yen/kWh in backend cost and 0.3 yen/kWh in reactor
decommissioning cost. Nuclear power generation thus features a far cheaper fuel cost than thermal power generation.
Meanwhile, the backend cost makes great contributions to the overall nuclear power generation cost. According to the OECD’s
model-based cost estimation, the backend cost (covering transportation, storage and reprocessing of spent fuels, and waste
disposal) is calculated at 0.23 cent/kWh15). Given actual Japanese data, OECD’s estimate is interpreted as indicating an
underestimation. Most of the backend and decommissioning costs accumulated on an actual data basis are based on reserves
set aside by the companies for the future. We must recognize that these costs would be different from costs for actual
decommissioning of nuclear reactors and disposal of radioactive wastes. Therefore, a detailed analysis of backend and
decommissioning costs will become a very important challenge in the future.
Figure 3-1 Power Generation Costs by Source (FY2006-2010 average)
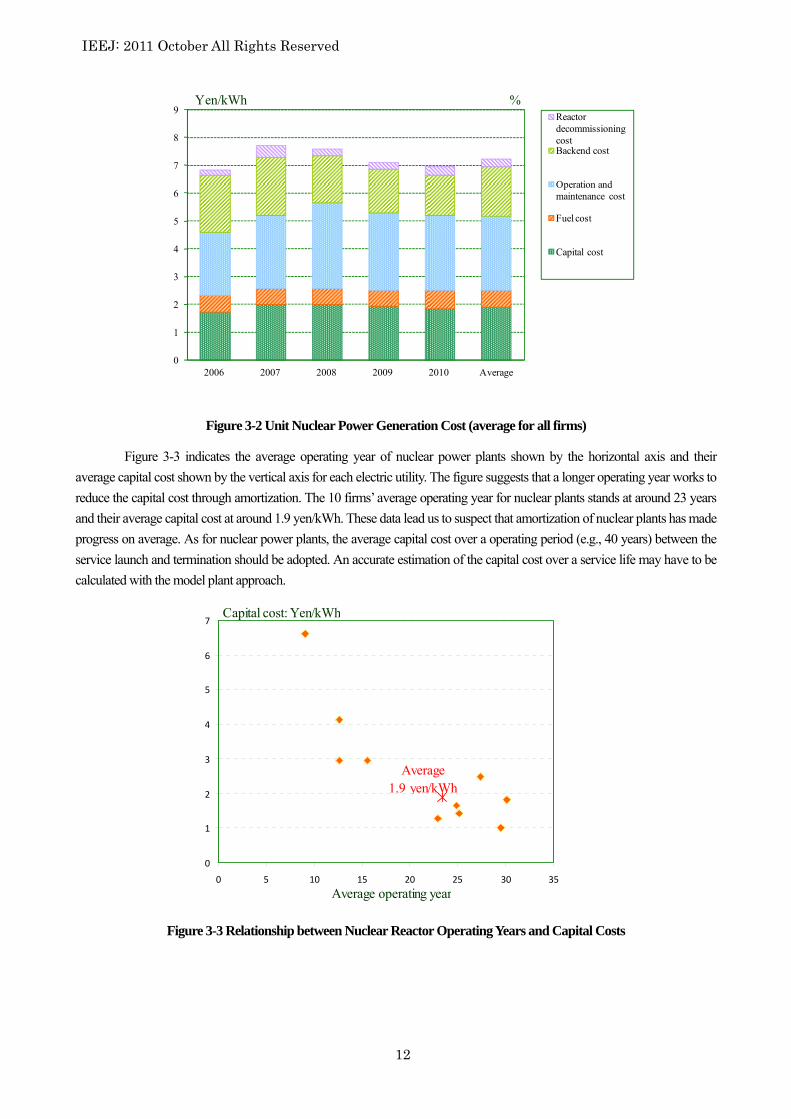
Figure 3-2 indicates time-series changes in the unit nuclear power generation cost (the average for 10 companies with
nuclear power generation facilities). The unit cost was lower when the capacity factor was relatively higher, and higher when it
was lower. On average, the unit cost remained stable around 7 yen/kWh, as shown by the figure.
0
2
4
6
8
10
12
Foss i l ‐fuel fi red Nuclear Geothermal etc.
Decommiss ioning cost
Backend cost
Operation and
maintenancecostFuel cost
Capi ta l cost
Yen/kWh
IEEJ: 2011 October All Rights Reserved
12
Figure 3-2 Unit Nuclear Power Generation Cost (average for all firms)
Figure 3-3 indicates the average operating year of nuclear power plants shown by the horizontal axis and their
average capital cost shown by the vertical axis for each electric utility. The figure suggests that a longer operating year works to
reduce the capital cost through amortization. The 10 firms’ average operating year for nuclear plants stands at around 23 years
and their average capital cost at around 1.9 yen/kWh. These data lead us to suspect that amortization of nuclear plants has made
progress on average. As for nuclear power plants, the average capital cost over a operating period (e.g., 40 years) between the
service launch and termination should be adopted. An accurate estimation of the capital cost over a service life may have to be
calculated with the model plant approach.
Figure 3-3 Relationship between Nuclear Reactor Operating Years and Capital Costs
0
1
2
3
4
5
6
7
8
9
2006 2007 2008 2009 2010 Average
Reactor decommissioning costBackend cost
Operation and maintenance cost
Fuel cost
Capital cost
Yen/kWh %
0
1
2
3
4
5
6
7
0 5 10 15 20 25 30 35
Capital cost: Yen/kWh
Average operating year
Average1.9 yen/kWh

IEEJ: 2011 October All Rights Reserved
13
Figure 3-4 indicates the trends of the unit thermal power generation cost (the average for 11 companies with thermal
power plants) along with those of the benchmark crude oil import price (on a C.I.F. basis)16) viewed as a main energy price
indicator in Japan. Thermal power generation cost fluctuations have almost been defined by fuel price changes that have been
linked to crude oil price fluctuations, as shown in the figure. In FY2008, the fuel cost accounted for 9.8 yen/kWh or 78% of the
total unit thermal power generation cost that reached 12.5 yen/kWh.
In this way, the unit thermal power generation cost has wildly fluctuated in line with primary energy price changes
amid crude oil price spikes since 2004. Although U.S. natural gas prices have fallen on sharp progress in shale gas
development over recent years, the U.S. change has failed to affect Japan where imported LNG prices have been linked to
crude oil prices. Meanwhile, primary energy prices are expected to continue an upward trend in the world as natural gas
demand continues a steep expansion over a long term in emerging countries such as China and India17)18)19)20). The unit thermal
power generation cost is estimated to rise to 14 yen/kWh if the benchmark crude oil price rises from $60.4/bbl in 2009 to
$115/bbl (in 2009 prices) in 2035 as forecast in the IEEJ outlook20), with other primary energy prices following suit. If carbon
dioxide emissions are priced in some form on progress in global warming measures, the emission cost may be included into the
thermal power generation cost. Given the above, any excessive dependence on thermal power generation is expected to post
great threats to national energy security.
Figure 3-4 Thermal Power Generation Cost (on average for all firms)
Figure 3-5 shows changes in the gap between the unit thermal and nuclear power generation costs. The average gap
over five years came to 3.0 yen/kWh. In FY2008 when crude oil prices soared, the gap widened to 4.9 yen/kWh. Even if the
pumped hydro power generation cost of 1.1 yen/kWh and the development and siting cost of 1.7 yen/kWh are included into
the unit nuclear power generation cost, the nuclear cost may be almost equal to the unit thermal power generation cost on a
five-year average basis and may slip far below the thermal cost upon fossil fuel price spikes.
0
20
40
60
80
100
120
140
0
2
4
6
8
10
12
14
2006 2007 2008 2009 2010 Average
Reactor decommissioning cost
Backend cost
Operation and maintenance cost
Fuel cost
Capital cost
Crude oil price (right axis)
Yen/kWh $/bbl

IEEJ: 2011 October All Rights Reserved
14
Figure 3-5 Gap between Thermal and Nuclear Power Generation Costs
Figure 3-6 outlines gaps between Oshima’s estimates (on a FY1970-2007 average basis) and authors’ estimates. The
Oshima-estimated thermal power generation cost is almost equal to authors’ estimate (on a FY2006-2010 basis) as the former
estimate covers data during the past oil crises while failing to reflect the recent crude oil spikes.
But the Oshima-estimated nuclear power generation cost differs far from authors’ estimate. The largest factor behind
the difference is the gap in the period for estimation. As described above, calculation on a FY1970-2007 average basis
overestimates unit nuclear power generating costs due to large fluctuations in interest rates and rates of return.
Oshima estimates the development cost at 1.3 yen/kWh, the siting cost at 0.5 yen/kWh and the pumped hydro power
generation cost at 1.2 yen/kWh on a FY2000-2007 basis as part of the total unit nuclear power generation cost. The difference
between the interest rate-using and rate of reutrn-using approaches is estimated to result in a gap of around 0.5 yen/kWh. The
total gap comes to 5 yen/kWh.
For the above-mentioned reasons, the inclusion of all pumped hydro power generation and development costs into
the unit nuclear power generation cost is expected to produce an overestimate. Meanwhile, the siting cost can provide useful
information for power generation’s load on the whole of Japanese society. If this is included, the unit nuclear power generation
cost comes to 7.7 yen/kWh.
0
1
2
3
4
5
6
2006 2007 2008 2009 2010 Average
Yen/kWh

IEEJ: 2011 October All Rights Reserved
15
Thermal Nuclear
Figure 3-6 Gaps between Oshima (2010) and authors’ Estimates
Figure 3-7 indicates the unit geothermal, etc. power generation cost. The unit cost came to 8.4 yen/kWh in FY2009
and 9.5 yen/kWh in FY2010, slipping below the thermal power generation cost. As indicated by Table 3-1, however, no new
geothermal power plants have been built since many such plants launched operations in the 1990s, indicating that the capital
cost might have been underestimated due to amortization. Anyway, the power generation cost of geothermal, etc. may have to
be estimated accurately after more data are collected in addition to those for FY2009 and 2010.
Figure 3-7 Geothermal etc. Power Generation Cost (average for all excluding J-Power)
0.5
1.2
0.5
1.7
1.2
0
2
4
6
8
10
12
14
Oshima (2010)
12.23 yen/kWh
Authors ' estimate
7.22 yen/kWh
Yen/kWh
0.3
0
2
4
6
8
10
12
14
Oshima (2010)
9.90 yen/kWh
Authors ' estimate
7.22 yen/kWh
Yen/kWh
Estimation period difference, Estimation approach difference, etc.
Estimation period difference
(2006~2010 → 1970~2007)
Estimation approach difference
Pumped hydro cost
Development cost
Siting cost
0
1
2
3
4
5
6
7
8
9
10
2006 2007 2008 2009 2010 Average
Reactor decommissioning costBackend cost
Operation and maintenance cost
Fuel cost
Capital cost
Yen/kWh

IEEJ: 2011 October All Rights Reserved
16
Table 3-1 Geothermal Power Plants of Tohoku and Kyushu Electric Power
Sources: Company websites
Figure 3-8 gives estimation results under the approach using the rate of return as outlined in Section 2-2. Small
differences between Oshima’s and authors’ estimates for FY2006 and 2007 are attributable to a gap in the coverage of electric
power generation companies. While Oshima’s estimates cover only nine general power utilities excluding Okinawa Electric
Power Co., authors’ estimates include J-Power for hydro power generation, Okinawa Electric Power and J-Power for thermal
power generation and Japan Atomic Power Co. for nuclear power generation.
Like earlier estimates, the estimation results indicate that the thermal power generation cost increased in line with
crude oil price spikes. Its gap with the nuclear power generation cost in FY2008 reached 4.5 yen/kWh. Even under this
approach, estimates based on corporate financial statements indicate that even if development and siting costs are included into
the nuclear power generation cost, the thermal power generation cost exceeds the nuclear cost upon fossil fuel price spikes.
Figure 3-8 Power Generation Cost Estimation Using the Rates of Return
(Oshima’s estimates for FY2000-2007 and authors’ estimates for FY2006-2010)
4. Comparison between Authors’ and Other Power Generation Cost Estimates As explained above, the power generation cost estimation approach using corporate financial statements, though
having some methodological problems, apparently provides useful information at least when thermal and nuclear power
generation costs are compared. Comparing authors’ estimates with others including the OECD’s estimates under a
representative approach using model plants, this chapter analyzes key points for estimating power generation costs.
Tohoku Electric Power Co. Kyushu Electric Power Co.
NameYear of
launchingMW Name
Year oflaunching
MW
Uenotai geothermal plant 1994 28.8 Otake power plant 1967 12.5Kakkonda geothermal plant unit 1 1978 50 Hatchobaru unit 1 1977 55Kakkonda geothermal plant unit 2 1996 30 Hatchobaru unit 2 1990 55Sumikawa geothermal plant 1995 50 Yamakawa power plant 1995 30Yanaizu Nishiyama geothermal plant 1993 65 Takigami power plant 1996 27.5
Ogiri power plant 1996 30
Total 223.8 Total 210
0
2
4
6
8
10
12
14
2000 2001 2002 2003 2004 2005 2006 2007 2008 2009 2010
Yen/kWh
Nuclear+Pumped hydro
Nuclear
Thermal
Hydro
Hydro(excluding pumped hydro)
IEEJ: 2011 October All Rights Reserved
17
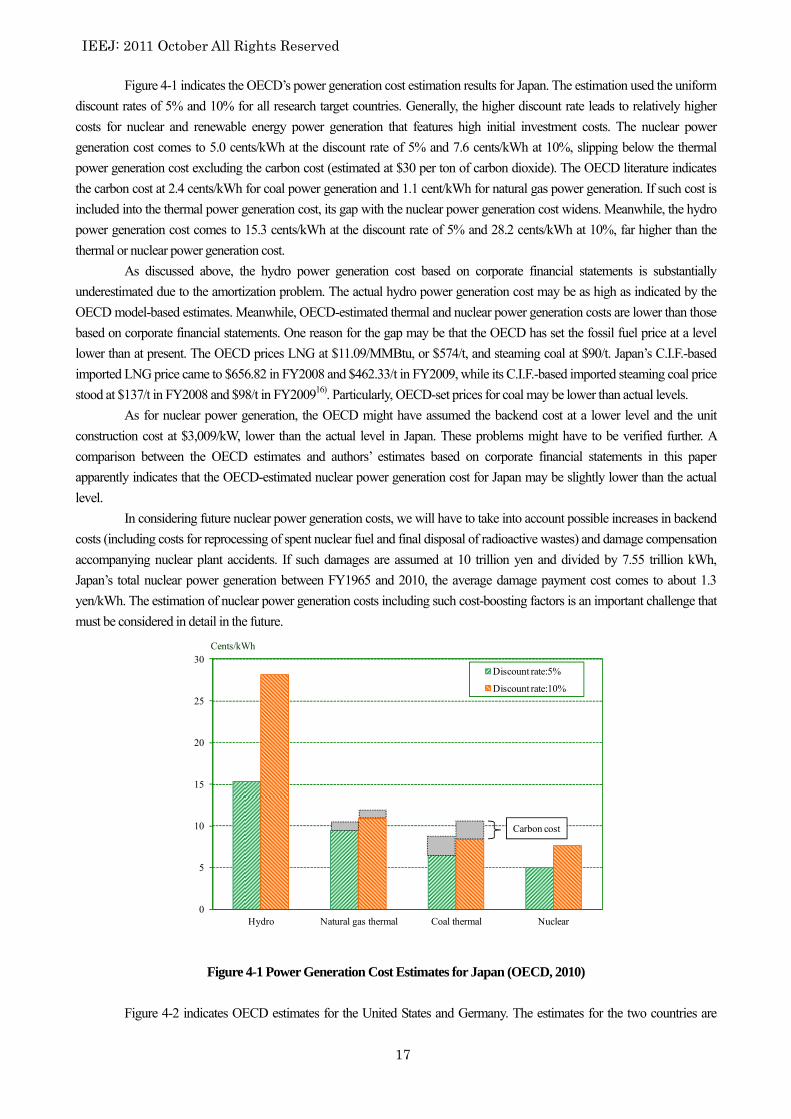
Figure 4-1 indicates the OECD’s power generation cost estimation results for Japan. The estimation used the uniform
discount rates of 5% and 10% for all research target countries. Generally, the higher discount rate leads to relatively higher
costs for nuclear and renewable energy power generation that features high initial investment costs. The nuclear power
generation cost comes to 5.0 cents/kWh at the discount rate of 5% and 7.6 cents/kWh at 10%, slipping below the thermal
power generation cost excluding the carbon cost (estimated at $30 per ton of carbon dioxide). The OECD literature indicates
the carbon cost at 2.4 cents/kWh for coal power generation and 1.1 cent/kWh for natural gas power generation. If such cost is
included into the thermal power generation cost, its gap with the nuclear power generation cost widens. Meanwhile, the hydro
power generation cost comes to 15.3 cents/kWh at the discount rate of 5% and 28.2 cents/kWh at 10%, far higher than the
thermal or nuclear power generation cost.
As discussed above, the hydro power generation cost based on corporate financial statements is substantially
underestimated due to the amortization problem. The actual hydro power generation cost may be as high as indicated by the
OECD model-based estimates. Meanwhile, OECD-estimated thermal and nuclear power generation costs are lower than those
based on corporate financial statements. One reason for the gap may be that the OECD has set the fossil fuel price at a level
lower than at present. The OECD prices LNG at $11.09/MMBtu, or $574/t, and steaming coal at $90/t. Japan’s C.I.F.-based
imported LNG price came to $656.82 in FY2008 and $462.33/t in FY2009, while its C.I.F.-based imported steaming coal price
stood at $137/t in FY2008 and $98/t in FY200916). Particularly, OECD-set prices for coal may be lower than actual levels.
As for nuclear power generation, the OECD might have assumed the backend cost at a lower level and the unit
construction cost at $3,009/kW, lower than the actual level in Japan. These problems might have to be verified further. A
comparison between the OECD estimates and authors’ estimates based on corporate financial statements in this paper
apparently indicates that the OECD-estimated nuclear power generation cost for Japan may be slightly lower than the actual
level.
In considering future nuclear power generation costs, we will have to take into account possible increases in backend
costs (including costs for reprocessing of spent nuclear fuel and final disposal of radioactive wastes) and damage compensation
accompanying nuclear plant accidents. If such damages are assumed at 10 trillion yen and divided by 7.55 trillion kWh,
Japan’s total nuclear power generation between FY1965 and 2010, the average damage payment cost comes to about 1.3
yen/kWh. The estimation of nuclear power generation costs including such cost-boosting factors is an important challenge that
must be considered in detail in the future.
Figure 4-1 Power Generation Cost Estimates for Japan (OECD, 2010)
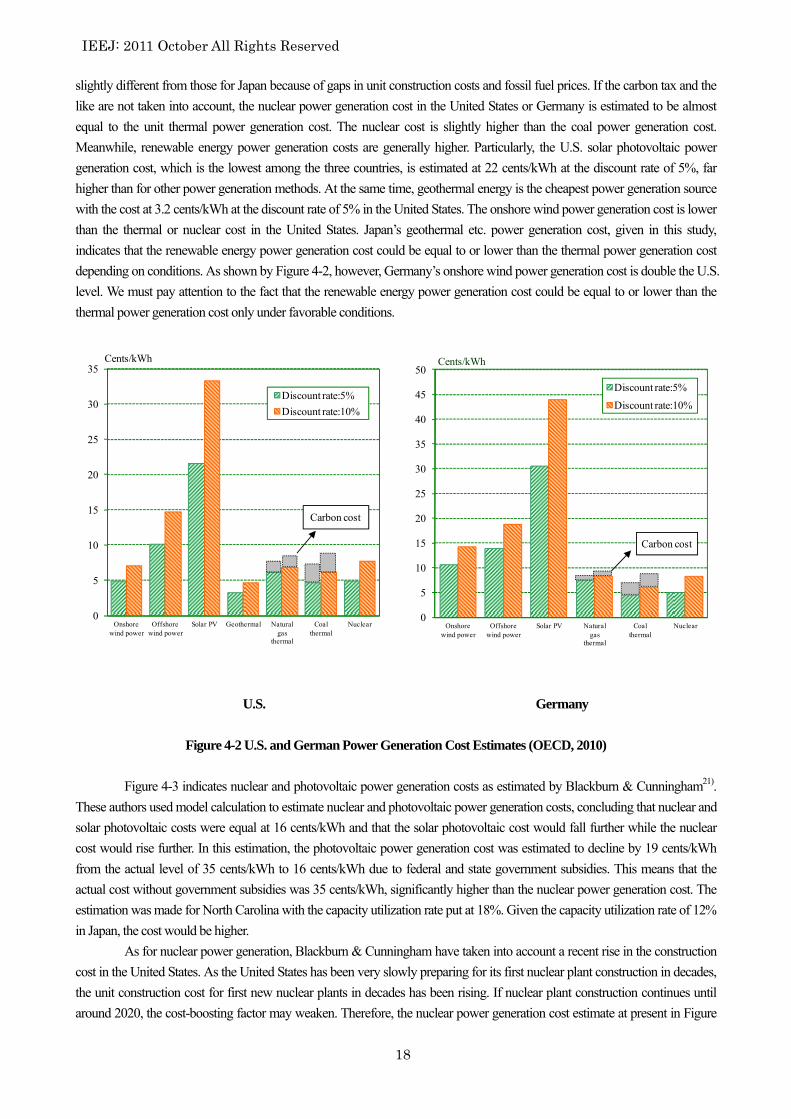
Figure 4-2 indicates OECD estimates for the United States and Germany. The estimates for the two countries are
0
5
10
15
20
25
30
Hydro Natural gas thermal Coal thermal Nuclear
Discount rate:5%
Discount rate:10%
Cents/kWh
Carbon cost
IEEJ: 2011 October All Rights Reserved
18
slightly different from those for Japan because of gaps in unit construction costs and fossil fuel prices. If the carbon tax and the
like are not taken into account, the nuclear power generation cost in the United States or Germany is estimated to be almost
equal to the unit thermal power generation cost. The nuclear cost is slightly higher than the coal power generation cost.
Meanwhile, renewable energy power generation costs are generally higher. Particularly, the U.S. solar photovoltaic power
generation cost, which is the lowest among the three countries, is estimated at 22 cents/kWh at the discount rate of 5%, far
higher than for other power generation methods. At the same time, geothermal energy is the cheapest power generation source
with the cost at 3.2 cents/kWh at the discount rate of 5% in the United States. The onshore wind power generation cost is lower
than the thermal or nuclear cost in the United States. Japan’s geothermal etc. power generation cost, given in this study,
indicates that the renewable energy power generation cost could be equal to or lower than the thermal power generation cost
depending on conditions. As shown by Figure 4-2, however, Germany’s onshore wind power generation cost is double the U.S.
level. We must pay attention to the fact that the renewable energy power generation cost could be equal to or lower than the
thermal power generation cost only under favorable conditions.
U.S. Germany
Figure 4-2 U.S. and German Power Generation Cost Estimates (OECD, 2010)
Figure 4-3 indicates nuclear and photovoltaic power generation costs as estimated by Blackburn & Cunningham21).
These authors used model calculation to estimate nuclear and photovoltaic power generation costs, concluding that nuclear and
solar photovoltaic costs were equal at 16 cents/kWh and that the solar photovoltaic cost would fall further while the nuclear
cost would rise further. In this estimation, the photovoltaic power generation cost was estimated to decline by 19 cents/kWh
from the actual level of 35 cents/kWh to 16 cents/kWh due to federal and state government subsidies. This means that the
actual cost without government subsidies was 35 cents/kWh, significantly higher than the nuclear power generation cost. The
estimation was made for North Carolina with the capacity utilization rate put at 18%. Given the capacity utilization rate of 12%
in Japan, the cost would be higher.
As for nuclear power generation, Blackburn & Cunningham have taken into account a recent rise in the construction
cost in the United States. As the United States has been very slowly preparing for its first nuclear plant construction in decades,
the unit construction cost for first new nuclear plants in decades has been rising. If nuclear plant construction continues until
around 2020, the cost-boosting factor may weaken. Therefore, the nuclear power generation cost estimate at present in Figure
0
5
10
15
20
25
30
35
40
45
50
Onshorewind power
Offshorewind power
Solar PV Naturalgas
thermal
Coalthermal
Nuclear
Discount rate:5%
Discount rate:10%
Cents/kWh
Carbon cost
0
5
10
15
20
25
30
35
Onshorewind power
Offshorewind power
Solar PV Geothermal Naturalgas
thermal
Coalthermal
Nuclear
Discount rate:5%
Discount rate:10%
Cents/kWh
Carbon cost

IEEJ: 2011 October All Rights Reserved
19
4-3 may be viewed as an overestimate over a long time. There may be little ground for projecting the nuclear power generation
cost to rise persistently from now on.
Figure 4-3 Estimated Photovoltaic and Nuclear Power Generation Costs
(Blackburn & Cunningham, 2010)
5. Conclusion This paper estimated thermal and nuclear power generation costs using corporate financial statements for the past five
years, while referring to past research approaches. Based on actual costs in these statements, we found that nuclear power
generation cost less than thermal power generation when fossil fuel prices soared. The actual data have demonstrated that while
thermal power generation is directly affected by fluctuations of the fuel cost accounting for more than 70% of the total cost,
nuclear power generation is invulnerable to fossil fuel price fluctuations.
Fossil fuel prices are expected to continue an upward trend over a long time as energy demand grows rapidly mainly
in Asian developing countries. In such case, the thermal power generation cost is expected to rise inevitably. Destabilization of
fossil fuel supply and wild fluctuations of fossil fuel prices may have to be considered from the viewpoint of energy security.
The thermal power generation cost is expected to rise further due to a carbon cost if global warming measures make progress.
(The OECD estimates the carbon cost at 2-3 cents/kWh for coal power generation and at 1 cent/kWh for natural gas power
generation.) Meanwhile, the fuel cost’s share of the total unit nuclear power generation cost is smaller. Uranium enrichment
service costs are unlikely to increase so much as new large uranium enrichment facilities are expected to become operational.
Even if natural uranium prices soar, therefore, its impact on the overall nuclear power generation cost may be relatively limited.
But such future cost-boosting factors as the enhancement of safety, damage payments accompanying nuclear accidents, and
decommissioning and backend cost increases cannot be estimated with the approach using corporate financial statements. They
can never be ignored. The Oshima-estimated nuclear power generation cost inappropriately includes all of pumped hydro
power generation, development and siting costs, resulting in an overestimate. But some (including the siting cost) of the
additional costs may be interpreted as representing necessary costs accompanying nuclear power generation. Their inclusion
could be appropriate depending on estimating approaches. Given all these problems, efforts should be continued to
comprehensively and accurately estimate power generation costs.
IEEJ: 2011 October All Rights Reserved
20
Bibliography 1) "The Strategic Energy Plan" decided on by Cabinet in June 2010
2) Subcommittee to Study Costs and Other Issues, Electricity Industry Committee, Advisory Committee for Natural
Resources and Energy, "Structure of Overall Backend Business Costs -- Analysis and Assessment of Profitability of Entire
Nuclear Power Generation Process" (2004)
3) University of Chicago, “The Economic Future of Nuclear Power” (2004)
4) Massachusetts Institute of Technology, “The Future of Nuclear Power” (2003)
5) Massachusetts Institute of Technology, “Update of the MIT 2003 Future of Nuclear Power” (2009)
6) US Congressional Budget Office, “Nuclear Power’s Role in Generating Electricity” (2008)
7) Matsuo Y., Y. Nagatomi and T. Murakami, “Economic Assessment of Nuclear Power Generation Based on U.S.
Congressional Budget Office Report,” IEEJ Website (2008)
8) Corporate financial statements of general and wholesale electricity utilities as submitted to EDINET
9) Kunitake, Norifumi, “An Analysis of Nuclear Power Generation Cost Structure in Japan – Economic Assessment Based
on Financial Statements of Nine Electric Power Companies,” Central Research Institute of Electric Power Industry
Research Report Y98003 (1999)
10) Kunitake N., K. Nagano and T. Suzuki, “Outlook on Future Nuclear Power Generation Cost Structure in Japan,” Central
Research Institute of Electric Power Industry Research Report Y98019 (1999)
11) Murota, Takeshi, “History and Present State of Charge System under Electricity Monopoly in Japan – Including
Estimation of Nine Electric Power Companies’ Unit Power Generation Cost by Source in FY1970-1989,” Keizaigaku
Kenkyu (Economics Research) No. 32, pp.75-159 (1991)
12) Murota, Takeshi, “Economics of Electricity Industry Deregulation,” Takarajimasha Inc. (2010)
13) Oshima, Kenichi, “Political Economics of Renewable Energy,” Toyo Keizai Inc. (2010)
14) Electric Power Civil Engineering Association, “Hydro Power Plant Database”
15) OECD/IEA, “Projected Costs of Generating Electricity 2010 Edition” (2010)
16) IEEJ Energy Data and Modeling Center, “Handbook of Energy & Economic Statistics in Japan 2011,” Energy
Conservation Center, Japan (2011)
17) IEA, “World Energy Outlook 2010” (2010)
18) U.S. Department of Energy, “International Energy Outlook 2010” (2010)
19) OPEC, “World Oil Outlook 2010” (2010)
20) IEEJ, “Asia/World Energy Outlook 2010”(2010)
21) J. O. Blackburn & S. Cunningham, “Solar and Nuclear Costs – The Historic Crossover”, NC WARN (2010)
Contact: [email protected]