treasurer’s annual report and a possible slide into recession. on the positive side, low interest...
TRANSCRIPT

Treasurer’s Annual ReportOne hundred and thirty-fourth fiscal year
University of California • 2001-2002

PAGE 1
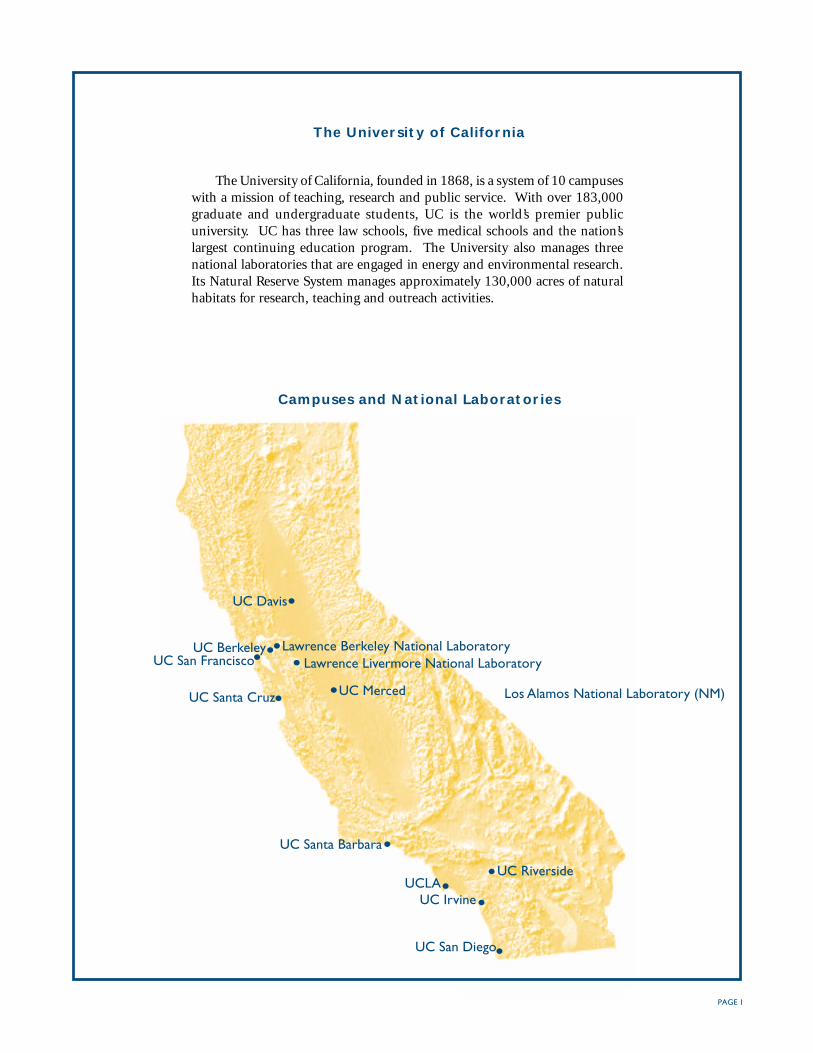
Campuses and National Laboratories
The University of California
The University of California, founded in 1868, is a system of 10 campuseswith a mission of teaching, research and public service. With over 183,000graduate and undergraduate students, UC is the world’s premier publicuniversity. UC has three law schools, five medical schools and the nation’slargest continuing education program. The University also manages threenational laboratories that are engaged in energy and environmental research.Its Natural Reserve System manages approximately 130,000 acres of naturalhabitats for research, teaching and outreach activities.
UC Davis
UC BerkeleyUC San Francisco
Lawrence Berkeley National LaboratoryLawrence Livermore National Laboratory
Los Alamos National Laboratory (NM)UC MercedUC Santa Cruz
UC Santa Barbara
UCLAUC Riverside
UC Irvine
UC San Diego

PAGE 2
The Regents of the University of California
The University of California is governed by The Regents, a 26-member board, as established underArticle IX, Section 9 of the California Constitution. The Treasurer of The Regents is responsible for managingthe investments and cash for the University of California System. The Treasurer’s Office carries out theseactivities under the policies established by the Investment Committee of The Regents of the University ofCalifornia.
OFFICERS OF THE REGENTS The Honorable Gray Davis, President
John J. Moores, Chairperson
Odessa P. Johnson, Vice Chairperson
James E. Holst, General Counsel and Vice President for Legal Affairs
Leigh Trivette, Secretary
David H. Russ, Treasurer and Vice President for Investments
EX OFFICIO REGENTS The Honorable Gray Davis, Governor of California
Cruz M. Bustamante, Lieutenant Governor
Herb Wesson, Jr., Speaker of the Assembly
Delaine Eastin, State Superintendent of Public Instruction
Jeffrey A. Seymour, President of the Alumni Associations of the University of California
Robert C. Morrison, Vice President of the Alumni Associations of the University of California
Richard C. Atkinson, President of the University of California
APPOINTED REGENTS Richard C. Blum George M. MarcusWard Connerly Velma MontoyaJohn G. Davies John J. MooresJudith L. Hopkinson Gerald L. ParskyOdessa P. Johnson Norman J. PattizJoanne C. Kozberg Peter PreussSherry L. Lansing Haim SabanDavid S. Lee Tom SaylesMonica C. Lozano Tracy M. Davis, Student Regent
FACULTY REPRESENTATIVES Chand R. Viswanathan Gayle N. Binion
REGENTS-DESIGNATE Fred Sainick Alfredo TerrazasDexter Ligot-Gordon
COMMITTEE ON INVESTMENTS Judith L. Hopkinson, Chairperson Delaine EastinGerald L. Parsky, Vice Chairperson Sherry L. LansingRichard C. Blum David S. LeeJohn G. Davies Norman J. PattizTracy M. Davis Haim Saban
Ex Officio Members:
The Honorable Gray Davis Richard C. AtkinsonJohn J. MooresAdvisory Member:
Dexter Ligot-Gordon

PAGE 3
Treasurer’s Annual Report Fiscal 2001-2002
Established in 1933, The Office of the Treasurer of The Regents has had along and successful history of managing the University’s pension andendowment funds. These investments provide substantial benefits to currentand retired employees and support the University’s mission of education,research and public service. The Treasurer’s Office currently manages a portfolioof retirement and endowment funds totaling $51 billion.
The Treasurer’s Annual Report
Message from the Treasurer 4
The Office of the Treasurer 6
Investment Management Overview 8
The Regents’ Endowment Funds
General Endowment Pool 10
Other Endowment Funds 16
High Income Endowment Pool 18
Short Term Investment Pool
Short Term Investment Pool 22
University of California Retirement System
Retirement Plan 24
Defined Contribution Funds 30
Investment Operations
Investment Operations 34

PAGE 4
The Treasurer’s Annual ReportUniversity of California Treasurer of the Regents
FISCAL YEAR 2002 IN REVIEW
As the technology and telecommunicationsspending bubble of the late 1990s continued tounwind, investor confidence was further rockedby the September 11 terrorist attacks and severalhigh-profile corporate accounting scandals andbankruptcies.
In the first quarter of calendar 2002, the U.S.economy staged a recovery from the mild recessionof 2001, achieving 5% real growth measured bygross domestic product. This GDP growth causedinvestors to question the apparent “disconnect”between the real economy and equity marketperformance. However, economic growth slowedprecipitously in the second quarter, downgradingcorporate earnings prospects and negativelyimpacting the equity market.
In the fiscal year, the Russell 3000 TobaccoFree Index declined 17.4%, NASDAQ 32.3%,S&P 500 18.0% and the Dow Jones IndustrialAverage 10.3%. Large capitalization stocks wereparticularly hard hit. Small and mid-capitalizationstocks outperformed the broad market indices.
The major foreign markets, represented bythe Morgan Stanley Capital International AllCountry World ex U.S. Index and Morgan StanleyCapital International Europe, Australia, and FarEast Index, declined 8.2% and 9.2% respectively.
Private Equity market returns were similar topublic equities as opposed to the severeunderperformance experienced last year. Newprivate equity investing slowed dramaticallyacross the industry, with several partnershipsreturning uninvested funds and reducing the feesto their limited partners.
In the fiscal year, the Federal Reserve loweredinterest rates from 3.75% to 1.75%, impactingthe short end of the yield curve. Overall, bondsprovided positive returns, for as interest rates fell,prices rose.
MESSAGE FROM THE TREASURER
The past fiscal year brought us many portfoliomanagement challenges. As discussed in the previouscolumn, the United States and International equitymarkets experienced further declines in value. At thistime, equity markets have reached 6-year lows. Thelargest risks to our investment portfolios are uncertainglobal markets, rising budget deficits at all levels ofgovernment, and a possible slide into recession. On thepositive side, low interest rates are promoting mortgagerefinancing, corporations are reducing debt, and equityvaluations have been severely reduced to reasonablelevels.
The U.S. bond markets produced relatively largetotal returns as the low interest rates that we are nowexperiencing raised the price on all outstanding bonds.These gains could be reversed if interest rates orinflation rises in the future.
Corporate accounting scandals rocked the U.S.equity market. The Regents’ investment portfolios weredirectly affected by the Enron and WorldCombankruptcies that were the result of alleged accountingfraud by the firms and their accountants. While UC’slosses were significant dollar amounts, they representeda small percentage of funds under management and didnot impact our ability to meet obligations.
Following action by The Regents to authorize anapplication for lead plaintiff status in the Enronlitigation, the University was designated as such by thefederal court in Houston. A first step in the process ofrecovery was a $40 million settlement with ArthurAndersen International on behalf of the total class ofdefrauded Enron investors.
At the May 2002 Regents’ meeting, The Regentsapproved the addition of Treasury Inflation ProtectedSecurities (TIPS) as a separate asset class in the U.C.Retirement System defined benefit portfolio. TIPS
PAGE 5
increase in value as inflation, as measured by theConsumer Price Inflation (CPI - seasonally notadjusted), increases. This action by The Regentsdedicated 5% of the defined benefit portfolio to TIPS,while reducing the overall risk of the portfolio. Theallocation was shifted from regular coupon bonds toTIPS and was completed as of fiscal year end.
The Regents approved changes to the GeneralEndowment Pool (GEP) asset allocation at the May2002 meeting. The new asset allocation for the GEPreduced the exposure to U.S. Equity from 53% to 45%,increased International Equity from 7% to 10%,doubled Private Equity from 5% to 10%, and decreasedFixed Income from 35% to 30%. The changes to theendowment portfolio also included the addition of anew asset class: Absolute Return Strategies (ABS) withan allocation of 5%. ABS include market neutral, long/short equities, merger arbitrage, and other investmentmethods that attempt to reduce risk while preservingcapital. We plan to have begun implementation of thenew asset allocation for the GEP by calendar year end.Due to the nature of the investing cycle for PrivateEquity, the increase to Private Equity will take placeover a three to five year period as we makecommitments to new funds and existing relationships.
The Treasurer’s Office added new personnel inseveral key areas during the year. These new positionsinclude: Manager of Communications to interface withour clients and the HR/Benefits group, Director ofInvestment Risk Management to control, measure andreport on investment portfolio risks, Managing Director– Alternative Investments to manage the Private Equity(Venture Capital and Buy-out Funds), and a MiddleOffice administrator to improve the flow of informationfrom the securities trading operation to the essentialinvestment accounting group and custodial bank.
Sincerely,
David H. RussTreasurer and Vice President For InvestmentsOctober 2002
The Treasurer’s Office alsoimplemented severalenhancements to itsoperational and analyticsareas such as riskmanagement software andperformance evaluationtools.
The Treasurer’s Office created four new low-costpooled investment options for the U.C. CampusFoundations and affiliated groups: Russell 3000Tobacco Free Index, Morgan Stanley CapitalInternational (MSCI) Europe Asia Far East (EAFE)Tobacco Free Index, Lehman Brothers Aggregate BondIndex and the UC Vintage Year Private Equity Funds.These options permit the Foundations to alter their assetallocations to fit their institutional risk tolerance andportfolio expected risk and return parameters. Theindex fund options are available now. The UC VintageYear Private Equity Funds will be available early nextyear.
Looking ahead, the Treasurer’s Office will focus onimplementation of asset allocation changes for GEP,which includes the recent hiring of a Director ofAbsolute Return Strategies. We will continue to research,identify, refine and manage specialized asset classes.
I am pleased to serve The Regents, faculty, staff andstudents of the University of California. Please visit ourwebsite for timely announcements and quarterlyportfolio performance reporting at www.ucop.edu/treasurer/.
PAGE 6
The Treasurer’s Annual ReportUniversity of California Treasurer of the Regents
DAVID H. RUSS, MA – Treasurer and Vice President for InvestmentsMr. Russ is responsible for overseeing the University of California investment portfolio. Mr. Russ brings over 16 years
of investment management experience to the Treasurer’s Office. Prior to joining the Treasurer’s Office in 2001, Mr. Russserved as Managing Director-Public Equity for the University of Texas Investment Management Company. Mr. Russ alsoserved as the Director of Investment Management and Portfolio Manager for Pacific Telesis Group (now SBCCommunications); and as Senior Portfolio Manager for the Stanford Management Company. Mr. Russ received his Masterof Administration in Finance and Accounting from the University of California, Davis and his BA degree in Genetics fromthe University of California, Berkeley.
MELVIN L. STANTON, MBA – The Assistant TreasurerMr. Stanton, along with the Treasurer, is responsible for the overall management of the Treasurer’s Office. Prior to
joining the Treasurer’s Office in 1989, Mr. Stanton had more than 25 years experience as a financial executive in portfoliomanagement and securities trading, including Director of Sales for Midland Montagu Securities, Inc., San Francisco; FirstVice President and Manager with Crocker National Bank, San Francisco; and Vice President and Regional Sales Managerwith Bankers Trust Company, Los Angeles. Mr. Stanton received his MBA and BS degrees from California State University,Northridge.
JEFFREY E. HEIL, CFA – Managing Director – Public EquityMr. Heil is responsible for the strategic focus and management of the public equity portfolio. He began his career as an
Investment Analyst with Arnold Bernhard and Company, Inc. Prior to joining the Treasurer’s Office in 1997, Mr. Heil wasVice President of Equity Research for Key Asset Management, Cleveland; Corporate Finance Consultant with McKinsey &Company, Cleveland; and Investment Banker for Asset Growth Partners, New York. Mr. Heil received his MBA degree inFinance from New York University and his BA degree in Government from Ohio University. Mr. Heil holds the CFAdesignation.
RANDOLPH E. WEDDING, MBA – Managing Director – Fixed IncomeMr. Wedding is responsible for the strategic focus and management of the long- and short-term fixed-income
portfolios. Prior to joining the Treasurer’s Office in 1998, Mr. Wedding was Manager of Currency Options and DerivativesTrading for Bank of America, NT&SA, New York; Managing Director, Commodities and Derivative Sales for Bear Stearns& Co., New York; and Principal, Manager of Fixed-Income Derivative Sales for Morgan Stanley & Co., New York. Mr.Wedding began his career with Wells Fargo Bank, responsible for the Bank’s Fixed Income Portfolio. Mr. Wedding earnedhis MBA in Finance from the University of California, Berkeley and BA in Mathematics from the University of California,San Diego.
MARIE N. BERGGREN, MS – Managing Director – Alternative InvestmentsMs. Berggren is responsible for the private equity portfolio, venture capital and buy-out investments. Prior to joining
the Treasurer’s Office in 2002, Ms. Berggren was Executive Vice President/Department Head of Venture CapitalInvestments for Bank One Corporation. While employed at Bank One and its predecessor organization, First ChicagoInvestment Advisors, Ms. Berggren held the titles of Director of Research, Managing Director of Equities, Senior VicePresident/Department Head for Corporate Mergers and Acquisitions, and Vice President – Corporate Strategy. Ms.Berggren earned her MS in Management from Stanford University Graduate School of Business, and a BA in Economicsfrom the College of New Rochelle.
PAGE 7
INVESTMENT MANAGEMENT
PUBLIC EQUITY INVESTMENTS years exp. years with UC
James Cottle, CFA, MBA Investment Officer Technology-Software & Services Sector 35 17Gary DeWeese, MAI, MBA Investment Officer Real Estate and Capital Goods Sector 29 28Alison Shimada, MBA Investment Officer Health Care Sector 13 3David Stewart, CFA, MBA Investment Officer Technology-Hardware Sector 11 3Arild Holm, CFA, MBA Investment Officer Energy Sector 8 2Sandra Salas, MBA Investment Officer Consumer Sector 6 1Jeremy Berk, CFA, BS Investment Analyst Financial Services Sector 6 4Ingrid Yang, MBA Research Associate Investment Research 3 1Thalia Murray, BA Research Assistant Research/Administrative Support 3 2
ALTERNATIVE INVESTMENTS years exp. years with UC
Neetesh Kumar, MBA, MS Investment Officer Private Equity Investments 9 -Leslie Watson, BA Research Assistant Private Equity Investments 1 7
FIXED INCOME INVESTMENTS years exp. years with UC
David Schroeder, BA Senior Portfolio Manager, Long-Term Securities, Gov’ts. 22 -Satish Swamy, CFA, MBA Senior Portfolio Manager, Long-Term Securities, MBS 10 4Alice Yee, MBA Senior Portfolio Manager, Short-Term Securities 26 22Kim Evans, MBA Head of Credit Analysis 18 12Omar Sanders, MBA Credit Analyst 7 1Aaron Staines, BA Research Assistant 1 1
RISK MANAGEMENT/ANALYTICS years exp. years with UC
Jesse Phillips, CFA, MBA, MA Director of Investment Risk Management 10 -Jenny Shen, CPA, MA Quantitative Analytics Manager 7 2
TRADING years exp. years with UC
Linda Fried, BA Head of Trading 28 20Matthew Scoble, CFA, BS Equity Trading 7 3
INVESTMENT SERVICES
OPERATIONS
Robert Yastishak, Director Paula Ferreira, Supervisor Jan Kehoe, Assistant Director Marjan ShomaliOfelia Abaya Floyd Gazaway, Jr. Khaleelah Muhammad Michael StrachAngelica Beckman Brian Hagland Edward Quave Allen Woo
INFORMATION SYSTEMS
Michael Comstock Michael John
COMMUNICATIONS
Susan Rossi, Manager Alison Johnson
PROJECT MANAGEMENT
Nelson Chiu, Manager Jennifer Lipscomb
ADMINISTRATIVE STAFF
Gayle Tapscott, Manager Elizabeth Agbayani Anita Gridley Barbaretta MorrisGay Adams Claudia Green Joyce Lewis

PAGE 8
The Treasurer’s Annual ReportUniversity of California Treasurer of the Regents
Portfolio
Portfolio ConstructionDetermine/Adjust Industry
& Security Weights
EquityWeekly Review of Portfolio:
Equity Managers
Fixed IncomeBiweekly Review of Portfolio:
Fixed Income Managers
Asset Allocation/RebalancingWeekly Review of Asset Allocation:Portfolio Management Committee
Monthly Review of Portfolio:Industry & Stock Review
Committee
INVESTMENT MANAGEMENT OVERVIEW
The investment funds managed by the Treasurer of theRegents consist of the University’s retirement, definedcontribution and endowment funds, as well as the system’scash assets. At June 30, 2002, the Treasurer’s Officemanaged $51.0 billion in total assets as outlined below.
TOTAL FUNDS UNDER MANAGEMENTJune 30, 2002($ in billions)
UC Retirement Plan (UCRP) $34.3
DC Funds 6.3
Endowment Funds 4.6
Short Term Investment Pool (STIP)1 5.8
Total Funds $51.0
The Treasurer’s investment management staff includes26 investment professionals with an average of 15 years ofinvestment experience. The Treasurer’s Office strengths asan investment manager include:
Long-term investment focusGlobal tactical approach to investingConsistent investment philosophy and investing styleOriginal, in-depth researchAccess to corporate managements and globalfinancial researchStreamlined decision-makingExperienced investment teamSignificantly lower cost
INVESTMENT OBJECTIVES & PHILOSOPHY
The investment objective for all funds undermanagement is to maximize long-term total real returns(adjusted for inflation) while assuming appropriate levelsof risk. Because the purpose of each fund is unique, TheRegents has established specific objectives for each fund,along with the overall goal of exceeding the median returnof our peer institutions and the rate of inflation.
Retirement Funds Objective: For UCRP, produce a realreturn to meet obligations to beneficiaries and to meet orexceed the actuarial rate of return. For University-Managed Defined Contribution Funds, meet statedinvestment objectives for each fund.
Endowed Funds Objective: Produce a real returnsufficient to meet the needs of the endowed projects, and
1 The Short Term Investment Pool excludes the cash invested for, and reported as partof the UCRP, DC and Endowment funds.
generate growth of principal and a growing payout streamto ensure that future funding for endowment-supportedactivities can be maintained in perpetuity.
ASSET ALLOCATION
Asset allocation is the primary determinant of long-term investment returns. UC funds are diversified amongglobal equities and fixed-income securities, within aRegental target allocation (see pages 11, 25 and 30.)Historically, portfolio asset allocation has favored equityinvestments over fixed-income securities due to theexpectation thatequities willprovide higher totalreturns over the longterm. This emphasis onequity investing hasresulted in substantialgrowth in both the endowmentand retirement funds managedon behalf of The Regents.
The Portfolio ManagementCommittee meets weekly to review asset allocation andother portfolio issues. Asset allocation rebalancing isrequired when an asset class falls below the allowablerange. The Committee decides on the timing and extentof the rebalancing, within The Regents’ policy, based onmarket conditions.
PUBLIC EQUITY INVESTING
The Regents’ public equity investment strategy utilizesboth active and passive management. In its active equityinvestment process, the Treasurer’s Office focuses on avalue-oriented, long-term approach to growth-stockinvesting. This means using a “top-down” theme orientedapproach to find attractive industry segments, followed bya “bottom-up” stock selection process to find qualitybusinesses with good management and robust cash flow.The results are portfolios of stocks that are believed to beselling at a discount to their future value, as well as fittingwithin equity and portfolio guidelines.
The Equity Managers meet weekly to review theportfolio, including new buy and sell recommendations,and an Industry Weighting Committee meets monthly. Selldecisions are made when a security has reached avaluation level beyond that supported by the fundamentaloutlook for the company, or when the fundamentalsthemselves have changed or deteriorated.

PAGE 9
FIXED INCOME INVESTING
Within the overall goal of maximizing total returnover a long-term horizon, the Treasurer’s Office Fixed In-come team focuses on safety of principal, liquidity, creditquality, and efficient use of risk. They use a “top-down”approach to sector and country selection by analyzingmacroeconomic factors, business cycle, monetary and fis-cal policy, and political stability combined with a “bottom-up” approach to security selection within sectors or coun-tries by analyzing financial strength, quality of manage-ment, position within the industry and credit rating forindividual investments. Analysts also monitor market con-ditions to take advantage of short-term supply/demandinequalities and temporary changes in the yield curve. TheFixed Income Managers meet weekly to review the portfo-lio.
PRIVATE EQUITY INVESTING
The Regents include private equity investments suchas venture capital and buyouts in their overall asset alloca-tion to increase portfolio diversification and reduce riskdue to its low correlation with other asset classes. Addingto its attraction, return expectations for private equity aregenerally at least 300 basis points greater than those of thepublic equity markets.
Manager selection is key to this asset class and theTreasurer’s Office’s team has a strong competitive advan-tage and highly distinctive strategies. The team is seen as asophisticated, long-term investor in the private equity are-na, achieving well above average returns over the past 20-plus years. The office has long standing relationships withmany top-tier private equity groups and continues to build
new relationships with premier firms not accessible tomost institutions. The objective is to build a well-diversi-fied portfolio of top tier U.S. partnerships. The Treasurer’sOffice Alternative Investments team reviews and recom-mends private equity investments along with a private eq-uity consultant.
Post-investment monitoring, including investmentdocumentations, interim valuations, and regular meetingswith general partners, bolster the integrity of the invest-ment program.
RISK MANAGEMENT
The primary objective of the Risk Management functionis to ensure that the Treasurer’s Office investment and opera-tional activities do not expose the University to potential orunexpected losses beyond the Regents’ risk tolerance levels.This involves identifying risks and setting bounds for possiblelosses; implementing policies, guidelines and controls; andintegrating risk monitoring, measurement, and analysis intoall aspects of the investment process.
At the portfolio level, various aspects of risk, both quan-titative and qualitative, are monitored to ensure that risk lev-els are proportionate to return expectations, and that risk istaken intentionally and diversified optimally. At the plan lev-el, risk management focuses on how the volatility of assetsimpacts the ability to pay promised benefits or supportspending policies. In addition to measuring risk exposures,scenario analysis, stress testing key assumptions, and optimi-zation of risk and expected return are key components of therisk management process.
Risk exposures are continually monitored, comparedto targets, and altered when appropriate.
Treasurer andVice President for
Investments
The Regents of TheUniversity of CaliforniaPresident of The
University of California
UC RegentsCommittee on
Investments
UC RegentsInvestment
Advisory Committee
Senior Vice Presidentfor Business & Finance
Investment Management
Fixed Income AlternativeInvestments
Public EquityInvestment RiskManagement
Investment MattersAdministrative Matters
University of CaliforniaOffice of the TreasurerOrganizational Chart
Investment Services
CommunicationsFunction
Process, Budget,Policy & Control
Functions
OfficeAdministration
Function
InformationSystemsFunction
OperationsFunction
PAGE 10
General Endowment Pool (GEP)
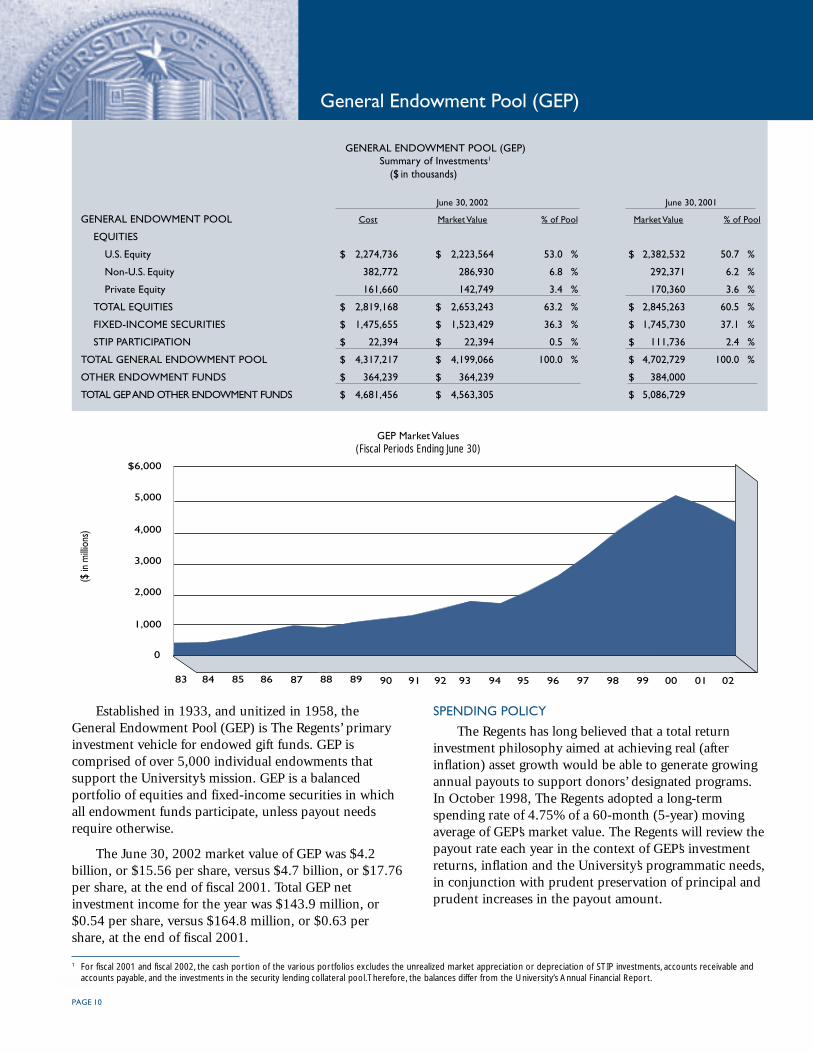
GENERAL ENDOWMENT POOL (GEP)Summary of Investments1
($ in thousands)
June 30, 2002 June 30, 2001
GENERAL ENDOWMENT POOL Cost Market Value % of Pool Market Value % of Pool
EQUITIES
U.S. Equity $ 2,274,736 $ 2,223,564 53.0 % $ 2,382,532 50.7 %
Non-U.S. Equity 382,772 286,930 6.8 % 292,371 6.2 %
Private Equity 161,660 142,749 3.4 % 170,360 3.6 %
TOTAL EQUITIES $ 2,819,168 $ 2,653,243 63.2 % $ 2,845,263 60.5 %
FIXED-INCOME SECURITIES $ 1,475,655 $ 1,523,429 36.3 % $ 1,745,730 37.1 %
STIP PARTICIPATION $ 22,394 $ 22,394 0.5 % $ 111,736 2.4 %
TOTAL GENERAL ENDOWMENT POOL $ 4,317,217 $ 4,199,066 100.0 % $ 4,702,729 100.0 %
OTHER ENDOWMENT FUNDS $ 364,239 $ 364,239 $ 384,000
TOTAL GEP AND OTHER ENDOWMENT FUNDS $ 4,681,456 $ 4,563,305 $ 5,086,729
Established in 1933, and unitized in 1958, theGeneral Endowment Pool (GEP) is The Regents’ primaryinvestment vehicle for endowed gift funds. GEP iscomprised of over 5,000 individual endowments thatsupport the University’s mission. GEP is a balancedportfolio of equities and fixed-income securities in whichall endowment funds participate, unless payout needsrequire otherwise.
The June 30, 2002 market value of GEP was $4.2billion, or $15.56 per share, versus $4.7 billion, or $17.76per share, at the end of fiscal 2001. Total GEP netinvestment income for the year was $143.9 million, or$0.54 per share, versus $164.8 million, or $0.63 pershare, at the end of fiscal 2001.
SPENDING POLICY
The Regents has long believed that a total returninvestment philosophy aimed at achieving real (afterinflation) asset growth would be able to generate growingannual payouts to support donors’ designated programs.In October 1998, The Regents adopted a long-termspending rate of 4.75% of a 60-month (5-year) movingaverage of GEP’s market value. The Regents will review thepayout rate each year in the context of GEP’s investmentreturns, inflation and the University’s programmatic needs,in conjunction with prudent preservation of principal andprudent increases in the payout amount.
GEP Market Values(Fiscal Periods Ending June 30)
1 For fiscal 2001 and fiscal 2002, the cash portion of the various portfolios excludes the unrealized market appreciation or depreciation of STIP investments, accounts receivable andaccounts payable, and the investments in the security lending collateral pool. Therefore, the balances differ from the University’s Annual Financial Report.
0
1,000
2,000
3,000
4,000
5,000
$6,000
83 84 85 86 87 88 89 90 91 92 93 94 95 96 97 98 99 00 01 02
($ in
milli
ons)
PAGE 11
For Private Equity, the Treasurer’s Office seeksopportunities through recognized top-tier venture capitalpartnerships and select buyout funds.
For Fixed-Income investments, the Treasurer’s Officeanalyzes relative value among the core benchmark sectorsof Governments, Corporates, and Mortgage-backedsecurities and overweights those sectors and securitiesoffering attractive real returns, while maintaining a risklevel commensurate with the benchmark index.
RETURNS
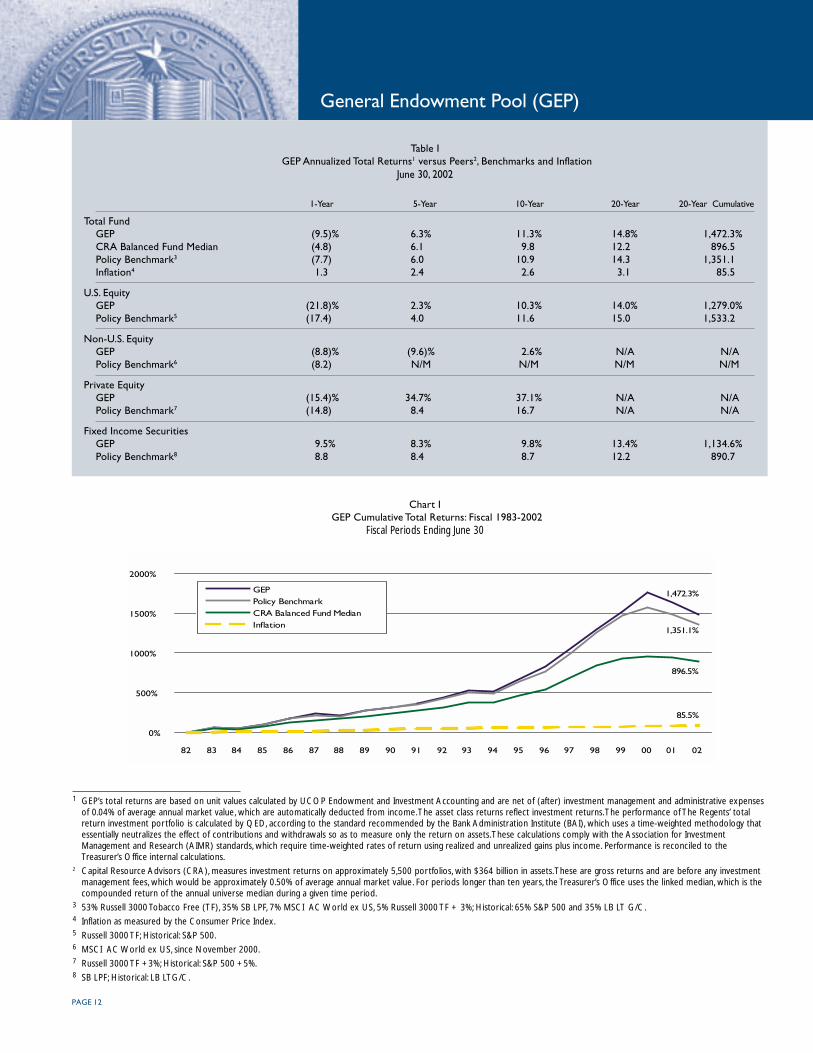
Throughout the years, GEP has exceeded its fundobjectives. As illustrated in Table I on page 12, GEP hasalso consistently performed well vs. its peers and policybenchmarks. GEP’s total return of (9.5%) for the fiscalyear was impacted by weak global equity markets, and thenegative environment for large cap growth stocks inparticular. For the past 20 years, however, GEP’scompound annual total return was a strong 14.8% vs.12.2% for the CRA Median1 and 14.3% for itsbenchmark. During that time, payout distributions grewat an average annual rate of 7.8%—well aboveannualized inflation of 3.1%.
Chart I on page 12 illustrates the cumulative total returnsfor GEP for the past 20 years relative to the policybenchmark, CRA Balanced Fund Median, and inflation. TableII on page 14 provides a detailed illustration of theperformance of an endowed gift to GEP for the past 20 years.GEP’s five-year average annual turnover rate was 20.6%
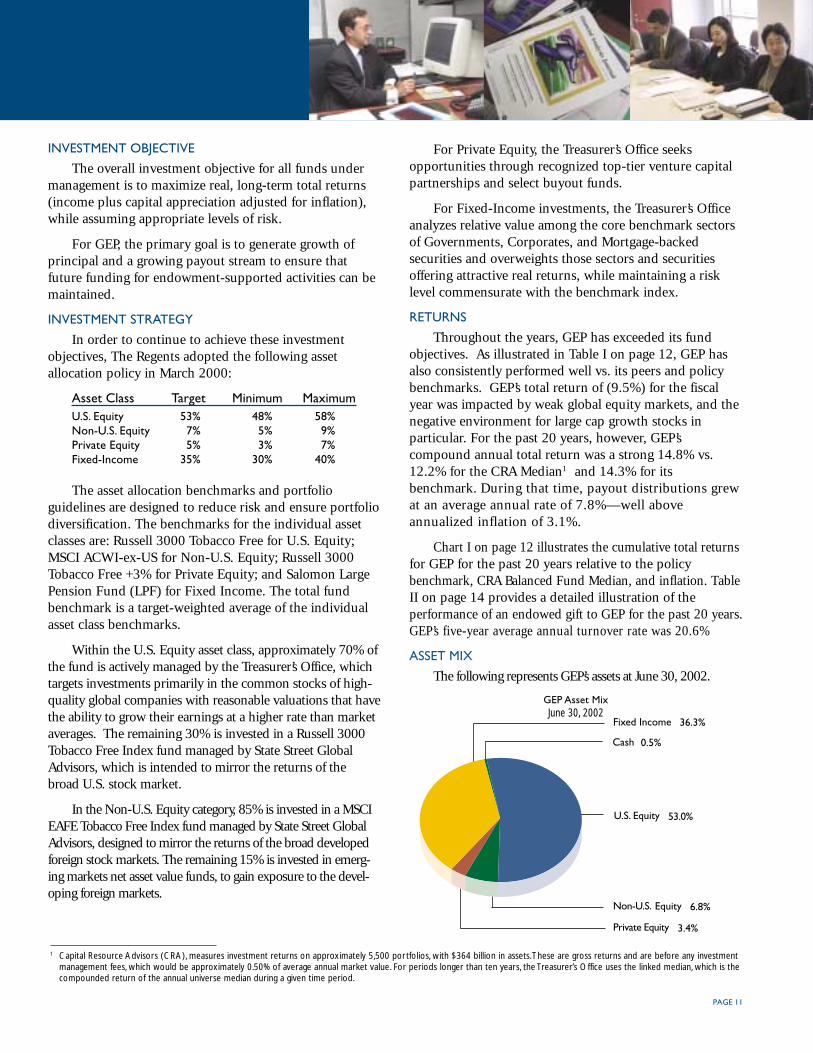
ASSET MIX
The following represents GEP’s assets at June 30, 2002.
GEP Asset MixJune 30, 2002
1 Capital Resource Advisors (CRA), measures investment returns on approximately 5,500 portfolios, with $364 billion in assets. These are gross returns and are before any investmentmanagement fees, which would be approximately 0.50% of average annual market value. For periods longer than ten years, the Treasurer’s Office uses the linked median, which is thecompounded return of the annual universe median during a given time period.
INVESTMENT OBJECTIVE
The overall investment objective for all funds undermanagement is to maximize real, long-term total returns(income plus capital appreciation adjusted for inflation),while assuming appropriate levels of risk.
For GEP, the primary goal is to generate growth ofprincipal and a growing payout stream to ensure thatfuture funding for endowment-supported activities can bemaintained.
INVESTMENT STRATEGY
In order to continue to achieve these investmentobjectives, The Regents adopted the following assetallocation policy in March 2000:
Asset Class Target Minimum MaximumU.S. Equity 53% 48% 58%Non-U.S. Equity 7% 5% 9%Private Equity 5% 3% 7%Fixed-Income 35% 30% 40%
The asset allocation benchmarks and portfolioguidelines are designed to reduce risk and ensure portfoliodiversification. The benchmarks for the individual assetclasses are: Russell 3000 Tobacco Free for U.S. Equity;MSCI ACWI-ex-US for Non-U.S. Equity; Russell 3000Tobacco Free +3% for Private Equity; and Salomon LargePension Fund (LPF) for Fixed Income. The total fundbenchmark is a target-weighted average of the individualasset class benchmarks.
Within the U.S. Equity asset class, approximately 70% ofthe fund is actively managed by the Treasurer’s Office, whichtargets investments primarily in the common stocks of high-quality global companies with reasonable valuations that havethe ability to grow their earnings at a higher rate than marketaverages. The remaining 30% is invested in a Russell 3000Tobacco Free Index fund managed by State Street GlobalAdvisors, which is intended to mirror the returns of thebroad U.S. stock market.
In the Non-U.S. Equity category, 85% is invested in a MSCIEAFE Tobacco Free Index fund managed by State Street GlobalAdvisors, designed to mirror the returns of the broad developedforeign stock markets. The remaining 15% is invested in emerg-ing markets net asset value funds, to gain exposure to the devel-oping foreign markets.
Cash 0.5%
U.S. Equity 53.0%
Non-U.S. Equity 6.8%
Private Equity 3.4%
Fixed Income 36.3%
PAGE 12
General Endowment Pool (GEP)
0%
500%
1000%
1500%
2000%
82 83 84 85 86 87 88 89 90 91 92 93 94 95 96 97 98 99 00 01 02
GEPPolicy BenchmarkCRA Balanced Fund MedianInflation
1,472.3%
896.5%
85.5%
1,351.1%
Table IGEP Annualized Total Returns1 versus Peers2, Benchmarks and Inflation
June 30, 2002
1-Year 5-Year 10-Year 20-Year 20-Year Cumulative
Total FundGEP (9.5)% 6.3% 11.3% 14.8% 1,472.3%CRA Balanced Fund Median (4.8) 6.1 9.8 12.2 896.5Policy Benchmark3 (7.7) 6.0 10.9 14.3 1,351.1Inflation4 1.3 2.4 2.6 3.1 85.5
U.S. EquityGEP (21.8)% 2.3% 10.3% 14.0% 1,279.0%Policy Benchmark5 (17.4) 4.0 11.6 15.0 1,533.2
Non-U.S. EquityGEP (8.8)% (9.6)% 2.6% N/A N/APolicy Benchmark6 (8.2) N/M N/M N/M N/M
Private EquityGEP (15.4)% 34.7% 37.1% N/A N/APolicy Benchmark7 (14.8) 8.4 16.7 N/A N/A
Fixed Income SecuritiesGEP 9.5% 8.3% 9.8% 13.4% 1,134.6%Policy Benchmark8 8.8 8.4 8.7 12.2 890.7
Chart IGEP Cumulative Total Returns: Fiscal 1983-2002
Fiscal Periods Ending June 30
1 GEP’s total returns are based on unit values calculated by UCOP Endowment and Investment Accounting and are net of (after) investment management and administrative expensesof 0.04% of average annual market value, which are automatically deducted from income. The asset class returns reflect investment returns. The performance of The Regents’ totalreturn investment portfolio is calculated by QED, according to the standard recommended by the Bank Administration Institute (BAI), which uses a time-weighted methodology thatessentially neutralizes the effect of contributions and withdrawals so as to measure only the return on assets. These calculations comply with the Association for InvestmentManagement and Research (AIMR) standards, which require time-weighted rates of return using realized and unrealized gains plus income. Performance is reconciled to theTreasurer’s Office internal calculations.
2 Capital Resource Advisors (CRA), measures investment returns on approximately 5,500 portfolios, with $364 billion in assets. These are gross returns and are before any investmentmanagement fees, which would be approximately 0.50% of average annual market value. For periods longer than ten years, the Treasurer’s Office uses the linked median, which is thecompounded return of the annual universe median during a given time period.
3 53% Russell 3000 Tobacco Free (TF), 35% SB LPF, 7% MSCI AC World ex US, 5% Russell 3000 TF + 3%; Historical: 65% S&P 500 and 35% LB LT G/C.4 Inflation as measured by the Consumer Price Index.5 Russell 3000 TF; Historical: S&P 500.6 MSCI AC World ex US, since November 2000.7 Russell 3000 TF +3%; Historical: S&P 500 +5%.8 SB LPF; Historical: LB LTG/C.
PAGE 13
EQUITY INVESTMENTS
The equity portion of GEP consists primarily of domesticand foreign common stocks, with a modest exposure toprivate equity. Total equities represented 63.2% of GEP atyear-end, with a market value of $2.6 billion.
U.S. Equity represented 53.0% of the fund at year-end, with a market value of $2.2 billion. In a difficult yearfor the U.S. stock markets, GEP’s U.S. Equity returnsdeclined by 21.8%, trailing the benchmark return of(17.4%). Over the longer-term, however, GEP’s U.S.Equity returns of 10.3% and 14.0% for the 10- and 20-year periods compare more favorably. The portfolio’s five-year average annual turnover rate was 16.7%.
The following are the 10 largest equity holdings andsector breakdown of the active portion of the U.S. Equityportfolio:
Largest Equity Holdings Major Sector Allocations % of TotalGeneral Electric Non-Cyc. Consumer Goods 21%
American International Group Other Public Equity1 17%
Sysco Financials 16%
Exxon Mobil Information Technology 16%
Microsoft Cyclical Services 12%
Pharmacia General Industrials 8%
Automatic Data Processing Resources 4%
Wyeth Non-Cyclical Services 3%
Baxter International Basic Industries 2%
Pepsico, Inc. Utilities 1%
Non-U.S. Equity represented 6.8% of GEP at year-end, with a market value of $287 million. GEP’s Non-U.S.Equities declined 8.8% in the fiscal year, similar to thebenchmark return of (8.2%). The longer-term returns forthis asset class represent the emerging markets NAV fundsonly, so comparisons are not yet meaningful.
Private Equity represented 3.4% of GEP at year-endwith a market value of $143 million. Returns for this assetclass in the fiscal year were similar to the public equitymarkets as the excessive valuations achieved during theinternet boom were largely reversed. Over the past 5 and10 years, however, GEP’s private equity returns of 34.7%and 37.1% have been very rewarding. Longer-term, thiscategory should provide attractive returns, although likelymore modest than those of the previous few years.
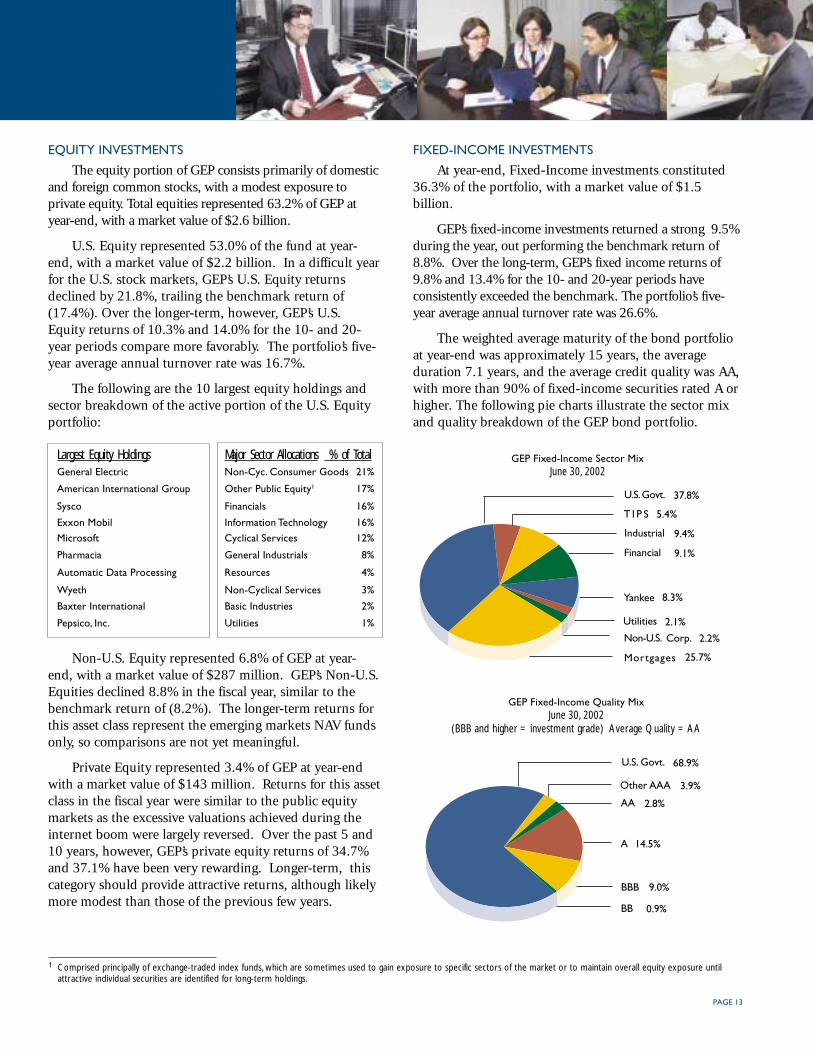
GEP Fixed-Income Quality MixJune 30, 2002
(BBB and higher = investment grade) Average Quality = AA
Mortgages 25.7%
U.S. Govt. 37.8%
Non-U.S. Corp. 2.2%
Yankee 8.3%
Utilities 2.1%
Financial 9.1%
Industrial 9.4%
T I P S 5.4%
1 Comprised principally of exchange-traded index funds, which are sometimes used to gain exposure to specific sectors of the market or to maintain overall equity exposure untilattractive individual securities are identified for long-term holdings.
FIXED-INCOME INVESTMENTS
At year-end, Fixed-Income investments constituted36.3% of the portfolio, with a market value of $1.5billion.
GEP’s fixed-income investments returned a strong 9.5%during the year, out performing the benchmark return of8.8%. Over the long-term, GEP’s fixed income returns of9.8% and 13.4% for the 10- and 20-year periods haveconsistently exceeded the benchmark. The portfolio’s five-year average annual turnover rate was 26.6%.
The weighted average maturity of the bond portfolioat year-end was approximately 15 years, the averageduration 7.1 years, and the average credit quality was AA,with more than 90% of fixed-income securities rated A orhigher. The following pie charts illustrate the sector mixand quality breakdown of the GEP bond portfolio.
GEP Fixed-Income Sector MixJune 30, 2002
U.S. Govt. 68.9%
Other AAA 3.9%
AA 2.8%
A 14.5%
BB 0.9%
BBB 9.0%
PAGE 14
General Endowment Pool (GEP)
1 GEP’s total returns are based on unit values calculated by UCOP Endowment and Investment Accounting and are net of (after) investment management and administrative expensesof 0.04% of average annual market value, which are automatically deducted from income. The performance of The Regents’ total return investment portfolio is calculated by QED,according to the standard recommended by the Bank Administration Institute (BAI), which uses a time-weighted methodology that essentially neutralizes the effect of contributionsand withdrawals so as to measure only the returns on assets. These calculations comply with the Association for Investment Management and Research (AIMR) standards, whichrequire time-weighted rates of return using realized and unrealized gains plus income. Performance is reconciled to the Treasurer’s Office own internal calculations.
2 Payout per share in fiscal 1993 is approximately $0.0133 higher than normal as a result of an accounting policy change to distribute equity accruals. Without the change, payout pershare would have been $0.3356, or $14,882 for the $100,000 gift.
3 The payout for fiscal years 1999 and 2000 was 4.35% and the payout for fiscal years 2001 and 2002 was 4.45% of a 60-month moving average of GEP’s market value.
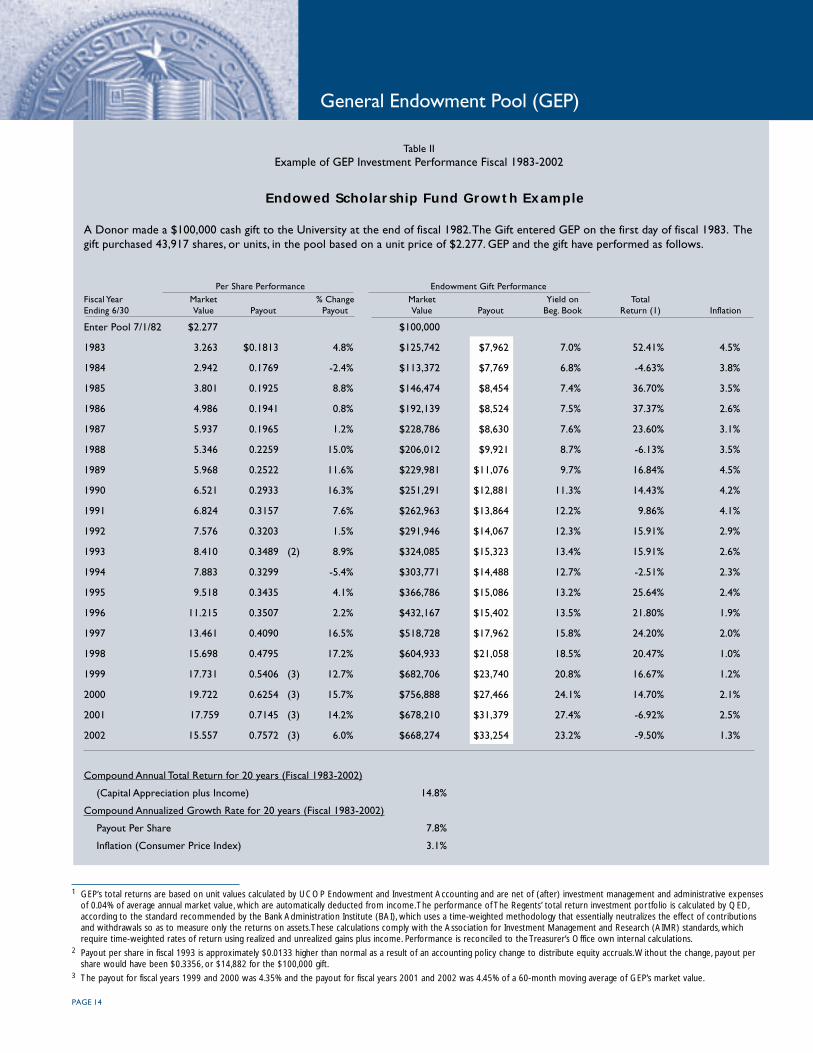
Table IIExample of GEP Investment Performance Fiscal 1983-2002
Endowed Scholarship Fund Growth Example
A Donor made a $100,000 cash gift to the University at the end of fiscal 1982. The Gift entered GEP on the first day of fiscal 1983. Thegift purchased 43,917 shares, or units, in the pool based on a unit price of $2.277. GEP and the gift have performed as follows.
Per Share Performance Endowment Gift PerformanceFiscal Year Market % Change Market Yield on TotalEnding 6/30 Value Payout Payout Value Payout Beg. Book Return (1) Inflation
Enter Pool 7/1/82 $2.277 $100,000
1983 3.263 $0.1813 4.8% $125,742 $7,962 7.0% 52.41% 4.5%
1984 2.942 0.1769 -2.4% $113,372 $7,769 6.8% -4.63% 3.8%
1985 3.801 0.1925 8.8% $146,474 $8,454 7.4% 36.70% 3.5%
1986 4.986 0.1941 0.8% $192,139 $8,524 7.5% 37.37% 2.6%
1987 5.937 0.1965 1.2% $228,786 $8,630 7.6% 23.60% 3.1%
1988 5.346 0.2259 15.0% $206,012 $9,921 8.7% -6.13% 3.5%
1989 5.968 0.2522 11.6% $229,981 $11,076 9.7% 16.84% 4.5%
1990 6.521 0.2933 16.3% $251,291 $12,881 11.3% 14.43% 4.2%
1991 6.824 0.3157 7.6% $262,963 $13,864 12.2% 9.86% 4.1%
1992 7.576 0.3203 1.5% $291,946 $14,067 12.3% 15.91% 2.9%
1993 8.410 0.3489 (2) 8.9% $324,085 $15,323 13.4% 15.91% 2.6%
1994 7.883 0.3299 -5.4% $303,771 $14,488 12.7% -2.51% 2.3%
1995 9.518 0.3435 4.1% $366,786 $15,086 13.2% 25.64% 2.4%
1996 11.215 0.3507 2.2% $432,167 $15,402 13.5% 21.80% 1.9%
1997 13.461 0.4090 16.5% $518,728 $17,962 15.8% 24.20% 2.0%
1998 15.698 0.4795 17.2% $604,933 $21,058 18.5% 20.47% 1.0%
1999 17.731 0.5406 (3) 12.7% $682,706 $23,740 20.8% 16.67% 1.2%
2000 19.722 0.6254 (3) 15.7% $756,888 $27,466 24.1% 14.70% 2.1%
2001 17.759 0.7145 (3) 14.2% $678,210 $31,379 27.4% -6.92% 2.5%
2002 15.557 0.7572 (3) 6.0% $668,274 $33,254 23.2% -9.50% 1.3%
Compound Annual Total Return for 20 years (Fiscal 1983-2002)
(Capital Appreciation plus Income) 14.8%
Compound Annualized Growth Rate for 20 years (Fiscal 1983-2002)
Payout Per Share 7.8%
Inflation (Consumer Price Index) 3.1%
PAGE 15
ENDOWED CHAIRS
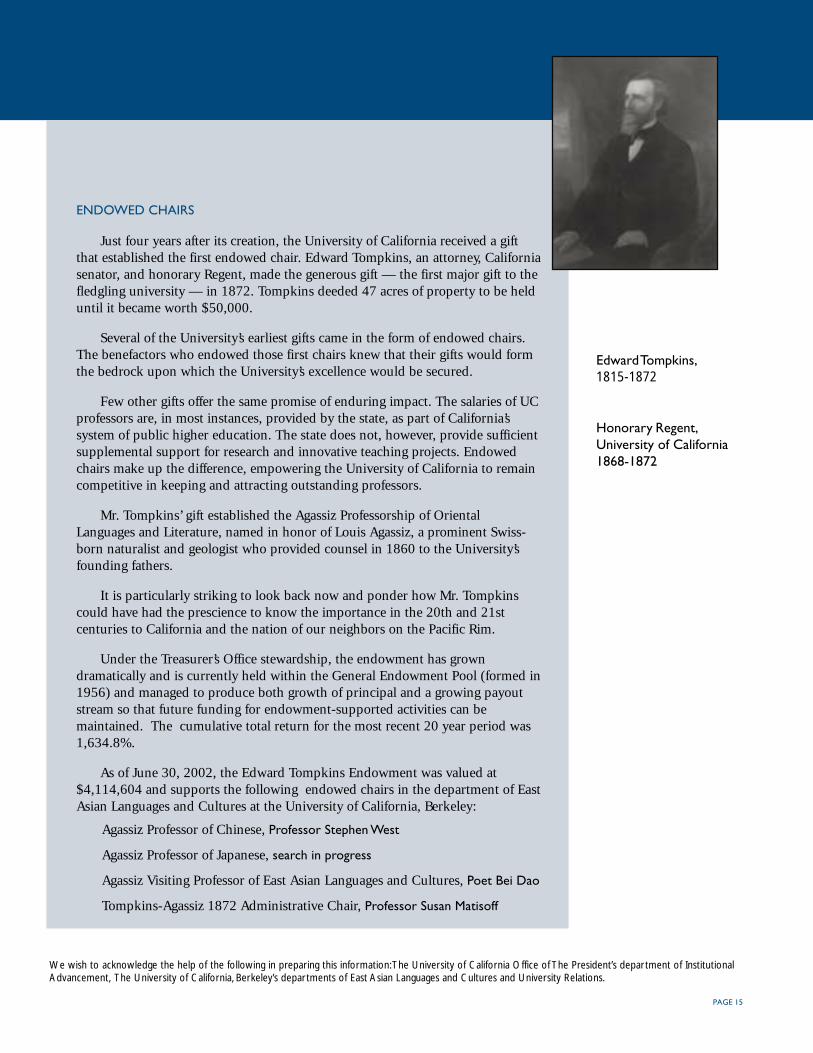
Just four years after its creation, the University of California received a giftthat established the first endowed chair. Edward Tompkins, an attorney, Californiasenator, and honorary Regent, made the generous gift — the first major gift to thefledgling university — in 1872. Tompkins deeded 47 acres of property to be helduntil it became worth $50,000.
Several of the University’s earliest gifts came in the form of endowed chairs.The benefactors who endowed those first chairs knew that their gifts would formthe bedrock upon which the University’s excellence would be secured.
Few other gifts offer the same promise of enduring impact. The salaries of UCprofessors are, in most instances, provided by the state, as part of California’ssystem of public higher education. The state does not, however, provide sufficientsupplemental support for research and innovative teaching projects. Endowedchairs make up the difference, empowering the University of California to remaincompetitive in keeping and attracting outstanding professors.
Mr. Tompkins’ gift established the Agassiz Professorship of OrientalLanguages and Literature, named in honor of Louis Agassiz, a prominent Swiss-born naturalist and geologist who provided counsel in 1860 to the University’sfounding fathers.
It is particularly striking to look back now and ponder how Mr. Tompkinscould have had the prescience to know the importance in the 20th and 21stcenturies to California and the nation of our neighbors on the Pacific Rim.
Under the Treasurer’s Office stewardship, the endowment has growndramatically and is currently held within the General Endowment Pool (formed in1956) and managed to produce both growth of principal and a growing payoutstream so that future funding for endowment-supported activities can bemaintained. The cumulative total return for the most recent 20 year period was1,634.8%.
As of June 30, 2002, the Edward Tompkins Endowment was valued at$4,114,604 and supports the following endowed chairs in the department of EastAsian Languages and Cultures at the University of California, Berkeley:
Agassiz Professor of Chinese, Professor Stephen West
Agassiz Professor of Japanese, search in progress
Agassiz Visiting Professor of East Asian Languages and Cultures, Poet Bei Dao
Tompkins-Agassiz 1872 Administrative Chair, Professor Susan Matisoff
Edward Tompkins,1815-1872
Honorary Regent,University of California1868-1872
We wish to acknowledge the help of the following in preparing this information: The University of California Office of The President’s department of InstitutionalAdvancement, The University of California, Berkeley’s departments of East Asian Languages and Cultures and University Relations.
PAGE 16
The Regents’ Endowment Funds
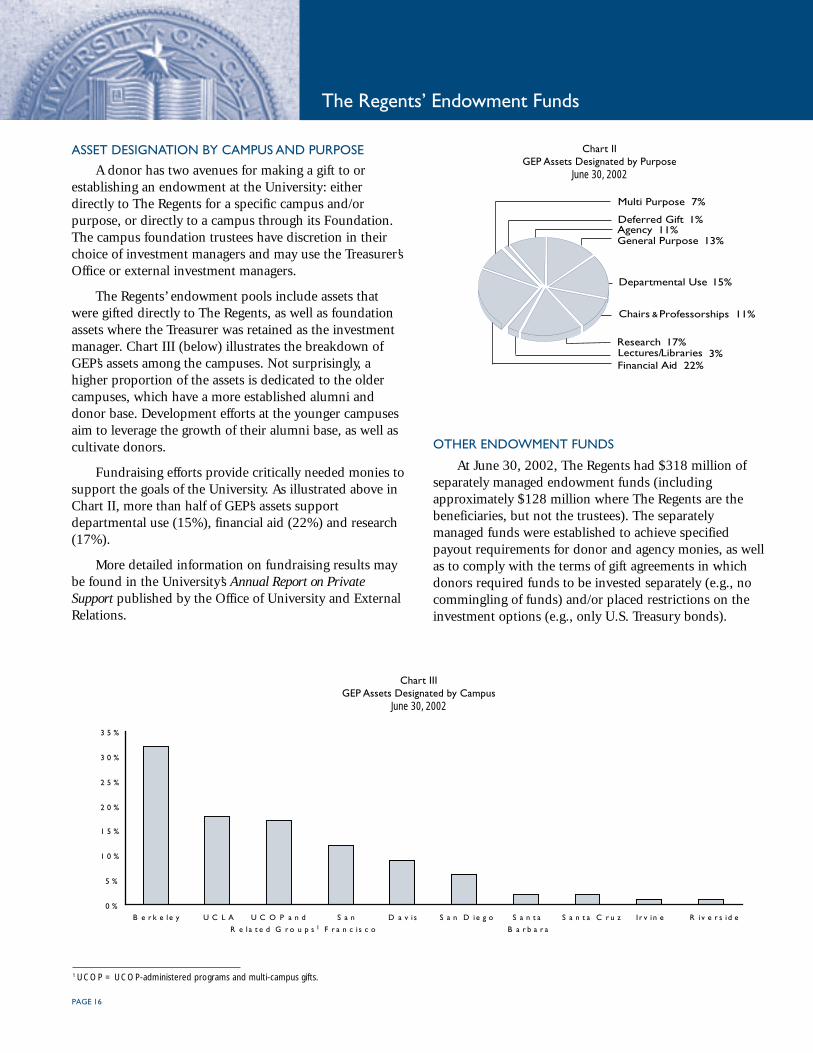
Chart IIGEP Assets Designated by Purpose
June 30, 2002
Agency 11%Deferred Gift 1%
General Purpose 13%
Departmental Use 15%
Chairs &Professorships 11%
Research 17%Lectures/Libraries 3%Financial Aid 22%
Multi Purpose 7%
ASSET DESIGNATION BY CAMPUS AND PURPOSE
A donor has two avenues for making a gift to orestablishing an endowment at the University: eitherdirectly to The Regents for a specific campus and/orpurpose, or directly to a campus through its Foundation.The campus foundation trustees have discretion in theirchoice of investment managers and may use the Treasurer’sOffice or external investment managers.
The Regents’ endowment pools include assets thatwere gifted directly to The Regents, as well as foundationassets where the Treasurer was retained as the investmentmanager. Chart III (below) illustrates the breakdown ofGEP’s assets among the campuses. Not surprisingly, ahigher proportion of the assets is dedicated to the oldercampuses, which have a more established alumni anddonor base. Development efforts at the younger campusesaim to leverage the growth of their alumni base, as well ascultivate donors.
Fundraising efforts provide critically needed monies tosupport the goals of the University. As illustrated above inChart II, more than half of GEP’s assets supportdepartmental use (15%), financial aid (22%) and research(17%).
More detailed information on fundraising results maybe found in the University’s Annual Report on PrivateSupport published by the Office of University and ExternalRelations.
OTHER ENDOWMENT FUNDS
At June 30, 2002, The Regents had $318 million ofseparately managed endowment funds (includingapproximately $128 million where The Regents are thebeneficiaries, but not the trustees). The separatelymanaged funds were established to achieve specifiedpayout requirements for donor and agency monies, as wellas to comply with the terms of gift agreements in whichdonors required funds to be invested separately (e.g., nocommingling of funds) and/or placed restrictions on theinvestment options (e.g., only U.S. Treasury bonds).
Chart IIIGEP Assets Designated by Campus
June 30, 2002
1 UCOP = UCOP-administered programs and multi-campus gifts.
0 %
5 %
1 0 %
1 5 %
2 0 %
2 5 %
3 0 %
3 5 %
B e r k e l e y U C L A U C O P a n d
R e l a t e d G r o u p s 1S a n
F r a n c i s c o
D a v i s S a n D ie g o S a n t a
B a r b a r a
S a n t a C r u z I r v i n e R i v e r s i d e
PAGE 17
FELLOWSHIPS
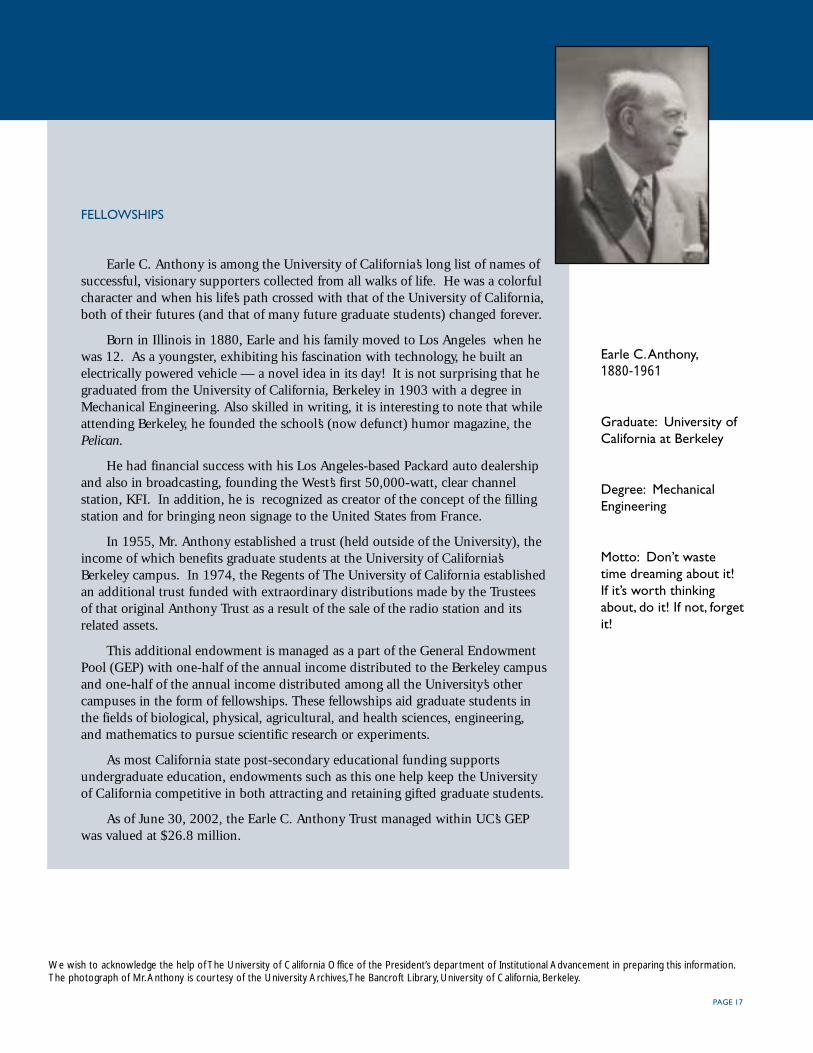
Earle C. Anthony is among the University of California’s long list of names ofsuccessful, visionary supporters collected from all walks of life. He was a colorfulcharacter and when his life’s path crossed with that of the University of California,both of their futures (and that of many future graduate students) changed forever.
Born in Illinois in 1880, Earle and his family moved to Los Angeles when hewas 12. As a youngster, exhibiting his fascination with technology, he built anelectrically powered vehicle — a novel idea in its day! It is not surprising that hegraduated from the University of California, Berkeley in 1903 with a degree inMechanical Engineering. Also skilled in writing, it is interesting to note that whileattending Berkeley, he founded the school’s (now defunct) humor magazine, thePelican.
He had financial success with his Los Angeles-based Packard auto dealershipand also in broadcasting, founding the West’s first 50,000-watt, clear channelstation, KFI. In addition, he is recognized as creator of the concept of the fillingstation and for bringing neon signage to the United States from France.
In 1955, Mr. Anthony established a trust (held outside of the University), theincome of which benefits graduate students at the University of California’sBerkeley campus. In 1974, the Regents of The University of California establishedan additional trust funded with extraordinary distributions made by the Trusteesof that original Anthony Trust as a result of the sale of the radio station and itsrelated assets.
This additional endowment is managed as a part of the General EndowmentPool (GEP) with one-half of the annual income distributed to the Berkeley campusand one-half of the annual income distributed among all the University’s othercampuses in the form of fellowships. These fellowships aid graduate students inthe fields of biological, physical, agricultural, and health sciences, engineering,and mathematics to pursue scientific research or experiments.
As most California state post-secondary educational funding supportsundergraduate education, endowments such as this one help keep the Universityof California competitive in both attracting and retaining gifted graduate students.
As of June 30, 2002, the Earle C. Anthony Trust managed within UC’s GEPwas valued at $26.8 million.
Earle C. Anthony,1880-1961
Graduate: University ofCalifornia at Berkeley
Degree: MechanicalEngineering
Motto: Don’t wastetime dreaming about it!If it’s worth thinkingabout, do it! If not, forgetit!
We wish to acknowledge the help of The University of California Office of the President’s department of Institutional Advancement in preparing this information.The photograph of Mr. Anthony is courtesy of the University Archives, The Bancroft Library, University of California, Berkeley.
PAGE 18
High Income Pool (HIP)
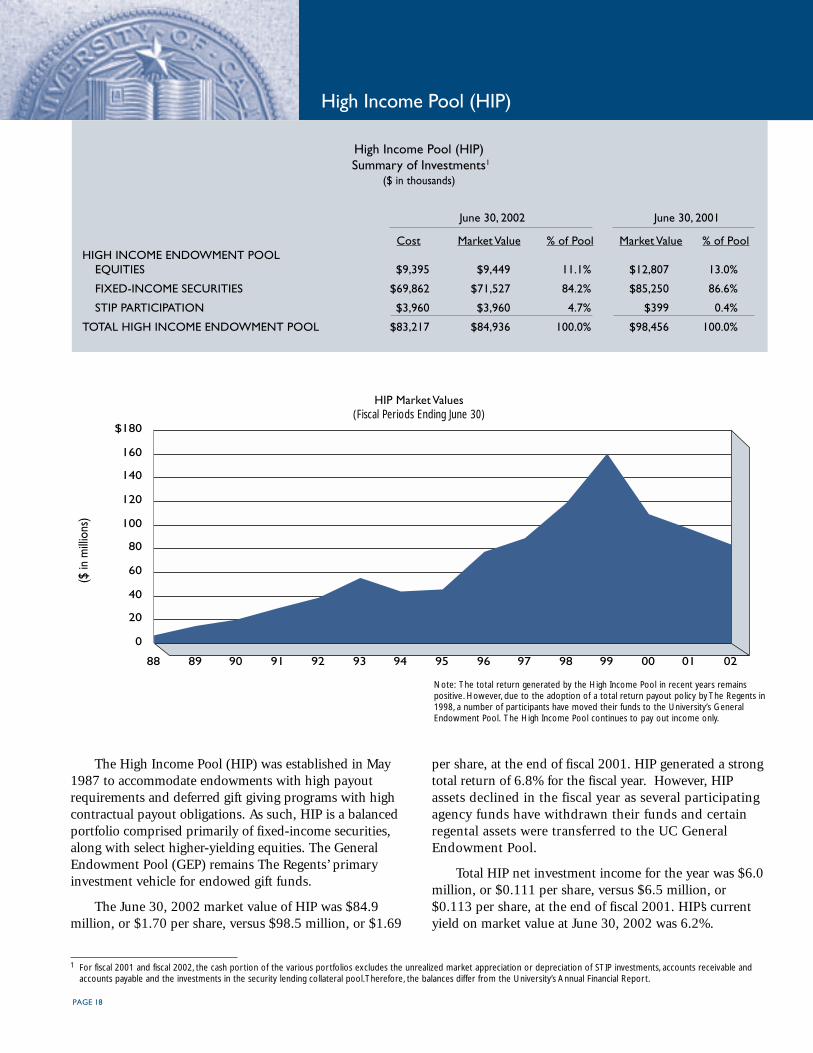
The High Income Pool (HIP) was established in May1987 to accommodate endowments with high payoutrequirements and deferred gift giving programs with highcontractual payout obligations. As such, HIP is a balancedportfolio comprised primarily of fixed-income securities,along with select higher-yielding equities. The GeneralEndowment Pool (GEP) remains The Regents’ primaryinvestment vehicle for endowed gift funds.
The June 30, 2002 market value of HIP was $84.9million, or $1.70 per share, versus $98.5 million, or $1.69
per share, at the end of fiscal 2001. HIP generated a strongtotal return of 6.8% for the fiscal year. However, HIPassets declined in the fiscal year as several participatingagency funds have withdrawn their funds and certainregental assets were transferred to the UC GeneralEndowment Pool.
Total HIP net investment income for the year was $6.0million, or $0.111 per share, versus $6.5 million, or$0.113 per share, at the end of fiscal 2001. HIP’s currentyield on market value at June 30, 2002 was 6.2%.
1 For fiscal 2001 and fiscal 2002, the cash portion of the various portfolios excludes the unrealized market appreciation or depreciation of STIP investments, accounts receivable andaccounts payable and the investments in the security lending collateral pool. Therefore, the balances differ from the University’s Annual Financial Report.
High Income Pool (HIP) Summary of Investments1
($ in thousands)
June 30, 2002 June 30, 2001
Cost Market Value % of Pool Market Value % of PoolHIGH INCOME ENDOWMENT POOL
EQUITIES $9,395 $9,449 11.1% $12,807 13.0%
FIXED-INCOME SECURITIES $69,862 $71,527 84.2% $85,250 86.6%
STIP PARTICIPATION $3,960 $3,960 4.7% $399 0.4%
TOTAL HIGH INCOME ENDOWMENT POOL $83,217 $84,936 100.0% $98,456 100.0%
0
20
40
60
80
100
120
140
160
$180
88 89 90 91 92 93 94 95 96 97 98 99 00 01 02
($ in
milli
ons)
Note: The total return generated by the High Income Pool in recent years remainspositive. However, due to the adoption of a total return payout policy by The Regents in1998, a number of participants have moved their funds to the University’s GeneralEndowment Pool. The High Income Pool continues to pay out income only.
HIP Market Values(Fiscal Periods Ending June 30)
PAGE 19
SPENDING POLICY
Although The Regents adopted a total return spendingpolicy for GEP during fiscal 1999, the income only payoutspending policy is being maintained for HIP given thenature of the gifts and their required payouts.
INVESTMENT OBJECTIVE
The overall investment objective for all funds undermanagement is to maximize real, long-term total returns(income plus capital appreciation adjusted for inflation),while assuming appropriate levels of risk.
For HIP, the primary goal is to produce a relativelyhigh and stable level of current income sufficient to meetthe needs of the specific funds, with moderate growth ofincome and preservation of capital.
INVESTMENT STRATEGY
In order to achieve these higher income goals, TheRegents’ asset allocation strategy for HIP calls for themajority of assets to be invested in fixed-income securities.The Treasurer’s Office targets those fixed-income securitiesand equities that will provide a high level of currentincome and can also generate moderate growth. TheTreasurer’s Office may vary the asset mix to maintain arelatively high level of income.
RETURNS
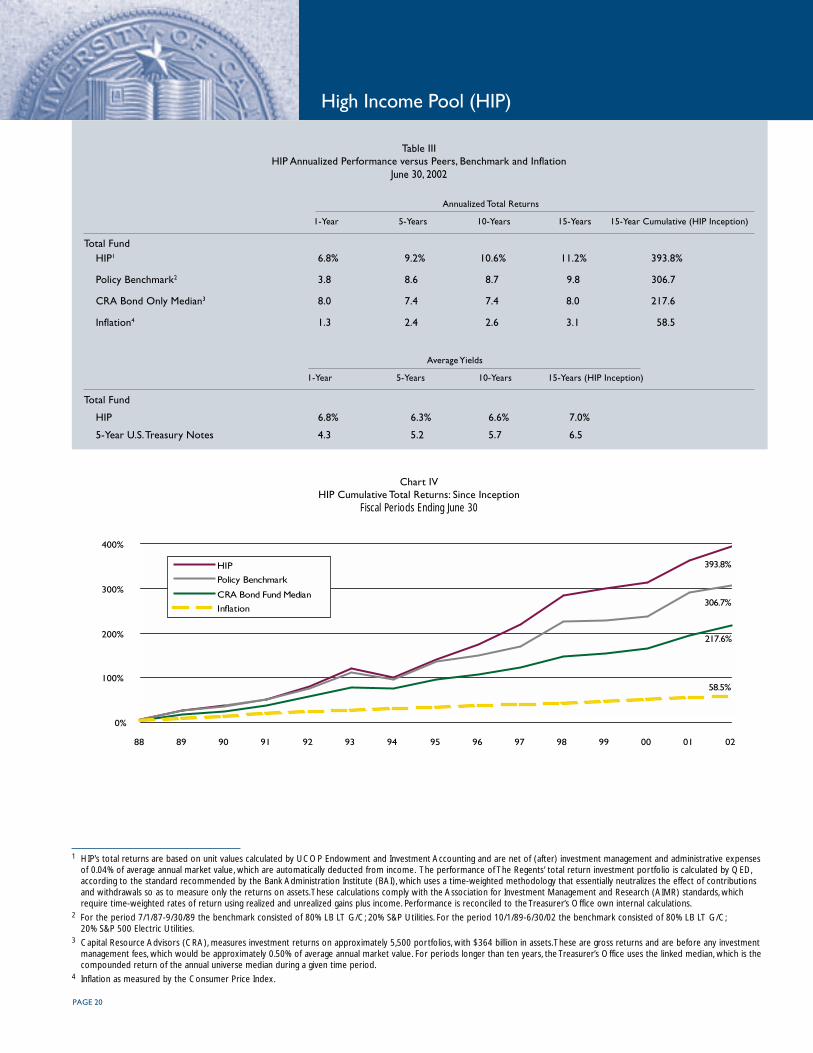
During its 15-year history, HIP has performed verywell versus its peers and benchmark, as illustrated in TableIII on page 20. HIP’s positive return of 6.8% in the fiscalyear reflects its emphasis on fixed income investments.
Chart IV on page 20 illustrates HIP’s cumulative totalreturns versus the policy benchmark, CRA Bond FundMedian, and inflation since inception.
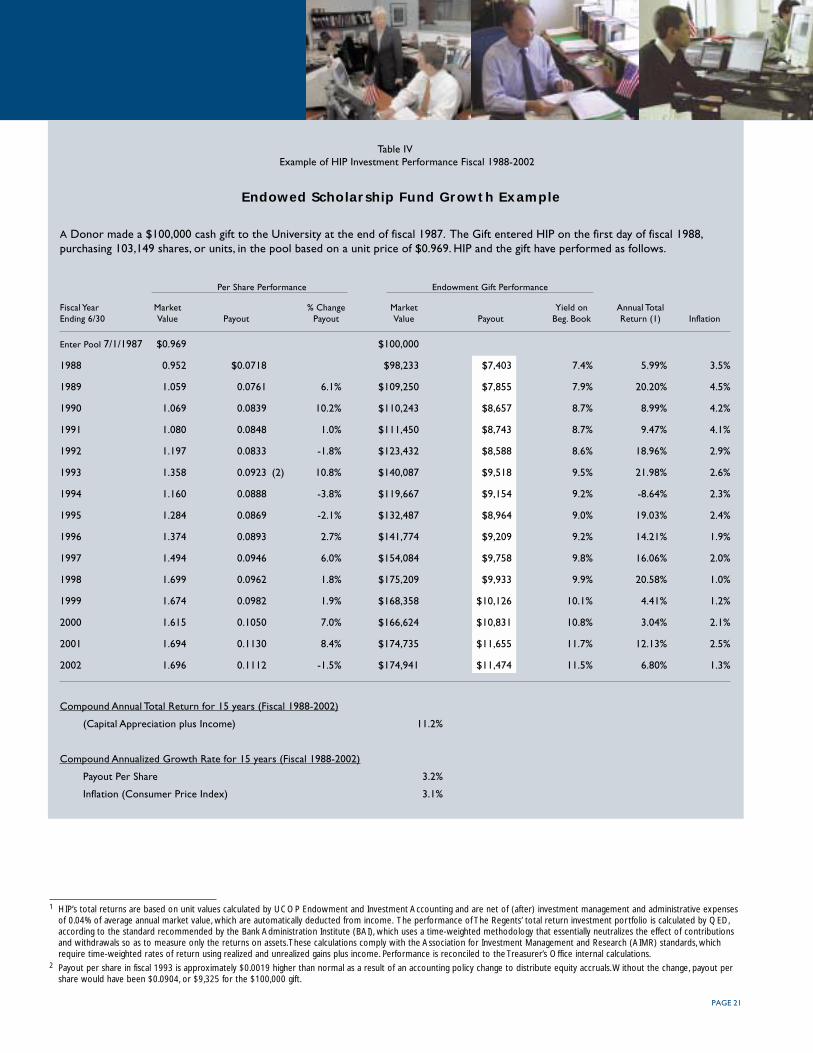
Table IV on page 21 provides a detailed illustration ofthe performance of an endowed gift to HIP sinceinception. During that time, HIP has generated acompound annual total return of 11.2%, and payoutdistributions have grown at an average annual rate of3.2%, exceeding average inflation of 3.1%. HIP’s five-yearaverage annual turnover rate was 22.3%
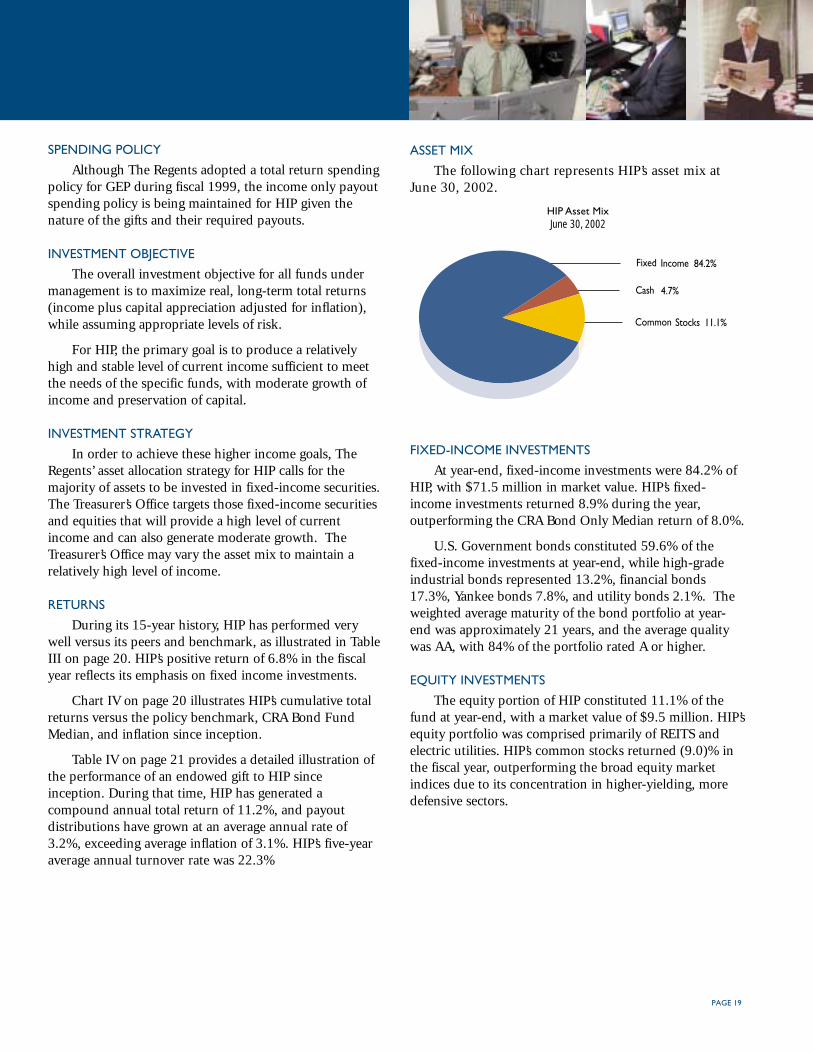
ASSET MIX
The following chart represents HIP’s asset mix atJune 30, 2002.
HIP Asset MixJune 30, 2002
FIXED-INCOME INVESTMENTS
At year-end, fixed-income investments were 84.2% ofHIP, with $71.5 million in market value. HIP’s fixed-income investments returned 8.9% during the year,outperforming the CRA Bond Only Median return of 8.0%.
U.S. Government bonds constituted 59.6% of thefixed-income investments at year-end, while high-gradeindustrial bonds represented 13.2%, financial bonds17.3%, Yankee bonds 7.8%, and utility bonds 2.1%. Theweighted average maturity of the bond portfolio at year-end was approximately 21 years, and the average qualitywas AA, with 84% of the portfolio rated A or higher.
EQUITY INVESTMENTS
The equity portion of HIP constituted 11.1% of thefund at year-end, with a market value of $9.5 million. HIP’sequity portfolio was comprised primarily of REITS andelectric utilities. HIP’s common stocks returned (9.0)% inthe fiscal year, outperforming the broad equity marketindices due to its concentration in higher-yielding, moredefensive sectors.
Fixed Income 84.2%
Cash 4.7%
Common Stocks 11.1%
PAGE 20
High Income Pool (HIP)
Table IIIHIP Annualized Performance versus Peers, Benchmark and Inflation
June 30, 2002
Annualized Total Returns
1-Year 5-Years 10-Years 15-Years 15-Year Cumulative (HIP Inception)
Total FundHIP1 6.8% 9.2% 10.6% 11.2% 393.8%
Policy Benchmark2 3.8 8.6 8.7 9.8 306.7
CRA Bond Only Median3 8.0 7.4 7.4 8.0 217.6
Inflation4 1.3 2.4 2.6 3.1 58.5
Average Yields
1-Year 5-Years 10-Years 15-Years (HIP Inception)
Total Fund
HIP 6.8% 6.3% 6.6% 7.0%
5-Year U.S. Treasury Notes 4.3 5.2 5.7 6.5
Chart IVHIP Cumulative Total Returns: Since Inception
Fiscal Periods Ending June 30
1 HIP’s total returns are based on unit values calculated by UCOP Endowment and Investment Accounting and are net of (after) investment management and administrative expensesof 0.04% of average annual market value, which are automatically deducted from income. The performance of The Regents’ total return investment portfolio is calculated by QED,according to the standard recommended by the Bank Administration Institute (BAI), which uses a time-weighted methodology that essentially neutralizes the effect of contributionsand withdrawals so as to measure only the returns on assets. These calculations comply with the Association for Investment Management and Research (AIMR) standards, whichrequire time-weighted rates of return using realized and unrealized gains plus income. Performance is reconciled to the Treasurer’s Office own internal calculations.
2 For the period 7/1/87-9/30/89 the benchmark consisted of 80% LB LT G/C; 20% S&P Utilities. For the period 10/1/89-6/30/02 the benchmark consisted of 80% LB LT G/C;20% S&P 500 Electric Utilities.
3 Capital Resource Advisors (CRA), measures investment returns on approximately 5,500 portfolios, with $364 billion in assets. These are gross returns and are before any investmentmanagement fees, which would be approximately 0.50% of average annual market value. For periods longer than ten years, the Treasurer’s Office uses the linked median, which is thecompounded return of the annual universe median during a given time period.
4 Inflation as measured by the Consumer Price Index.
0%
100%
200%
300%
400%
88 89 90 91 92 93 94 95 96 97 98 99 00 01 02
HIP
Policy Benchmark
CRA Bond Fund Median
Inflation
393.8%
217.6%
58.5%
306.7%
PAGE 21
Table IVExample of HIP Investment Performance Fiscal 1988-2002
Endowed Scholarship Fund Growth Example
A Donor made a $100,000 cash gift to the University at the end of fiscal 1987. The Gift entered HIP on the first day of fiscal 1988,purchasing 103,149 shares, or units, in the pool based on a unit price of $0.969. HIP and the gift have performed as follows.
Per Share Performance Endowment Gift Performance
Fiscal Year Market % Change Market Yield on Annual TotalEnding 6/30 Value Payout Payout Value Payout Beg. Book Return (1) Inflation
Enter Pool 7/1/1987 $0.969 $100,000
1988 0.952 $0.0718 $98,233 $7,403 7.4% 5.99% 3.5%
1989 1.059 0.0761 6.1% $109,250 $7,855 7.9% 20.20% 4.5%
1990 1.069 0.0839 10.2% $110,243 $8,657 8.7% 8.99% 4.2%
1991 1.080 0.0848 1.0% $111,450 $8,743 8.7% 9.47% 4.1%
1992 1.197 0.0833 -1.8% $123,432 $8,588 8.6% 18.96% 2.9%
1993 1.358 0.0923 (2) 10.8% $140,087 $9,518 9.5% 21.98% 2.6%
1994 1.160 0.0888 -3.8% $119,667 $9,154 9.2% -8.64% 2.3%
1995 1.284 0.0869 -2.1% $132,487 $8,964 9.0% 19.03% 2.4%
1996 1.374 0.0893 2.7% $141,774 $9,209 9.2% 14.21% 1.9%
1997 1.494 0.0946 6.0% $154,084 $9,758 9.8% 16.06% 2.0%
1998 1.699 0.0962 1.8% $175,209 $9,933 9.9% 20.58% 1.0%
1999 1.674 0.0982 1.9% $168,358 $10,126 10.1% 4.41% 1.2%
2000 1.615 0.1050 7.0% $166,624 $10,831 10.8% 3.04% 2.1%
2001 1.694 0.1130 8.4% $174,735 $11,655 11.7% 12.13% 2.5%
2002 1.696 0.1112 -1.5% $174,941 $11,474 11.5% 6.80% 1.3%
Compound Annual Total Return for 15 years (Fiscal 1988-2002)
(Capital Appreciation plus Income) 11.2%
Compound Annualized Growth Rate for 15 years (Fiscal 1988-2002)
Payout Per Share 3.2%
Inflation (Consumer Price Index) 3.1%
1 HIP’s total returns are based on unit values calculated by UCOP Endowment and Investment Accounting and are net of (after) investment management and administrative expensesof 0.04% of average annual market value, which are automatically deducted from income. The performance of The Regents’ total return investment portfolio is calculated by QED,according to the standard recommended by the Bank Administration Institute (BAI), which uses a time-weighted methodology that essentially neutralizes the effect of contributionsand withdrawals so as to measure only the returns on assets. These calculations comply with the Association for Investment Management and Research (AIMR) standards, whichrequire time-weighted rates of return using realized and unrealized gains plus income. Performance is reconciled to the Treasurer’s Office internal calculations.
2 Payout per share in fiscal 1993 is approximately $0.0019 higher than normal as a result of an accounting policy change to distribute equity accruals. Without the change, payout pershare would have been $0.0904, or $9,325 for the $100,000 gift.
PAGE 22
Short Term Investment Pool (STIP)
The Short Term Investment Pool (STIP) is a cashinvestment pool established in fiscal 1976 by The Regentsand is available to all University groups, includingretirement and endowment funds. STIP allows fundparticipants to maximize the returns on their short-termcash balances by taking advantage of the economies ofscale of investing in a larger pool and investing in abroader range of maturities.
STIP consists primarily of current funds slated forpayroll, operating and construction expenses for all thecampuses and teaching hospitals of the University. Inaddition, funds awaiting permanent investment are investedin STIP to earn maximum daily interest until transferred.
INVESTMENT OBJECTIVE
STIP’s investment objective is to maximize returnsconsistent with safety of principal, liquidity and cash-flowrequirements. STIP’s investments encompass a broadspectrum of high-quality money-market and fixed-incomeinstruments with a maximum maturity of five years. TheTreasurer’s Office structures investment maturities toensure an adequate flow of funds to meet the University’scash requirements.
INVESTMENT STRATEGY
The Treasurer’s Office manages STIP as a highly liquidportfolio, using maturity distribution strategies tomaximize returns in different yield-curve environments.The Treasurer’s Office also employs select swappingstrategies by taking advantage of disparities in the marketto improve quality and yield, while maintaining liquidity.
YIELDS
STIP has achieved very attractive returns over theyears as illustrated in Table V. For fiscal 2002, STIP’s yieldof 5.0% outperformed 3-month U.S. Treasury Bills at2.2%. During the past 20 years, the average yield on STIPwas 7.5%, compared to 6.1% for 3-month U.S. TreasuryBills.
STIP continued to maintain a high degree of liquidityin the fiscal year to accommodate periodic asset classrebalancing in the longer-term portfolios. At the sametime, as the front end of the yield curve steepened, highquality spread products in the 3-5 year maturities wereadded to enhance the portfolio’s yield.
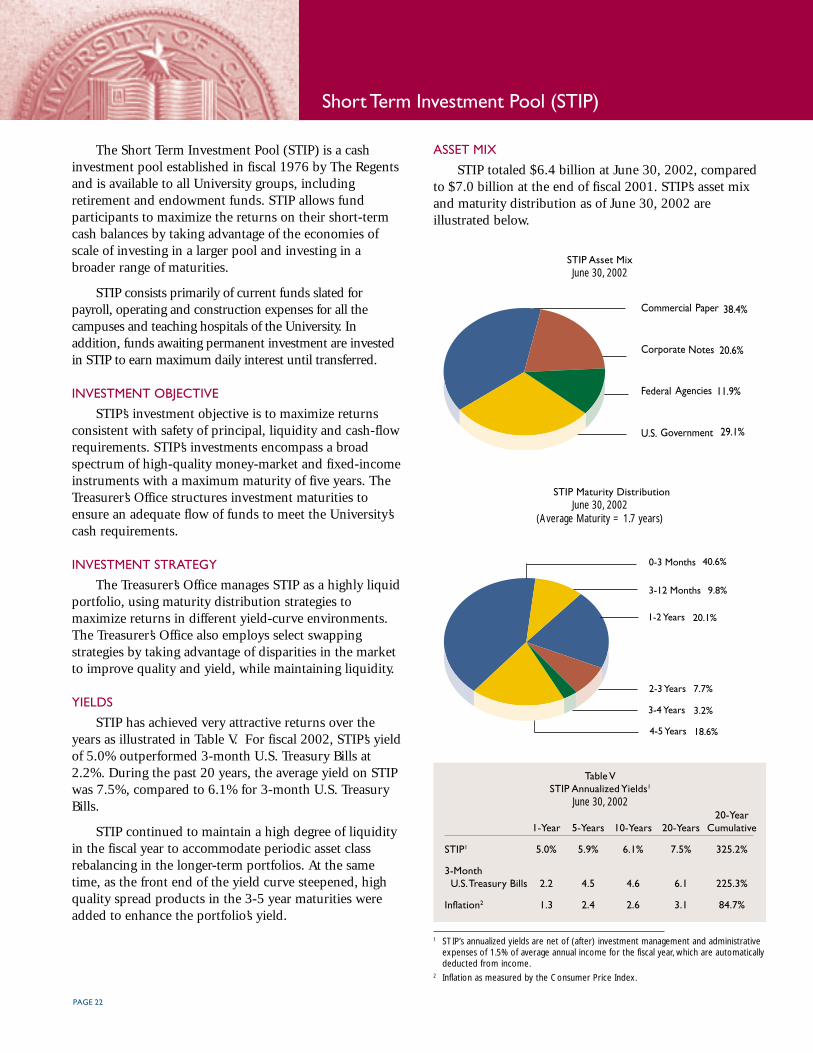
ASSET MIX
STIP totaled $6.4 billion at June 30, 2002, comparedto $7.0 billion at the end of fiscal 2001. STIP’s asset mixand maturity distribution as of June 30, 2002 areillustrated below.
STIP Asset MixJune 30, 2002
STIP Maturity DistributionJune 30, 2002
(Average Maturity = 1.7 years)
Table VSTIP Annualized Yields1
June 30, 200220-Year
1-Year 5-Years 10-Years 20-Years Cumulative
STIP1 5.0% 5.9% 6.1% 7.5% 325.2%
3-Month U.S. Treasury Bills 2.2 4.5 4.6 6.1 225.3%
Inflation2 1.3 2.4 2.6 3.1 84.7%
1 STIP’s annualized yields are net of (after) investment management and administrativeexpenses of 1.5% of average annual income for the fiscal year, which are automaticallydeducted from income.
2 Inflation as measured by the Consumer Price Index.
Commercial Paper 38.4%
Corporate Notes 20.6%
Federal Agencies 11.9%
U.S. Government 29.1%
3-4 Years 3.2%
4-5 Years 18.6%
2-3 Years 7.7%
1-2 Years 20.1%
3-12 Months 9.8%
0-3 Months 40.6%

PAGE 23
CHOOSING TO UTILIZE UC-MANAGED POOLS
UNIVERSITY PROGRAMS UTILIZING STIP
In fiscal 1985, The Regents authorized the Universityof California Mortgage Origination Program, whichprovides first deed of trust mortgage loans to eligiblemembers of the University’s faculty and staff. These loanstotaled $459.6 million at June 30, 2002, and were funded
by the legally available cash balances in the unrestrictedportion of STIP. In March 1999, The Regents authorizedthe use of the legally available cash balances in theunrestricted portion of STIP to provide liquidity supportfor the University’s Commercial Paper Program.
As of June 30,2002, the Treasurer’s Office manages$760 million for the campus foundations and supportgroups. A donor has two avenues for making a gift to orestablishing an endowment at the University ofCalifornia: either directly to The Regents for a specificcampus and/or purpose, or directly to a campus throughits Foundation. The campus foundation trustees havediscretion in their choice of investment managers andmay use the Treasurer’s Office or external investmentmanagers.
The Treasurer’s Office has worked with The UCSB Foundation since 1985.
“The UC Treasurer’s Office provides us with a wide range of services that are especially sensitive to our needsas a campus. Not only do they do a great job of managing the funds - unlike other fund management entities, theyhave a keen understanding of the particular needs of donors to a university and of the concerns of facultymembers.
“These sensitivities help those of us in development be both more responsive and more effective in doing our jobs.”
John M. WiemannVice Chancellor, Institutional AdvancementUC Santa Barbara
“As chair of the UCSB Foundation’s finance committee and as a banker, I can appreciate the tremendoustechnical expertise that the UC Treasurer’s Office brings to the task of managing our investments. The economiesof scale they offer in reducing transaction costs contribute significantly to our efficiency. It gives me greatconfidence as a trustee of our campus foundation to have our investments in the hands of a staff the caliber of thatfound in the UC Treasurer’s Office.”
William S. “Tom” ThomasPresident and CEO, Santa Barbara Bank & TrustChair, Finance CommitteeThe UCSB Foundation
PAGE 24
University of California Retirement System
UNIVERSITY OF CALIFORNIA RETIREMENT SYSTEM
Summary of Investments1
($ in thousands)
June 30, 2002 June 30, 2001
UC RETIREMENT PLAN (UCRP) Cost Market Value % of UCRP Market Value % of UCRP
EQUITIES
U.S. Equity $ 17,606,211 $ 18,369,435 53.6% $ 19,953,399 51.5%Non-U.S. Equity $ 3,088,469 $ 2,417,921 7.0% $ 2,474,151 6.4%
Private Equity $ 793,129 $ 659,455 1.9% $ 802,929 2.1%
TOTAL EQUITIES $ 21,487,808 $ 21,446,810 62.5% $ 23,230,479 60.0%
FIXED INCOME SECURITIES $ 11,955,382 $ 12,607,171 36.8% $ 14,281,066 36.9%
STIP PARTICIPATION2 $ 238,222 $ 238,222 0.7% $ 1,187,698 3.1%
TOTAL UCRP $ 33,681,412 $ 34,292,203 100.0% $ 38,699,243 100.0%
June 30, 2002 June 30, 2001
DEFINED CONTRIBUTION (DC) FUNDS Cost Market Value % of DC Market Value % of DC
TOTAL RETURN FUNDS
EQUITY FUND $ 2,677,621 $ 2,428,097 38.4% $ 3,008,396 46.6%
BOND FUND $ 742,774 $ 760,753 12.0% $ 642,299 10.0%
INTEREST INCOME FUNDS
SAVINGS FUND $ 2,618,095 $ 2,618,095 41.4% $ 2,372,636 36.8%
ICC FUND $ 377,216 $ 377,216 6.0% $ 299,769 4.6%
MONEY MARKET FUND $ 140,687 $ 140,687 2.2% $ 131,425 2.0%
TOTAL DC FUNDS3 $ 6,556,393 $ 6,324,848 100.0% $ 6,454,525 100.0%
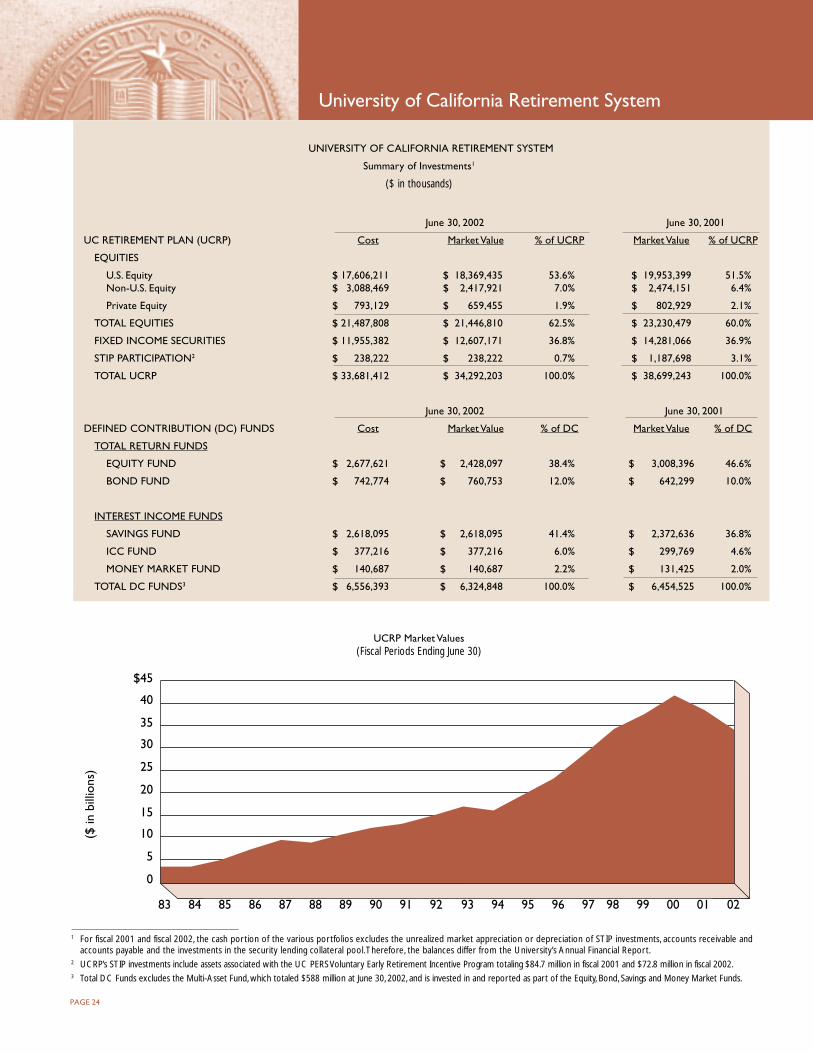
UCRP Market Values(Fiscal Periods Ending June 30)
1 For fiscal 2001 and fiscal 2002, the cash portion of the various portfolios excludes the unrealized market appreciation or depreciation of STIP investments, accounts receivable andaccounts payable and the investments in the security lending collateral pool. Therefore, the balances differ from the University’s Annual Financial Report.
2 UCRP’s STIP investments include assets associated with the UC PERS Voluntary Early Retirement Incentive Program totaling $84.7 million in fiscal 2001 and $72.8 million in fiscal 2002.3 Total DC Funds excludes the Multi-Asset Fund, which totaled $588 million at June 30, 2002, and is invested in and reported as part of the Equity, Bond, Savings and Money Market Funds.
0
5
10
15
20
25
30
35
40
$45
83 84 85 86 87 88 89 90 91 92 93 94 95 96 97 98 99 00 01 02
($ in
bill
ions
)

PAGE 25
The largest pool of assets managed by the Treasurer’sOffice is the University of California Retirement Plan(UCRP), created in 1961. UCRP is a defined benefit plan,whereby retirement benefits are a function of theemployee’s age, average income and length of service.With the plan in surplus, The Regents suspended bothemployee and employer contributions to UCRP in 1990,but redirected the mandatory employee contributions (lessthan 2% of annual salary for most employees) to the newlyestablished Defined Contribution Plan.
UCRP is a balanced portfolio of equities and fixed-income securities, which at June 30, 2002 totaled $34.3billion, versus $38.7 billion at the end of fiscal 2001.
INVESTMENT OBJECTIVE
The overall investment objective for all funds undermanagement is to maximize real, long-term total returns(income plus capital appreciation adjusted for inflation),while assuming appropriate levels of risk.
UCRP’s specific objective is to ensure its ability tomeet its obligation to beneficiaries by earning sufficientreturns over the long term that meet or exceed theactuarial rate of return of 7.5%.
INVESTMENT STRATEGY
In order to continue to achieve these investmentobjectives, The Regents adopted the following assetallocation policy in March 2000:
Asset Class Target Minimum MaximumU.S. Equity 53% 48% 58%Non-U.S. Equity 7% 5% 9%Private Equity 5% 3% 7%Fixed-Income 35% 30% 40%
The asset allocation changes were designed to reducerisk and broaden portfolio diversification. Thebenchmarks for the individual asset classes are: Russell3000 Tobacco Free for U.S. Equity; MSCI ACWI-ex-US forNon-U.S. Equity; Russell 3000 Tobacco Free +3% forPrivate Equity; and Salomon Large Pension Fund (LPF) forFixed Income. The total fund benchmark is a target-weighted average of the individual asset class benchmarks.
Within the U.S. Equity asset class, approximately 70%of the fund is managed actively by the Treasurer’s Office,which targets equity investments primarily in the commonstocks of high quality global companies with reasonablevaluations that have the ability to grow their earnings at ahigher rate than market averages. The remaining 30% isinvested in a Russell 3000 Tobacco Free Index fundmanaged by State Street Global Advisors, which isintended to mirror the returns of the broad U.S. stockmarket.
In the Non-U.S. Equity category, 85% is invested in aMSCI EAFE Tobacco Free Index fund managed by StateStreet Global Advisors, designed to mirror the returns ofthe broad developed foreign stock markets. Theremaining 15% is invested in emerging markets net assetvalue funds, to gain exposure to the developing foreignmarkets.
For Private Equity, the Treasurer’s Office seeksopportunities through recognized top-tier venture capitalpartnerships and select buyout funds.
For Fixed Income investments, the Treasurer’s Officeanalyzes relative value among the core benchmark sectorsof Governments, Corporates, and Mortgage-backedsecurities and overweights those sectors and securitiesoffering attractive real returns, while maintaining a risklevel commensurate with the benchmark index.
RETURNS
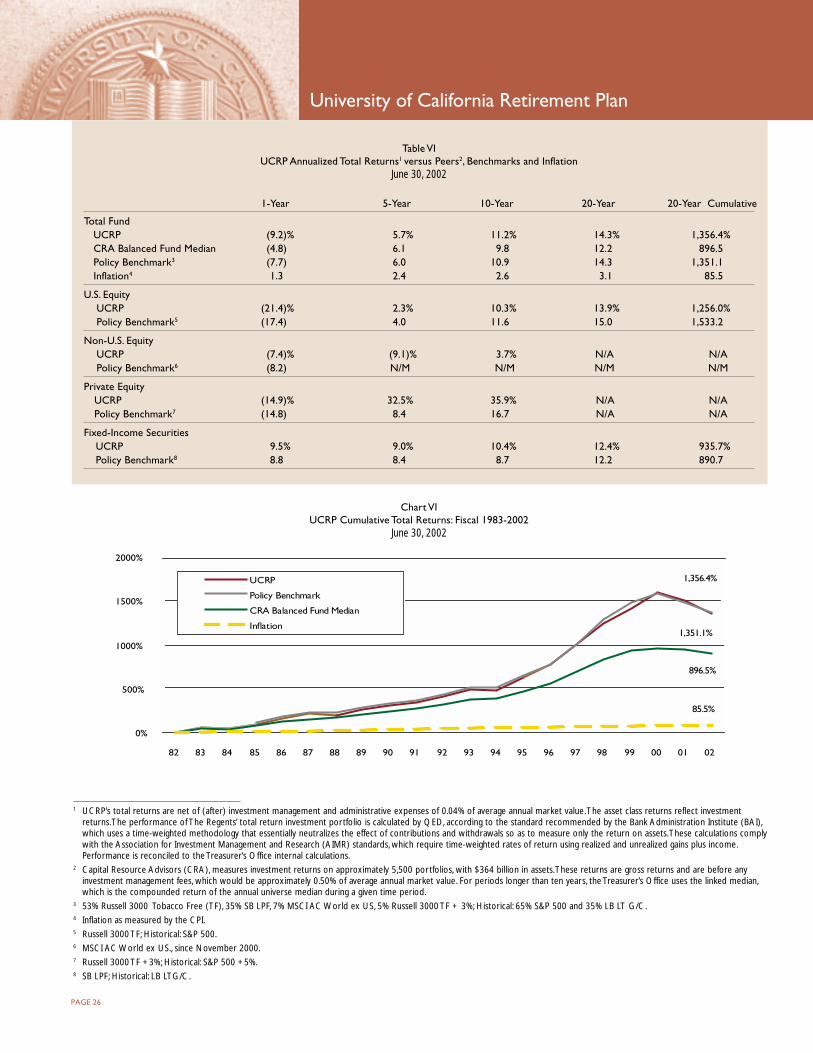
UCRP has exceeded its investment objectives over thelong-term. It has also performed very well versus its policybenchmarks and peers. As illustrated in Table VI on page26, UCRP has a proven history of above-medianinvestment performance when compared to the CRAuniverse of balanced funds1. UCRP’s return of (9.2%) inthe fiscal year reflects weak global equity markets.However, UCRP’s annualized total return for the past 20years through June 30, 2002 was 14.3%, matching itsbenchmark and beating the CRA Balanced Fund Medianreturn of 12.2%.
Chart VI on page 26 illustrates the cumulative totalreturns for UCRP for the past 20 years relative to the policybenchmark, CRA Balanced Fund Median, and inflation.
UCRP’s five-year average annual turnover rate was 21.7%.
1 Capital Resource Advisors (CRA), measures investment returns on approximately 5,500 portfolios, with $364 billion in assets. These are gross returns and are before any investmentmanagement fees, which would be approximately 0.50% of average annual market value. For periods longer than ten years, the Treasurer’s Office uses the linked median, which is thecompounded return of the annual universe median during a given time period.
PAGE 26
University of California Retirement Plan
0%
500%
1000%
1500%
2000%
82 83 84 85 86 87 88 89 90 91 92 93 94 95 96 97 98 99 00 01 02
UCRP
Policy Benchmark
CRA Balanced Fund Median
Inflation
1,356.4%
896.5%
85.5%
1,351.1%
Table VIUCRP Annualized Total Returns1 versus Peers2, Benchmarks and Inflation
June 30, 2002
1-Year 5-Year 10-Year 20-Year 20-Year Cumulative
Total FundUCRP (9.2)% 5.7% 11.2% 14.3% 1,356.4%CRA Balanced Fund Median (4.8) 6.1 9.8 12.2 896.5Policy Benchmark3 (7.7) 6.0 10.9 14.3 1,351.1Inflation4 1.3 2.4 2.6 3.1 85.5
U.S. EquityUCRP (21.4)% 2.3% 10.3% 13.9% 1,256.0%Policy Benchmark5 (17.4) 4.0 11.6 15.0 1,533.2
Non-U.S. EquityUCRP (7.4)% (9.1)% 3.7% N/A N/APolicy Benchmark6 (8.2) N/M N/M N/M N/M
Private EquityUCRP (14.9)% 32.5% 35.9% N/A N/APolicy Benchmark7 (14.8) 8.4 16.7 N/A N/A
Fixed-Income SecuritiesUCRP 9.5% 9.0% 10.4% 12.4% 935.7%Policy Benchmark8 8.8 8.4 8.7 12.2 890.7
Chart VIUCRP Cumulative Total Returns: Fiscal 1983-2002
June 30, 2002
1 UCRP’s total returns are net of (after) investment management and administrative expenses of 0.04% of average annual market value. The asset class returns reflect investmentreturns. The performance of The Regents’ total return investment portfolio is calculated by QED, according to the standard recommended by the Bank Administration Institute (BAI),which uses a time-weighted methodology that essentially neutralizes the effect of contributions and withdrawals so as to measure only the return on assets. These calculations complywith the Association for Investment Management and Research (AIMR) standards, which require time-weighted rates of return using realized and unrealized gains plus income.Performance is reconciled to the Treasurer’s Office internal calculations.
2 Capital Resource Advisors (CRA), measures investment returns on approximately 5,500 portfolios, with $364 billion in assets. These returns are gross returns and are before anyinvestment management fees, which would be approximately 0.50% of average annual market value. For periods longer than ten years, the Treasurer’s Office uses the linked median,which is the compounded return of the annual universe median during a given time period.
3 53% Russell 3000 Tobacco Free (TF), 35% SB LPF, 7% MSCI AC World ex US, 5% Russell 3000 TF + 3%; Historical: 65% S&P 500 and 35% LB LT G/C.4 Inflation as measured by the CPI.5 Russell 3000 TF; Historical: S&P 500.6 MSCI AC World ex US., since November 2000.7 Russell 3000 TF +3%; Historical: S&P 500 +5%.8 SB LPF; Historical: LB LTG/C.
PAGE 27
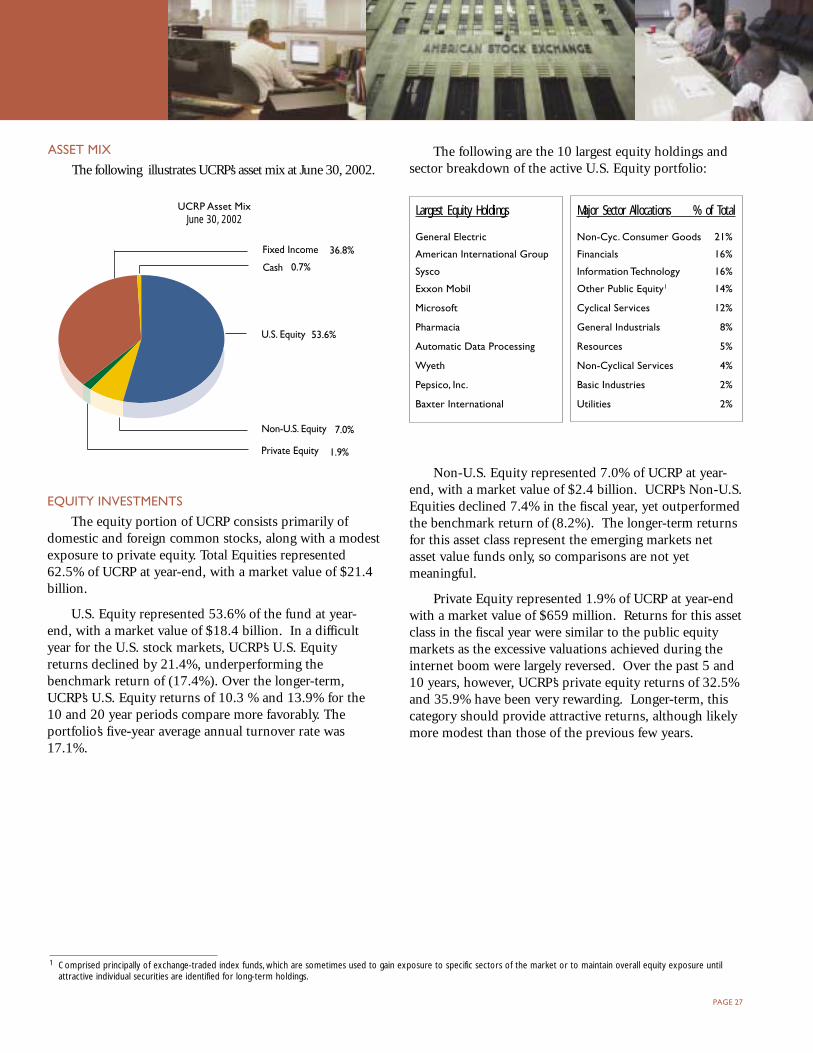
ASSET MIX
The following illustrates UCRP’s asset mix at June 30, 2002.
UCRP Asset MixJune 30, 2002
The following are the 10 largest equity holdings andsector breakdown of the active U.S. Equity portfolio:
Largest Equity Holdings Major Sector Allocations % of Total
General Electric Non-Cyc. Consumer Goods 21%
American International Group Financials 16%
Sysco Information Technology 16%
Exxon Mobil Other Public Equity1 14%
Microsoft Cyclical Services 12%
Pharmacia General Industrials 8%
Automatic Data Processing Resources 5%
Wyeth Non-Cyclical Services 4%
Pepsico, Inc. Basic Industries 2%
Baxter International Utilities 2%
Non-U.S. Equity represented 7.0% of UCRP at year-end, with a market value of $2.4 billion. UCRP’s Non-U.S.Equities declined 7.4% in the fiscal year, yet outperformedthe benchmark return of (8.2%). The longer-term returnsfor this asset class represent the emerging markets netasset value funds only, so comparisons are not yetmeaningful.
Private Equity represented 1.9% of UCRP at year-endwith a market value of $659 million. Returns for this assetclass in the fiscal year were similar to the public equitymarkets as the excessive valuations achieved during theinternet boom were largely reversed. Over the past 5 and10 years, however, UCRP’s private equity returns of 32.5%and 35.9% have been very rewarding. Longer-term, thiscategory should provide attractive returns, although likelymore modest than those of the previous few years.
EQUITY INVESTMENTS
The equity portion of UCRP consists primarily ofdomestic and foreign common stocks, along with a modestexposure to private equity. Total Equities represented62.5% of UCRP at year-end, with a market value of $21.4billion.
U.S. Equity represented 53.6% of the fund at year-end, with a market value of $18.4 billion. In a difficultyear for the U.S. stock markets, UCRP’s U.S. Equityreturns declined by 21.4%, underperforming thebenchmark return of (17.4%). Over the longer-term,UCRP’s U.S. Equity returns of 10.3 % and 13.9% for the10 and 20 year periods compare more favorably. Theportfolio’s five-year average annual turnover rate was17.1%.
Fixed Income 36.8%
Cash 0.7%
U.S. Equity 53.6%
Non-U.S. Equity 7.0%
Private Equity 1.9%
1 Comprised principally of exchange-traded index funds, which are sometimes used to gain exposure to specific sectors of the market or to maintain overall equity exposure untilattractive individual securities are identified for long-term holdings.
PAGE 28
University of California Retirement Plan
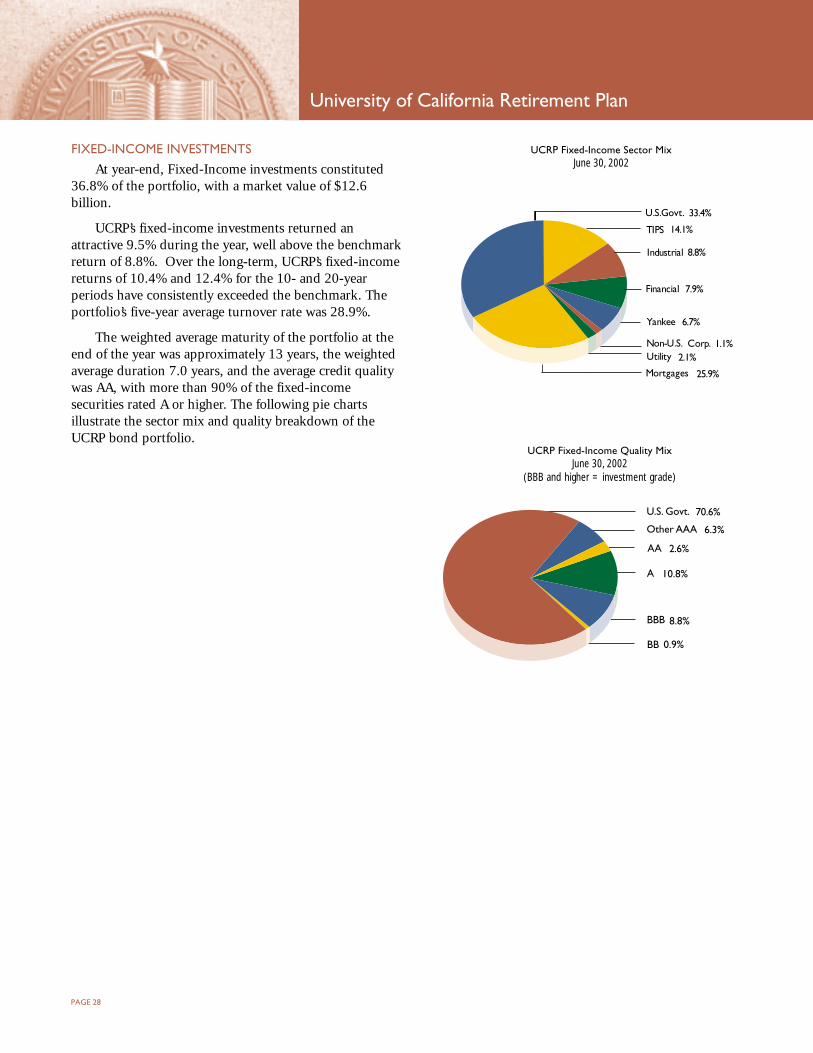
FIXED-INCOME INVESTMENTS
At year-end, Fixed-Income investments constituted36.8% of the portfolio, with a market value of $12.6billion.
UCRP’s fixed-income investments returned anattractive 9.5% during the year, well above the benchmarkreturn of 8.8%. Over the long-term, UCRP’s fixed-incomereturns of 10.4% and 12.4% for the 10- and 20-yearperiods have consistently exceeded the benchmark. Theportfolio’s five-year average turnover rate was 28.9%.
The weighted average maturity of the portfolio at theend of the year was approximately 13 years, the weightedaverage duration 7.0 years, and the average credit qualitywas AA, with more than 90% of the fixed-incomesecurities rated A or higher. The following pie chartsillustrate the sector mix and quality breakdown of theUCRP bond portfolio.
UCRP Fixed-Income Sector MixJune 30, 2002
UCRP Fixed-Income Quality MixJune 30, 2002
(BBB and higher = investment grade)
BB 0.9%
A 10.8%
AA 2.6%
Other AAA 6.3%
U.S. Govt. 70.6%
BBB 8.8%
Mortgages 25.9%
Financial 7.9%
Yankee 6.7%
U.S.Govt. 33.4%
Industrial 8.8%
Non-U.S. Corp. 1.1%Utility 2.1%
TIPS 14.1%

PAGE 29
Edna Coleman Smith
Berkeley, California
Retired
40 years with theUniversity of California
Director of HumanResources and BenefitsServices
RETIREE PROFILE
Edna Coleman Smith spent much of her career making sure the University ofCalifornia can choose from among the best when selecting employees.
With an educational background in Business Administration from University ofCalifornia, Berkeley, she joined UC’s staff knowing she wanted to make acontribution to the institution. She found her niche in Personnel Services early onand served on the team that created an independent Personnel Office for the Officeof the President (UCOP.) She was also responsible for the development of UCOPTemporary Staffing Services and instrumental in developing and implementing thefirst UCOP Affirmative Action Plan.
In addition, she is credited with spearheading two very successful employeedevelopment programs: Professional Skills Assessment and the UCOP ScholarshipProgram. Both of these programs have been directly responsible for many careerdevelopment success stories. Since 1978, her executive recruitment expertise wasdirectly responsible for recruiting many of UC’s current and former executives. Herspecial skills at sourcing diverse candidate pools contributed significantly to theexcellent quality and meaningful diversity of the UCOP workforce. She pridesherself on the camaraderie she developed across all lines of the UC system, fromadministrative support to Presidents (having served under seven of them.)
Edna began planning for retirement several years into her career by attendingUC-sponsored retirement workshops and by consulting regularly with her financialadvisor. She states, “The best advice I received was to always have a diversifiedinvestment portfolio. Invest in your self right now. Do research on your retirementfuture and make yourself and your financial well-being a priority!”
Edna retired later than planned only because she couldn’t pass up theopportunity to perform a significant leadership role. The PERS (Public EmployeePersonnel System), which preceded UCRP, provided her with the opportunity tohave reciprocity into the UCRP at retirement. She also took advantage of the 401(k)and 403(b) programs (utilizing a diversified combination of UC-managed funds inthe latter) to enhance her retirement savings.
She continues to touch people’s professional lives, even in retirement, as herdream of creating a consulting business is coming true. In addition, with herexperience and insight into professional development, she is a natural serving onthe Board of “Wardrobe for Opportunity.” This organization serves economicallydisadvantaged women seeking employment in California’s Contra Costa andAlameda counties. Volunteers provide vital, and often overlooked, services such asfurnishing suitable business attire for both the interview process and the job andproviding support for career advancement. She is also Chair of the Ebony FashionShow sponsored by The Links, Inc. Oakland Bay Area Chapter (a nonprofitphilanthropic organization.)
We wish to acknowledge the help of The University of California Office of the President’s Department of Human Resources and Benefits, Department ofResearch, and the UC Berkeley Retirement Center in preparing this information.
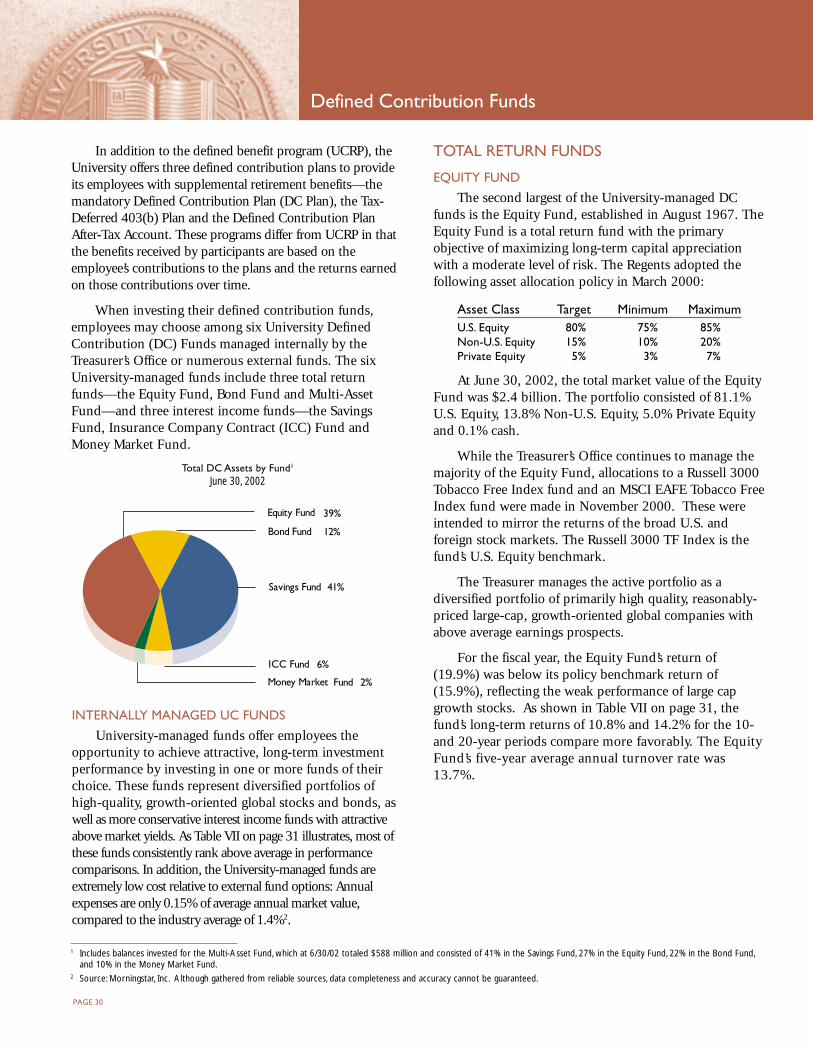
PAGE 30
Defined Contribution Funds
In addition to the defined benefit program (UCRP), theUniversity offers three defined contribution plans to provideits employees with supplemental retirement benefits—themandatory Defined Contribution Plan (DC Plan), the Tax-Deferred 403(b) Plan and the Defined Contribution PlanAfter-Tax Account. These programs differ from UCRP in thatthe benefits received by participants are based on theemployee’s contributions to the plans and the returns earnedon those contributions over time.
When investing their defined contribution funds,employees may choose among six University DefinedContribution (DC) Funds managed internally by theTreasurer’s Office or numerous external funds. The sixUniversity-managed funds include three total returnfunds—the Equity Fund, Bond Fund and Multi-AssetFund—and three interest income funds—the SavingsFund, Insurance Company Contract (ICC) Fund andMoney Market Fund.
Total DC Assets by Fund1
June 30, 2002
TOTAL RETURN FUNDS
EQUITY FUND
The second largest of the University-managed DCfunds is the Equity Fund, established in August 1967. TheEquity Fund is a total return fund with the primaryobjective of maximizing long-term capital appreciationwith a moderate level of risk. The Regents adopted thefollowing asset allocation policy in March 2000:
Asset Class Target Minimum MaximumU.S. Equity 80% 75% 85%Non-U.S. Equity 15% 10% 20%Private Equity 5% 3% 7%
At June 30, 2002, the total market value of the EquityFund was $2.4 billion. The portfolio consisted of 81.1%U.S. Equity, 13.8% Non-U.S. Equity, 5.0% Private Equityand 0.1% cash.
While the Treasurer’s Office continues to manage themajority of the Equity Fund, allocations to a Russell 3000Tobacco Free Index fund and an MSCI EAFE Tobacco FreeIndex fund were made in November 2000. These wereintended to mirror the returns of the broad U.S. andforeign stock markets. The Russell 3000 TF Index is thefund’s U.S. Equity benchmark.
The Treasurer manages the active portfolio as adiversified portfolio of primarily high quality, reasonably-priced large-cap, growth-oriented global companies withabove average earnings prospects.
For the fiscal year, the Equity Fund’s return of(19.9%) was below its policy benchmark return of(15.9%), reflecting the weak performance of large capgrowth stocks. As shown in Table VII on page 31, thefund’s long-term returns of 10.8% and 14.2% for the 10-and 20-year periods compare more favorably. The EquityFund’s five-year average annual turnover rate was13.7%.
1 Includes balances invested for the Multi-Asset Fund, which at 6/30/02 totaled $588 million and consisted of 41% in the Savings Fund, 27% in the Equity Fund, 22% in the Bond Fund,and 10% in the Money Market Fund.
2 Source: Morningstar, Inc. Although gathered from reliable sources, data completeness and accuracy cannot be guaranteed.
INTERNALLY MANAGED UC FUNDS
University-managed funds offer employees theopportunity to achieve attractive, long-term investmentperformance by investing in one or more funds of theirchoice. These funds represent diversified portfolios ofhigh-quality, growth-oriented global stocks and bonds, aswell as more conservative interest income funds with attractiveabove market yields. As Table VII on page 31 illustrates, most ofthese funds consistently rank above average in performancecomparisons. In addition, the University-managed funds areextremely low cost relative to external fund options: Annualexpenses are only 0.15% of average annual market value,compared to the industry average of 1.4%2.
Equity Fund 39%
Money Market Fund 2%
ICC Fund 6%
Bond Fund 12%
Savings Fund 41%
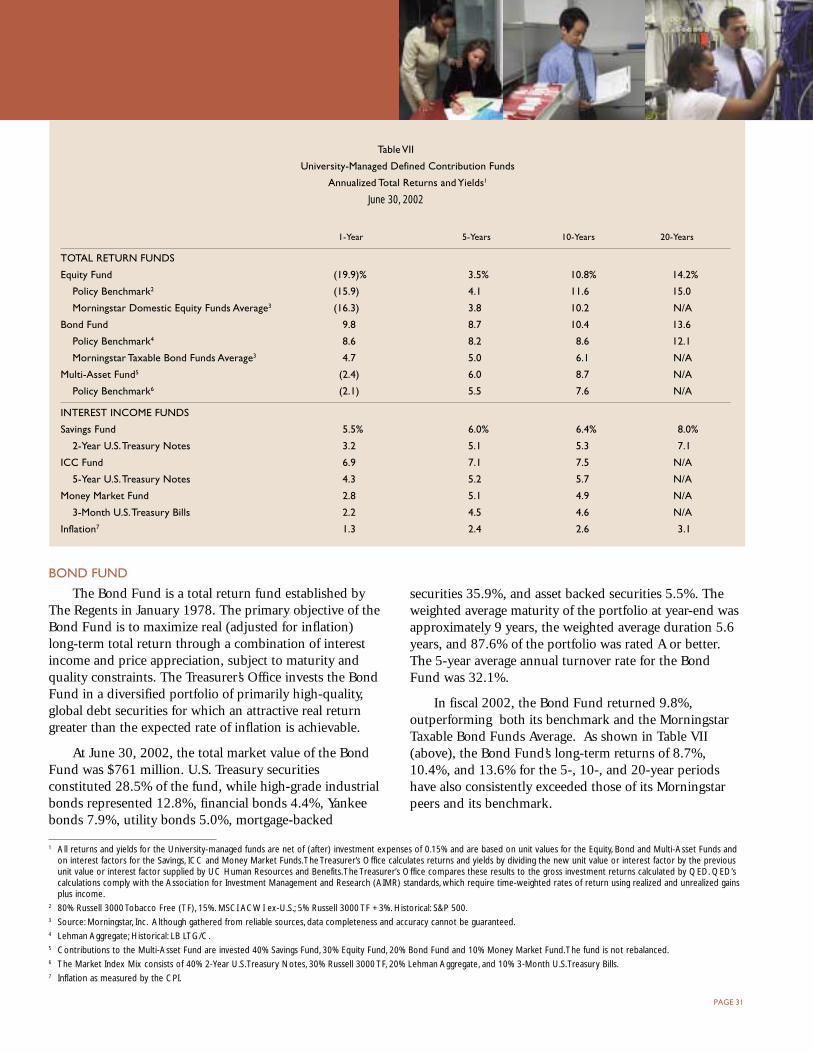
PAGE 31
Table VII
University-Managed Defined Contribution Funds
Annualized Total Returns and Yields1
June 30, 2002
1-Year 5-Years 10-Years 20-Years
TOTAL RETURN FUNDS
Equity Fund (19.9)% 3.5% 10.8% 14.2%
Policy Benchmark2 (15.9) 4.1 11.6 15.0
Morningstar Domestic Equity Funds Average3 (16.3) 3.8 10.2 N/A
Bond Fund 9.8 8.7 10.4 13.6
Policy Benchmark4 8.6 8.2 8.6 12.1
Morningstar Taxable Bond Funds Average3 4.7 5.0 6.1 N/A
Multi-Asset Fund5 (2.4) 6.0 8.7 N/A
Policy Benchmark6 (2.1) 5.5 7.6 N/A
INTEREST INCOME FUNDS
Savings Fund 5.5% 6.0% 6.4% 8.0%
2-Year U.S. Treasury Notes 3.2 5.1 5.3 7.1
ICC Fund 6.9 7.1 7.5 N/A
5-Year U.S. Treasury Notes 4.3 5.2 5.7 N/A
Money Market Fund 2.8 5.1 4.9 N/A
3-Month U.S. Treasury Bills 2.2 4.5 4.6 N/A
Inflation7 1.3 2.4 2.6 3.1
1 All returns and yields for the University-managed funds are net of (after) investment expenses of 0.15% and are based on unit values for the Equity, Bond and Multi-Asset Funds andon interest factors for the Savings, ICC and Money Market Funds. The Treasurer’s Office calculates returns and yields by dividing the new unit value or interest factor by the previousunit value or interest factor supplied by UC Human Resources and Benefits. The Treasurer’s Office compares these results to the gross investment returns calculated by QED. QED’scalculations comply with the Association for Investment Management and Research (AIMR) standards, which require time-weighted rates of return using realized and unrealized gainsplus income.
2 80% Russell 3000 Tobacco Free (TF), 15%. MSCI ACWI ex-U.S.; 5% Russell 3000 TF +3%. Historical: S&P 500.3 Source: Morningstar, Inc. Although gathered from reliable sources, data completeness and accuracy cannot be guaranteed.4 Lehman Aggregate; Historical: LB LTG/C.5 Contributions to the Multi-Asset Fund are invested 40% Savings Fund, 30% Equity Fund, 20% Bond Fund and 10% Money Market Fund. The fund is not rebalanced.6 The Market Index Mix consists of 40% 2-Year U.S. Treasury Notes, 30% Russell 3000 TF, 20% Lehman Aggregate, and 10% 3-Month U.S. Treasury Bills.7 Inflation as measured by the CPI.
BOND FUND
The Bond Fund is a total return fund established byThe Regents in January 1978. The primary objective of theBond Fund is to maximize real (adjusted for inflation)long-term total return through a combination of interestincome and price appreciation, subject to maturity andquality constraints. The Treasurer’s Office invests the BondFund in a diversified portfolio of primarily high-quality,global debt securities for which an attractive real returngreater than the expected rate of inflation is achievable.
At June 30, 2002, the total market value of the BondFund was $761 million. U.S. Treasury securitiesconstituted 28.5% of the fund, while high-grade industrialbonds represented 12.8%, financial bonds 4.4%, Yankeebonds 7.9%, utility bonds 5.0%, mortgage-backed
securities 35.9%, and asset backed securities 5.5%. Theweighted average maturity of the portfolio at year-end wasapproximately 9 years, the weighted average duration 5.6years, and 87.6% of the portfolio was rated A or better.The 5-year average annual turnover rate for the BondFund was 32.1%.
In fiscal 2002, the Bond Fund returned 9.8%,outperforming both its benchmark and the MorningstarTaxable Bond Funds Average. As shown in Table VII(above), the Bond Fund’s long-term returns of 8.7%,10.4%, and 13.6% for the 5-, 10-, and 20-year periodshave also consistently exceeded those of its Morningstarpeers and its benchmark.

PAGE 32
Defined Contribution Funds
MULTI-ASSET FUND
In September 1990, the University Administrationestablished the Multi-Asset Fund as an investment option.The Multi-Asset Fund is not a managed fund, per se, but isa combination of four existing University-managed funds,whereby contributions are invested according to a fixedpercentage: 30% in the Equity Fund, 20% in the BondFund, 40% in the Savings Fund and 10% in the MoneyMarket Fund. As such, the Fund invests in a conservativeblend of 70% fixed-income assets and 30% equity assets.Although employee contributions enter the Multi-AssetFund in a fixed percentage, the Multi-Asset Fund is notrebalanced. The actual mix of the Multi-Asset Fund willvary over time as the market values of the componentfunds fluctuate at different rates.
The market value of the Multi-Asset Fund at June 30,2002 was $588 million, and the actual asset mix was27.2% Equity Fund, 22.1% Bond Fund, 40.9% SavingsFund and 9.8% Money Market Fund.
The Multi-Asset Fund’s returns are a function of theperformance of its component funds.
INTEREST INCOME FUNDS
SAVINGS FUND
The Savings Fund, the largest DC fund, is an interestincome fund created in July 1967. The investmentobjective of the Savings Fund is to maximize interestincome returns, while protecting principal, in order toprovide a safe, low-risk investment with attractive andstable returns. As such, the Savings Fund invests 100% ingovernment, government-guaranteed and governmentagency securities of up to five years in maturity. TheTreasurer’s Office maximizes returns by altering the Fund’smaturity structure in different yield curve environments.
The Savings Fund totaled $2.6 billion at June 30,2002, and was invested 100% in AAA-rated U.S. Treasuryand federal agency securities. The weighted averagematurity of the Savings Fund was 2.1 years at June 30,2002.
The Savings Fund has historically provided a yieldgreater than that of 2-year U.S. Treasury Notes. In fiscal2002, the Savings Fund generated a yield of 5.5%,exceeding the 3.2% yield on 2-year U.S. Treasury Notes.During the past 20 years the Savings Fund generated anaverage yield of 8.0% versus 7.1% on 2-year U.S. TreasuryNotes.
INSURANCE COMPANY CONTRACT FUND
The Regents approved the Insurance CompanyContract (ICC) Fund as an investment option inSeptember 1985. The investment objective of the ICCFund is to maximize interest income while protectingprincipal. The Treasurer’s Office invests contributions tothe ICC Fund in insurance company contracts offered byselect, highly rated, financially sound insurancecompanies. Under such contracts, the insurancecompanies guarantee a fixed annual rate of interest for aspecified time period and the repayment of principal at theend of that time period. The contracts are backed by theassets of the insurance companies, and ICC Fundparticipants receive the blended rate of all contracts in thefund. The Treasurer’s Office uses staggered maturities tosystematically manage the reinvestment of maturingcontracts and to provide return stability.
At June 30, 2002, the ICC Fund totaled $377 million,with a weighted average maturity of 3.6 years.
Since inception, the ICC Fund has generated yieldsthat have exceeded those of 5-year U.S. Treasury Notes bya comfortable margin. In fiscal 2002, the ICC Fundgenerated a 6.9% yield versus 4.3% on 5-year U.S.Treasury Notes and during the past 10 years 7.5%compared to 5.7% on 5-year U.S. Treasury Notes.
MONEY MARKET FUND
The Regents approved the Money Market Fund as aninvestment option in September 1985 on therecommendation of the University Administration. TheFund’s investment objective is to maximize interest incomewhile protecting principal. The Treasurer’s Office investsthe Money Market Fund in a diversified portfolio of high-quality, short-term securities. The weighted averagematurity of the Fund may not exceed 90 days and noindividual maturity may exceed 13 months.
The Money Market Fund totaled $141 million at June30, 2002 and had a weighted average maturity of 68.0days. The portfolio was invested 59% in commercialpaper, 27% in federal agencies and 14% in U.S.government securities.
The Money Market Fund’s yields compare favorably tothose of 3-month U.S. Treasury Bills. In fiscal 2002, theMoney Market Fund generated a 2.8% yield compared to2.2% on 3-month U.S. Treasury Bills. During the past 10years, the Money Market Fund generated an average yieldof 4.9% compared to 4.6% on 3-month U.S. TreasuryBills.
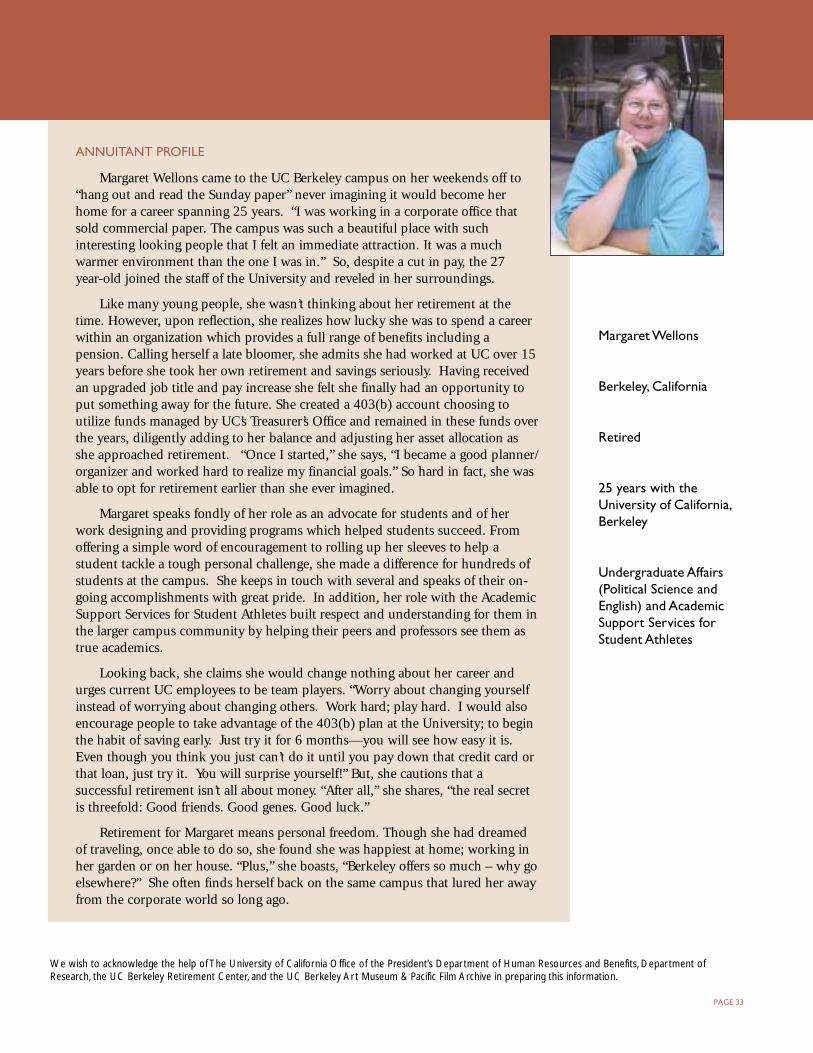
PAGE 33
ANNUITANT PROFILE
Margaret Wellons came to the UC Berkeley campus on her weekends off to“hang out and read the Sunday paper” never imagining it would become herhome for a career spanning 25 years. “I was working in a corporate office thatsold commercial paper. The campus was such a beautiful place with suchinteresting looking people that I felt an immediate attraction. It was a muchwarmer environment than the one I was in.” So, despite a cut in pay, the 27year-old joined the staff of the University and reveled in her surroundings.
Like many young people, she wasn’t thinking about her retirement at thetime. However, upon reflection, she realizes how lucky she was to spend a careerwithin an organization which provides a full range of benefits including apension. Calling herself a late bloomer, she admits she had worked at UC over 15years before she took her own retirement and savings seriously. Having receivedan upgraded job title and pay increase she felt she finally had an opportunity toput something away for the future. She created a 403(b) account choosing toutilize funds managed by UC’s Treasurer’s Office and remained in these funds overthe years, diligently adding to her balance and adjusting her asset allocation asshe approached retirement. “Once I started,” she says, “I became a good planner/organizer and worked hard to realize my financial goals.” So hard in fact, she wasable to opt for retirement earlier than she ever imagined.
Margaret speaks fondly of her role as an advocate for students and of herwork designing and providing programs which helped students succeed. Fromoffering a simple word of encouragement to rolling up her sleeves to help astudent tackle a tough personal challenge, she made a difference for hundreds ofstudents at the campus. She keeps in touch with several and speaks of their on-going accomplishments with great pride. In addition, her role with the AcademicSupport Services for Student Athletes built respect and understanding for them inthe larger campus community by helping their peers and professors see them astrue academics.
Looking back, she claims she would change nothing about her career andurges current UC employees to be team players. “Worry about changing yourselfinstead of worrying about changing others. Work hard; play hard. I would alsoencourage people to take advantage of the 403(b) plan at the University; to beginthe habit of saving early. Just try it for 6 months—you will see how easy it is.Even though you think you just can’t do it until you pay down that credit card orthat loan, just try it. You will surprise yourself!” But, she cautions that asuccessful retirement isn’t all about money. “After all,” she shares, “the real secretis threefold: Good friends. Good genes. Good luck.”
Retirement for Margaret means personal freedom. Though she had dreamedof traveling, once able to do so, she found she was happiest at home; working inher garden or on her house. “Plus,” she boasts, “Berkeley offers so much – why goelsewhere?” She often finds herself back on the same campus that lured her awayfrom the corporate world so long ago.
Margaret Wellons
Berkeley, California
Retired
25 years with theUniversity of California,Berkeley
Undergraduate Affairs(Political Science andEnglish) and AcademicSupport Services forStudent Athletes
We wish to acknowledge the help of The University of California Office of the President’s Department of Human Resources and Benefits, Department ofResearch, the UC Berkeley Retirement Center, and the UC Berkeley Art Museum & Pacific Film Archive in preparing this information.
PAGE 34
Investment Operations
Supporting the management of the portfolios is anexperienced Operations staff. The staff consists of aDirector, Assistant Director, and Supervisor with anaverage of 13 years experience in banking and/orinvestment operations and eight analysts with anaverage of 14.5 years experience in investmentaccounting and operations. This unit is responsible forinvestment accounting and reporting, as well as thecentral management of all cash services for theUniversity.
INVESTMENT ACCOUNTING
Track all investment security transactions (foreignand domestic) from origination to settlement.
Monitor and collect all investment income.
Reconcile daily all investment assets with the mastercustodian.
Monitor all transactions and holdings and reconcileall custodial records to in-house-investmentdatabases.
Calculate, analyze and report investmentperformance.
Coordinate incoming gifts with campuses and/or donorsand monitor and report receipt of security and cash gifts.
Review and upgrade portfolio accounting systemson an ongoing basis in order to remain current withindustry standards.
Provide the UCOP Endowment and InvestmentAccounting Office with investment accountingentries for input into the general ledger.
INVESTMENT REPORTING
In addition to trading and monitoring all investmentsecurity transactions and holdings, the Investment Operationsstaff calculates, analyzes and reports all performance andprovides investment accounting entries for input into theUCOP Endowment and Investment Accounting generalledger. The investment group provides all investmentinformation for the following reports:
All required reports to The Regents’ Committee onInvestments.
Performance reports on the various portfolios andseparately invested funds.
All required governmental and other regulatoryagency reports.
The Treasurer’s Annual Report.
The Retirement Investment Funds Brochure.
CASH MANAGEMENT
Sweep all depository accounts daily and transferfunds to the University’s main accounts.
Provide UCOP funds to cover all checks andelectronic fund transfers for vendor and payrollaccounts.
Provide the Endowment and Investment AccountingOffice with accounting entries for input into thegeneral ledger for all cash and STIP transactions.
The management of the portfolios is also supported bystate-of-the-art information systems and a well-establishedcustodial relationship with a leading industry provider,ensuring sound safekeeping and recording of assets.
FISCAL YEAR CHANGES
As of June 1, 2002, State Street Corporation became“book of record” for the Treasurer’s Office. This integrationwith their custody structure allows the Treasurer’s Office toutilize State Street’s accounting, performance, andanalytics systems. This change allows for an additionalverification of performance returns.
During the year, the Treasurer’s Office installedelectronic connections to the brokers, exchanges, andmarkets that execute our equity trading orders. The linksincrease the speed at which information is communicatedand improve access to sources of liquidity. Theseconnections help the staff make more timely investmentdecisions and improve the quality of trade executions. Inaddition, similar connections were installed to ourcustodian to enhance the overall efficiency of processingand clearing all securities trades. Both parts of thisinitiative should enhance the returns of the funds undermanagement.

PAGE 35
This Treasurer’s Annual Report 2001-2002 is unaudited, however these investments are included inthe following audited financial statements of the University of California: The University of CaliforniaAnnual Financial Report 2001-2002 (available on the internet at www.ucop.edu/ucophome/busfin/reports.html), The University of California Defined Contribution Plan and Tax-Deferred 403(b) Plan 2001-2002, and The University of California Retirement Plan 2001-2002 (both available on the internet athttp://atyourservice.ucop.edu/forms_pubs/categorical/misc.html).
The Treasurer’s Office established a Middle Officefunction to centralize settlement and risk responsibilities.The Middle Office administrator is responsible forconfirming all relevant trade and foreign exchangeinformation with external parties (e.g. brokers), fordisseminating trade tickets to the custodian bank,resolving all trade settlement and failed trade issues, andensuring that all corporate actions are responded to on atimely basis.
In conjunction with the Internal Audit Department,the Operations team developed a Disaster Recovery Sitelocated a few hours drive from the Oakland-based Officeof the Treasurer. System files are backed-up to thislocation nightly. In the case of an emergency situationaffecting the Office’s building or a larger geographic area,essential staff will be relocated and can begin operatingfrom this site within hours.
In March of 2002, the Banking and Treasury Servicesunit moved from the Office of the Treasurer and became apart of UCOP’s Division of Business and Finance. TheBanking and Treasury Services unit is responsible for themanagement and central oversight of all banking andrelated service facilities for the UC system including allcampuses and laboratories under the authority of TheRegents’ Committee on Finance. For current informationregarding staff and/or services contact the Division ofBusiness and Finance (available on the internet atwww.ucop.edu/finmgt/banking).

PAGE 36
FOR FURTHER INFORMATION
For more information on the University-managed funds, please refer to Retirement Investment Funds - December 2001 or log on to our website (http://www.ucop.edu/treasurer).
You may contact us in writing at the University of California, Office of the Treasurer,P.O. Box 24000, Oakland, CA 94623-1000.
www.ucop.edu/treasurer Tel. (510) 987-9600 Fax. (510) 987-9651 [email protected]

