vmware tco comparison calculator - vmware – … tco comparison calculator | methodology t echnical...
TRANSCRIPT
VMware TCO Comparison
Calculator
Methodology
T E C H N I C A L W H I T E P A P E R | M A R C H 2 0 1 8
J

VMware TCO Comparison Calculator | Methodology
T E C H N I C A L W H I T E P A P E R / 2
Contents Contents ........................................................................................................................................................ 2 Overview ........................................................................................................................................................ 3
Definitions and Objectives .......................................................................................................................... 3 User-Selectable Inputs ............................................................................................................................... 4
Host Hardware Server Cost .......................................................................................................................... 8 Server Calculations .................................................................................................................................... 9 Assumptions............................................................................................................................................... 9
Storage Cost .................................................................................................................................................. 9 Storage Calculations ................................................................................................................................ 10 Assumptions............................................................................................................................................. 10
Networking Cost ......................................................................................................................................... 11 Networking Calculations ........................................................................................................................... 11 Assumptions............................................................................................................................................. 11
Power and Cooling Cost............................................................................................................................. 11 Power and Cooling Calculations .............................................................................................................. 12 Assumptions............................................................................................................................................. 13
Data Center Real Estate Cost ..................................................................................................................... 13 Data Center Real Estate Calculations ...................................................................................................... 14 Assumptions............................................................................................................................................. 14
Guest Operating System License and Support Cost ............................................................................... 14 Guest Operating System License and Support Calculations .................................................................... 15 Assumptions............................................................................................................................................. 15
VMware Product Edition License and Support Costs ............................................................................. 15 VMware Product Edition License and Support Calculations .................................................................... 15 Assumptions............................................................................................................................................. 16
VMware Management Software Costs and Infrastructure Requirements .............................................. 16 VMware vCenter Server ........................................................................................................................... 16 VMware vRealize Operations ................................................................................................................... 17 VMware vRealize Automation .................................................................................................................. 17 VMware vRealize Log Insight ................................................................................................................... 18
Microsoft Software Cost and Infrastructure Requirements .................................................................... 19 Windows Server Hyper-V License and Support Costs ............................................................................. 19 Microsoft System Center License and Support Costs .............................................................................. 19 Microsoft System Center Infrastructure Requirements ............................................................................. 20
System Center Virtual Machine Manager ............................................................................................ 20 System Center Operations Manager ................................................................................................... 21 System Center Configuration Manager ............................................................................................... 21 System Center Data Protection Manager ............................................................................................ 21 System Center Orchestrator ................................................................................................................ 21 System Center Service Manager ......................................................................................................... 22 System Center Service Provider Foundation ....................................................................................... 23 Windows Azure Pack ........................................................................................................................... 23
Microsoft Operations Management Suite Costs ....................................................................................... 23
Operating Expenses ................................................................................................................................... 24 Operating Expenses for Common IT Scenarios ....................................................................................... 24
Third-Party Software Costs ........................................................................................................................ 26 Third-Party Software Calculations ............................................................................................................ 28 Third-Party Software Integration Costs .................................................................................................... 28

VMware TCO Comparison Calculator | Methodology
T E C H N I C A L W H I T E P A P E R / 3
Assumptions............................................................................................................................................. 28
Overview
Definitions and Objectives
In evaluating the cost of a virtualization and private cloud solution, it is essential to use a metric that not only
accounts for the cost to acquire the software and the physical infrastructure it requires, but also includes the
time and effort needed to operate the solution.
Because centralized management is a fundamental component of any virtualization and private cloud
deployment, hardware and software costs associated with related management products, such as VMware
vCenter and vRealize components, or Microsoft System Center, also need to be included. Moreover,
software comparisons must accurately consider the features each product provides; if feature gaps exist,
costs of supplementary software from the vendors or third-parties must be included for a true comparison.
As shown in Figures 1–3, VMware defines total cost of ownership (TCO) as the sum of all these cost items
separated into capital expenditures (CapEx) and operating expenditures (OpEx) over a selected period, and
cost per virtual machine (VM) as that amount divided by the number of virtual machines in the environment.
Figure 1. Capital Expenses Equation
Host hardware server costs
+ Host networking hardware costs
+ Storage costs
+ Virtualization software license costs
+ Management software license costs
+ Host and guest operating system license costs
+ Applicable third-party license costs
= Total CapEx costs
Figure 2. Operating Expenses Equation
Power and cooling costs
+ Data center space costs
+ Virtualization and management software support costs
+ Host and guest operating system support costs
+ Software-as-a-Service subscription costs
+ Third-party software support costs
+ Third-party software integration costs
+ IT administrative time costs
+ VM platform migration costs (if applicable)
= Total OpEx costs

VMware TCO Comparison Calculator | Methodology
T E C H N I C A L W H I T E P A P E R / 4
Figure 3. Cost Per Virtual Machine Equation
Total CapEx costs
+ Total OpEx costs (over selected period)
= Total cost of ownership
/ Number of VMs
= Total cost of ownership per VM
Ultimately, enterprises care about how much it will cost to run the total set of their business applications and
how efficiently they are using infrastructure. Therefore, in a virtualized IT environment, it is important to see
the costs associated with both purchase and maintenance of the system, including the IT administration
time necessary to operate and manage the platforms. Cost per VM as a metric also provides a more
condensed view of the total costs.
The VMware TCO Comparison Calculator (the Calculator) examines these metrics across two different
scenarios. The first scenario is a net-new deployment, where the Calculator assumes no existing
infrastructure and calculates the total costs associated with deploying a new, fully functional data center
running VMware or Microsoft Windows virtualization and private cloud solutions. The second scenario is a
software upgrade, where the Calculator calculates the cost of upgrading an existing vSphere deployment to
a private cloud platform based on either VMware vCloud Suite or Microsoft Hyper-V and System Center.
The Calculator performs a straightforward TCO calculation by modeling a comprehensive set of costs for
deploying, managing, and operating a virtualized infrastructure or private cloud, with the exception of
hardware equipment depreciation. This TCO (defined as CapEx plus OpEx, as shown in Figure 3) and the
cost per VM are simple and accurate metrics to compare the upfront and ongoing expenditures required.
User-Selectable Inputs
As a first step when using the VMware TCO Comparison Calculator, you must decide which scenario to use
for making the comparison—either a new infrastructure deployment or a software upgrade (vSphere to
vCloud Suite).
If you choose the new infrastructure scenario, the Calculator makes a cost comparison between VMware
and Microsoft using deployment details as defined by your inputs. The inputs for the new infrastructure
comparison are listed in Table 1.
For the software upgrade scenario, the Calculator makes a cost comparison between upgrading an existing
vSphere deployment to VMware vCloud Suite versus migrating an existing vSphere deployment to a
Microsoft Windows Server Hyper-V and System Center private cloud. The Calculator assumes no additional
virtualization host server purchases for upgrading to vCloud Suite products; however, it does include any
additional hardware costs associated with new requirements for management servers or standard practices
for VM density when changing virtualization software to a Microsoft product with lower VM density. When
upgrading an existing vSphere or vSphere with Operations Management (vSOM) deployment to vCloud
Suite, the Calculator uses VMware upgrade prices, where applicable, to minimize software license costs.
For the software upgrade scenario, iSCSI storage costs are applied to both the VMware and Microsoft
configurations.
The software upgrade scenario also includes a two-hour-per-VM IT time cost to migrate each VM from
vSphere to Windows Server Hyper-V that is based on field experience of VMware professional services
consultants. These costs are added on the Microsoft side of the comparison.
All management servers and associated databases are assumed to run on VMs. Microsoft management
server VMs are configured so the hosts provide physical memory without overcommitment to meet

VMware TCO Comparison Calculator | Methodology
T E C H N I C A L W H I T E P A P E R / 5
management server requirements, per Microsoft recommendations.1
The inputs for the software upgrade scenario are listed in Table 2.
Table 1. Creating a New Infrastructure: User-Selectable Inputs
INP U T DE S C RI P TI ON
Number of VMs Select the number of VMs to deploy. Values from 5 to 5,000 are allowed. Usually one or
more VMs are deployed for each virtualized application.
Virtualization host type Virtualization hosts are the servers on which users will install the hypervisor and run
virtualized applications. The following virtualization hosts are available:
• Server A: $7,000 for 2-socket, 12-core processors, 64GB RAM, 2 10Gb network
ports
• Server B: $10,000 for 2-socket, 14-core processors, 128GB RAM, 2 10Gb network
ports
• Server C: $34,000 for 4-socket, 18-core processors, 512GB RAM, 4 10Gb network
ports
Servers B and C are more powerful than Server A and will typically run more VMs than
Server A. The server price does not include costs for shared storage (like HBAs, SAN
switches, or disks), networking infrastructure (like switches), electricity, cooling, or space.
Storage type Users can select the type of shared storage that meets their business needs. Shared
storage options for virtual disks on VMs include the following:
• Fibre Channel SAN: Assumes storage cost of $6/GB usable. SAN switches and
HBAs are additional and are included in the total cost for storage.
• iSCSI SAN: Assumes storage cost of $5/GB usable.
• Network-attached storage (NAS): Assumes storage cost of $4/GB usable.
• VMware vSAN: Available for VMware products only. Assumes storage cost of
$2/GB usable.
Storage costs are based on the VMware vSAN Hybrid TCO and Sizing Calculator.
Product edition The Calculator allows users to select the VMware product edition that best meets their
business goals. Each edition differs in features and pricing, and you can use the product
selection wizard to help narrow down the choices by selecting the features you need.
The full list of VMware product editions in the new infrastructure scenario is as follows:
• vSphere Essentials 6.5
• vSphere Essentials Plus 6.5
• vSphere Standard 6.5
• vSphere Enterprise Plus 6.5
• vSphere with Operations Management Enterprise Plus 6.5
• vCloud Suite Standard 7
• vCloud Suite Advanced 7
• vCloud Suite Enterprise 7
vSphere Essentials and Essentials Plus deployments are limited to six processors, so the
Calculator will disable selection of those editions if the calculated number of processors
exceeds that number. For the upgrade scenario, users can select as their current VMware
product any of the vSphere Essentials, vSphere, and vSphere with Operations Management
editions. For the desired VMware product edition, any of the vCloud Suite editions may be
selected.
Comparisons are made with Windows Server 2016 Hyper-V and System Center 2016.
Depending on the VMware product selected, Microsoft Operations Management Suite
subscriptions or additional third-party software licenses may be added to the Microsoft costs
to more accurately provide functional parity between the two environments.
1 Microsoft Azure Pack distributed deployment hardware and software requirements
VMware TCO Comparison Calculator | Methodology
T E C H N I C A L W H I T E P A P E R / 6
INP U T DE S C RI P TI ON
Electricity Approximate cost per commercial kWh in the region where the data center is located. The
Calculator allows users to choose from three alternatives:
• Low: $0.070/kWh (contiguous US low)
• Average: $0.106/kWh (contiguous US average)
• High: $0.150/kWh (contiguous US high)
If the user selects a different local currency than US dollars, electricity costs are displayed in
terms of local currency per kWh.
Data center facilities Approximate annualized data center capital costs, including space, cooling systems, air
distribution, UPS, switchgear, and fire suppression, plus floor space-based variable costs in
the region where the data center is located. The Calculator allows users to choose from
three alternatives:
• Low: Fully burdened data center facility cost of $147/sq. ft per year.
• Average: Fully burdened data center facility cost of $290/ sq. ft per year.
• High: Fully burdened data center facility cost of $428/sq. ft per year.
If the user selects a different local currency than US dollars, floor space costs are displayed
in terms of local currency per square meter.
Capital costs are calculated assuming 10-year depreciation.
VMs per CPU The number of VMs per host server CPU (or socket) to be deployed. Users can select from
4 through 20 VMs per CPU.
Additional VMware VMs
per CPU
The incremental number of VMs to run per CPU on the VMware vSphere hosts. Users can
select from 1 through 10 VMs. This value represents the greater VM density users expect to
obtain on VMware vSphere. The smallest value of one additional VM per CPU represents a
minimum VM density advantage as supported by user reports, independent analyst opinion,
and independent lab testing (data available from VMware upon request). VM densities with
vSphere 6.5 can be more than 50% higher than with Hyper-V 2016 when allowances for
restarting VMs after host failures are considered, due to more effective memory
management in vSphere.
Time period for
comparison
The number of years of operation to use in the TCO calculation. Users can select from three
to six years.
Local currency The currency to be used by the Calculator. Choices are:
• US Dollars (USD)
• Australian Dollars (AUD)
• Euros (EUR)
• UK Pounds (GBP)
• Japanese Yen (JPY)
The Calculator uses VMware and Microsoft prices as listed on March 7, 2018 for each
currency. Prices for third-party software and other USD-based costs in the Calculator are
converted to local currencies using published exchange rates as of March 7, 2018.
Table 2. Upgrading an Existing Infrastructure: User-Selectable Inputs
INP U T DE S C RI P TI ON
Current vSphere product Select a vSphere product that is currently in use in your environment. Available options are:
• vSphere Essentials
• vSphere Essentials Plus
• vSphere Standard
• vSphere Enterprise Plus
• vSphere with Operations Management Enterprise Plus
Number of current host
machine CPUs
Enter the number of CPUs (processors) currently running VMware products. The Calculator
uses this amount to determine the number of product licenses to purchase in the software
upgrade.
VMware TCO Comparison Calculator | Methodology
T E C H N I C A L W H I T E P A P E R / 7
INP U T DE S C RI P TI ON
Number of VMs in the
current environment
Enter the number of VMs running in your environment. Values between 5 and 5,000 are
allowed. The Calculator uses this as the number of desired VMs. The number of VMs
divided by the number of current host machine CPUs must be between 4.0 and 20.0
(inclusive) to fall within the typical range of VM densities reported by VMware customers.
vCloud Suite upgrade Enter the vCloud Suite product you are interested in upgrading to and comparing with a
migration to Windows Server Hyper-V and System Center. Available upgrade editions are:
• vCloud Suite Standard 7
• vCloud Suite Advanced 7
• vCloud Suite Enterprise 7
The Calculator will apply listed VMware upgrade prices, where applicable, to calculate the
license cost of vCloud Suite upgrades.
Virtualization host type Virtualization hosts are the servers on which users will install the hypervisor and run
virtualized applications. The following virtualization hosts are available:
• Server A: $7,000 for 2-socket, 12-core processors, 64GB RAM, 2 10Gb network
ports
• Server B: $10,000 for 2-socket, 14-core processors, 128GB RAM, 2 10Gb network
ports
• Server C: $34,000 for 4-socket, 18-core processors, 512GB RAM, 4 10Gb network
ports
Servers B and C are more powerful than Server A and will typically run more VMs than
Server A. The server price does not include costs for shared storage (like HBAs, SAN
switches, or disks), networking infrastructure (like switches), electricity, cooling, or space.
Electricity Approximate cost per commercial kWh in the region where the data center is located. The
Calculator allows users to choose from three alternatives:
Low: $0.070/kWh (contiguous US low)
Average: $0.106/kWh (contiguous US average)
High: $0.150/kWh (contiguous US high)
If the user selects a different local currency than US dollars, electricity costs are displayed in
terms of local currency per kWh.
Data center facilities Approximate annualized data center capital costs, including space, cooling systems, air
distribution, UPS, switchgear, and fire suppression, plus floor footage-based variable costs
in the region where the data center is located. The Calculator allows users to choose from
three alternatives:
Low: Fully burdened data center facility cost of $147/ sq. ft per year.
Average: Fully burdened data center facility cost of $290/ sq. ft per year.
High: Fully burdened data center facility cost of $428/ sq. ft per year.
If the users select a different local currency than US dollars, floor space costs are displayed
in terms of local currency per square meter.
Capital costs are calculated assuming 10-year depreciation.
Time period for
comparison
The number of years of operation to use in the TCO calculation. Users can select from three
to six years.
Local currency The currency to be used by the Calculator. Choices are:
• US Dollars (USD)
• Australian Dollars (AUD)
• Euros (EUR)
• UK Pounds (GBP)
• Japanese Yen (JPY)
The Calculator uses VMware and Microsoft prices as listed on March 7, 2018 for each
currency. Prices for third-party software and other USD-based costs in the Calculator are
converted to local currencies using published exchange rates as of March 7, 2018.

VMware TCO Comparison Calculator | Methodology
T E C H N I C A L W H I T E P A P E R / 8
Host Hardware Server Cost Host hardware server cost represents the capital expenditure for server hardware. The Calculator assumes
that management components run in VMs hosted on the same type of server selected by the user for
standard VMs. The number of physical hosts required to support the Microsoft management server VMs
and management database VMs is calculated so that the hosts provide full physical RAM equal to or
greater than the recommended memory allocations for those management VMs. The inputs for the host
hardware server cost are listed in Table 3.
Table 3. Inputs for Server Cost Calculation
INP U T DE S C RI P TI ON V ALUE S OU RC E
Number of VMs Estimated number
of VMs that the user
plans to deploy
Between 5 and 5,000 User input
Host unit cost Cost of a
virtualization host
excluding hardware
support
Value depends on server type selection:
• Server A: $7,000 for 2-socket, 12-core
processors, 64GB RAM, 2 10Gb network
ports
• Server B: $10,000 for 2-socket, 14-core
processors, 128GB RAM, 2 10Gb network
ports
• Server C: $34,000 for 4-socket, 18-core
processors, 512GB RAM, 4 10Gb network
ports
Cost of three years of hardware support is added to
the unit price (assumed to be 15 percent of unit price
for all server types).
For more details, see Appendix B of VMware TCO
Comparison Calculator – Results Report.
Unit cost of virtualization host = server price +
3-year support cost.
User input
VM density Number of VMs per
virtualization host
Baseline value set to seven VMs per CPU for
VMware product editions and to six VMs per CPU
for Microsoft product editions in the new
infrastructure scenario.
In the upgrade scenario, the baseline value is set to
the user input VM density (with a lower bound at 4.0
VMs/CPU and an upper bound of 20.0) for the
VMware density and to 25 percent lower than the
user input for the Microsoft density (with a lower
bound at 1.0 VMs/CPU). For more details, see
VMware TCO Comparison Calculator – Results
Report.
Based on VMware
customer averages,
Independent analyst
opinion (see this
Gartner study) and
independent studies
(available from
VMware upon
request).
Physical hosts for
management
server and
database VMs
Number of physical
hosts needed to
support all required
management VMs
Physical hosts of the same type (A, B, or C) selected
by the user are added to support the management
server and database VMs based on the product
selected and VM population. For VMware, additional
hosts are added to keep the VM density less than or
equal to the user’s input. For Microsoft, the number
of physical hosts is determined by the total
recommended virtual RAM calculated for the
management VMs so that no memory
overcommitment occurs.
Microsoft Azure Pack
documentation
recommends against
overcommitting RAM
for management
VMs (see footnote
1.)

VMware TCO Comparison Calculator | Methodology
T E C H N I C A L W H I T E P A P E R / 9
Server Calculations
1. Number of hosts = number of VMs / number of VMs per host.
2. Number of additional physical hosts for management server and database VMs: The value depends on
the size of the environment (number of VMs and number of managed hosts) and the product edition
selected. The calculated management server and database VMs are assumed to run on additional
physical hosts, the number of which is calculated as above.
3. Cost of servers = (number of hosts * host unit cost) + (number of additional hosts required for
management server and database VMs * host unit cost).
Note: Numbers of servers are rounded up to the closest integer.
Assumptions
Server price is inclusive of internal disk storage for system software and controllers. It does not include the
cost of HBAs (included in storage cost) and operating systems (included in OS software cost.)
In the upgrade scenario, for all users at 4.0 VMs per CPU density and higher, the Calculator assumes that
the density is the same for the new software and that no other servers are needed beyond any additional
hosts for the increased number of management VMs. However, there are differences in density capabilities
between Microsoft and VMware. For this reason, the Calculator may include purchase of additional
virtualization hosts to accommodate the lower density when migrating to Windows Server Hyper-V and
System Center.
Storage Cost Storage cost represents the capital expenditure for storage hardware given the number of VMs specified as
input to the Calculator. The following storage technologies are available in the new infrastructure scenario:
• Fibre Channel
• iSCSI
• NAS
• VMware vSAN: VMware-specific hyperconverged storage option
Note: For comparison purposes, users must select from either Fibre Channel, iSCSI, or NAS for the
Microsoft side.
As shown in Table 4, the following items are included in storage type:
• HBAs: For Fibre Channel SAN only
• SAN switches: For Fibre Channel SAN only
• Disk storage
VMware TCO Comparison Calculator | Methodology
T E C H N I C A L W H I T E P A P E R / 1 0
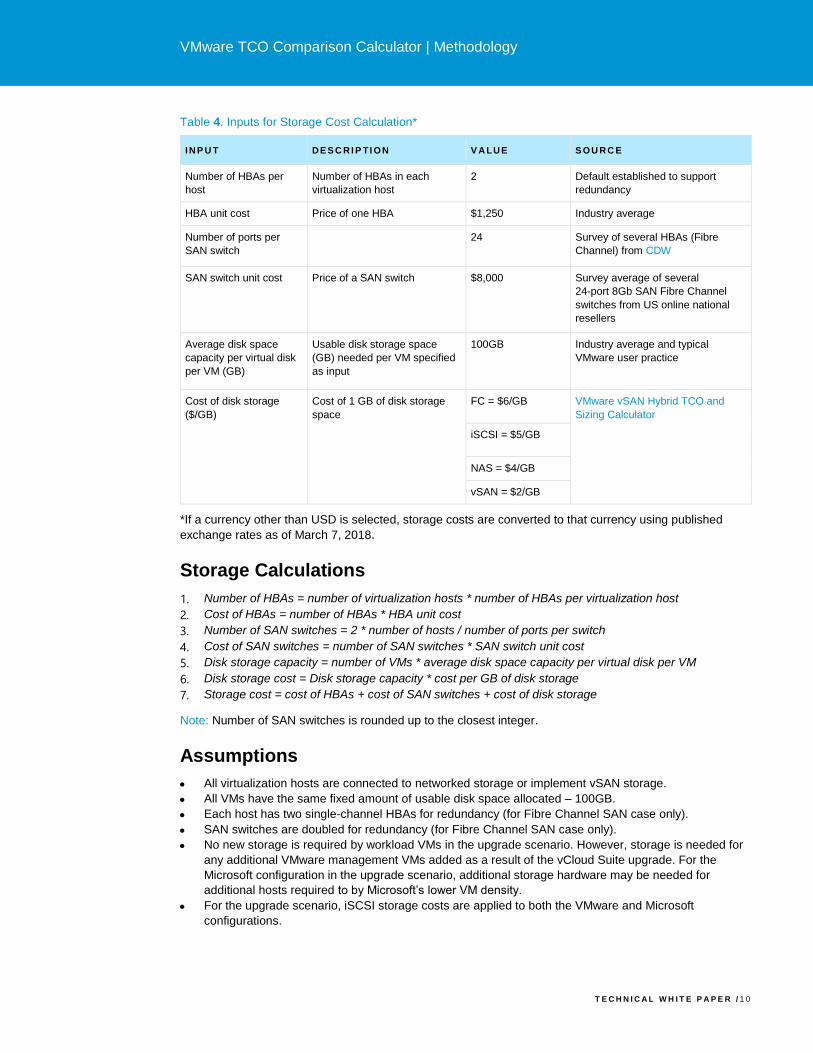
Table 4. Inputs for Storage Cost Calculation*
INP U T DE S C RI P TI ON V ALUE S OU RC E
Number of HBAs per
host
Number of HBAs in each
virtualization host
2 Default established to support
redundancy
HBA unit cost Price of one HBA $1,250 Industry average
Number of ports per
SAN switch
24 Survey of several HBAs (Fibre
Channel) from CDW
SAN switch unit cost Price of a SAN switch $8,000 Survey average of several
24-port 8Gb SAN Fibre Channel
switches from US online national
resellers
Average disk space
capacity per virtual disk
per VM (GB)
Usable disk storage space
(GB) needed per VM specified
as input
100GB Industry average and typical
VMware user practice
Cost of disk storage
($/GB)
Cost of 1 GB of disk storage
space
FC = $6/GB VMware vSAN Hybrid TCO and
Sizing Calculator
iSCSI = $5/GB
NAS = $4/GB
vSAN = $2/GB
*If a currency other than USD is selected, storage costs are converted to that currency using published
exchange rates as of March 7, 2018.
Storage Calculations
1. Number of HBAs = number of virtualization hosts * number of HBAs per virtualization host
2. Cost of HBAs = number of HBAs * HBA unit cost
3. Number of SAN switches = 2 * number of hosts / number of ports per switch
4. Cost of SAN switches = number of SAN switches * SAN switch unit cost
5. Disk storage capacity = number of VMs * average disk space capacity per virtual disk per VM
6. Disk storage cost = Disk storage capacity * cost per GB of disk storage
7. Storage cost = cost of HBAs + cost of SAN switches + cost of disk storage
Note: Number of SAN switches is rounded up to the closest integer.
Assumptions
• All virtualization hosts are connected to networked storage or implement vSAN storage.
• All VMs have the same fixed amount of usable disk space allocated – 100GB.
• Each host has two single-channel HBAs for redundancy (for Fibre Channel SAN case only).
• SAN switches are doubled for redundancy (for Fibre Channel SAN case only).
• No new storage is required by workload VMs in the upgrade scenario. However, storage is needed for
any additional VMware management VMs added as a result of the vCloud Suite upgrade. For the
Microsoft configuration in the upgrade scenario, additional storage hardware may be needed for
additional hosts required to by Microsoft’s lower VM density.
• For the upgrade scenario, iSCSI storage costs are applied to both the VMware and Microsoft
configurations.

VMware TCO Comparison Calculator | Methodology
T E C H N I C A L W H I T E P A P E R / 1 1
Networking Cost Networking cost represents the capital expenditure for network switches required for the hosts needed to
support the workload VMs specified as input to the Calculator (Table 5) and the calculated number of
management VMs.
Table 5. Inputs for Networking Cost Calculation*
INP U T DE S C RI P TI ON V ALUE S OU RC E
Number of network ports
per virtualization host
Value depends on
selection of server type:
• Server A: 2 10Gb
ports per host
• Server B: 2 10Gb
ports per host
• Server C: 4 10Gb
ports per host
Industry average for workload
production servers and typical
VMware customer practice
Number of ports per
network switch
24 Average from survey of VMware
customers
Network switch unit cost Price of a managed
24-port 10Gb network
switch
$6,500 Survey of
various switches at large
US resellers online
*If a currency other than USD is selected, networking costs are converted to that currency using published
exchange rates as of March 7, 2018.
Networking Calculations
1. Total number of network ports = number of network ports per virtualization host * number of
virtualization hosts
2. Number of network switches = total number of network ports / number of ports per network switch
3. Networking cost = number of network switches * network switch unit cost
Note: Number of network switches is rounded up to the closest integer.
Assumptions
Other networking costs such as cabling are omitted for simplicity.
Power and Cooling Cost Table 6 lists inputs for calculating power and cooling costs in the Calculator. For simplicity, the Calculator
considers only the direct operating and cooling power consumed by server hardware, leaving out potential
power and cooling consumption for networking, storage, and other data center infrastructure.
The operating power consumed by server hardware can be calculated by adding up the power ratings of
each server in the data center. Because this number represents maximum power used, it should be derated
to achieve steady-state power consumption. The steady-state constant was determined empirically.
According to American Power Conversion Corporation, “…the nameplate rating of most IT devices is well in
excess of the actual running load by a factor of at least 33 percent.”2 Forrester Research corroborates this
2 Sawyer, Richard, “Calculating Total Power Requirements for Data Centers,” American Power Conversion, 2011.

VMware TCO Comparison Calculator | Methodology
T E C H N I C A L W H I T E P A P E R / 1 2
idea, indicating that idle x86 servers consume between 30–40 percent of maximum (rated) power.3
In addition to operating power, servers produce heat and require substantial cooling to keep them running at
prescribed temperatures. According to experiments completed in HP Laboratories, cooling equipment
consumes 0.8W of power for every 1W of heat dissipation in the data center (designated in this document
as the load factor, or L). Forrester Research confirmed this figure, which estimates that 0.5W to 1.0W of
power is required to dissipate 1W of heat.
Table 6. Inputs for Power and Cooling Cost Calculation*
INP U T DE S C RI P TI ON V ALUE S OU RC E
Server nameplate
operating power
Peak rated server power
consumption
Value depends on server type
selection:
• Server A: 500 watts
• Server B: 500 watts
• Server C: 1,200 watts
Server manufacturer’s Web
site
Electricity price per
hour
Commercial price per
kilowatt-hour of electricity
• Low: $0.070/kWh
(contiguous US low)
• Average: $0.106/kWh
(contiguous US average)
• High: $0.150/kWh
(contiguous US high)
Energy Information
Administration
Nameplate to steady-
state power
conversion
Steady-state constant used
to convert nameplate power
consumption to steady-state
0.67 American Power
Conversion4 (On average,
nameplate ratings are 33
percent higher than steady-
state load.)
Cooling load factor Estimated cooling load
factor (watts of cooling
electricity needed to
dissipate 1 watt of heat)
0.80 Empirically determined in
HP Laboratories
Airflow redundancy Airflow redundancy required
to cool the data center
125 percent 25-percent increment over
current airflow needed to
support proper cooling
(SearchDataCenter.com)5
Airflow derating Percentage of airflow that is
available for cooling server
heat
80 percent SearchDataCenter.com
(see previous row)
Data center operating
hours
Product of hours per day,
days per week, weeks per
year, and number of years
that the data center is
operational (“server on”
hours)
8,736 hours (24x7x52) per year Annual operating hours for
typical 24x7x52 operation
*If a currency other than USD is selected, power and cooling costs are converted to that currency using
published exchange rates as of March 7, 2018.
Power and Cooling Calculations
1. Actual operating power = nameplate power * nameplate to steady-state conversion factor
3 Fichera, Richard, “Power And Cooling Heat Up The Data Center,” Forrester Research, Inc., September 21, 2011. 4 Sawyer, Richard, “Calculating Total Power Requirements for Data Centers,” American Power Conversion, 2011. 5 McFarlane, Robert, “Let’s Add an Air Conditioner,” SearchDataCenter news article, published November 30, 2005.

VMware TCO Comparison Calculator | Methodology
T E C H N I C A L W H I T E P A P E R / 1 3
2. Actual cooling power = actual operating power * cooling load factor * (1 + airflow redundancy required
in data center) / airflow derating
3. Power and cooling cost = (number of virtualization hosts) * (actual operating power + actual cooling
power) * electricity price per hour / 1,000 * data center operating hours per year * number of years
selected
Assumptions
This calculation is for operating power consumed during the selected time period only and includes the
operating costs of the power delivery and cooling systems.
Data Center Real Estate Cost Savings in data center real estate are achieved by reducing the number of physical servers consuming
valuable data center space. Reducing the number of physical servers enables current data center space to
be reclaimed, so building out future data center facilities can be avoided or deferred.
Due to the special infrastructure (racks, cooling, power systems, acoustics, and disaster resilience) required
in data centers, they are often significantly more expensive to build than standard commercial properties.
Industry sources6 show that data center costs per square foot vary significantly as a function of local costs,
data center size, and the level of infrastructure redundancy required.
VMware infrastructure can reduce a company’s physical server count and data center footprint today and
reduce the need for future construction of new data centers—compared to virtualization products that
provide lower VM density. The Calculator accounts for the total yearly data center carrying costs; it
combines the monthly real-estate rental cost, data center facilities cost, and power and cooling build-out
costs (Table 7).
Table 7. Inputs for Data Center Real Estate Calculation*
INP U T DE S C RI P TI ON V ALUE S OU RC E
Rack units
consumed per
server
Average rack size
for current server
hardware (in
number of U per
server)
• 2 CPU = 1U
(server type A)
• 2 CPU = 2U
(server type B)
• 4 CPU = 2U
(server type C)
Typical server configurations from
manufacturer Web sites
Unit space per rack Average units that
can be installed in a
rack
Set to 24 by default Typical usable data center rack space,
accounting for a 42U rack, but 43 percent
consumed with needed networking, power
distribution, cable management,
keyboard/display, and spacing (source:
VMware)
Floor space per rack Square feet per
rack: square meters
per rack
27 square feet
(approximately);
2.51 square meters
(approximately)
Typical data center floor space per rack7
6 Schneider Electric, “Data Center Capital Cost Calculator” 7 Schneider Electric (blog), “Data Center Capital Cost Calculator – A Tool to Help Align Your Data Center Business
Requirements with Your Project Budget”

VMware TCO Comparison Calculator | Methodology
T E C H N I C A L W H I T E P A P E R / 1 4
INP U T DE S C RI P TI ON V ALUE S OU RC E
Capital cost for data
center facilities
build-out (per
square foot)
Capital cost for data
center facilities
build-out (includes
cooling systems, air
distribution, UPS,
switchgear, and fire
suppression)
• Low: $1,150 per
sq. ft*
• Average:
$2,500 per
sq. ft*
• High: $3,800 sq.
ft*
Schneider Electric’s Data Center Capital Cost
Calculator (“Low” assumes a 500-rack facility
with low installation labor rates and non-
redundant power and cooling infrastructure.
“High” assumes a 25-rack facility with high
installation labor costs and 2N power and
cooling infrastructure redundancy. These costs
are amortized over 10 years in this model.)
Years to amortize
build-out costs
Average weighted
depreciation to use
for build-out and
equipment (in years)
10 years Estimates of useful life for typical data center
build-out
Annual cost for the
space (lease, rent,
mortgage)
Cost for the space
(lease, rent,
mortgage) in dollars
per square foot per
year or square
meter per year
• Low: $32 per
sq. ft*. per year
• Average: $40
per sq. ft* per
year
• High: $48 per
sq. ft* per year
Cost for data center space lease in US (varies
based on local data center facilities costs)
*If a currency other than USD is selected, data center real estate costs are displayed in terms of cost per
square meter and are converted to that currency using published exchange rates as of March 7, 2018.
Data Center Real Estate Calculations
1. Total number of racks = round up (number of servers [by type] * rack size consumed per server / unit
space per rack)
2. Total area consumed by servers = number of racks * floor space of a single rack
3. Average fully burdened data center cost per unit of floor space per year = cost to build data center
facilities / years to amortize build-out costs + annual space lease or allocated annual real estate cost
per unit of floor space
4. Data center real estate cost = total area consumed by servers * average fully burdened data center
cost per year * number of years selected
Assumptions
This calculation is for expenses related to data center space consumed by servers only over the number of
years selected by the user.
Guest Operating System License and Support
Cost A guest operating system is the OS that runs in a VM. The cost of a guest OS includes the cost of both
licensing and support. Pricing and packaging for licensing and support depend on the type of guest OS.
For simplicity, the Calculator assumes that all VMware and Microsoft virtualization hosts are licensed for
Windows Server Datacenter Edition, which includes rights to run an unlimited number of Windows Server
VMs. All VMs are assumed to run Windows Server as the guest OS. Pricing details can be found at the
Microsoft License Advisor. The Calculator applies per-core pricing that went into effect with the Windows
Server 2016 and System Center 2016 releases.
The Calculator also accounts for the cost of support that Microsoft offers through the Software Assurance
program. Microsoft Software Assurance is billed at 25 percent of license price per year and does not include

VMware TCO Comparison Calculator | Methodology
T E C H N I C A L W H I T E P A P E R / 1 5
24x7 phone access to Microsoft technical support—as does the VMware Support and Subscription (SnS)
that is required with the VMware licenses. The Calculator also assumes that Microsoft configurations
include Microsoft Professional Support purchased separately from Microsoft ($499 per incident8.) VMware
SnS entitles customers to all software releases and updates, as well as VMware Technical Support
assistance for issues related to VMware products or any guest OS supported on vSphere.
Guest Operating System License and Support Calculations
1. Number of Windows Server Datacenter licenses = number of virtualization hosts * number of CPUs per
host * number of cores per CPU / 2 (Windows Server is priced per two-core pair)
2. Total cost of guest OS license and Software Assurance = number of Windows Server Datacenter core
pair licenses * (Windows Server Datacenter Edition core pair unit license cost + Software Assurance
unit cost)
Assumptions
• For Microsoft products, “Open, No Level” list pricing is used.
• Microsoft Software Assurance cost is 25 percent of the product license price per year.
• Baseline Microsoft Professional Support incidents are estimated at 24 per year, plus 2.5 incidents per
100 VMs per year.
• System Center prices are based on the listed prices in the Microsoft License Advisor. License and
Software Assurance costs are reported separately in the Calculator with license costs included in
capital expenses and Software Assurance costs included in operational expenses.
• Windows Server prices are based on the listed prices in the Microsoft License Advisor.
• Windows Server and System Center costs are calculated using the per-core pricing that went into effect
with the release of the 2016 versions of those products. Windows Server per-core prices are applied to
both the VMware and Microsoft configurations.
• List software prices are used in the Calculator—no unpublished discounts are applied.
VMware Product Edition License and Support
Costs VMware offers an array of industry-leading virtualization platforms for building virtual infrastructures and
private clouds. vSphere Essentials, vSphere, vSphere with Operations Management, and vCloud Suite
product editions let users run business-critical applications with confidence and respond faster to business
needs.
The licensing model for VMware product editions is per-processor (socket). The Calculator derives the
number of required licenses by totaling the number of processors for all virtualization hosts. In the new
infrastructure scenario, this calculation is based on user input for number of VMs and for desired VM
density. In the upgrade scenario, the Calculator takes the user input for existing host CPUs with vSphere
products installed as the number of licenses to upgrade. VMware management servers are assumed to run
in VMs and additional virtualization hosts are added as needed to support the management VMs.
The Calculator also takes into account the cost of VMware Production Support and Subscription for each
year of the selected time period. Pricing for the vSphere Essentials, vSphere Essentials Plus, vSphere and
vSphere with Operations Management Enterprise Plus editions can be found on the vSphere product page.
This pricing also appears in Appendix A of VMware TCO Comparison Calculator – Results Report.
VMware Product Edition License and Support Calculations
1. Number of VMware product licenses = (number of virtualization hosts * number of CPUs per host)
8 Microsoft Per-Incident Support Pricing

VMware TCO Comparison Calculator | Methodology
T E C H N I C A L W H I T E P A P E R / 1 6
2. Total cost of VMware product licenses and support = number of VMware product licenses * (VMware
product license cost + production SnS unit cost for each year)
3. For vCloud Suite product editions in the upgrade scenario, vCloud Suite upgrade prices are used
where available to reduce costs. In some cases where upgrade prices are not available, full vCloud
Suite license prices are used
Assumptions
• For the new infrastructure scenario, list software prices are used in the Calculator—no unpublished
discounts are applied.
• The VMware Acceleration Kits for vSphere with Operations Management editions are not included in
the Calculator.
VMware Management Software Costs and
Infrastructure Requirements In addition to licenses and support for each virtualization management solution, the Calculator accounts for
the cost of the hardware and software infrastructure (operating systems and databases) necessary to
deploy each management solution. The Calculator assumes all management components run in VMs.
Such VMs will run on the virtualization hosts in addition to the application VMs. All the VMware
management servers and databases considered by the Calculator are available as prepackaged virtual
appliances, or they can be deployed in VMs. Because the Calculator assumes that all virtualization hosts
are licensed with Windows Server 2016 Datacenter Edition, there is no additional OS cost for management
and database servers. VMware vRealize Automation is the only VMware management component requiring
Microsoft SQL Server licenses and support, and that cost is included by the Calculator.
The infrastructure resources required by the management components are calculated in terms of the virtual
CPUs and virtual RAM required for the management VMs. Those vCPU and vRAM resources are
documented in VMware best practices and sizing guidelines.
VMware vCenter Server
VMware vCenter Server is a centralized management solution required for all vSphere, vSphere with
Operations Management, and vCloud Suite configurations. vCenter is priced by the number of server hosts
or VMs on which it runs. For vSphere Essentials and Essentials Plus deployments, the Calculator assumes
that the vCenter Server Foundation product bundled with those editions is used. For all other product
editions, vCenter Server Standard is added. vCenter pricing details can be found on the vSphere product
page or in Appendix A of VMware TCO Comparison Calculator – Results Report.
Each instance of vCenter Server supports as many as 2,000 vSphere hosts, or as many as 35,000 VMs.
vCenter Server virtual appliance requirements are detailed in Table 8. Those requirements include the
virtual CPU and vitual RAM resources required by an embedded Platform Services Controller.

VMware TCO Comparison Calculator | Methodology
T E C H N I C A L W H I T E P A P E R / 1 7
Table 8. VMware vCenter Server Virtual Appliance Requirements9
S I ZE M AN AGE D HO S TS (UP T O)
M AN AGE D V M S (UP T O)
V IR T U AL CP US V IR T U AL R AM (G B )
Tiny 10 100 4 10
Small 100 1,000 6 18
Medium 400 4,000 10 26
Large 1,000 10,000 18 34
VMware vRealize Operations
vRealize Operations is a component of all vSphere with Operations Management and vCloud Suite
configurations. vRealize Operations provides monitoring, performance analytics, capacity management, and
optimization for VMware infrastructure.
vRealize Operations is deployed as one or more virtual appliances. The Calculator assumes that vRealize
Operations is deployed in a single-node configuration with a virtual appliance that is scaled based on the
number of managed objects. The number of managed objects is the sum of the VMs, hosts, and datastores
monitored by vRealize Operations. The Calculator assumes that each VM is assigned 100GB of storage
space and each datastore is 500GB in size.
Each instance of the vRealize Operations virtual appliance can support as many as 15,000 managed
objects. Table 9 shows the vRealize Operations virtual appliance resource requirements as a function of the
number of managed objects.
Table 9. vRealize Operations Virtual Appliance Requirements10
V IR T U AL AP P LI AN CE S I ZE
M AN AGE D OB JE C TS (UP T O)
V IR T U AL CP US V IR T U AL R AM ( GB )
Extra small 250 2 8
Small 2,400 4 16
Medium 8,500 8 32
Large 15,000 16 48
VMware vRealize Automation
VMware vRealize Automation is bundled with vCloud Suite Advanced and Enterprise editions. vRealize
Automation provides private cloud management functions, including advanced cloud automation and self-
service portals, as well as application provisioning. For all vCloud Suite editions, the VMware vRealize
Business for Cloud product, which provides private cloud cost showback automation, is also included.
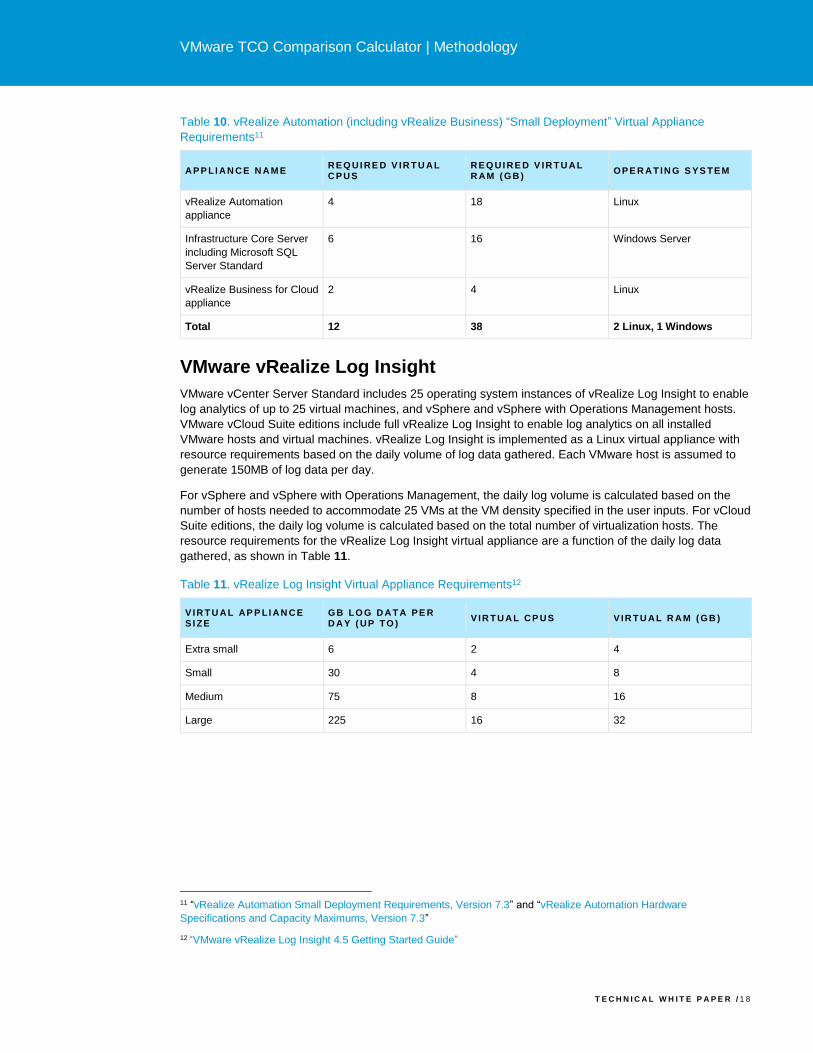
vRealize Automation is configured as a group of virtual appliances. The Calculator uses the Small Deployment Profile option for vRealize Automation, which requires six virtual appliances and scales to support up to 10,000 managed VMs (Table 10).
9 Hardware Requirements for the vCenter Server Appliance and Platform Services Controller Appliance 10 VMware Knowledge Base, “vRealize Operations Manager 6.6 and 6.6.1 Sizing Guidelines (2150421)”
VMware TCO Comparison Calculator | Methodology
T E C H N I C A L W H I T E P A P E R / 1 8
Table 10. vRealize Automation (including vRealize Business) “Small Deployment” Virtual Appliance
Requirements11
AP P LI AN CE N AM E RE Q UI RE D V IR T U AL CP US
RE Q UI RE D V IR T U AL R AM ( GB )
OP E R AT IN G S YS TE M
vRealize Automation
appliance
4 18 Linux
Infrastructure Core Server
including Microsoft SQL
Server Standard
6 16 Windows Server
vRealize Business for Cloud
appliance
2 4 Linux
Total 12 38 2 Linux, 1 Windows
VMware vRealize Log Insight
VMware vCenter Server Standard includes 25 operating system instances of vRealize Log Insight to enable
log analytics of up to 25 virtual machines, and vSphere and vSphere with Operations Management hosts.
VMware vCloud Suite editions include full vRealize Log Insight to enable log analytics on all installed
VMware hosts and virtual machines. vRealize Log Insight is implemented as a Linux virtual appliance with
resource requirements based on the daily volume of log data gathered. Each VMware host is assumed to
generate 150MB of log data per day.
For vSphere and vSphere with Operations Management, the daily log volume is calculated based on the
number of hosts needed to accommodate 25 VMs at the VM density specified in the user inputs. For vCloud
Suite editions, the daily log volume is calculated based on the total number of virtualization hosts. The
resource requirements for the vRealize Log Insight virtual appliance are a function of the daily log data
gathered, as shown in Table 11.
Table 11. vRealize Log Insight Virtual Appliance Requirements12
V IR T U AL AP P LI AN CE S I ZE
GB LO G D AT A P E R D AY ( UP TO )
V IR T U AL CP US V IR T U AL R AM ( GB )
Extra small 6 2 4
Small 30 4 8
Medium 75 8 16
Large 225 16 32
11 “vRealize Automation Small Deployment Requirements, Version 7.3” and “vRealize Automation Hardware
Specifications and Capacity Maximums, Version 7.3”
12 “VMware vRealize Log Insight 4.5 Getting Started Guide”

VMware TCO Comparison Calculator | Methodology
T E C H N I C A L W H I T E P A P E R / 1 9
Microsoft Software Cost and Infrastructure
Requirements
Windows Server Hyper-V License and Support Costs
Windows Server Hyper-V is the server virtualization hypervisor from Microsoft. Hyper-V is bundled with
Windows Server and does not require additional licensing.
As described in the Guest Operating System License and Support Cost section above, the Calculator
assumes that Windows Server Datacenter Edition with Hyper-V is licensed on all virtualization hosts. Both
the VMware and Microsoft configurations evaluated by the Calculator use the Windows Server list pricing
found at the Microsoft License Advisor site. Consequently, there are no additional costs required to license
Hyper-V. The Calculator applies per-core pricing that went into effect with the Windows Server 2016
release.
The Calculator accounts for the cost of support and maintenance that Microsoft offers through the Software
Assurance program. Software Assurance is priced at 25 percent of the product license list price per year.
The VMware Production SnS included with the VMware configurations (except vSphere Essentials, which
offers only per-incident support) in the Calculator provides unlimited 24x7 phone support, but Microsoft
Software Assurance only provides access to web-based support forums. To bring Microsoft support into
parity, the Calculator includes the cost of Microsoft Professional Support incidents, with the number of
incidents scaled based on the size of the VM environment (Figure 4). Microsoft Professional Support is
priced at $499 per incident as listed on the Microsoft support options page. If vSphere Essentials is selected
as the VMware product, the same per-incident support costs are added, but using the $299 per incident
pricing for vSphere Essentials listed on the vSphere pricing page.
Figure 4. Microsoft Premier Support Costs Included by the Calculator
Baseline incidents per year
Additional incidents based on
deployment size Cost
24 2.5 incidents per year
per 100 VMs $499/phone incident
Microsoft System Center License and Support Costs
System Center is a systems management software suite from Microsoft. It includes Virtual Machine
Manager (SCVMM), Operations Manager (SCOM), Configuration Manager (SCCM), Data Protection
Manager (SCDPM), Orchestrator (SCOrch), Service Manager (SCSM), and Service Provider Foundation
(SCSPF). Each System Center module provides a subset of the functionalities and features required to
manage a virtual infrastructure and private cloud. For more details, refer to the System Center product
page.
Just as use of VMware vCenter Server is optional with vSphere, System Center is not strictly required to run
Hyper-V, but because centralized virtualization management is part of the majority of today’s deployments
of server virtualization, the Calculator only provides cost comparisons that include management software
and its required infrastructure.
Although cost comparisons should be made between solutions with the same feature sets, there isn’t a
System Center setup that perfectly matches VMware vSphere with Operations Management or vCloud
Suite capabilities. Table 12 shows the System Center and other Microsoft management components that
the Calculator includes when comparing configurations with the various VMware product editions. The

VMware TCO Comparison Calculator | Methodology
T E C H N I C A L W H I T E P A P E R / 2 0
Calculator also includes Windows Azure Pack (WAP) in Microsoft configurations compared with VMware
vCloud Suite Advanced and Enterprise editions because WAP is the Microsoft-recommended solution for
creating private cloud self-service portals with Windows Server Hyper-V.
Table 12. Microsoft Management Products Included as a Function of VMware Product Selected
V M W AR E P RO DU C T S E L E C TE D
SCVMM SCOM SCCM SCDPM SCOrch SCSM SCSPF WAP
vSphere
Essentials ✓ ✓
vSphere
Essentials Plus ✓ ✓ ✓
vSphere
Standard ✓ ✓ ✓ ✓
vSphere
Enterprise Plus ✓ ✓ ✓ ✓
vSOM
Enterprise Plus ✓ ✓ ✓ ✓
vCloud Suite
Standard ✓ ✓ ✓ ✓ ✓ ✓
vCloud Suite
Advanced ✓ ✓ ✓ ✓ ✓ ✓ ✓ ✓
vCloud Suite
Enterprise ✓ ✓ ✓ ✓ ✓ ✓ ✓ ✓
The Calculator applies per-core pricing, which went into effect with the System Center 2016 release.
System Center licenses are sold in units of core pairs, with a minimum of eight core pair licenses required
per server. Server management licenses are required for managed devices that run server OS
environments. The Calculator uses System Center Datacenter Server licenses for all Hyper-V host servers.
Open No Level list pricing for System Center is used in the Calculator. Some System Center components
require SQL Server databases. Those SQL Server licenses are included with System Center licenses, so
there is no additional cost.
Microsoft System Center Infrastructure Requirements
The Calculator assumes that all management servers and databases required by the Microsoft
configurations run in VMs. The Calculator sums the CPU and memory requirements for each System
Center and WAP component using Microsoft recommendations as documented below. Microsoft
recommends against memory overcommitment using Dynamic Memory for some of its management
components. Therefore, the Calculator adds sufficient physical server hosts to the configuration to ensure
that the total memory requirements for the management VMs are met with dedicated physical host memory.
For example, if the total RAM required by the System Center and WAP management VMs equals 128GB
and the user has selected Server A hosts (each of which provides 64GB of physical RAM), two Server A
hosts would be added to the Microsoft configuration to meet the management VM requirements. The same
method is used to size the physical host capacity required for management VMs in the VMware
configuration.
System Center Virtual Machine Manager
SCVMM requires VMs for its Management Server, Database, and Library Server components. The
recommended resources required for the VMs for deployments of up to 1,000 managed Windows Server

VMware TCO Comparison Calculator | Methodology
T E C H N I C A L W H I T E P A P E R / 2 1
Hyper-V hosts are shown in Table 13.
Table 13. Microsoft System Center Virtual Machine Manager Management VM Resource Requirements13
S CV M M C OM P O NE N T M AN AGE D HO S TS RE C OM M E N DE D V IR T U AL CP US
RE C OM M E N DE D V IR T U AL R AM ( GB )
Management Server Up to 1,000 16 16
Database Up to 1,000 16 16
Library Server Up to 1,000 4 4
System Center Operations Manager
Microsoft recommends SCOM be configured with multiple server VMs for management and database
functions. The number of those VMs and their recommended resources vary with the number of managed
VMs, as shown in Table 14. Note that Microsoft’s System requirements for System Center 2016 Operations
Manager documentation states that the “Operations manager 2012 Sizing helper” is valid for estimating
SCOM 2016 requirements, and that is the source of the figures shown below.
Table 14. Microsoft System Center Operations Manager Management VM Resource Requirements1415
M AN AGE D V M S (U P T O)
S COM M AN AGE M E N T V M S R E Q UI RE D
RE C OM M E N DE D T O T AL V IR T U AL CP US
RE C OM M E N DE D T O T AL V IR T U AL R AM ( GB )
500 3 12 32
1,000 5 20 72
3,000 6 32 88
6,000 6 44 104
System Center Configuration Manager
The Calculator assumes SCCM is configured as a “Stand-alone primary site server with a database site role
on the same server,” as documented in Microsoft’s “Recommended hardware for System Center
Configuration Manager”. SCCM requires a single VM with 16 virtual CPUs and 96GB of virtual RAM.
System Center Data Protection Manager
Microsoft documents16 that a single SCDPM server can support 100 servers. To be conservative, the
Calculator uses a value of 300 Windows Server VMs per SCDPM server. Each SCDPM server VM is
allocated four virtual CPUs and 8GB of virtual RAM, as recommended for the SQL Server database used by
SCDPM.17
System Center Orchestrator
SCOrch requires four VMs, as shown in Table 15.
13 VMM system requirements, System Center 2016 14 System requirements for System Center 2016 - Operations Manager 15 Microsoft System Center 2012 Operations Manager Sizing Helper Tool 16 Get ready to deploy DPM servers 17 Preparing your environment for System Center 2016 Data Protection Manager
VMware TCO Comparison Calculator | Methodology
T E C H N I C A L W H I T E P A P E R / 2 2
Table 15. Microsoft System Center Orchestrator Management VM Resource Requirements1819
OR CHE S TR AT O R COM P O NE N T RE C OM M E N DE D V IR T U AL C P US RE C OM M E N DE D V IR T U AL R A M (G B )
Management Server 2 2
Runbook Server 2 2
Web Service 2 2
Runbook Designer 2 2
Total 8 8
System Center Service Manager
Microsoft documents the server VM, virtual CPU and virtual RAM requirements for various SCSM
deployment scenarios, as shown in Table 16.
Table 16. Microsoft System Center Service Manager Management VM Resource Requirements20
DE P L O YM E NT S CE N AR I O
S CS M C OM P O NE N T RE C OM M E N DE D V IR T U AL CP US
RE C OM M E N DE D V IR T U AL R AM ( GB )
Small (up to 2,000
computers)
Management Server 4 6
Data Warehouse 2 5
Self-Service Portal 2 5
Total 8 16
Medium (up to 3,000
computers)
Management Server 4 8
Data Warehouse 4 8
Self-Service Portal 8 32
Total 16 48
Large (up to 20,000
computers)
Management Server 4 8
Data Warehouse 4 8
Database 8 32
Data Warehouse Database 8 8
18 How to install System Center 2016 - Orchestrator 19 System requirements for System Center 2016 - Orchestrator 20 Recommended deployment topology scenarios for Service Manager

VMware TCO Comparison Calculator | Methodology
T E C H N I C A L W H I T E P A P E R / 2 3
DE P L O YM E NT S CE N AR I O
S CS M C OM P O NE N T RE C OM M E N DE D V IR T U AL CP US
RE C OM M E N DE D V IR T U AL R AM ( GB )
Self-Service Portal web
content
4 16
Self-Service Portal
SharePoint
4 8
Total 32 80
System Center Service Provider Foundation
Microsoft’s recommended system requirements for SCSPF are two virtual CPU cores and 16GB of virtual
memory.21
Windows Azure Pack
Microsoft recommends a “distributed deployment” of WAP for production environments.22 A distributed
deployment requires 8 VMs and a total of 16 virtual CPUs and 64GB virtual RAM (with no use of dynamic
memory.)
Microsoft Operations Management Suite Costs
The cost of Microsoft Operations Management Suite (OMS) subscriptions is added to the operational costs
of the Microsoft configuration in some cases to better achieve functional parity with the VMware products
selected. vSphere with Operations Management and the vCloud Suite editions include vRealize Operations,
which provides management dashboard and analytics features not available in System Center 2016.
Additionally, vRealize Automation is included with vCloud Suite Advanced and Enterprise Editions, giving
those products automation, application provisioning and application monitoring capabilities not available in
System Center 2016. The Calculator will include OMS subscription costs as shown in Table 17.
21 SPF system requirements 22 Windows Azure Pack system requirements overview

VMware TCO Comparison Calculator | Methodology
T E C H N I C A L W H I T E P A P E R / 2 4
Table 17. Microsoft Operations Management Suite subscriptions included based on VMware product
selected23
VMware Product Selected
Microsoft
OMS
Subscription
Added
V S P HE RE
V S P H E R E W I T H O P E R A -T I O N S M G M T
V C LO UD S UI TE
E S S E S S + S T D E N T+ E N T+ S T D A D V E N T
OMS Add-on
for System
Center E1
($13/VM/mo)
✓ ✓ ✓
OMS Add-on
for System
Center E2
($28/VM/mo)
✓
Operating Expenses With the expanding breadth of capabilities provided by virtualization, as well as the increasing size of
virtualization deployments, the cost of oversight for these environments is escalating. The role of IT within
organizations now extends from managing physical servers to maintaining the entire virtualized environment
and networks. Virtualization management software from both VMware and Microsoft attempts to simplify
common IT tasks associated with operating a virtualized environment and private cloud, but there remains a
gap in the amount of time required for IT personnel to perform these scenarios on the two platforms. The
Calculator takes into account the time required for a system administrator to complete the common
recurring tasks that occur during the time period selected by the user—and the cost associated with that
administrator’s time.
Operating Expenses for Common IT Scenarios
In independent studies commissioned by VMware, the system administrator work effort to complete an
assortment of common operational tasks was measured to compare VMware and Microsoft server
virtualization and private cloud platform products. The products tested include VMware vSphere 6.5 and
vCloud Suite 7, and Windows Server 2016 Hyper-V and Microsoft System Center 2016. The scenario tasks
measured are as follows:
1. Installing and configuring the platform
2. Deploying private cloud tenants
3. Creating private cloud self-service portals
4. Creating and deploying unencrypted VM templates
5. Modifying VM templates
6. Configuring security and deploying encrypted VM templates
7. Creating and deploying multi-VM application templates
8. Setting up and maintaining management dashboard for monitoring
9. Configuring and maintaining log file monitoring and analysis
10. Configuring and generating private cloud chargeback reports
23 Microsoft Operations Management Suite Pricing and Licensing Datasheet, March 2017

VMware TCO Comparison Calculator | Methodology
T E C H N I C A L W H I T E P A P E R / 2 5
11. Configuring and maintaining capacity management
12. Applying hypervisor/OS patches to private cloud server nodes
13. Adding storage and balancing capacity
14. Creating self-service catalog entries for non-deployment activities
15. Migrating to Windows Server 2016 Hyper-V and System Center 2016 from a vSphere deployment
Task 15 is a migration cost associated with moving from vSphere to Windows Server Hyper-V and System
Center; the cost is included in the comparison if the user selects the software upgrade scenario. The
migration cost is assumed to be two hours of system administrator time per VM, based on customer
experience.
The Calculator only applies scenario task costs when the selected VMware product edition actually has the
capabilities associated with that scenario. For example, costs for Task 3 (creating private cloud self-service
portals) would only be counted if the user has selected a vCloud Suite Advanced or Enterprise edition
product. Table 18 shows the task scenario costs that are counted for each product edition selected.
Table 18. Scenarios Counted by Product Edition Selected
Note: These scenario costs are included in the TCO Comparison.
OP E R AT IN G S CE N AR I OS
V S P HE RE
V S P H E R E W I T H O P E R A -T I O N S M G M T
V C LO UD S UI TE
E S S E S S + S T D E N T+ E N T+ S T D A D V E N T
Installing and configuring
the platform ✓* ✓* ✓** ✓** ✓*** ✓† ✓†† ✓††
Deploying private cloud
tenants ✓ ✓ ✓
Creating private cloud self-
service portals ✓ ✓
Creating and deploying
unencrypted VM templates ✓ ✓ ✓ ✓ ✓ ✓ ✓ ✓
Modifying VM templates ✓ ✓ ✓ ✓
Configuring security and
deploying encrypted VM
templates
✓ ✓ ✓ ✓ ✓
Creating and deploying
multi-VM application
templates
✓
Setting up and maintaining
management dashboard for
monitoring
✓ ✓ ✓ ✓
Configuring and maintaining
log file monitoring and
analysis
✓ ✓ ✓ ✓ ✓ ✓
Configuring and generating
private cloud chargeback
reports
✓ ✓ ✓
Configuring and maintaining
capacity management ✓ ✓ ✓ ✓

VMware TCO Comparison Calculator | Methodology
T E C H N I C A L W H I T E P A P E R / 2 6
OP E R AT IN G S CE N AR I OS
V S P HE RE
V S P H E R E W I T H O P E R A -T I O N S M G M T
V C LO UD S UI TE
E S S E S S + S T D E N T+ E N T+ S T D A D V E N T
Applying hypervisor/OS
patches to private cloud
server nodes
✓ ✓ ✓ ✓ ✓ ✓ ✓ ✓
Adding storage and
balancing capacity ✓ ✓ ✓ ✓ ✓
Creating self-service
catalog entries for non-
deployment activities
✓ ✓
Migrating to Windows
Server 2016 Hyper-V and
System Center 2016 from a
vSphere deployment
✓**** ✓**** ✓**** ✓**** ✓****
* vCenter and vSphere host installation and configuration costs are included.
** vCenter, vSphere host, and vRealize Log Insight installation and configuration costs are included.
*** vCenter, vSphere host, vRealize Log Insight and vRealize Operations installation and configuration costs are
included.
† vCenter, vSphere host, vRealize Log Insight, vRealize Operations, and vRealize Business installation and
configuration costs are included.
†† vCenter, vSphere host, vRealize Log Insight, vRealize Operations, vRealize Business, and vRealize Automation
installation and configuration costs are included.
**** Migration costs are included with the Microsoft configuration only if the user selects the software upgrade scenario.
Independent lab tests conducted in June, 2017 revealed that most of these relevant scenario tasks could be
completed faster with VMware products than with Microsoft products. The Calculator considers how many
times each scenario task would be repeated over the selected time period for the infrastructure size, based
on the number of VMs selected. For the scenario task cost calculations, the Calculator takes the average
fully loaded cost per minute of senior system administrator time, $1.08,24 and multiplies it by the number of
minutes required to carry out the scenario over the selected time period. If the user selects a currency other
than USD, the labor rate is converted using published exchange rates as of March 7, 2018. Only those
scenarios applying to the selected VMware product edition are counted in the total costs. For more
information about the scenarios and the methodology used for testing, see Table 11 of Appendix A in
VMware TCO Comparison Calculator – Results Report. The independent studies comparing VMware and
Microsoft system administrator task operational costs are available upon request from VMware.
Third-Party Software Costs When you evaluate a virtualization solution, it is important to consider the full range of features and
capabilities that each individual product has to offer. Although the virtualization platforms offered by both
VMware and Microsoft have features in common, out-of-the-box capabilities of specific products vary by
edition. To best compare product editions offered by VMware and Microsoft, the Calculator takes into
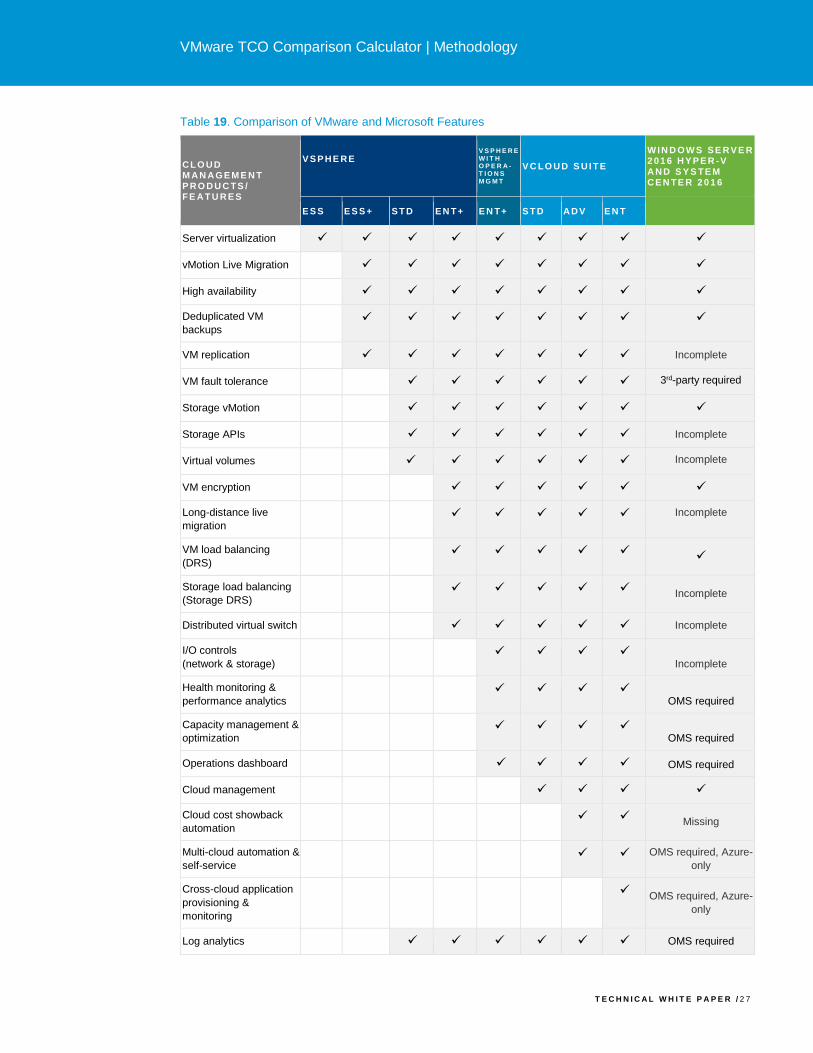
account features available in each separate product edition, as compared in Table 19.
24 According to Salary.com, the U.S. national average total compensation for senior systems administrators was
$134,643 as of June 12, 2017. Labor cost per minute is calculated based on 52 working weeks, 40 hours of work time per
week.
VMware TCO Comparison Calculator | Methodology
T E C H N I C A L W H I T E P A P E R / 2 7
Table 19. Comparison of VMware and Microsoft Features
CL O UD M AN AGE M E N T P RO DU C TS / FE AT U RE S
V S P HE RE
V S P H E R E W I T H O P E R A -T I O N S M G M T
V C LO UD S UI TE
W IN D OW S S E RV E R 2 01 6 H Y P E R -V AND S Y S TE M CE N TE R 2 0 1 6
E S S E S S + S T D E N T+ E N T+ S T D A D V E N T
Server virtualization ✓ ✓ ✓ ✓ ✓ ✓ ✓ ✓ ✓
vMotion Live Migration ✓ ✓ ✓ ✓ ✓ ✓ ✓ ✓
High availability ✓ ✓ ✓ ✓ ✓ ✓ ✓ ✓
Deduplicated VM
backups ✓ ✓ ✓ ✓ ✓ ✓ ✓ ✓
VM replication ✓ ✓ ✓ ✓ ✓ ✓ ✓ Incomplete
VM fault tolerance ✓ ✓ ✓ ✓ ✓ ✓ 3rd-party required
Storage vMotion ✓ ✓ ✓ ✓ ✓ ✓ ✓
Storage APIs ✓ ✓ ✓ ✓ ✓ ✓ Incomplete
Virtual volumes ✓ ✓ ✓ ✓ ✓ ✓ Incomplete
VM encryption ✓ ✓ ✓ ✓ ✓ ✓
Long-distance live
migration ✓ ✓ ✓ ✓ ✓ Incomplete
VM load balancing
(DRS) ✓ ✓ ✓ ✓ ✓
✓
Storage load balancing
(Storage DRS) ✓ ✓ ✓ ✓ ✓
Incomplete
Distributed virtual switch ✓ ✓ ✓ ✓ ✓ Incomplete
I/O controls
(network & storage) ✓ ✓ ✓ ✓
Incomplete
Health monitoring &
performance analytics ✓ ✓ ✓ ✓
OMS required
Capacity management &
optimization ✓ ✓ ✓ ✓
OMS required
Operations dashboard ✓ ✓ ✓ ✓ OMS required
Cloud management ✓ ✓ ✓ ✓
Cloud cost showback
automation
✓ ✓ Missing
Multi-cloud automation &
self-service
✓ ✓ OMS required, Azure-
only
Cross-cloud application
provisioning &
monitoring
✓ OMS required, Azure-
only
Log analytics ✓ ✓ ✓ ✓ ✓ ✓ OMS required

VMware TCO Comparison Calculator | Methodology
T E C H N I C A L W H I T E P A P E R / 2 8
Depending on the specific VMware product edition and the features listed with that product, Windows
Server Hyper-V and System Center may not match the complete range of capabilities. In the event of a
feature gap, the Calculator includes the cost of applicable third-party software to cover that gap. In addition
to the need to add Microsoft Operations Management Suite subscriptions for feature gaps shown in Table
19, VM fault tolerance is a vSphere feature missing from Hyper-V. The license and support costs to add a
third-party product filling that gap are shown in Table 20.
Table 20. Third-Party Software and Pricing
FE AT U RE S UG GE S TE D TH IR D -P AR T Y S O F TW ARE
L ICE NS E /US AG E C OS T S UP P OR T C OS T
VM fault tolerance Stratus everRun Enterprise Edition $6,486/CPU25 $1,297/CPU per year25
Note: Third-party software pricing is current as of June 10, 2017.
The Calculator takes the user’s VMware product edition input and compares features of that product with
those shown in Table 19. If the Calculator finds feature gaps, it assumes the user will purchase the
applicable software from Table 20 to supplement features missing from a System Center deployment.
Products for which Stratus everRun Enterprise is added to the Microsoft cost:
• vSphere Standard
• vSphere Enterprise Plus
• vSphere with Operations Management Enterprise Plus
• vCloud Suite Standard
• vCloud Suite Advanced
• vCloud Suite Enterprise
Third-Party Software Calculations
The total cost for Stratus everRun Enterprise is price per CPU * number of host CPUs for the licenses.
Third-Party Software Integration Costs
Incorporating a third-party product into a virtualized infrastructure or private cloud requires extra effort to
integrate the software with the primary platform and additional administrative time to develop and operate
the processes to combine the products. The Calculator estimates those integration costs by adding 33
percent of the third-party product license costs as an additional operating expense.
Assumptions
Only a subset of applications normally require fault tolerance, so the Calculator assigns Stratus everRun
Enterprise licenses to 10 percent of the Microsoft host CPUs.
If a currency other than USD is selected, third-party software prices are converted to that currency using
published exchange rates as of March 7, 2018.
25 Stratus Technologies everRun Enterprise pricing

VMware, Inc. 3401 Hillview Avenue, Palo Alto CA 94304 USA Tel 877-486-9273 Fax 650-427-5001 www.vmware.com
Copyright © 2018 VMware, Inc. All rights reserved. This product is protected by U.S. and international copyright and intellectual property laws.
VMware products are covered by one or more patents listed at http://www.vmware.com/go/patents. VMware is a registered trademark or trademark of
VMware, Inc. and its subsidiaries in the United States and other jurisdictions. All other marks and names mentioned herein may be trademarks of their
respective companies.