pearson edexcel level 1/level 2 gcse (9–1) statistics
TRANSCRIPT

Centre Number Candidate Number
Write your name hereSurname Other names
Total Marks
Paper Reference
*S59306A0124*S59306A©2018 Pearson Education Ltd.
6/1/6/4/6/1/
Turn over
Instructions
• Use black ink or ball-point pen.• Fill in the boxes at the top of this page with your name,
centre number and candidate number.• Answer all questions.• Answer the questions in the spaces provided
– there may be more space than you need.• Scientific calculators may be used. • You must show all your working out with your answer clearly identified
at the end of your solution.
Information
• The total mark for this paper is 80• The marks for each question are shown in brackets
– use this as a guide as to how much time to spend on each question.
Advice
• Read each question carefully before you start to answer it.• Try to answer every question.• Check your answers if you have time at the end.
StatisticsPaper 1
Foundation TierSpecimen Papers Set 1
Time: 1 hour 30 minutes 1ST0/1FYou must have:Ruler graduated in centimetres and millimetres, protractor, pen, HB pencil, eraser, scientific calculator.
Pearson Edexcel Level 1/Level 2 GCSE (9–1)

2
*S59306A0224*
D
O N
OT W
RITE IN TH
IS AREA
D
O N
OT W
RITE IN TH
IS AREA
D
O N
OT W
RITE IN TH
IS AREA
D
O N
OT
WRI
TE IN
TH
IS A
REA
D
O N
OT
WRI
TE IN
TH
IS A
REA
D
O N
OT
WRI
TE IN
TH
IS A
REA
Answer ALL questions.
Write your answers in the spaces provided.
You must write down all the stages in your working.
1 The children’s television show Blue Peter has featured dogs, cats, parrots and tortoises as pets over the years.
The incomplete pictogram shows information about the numbers of dogs, cats and parrots.
Key:
represents 2 pets
dog
cat
parrot
tortoise
(Source: Wikipedia)
There have been 5 tortoises on Blue Peter.
(a) Complete the pictogram.(1)
On Blue Peter there have been more cats than parrots.
(b) Work out how many more.
.. . . . . . . . . . . . . . . . . . . . . . . . . . . . . . . . . . . . . . . . . . . . . . . . . . . . . .
(2)
Amy thinks that there have been more than 25 pets on Blue Peter.
(c) Is Amy correct? Give a reason for your answer.
.. . . . . . . . . . . . . . . . . . . . . . . . . . . . . . . . . . . . . . . . . . . . . . . . . . . . . . . . . . . . . . . . . . . . . . . . . . . . . . . . . . . . . . . . . . . . . . . . . . . . . . . . . . . . . . . . . . . . . . . . . . . . . . . . . . . . . . . . . . . . . . . . . . . . . . . . . . . . . . . . . . . . . . . . . . . . . . . . . . . . . . . . . . . . . . . . . . . . . . . . . . . . . . . . . . . . . . . . . . . . . . . . . . . . . . . . . . . . . . . . . .
. . . . . . . . . . . . . . . . . . . . . . . . . . . . . . . . . . . . . . . . . . . . . . . . . . . . . . . . . . . . . . . . . . . . . . . . . . . . . . . . . . . . . . . . . . . . . . . . . . . . . . . . . . . . . . . . . . . . . . . . . . . . . . . . . . . . . . . . . . . . . . . . . . . . . . . . . . . . . . . . . . . . . . . . . . . . . . . . . . . . . . . . . . . . . . . . . . . . . . . . . . . . . . . . . . . . . . . . . . . . . . . . . . . . . . . . . . . . . . . . . . .
. . . . . . . . . . . . . . . . . . . . . . . . . . . . . . . . . . . . . . . . . . . . . . . . . . . . . . . . . . . . . . . . . . . . . . . . . . . . . . . . . . . . . . . . . . . . . . . . . . . . . . . . . . . . . . . . . . . . . . . . . . . . . . . . . . . . . . . . . . . . . . . . . . . . . . . . . . . . . . . . . . . . . . . . . . . . . . . . . . . . . . . . . . . . . . . . . . . . . . . . . . . . . . . . . . . . . . . . . . . . . . . . . . . . . . . . . . . . . . . . . . .
(2)
(Total for Question 1 is 5 marks)

3
*S59306A0324* Turn over
D
O N
OT W
RITE IN TH
IS AREA
D
O N
OT W
RITE IN TH
IS AREA
D
O N
OT W
RITE IN TH
IS AREA
D
O N
OT
WRI
TE IN
TH
IS A
REA
D
O N
OT
WRI
TE IN
TH
IS A
REA
D
O N
OT
WRI
TE IN
TH
IS A
REA
2 The table shows information about the number of men and the number of women in each of the National Parliaments of 10 countries in 2017
Country Number of men Number of women Total number of membersAustralia 107 43 150Canada 247 88 335China 2215 709 2924France 428 149 577Germany 397 233 630Japan 431 44 475Portugal 150 80 230Spain 213 137 350UK 455 195 650USA 348 83 431
(Source: www.ipu.org)
(a) Write down the number of men in the National Parliament of Portugal.
.. . . . . . . . . . . . . . . . . . . . . . . . . . . . . . . . . . . . . . . . . . . . . . . . . . . . . .
(1)
One country has twice as many women in its National Parliament as does Japan. (b) Write down the name of this country.
.. . . . . . . . . . . . . . . . . . . . . . . . . . . . . . . . . . . . . . . . . . . . . . . . . . . . . . . . . . . . . . . . . . . . . . . . . . . . . . . . . . . . . . . . . . . . . . . . . . . . . . . . . . . . .
(1)
Tina says,
“About a quarter of the members of the National Parliament of China are women”.
(c) Is Tina correct? Give a reason for your answer.
.. . . . . . . . . . . . . . . . . . . . . . . . . . . . . . . . . . . . . . . . . . . . . . . . . . . . . . . . . . . . . . . . . . . . . . . . . . . . . . . . . . . . . . . . . . . . . . . . . . . . . . . . . . . . . . . . . . . . . . . . . . . . . . . . . . . . . . . . . . . . . . . . . . . . . . . . . . . . . . . . . . . . . . . . . . . . . . . . . . . . . . . . . . . . . . . . . . . . . . . . . . . . . . . . . . . . . . . . . . . . . . . . . . . . . . . . . . . . . . . . . .
. . . . . . . . . . . . . . . . . . . . . . . . . . . . . . . . . . . . . . . . . . . . . . . . . . . . . . . . . . . . . . . . . . . . . . . . . . . . . . . . . . . . . . . . . . . . . . . . . . . . . . . . . . . . . . . . . . . . . . . . . . . . . . . . . . . . . . . . . . . . . . . . . . . . . . . . . . . . . . . . . . . . . . . . . . . . . . . . . . . . . . . . . . . . . . . . . . . . . . . . . . . . . . . . . . . . . . . . . . . . . . . . . . . . . . . . . . . . . . . . . . .
. . . . . . . . . . . . . . . . . . . . . . . . . . . . . . . . . . . . . . . . . . . . . . . . . . . . . . . . . . . . . . . . . . . . . . . . . . . . . . . . . . . . . . . . . . . . . . . . . . . . . . . . . . . . . . . . . . . . . . . . . . . . . . . . . . . . . . . . . . . . . . . . . . . . . . . . . . . . . . . . . . . . . . . . . . . . . . . . . . . . . . . . . . . . . . . . . . . . . . . . . . . . . . . . . . . . . . . . . . . . . . . . . . . . . . . . . . . . . . . . . . .
(2)
(Total for Question 2 is 4 marks)

4
*S59306A0424*
D
O N
OT W
RITE IN TH
IS AREA
D
O N
OT W
RITE IN TH
IS AREA
D
O N
OT W
RITE IN TH
IS AREA
D
O N
OT
WRI
TE IN
TH
IS A
REA
D
O N
OT
WRI
TE IN
TH
IS A
REA
D
O N
OT
WRI
TE IN
TH
IS A
REA
3 The time series graphs show information about the market share (%) for all UK Independent film studios and for all USA film studios for films released in the UK from 2006 to 2015
2006 2007 2008 2009 2010 2011 2012 2013 2014 2015
Year
Market share (%)
90
80
70
60
50
40
30
20
10
0
USA
UK Independent
(Source: BFI Statistical Yearbook)
(a) Write down the year for which the market share (%) for the UK Independent film studios was the greatest.
.. . . . . . . . . . . . . . . . . . . . . . . . . . . . . . . . . . . . . . . . . . . . . . . . . . . . . .
(1)
(b) Between which two consecutive years was the increase in the market share (%) for the USA film studios the greatest?
.. . . . . . . . . . . . . . . . . . . . . . . . . . . . . . . . . . . . . . . . . . . . . . . . . . . . . . and .. . . . . . . . . . . . . . . . . . . . . . . . . . . . . . . . . . . . . . . . . . . . . . . . . . . . . .
(1)

5
*S59306A0524* Turn over
D
O N
OT W
RITE IN TH
IS AREA
D
O N
OT W
RITE IN TH
IS AREA
D
O N
OT W
RITE IN TH
IS AREA
D
O N
OT
WRI
TE IN
TH
IS A
REA
D
O N
OT
WRI
TE IN
TH
IS A
REA
D
O N
OT
WRI
TE IN
TH
IS A
REA
(c) Describe the trend in the market share (%) for the UK Independent film studios from 2006 to 2015
... . . . . . . . . . . . . . . . . . . . . . . . . . . . . . . . . . . . . . . . . . . . . . . . . . . . . . . . . . . . . . . . . . . . . . . . . . . . . . . . . . . . . . . . . . . . . . . . . . . . . . . . . . . . . . . . . . . . . . . . . . . . . . . . . . . . . . . . . . . . . . . . . . . . . . . . . . . . . . . . . . . . . . . . . . . . . . . . . . . . . . . . . . . . . . . . . . . . . . . . . . . . . . . . . . . . . . . . . . . . . . . . . . . . . . . . . . . . . . . . .
(1)
(d) Compare the difference in market share (%) between UK Independent film studios and USA film studios for 2009 with the difference for 2011
You must show your working.
.. . . . . . . . . . . . . . . . . . . . . . . . . . . . . . . . . . . . . . . . . . . . . . . . . . . . . . . . . . . . . . . . . . . . . . . . . . . . . . . . . . . . . . . . . . . . . . . . . . . . . . . . . . . . . . . . . . . . . . . . . . . . . . . . . . . . . . . . . . . . . . . . . . . . . . . . . . . . . . . . . . . . . . . . . . . . . . . . . . . . . . . . . . . . . . . . . . . . . . . . . . . . . . . . . . . . . . . . . . . . . . . . . . . . . . . . . . . . . . . . . .
. . . . . . . . . . . . . . . . . . . . . . . . . . . . . . . . . . . . . . . . . . . . . . . . . . . . . . . . . . . . . . . . . . . . . . . . . . . . . . . . . . . . . . . . . . . . . . . . . . . . . . . . . . . . . . . . . . . . . . . . . . . . . . . . . . . . . . . . . . . . . . . . . . . . . . . . . . . . . . . . . . . . . . . . . . . . . . . . . . . . . . . . . . . . . . . . . . . . . . . . . . . . . . . . . . . . . . . . . . . . . . . . . . . . . . . . . . . . . . . . . . .
(3)
(Total for Question 3 is 6 marks)

6
*S59306A0624*
D
O N
OT W
RITE IN TH
IS AREA
D
O N
OT W
RITE IN TH
IS AREA
D
O N
OT W
RITE IN TH
IS AREA
D
O N
OT
WRI
TE IN
TH
IS A
REA
D
O N
OT
WRI
TE IN
TH
IS A
REA
D
O N
OT
WRI
TE IN
TH
IS A
REA
4 Katy is carrying out quality checks on bags of lollies produced in a factory.
Katy took a random sample of 18 bags and counted the number of lollies in each bag.
Here are her results.
15 14 12 11 13 12 13 12 14
13 12 14 15 12 12 13 12 15
(a) Fill in the tally chart for this information and complete the frequency column.
Number of lollies in bag Tally Frequency
11
12
13
14
15
(2)
Katy thinks that 10 of the bags in her sample contain more lollies than the mode of the sample.
(b) Is Katy correct? Give a reason for your answer.
.. . . . . . . . . . . . . . . . . . . . . . . . . . . . . . . . . . . . . . . . . . . . . . . . . . . . . . . . . . . . . . . . . . . . . . . . . . . . . . . . . . . . . . . . . . . . . . . . . . . . . . . . . . . . . . . . . . . . . . . . . . . . . . . . . . . . . . . . . . . . . . . . . . . . . . . . . . . . . . . . . . . . . . . . . . . . . . . . . . . . . . . . . . . . . . . . . . . . . . . . . . . . . . . . . . . . . . . . . . . . . . . . . . . . . . . . . . . . . . . . . .
. . . . . . . . . . . . . . . . . . . . . . . . . . . . . . . . . . . . . . . . . . . . . . . . . . . . . . . . . . . . . . . . . . . . . . . . . . . . . . . . . . . . . . . . . . . . . . . . . . . . . . . . . . . . . . . . . . . . . . . . . . . . . . . . . . . . . . . . . . . . . . . . . . . . . . . . . . . . . . . . . . . . . . . . . . . . . . . . . . . . . . . . . . . . . . . . . . . . . . . . . . . . . . . . . . . . . . . . . . . . . . . . . . . . . . . . . . . . . . . . . . .
. . . . . . . . . . . . . . . . . . . . . . . . . . . . . . . . . . . . . . . . . . . . . . . . . . . . . . . . . . . . . . . . . . . . . . . . . . . . . . . . . . . . . . . . . . . . . . . . . . . . . . . . . . . . . . . . . . . . . . . . . . . . . . . . . . . . . . . . . . . . . . . . . . . . . . . . . . . . . . . . . . . . . . . . . . . . . . . . . . . . . . . . . . . . . . . . . . . . . . . . . . . . . . . . . . . . . . . . . . . . . . . . . . . . . . . . . . . . . . . . . . .
(2)
One of these 18 bags is chosen at random.
(c) Find the probability that this bag contains more than 11 lollies.
.. . . . . . . . . . . . . . . . . . . . . . . . . . . . . . . . . . . . . . . . . . . . . . . . . . . . . .
(1)

7
*S59306A0724* Turn over
D
O N
OT W
RITE IN TH
IS AREA
D
O N
OT W
RITE IN TH
IS AREA
D
O N
OT W
RITE IN TH
IS AREA
D
O N
OT
WRI
TE IN
TH
IS A
REA
D
O N
OT
WRI
TE IN
TH
IS A
REA
D
O N
OT
WRI
TE IN
TH
IS A
REA
The packaging states that bags contain more than 11 lollies.
(d) Considering the sample taken by Katy, give one reason why this statement is appropriate.
. . . . . . . . . . . . . . . . . . . . . . . . . . . . . . . . . . . . . . . . . . . . . . . . . . . . . . . . . . . . . . . . . . . . . . . . . . . . . . . . . . . . . . . . . . . . . . . . . . . . . . . . . . . . . . . . . . . . . . . . . . . . . . . . . . . . . . . . . . . . . . . . . . . . . . . . . . . . . . . . . . . . . . . . . . . . . . . . . . . . . . . . . . . . . . . . . . . . . . . . . . . . . . . . . . . . . . . . . . . . . . . . . . . . . . . . . . . . . . . . . . .
. . . . . . . . . . . . . . . . . . . . . . . . . . . . . . . . . . . . . . . . . . . . . . . . . . . . . . . . . . . . . . . . . . . . . . . . . . . . . . . . . . . . . . . . . . . . . . . . . . . . . . . . . . . . . . . . . . . . . . . . . . . . . . . . . . . . . . . . . . . . . . . . . . . . . . . . . . . . . . . . . . . . . . . . . . . . . . . . . . . . . . . . . . . . . . . . . . . . . . . . . . . . . . . . . . . . . . . . . . . . . . . . . . . . . . . . . . . . . . . . . . .
(1)
There are three different machines in the factory that package the bags of lollies that Katy is checking.
Katy collected all 18 bags of lollies from just one of the machines.
(e) (i) Give one reason why doing this might be appropriate.
.. . . . . . . . . . . . . . . . . . . . . . . . . . . . . . . . . . . . . . . . . . . . . . . . . . . . . . . . . . . . . . . . . . . . . . . . . . . . . . . . . . . . . . . . . . . . . . . . . . . . . . . . . . . . . . . . . . . . . . . . . . . . . . . . . . . . . . . . . . . . . . . . . . . . . . . . . . . . . . . . . . . . . . . . . . . . . . . . . . . . . . . . . . . . . . . . . . . . . . . . . . . . . . . . . . . . . . . . . . . . . . . . . . . . . . . . . . . . . . . . . .
. . . . . . . . . . . . . . . . . . . . . . . . . . . . . . . . . . . . . . . . . . . . . . . . . . . . . . . . . . . . . . . . . . . . . . . . . . . . . . . . . . . . . . . . . . . . . . . . . . . . . . . . . . . . . . . . . . . . . . . . . . . . . . . . . . . . . . . . . . . . . . . . . . . . . . . . . . . . . . . . . . . . . . . . . . . . . . . . . . . . . . . . . . . . . . . . . . . . . . . . . . . . . . . . . . . . . . . . . . . . . . . . . . . . . . . . . . . . . . . . . . .
(ii) Give one reason why doing this might not be appropriate.
.. . . . . . . . . . . . . . . . . . . . . . . . . . . . . . . . . . . . . . . . . . . . . . . . . . . . . . . . . . . . . . . . . . . . . . . . . . . . . . . . . . . . . . . . . . . . . . . . . . . . . . . . . . . . . . . . . . . . . . . . . . . . . . . . . . . . . . . . . . . . . . . . . . . . . . . . . . . . . . . . . . . . . . . . . . . . . . . . . . . . . . . . . . . . . . . . . . . . . . . . . . . . . . . . . . . . . . . . . . . . . . . . . . . . . . . . . . . . . . . . . .
. . . . . . . . . . . . . . . . . . . . . . . . . . . . . . . . . . . . . . . . . . . . . . . . . . . . . . . . . . . . . . . . . . . . . . . . . . . . . . . . . . . . . . . . . . . . . . . . . . . . . . . . . . . . . . . . . . . . . . . . . . . . . . . . . . . . . . . . . . . . . . . . . . . . . . . . . . . . . . . . . . . . . . . . . . . . . . . . . . . . . . . . . . . . . . . . . . . . . . . . . . . . . . . . . . . . . . . . . . . . . . . . . . . . . . . . . . . . . . . . . . .
(2)
(Total for Question 4 is 8 marks)

8
*S59306A0824*
D
O N
OT W
RITE IN TH
IS AREA
D
O N
OT W
RITE IN TH
IS AREA
D
O N
OT W
RITE IN TH
IS AREA
D
O N
OT
WRI
TE IN
TH
IS A
REA
D
O N
OT
WRI
TE IN
TH
IS A
REA
D
O N
OT
WRI
TE IN
TH
IS A
REA
5 The bar chart shows information about the numbers of gold medals won in the 2016 Olympic Games by the five countries that won the most gold medals.
50
45
40
35
30
25
20
15
10
5
0Germany Russia China Great
BritainUSA
Country
Number of gold medals
(Source: www.theguardian.com)
(a) Find the total number of gold medals won by the three countries that won the most gold medals.
.. . . . . . . . . . . . . . . . . . . . . . . . . . . . . . . . . . . . . . . . . . . . . . . . . . . . . .
(1)
(b) Compare the number of gold medals won by Great Britain with the number of gold medals won by Russia.
.. . . . . . . . . . . . . . . . . . . . . . . . . . . . . . . . . . . . . . . . . . . . . . . . . . . . . . . . . . . . . . . . . . . . . . . . . . . . . . . . . . . . . . . . . . . . . . . . . . . . . . . . . . . . . . . . . . . . . . . . . . . . . . . . . . . . . . . . . . . . . . . . . . . . . . . . . . . . . . . . . . . . . . . . . . . . . . . . . . . . . . . . . . . . . . . . . . . . . . . . . . . . . . . . . . . . . . . . . . . . . . . . . . . . . . . . . . . . . . . . . .
. . . . . . . . . . . . . . . . . . . . . . . . . . . . . . . . . . . . . . . . . . . . . . . . . . . . . . . . . . . . . . . . . . . . . . . . . . . . . . . . . . . . . . . . . . . . . . . . . . . . . . . . . . . . . . . . . . . . . . . . . . . . . . . . . . . . . . . . . . . . . . . . . . . . . . . . . . . . . . . . . . . . . . . . . . . . . . . . . . . . . . . . . . . . . . . . . . . . . . . . . . . . . . . . . . . . . . . . . . . . . . . . . . . . . . . . . . . . . . . . . . .
(1)
The information in the bar chart is going to be shown in a newspaper article.
(c) Explain why it might be more appropriate to use a pictogram.
.. . . . . . . . . . . . . . . . . . . . . . . . . . . . . . . . . . . . . . . . . . . . . . . . . . . . . . . . . . . . . . . . . . . . . . . . . . . . . . . . . . . . . . . . . . . . . . . . . . . . . . . . . . . . . . . . . . . . . . . . . . . . . . . . . . . . . . . . . . . . . . . . . . . . . . . . . . . . . . . . . . . . . . . . . . . . . . . . . . . . . . . . . . . . . . . . . . . . . . . . . . . . . . . . . . . . . . . . . . . . . . . . . . . . . . . . . . . . . . . . . .
. . . . . . . . . . . . . . . . . . . . . . . . . . . . . . . . . . . . . . . . . . . . . . . . . . . . . . . . . . . . . . . . . . . . . . . . . . . . . . . . . . . . . . . . . . . . . . . . . . . . . . . . . . . . . . . . . . . . . . . . . . . . . . . . . . . . . . . . . . . . . . . . . . . . . . . . . . . . . . . . . . . . . . . . . . . . . . . . . . . . . . . . . . . . . . . . . . . . . . . . . . . . . . . . . . . . . . . . . . . . . . . . . . . . . . . . . . . . . . . . . . .
. . . . . . . . . . . . . . . . . . . . . . . . . . . . . . . . . . . . . . . . . . . . . . . . . . . . . . . . . . . . . . . . . . . . . . . . . . . . . . . . . . . . . . . . . . . . . . . . . . . . . . . . . . . . . . . . . . . . . . . . . . . . . . . . . . . . . . . . . . . . . . . . . . . . . . . . . . . . . . . . . . . . . . . . . . . . . . . . . . . . . . . . . . . . . . . . . . . . . . . . . . . . . . . . . . . . . . . . . . . . . . . . . . . . . . . . . . . . . . . . . . .
(1)

9
*S59306A0924* Turn over
D
O N
OT W
RITE IN TH
IS AREA
D
O N
OT W
RITE IN TH
IS AREA
D
O N
OT W
RITE IN TH
IS AREA
D
O N
OT
WRI
TE IN
TH
IS A
REA
D
O N
OT
WRI
TE IN
TH
IS A
REA
D
O N
OT
WRI
TE IN
TH
IS A
REA
The table shows information about the numbers of gold, silver and bronze medals won by the USA in the 2016 Olympic Games.
Gold Silver Bronze Total
46 37 38 121(Source: www.theguardian.com)
(d) Complete the pie chart for this information.
(3)
In the 2016 Olympic Games, Great Britain won a total of 67 medals. Of these, 27 were gold medals.
Sanjit says,
“The fraction of the medals won by the USA that were gold medals was greater than the fraction of the medals won by Great Britain that were gold medals”.
(e) Determine whether or not the given information supports Sanjit’s statement.
.. . . . . . . . . . . . . . . . . . . . . . . . . . . . . . . . . . . . . . . . . . . . . . . . . . . . . . . . . . . . . . . . . . . . . . . . . . . . . . . . . . . . . . . . . . . . . . . . . . . . . . . . . . . . . . . . . . . . . . . . . . . . . . . . . . . . . . . . . . . . . . . . . . . . . . . . . . . . . . . . . . . . . . . . . . . . . . . . . . . . . . . . . . . . . . . . . . . . . . . . . . . . . . . . . . . . . . . . . . . . . . . . . . . . . . . . . . . . . . . . . .
. . . . . . . . . . . . . . . . . . . . . . . . . . . . . . . . . . . . . . . . . . . . . . . . . . . . . . . . . . . . . . . . . . . . . . . . . . . . . . . . . . . . . . . . . . . . . . . . . . . . . . . . . . . . . . . . . . . . . . . . . . . . . . . . . . . . . . . . . . . . . . . . . . . . . . . . . . . . . . . . . . . . . . . . . . . . . . . . . . . . . . . . . . . . . . . . . . . . . . . . . . . . . . . . . . . . . . . . . . . . . . . . . . . . . . . . . . . . . . . . . . .
(2)
(Total for Question 5 is 8 marks)

10
*S59306A01024*
D
O N
OT W
RITE IN TH
IS AREA
D
O N
OT W
RITE IN TH
IS AREA
D
O N
OT W
RITE IN TH
IS AREA
D
O N
OT
WRI
TE IN
TH
IS A
REA
D
O N
OT
WRI
TE IN
TH
IS A
REA
D
O N
OT
WRI
TE IN
TH
IS A
REA
6 Edward is investigating the amount of money children and adults spend online.
He is going to do a pilot study for his questionnaire.
(a) Describe what a pilot study is and give one advantage of using a pilot study.
.. . . . . . . . . . . . . . . . . . . . . . . . . . . . . . . . . . . . . . . . . . . . . . . . . . . . . . . . . . . . . . . . . . . . . . . . . . . . . . . . . . . . . . . . . . . . . . . . . . . . . . . . . . . . . . . . . . . . . . . . . . . . . . . . . . . . . . . . . . . . . . . . . . . . . . . . . . . . . . . . . . . . . . . . . . . . . . . . . . . . . . . . . . . . . . . . . . . . . . . . . . . . . . . . . . . . . . . . . . . . . . . . . . . . . . . . . . . . . . . . . .
. . . . . . . . . . . . . . . . . . . . . . . . . . . . . . . . . . . . . . . . . . . . . . . . . . . . . . . . . . . . . . . . . . . . . . . . . . . . . . . . . . . . . . . . . . . . . . . . . . . . . . . . . . . . . . . . . . . . . . . . . . . . . . . . . . . . . . . . . . . . . . . . . . . . . . . . . . . . . . . . . . . . . . . . . . . . . . . . . . . . . . . . . . . . . . . . . . . . . . . . . . . . . . . . . . . . . . . . . . . . . . . . . . . . . . . . . . . . . . . . . . .
. . . . . . . . . . . . . . . . . . . . . . . . . . . . . . . . . . . . . . . . . . . . . . . . . . . . . . . . . . . . . . . . . . . . . . . . . . . . . . . . . . . . . . . . . . . . . . . . . . . . . . . . . . . . . . . . . . . . . . . . . . . . . . . . . . . . . . . . . . . . . . . . . . . . . . . . . . . . . . . . . . . . . . . . . . . . . . . . . . . . . . . . . . . . . . . . . . . . . . . . . . . . . . . . . . . . . . . . . . . . . . . . . . . . . . . . . . . . . . . . . . .
(2)
Edward produces a questionnaire with closed questions.
(b) Give one reason why closed questions might be more appropriate than open questions.
.. . . . . . . . . . . . . . . . . . . . . . . . . . . . . . . . . . . . . . . . . . . . . . . . . . . . . . . . . . . . . . . . . . . . . . . . . . . . . . . . . . . . . . . . . . . . . . . . . . . . . . . . . . . . . . . . . . . . . . . . . . . . . . . . . . . . . . . . . . . . . . . . . . . . . . . . . . . . . . . . . . . . . . . . . . . . . . . . . . . . . . . . . . . . . . . . . . . . . . . . . . . . . . . . . . . . . . . . . . . . . . . . . . . . . . . . . . . . . . . . . .
. . . . . . . . . . . . . . . . . . . . . . . . . . . . . . . . . . . . . . . . . . . . . . . . . . . . . . . . . . . . . . . . . . . . . . . . . . . . . . . . . . . . . . . . . . . . . . . . . . . . . . . . . . . . . . . . . . . . . . . . . . . . . . . . . . . . . . . . . . . . . . . . . . . . . . . . . . . . . . . . . . . . . . . . . . . . . . . . . . . . . . . . . . . . . . . . . . . . . . . . . . . . . . . . . . . . . . . . . . . . . . . . . . . . . . . . . . . . . . . . . . .
(1)
Edward asks four children and four adults to each record on a spreadsheet their age and the amount, in pounds, they each spent online last month.
The spreadsheet is shown below.
Child age Amount spent online Adult age Amount spent online
12 £40 28 £10
15 £20 31 Fifty pounds
16 Nothing 40 £20
17 £5 54 £5
Total £65 Total £35
The total amounts were calculated by the spreadsheet.
Edward thinks that the spreadsheet shows that the children spent more money online than the adults.
(c) Explain how the use of this spreadsheet affects the reliability of this conclusion.
.. . . . . . . . . . . . . . . . . . . . . . . . . . . . . . . . . . . . . . . . . . . . . . . . . . . . . . . . . . . . . . . . . . . . . . . . . . . . . . . . . . . . . . . . . . . . . . . . . . . . . . . . . . . . . . . . . . . . . . . . . . . . . . . . . . . . . . . . . . . . . . . . . . . . . . . . . . . . . . . . . . . . . . . . . . . . . . . . . . . . . . . . . . . . . . . . . . . . . . . . . . . . . . . . . . . . . . . . . . . . . . . . . . . . . . . . . . . . . . . . . .
. . . . . . . . . . . . . . . . . . . . . . . . . . . . . . . . . . . . . . . . . . . . . . . . . . . . . . . . . . . . . . . . . . . . . . . . . . . . . . . . . . . . . . . . . . . . . . . . . . . . . . . . . . . . . . . . . . . . . . . . . . . . . . . . . . . . . . . . . . . . . . . . . . . . . . . . . . . . . . . . . . . . . . . . . . . . . . . . . . . . . . . . . . . . . . . . . . . . . . . . . . . . . . . . . . . . . . . . . . . . . . . . . . . . . . . . . . . . . . . . . . .
(1)

11
*S59306A01124* Turn over
D
O N
OT W
RITE IN TH
IS AREA
D
O N
OT W
RITE IN TH
IS AREA
D
O N
OT W
RITE IN TH
IS AREA
D
O N
OT
WRI
TE IN
TH
IS A
REA
D
O N
OT
WRI
TE IN
TH
IS A
REA
D
O N
OT
WRI
TE IN
TH
IS A
REA
The incomplete table below gives some information about the sales, in billions of dollars, made by an American online retailer for the years 2015, 2016 and the first quarter of 2017
Year Quarter Sales ($ billions)
4-point moving average ($ billions)
2015
1 17.2
2 17.2
3 18.620.75
4 26.621.725
2016
1 20.622.65
2 21.123.65
3 22.324.425
4 30.6
2017 1 23.7(Source: nasdaq.com)
The first 4-point moving average is missing from the table.
(d) Calculate this 4-point moving average.
$ .. . . . . . . . . . . . . . . . . . . . . . . . . . . . . . . . . . . . . . . . . . . . . . . . . . . . . . billions(2)
(Total for Question 6 is 6 marks)

12
*S59306A01224*
D
O N
OT W
RITE IN TH
IS AREA
D
O N
OT W
RITE IN TH
IS AREA
D
O N
OT W
RITE IN TH
IS AREA
D
O N
OT
WRI
TE IN
TH
IS A
REA
D
O N
OT
WRI
TE IN
TH
IS A
REA
D
O N
OT
WRI
TE IN
TH
IS A
REA
BLANK PAGE

13
*S59306A01324* Turn over
D
O N
OT W
RITE IN TH
IS AREA
D
O N
OT W
RITE IN TH
IS AREA
D
O N
OT W
RITE IN TH
IS AREA
D
O N
OT
WRI
TE IN
TH
IS A
REA
D
O N
OT
WRI
TE IN
TH
IS A
REA
D
O N
OT
WRI
TE IN
TH
IS A
REA
7 Aneena wants to investigate whether the boys at her school do more exercise than the girls at her school.
(a) Suggest a hypothesis Aneena could use.
.. . . . . . . . . . . . . . . . . . . . . . . . . . . . . . . . . . . . . . . . . . . . . . . . . . . . . . . . . . . . . . . . . . . . . . . . . . . . . . . . . . . . . . . . . . . . . . . . . . . . . . . . . . . . . . . . . . . . . . . . . . . . . . . . . . . . . . . . . . . . . . . . . . . . . . . . . . . . . . . . . . . . . . . . . . . . . . . . . . . . . . . . . . . . . . . . . . . . . . . . . . . . . . . . . . . . . . . . . . . . . . . . . . . . . . . . . . . . . . . . . .
. . . . . . . . . . . . . . . . . . . . . . . . . . . . . . . . . . . . . . . . . . . . . . . . . . . . . . . . . . . . . . . . . . . . . . . . . . . . . . . . . . . . . . . . . . . . . . . . . . . . . . . . . . . . . . . . . . . . . . . . . . . . . . . . . . . . . . . . . . . . . . . . . . . . . . . . . . . . . . . . . . . . . . . . . . . . . . . . . . . . . . . . . . . . . . . . . . . . . . . . . . . . . . . . . . . . . . . . . . . . . . . . . . . . . . . . . . . . . . . . . . .
(1)
Aneena wants to collect primary data for her investigation.
(b) Describe the difference between primary data and secondary data.
.. . . . . . . . . . . . . . . . . . . . . . . . . . . . . . . . . . . . . . . . . . . . . . . . . . . . . . . . . . . . . . . . . . . . . . . . . . . . . . . . . . . . . . . . . . . . . . . . . . . . . . . . . . . . . . . . . . . . . . . . . . . . . . . . . . . . . . . . . . . . . . . . . . . . . . . . . . . . . . . . . . . . . . . . . . . . . . . . . . . . . . . . . . . . . . . . . . . . . . . . . . . . . . . . . . . . . . . . . . . . . . . . . . . . . . . . . . . . . . . . . .
. . . . . . . . . . . . . . . . . . . . . . . . . . . . . . . . . . . . . . . . . . . . . . . . . . . . . . . . . . . . . . . . . . . . . . . . . . . . . . . . . . . . . . . . . . . . . . . . . . . . . . . . . . . . . . . . . . . . . . . . . . . . . . . . . . . . . . . . . . . . . . . . . . . . . . . . . . . . . . . . . . . . . . . . . . . . . . . . . . . . . . . . . . . . . . . . . . . . . . . . . . . . . . . . . . . . . . . . . . . . . . . . . . . . . . . . . . . . . . . . . . .
. . . . . . . . . . . . . . . . . . . . . . . . . . . . . . . . . . . . . . . . . . . . . . . . . . . . . . . . . . . . . . . . . . . . . . . . . . . . . . . . . . . . . . . . . . . . . . . . . . . . . . . . . . . . . . . . . . . . . . . . . . . . . . . . . . . . . . . . . . . . . . . . . . . . . . . . . . . . . . . . . . . . . . . . . . . . . . . . . . . . . . . . . . . . . . . . . . . . . . . . . . . . . . . . . . . . . . . . . . . . . . . . . . . . . . . . . . . . . . . . . . .
(2)
Here is a list of types of data.
Discrete Continuous Qualitative
The table shows some of the variables that Aneena could use.
(c) Complete the table by choosing the word from the list that best describes each variable.
Variable Type of data
Student’s favourite sport
Time a student spent exercising each day
Number of sports clubs to which a student belongs
(2)

14
*S59306A01424*
D
O N
OT W
RITE IN TH
IS AREA
D
O N
OT W
RITE IN TH
IS AREA
D
O N
OT W
RITE IN TH
IS AREA
D
O N
OT
WRI
TE IN
TH
IS A
REA
D
O N
OT
WRI
TE IN
TH
IS A
REA
D
O N
OT
WRI
TE IN
TH
IS A
REA
Aneena took a sample of 51 boys and a sample of 51 girls from the students at her school.
She collected information about the time each boy and the time each girl in her samples spent exercising on one particular day.
Aneena started to write the results for the boys into Table A. Part of Table A is shown below.
Table A
Amount of time spent exercising (t minutes) for boys Frequency
0 t < 5 2
5 t < 10 3
10 t < 15 1
15 t < 20 0
20 t < 25
95 t < 100
Aneena changed her mind and decided to use different class intervals. Table B shows information about all the boys’ results.
Table B
Amount of time spent exercising (t minutes) for boys Frequency
0 t < 20 6
20 t < 40 9
40 t < 60 12
60 t < 80 16
80 t < 100 8
(d) For the results shown in Table B, write down the modal class.
.. . . . . . . . . . . . . . . . . . . . . . . . . . . . . . . . . . . . . . . . . . . . . . . . . . . . . .
(1)
(e) Explain why Aneena would find Table B more appropriate to display the boys’ results than Table A.
.. . . . . . . . . . . . . . . . . . . . . . . . . . . . . . . . . . . . . . . . . . . . . . . . . . . . . . . . . . . . . . . . . . . . . . . . . . . . . . . . . . . . . . . . . . . . . . . . . . . . . . . . . . . . . . . . . . . . . . . . . . . . . . . . . . . . . . . . . . . . . . . . . . . . . . . . . . . . . . . . . . . . . . . . . . . . . . . . . . . . . . . . . . . . . . . . . . . . . . . . . . . . . . . . . . . . . . . . . . . . . . . . . . . . . . . . . . . . . . . . . .
. . . . . . . . . . . . . . . . . . . . . . . . . . . . . . . . . . . . . . . . . . . . . . . . . . . . . . . . . . . . . . . . . . . . . . . . . . . . . . . . . . . . . . . . . . . . . . . . . . . . . . . . . . . . . . . . . . . . . . . . . . . . . . . . . . . . . . . . . . . . . . . . . . . . . . . . . . . . . . . . . . . . . . . . . . . . . . . . . . . . . . . . . . . . . . . . . . . . . . . . . . . . . . . . . . . . . . . . . . . . . . . . . . . . . . . . . . . . . . . . . . .
(1)

15
*S59306A01524* Turn over
D
O N
OT W
RITE IN TH
IS AREA
D
O N
OT W
RITE IN TH
IS AREA
D
O N
OT W
RITE IN TH
IS AREA
D
O N
OT
WRI
TE IN
TH
IS A
REA
D
O N
OT
WRI
TE IN
TH
IS A
REA
D
O N
OT
WRI
TE IN
TH
IS A
REA
For the boys, Aneena uses the grouped data from Table B to calculate their mean time spent exercising.
For the girls, she uses raw data to calculate their mean time spent exercising. She compares the two means.
(f) Discuss how the reliability of her comparison is affected by her method.
.. . . . . . . . . . . . . . . . . . . . . . . . . . . . . . . . . . . . . . . . . . . . . . . . . . . . . . . . . . . . . . . . . . . . . . . . . . . . . . . . . . . . . . . . . . . . . . . . . . . . . . . . . . . . . . . . . . . . . . . . . . . . . . . . . . . . . . . . . . . . . . . . . . . . . . . . . . . . . . . . . . . . . . . . . . . . . . . . . . . . . . . . . . . . . . . . . . . . . . . . . . . . . . . . . . . . . . . . . . . . . . . . . . . . . . . . . . . . . . . . . .
. . . . . . . . . . . . . . . . . . . . . . . . . . . . . . . . . . . . . . . . . . . . . . . . . . . . . . . . . . . . . . . . . . . . . . . . . . . . . . . . . . . . . . . . . . . . . . . . . . . . . . . . . . . . . . . . . . . . . . . . . . . . . . . . . . . . . . . . . . . . . . . . . . . . . . . . . . . . . . . . . . . . . . . . . . . . . . . . . . . . . . . . . . . . . . . . . . . . . . . . . . . . . . . . . . . . . . . . . . . . . . . . . . . . . . . . . . . . . . . . . . .
. . . . . . . . . . . . . . . . . . . . . . . . . . . . . . . . . . . . . . . . . . . . . . . . . . . . . . . . . . . . . . . . . . . . . . . . . . . . . . . . . . . . . . . . . . . . . . . . . . . . . . . . . . . . . . . . . . . . . . . . . . . . . . . . . . . . . . . . . . . . . . . . . . . . . . . . . . . . . . . . . . . . . . . . . . . . . . . . . . . . . . . . . . . . . . . . . . . . . . . . . . . . . . . . . . . . . . . . . . . . . . . . . . . . . . . . . . . . . . . . . . .
. . . . . . . . . . . . . . . . . . . . . . . . . . . . . . . . . . . . . . . . . . . . . . . . . . . . . . . . . . . . . . . . . . . . . . . . . . . . . . . . . . . . . . . . . . . . . . . . . . . . . . . . . . . . . . . . . . . . . . . . . . . . . . . . . . . . . . . . . . . . . . . . . . . . . . . . . . . . . . . . . . . . . . . . . . . . . . . . . . . . . . . . . . . . . . . . . . . . . . . . . . . . . . . . . . . . . . . . . . . . . . . . . . . . . . . . . . . . . . . . . . .
(2)
(Total for Question 7 is 9 marks)

16
*S59306A01624*
D
O N
OT W
RITE IN TH
IS AREA
D
O N
OT W
RITE IN TH
IS AREA
D
O N
OT W
RITE IN TH
IS AREA
D
O N
OT
WRI
TE IN
TH
IS A
REA
D
O N
OT
WRI
TE IN
TH
IS A
REA
D
O N
OT
WRI
TE IN
TH
IS A
REA
8 Alex is investigating the monthly charges of 7 different companies for each of two types of phones, phone A and phone B.
Here are the monthly charges, in pounds, for phone A.
23 23 26 31 32 36 40
(Source: moneysupermarket.com)
(a) Find the interquartile range of these charges.
£ .. . . . . . . . . . . . . . . . . . . . . . . . . . . . . . . . . . . . . . . . . . . . . . . . . . . . . .
(2)
The interquartile range of the monthly charges for phone B is £8
(b) (i) Compare the spread of the charges for phone A and for phone B.
.. . . . . . . . . . . . . . . . . . . . . . . . . . . . . . . . . . . . . . . . . . . . . . . . . . . . . . . . . . . . . . . . . . . . . . . . . . . . . . . . . . . . . . . . . . . . . . . . . . . . . . . . . . . . . . . . . . . . . . . . . . . . . . . . . . . . . . . . . . . . . . . . . . . . . . . . . . . . . . . . . . . . . . . . . . . . . . . . . . . . . . . . . . . . . . . . . . . . . . . . . . . . . . . . . . . . . . . . . . . . . . . . . . . . . . . . . . . . . . . . . .
. . . . . . . . . . . . . . . . . . . . . . . . . . . . . . . . . . . . . . . . . . . . . . . . . . . . . . . . . . . . . . . . . . . . . . . . . . . . . . . . . . . . . . . . . . . . . . . . . . . . . . . . . . . . . . . . . . . . . . . . . . . . . . . . . . . . . . . . . . . . . . . . . . . . . . . . . . . . . . . . . . . . . . . . . . . . . . . . . . . . . . . . . . . . . . . . . . . . . . . . . . . . . . . . . . . . . . . . . . . . . . . . . . . . . . . . . . . . . . . . . . .
(1)
The 25th percentile of the monthly charges for phone B is £36
(ii) Work out the 75th percentile for phone B.
£ .. . . . . . . . . . . . . . . . . . . . . . . . . . . . . . . . . . . . . . . . . . . . . . . . . . . . . .
(2)
(Total for Question 8 is 5 marks)

17
*S59306A01724* Turn over
D
O N
OT W
RITE IN TH
IS AREA
D
O N
OT W
RITE IN TH
IS AREA
D
O N
OT W
RITE IN TH
IS AREA
D
O N
OT
WRI
TE IN
TH
IS A
REA
D
O N
OT
WRI
TE IN
TH
IS A
REA
D
O N
OT
WRI
TE IN
TH
IS A
REA
9 The Venn diagram shows information about 20 films shown in the UK in 2015
A is the event that the film was produced in the UK. B is the event that the film made more than £40 million.
The numbers in the Venn diagram indicate the number of films.
A B
3 25
10
(Source: BFI Statistical Yearbook)
(a) Explain fully what the number 3 represents in the Venn diagram.
.. . . . . . . . . . . . . . . . . . . . . . . . . . . . . . . . . . . . . . . . . . . . . . . . . . . . . . . . . . . . . . . . . . . . . . . . . . . . . . . . . . . . . . . . . . . . . . . . . . . . . . . . . . . . . . . . . . . . . . . . . . . . . . . . . . . . . . . . . . . . . . . . . . . . . . . . . . . . . . . . . . . . . . . . . . . . . . . . . . . . . . . . . . . . . . . . . . . . . . . . . . . . . . . . . . . . . . . . . . . . . . . . . . . . . . . . . . . . . . . . . .
. . . . . . . . . . . . . . . . . . . . . . . . . . . . . . . . . . . . . . . . . . . . . . . . . . . . . . . . . . . . . . . . . . . . . . . . . . . . . . . . . . . . . . . . . . . . . . . . . . . . . . . . . . . . . . . . . . . . . . . . . . . . . . . . . . . . . . . . . . . . . . . . . . . . . . . . . . . . . . . . . . . . . . . . . . . . . . . . . . . . . . . . . . . . . . . . . . . . . . . . . . . . . . . . . . . . . . . . . . . . . . . . . . . . . . . . . . . . . . . . . . .
(1)
One of the films is chosen at random.
(b) Find P(B)
.. . . . . . . . . . . . . . . . . . . . . . . . . . . . . . . . . . . . . . . . . . . . . . . . . . . . . .
(1)
(c) Find P(B | A)
.. . . . . . . . . . . . . . . . . . . . . . . . . . . . . . . . . . . . . . . . . . . . . . . . . . . . . .
(2)
(d) Using your answers to part (b) and part (c), explain whether or not A and B are independent events.
.. . . . . . . . . . . . . . . . . . . . . . . . . . . . . . . . . . . . . . . . . . . . . . . . . . . . . . . . . . . . . . . . . . . . . . . . . . . . . . . . . . . . . . . . . . . . . . . . . . . . . . . . . . . . . . . . . . . . . . . . . . . . . . . . . . . . . . . . . . . . . . . . . . . . . . . . . . . . . . . . . . . . . . . . . . . . . . . . . . . . . . . . . . . . . . . . . . . . . . . . . . . . . . . . . . . . . . . . . . . . . . . . . . . . . . . . . . . . . . . . . .
. . . . . . . . . . . . . . . . . . . . . . . . . . . . . . . . . . . . . . . . . . . . . . . . . . . . . . . . . . . . . . . . . . . . . . . . . . . . . . . . . . . . . . . . . . . . . . . . . . . . . . . . . . . . . . . . . . . . . . . . . . . . . . . . . . . . . . . . . . . . . . . . . . . . . . . . . . . . . . . . . . . . . . . . . . . . . . . . . . . . . . . . . . . . . . . . . . . . . . . . . . . . . . . . . . . . . . . . . . . . . . . . . . . . . . . . . . . . . . . . . . .
(2)
(Total for Question 9 is 6 marks)
18
*S59306A01824*
D
O N
OT W
RITE IN TH
IS AREA
D
O N
OT W
RITE IN TH
IS AREA
D
O N
OT W
RITE IN TH
IS AREA
D
O N
OT
WRI
TE IN
TH
IS A
REA
D
O N
OT
WRI
TE IN
TH
IS A
REA
D
O N
OT
WRI
TE IN
TH
IS A
REA
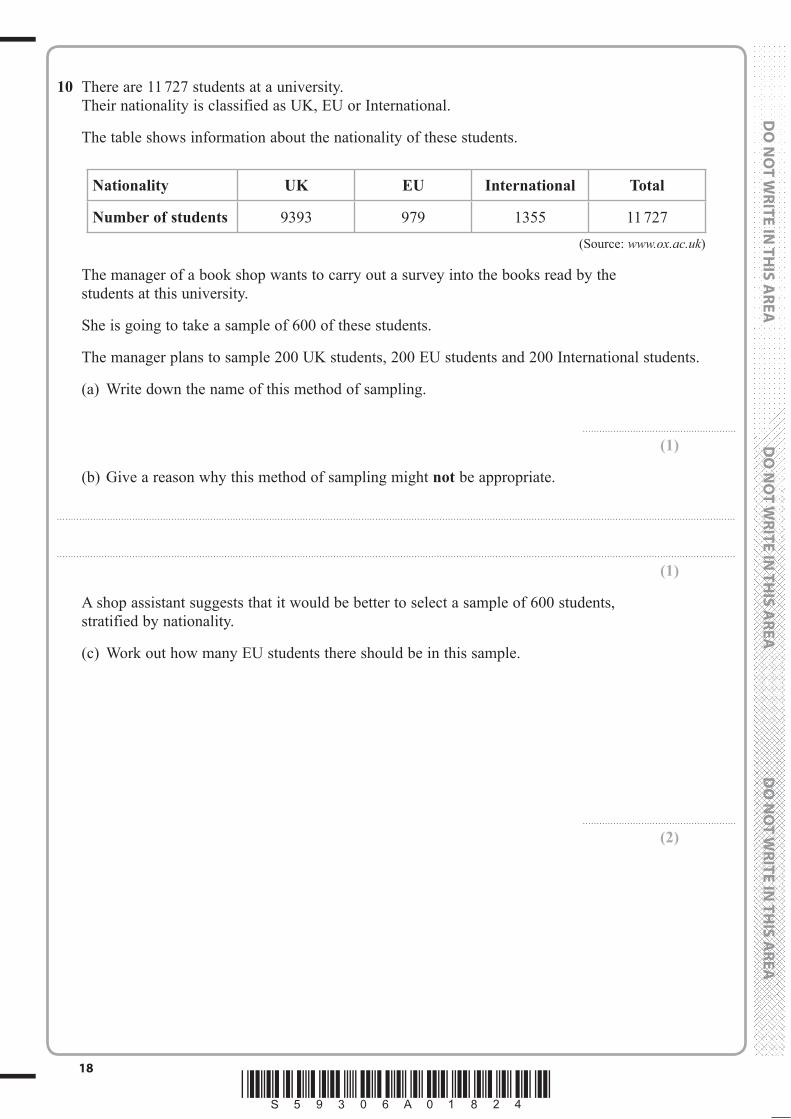
10 There are 11 727 students at a university. Their nationality is classified as UK, EU or International.
The table shows information about the nationality of these students.
Nationality UK EU International Total
Number of students 9393 979 1355 11 727(Source: www.ox.ac.uk)
The manager of a book shop wants to carry out a survey into the books read by the students at this university.
She is going to take a sample of 600 of these students.
The manager plans to sample 200 UK students, 200 EU students and 200 International students.
(a) Write down the name of this method of sampling.
.. . . . . . . . . . . . . . . . . . . . . . . . . . . . . . . . . . . . . . . . . . . . . . . . . . . . . .
(1)
(b) Give a reason why this method of sampling might not be appropriate.
.. . . . . . . . . . . . . . . . . . . . . . . . . . . . . . . . . . . . . . . . . . . . . . . . . . . . . . . . . . . . . . . . . . . . . . . . . . . . . . . . . . . . . . . . . . . . . . . . . . . . . . . . . . . . . . . . . . . . . . . . . . . . . . . . . . . . . . . . . . . . . . . . . . . . . . . . . . . . . . . . . . . . . . . . . . . . . . . . . . . . . . . . . . . . . . . . . . . . . . . . . . . . . . . . . . . . . . . . . . . . . . . . . . . . . . . . . . . . . . . . . .
. . . . . . . . . . . . . . . . . . . . . . . . . . . . . . . . . . . . . . . . . . . . . . . . . . . . . . . . . . . . . . . . . . . . . . . . . . . . . . . . . . . . . . . . . . . . . . . . . . . . . . . . . . . . . . . . . . . . . . . . . . . . . . . . . . . . . . . . . . . . . . . . . . . . . . . . . . . . . . . . . . . . . . . . . . . . . . . . . . . . . . . . . . . . . . . . . . . . . . . . . . . . . . . . . . . . . . . . . . . . . . . . . . . . . . . . . . . . . . . . . . .
(1)
A shop assistant suggests that it would be better to select a sample of 600 students, stratified by nationality.
(c) Work out how many EU students there should be in this sample.
.. . . . . . . . . . . . . . . . . . . . . . . . . . . . . . . . . . . . . . . . . . . . . . . . . . . . . .
(2)

19
*S59306A01924* Turn over
D
O N
OT W
RITE IN TH
IS AREA
D
O N
OT W
RITE IN TH
IS AREA
D
O N
OT W
RITE IN TH
IS AREA
D
O N
OT
WRI
TE IN
TH
IS A
REA
D
O N
OT
WRI
TE IN
TH
IS A
REA
D
O N
OT
WRI
TE IN
TH
IS A
REA
Three students, Amy, Beth and Carlos, bought the same eight books from the book shop.
The manager asked Amy, Beth and Carlos to rank these eight books in increasing order of how much they each enjoyed them.
The manager calculated the Spearman’s rank correlation coefficient for the ranks given by Amy and Beth.
She got a result of 1.2
(d) Explain how you know that this result is not correct.
.. . . . . . . . . . . . . . . . . . . . . . . . . . . . . . . . . . . . . . . . . . . . . . . . . . . . . . . . . . . . . . . . . . . . . . . . . . . . . . . . . . . . . . . . . . . . . . . . . . . . . . . . . . . . . . . . . . . . . . . . . . . . . . . . . . . . . . . . . . . . . . . . . . . . . . . . . . . . . . . . . . . . . . . . . . . . . . . . . . . . . . . . . . . . . . . . . . . . . . . . . . . . . . . . . . . . . . . . . . . . . . . . . . . . . . . . . . . . . . . . . .
. . . . . . . . . . . . . . . . . . . . . . . . . . . . . . . . . . . . . . . . . . . . . . . . . . . . . . . . . . . . . . . . . . . . . . . . . . . . . . . . . . . . . . . . . . . . . . . . . . . . . . . . . . . . . . . . . . . . . . . . . . . . . . . . . . . . . . . . . . . . . . . . . . . . . . . . . . . . . . . . . . . . . . . . . . . . . . . . . . . . . . . . . . . . . . . . . . . . . . . . . . . . . . . . . . . . . . . . . . . . . . . . . . . . . . . . . . . . . . . . . . .
(1)
The manager also calculated the Spearman’s rank correlation coefficient for the ranks given by Beth and Carlos.
She got a result of 0.74
(e) (i) What type of correlation is shown by this result?
.. . . . . . . . . . . . . . . . . . . . . . . . . . . . . . . . . . . . . . . . . . . . . . . . . . . . . .
(ii) Interpret this result.
. . . . . . . . . . . . . . . . . . . . . . . . . . . . . . . . . . . . . . . . . . . . . . . . . . . . . . . . . . . . . . . . . . . . . . . . . . . . . . . . . . . . . . . . . . . . . . . . . . . . . . . . . . . . . . . . . . . . . . . . . . . . . . . . . . . . . . . . . . . . . . . . . . . . . . . . . . . . . . . . . . . . . . . . . . . . . . . . . . . . . . . . . . . . . . . . . . . . . . . . . . . . . . . . . . . . . . . . . . . . . . . . . . . . . . . . . . . . . . . . . . .
. . . . . . . . . . . . . . . . . . . . . . . . . . . . . . . . . . . . . . . . . . . . . . . . . . . . . . . . . . . . . . . . . . . . . . . . . . . . . . . . . . . . . . . . . . . . . . . . . . . . . . . . . . . . . . . . . . . . . . . . . . . . . . . . . . . . . . . . . . . . . . . . . . . . . . . . . . . . . . . . . . . . . . . . . . . . . . . . . . . . . . . . . . . . . . . . . . . . . . . . . . . . . . . . . . . . . . . . . . . . . . . . . . . . . . . . . . . . . . . . . . .
(2)
(Total for Question 10 is 7 marks)
20
*S59306A02024*
D
O N
OT W
RITE IN TH
IS AREA
D
O N
OT W
RITE IN TH
IS AREA
D
O N
OT W
RITE IN TH
IS AREA
D
O N
OT
WRI
TE IN
TH
IS A
REA
D
O N
OT
WRI
TE IN
TH
IS A
REA
D
O N
OT
WRI
TE IN
TH
IS A
REA
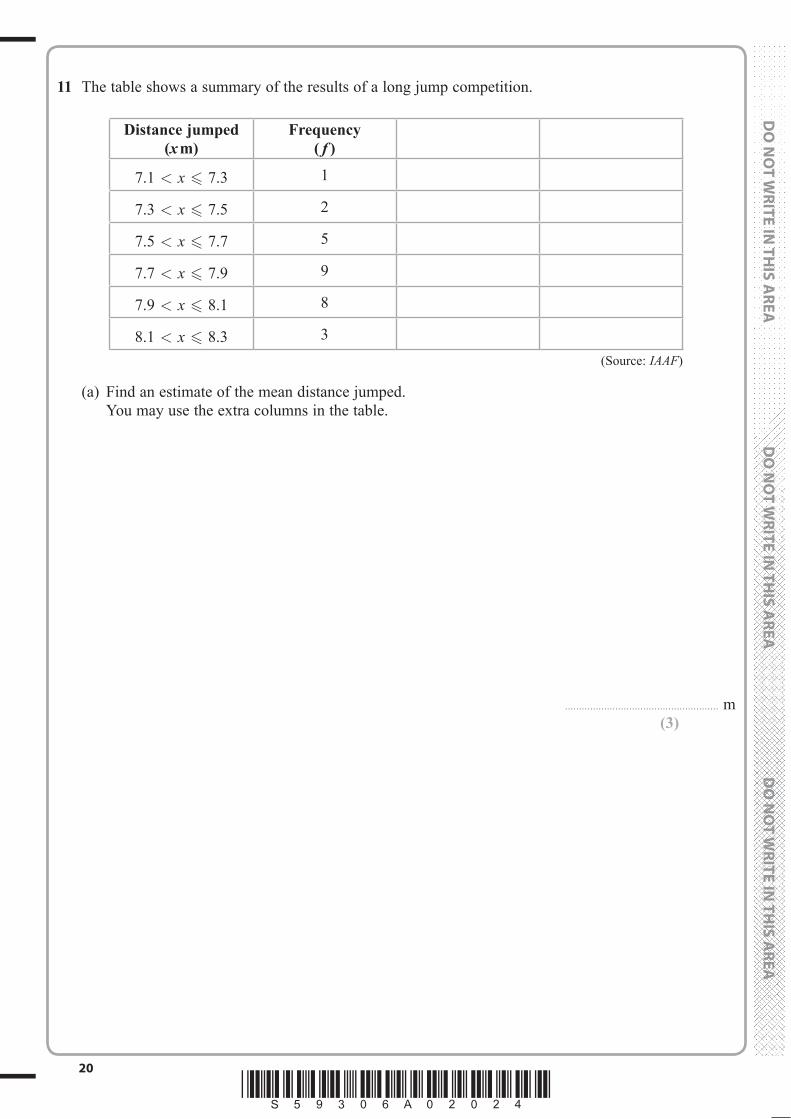
11 The table shows a summary of the results of a long jump competition.
Distance jumped (x m)
Frequency ( f )
7.1 < x 7.3 1
7.3 < x 7.5 2
7.5 < x 7.7 5
7.7 < x 7.9 9
7.9 < x 8.1 8
8.1 < x 8.3 3(Source: IAAF)
(a) Find an estimate of the mean distance jumped. You may use the extra columns in the table.
.. . . . . . . . . . . . . . . . . . . . . . . . . . . . . . . . . . . . . . . . . . . . . . . . . . . . . . m(3)

21
*S59306A02124* Turn over
D
O N
OT W
RITE IN TH
IS AREA
D
O N
OT W
RITE IN TH
IS AREA
D
O N
OT W
RITE IN TH
IS AREA
D
O N
OT
WRI
TE IN
TH
IS A
REA
D
O N
OT
WRI
TE IN
TH
IS A
REA
D
O N
OT
WRI
TE IN
TH
IS A
REA
(b) Draw a frequency polygon for the data.
7.0 7.2 7.4 7.6 7.8 8.0 8.2 8.4
Distance jumped (x m)(3)
(c) Describe any skew shown by the data.
.. . . . . . . . . . . . . . . . . . . . . . . . . . . . . . . . . . . . . . . . . . . . . . . . . . . . . . . . . . . . . . . . . . . . . . . . . . . . . . . . . . . . . . . . . . . . . . . . . . . . . . . . . . . . . . . . . . . . . . . . . . . . . . . . . . . . . . . . . . . . . . . . . . . . . . . . . . . . . . . . . . . . . . . . . . . . . . . . . . . . . . . . . . . . . . . . . . . . . . . . . . . . . . . . . . . . . . . . . . . . . . . . . . . . . . . . . . . . . . . . . .
(1)
(Total for Question 11 is 7 marks)

22
*S59306A02224*
D
O N
OT W
RITE IN TH
IS AREA
D
O N
OT W
RITE IN TH
IS AREA
D
O N
OT W
RITE IN TH
IS AREA
D
O N
OT
WRI
TE IN
TH
IS A
REA
D
O N
OT
WRI
TE IN
TH
IS A
REA
D
O N
OT
WRI
TE IN
TH
IS A
REA
12 Youssef is investigating the amount of time students spend on social media.
Here is what Youssef has written down for his hypothesis and how he plans to collect, process and present his data.
Hypothesis
• Do girls spend more time than boys on social media?
Data to collect
• Gender of student• Time spent on social media in one week (using categories: 1–2 hrs, 3–4 hrs, 5–6 hrs)• Name of student
Processing and presenting data
• Work out an estimate of the mean weekly time boys spend on social media• Work out an estimate of the mean weekly time girls spend on social media• Draw a scatter graph with gender on the horizontal axis and time spent on social media on
the vertical axis• Draw a time series graph showing how the amount of time spent on social media has
changed over the years
Discuss whether Youssef’s hypothesis and his plans for collecting, processing and presenting his data are appropriate.
.. . . . . . . . . . . . . . . . . . . . . . . . . . . . . . . . . . . . . . . . . . . . . . . . . . . . . . . . . . . . . . . . . . . . . . . . . . . . . . . . . . . . . . . . . . . . . . . . . . . . . . . . . . . . . . . . . . . . . . . . . . . . . . . . . . . . . . . . . . . . . . . . . . . . . . . . . . . . . . . . . . . . . . . . . . . . . . . . . . . . . . . . . . . . . . . . . . . . . . . . . . . . . . . . . . . . . . . . . . . . . . . . . . . . . . . . . . . . . . . . . .
. . . . . . . . . . . . . . . . . . . . . . . . . . . . . . . . . . . . . . . . . . . . . . . . . . . . . . . . . . . . . . . . . . . . . . . . . . . . . . . . . . . . . . . . . . . . . . . . . . . . . . . . . . . . . . . . . . . . . . . . . . . . . . . . . . . . . . . . . . . . . . . . . . . . . . . . . . . . . . . . . . . . . . . . . . . . . . . . . . . . . . . . . . . . . . . . . . . . . . . . . . . . . . . . . . . . . . . . . . . . . . . . . . . . . . . . . . . . . . . . . . .
. . . . . . . . . . . . . . . . . . . . . . . . . . . . . . . . . . . . . . . . . . . . . . . . . . . . . . . . . . . . . . . . . . . . . . . . . . . . . . . . . . . . . . . . . . . . . . . . . . . . . . . . . . . . . . . . . . . . . . . . . . . . . . . . . . . . . . . . . . . . . . . . . . . . . . . . . . . . . . . . . . . . . . . . . . . . . . . . . . . . . . . . . . . . . . . . . . . . . . . . . . . . . . . . . . . . . . . . . . . . . . . . . . . . . . . . . . . . . . . . . . .
. . . . . . . . . . . . . . . . . . . . . . . . . . . . . . . . . . . . . . . . . . . . . . . . . . . . . . . . . . . . . . . . . . . . . . . . . . . . . . . . . . . . . . . . . . . . . . . . . . . . . . . . . . . . . . . . . . . . . . . . . . . . . . . . . . . . . . . . . . . . . . . . . . . . . . . . . . . . . . . . . . . . . . . . . . . . . . . . . . . . . . . . . . . . . . . . . . . . . . . . . . . . . . . . . . . . . . . . . . . . . . . . . . . . . . . . . . . . . . . . . . .
. . . . . . . . . . . . . . . . . . . . . . . . . . . . . . . . . . . . . . . . . . . . . . . . . . . . . . . . . . . . . . . . . . . . . . . . . . . . . . . . . . . . . . . . . . . . . . . . . . . . . . . . . . . . . . . . . . . . . . . . . . . . . . . . . . . . . . . . . . . . . . . . . . . . . . . . . . . . . . . . . . . . . . . . . . . . . . . . . . . . . . . . . . . . . . . . . . . . . . . . . . . . . . . . . . . . . . . . . . . . . . . . . . . . . . . . . . . . . . . . . . .
. . . . . . . . . . . . . . . . . . . . . . . . . . . . . . . . . . . . . . . . . . . . . . . . . . . . . . . . . . . . . . . . . . . . . . . . . . . . . . . . . . . . . . . . . . . . . . . . . . . . . . . . . . . . . . . . . . . . . . . . . . . . . . . . . . . . . . . . . . . . . . . . . . . . . . . . . . . . . . . . . . . . . . . . . . . . . . . . . . . . . . . . . . . . . . . . . . . . . . . . . . . . . . . . . . . . . . . . . . . . . . . . . . . . . . . . . . . . . . . . . . .
. . . . . . . . . . . . . . . . . . . . . . . . . . . . . . . . . . . . . . . . . . . . . . . . . . . . . . . . . . . . . . . . . . . . . . . . . . . . . . . . . . . . . . . . . . . . . . . . . . . . . . . . . . . . . . . . . . . . . . . . . . . . . . . . . . . . . . . . . . . . . . . . . . . . . . . . . . . . . . . . . . . . . . . . . . . . . . . . . . . . . . . . . . . . . . . . . . . . . . . . . . . . . . . . . . . . . . . . . . . . . . . . . . . . . . . . . . . . . . . . . . .
. . . . . . . . . . . . . . . . . . . . . . . . . . . . . . . . . . . . . . . . . . . . . . . . . . . . . . . . . . . . . . . . . . . . . . . . . . . . . . . . . . . . . . . . . . . . . . . . . . . . . . . . . . . . . . . . . . . . . . . . . . . . . . . . . . . . . . . . . . . . . . . . . . . . . . . . . . . . . . . . . . . . . . . . . . . . . . . . . . . . . . . . . . . . . . . . . . . . . . . . . . . . . . . . . . . . . . . . . . . . . . . . . . . . . . . . . . . . . . . . . . .
. . . . . . . . . . . . . . . . . . . . . . . . . . . . . . . . . . . . . . . . . . . . . . . . . . . . . . . . . . . . . . . . . . . . . . . . . . . . . . . . . . . . . . . . . . . . . . . . . . . . . . . . . . . . . . . . . . . . . . . . . . . . . . . . . . . . . . . . . . . . . . . . . . . . . . . . . . . . . . . . . . . . . . . . . . . . . . . . . . . . . . . . . . . . . . . . . . . . . . . . . . . . . . . . . . . . . . . . . . . . . . . . . . . . . . . . . . . . . . . . . . .
. . . . . . . . . . . . . . . . . . . . . . . . . . . . . . . . . . . . . . . . . . . . . . . . . . . . . . . . . . . . . . . . . . . . . . . . . . . . . . . . . . . . . . . . . . . . . . . . . . . . . . . . . . . . . . . . . . . . . . . . . . . . . . . . . . . . . . . . . . . . . . . . . . . . . . . . . . . . . . . . . . . . . . . . . . . . . . . . . . . . . . . . . . . . . . . . . . . . . . . . . . . . . . . . . . . . . . . . . . . . . . . . . . . . . . . . . . . . . . . . . . .
(Total for Question 12 is 5 marks)

23
*S59306A02324*
D
O N
OT W
RITE IN TH
IS AREA
D
O N
OT W
RITE IN TH
IS AREA
D
O N
OT W
RITE IN TH
IS AREA
D
O N
OT
WRI
TE IN
TH
IS A
REA
D
O N
OT
WRI
TE IN
TH
IS A
REA
D
O N
OT
WRI
TE IN
TH
IS A
REA
13 In a factory there are two machines, Machine A and Machine B, that produce parts.
The table shows the number of faulty parts and the number of non-faulty parts that are produced by each machine one morning.
Faulty Non-faulty Total
Machine A 1 19 20
Machine B 2 48 50
(a) Find the relative risk of getting a faulty part from Machine A compared with getting a faulty part from Machine B.
.. . . . . . . . . . . . . . . . . . . . . . . . . . . . . . . . . . . . . . . . . . . . . . . . . . . . . .
(3)
Carla says,
“The relative risk shows that the risk of Machine A producing a faulty part is greater than the risk of Machine B producing a faulty part”.
(b) Using your answer to part (a), explain whether or not Carla’s conclusion is correct.
.. . . . . . . . . . . . . . . . . . . . . . . . . . . . . . . . . . . . . . . . . . . . . . . . . . . . . . . . . . . . . . . . . . . . . . . . . . . . . . . . . . . . . . . . . . . . . . . . . . . . . . . . . . . . . . . . . . . . . . . . . . . . . . . . . . . . . . . . . . . . . . . . . . . . . . . . . . . . . . . . . . . . . . . . . . . . . . . . . . . . . . . . . . . . . . . . . . . . . . . . . . . . . . . . . . . . . . . . . . . . . . . . . . . . . . . . . . . . . . . . . .
. . . . . . . . . . . . . . . . . . . . . . . . . . . . . . . . . . . . . . . . . . . . . . . . . . . . . . . . . . . . . . . . . . . . . . . . . . . . . . . . . . . . . . . . . . . . . . . . . . . . . . . . . . . . . . . . . . . . . . . . . . . . . . . . . . . . . . . . . . . . . . . . . . . . . . . . . . . . . . . . . . . . . . . . . . . . . . . . . . . . . . . . . . . . . . . . . . . . . . . . . . . . . . . . . . . . . . . . . . . . . . . . . . . . . . . . . . . . . . . . . . .
(1)
(Total for Question 13 is 4 marks)
TOTAL FOR PAPER IS 80 MARKS

24
*S59306A02424*
D
O N
OT W
RITE IN TH
IS AREA
D
O N
OT W
RITE IN TH
IS AREA
D
O N
OT W
RITE IN TH
IS AREA
BLANK PAGE